


The Use of BIM Models and Drone Flyover Data in Building Energy Efficiency Analysis
 ,
,  , , ,
, , ,  and
and 
Abstract
1. Introduction
1.1. BIM and Energy Efficiency
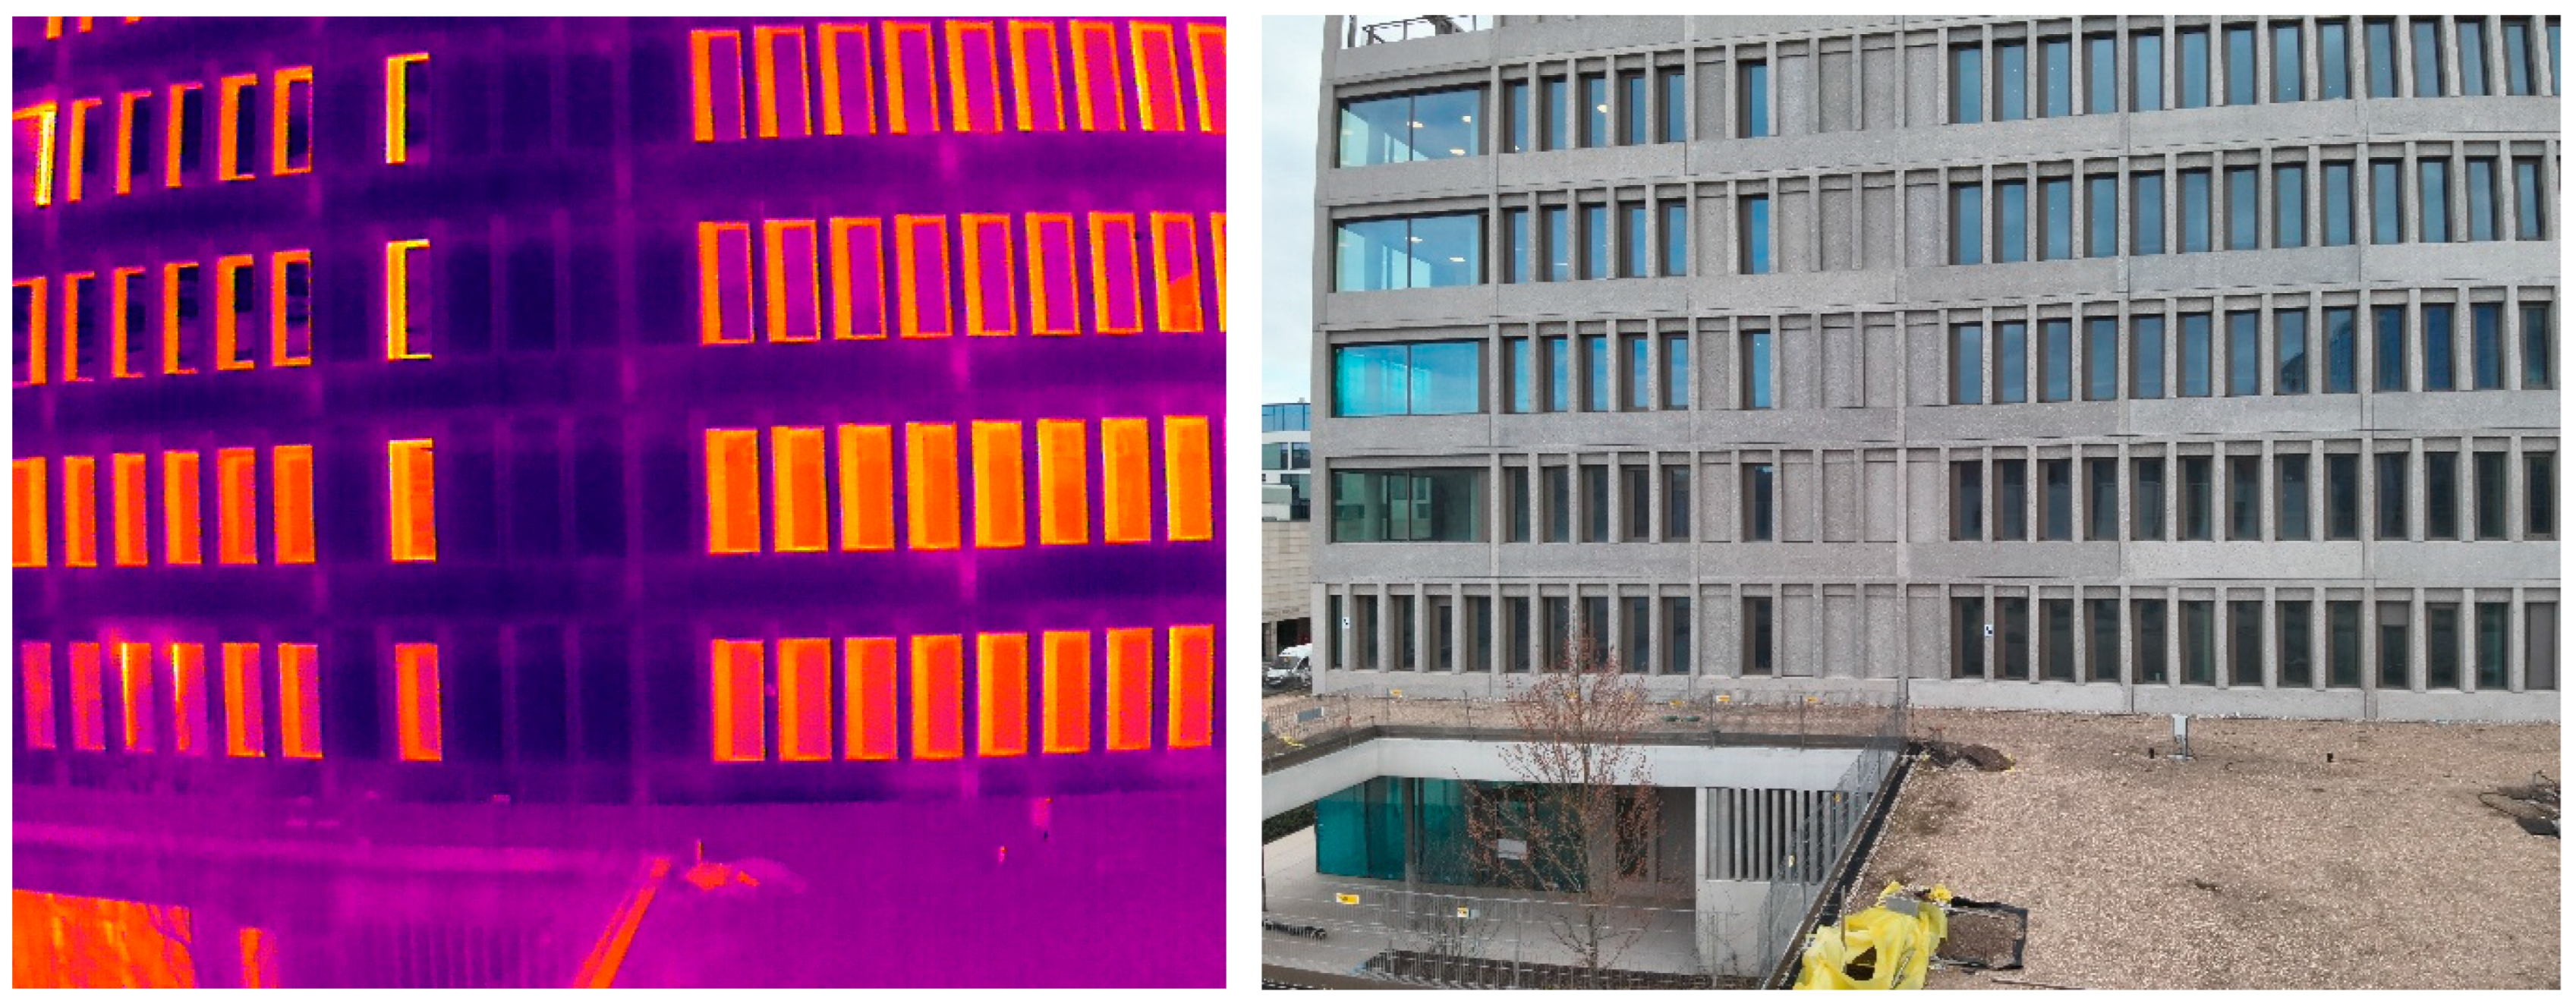
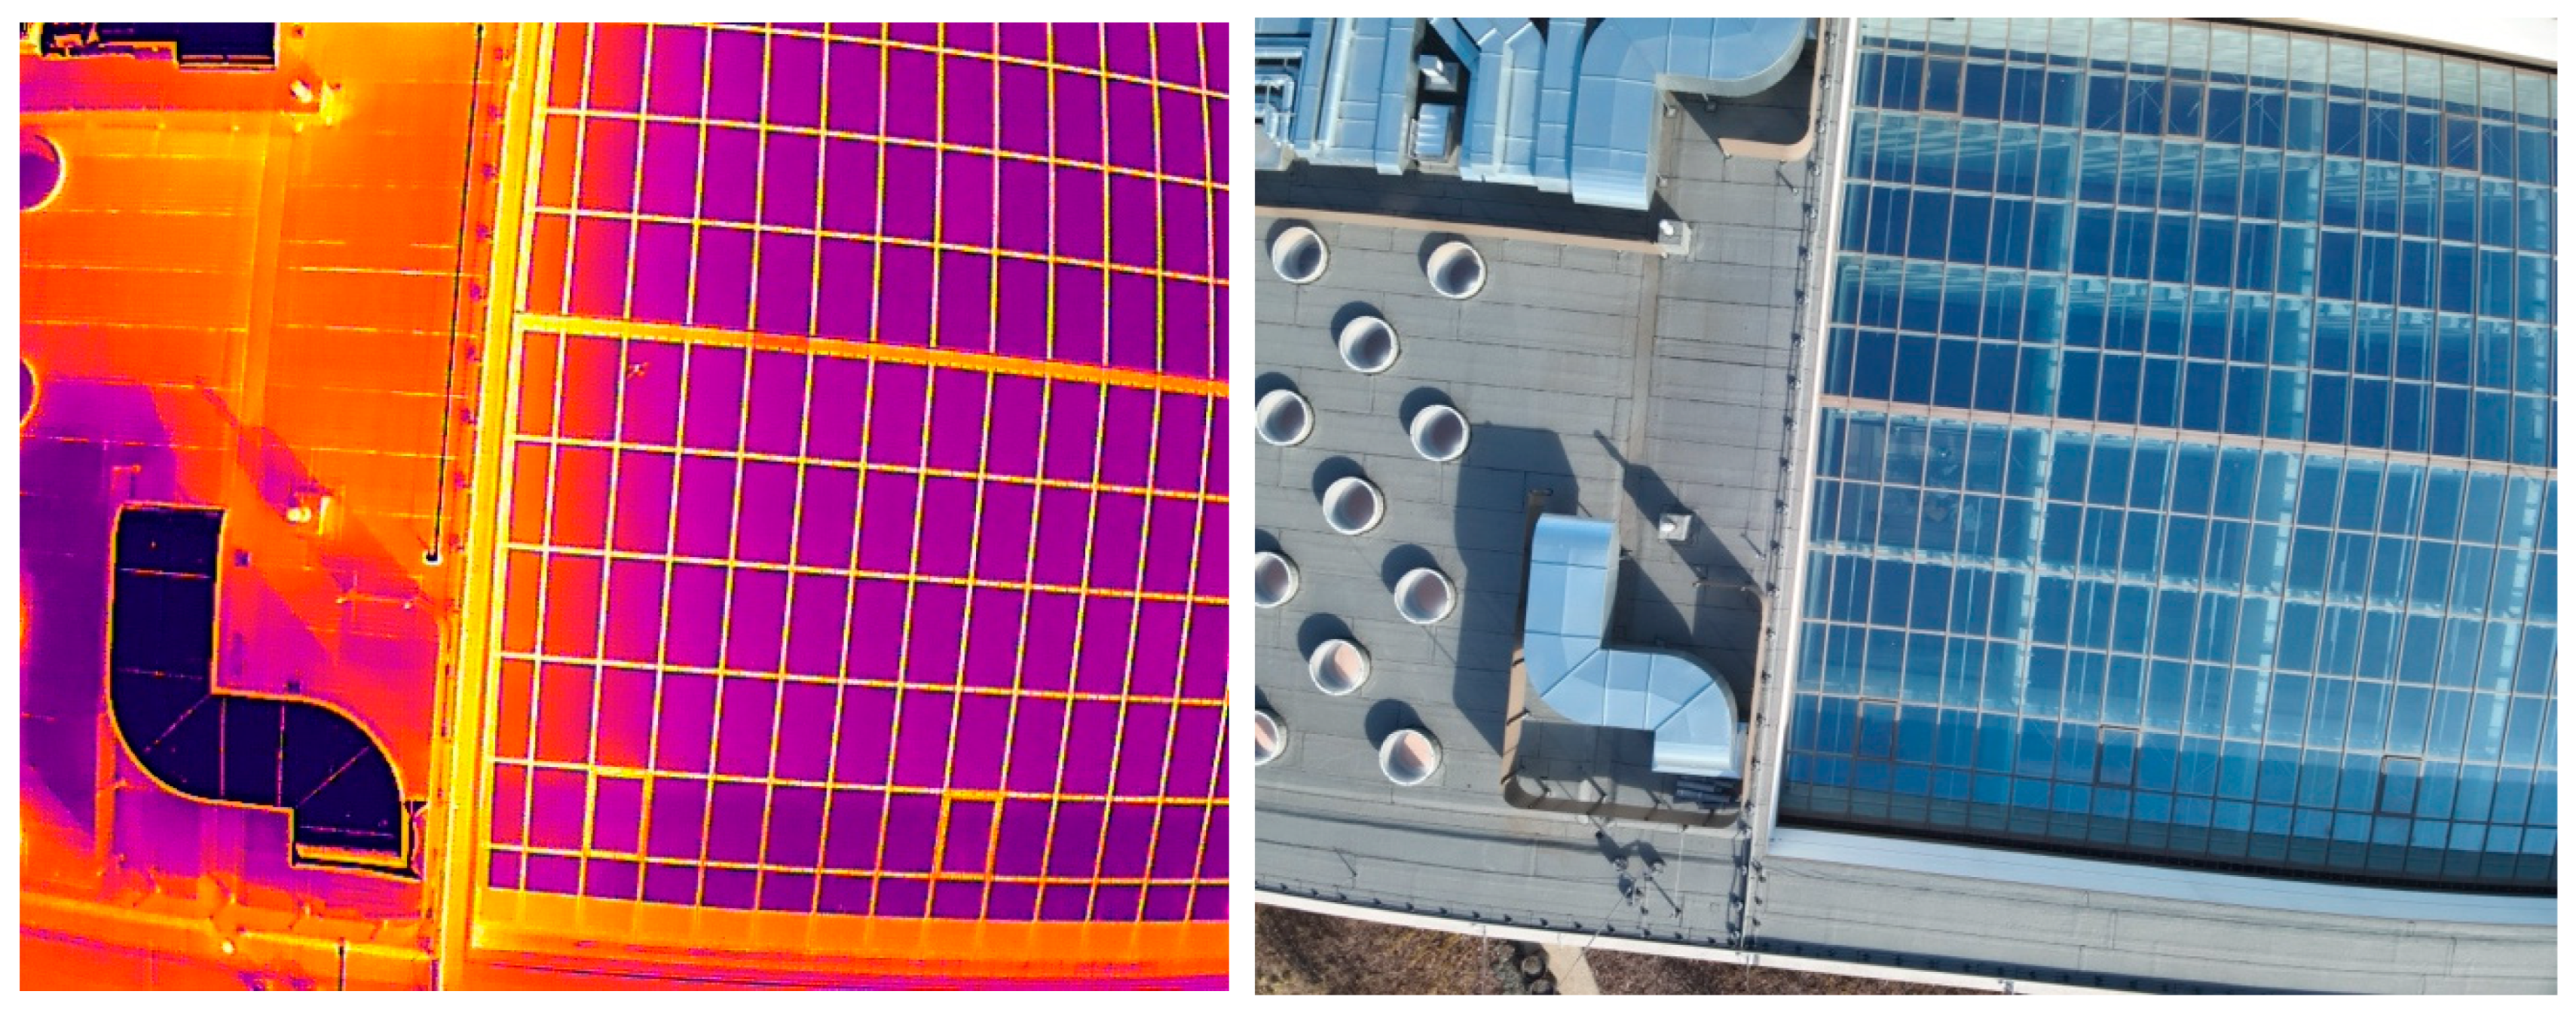
1.2. UAV-Based Thermal Imaging in Building Analysis
1.3. Thermal Bridges
1.4. The Significance of Energy Efficiency Throughout the Entire Life Cycle of Buildings
1.5. The Aim of the Study
2. Literature Review
2.1. BIM and Energy Efficiency in Building Design
2.2. Digital Twin as an Extension of BIM in Energy Management
2.3. Thermography Data Integration with the BIM Model
2.4. Digital Tools for Thermographic Assessment
2.5. Machine Learning in Thermal Image Analysis
2.6. Research Gap and Novelty Statement
3. Research Methods and Materials
- (A)
- Thermal activation of the building—increasing indoor temperature to create a measurable temperature gradient.
- (B)
- UAV flight planning—planning flights (general, roof, and façade) to ensure 70–80% image overlap; defining flight paths, angles, and distances (5–20 m depending on type).
- (C)
- Environmental data logging—recording ambient temperature and humidity during each flight.
- (D)
- Data acquisition (RGB + Thermal)—executing pre-programmed/manual UAV flights with RTK activated for accuracy.
- (E)
- Thermal image preprocessing—utilization of ImageJ and the IRImage plugin for calibration and conversion to temperature maps.
- (F)
- Three-dimensional model reconstruction—generation of a 3D model from RGB images via Structure from Motion (SfM).
- (G)
- Thermal–RGB Fusion—registering thermal data onto the 3D model using custom software to create a thermal point cloud (X, Y, Z, RGB, and temperature).
- (H)
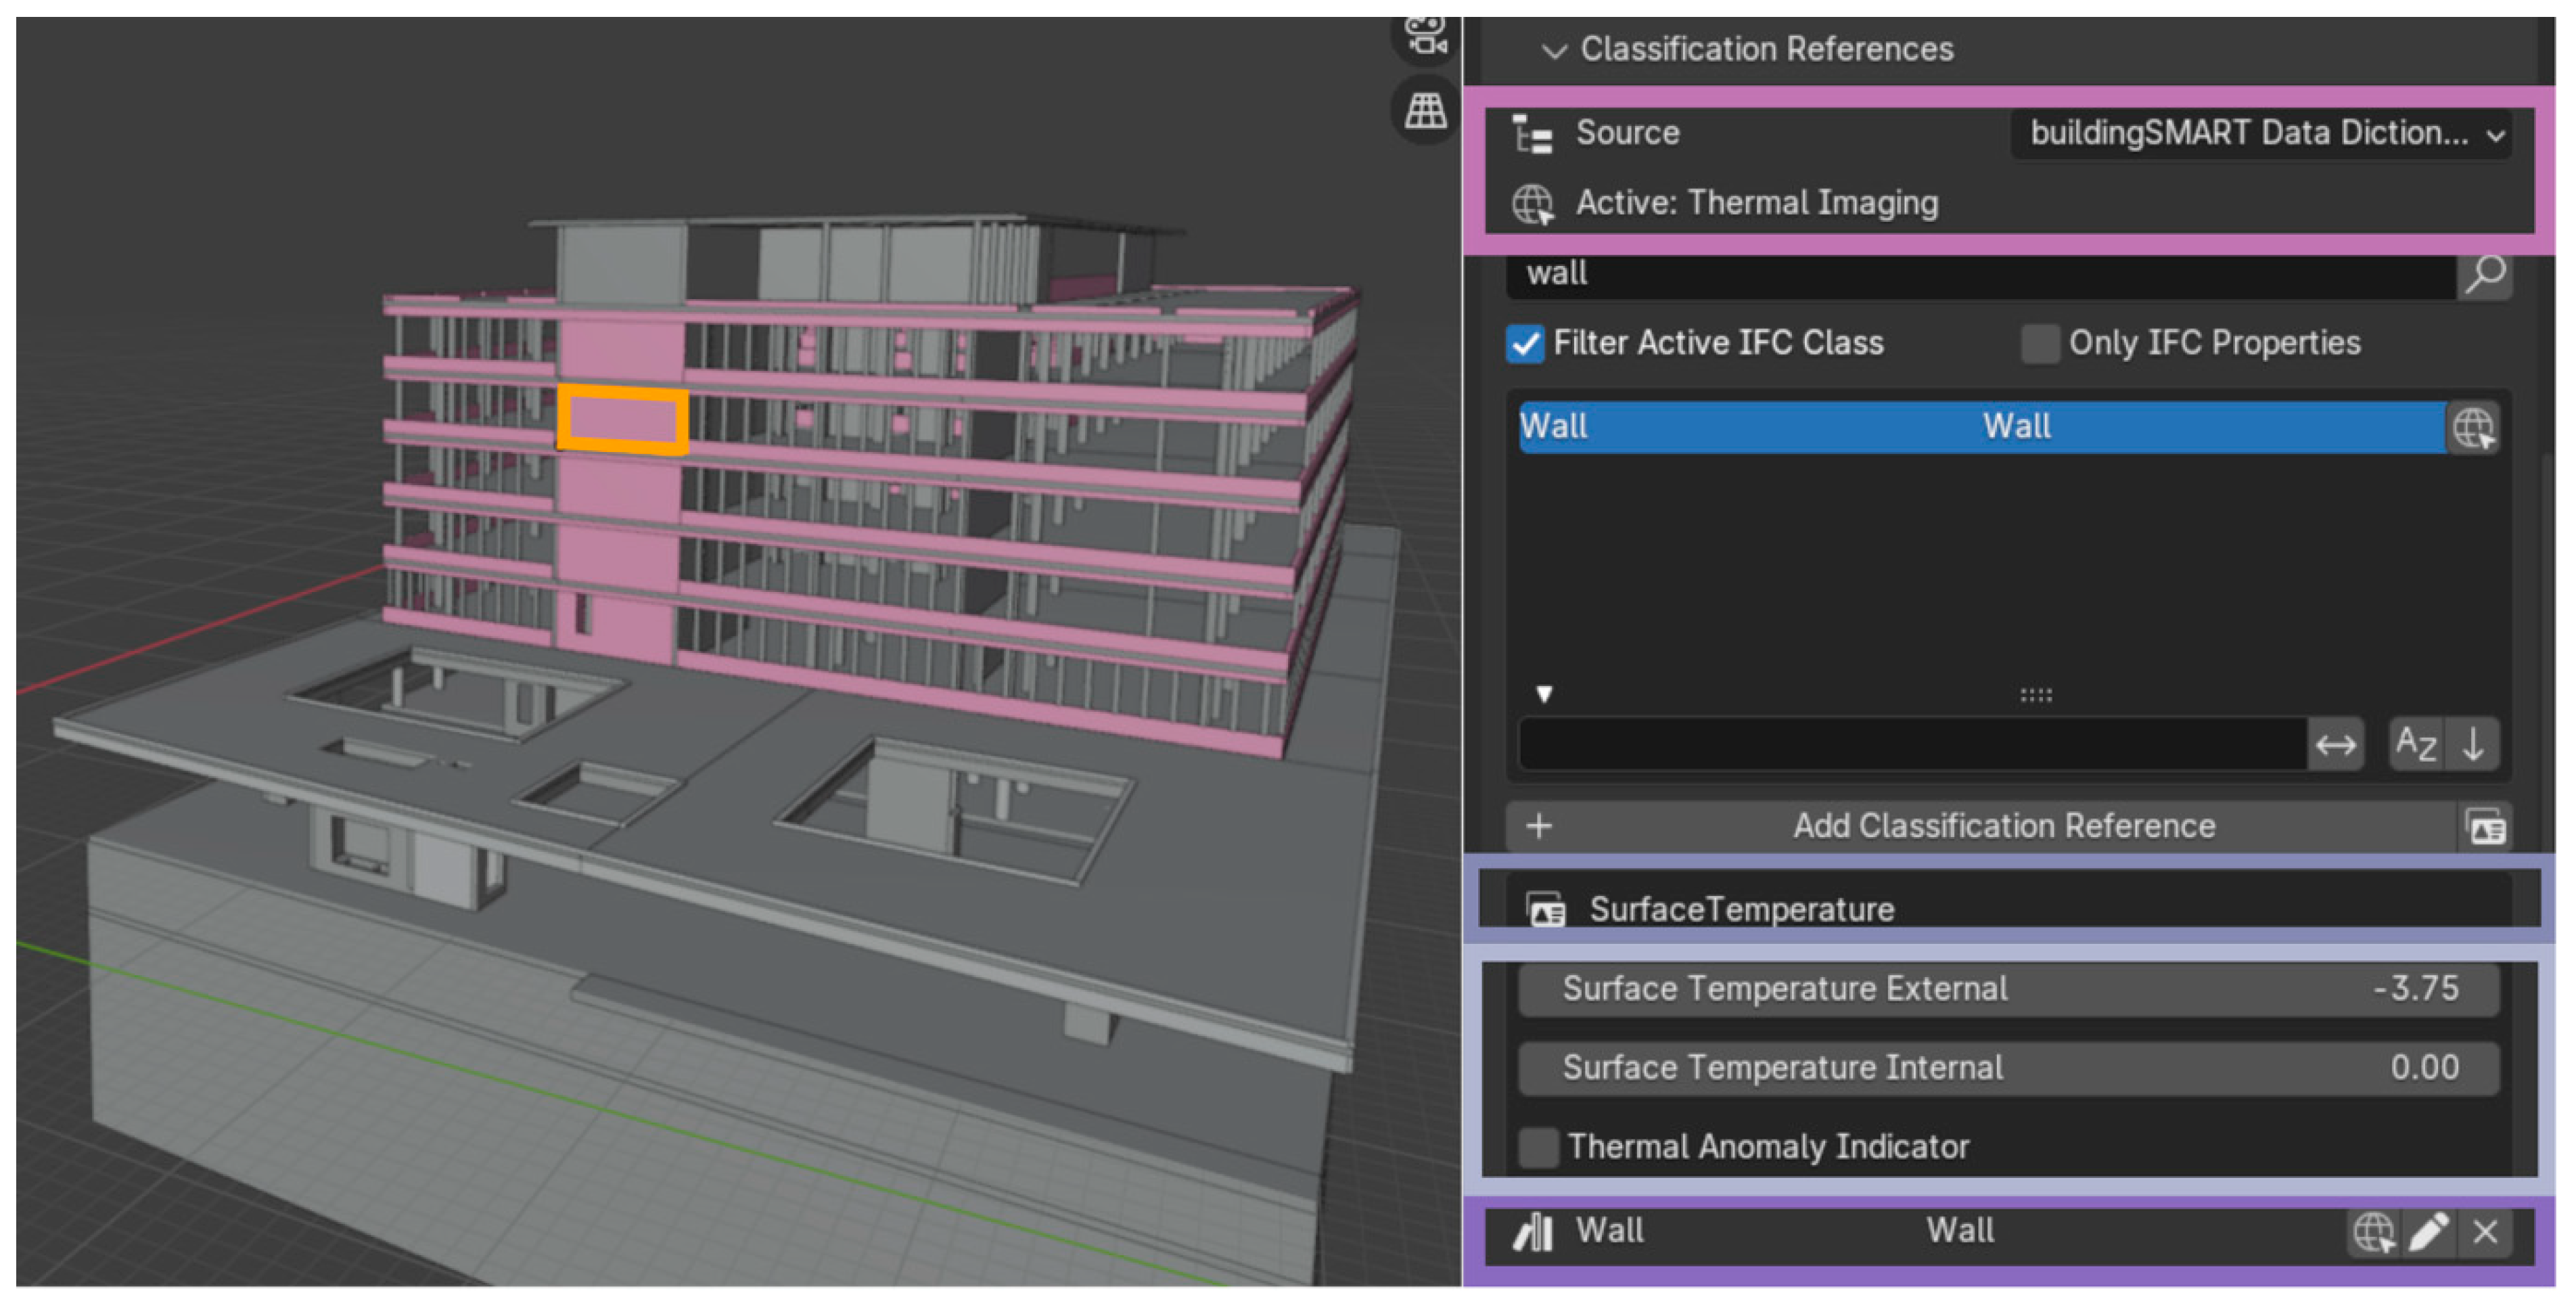
- (H1) Visualization in Potree—visualizing and analyzing thermal anomalies interactively using color maps, measurement tools, and layer overlays (e.g., RGB and thermal).(H2) Integration with BIM (IFC)—manually assigning temperature data and thermal anomaly types to specific building elements in the IFC model (e.g., walls and windows), using predefined bSDD properties (e.g., via Blender and Bonsai plugin).
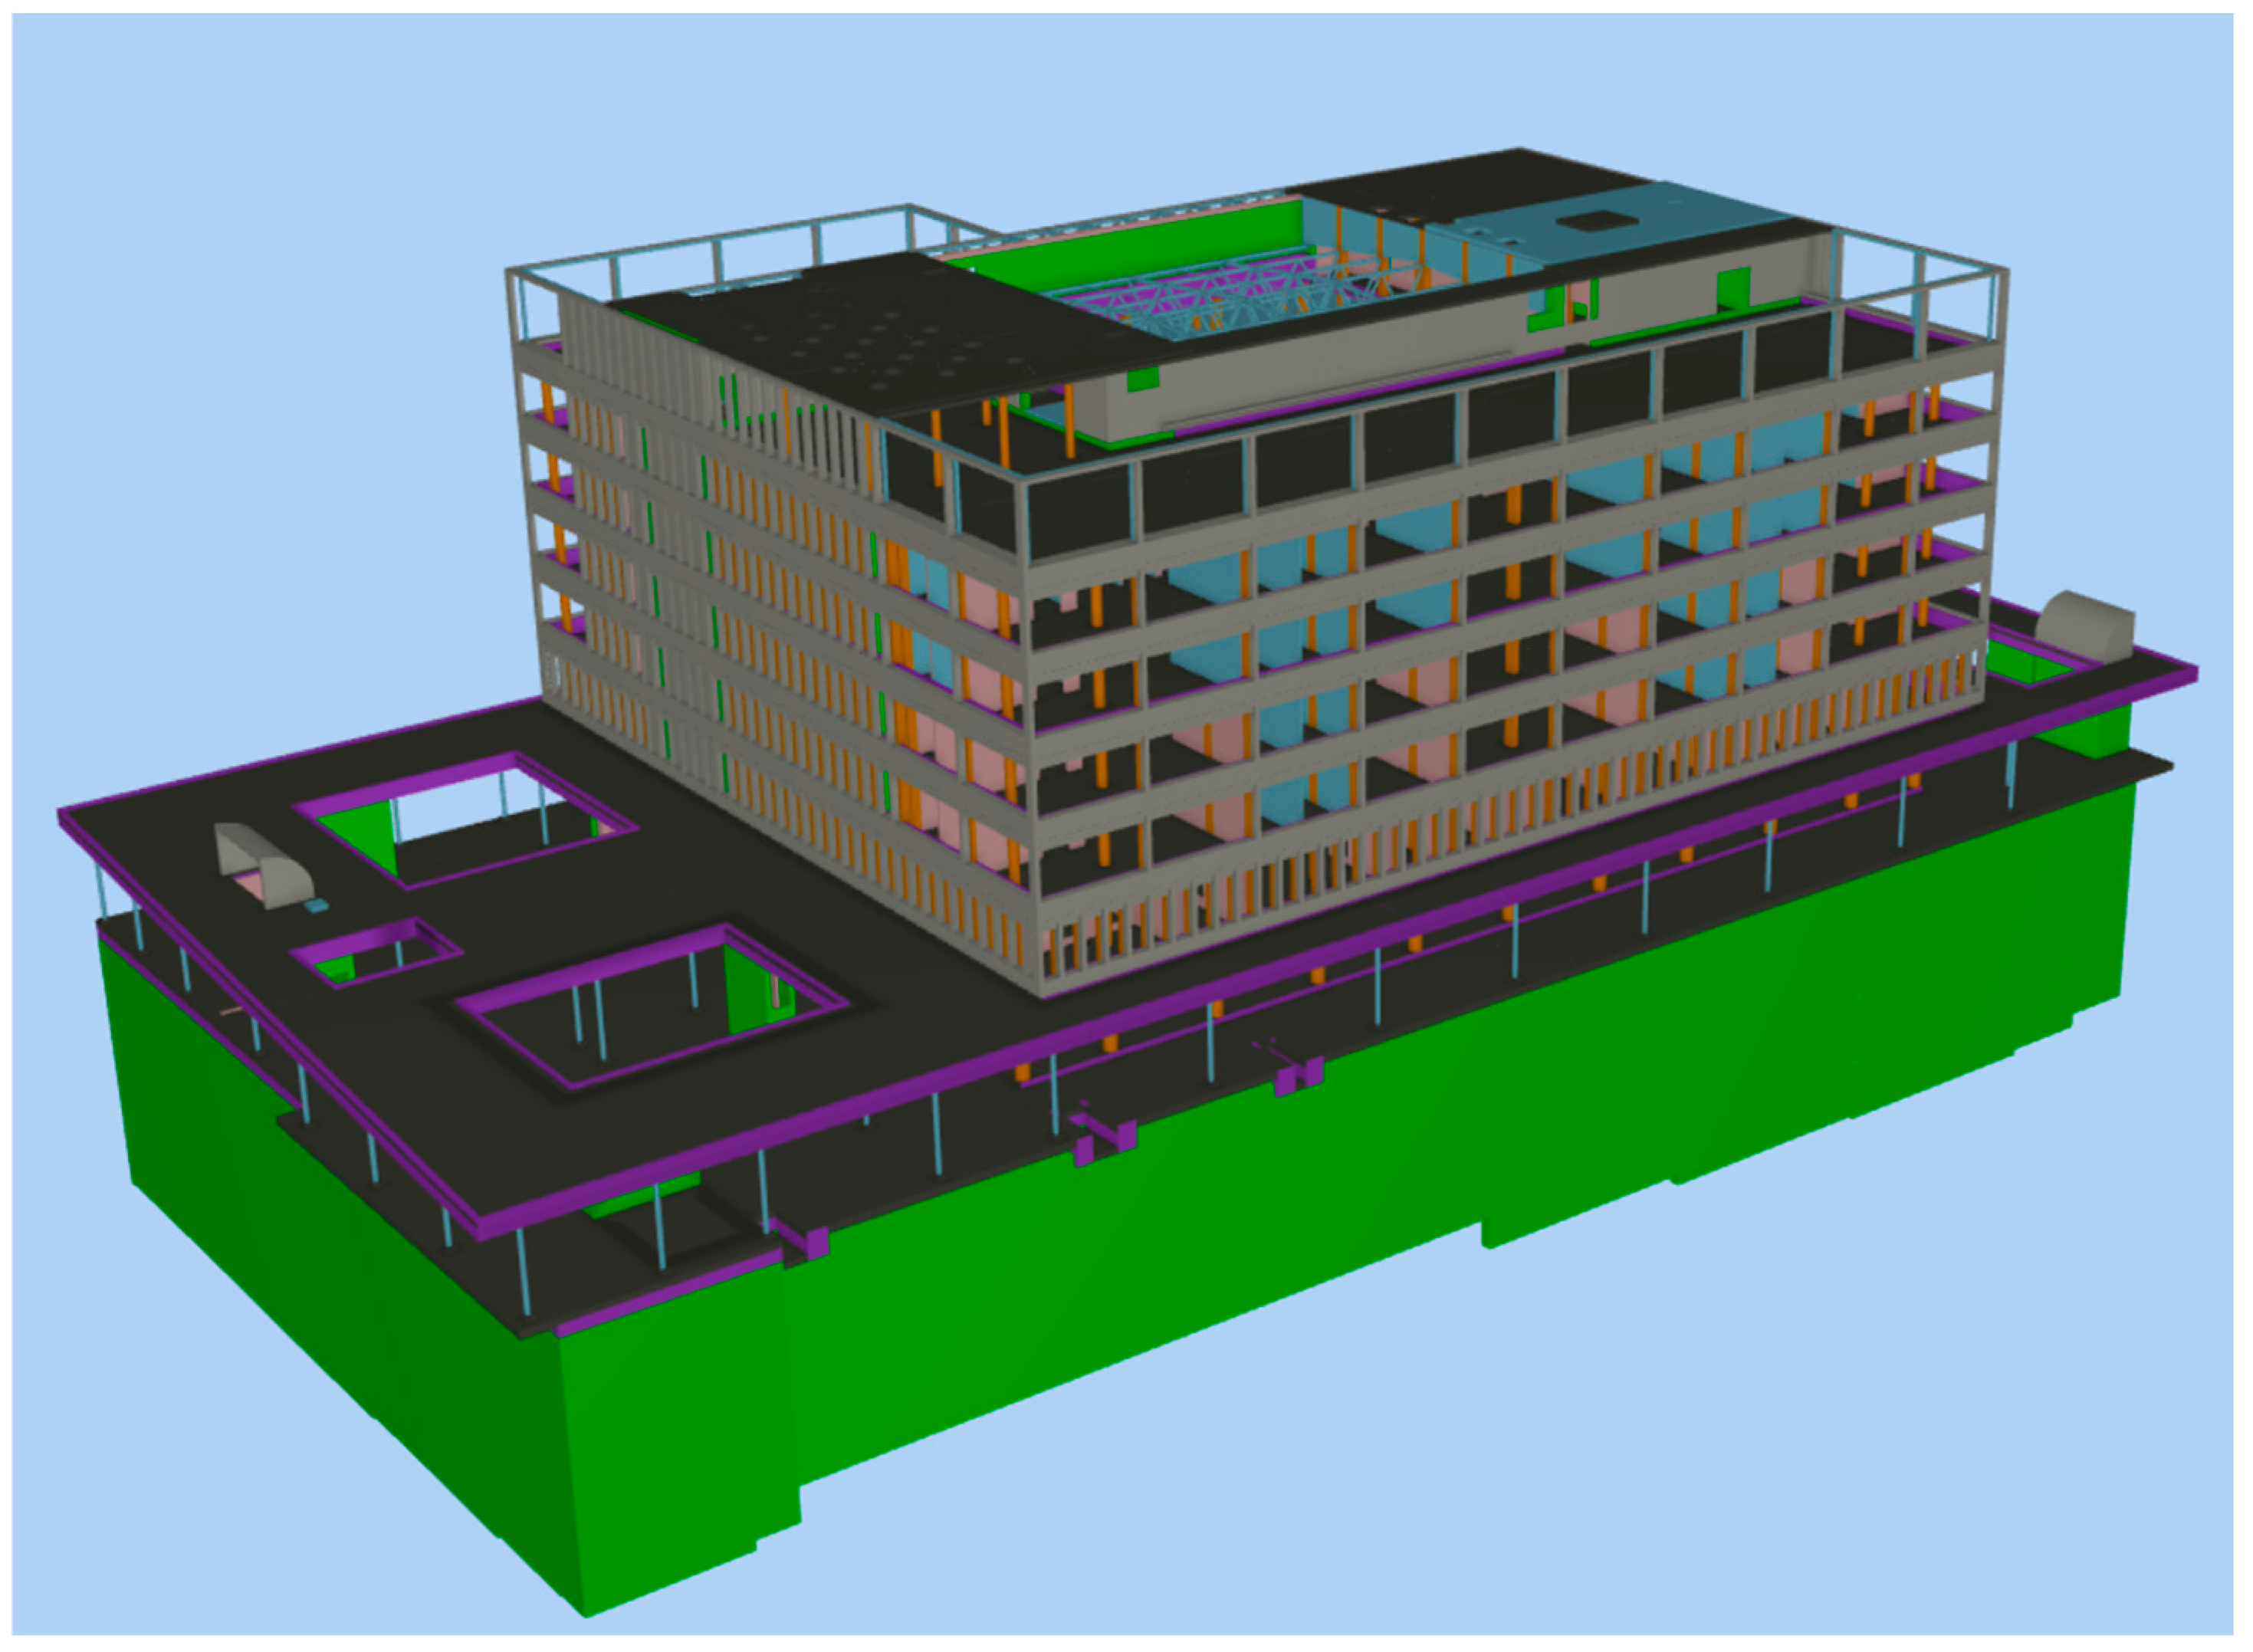
3.1. Case Study 1: BUILDSPACE Project
3.1.1. Case Study of the Warsaw Pilot
3.1.2. Application of Thermal Data Collection Methodology
3.1.3. Procedures for Thermal Data Acquisition
3.1.4. Data Processing to Obtain Point Cloud and Thermal Representation of the Building
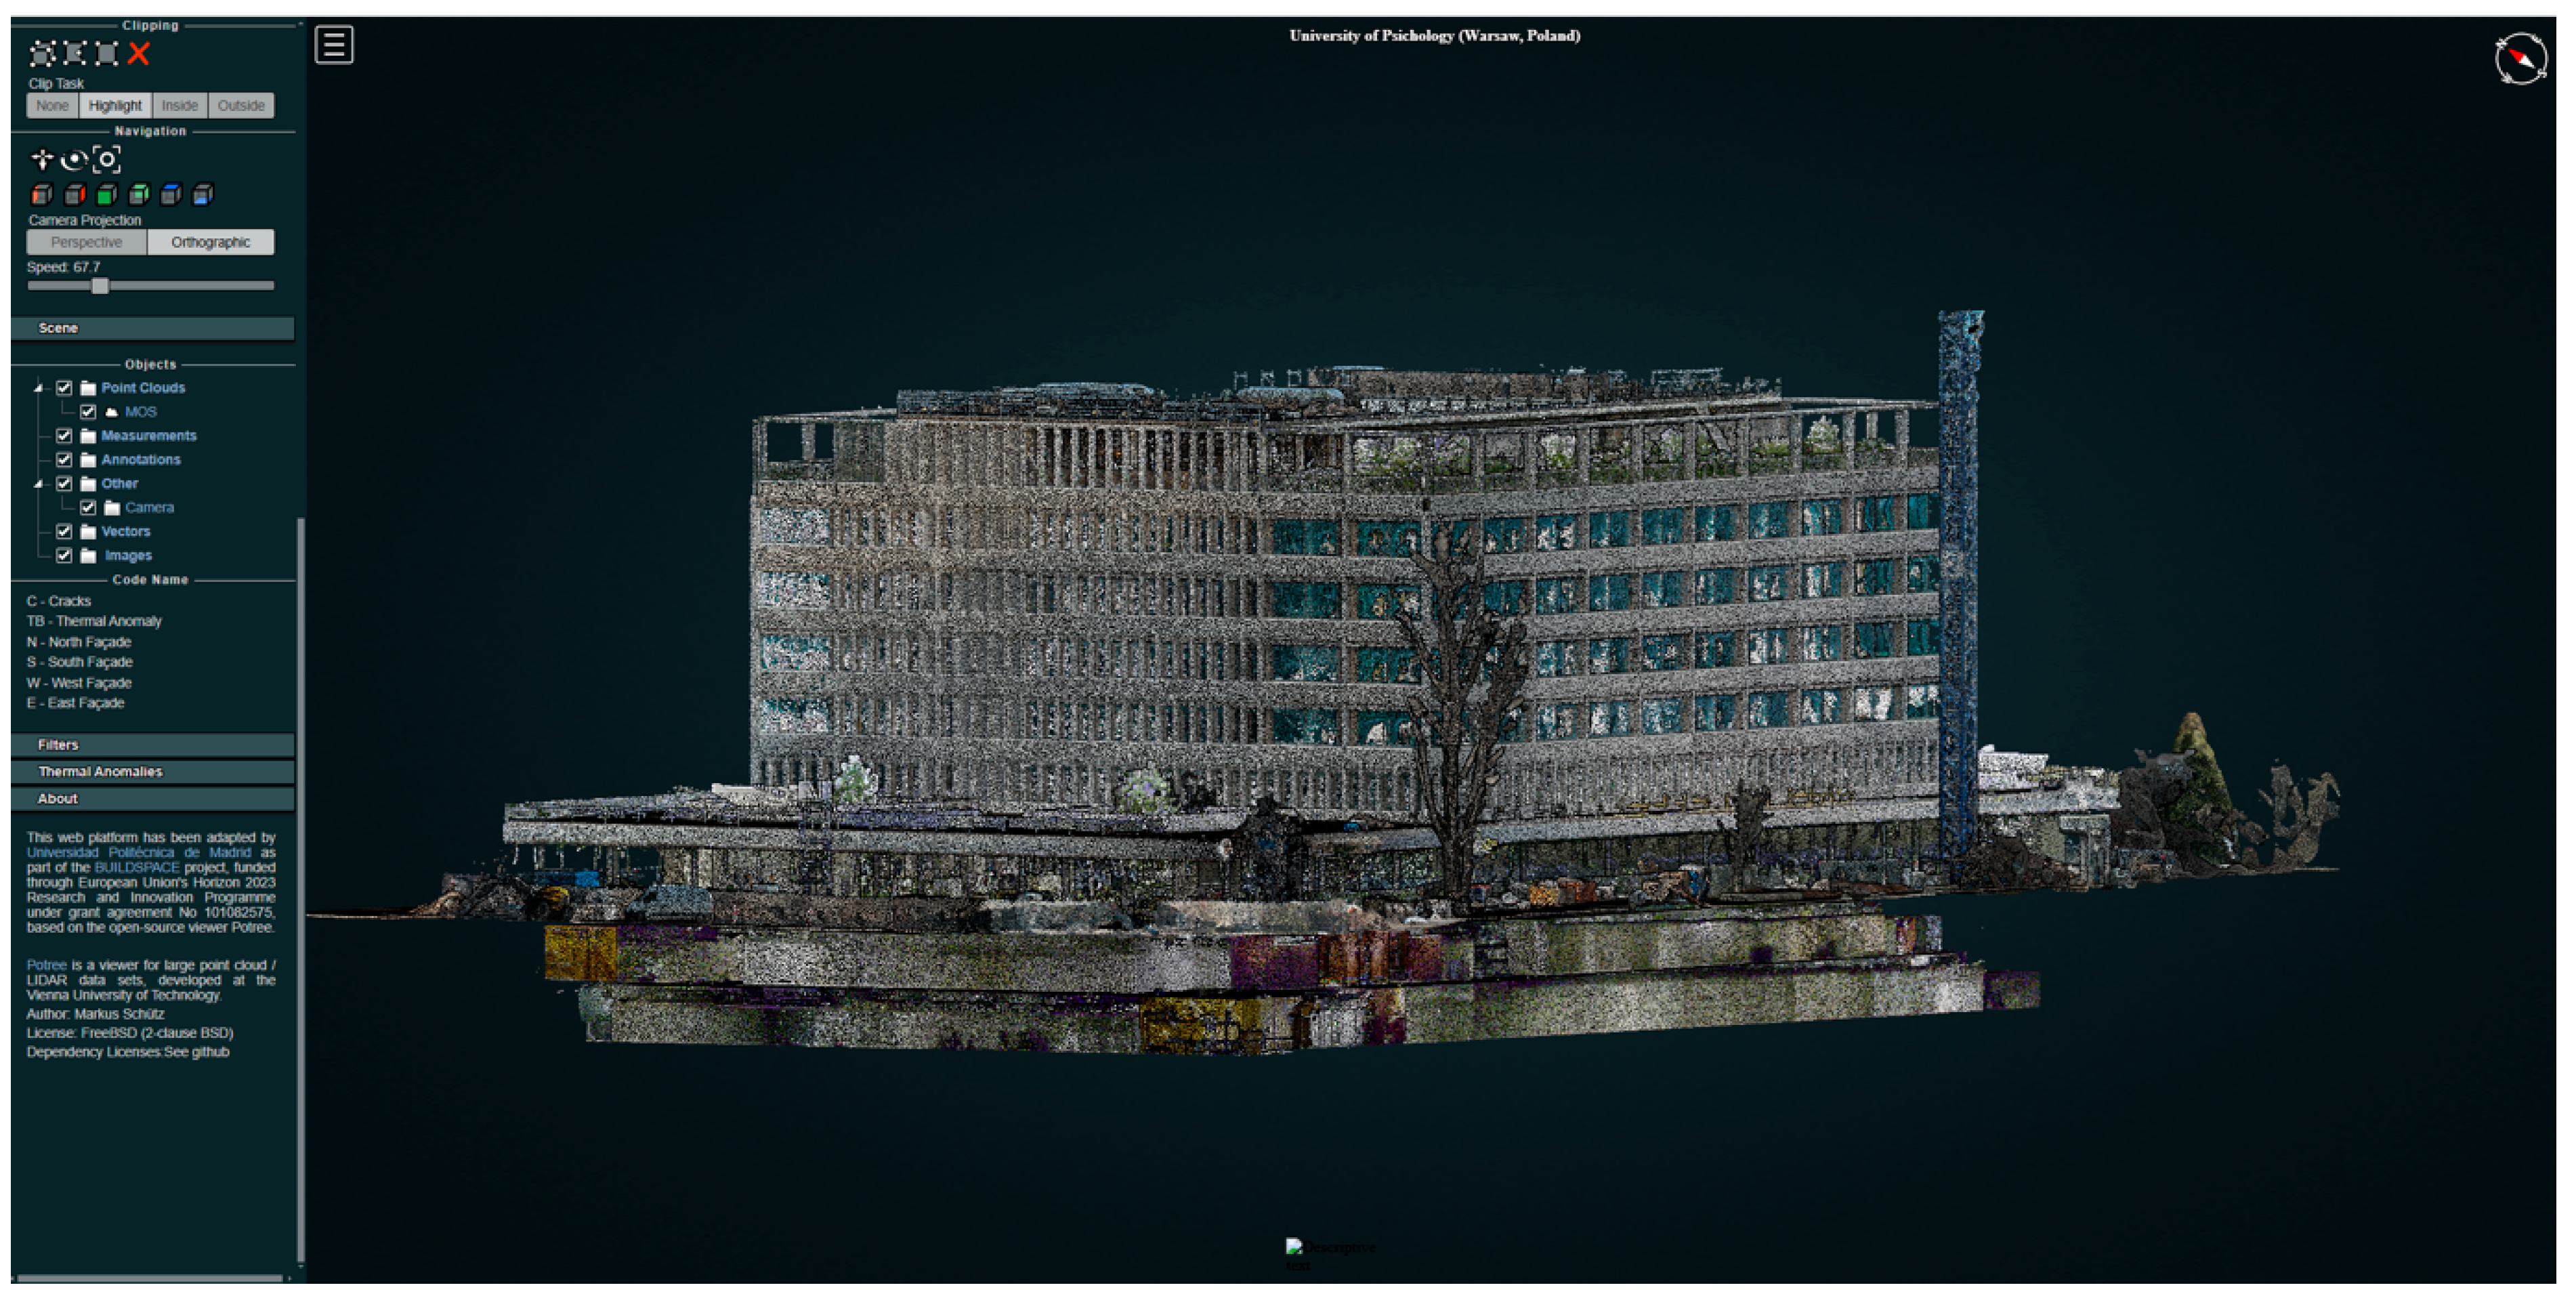
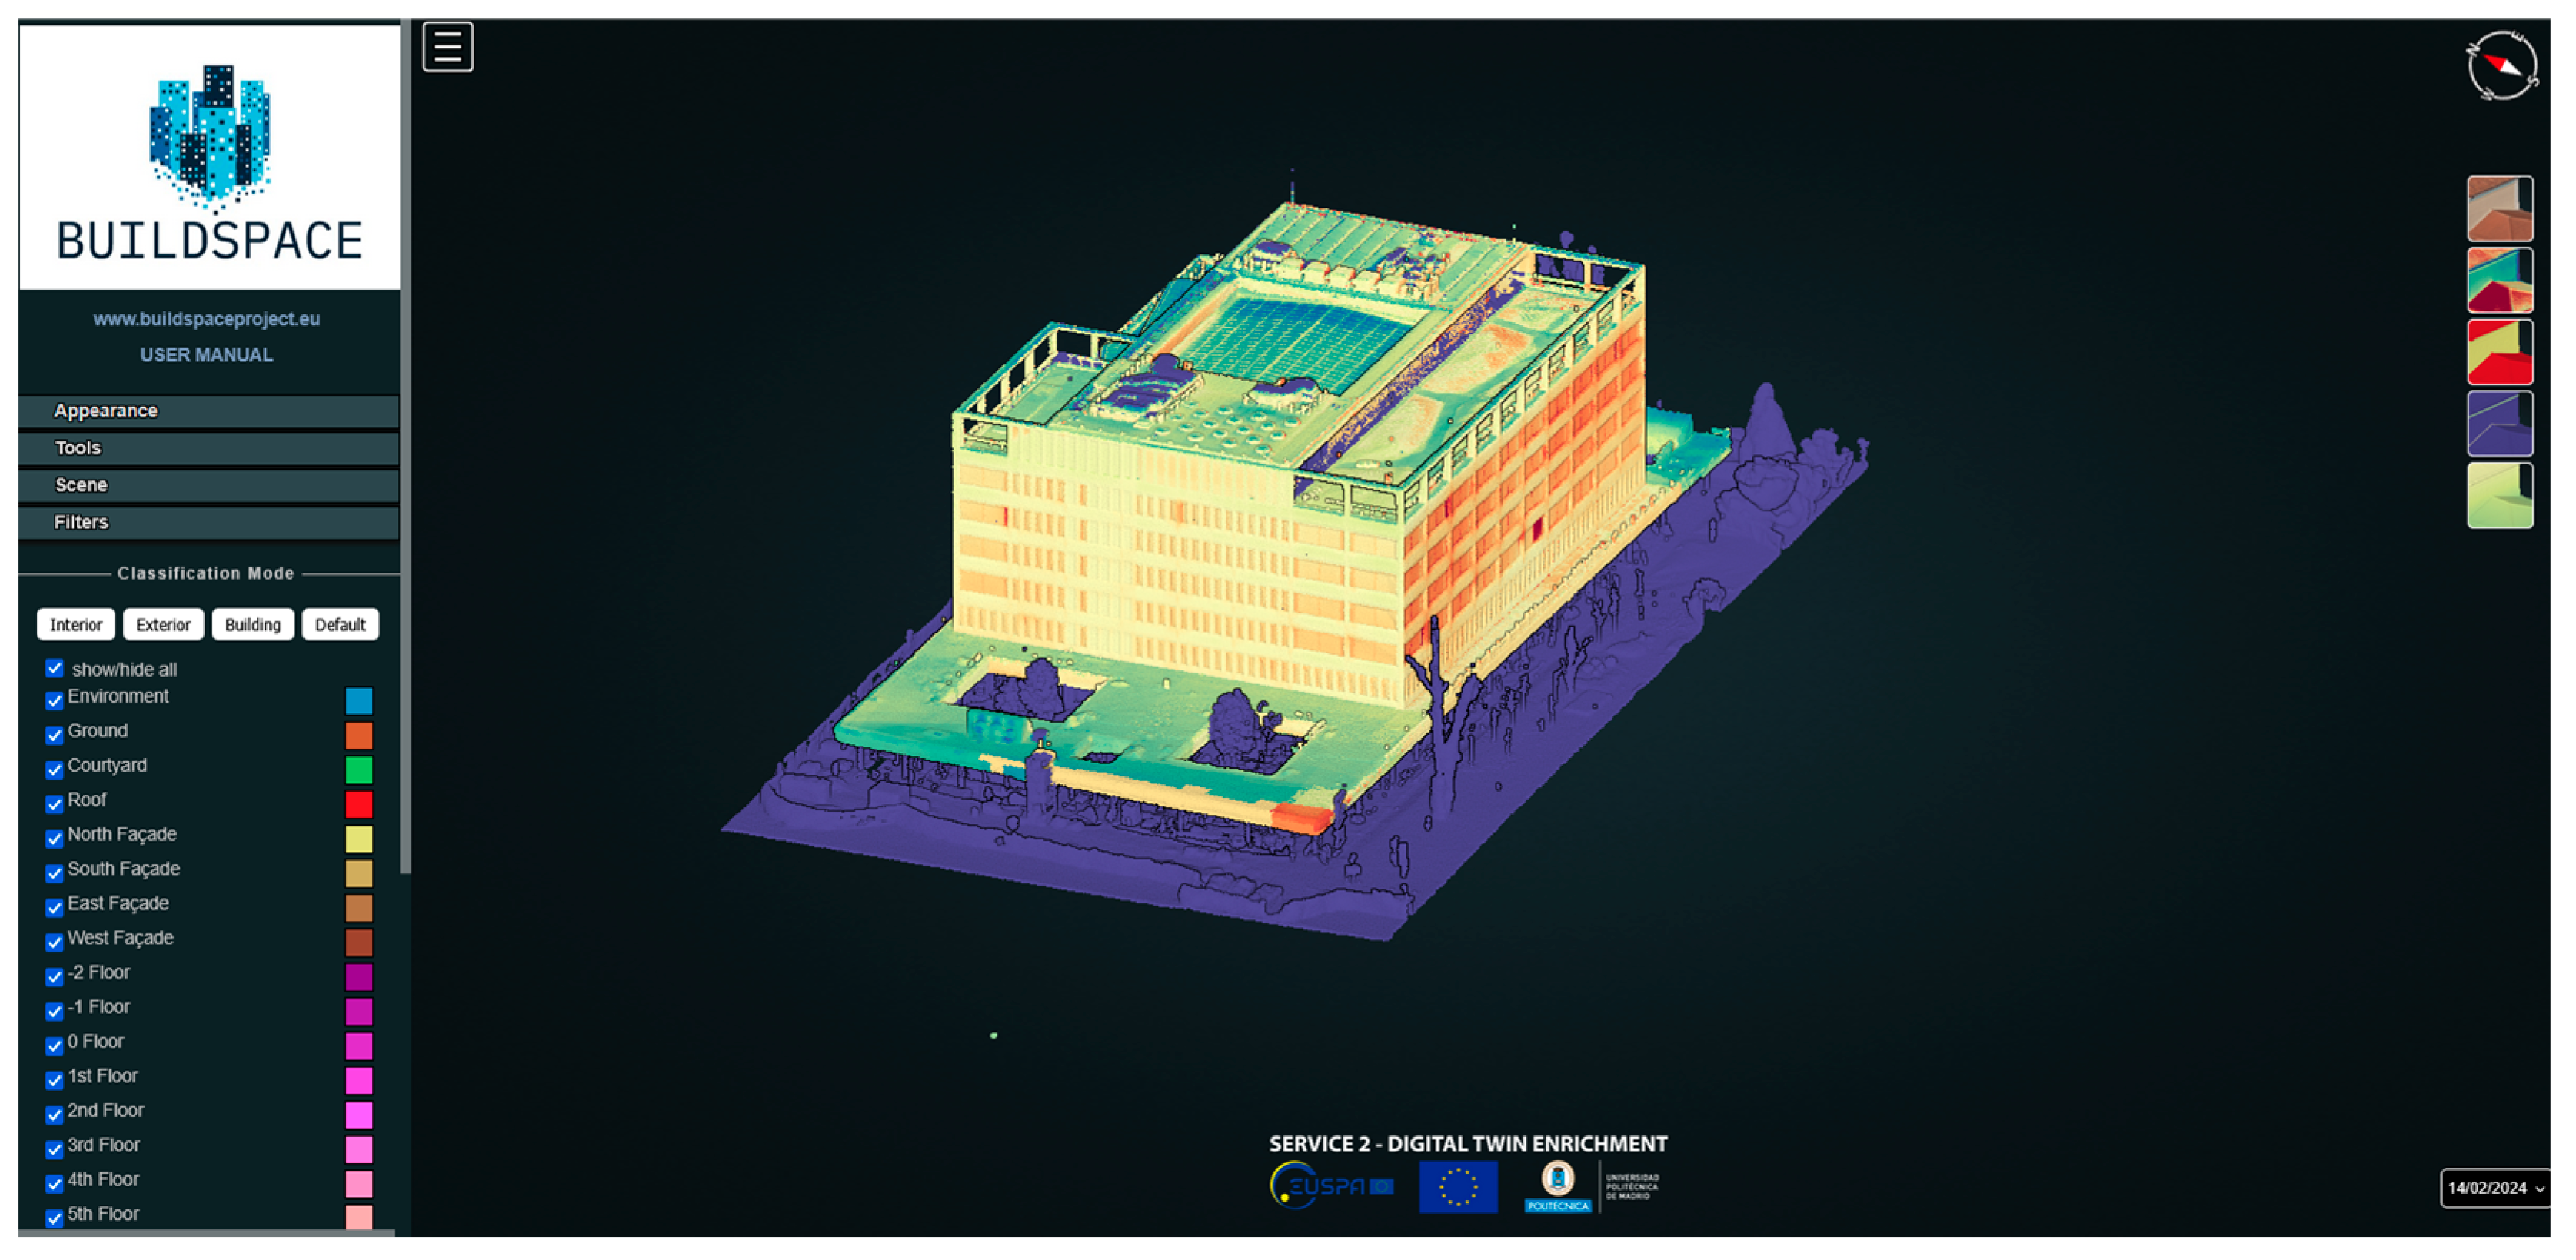
3.1.5. Platform for the Visualization of Thermal Bridges [74]
3.2. Thermal Calibration and Thermal-to-3D Integration Workflow
3.3. Case Study 2: IFC 4.3 Class System—Information Content of the BIM Model in Low-Emission Construction
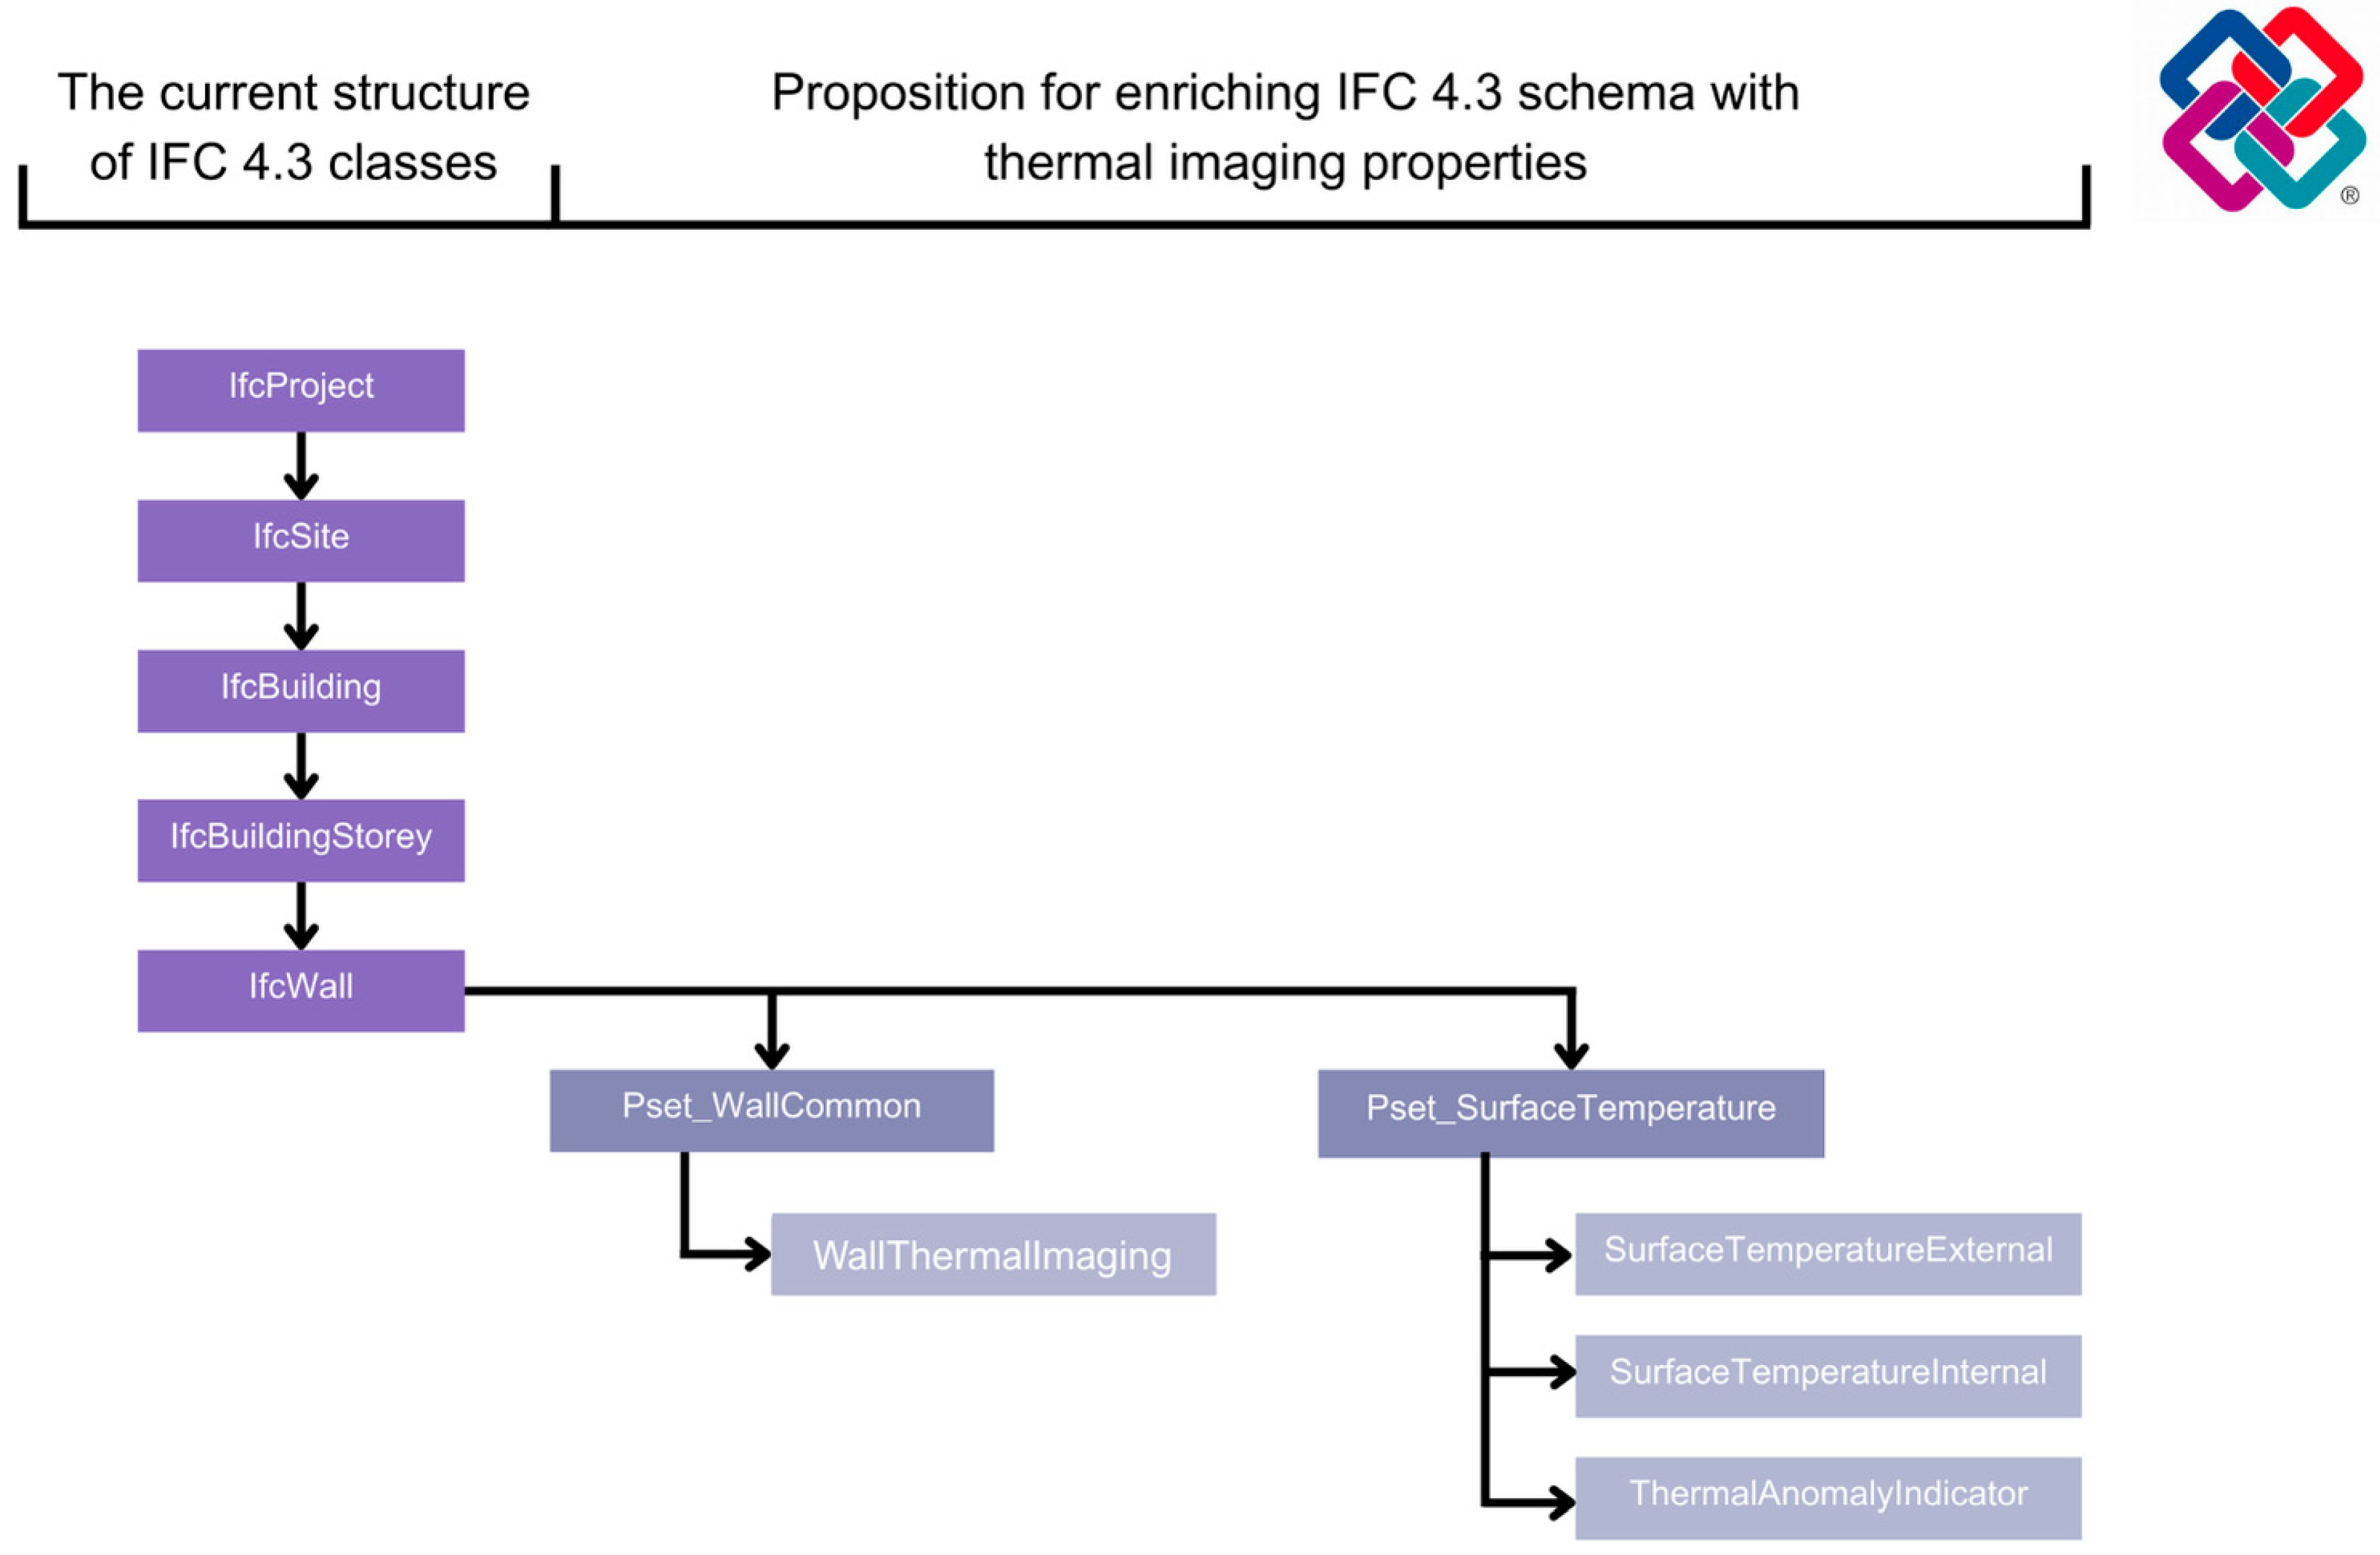
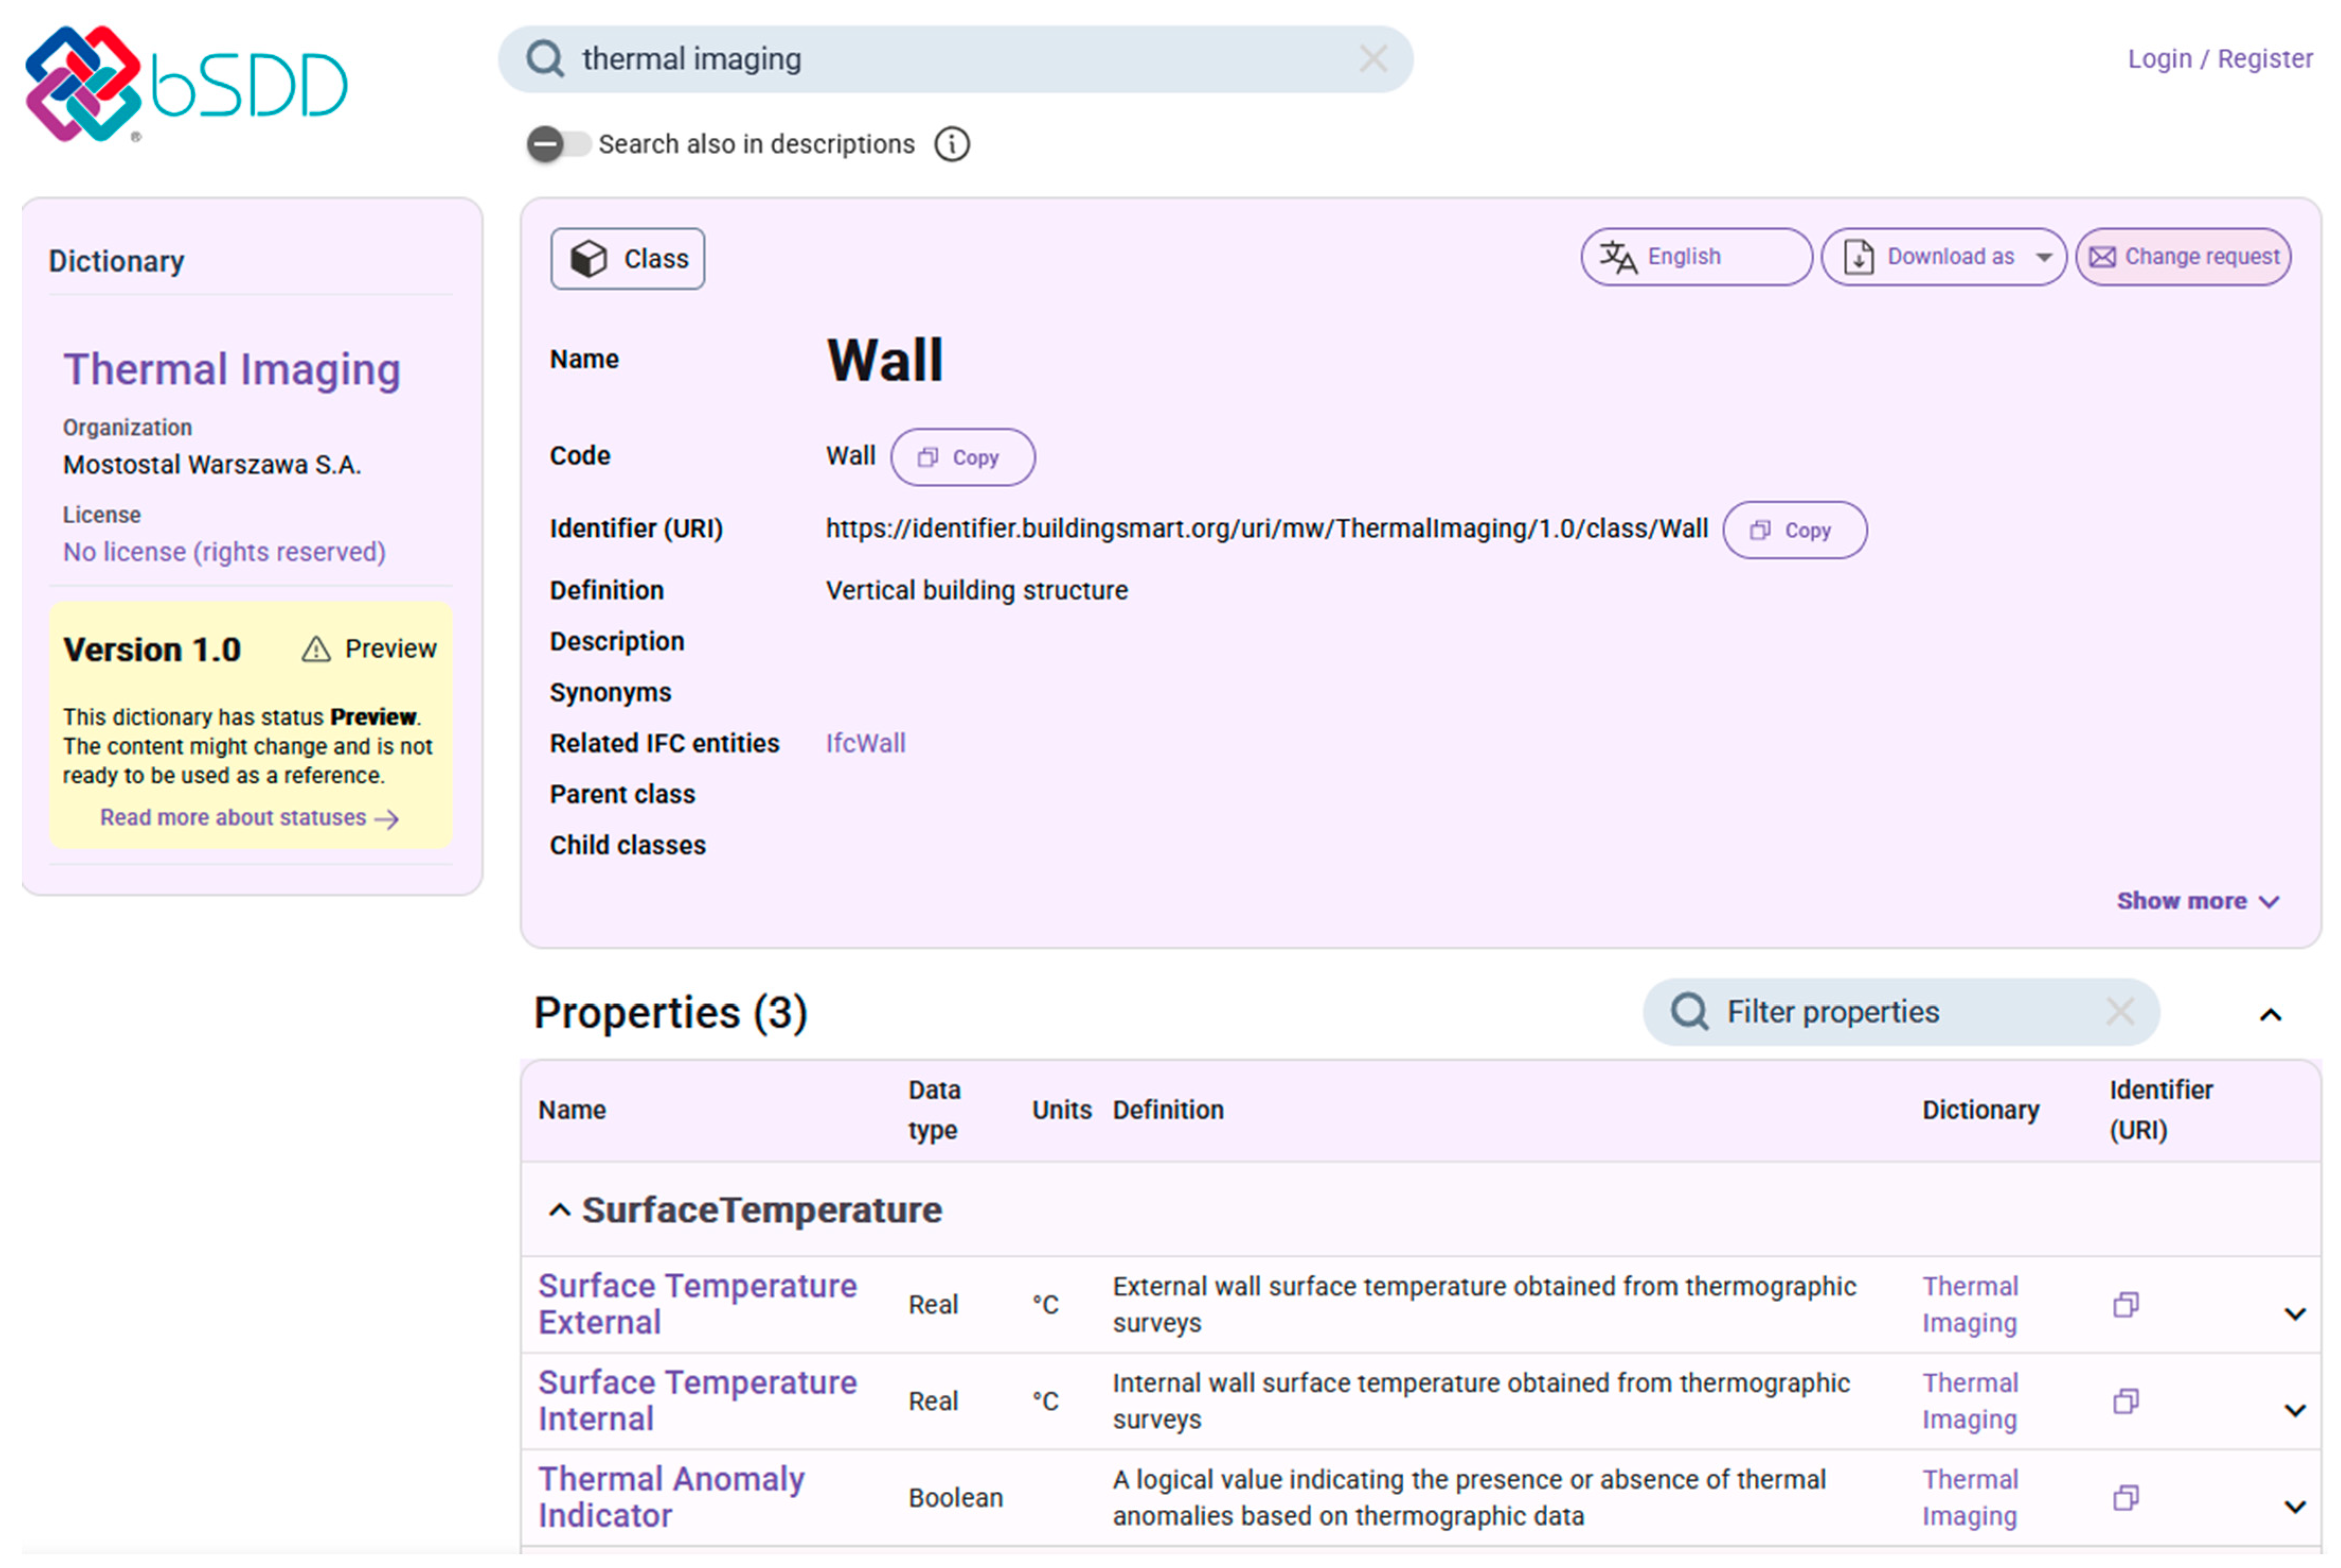
3.3.1. IfcWall Information Content in Terms of Energy Efficiency
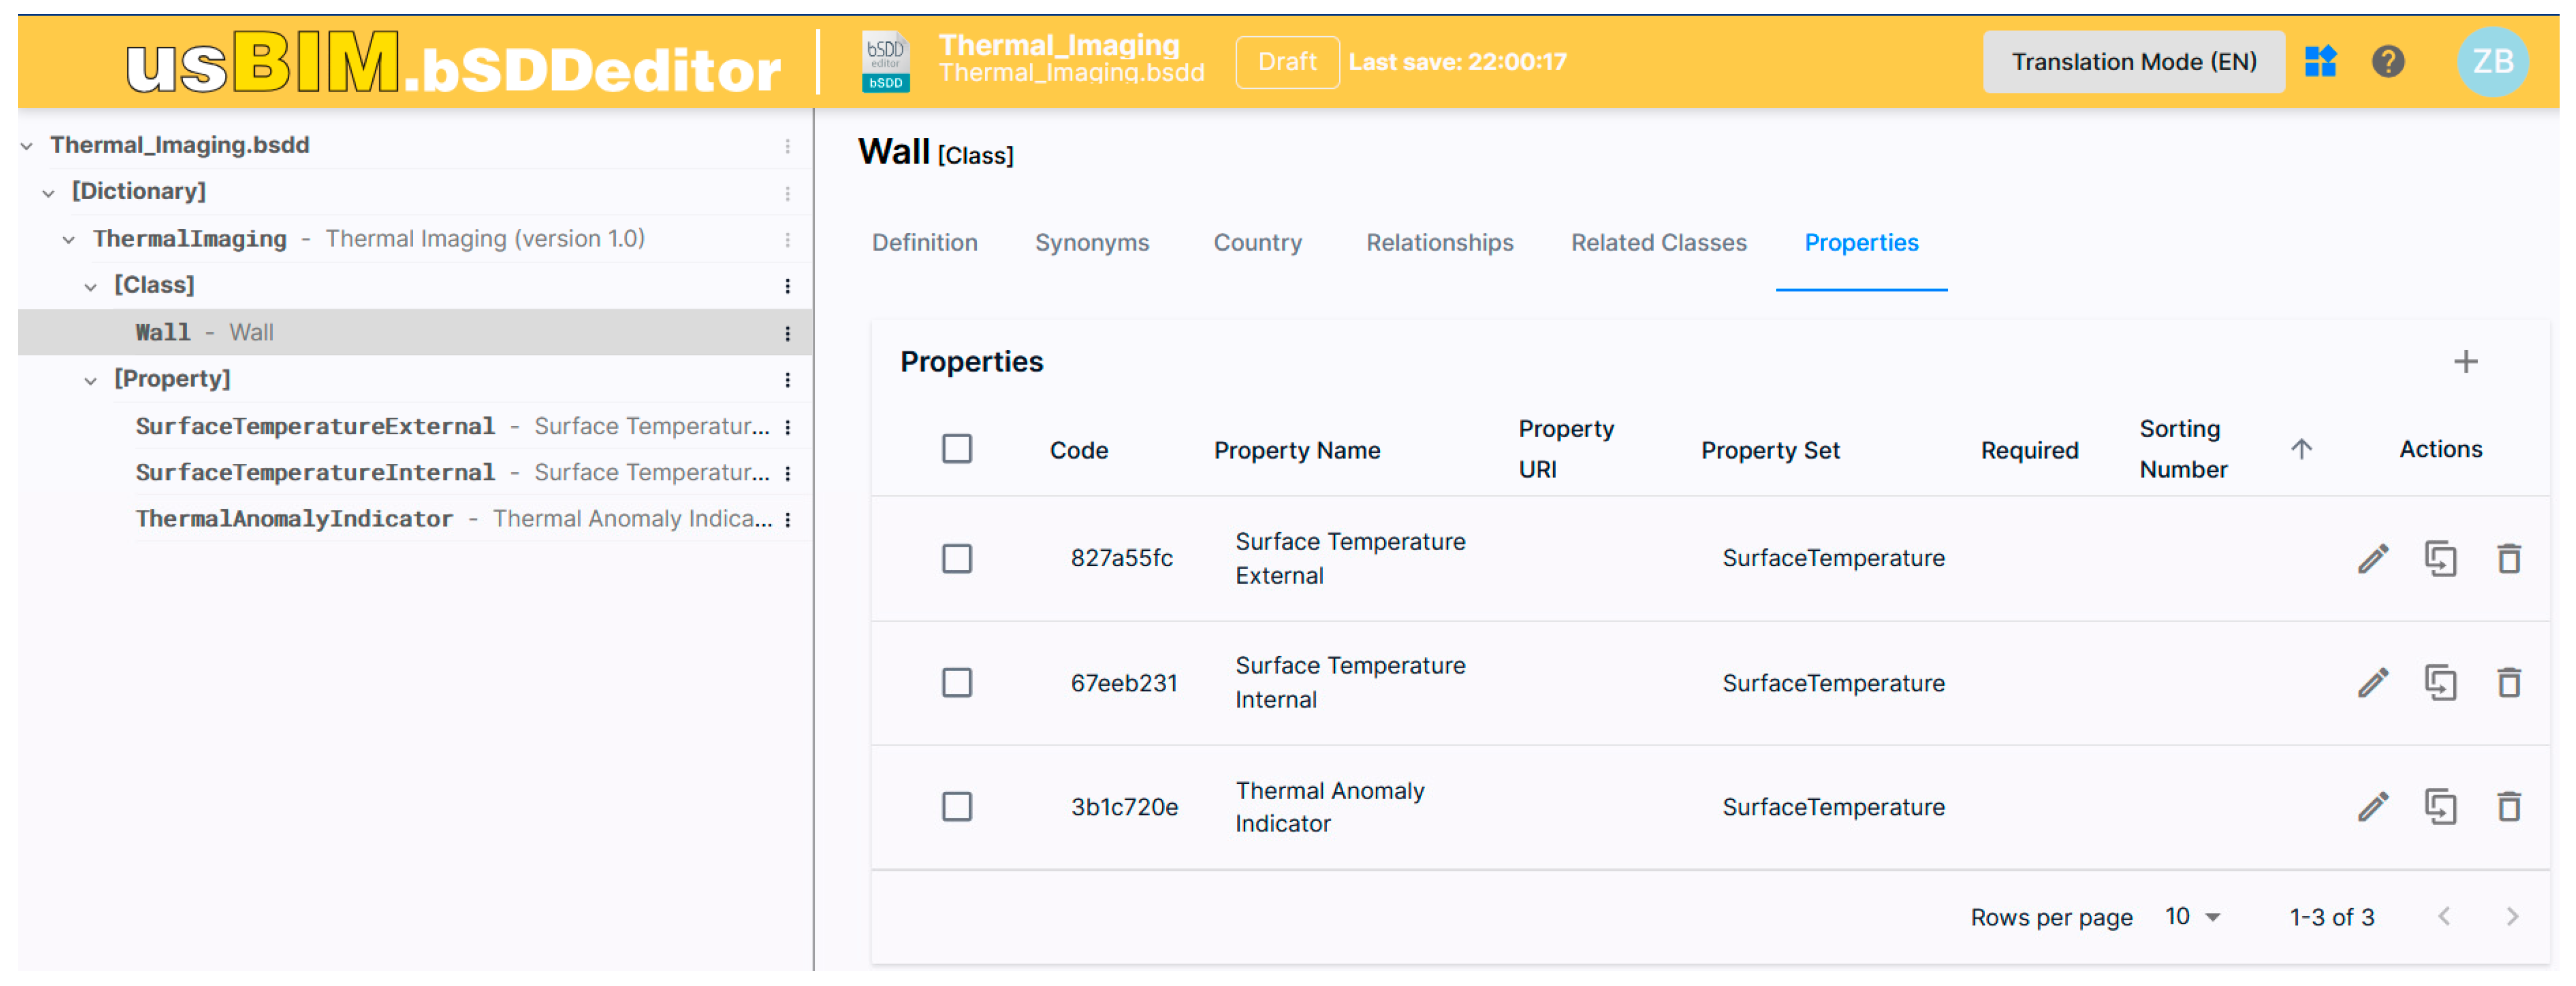
3.3.2. Justification for Custom bSDD Terminology and Compatibility with Standards
4. Results
5. Discussion
5.1. Study Limitations
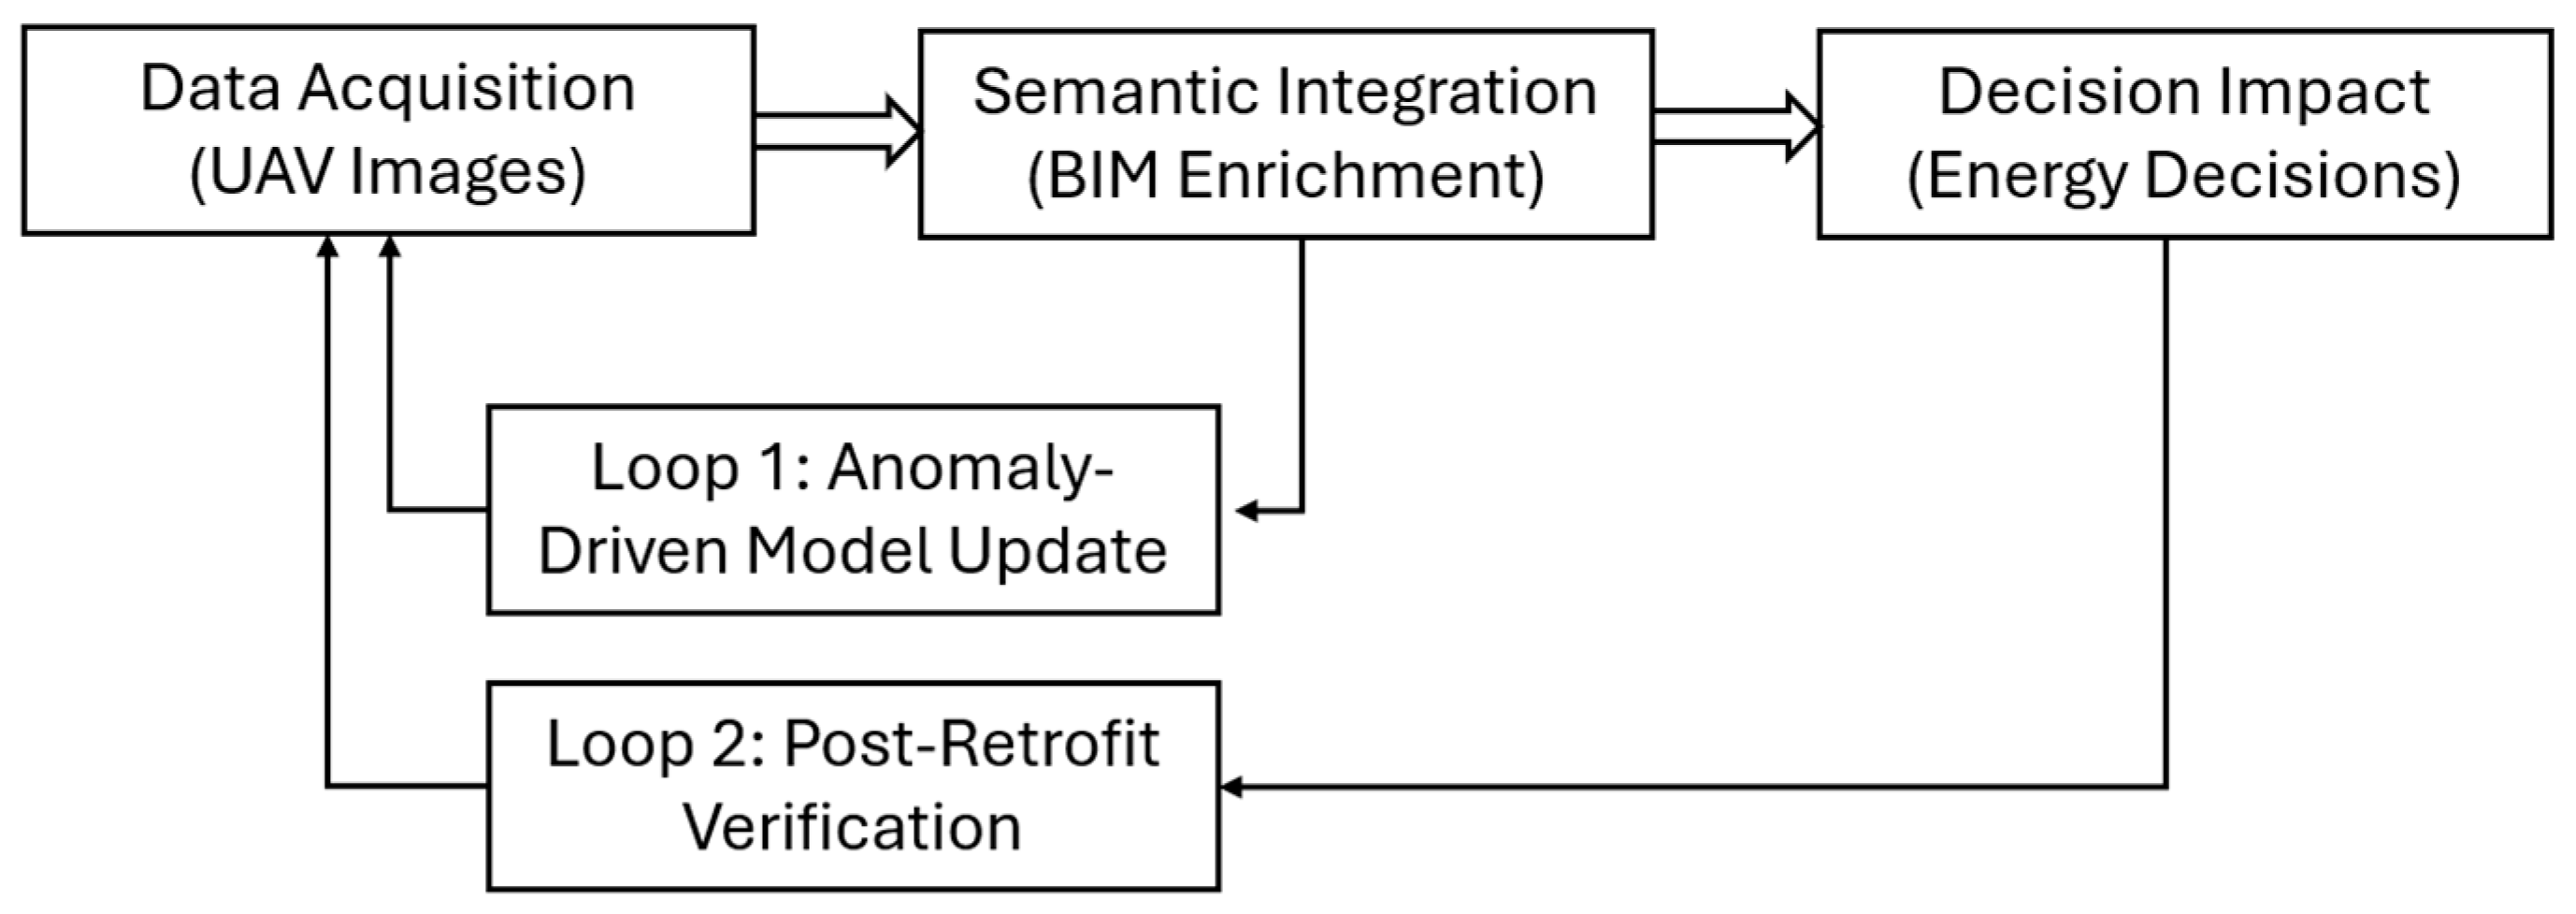
5.2. Proposed Conceptual Framework for Algorithmic Thermal-to-BIM Mapping
- BIM element segmentation: The geometry of BIM elements (e.g., IfcWall, IfcRoof, and IfcWindow) would be extracted from the IFC model. Spatial matching techniques—such as bounding box intersection or proximity-based nearest surface detection—could be used to associate each region of the thermal point cloud with specific BIM elements.
- Temperature aggregation and analysis: For each matched BIM element, basic thermal statistics would be calculated using the corresponding subset of thermal data points. These aggregated values would serve as representative indicators of surface temperature for each element.
- IFC model algorithmic enrichment with thermal properties: Based on detection results, elements would be tagged with a ‘ThermalAnomalyIndicator’ property indicating the presence of potential insulation defects or thermal bridges. Newly computed temperature values and anomaly indicators would be appended to BIM elements as properties automatically through algorithmic integration with the IFC software API and bSDD service API.
5.3. Influence of Seasonal and Diurnal Weather Factors
5.4. Quantitative Accuracy of Anomaly Detection
6. Conclusions
Author Contributions
Funding
Data Availability Statement
Conflicts of Interest
References
- Alizadehsalehi, S.; Hadavi, A.; Huang, J.C. From BIM to Extended Reality in AEC Industry. Autom. Constr. 2020, 116, 103254. [Google Scholar] [CrossRef]
- Agbobli, D.; Mo, Y. Leveraging XR in AEC Education Focusing on Occupant Behavior-Related Building Energy Use: A Systematic Review. Energy Build. 2024, 323, 114821. [Google Scholar] [CrossRef]
- Akbari, S.; Sheikhkhoshkar, M.; Pour Rahimian, F.; El Haouzi, H.B.; Najafi, M.; Talebi, S. Sustainability and Building Information Modelling: Integration, Research Gaps, and Future Directions. Autom. Constr. 2024, 163, 105420. [Google Scholar] [CrossRef]
- Alshehri, A.M.; Al Hajj, F.; Waqar, A.; Bageis, A.S.; Houda, M.; Benjeddou, O. Building Information Modeling (BIM) Driven Performance-Based Construction for the Optimization of Sustainable and Smart Structures Development. Environ. Chall. 2024, 16, 100980. [Google Scholar] [CrossRef]
- Kineber, A.F.; Singh, A.K.; Fazeli, A.; Mohandes, S.R.; Cheung, C.; Arashpour, M.; Ejohwomu, O.; Zayed, T. Modelling the Relationship between Digital Twins Implementation Barriers and Sustainability Pillars: Insights from Building and Construction Sector. Sustain. Cities Soc. 2023, 99, 104930. [Google Scholar] [CrossRef]
- Ansah, M.K.; Chen, X.; Yang, H.; Lu, L.; Lam, P.T.I. A Review and Outlook for Integrated BIM Application in Green Building Assessment. Sustain. Cities Soc. 2019, 48, 101576. [Google Scholar] [CrossRef]
- Dubljević, S.; Tepavčević, B.; Markoski, B.; Anđelković, A.S. Computational BIM Tool for Automated LEED Certification Process. Energy Build. 2023, 292, 113168. [Google Scholar] [CrossRef]
- Jalaei, F.; Jalaei, F.; Mohammadi, S. An Integrated BIM-LEED Application to Automate Sustainable Design Assessment Framework at the Conceptual Stage of Building Projects. Sustain. Cities Soc. 2020, 53, 101979. [Google Scholar] [CrossRef]
- Nocerino, G.; Leone, M.F. Computational LEED: Computational Thinking Strategies and Visual Programming Languages to Support Environmental Design and LEED Credits Achievement. Energy Build. 2023, 278, 112626. [Google Scholar] [CrossRef]
- Pan, X.; Mateen Khan, A.; Eldin, S.M.; Aslam, F.; Kashif Ur Rehman, S.; Jameel, M. BIM Adoption in Sustainability, Energy Modelling and Implementing Using ISO 19650: A Review. Ain Shams Eng. J. 2024, 15, 102252. [Google Scholar] [CrossRef]
- Weber, R.E.; Mueller, C.; Reinhart, C. Automated Floorplan Generation in Architectural Design: A Review of Methods and Applications. Autom. Constr. 2022, 140, 104385. [Google Scholar] [CrossRef]
- Muta, L.F.; Melo, A.P.; Lamberts, R. Enhancing Energy Performance Assessment and Labeling in Buildings: A Review of BIM-Based Approaches. J. Build. Eng. 2025, 103, 112089. [Google Scholar] [CrossRef]
- Zhang, C.; Zou, Y.; Wang, F.; Dimyadi, J. Automated UAV Image-to-BIM Registration for Planar and Curved Building Façades Using Structure-from-Motion and 3D Surface Unwrapping. Autom. Constr. 2025, 174, 106148. [Google Scholar] [CrossRef]
- Zhang, C.; Zou, Y.; Dimyadi, J.; Gonzalez, V.A. UAV Thermography for Building Energy Audit: Comparing Image Acquisition Strategies. In Proceedings of the 41st ISARC, Lille, France, 3 June 2024. [Google Scholar]
- Lin, D.; Yang, N.; Miao, Q.; Cui, X.; Xu, D. True 3D Thermal Inspection of Buildings Using Multimodal UAV Images. J. Build. Eng. 2025, 100, 111806. [Google Scholar] [CrossRef]
- Gaši, M.; Tkalčić, D.; Milovanović, B.; Maslać, M. Optimizing Building Energy Efficiency: A Precise BIM-Based Approach for Quantifying Thermal Bridges. J. Build. Eng. 2025, 101, 111796. [Google Scholar] [CrossRef]
- Vaz, C.F.; Guilherme, L.L.d.F.; Maciel, A.C.F.; De Araujo, A.L.; Da Costa, B.B.F.; Haddad, A.N. Building Information Modeling/Building Energy Simulation Integration Based on Quantitative and Interpretative Interoperability Analysis. Infrastructures 2024, 9, 84. [Google Scholar] [CrossRef]
- Guo, H.; Chen, Z.; Chen, X.; Yang, J.; Song, C.; Chen, Y. UAV-BIM-BEM: An Automatic Unmanned Aerial Vehicles-Based Building Energy Model Generation Platform. Energy Build. 2025, 328, 115120. [Google Scholar] [CrossRef]
- Pozzer, S.; Ramos, G.; Nooralishahi, P.; Azar, E.R.; El Refai, A.; López, F.; Ibarra-Castanedo, C.; Maldague, X. Integration of Thermographic Inspection Data with BIM for Enhanced Concrete Infrastructure Assessment. Autom. Constr. 2025, 171, 105965. [Google Scholar] [CrossRef]
- Musella, C.; Serra, M.; Menna, C.; Asprone, D. Building Information Modeling and Artificial Intelligence: Advanced Technologies for the Digitalisation of Seismic Damage in Existing Buildings. Struct. Concr. 2021, 22, 2761–2774. [Google Scholar] [CrossRef]
- Martin, M.; Chong, A.; Biljecki, F.; Miller, C. Infrared Thermography in the Built Environment: A Multi-Scale Review. Renew. Sustain. Energy Rev. 2022, 165, 112540. [Google Scholar] [CrossRef]
- Martín Garín, A.; Millán García, J.A.; Albrecht, P.; Otxoa Errarte, J.; Beraza Olabarrieta, X.; Rodríguez Saiz, Á. Tecnologías Digitales Para El Análisis de Edificios. Salud, Confort y Energía. = Digital Technologies for Building Analysis. Health, Confort and Energy. An. De Edif. 2021, 6, 21. [Google Scholar] [CrossRef]
- Alhawari, A.; Mukhopadhyaya, P. Mitigating Balcony Thermal Bridging: Experimental and Numerical Investigation of Innovative Solutions for Energy-Efficient Building Envelopes. Energy Build. 2025, 328, 115152. [Google Scholar] [CrossRef]
- Du, G.; Liu, Z.; Wang, J.; Wei, Q.; Yan, S. Life Cycle Carbon Emission Calculation Model of Energy System in Public Buildings: A Case Study in Shanghai. Energy Rep. 2024, 12, 3437–3450. [Google Scholar] [CrossRef]
- Zhao, S.; Diao, J.; Yao, S.; Yuan, J.; Liu, X.; Li, M. Seasonal Optimization of Envelope and Shading Devices Oriented towards Low-Carbon Emission for Premodern Historic Residential Buildings of China. Case Stud. Therm. Eng. 2024, 64, 105452. [Google Scholar] [CrossRef]
- Huang, X.; Ouyang, Y.; Zhang, D.; Yu, H. Greenhouse Gas Emission of Recycled Concrete Production for Pavement Construction Considering Carbon Uptake. Dev. Built Environ. 2025, 22, 100646. [Google Scholar] [CrossRef]
- Shadram, F.; Mukkavaara, J. Investigating the Potential for Realizing Life Cycle Net-Zero Energy Buildings in Europe Using Multi-Objective Optimization. Energy Rep. 2024, 12, 5648–5670. [Google Scholar] [CrossRef]
- Du, M.; Huang, C.; Liao, L. Trade Liberalization and Energy Efficiency: Quasi-Natural Experiment Evidence from the Pilot Free Trade Zones in China. Econ. Anal. Policy 2025, 85, 1739–1751. [Google Scholar] [CrossRef]
- Alhammad, M.; Eames, M.; Vinai, R. Enhancing Building Energy Efficiency through Building Information Modeling (BIM) and Building Energy Modeling (BEM) Integration: A Systematic Review. Buildings 2024, 14, 581. [Google Scholar] [CrossRef]
- Chakin, E.Y.; Gamayunova, O.S. Methodology for Selecting Energy-Efficient Thermal Insulation Materials Using the Dynamo Visual Programming Environment. Proc. Southwest State Univ. 2024, 28, 50–68. [Google Scholar] [CrossRef]
- Liu, Z.; Tang, A.; Lan, T.; Sun, L. Calculation of Carbon Emissions throughout the Lifecycle of Buildings Based on BIM Technology. Acad. J. Eng. Technol. Sci. 2024, 7, 47–52. [Google Scholar] [CrossRef]
- Pandya, C.; Prajapati, S.; Gupta, R. Sustainable Energy Efficient Green Campuses: A Systematic Literature Review and Bibliometric Analysis. IOP Conf. Ser. Earth Environ. Sci. 2022, 1084, 012016. [Google Scholar] [CrossRef]
- Piras, G.; Muzi, F.; Tiburcio, V.A. Enhancing Space Management through Digital Twin: A Case Study of the Lazio Region Headquarters. Appl. Sci. 2024, 14, 7463. [Google Scholar] [CrossRef]
- Abdelalim, A.M.; Essawy, A.; Sherif, A.; Salem, M.; Al-Adwani, M.; Abdullah, M.S. Optimizing Facilities Management Through Artificial Intelligence and Digital Twin Technology in Mega-Facilities. Sustainability 2025, 17, 1826. [Google Scholar] [CrossRef]
- Blut, C.; Becker, R.; Kinnen, T.; Schluetter, D.; Emunds, C.; Frisch, J.; Heidermann, D.; Wenthe, M.; Rettig, T.; Baranski, M.; et al. Optimizing Building Energy Systems through BIM-Enabled Georeferenced Digital Twins. Int. Arch. Photogramm. Remote Sens. Spat. Inf. Sci. 2024, XLVIII-4/W11-2024, 1–8. [Google Scholar] [CrossRef]
- Han, F.; Du, F.; Jiao, S.; Zou, K. Predictive Analysis of a Building’s Power Consumption Based on Digital Twin Platforms. Energies 2024, 17, 3692. [Google Scholar] [CrossRef]
- Daniotti, B.; Masera, G.; Bolognesi, C.M.; Lupica Spagnolo, S.; Pavan, A.; Iannaccone, G.; Signorini, M.; Ciuffreda, S.; Mirarchi, C.; Lucky, M.; et al. The Development of a BIM-Based Interoperable Toolkit for Efficient Renovation in Buildings: From BIM to Digital Twin. Buildings 2022, 12, 231. [Google Scholar] [CrossRef]
- Coupry, C.; Noblecourt, S.; Richard, P.; Baudry, D.; Bigaud, D. BIM-Based Digital Twin and XR Devices to Improve Maintenance Procedures in Smart Buildings: A Literature Review. Appl. Sci. 2021, 11, 6810. [Google Scholar] [CrossRef]
- Fokaides, P.; Klumbyte, E. Enhancing Building Energy Performance with Digital Twin Technologies: Insights from the SmartWins Project. Available online: https://build-up.ec.europa.eu/en/resources-and-tools/articles/enhancing-building-energy-performance-digital-twin-technologies (accessed on 28 April 2025).
- Zhang, C.; Zou, Y.; Dimyadi, J.; Chang, R. Thermal-Textured BIM Generation for Building Energy Audit with UAV Image Fusion and Histogram-Based Enhancement. Energy Build. 2023, 301, 113710. [Google Scholar] [CrossRef]
- Zhang, C.; Wang, F.; Zou, Y.; Dimyadi, J.; Guo, B.H.W.; Hou, L. Automated UAV Image-to-BIM Registration for Building Façade Inspection Using Improved Generalised Hough Transform. Autom. Constr. 2023, 153, 104957. [Google Scholar] [CrossRef]
- Tan, Y.; Li, G.; Cai, R.; Ma, J.; Wang, M. Mapping and Modelling Defect Data from UAV Captured Images to BIM for Building External Wall Inspection. Autom. Constr. 2022, 139, 104284. [Google Scholar] [CrossRef]
- Ham, Y.; Golparvar-Fard, M. Mapping Actual Thermal Properties to Building Elements in GbXML-Based BIM for Reliable Building Energy Performance Modeling. Autom. Constr. 2015, 49, 214–224. [Google Scholar] [CrossRef]
- Zhang, C.; Zou, Y.; Dimyadi, J. Integrating UAV and BIM for Automated Visual Building Inspection: A Systematic Review and Conceptual Framework. IOP Conf. Ser. Earth Environ. Sci. 2022, 1101, 062030. [Google Scholar] [CrossRef]
- Cheng, J.C.P.; Kwok, H.H.L.; Li, A.T.Y.; Tong, J.C.K.; Lau, A.K.H. BIM-Supported Sensor Placement Optimization Based on Genetic Algorithm for Multi-Zone Thermal Comfort and IAQ Monitoring. Build. Environ. 2022, 216, 108997. [Google Scholar] [CrossRef]
- Collins, F.C.; Noichl, F.; Slepicka, M.; Cones, G.; Borrmann, A. 360-Degree Tri-Modal Scanning: Engineering a Modular Multi-Sensor Platform for Semantic Enrichment of BIM Models. ISPRS Ann. Photogramm. Remote Sens. Spat. Inf. Sci. 2024, X-1–2024, 41–48. [Google Scholar] [CrossRef]
- Bassir, D.; Lodge, H.; Chang, H.; Majak, J.; Chen, G. Application of Artificial Intelligence and Machine Learning for BIM: Review. Int. J. Simul. Multidiscip. Des. Optim. 2023, 14, 5. [Google Scholar] [CrossRef]
- Shahinmoghadam, M.; Natephra, W.; Motamedi, A. BIM- and IoT-Based Virtual Reality Tool for Real-Time Thermal Comfort Assessment in Building Enclosures. Build. Environ. 2021, 199, 107905. [Google Scholar] [CrossRef]
- Kirimtat, A.; Krejcar, O. A Review of Infrared Thermography for the Investigation of Building Envelopes: Advances and Prospects. Energy Build. 2018, 176, 390–406. [Google Scholar] [CrossRef]
- Panigati, T.; Zini, M.; Striccoli, D.; Giordano, P.F.; Tonelli, D.; Limongelli, M.P.; Zonta, D. Drone-Based Bridge Inspections: Current Practices and Future Directions. Autom. Constr. 2025, 173, 106101. [Google Scholar] [CrossRef]
- Mayer, Z.; Kahn, J.; Hou, Y.; Götz, M.; Volk, R.; Schultmann, F. Deep Learning Approaches to Building Rooftop Thermal Bridge Detection from Aerial Images. Autom. Constr. 2023, 146, 104690. [Google Scholar] [CrossRef]
- Rakha, T.; Gorodetsky, A. Review of Unmanned Aerial System (UAS) Applications in the Built Environment: Towards Automated Building Inspection Procedures Using Drones. Autom. Constr. 2018, 93, 252–264. [Google Scholar] [CrossRef]
- Cai, W.; Huang, L.; Zou, Z. Actively-Exploring Thermography-Enabled Autonomous Robotic System for Detecting and Registering HVAC Thermal Leaks. Autom. Constr. 2023, 152, 104901. [Google Scholar] [CrossRef]
- Róg, M.; Rzonca, A. The Impact of Photo Overlap, the Number of Control Points and the Method of Camera Calibration on the Accuracy of 3D Model Reconstruction. Geomat. Environ. Eng. 2021, 15, 67–87. [Google Scholar] [CrossRef]
- Liu, L.; Zhang, L. Research on Optimization of Urban Landscape Design Based on Machine Learning and Thermodynamic Models: Integrated Application of Thermal Energy Cycle and Ecological Cycle. Therm. Sci. Eng. Prog. 2025, 60, 103440. [Google Scholar] [CrossRef]
- Waqas, A.; Araji, M.T. Machine Learning-Aided Thermography for Autonomous Heat Loss Detection in Buildings. Energy Convers. Manag. 2024, 304, 118243. [Google Scholar] [CrossRef]
- Wang, J. Thermal Energy Resource Utilization and Sample Image Restoration Technology Based on Machine Vision Simulation in Interior Design. Therm. Sci. Eng. Prog. 2024, 55, 102897. [Google Scholar] [CrossRef]
- Chuan, Y. Application of Indoor Thermal Energy Cycle and Visual Communication Simulation Scene Based on Machine Vision and Optical Image Enhancement. Therm. Sci. Eng. Prog. 2024, 55, 102994. [Google Scholar] [CrossRef]
- Gao, Y.; Chung, W. Optimization of Building Thermal Environment in Industrial Heritage Landscape Regeneration Design Simulation Based on Image Visual Visualization. Therm. Sci. Eng. Prog. 2024, 56, 103024. [Google Scholar] [CrossRef]
- Shrestha, A.; Shimizu, T. Thermal Performance Assessment of Traditional Japanese Wooden Houses with Short-Term Measurements: Machine Learning Approaches. J. Build. Eng. 2024, 97, 110954. [Google Scholar] [CrossRef]
- Hongyu, Y.; Tianyi, C. Application of Deep Learning in Indoor VR Design of Green Buildings: Research on Thermal Conductivity of Thermal Materials and Optimization of Space Utilization. Therm. Sci. Eng. Prog. 2025, 57, 103142. [Google Scholar] [CrossRef]
- Liu, X.; Gou, Z.; Yuan, C. Application of Human-Centric Digital Twins: Predicting Outdoor Thermal Comfort Distribution in Singapore Using Multi-Source Data and Machine Learning. Urban Clim. 2024, 58, 102210. [Google Scholar] [CrossRef]
- Tardy, F. A Review of the Use of Infrared Thermography in Building Envelope Thermal Property Characterization Studies. J. Build. Eng. 2023, 75, 106918. [Google Scholar] [CrossRef]
- Gil-Docampo, M.; Sanz, J.O.; Guerrero, I.C.; Cabanas, M.F. UAS IR-Thermograms Processing and Photogrammetry of Thermal Images for the Inspection of Building Envelopes. Appl. Sci. 2023, 13, 3948. [Google Scholar] [CrossRef]
- Niu, Z.; Xia, H.; Tao, P.; Ke, T. Accuracy Assessment of UAV Photogrammetry System with RTK Measurements for Direct Georeferencing. ISPRS Ann. Photogramm. Remote Sens. Spat. Inf. Sci. 2024, X-1–2024, 169–176. [Google Scholar] [CrossRef]
- Zhang, H.; Aldana-Jague, E.; Clapuyt, F.; Wilken, F.; Vanacker, V.; Van Oost, K. Evaluating the Potential of Post-Processing Kinematic (PPK) Georeferencing for UAV-Based Structure- from-Motion (SfM) Photogrammetry and Surface Change Detection. Earth Surf. Dyn. 2019, 7, 807–827. [Google Scholar] [CrossRef]
- Palanirajan, H.K.; Alsadik, B.; Nex, F.; Oude Elberink, S. Efficient flight planning for building façade 3D reconstruction. Int. Arch. Photogramm. Remote Sens. Spat. Inf. Sci. 2019, XLII-2/W13, 495–502. [Google Scholar] [CrossRef]
- Zhang, S.; Zhang, W.; Liu, C. Model-based multi-uav path planning for high-quality 3D reconstruction of buildings. Int. Arch. Photogramm. Remote Sens. Spat. Inf. Sci. 2023, XLVIII-1/W2-2023, 1923–1928. [Google Scholar] [CrossRef]
- Yao, P.; Cai, Y.; Zhu, Q. Time-Optimal Trajectory Generation for Aerial Coverage of Urban Building. Aerosp. Sci. Technol. 2019, 84, 387–398. [Google Scholar] [CrossRef]
- Available online: https://Github.Com/Imagej (accessed on 28 April 2025).
- Available online: https://Github.Com/Gpereyrairujo/IRimage (accessed on 28 April 2025).
- Pereyra Irujo, G. IRimage: Open Source Software for Processing Images from Infrared Thermal Cameras. PeerJ Comput. Sci. 2022, 8, e977. [Google Scholar] [CrossRef]
- Livada, Č.; Glavaš, H.; Baumgartner, A.; Jukić, D. The Dangers of Analyzing Thermographic Radiometric Data as Images. J. Imaging 2023, 9, 143. [Google Scholar] [CrossRef]
- Schuetz, M. Potree: Rendering Large Point Clouds in Web Browsers; Technische Universitat Wien: Vienna, Austria, 2015. [Google Scholar]
- Available online: https://Github.Com/Potree/Potree/ (accessed on 28 April 2025).
- Antunes, M.L.R.; César, K.M.L.; Ribeiro, J.C.L.; de Oliveira, D.S.; Carvalho, J.M.F. de Analysis of IFC Interoperability Data Schema for Project Representation. Autom. Constr. 2024, 166, 105650. [Google Scholar] [CrossRef]

| Flight | Vertical  | Oblique | Horizontal |
| Trajectory | 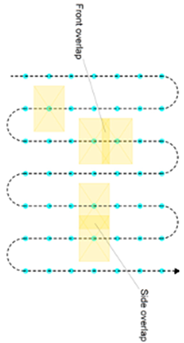 Grid | 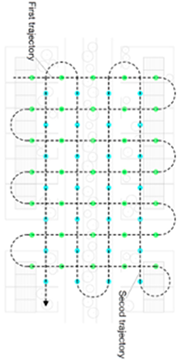 Double Grid | 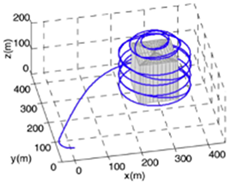 [69] Zig-zag Ring |
| Camera position | 90° | 30–45° | 0–30° |
| Image Overlay (calculated with respect to the thermal camera GSD) | 70–80% | 70–80% | >80% |
Disclaimer/Publisher’s Note: The statements, opinions and data contained in all publications are solely those of the individual author(s) and contributor(s) and not of MDPI and/or the editor(s). MDPI and/or the editor(s) disclaim responsibility for any injury to people or property resulting from any ideas, methods, instructions or products referred to in the content. |
© 2025 by the authors. Licensee MDPI, Basel, Switzerland. This article is an open access article distributed under the terms and conditions of the Creative Commons Attribution (CC BY) license (https://creativecommons.org/licenses/by/4.0/).
Share and Cite
Muchla, A.; Kurcjusz, M.; Sutkowska, M.; Burgos-Bayo, R.; Koda, E.; Stefańska, A. The Use of BIM Models and Drone Flyover Data in Building Energy Efficiency Analysis. Energies 2025, 18, 3225. https://doi.org/10.3390/en18133225
Muchla A, Kurcjusz M, Sutkowska M, Burgos-Bayo R, Koda E, Stefańska A. The Use of BIM Models and Drone Flyover Data in Building Energy Efficiency Analysis. Energies. 2025; 18(13):3225. https://doi.org/10.3390/en18133225
Chicago/Turabian StyleMuchla, Agata, Małgorzata Kurcjusz, Maja Sutkowska, Raquel Burgos-Bayo, Eugeniusz Koda, and Anna Stefańska. 2025. "The Use of BIM Models and Drone Flyover Data in Building Energy Efficiency Analysis" Energies 18, no. 13: 3225. https://doi.org/10.3390/en18133225
APA StyleMuchla, A., Kurcjusz, M., Sutkowska, M., Burgos-Bayo, R., Koda, E., & Stefańska, A. (2025). The Use of BIM Models and Drone Flyover Data in Building Energy Efficiency Analysis. Energies, 18(13), 3225. https://doi.org/10.3390/en18133225