1. Introduction
The World Climate Action Summit (WCAS) aims to reduce
emissions by 22–25 gigatons of carbon dioxide equivalent Gt
e by 2030 in order to keep warming below 1.5 °C [
1]. The Paris Agreement aims to decarbonize the energy sector through lower consumption, lowering emissions from transportation, and improving energy security [
2].
Switching from fossil fuels to renewables such as solar and wind presents issues, owing to their fluctuating nature. Because output is weather- and time-dependent, balancing supply and demand necessitates adequate energy storage. Intermittency can strain grid stability, threatening outages due to voltage and frequency changes [
3].
Hydrocarbon-free fuels, such as ammonia and hydrogen, are becoming increasingly common. Hydrogen, at 121.1 MJ/kg, has a higher energy content than natural gas (48 MJ/kg), which improves efficiency in certain industries. Unlike fossil fuels, which release pollutants like
,
,
, and particulate matter, hydrogen combustion produces solely water vapor, helping reduce greenhouse gas emissions and enhance air quality [
4].
Hydrogen can be created through sustainable electrolysis powered by renewable energy sources such as hydroelectric, solar, or wind, resulting in “green hydrogen” with zero emissions. Hydrogen also improves energy security by lowering dependence on imported fossil fuels and diversifying energy sources, thereby increasing independence and resilience [
5,
6].
Hydrogen and renewable energy sources can be utilized to produce ammonia
, mainly through the Haber–Bosch method [
7]. Ammonia has a higher energy density per volume than hydrogen (12.69 MJ/L or 11.65 MJ/L, depending on storage conditions), and it can be kept as a liquid under manageable conditions, e.g., 1 bar at 240 K or 300 bar at 298 K [
8]. These benefits make ammonia storage 26–30 times less expensive than hydrogen [
7].
Table 1 shows that there are variations in energy content, flammability, and ignition properties between
,
, and
.
Gas turbines are ideal for combined heat and power (CHP) systems because they are long-lasting, require little maintenance, and have little downtime. Their straightforward design and few moving parts enable continuous operation. They also adapt swiftly to load changes and accommodate a variety of fuels, and alter output to match demand, thereby maintaining grid stability and efficiency [
10].
Gas turbines serve clean energy goals by employing fuels such as hydrogen and ammonia, which reduce emissions and increase efficiency. They can use a variety of fuels, including high-calorific methane and low-calorific biogas [
11]. Their combustion systems can be altered to accept low-octane or hydrogen fuels [
12,
13,
14].
The LM6000 gas turbine, introduced in 1989, underwent rigorous testing prior to commercial usage. Its superior output and simple-cycle efficiency make it popular in power plants and cogeneration. The CF6-80C2 engine evolved from older GE turbines such as the LM1600, LM2500, and LM5000 [
15].
The LM6000 gas turbine supports a variety of fuels, including natural gas, LPG, isopentane, ethanol, diesel, and Coke Oven gas, and allows for rapid switching without shutting down. It ramps at 50 megawatts per minute, which is far quicker than ordinary 5-megawatt turbines. The SPRINT system enhances mass flow and cooling by spray intercooling, with automatic water injection management dependent on the inlet temperature [
15].
Since the mid-20th century, hydrogen has been investigated as a fuel for gas turbines. In 1939, Hans von Ohain pioneered its application in these engines. At first hydrogen’s combustion qualities appeared promising. However, complications emerged as a result of metal fatigue [
16].
Morris [
17] studied the effect of hydrogen as a fuel addition in a heavy-duty gas turbine. Hydrogen reduced
emissions but slightly raised
generation, particularly when injection levels reached up to 10% by volume. Mitsubishi Heavy Industries Ltd. (MHI), Tokyo, Japan, conducted a co-firing experiment with 30% hydrogen by volume in their new combustor. This technology can reduce
emissions by around 10% relative to natural gas production [
18].
In [
19,
20], the effect of adding hydrogen on gas turbine efficiency, emissions, and combustion kinetics was assessed by a thermodynamic theory with linked combustion kinetics. The findings revealed that a smaller fuel/air ratio increased efficiency at the largest turbine inlet temperature, resulting in nonlinear variations in emissions and efficiency. The compressor and turbine isentropic efficiencies had the greatest effect on performance, rising with higher levels of hydrogen while also boosting thermal efficiency.
The authors of [
21] found that flame sizes reduced with increased hydrogen concentration, resulting in bigger
emissions from higher flame temperatures. However,
emissions greatly fell.
In May 2020, Kawasaki developed a hydrogen-powered industrial gas turbine using dry low-emission combustion technologies. The system employs micro-mix combustion to attain low
emissions with no water or steam injection, resulting in increased efficiency and lower nitrogen oxide emissions. This method promotes industrial carbon reduction and cleaner energy by allowing high hydrogen fuel utilization, enhancing turbine reliability, and minimizing maintenance [
22,
23].
In September 2023, Kawasaki launched the world’s first hydrogen DLE gas turbine with a micro-mix (MMX) combustor [
24]. The M1A-17 platform, with a 1.8 MWe output, allows for cofiring natural gas with 50–100 vol.% hydrogen throughout the entire load band.
As stated by [
25], at lower hydrogen concentrations (less than 10%), the flame’s combustion characteristics are virtually unaffected. While pure methane increases flame length, adding hydrogen diminishes it. Low levels of hydrogen reduce the lateral mixing zone, resulting in this effect.
In January 2024, Laith Mustafa and Rafał Slefarski analyzed hydrogen/methane mixes in combined cycle gas turbines. They maintained the turbine input temperature at 1723 K to prevent metal burning. The researchers discovered that raising hydrogen content enhanced thermal efficiency and work output. However, when hydrogen passed 20%,
emissions increased dramatically, with pure hydrogen releasing almost three times more
than methane because of higher levels of hydrogen, oxygen, and hydroxyl radicals in the reaction zone [
4].
Shih et al. [
26] used CFD to examine hydrogen–methane blends in a small gas turbine. They increased hydrogen from 0% to 90% by volume to evaluate flame behavior and emissions. Combustion efficiency remained consistent; however, the combustor design required alterations at high hydrogen levels. In [
27], researchers used tests and simulations to investigate pure hydrogen in an improved lean premixed burner. Burners were adjusted to accommodate fluctuating premix levels, and high flow rates hindered flame stabilization in the premix pipe. The results demonstrated that pure hydrogen can be used with emissions under regulatory limits.
Numerous studies concentrate on micro-gas turbines utilizing
and
blends. Tohoku University created a micro-gas turbine using ammonia–methane mixes that produced minimal emissions and great thermal performance for small-scale energy production. The research demonstrated the turbine’s consistent performance throughout several fuel blends and load conditions [
28].
Ślefarski et al. [
29] investigated ammonia–methane co-combustion in lean swirl flames with up to 25% ammonia. Modeling with the Eddy Dissipation Concept (EDC) and Reynolds Stress Models (RSMs) revealed that the Okafor mechanism more closely approximated the experimental findings. Heat transfer and volume of the reactor were estimated using CFD, resulting in
emissions within 10% of experimental data. Despite its high computing cost, the 3D RSM simulation is suited for small-scale applications.
In 2022, the Ansaldo AE-T100 micro-gas turbine was examined with ammonia–methane mixes rather than natural gas. Methane was used as a pilot flame, while ammonia levels changed in the main fuel line. The turbine produced 60 kWe at 645 °C and maintained stable operation with up to 63% ammonia. A powerful pilot flame was required for effective ignition [
30].
Skabelund et al. [
31] investigated ammonia, hydrogen, and methane mixes in a 50 MW Brayton cycle, examining over 5150 fuel combinations. A blend of 78% hydrogen and 22% ammonia reached 44.6% efficiency, which is comparable to methane. Another work designed a micro-gas turbine using partially cracked ammonia in MATLAB/Simulink, exhibiting 74.5–79.1% efficiency and reduced
emissions [
32].
Based on the H-25 series, Mitsubishi Power created a 40 MW gas turbine that runs on ammonia in 2021 [
33]. Including a steam cycle will improve efficiency. In comparison to natural gas turbines, ammonia requires a larger combustion chamber because of its slower laminar flame speed.
Experiments demonstrate that increased pressure decreases
emissions in stoichiometric premixed ammonia/air flames. Ammonia produces lower thermal
due to its relatively lower flame temperatures and emits no
or soot. Additionally its high octane rating offers anti-knock benefits [
34]. However, ammonia can still produce large
, causing air pollution [
35]. Blending it with fuels like methane can boost combustion speed and lower
emissions, making it more viable as a fuel [
36,
37,
38,
39].
Due to ammonia’s great ignition temperature and smaller flammability range, it requires more safety precautions when being handled, stored, and transported—especially in industrial settings. Hydrocarbon fuels have different combustion characteristics than ammonia. They require more ignition energy and have a slower burning rate of around 7 cm/s, a lower flame temperature, and a smaller flammability range [
34,
40,
41].
Scientists attempted to tackle these challenges. They focused on developing new materials, developing design processes, and studying hydrogen’s behavior in turbines. Today, hydrogen continues to be an essential research issue for more environmentally friendly and sustainable energy sources. This research [
42] demonstrates that material selection is crucial for the safe and efficient use of ammonia–hydrogen fuels in gas turbines. These fuels have distinct combustion problems, which can result in corrosion, embrittlement, and cracking. High temperatures raise the danger of damage, particularly in turbine blades, necessitating improved materials and analysis methodologies.
Adapting hydrogen and ammonia to use these fuels necessitates significant changes, but it may give viable options that improve safety and infrastructure. This study [
43,
44] concludes that while hydrogen combustion is sustainably benign, it poses issues in regulating ignition and combustion, potentially leading in knocking. Ammonia is less combustible, requiring engine changes, and produces
emissions that require more treatment.
Oxygen-enriched combustion (OEC) is a promising method for advanced power plants [
45]. Replacing nitrogen (
) with oxygen (
) reduces dilution, increases combustor temperatures, and improves efficiency and capacity [
46]. Injecting pure oxygen raises the oxidant’s oxygen content [
47], enabling more complete combustion and greater energy efficiency.
Oxygen-enriched combustion (OEC) uses less fuel to generate the same power, while lowering pollution and exhaust volume. It supports higher flame temperatures, faster reactions, and greater fuel flexibility, including the use of lower-quality fuels. OEC improves
capture and enhances combustion control, helping operators optimize performance and adapt to load changes [
47,
48].
Oxygen-enriched combustion (OEC) enables higher flame temperatures, faster reactions, and greater fuel flexibility, reducing reliance on specific fuels. OEC also enhances combustion control, allowing operators to optimize performance and adapt to load changes [
47,
48].
Although oxy-combustion is well-studied [
49,
50,
51,
52,
53,
54], OEC lacks experimental data [
45]. Bench tests show that oxygen enrichment improves volatile release and reduces burnout temperatures compared to air combustion [
55].
A heat flow model [
45] shows better combustion and higher flue gas temperatures, increasing boiler efficiency by 2–5% [
45]. In fluidized bed combustors, steam injection (steam-to-fuel ratio 0.8) lowers
emissions below 35% oxygen, while 0.5 enhances combustion [
55].
While past studies have looked at the effects of , , and OEC on gas turbines separately, no one has fully explored how these factors work together. The novelty of this study is that it looks at the combined impact of , , and OEC on gas turbine performance. Using data from GE Gas Power’s LM 6000 turbines, this research aims to fill that gap. The main goal is to better understand how these technologies can work together to improve gas turbine efficiency. The research will specifically carry out the following:
- (A)
Analyze the variation in adiabatic flame temperature with respect to fuel mixture ratio and OEC.
- (B)
Assess the differences in laminar burning velocity based on fuel mixture ratio and OEC.
- (C)
Compare thermal efficiency and network output as a function of fuel mixture ratio and OEC.
- (D)
Perform emission analysis considering fuel mixture ratio and OEC.
2. Materials and Methods
The methodology used to assess the effects of using hydrogen and ammonia blended with as fuels in gas turbine systems, integrating oxygen-enriched combustion (OEC) from the oxidizer stream, is described in this section. It provides thorough explanations of every system, including its elements, information, and underlying assumptions.
Sensitivity analyses were performed on the gas turbine powered by blends of methane–hydrogen and methane–ammonia. Meanwhile, the air’s oxygen concentration was varied to examine the effects of both on the gas turbine’s @ 15% (dry) emissions, burning velocity, thermal efficiency, and adiabatic temperature.
2.1. GE LM6000 Gas Turbine Design and Operating Principle
The operating principle of a gas turbine is to convert fuel into energy utilizing three key components: a compressor, a combustion chamber, and a turbine. The process begins when air is pulled in and compressed, heating it up. This high-pressure air then reacts with fuel and ignites, resulting in the release of superheated gas. As the gas expands, it causes the turbine blades to spin quickly, providing power while keeping the compressor running.
The GE LM6000 gas turbine components are shown in
Figure 1. The GE LM6000 is a two-shaft aeroderivative machine built on the CF6-80C2 engine. It is designed for high-performance power generation, offering fast start-up, high efficiency, and fuel diversity. The LM6000 has both low- and high-pressure compressors and turbines. It runs on gas or distillate fuel and minimizes emissions by steam or water injection. The airflow is controlled by three systems: bleed valves, inlet guide vanes, and variable stator vanes.
The low-pressure compressor (LPC) module includes a variable inlet guide vane (VIGV) to control incoming airflow, along with LPC stator and rotor assemblies. The LPC is a 5-stage axial-flow compressor based on the LM5000 LPC, which was developed from the CF6-50 booster.
The high-pressure compressor (HPC) is a single-spool, 14-stage axial-flow compressor with variable stator vanes (VSVs) in the inlet guide vane and stages 1 through 5. These vanes help prevent stalls and maintain high efficiency during startup and normal operation [
15,
56].
There are two available combustion systems: the single annular combustor (SAC) and the dry low-emission (DLE) combustor. The SAC is equipped with 30 externally mounted fuel nozzles and can operate on liquid distillate fuel, natural gas, or both (dual fuel).
The system can also be configured for water or steam injection to reduce
emissions. The DLE combustor has a triple annular design that allows it to run with a uniformly mixed lean fuel–air ratio (premixed mode) throughout the entire power range, helping to minimize emissions [
15,
56].
The low-pressure turbine (LPT) uses the gas flow from the core of the turbine to drive the low-pressure compressor (LPC) and other connected equipment.
The main parts of the LPT module are a five-stage stator and a five-stage rotor. The LPT rotor powers the LPC and the load either through the midshaft and forward drive adapter (cold-end drive) or directly through the rear drive adapter (hot-end drive).
The high-pressure turbine (HPT) in the LM6000 is a two-stage, air-cooled design that provides high efficiency. It includes the HPT rotor and the Stage 1 and Stage 2 nozzle assemblies. The HPT rotor is mechanically connected to the high-pressure compressor (HPC) and extracts energy from the hot gas stream to drive it. The turbine nozzles guide the hot gas onto the rotor blades at the best angle and speed for maximum performance [
15,
56].
The accessories connected to the accessory gearbox (AGB) are powered by the high-pressure rotor system. Power is transferred through the inlet gearbox (IGB), a radial drive shaft, and the transfer gearbox (TGB) assembly [
15].
In the engine frame and air collector, three structural frames support the bearings for both the low-pressure (LP) and high-pressure (HP) rotors. This frame configuration provides the gas turbine with strong mechanical and dynamic stability and helps control tip clearances for compressor and turbine blades and vanes.
As
Table 2 shows, the LM6000 uses three airflow control systems: bleed valves between the LPC and HPC, variable inlet guide vanes (VIGVs) at the LPC inlet, and variable stator vanes (VSVs) in the HPC. These systems enhance compressor stability, prevent stalls, and adjust airflow for different load conditions [
15].
2.2. Thermodynamic Analysis
For thermodynamic analysis, this study used Aspen HYSYS, a component-based simulation package specialized in modeling thermodynamic cycles for oil and gas operations, to simulate the power cycle [
57]. This program has a complete component library that allows users to pick and set properties for components such as combustion chambers, turbines, and compressors, as well as fuel and oxidizer components.
The program uses energy balances to control fuel behavior and streams to connect them. A component list allows you to specify the material composition of each stream, as well as properties like temperature, pressure, and mass flow. Aspen HYSYS can replicate the steady-state and dynamic performance of complicated chemical/hydrocarbon fluid-based processes by connecting multiple components via material and energy streams.
Air, fuel, and exhaust gas are represented using the Peng–Robinson fluid packages. The combustor was simulated using the GBS Reactor module, which was customized to meet the project’s specifications. The combustion chamber and other library components were adapted and programmed to allow new fuel combustion, substituting natural gas or a blend of / and /. All fuels under consideration were considered to have a constant heat loss from the combustion chamber.
Table 3 shows the input parameters and boundary conditions. It was assumed that the cycle would undergo no mass, heat, or pressure losses.
The mass of oxidizer supplied to the compressor was estimated based on the combustion reaction of the
/
and
/
blend as indicated in Equation (
1) , considering the equivalence ratio changeable to achieve the constant TIT in all situations. Oxygen fraction (
) was chosen to provide the necessary oxidizer for oxygen-enriched combustion (0.21, 0.3, and 0.4). This conclusion was made based on Aspen’s component ratio selection and total air mass calculations.
where
,
and
denote the mole fraction of
,
and
in the fuel; in the case of
/
, the molar fraction of
is zero. Conversely, for a
/
blend, the molar fraction of
is zero, and the density is at standard conditions calculated in Formula (
2), where M is the molar mass of components and g is mole fraction of the oxidizer component.
The mass flow rate of fuel was computed for a constant input power of
= 102 MW [
58], using Formula (
3), where
,
, and
are the mole fractions of the fuel components, and
is the lower heating value.
The thermal efficiency for the GT plant is computed in Equation (
4) and the net work by Equation (
5).
Figure 2 illustrates the fuel characteristics of methane mixes with ammonia and hydrogen, as well as the impact of
/
and hydrogen.
/
on the fuel combination’s energy characteristics. The higher heating value (HHV) and lower heating value (LHV) rise in proportion to the hydrogen concentration of the
/
mix. The molar masses of
/
/
should be included when determining the LHV and HHV of a gas mixture by volume. This pattern illustrates how hydrogen may significantly raise methane’s energy content, making it a desirable option for raising natural gas’s calorific value. As the ammonia fraction rises, the LHV and HHV for the
/
mix fall.
Figure 3 shows the fuel parameters for blends of
/
and
/
, revealing important trends in the molecular weight (MW) and mass heat capacity of the mixes. Because hydrogen has a much lower molecular weight than methane, the molecular weight of blends including hydrogen drops sharply as the hydrogen proportion increases. The molecular weight (MW) of
/
has slightly increased. The combination’s mass heat capacity increased from 2.44 to 14.21 of pure hydrogen, while there was a minor rise in
/
mass heat capacity.
Figure 4 illustrates how methane combines with hydrogen
and ammonia
to obtain a thermal input of 102 MW. This indicates major trends in thermodynamic characteristics and fuel efficiency. Adding hydrogen to the
combination lowers the mass of fuel required to achieve 102 MW. Because hydrogen has a greater energy content per unit mass than other fuels, the
mix requires more fuel, as ammonia has a lower calorific value than other fuels. Over a variety of hydrogen concentrations, the ratio representing the relationship between specific heat capacities at constant pressure (
) and constant volume (
) remains relatively constant in the case of
, and shows a slight increase in the case of
.
The model’s operation was assumed to be based on the delivery of pressurized hydrogen from water electrolysis and an easily accessible air supply. The Haber–Bosch process then converts green hydrogen into ammonia by mixing it with nitrogen. The ammonia in the gas phase was required to be 65 °C in order to keep the ammonia pressure at 30 bar.
The air was enriched with oxygen generated by water splitting, which results in both hydrogen and oxygen. The air was enriched at three distinct ratios: 21%, 30%, and 40% volume of .
The gas turbine system is made up of three major components, an air compressor (C), a turbine (T), and a combustor (CC), that are connected by a common shaft. The model includes direct combustion, which happens when fuels react with compressed air. The combustion temperature, which is maintained in the combustion chamber at 3.3 MPa, is determined by the oxygen content of the air. A constant-pressure process produces gases at the specified temperature, with a turbine inlet temperature of 1723 K.
The main experiment involved operating a GE LM6000 gas turbine using natural gas fuel with an oxygen enrichment concentration (OEC) of 21%. The simulation results were compared to the turbine’s rated performance, focusing specifically on parameters such as net work output and thermal efficiency. The comparison demonstrated that the simulation results closely matched the actual rated performance of the gas turbine, thereby validating the accuracy of the model [
56].
The oxygen levels were selected based on [
47], and
increases at concentrations above 40 vol.%
due to the generation of additional
radicals [
55].
2.3. Combustion Computation Method
For the calculation of the laminar burning velocity and the adiabatic flame temperature, the software tool of Chemkin was used. To achieve accurate computational predictions and comparisons, the well-validated mechanism of Shrestha et al [
59] was used. This was particularly effective in predicting
DME/
/
/
mixtures due to their adaptability for predicting premixed flame characteristics. The Shrestha mechanism includes 135 species and 1196 reactions, and this mechanism was updated recently and includes the
chemistry [
60].
For the adiabatic flame temperature, a zero-dimensional equilibrium calculation was adopted. Therefore, in the simulations, different volumetric percentages of hydrogen and ammonia were blended into as the fuel, using the selected reaction mechanism for the calculation of . The inputs included a range of mixture equivalence ratios ( = 0.33–1.0), and an initial temperature of 869 K, while all simulations were carried out at an initial pressure of 30 bar. These conditions are comparable to the conditions in a turbine combustion chamber.
The one-dimensional freely propagating flame PREMIX code, integrated with the CHEMKIN software, is employed to compute the laminar burning velocity under adiabatic conditions [
61]. The combustion domain was adaptively meshed and refined by gradually altering the gradients and curvatures of various output parameters, ensuring that the results are grid-independent.
Detailed reaction mechanisms, reaction kinetics, thermodynamic properties, and transport databases were referenced from various sources. These datasets were interpreted in the solver using thermodynamic and transport data codes [
62]. In the simulations, the appropriate reaction mechanism was selected, with different volumetric percentages of hydrogen (0–100%) and ammonia (0–100%), each blended into
as a fuel, for the same mixture equivalence ratios (
= 0.33–1.0), mole fractions, and initial temperature conditions (869 K) as inputs.
All simulations were again conducted at an initial pressure of 30 bar. Mesh adaptation and refinement criteria, such as GRAD = 0.08 and CURV = 0.05, were applied to the solver. It was observed that the mesh refinement did not affect precision. Thermal diffusion (Soret effect) was included in the computations.
2.4. Combustion Process Modeling
ANSYS Chemkin-Pro 2024 R2 software was used to model the combustion of
/
and
/
fuels under gas turbine combustion conditions in an oxygen-enriched oxidizer. The modeling employed a Rich–Quench–Lean combustion chamber [
4,
63] with staged combustion at different equivalence ratios. The combustion system is represented using a chemical reactor network (CRN), consisting of perfectly stirred reactors (PSRs), a plug flow reactor (PFR), and partially stirred reactors (PaSRs), as schematically shown in
Figure 5.
The mixing zone and the internal exhaust gas recirculation zone were modeled using (PSR), with parameters adopted from [
64]. The mass of recirculating flue gas, equal to 30% wt. (based on Valera-Medina [
65]), was divided into two parts: 70% of the mass of flue gases was delivered to the flame zone, and the remaining portion was directed to the mixing zone.
Reactants from the flame zone fed a flow reactor (PFR) to simulate the reaction in the post-flame zone. The quench/mixing zone was modeled using (PaSR), and the lean combustion zone was modeled with another PFR reactor. The GRI-Mech 3.0 mechanism for
/
(53 species and 325 reactions) [
66] and the San Diego mechanism for
/
fuel with 57 species and 268 reactions [
67] were used to model the combustion process and predict the formation of toxic compounds, particularly
.
Tests were conducted for three levels of oxygen in the oxidant: 0.21, 0.3, and 0.4 percent by volume. The remainder of the oxidant was nitrogen. The total amount of oxidant for the tested fuels was varied and adjusted to ensure that the temperature of the flue gas leaving the reactor network was within the range of 1720–1730 K, corresponding to the turbine inlet temperature for the LM6000 turbine.
The air distribution in the RQL sections of the combustion chamber for
/
fuel was chosen based on the literature [
68], with
= 1.7 (rich zone, R) and
= 0.5 (lean zone, L). For
/
fuels, simulations were carried out with varying shares of oxidant supplied to the rich and lean combustion zones, as per [
69]: R/L = 10/90, 20/80, and 30/70% of the oxidizer mass. Other parameters for the calculations, obtained from simulations in Aspen HYSYS software, were as follows: input thermal power
= 102 MW, oxidizer temperature (primary and secondary)
= 823 K, and combustion chamber pressure
= 3 MPa.
While the San Diego mechanism was used for / CRN modeling due to its prior use in the literature, we acknowledge its limitations in capturing – interactions under high-pressure conditions. Future work will consider more advanced mechanisms validated for gas turbine applications.
3. Results
This section presents the findings on the impact of blending and with on the gas turbine’s performance and emissions at different levels of oxygen.
3.1. Global Combustion Properties
Figure 6 shows a comparison of the development of adiabatic flame temperature as a function of equivalence ratio with the addition of hydrogen and the addition of ammonia. Additionally, the dependency on three different oxidizer compositions is investigated.
For hydrogen, it can be clearly seen that with an increasing oxygen content, as expected, the temperature rises. It is evident that regardless of the oxygen content, the temperature significantly increases with a higher hydrogen content, displaying a nonlinear trend that shows a marked increase from 60% hydrogen in methane.
For ammonia, it can be demonstrated that temperatures decrease with higher ammonia content. This also occurs nonlinearly but is significantly less pronounced than with hydrogen. Additionally, the temperatures in the ammonia mixtures also rise with an increasing oxygen content in the oxidizer but always remain below those of the hydrogen–methane mixtures.
It is observed that ammonia has no significant impact on temperature with pure air, but as the oxygen content increases, a notable decrease in temperature is evident compared to the natural gas/methane case at the same oxygen content. Considering hydrogen in the discussion, higher hydrogen contents result in increasing temperatures. At 30% oxygen and 100% hydrogen, the temperatures overlap with the case of 40% oxygen and 100% ammonia, with a much higher reduction but needing a higher amount of separation units; these cases have to be evaluated on the financial side.
In all cases, a nonlinear trend with higher enrichments can be observed, while changes up to 50% fuel switching remain within a range of less than of 50K for all tested oxygen contents.
In
Figure 7, six graphs are presented, displaying laminar burning velocities for hydrogen–methane (left) and methane–ammonia (right) mixtures rather than for temperature, as shown in
Figure 6. In the left column, the LBVs of hydrogen–methane mixtures are shown as a function of the equivalence ratio on the x-axis. Additionally, from top to bottom, the graphs represent 21%, 30%, and 40% oxygen in the oxidizer, with the remainder being nitrogen.
The initial temperature was 869 K, and the initial pressure was 30 bar. The results indicate that the LBV significantly increases at higher equivalence ratios near stoichiometry. Moreover, a higher hydrogen content leads to a marked increase in LBV, as corroborated by numerous experiments [
70].
In the three graphs, two reference lines are drawn: one at 37 cm/s (the maximum LBV for methane at 1 bar and 298 K) and the other at 270 cm/s (the maximum LBV for hydrogen–air at 1 bar and 298 K). These lines serve as a reference for the shift between different oxygen levels. If the curves are closely examined, it becomes evident that the addition of hydrogen and ammonia has the opposite effect on the combustion speed.
It is also noteworthy that even with 40% oxygen in the oxidizer, combustion with ammonia only reaches 270 cm/s, which is within the stoichiometric range. As illustrated in
Figure 7, the reduction in the presence of ammonia is nearly linear for an equivalence ratio of 0.4 at 30 bar and 869 K.
For 21% and 30%, there is minimal impact compared to the case with 40%, where the reaction rate decreases by approximately 35%. Examining the lower graph for hydrogen, significant changes are observable even at lower equivalence ratios.
The addition of hydrogen markedly increases the burning velocity, exhibiting a nonlinear trend. This trend is particularly pronounced at 30% and 40%, leading to a substantial increase starting at 70% hydrogen. In scenarios with 40% oxygen in the oxidizer, the burning velocity increases eight-fold.
3.2. Gas Turbine Operation Analysis
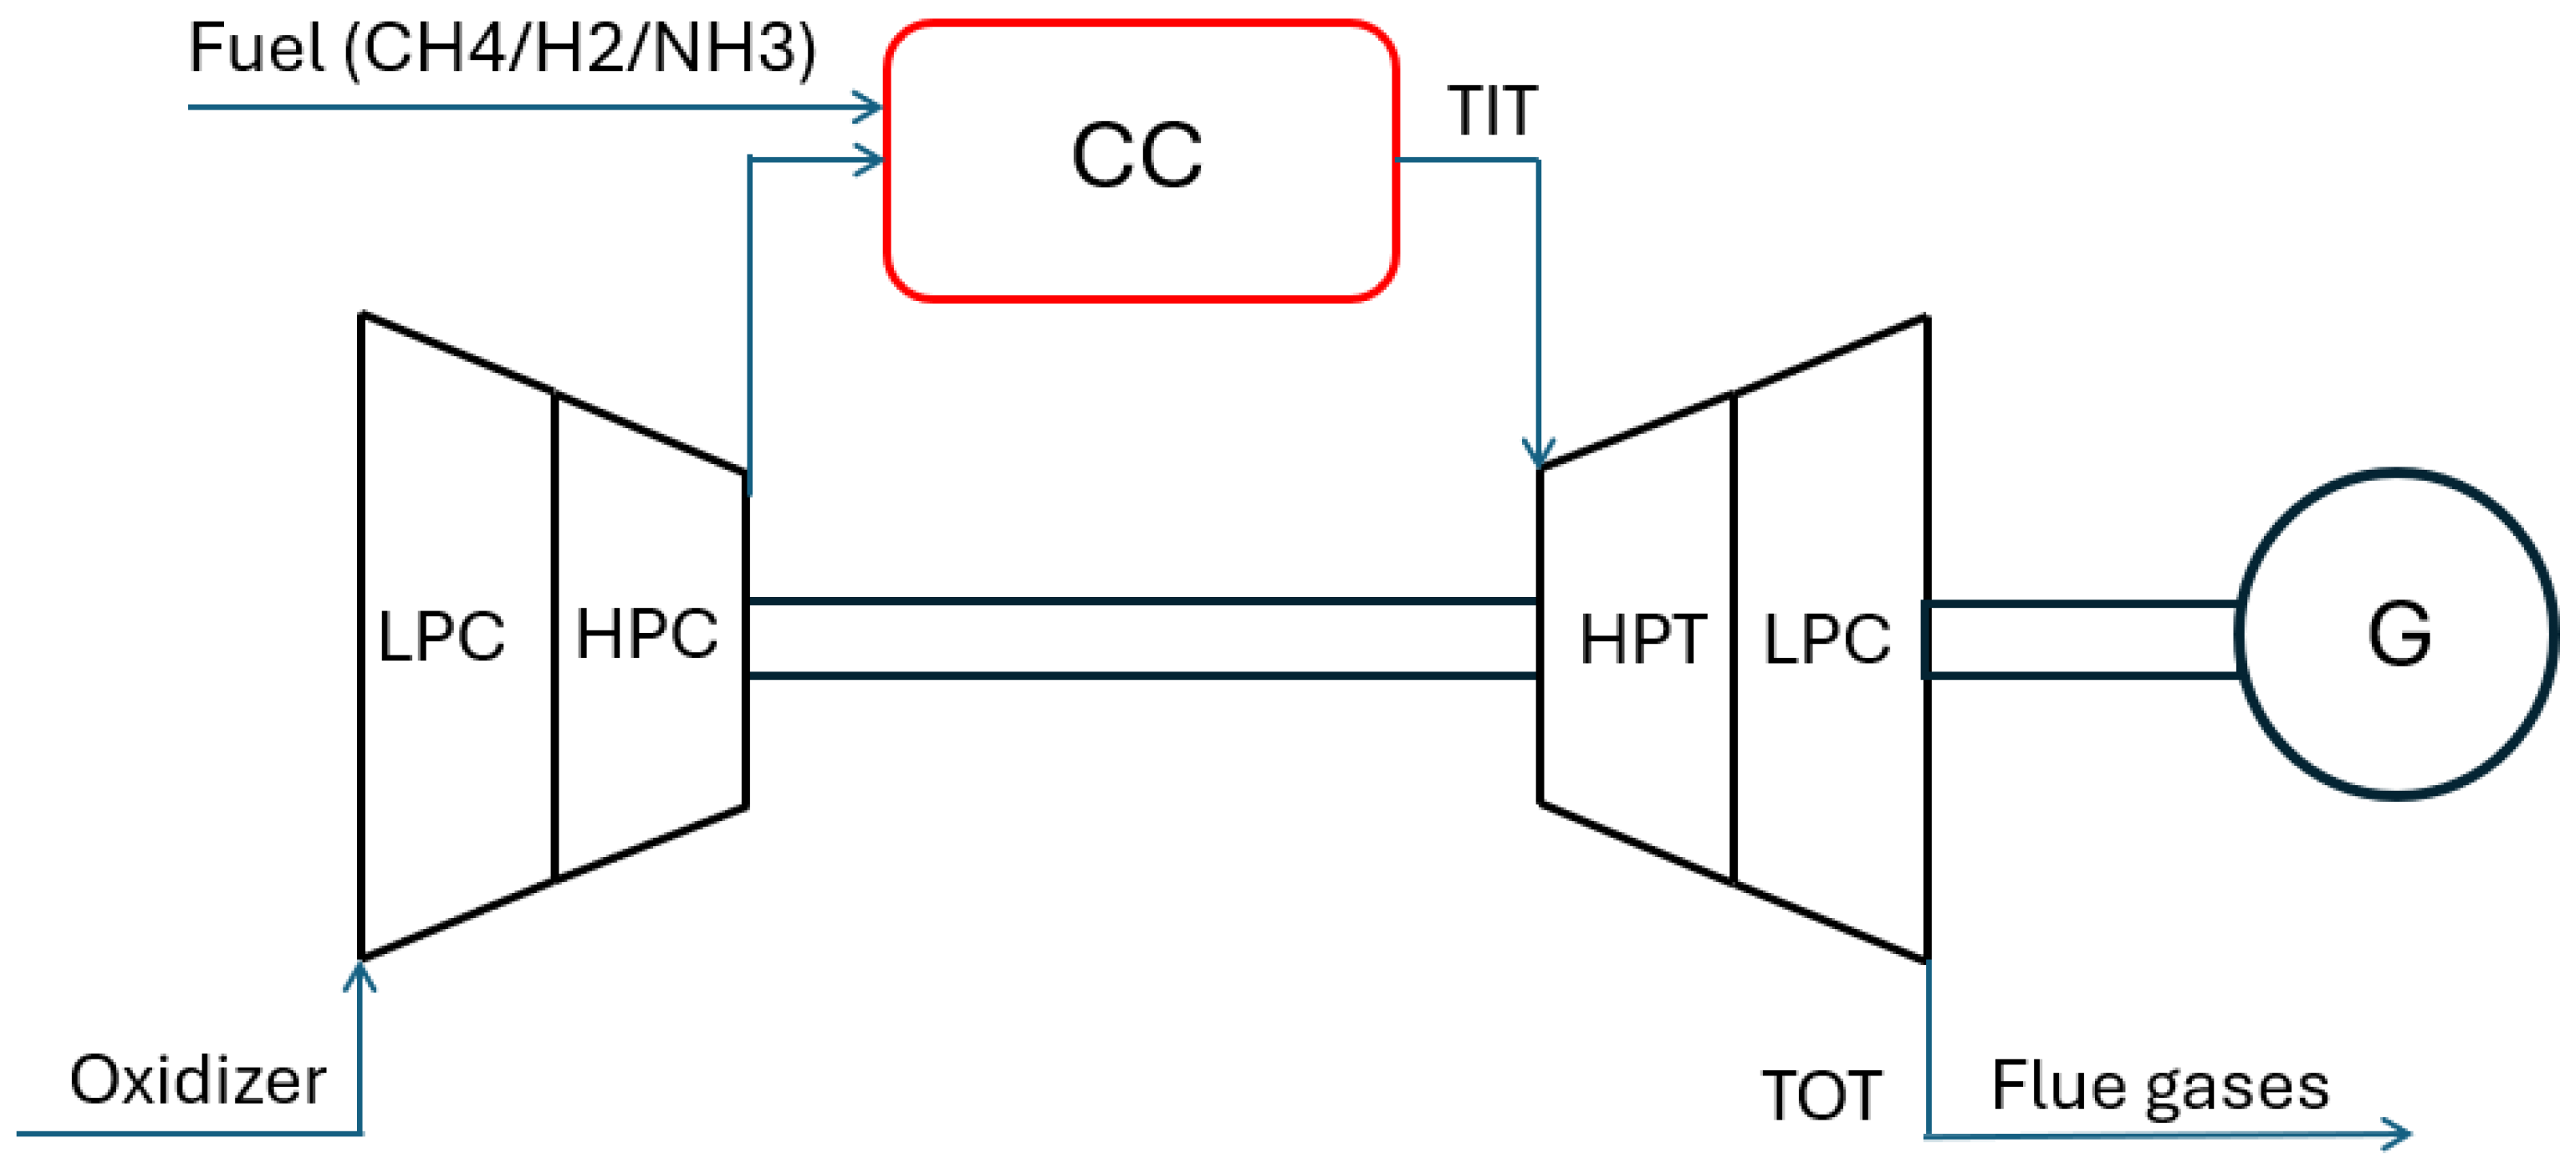
Figure 8 shows a simplified schematic of the modeled gas turbine cycle, with thermodynamic parameters from
Table 3. The system employs variable amounts of oxygen-enriched air that enter a compressor with a compression ratio of 33. The air is combusted with a fuel blend of either
/
or
/
before being delivered to the expander to generate energy for the turbine blades.
A thermodynamic study on a gas turbine powered by
/
and
/
mixtures using different oxygen concentrations (21%, 30%, and 40%
) highlights the necessity of keeping a constant turbine inlet temperature (TIT) of 1723K to prevent thermal stress that could shorten lifespan. This can be achieved by altering equivalence ratios, as seen in
Figure 6 and
Figure 9.
The / mix’s equivalence ratio declines with increasing hydrogen content. For instance, it begins at 0.4 for pure methane with 21% and falls to approximately 0.35 for pure hydrogen. To reach the necessary TIT, hydrogen requires more oxidizer due to its greater reactivity and LHV. The equivalence ratio decreases with increasing oxygen content, reaching 0.18 for pure hydrogen at 40% , needing more oxidizer for the same TIT.
As ammonia is added to the blend, the equivalence ratio rises due to its lessened reactivity and higher nitrogen concentration. The ratio for 100% ammonia at 21% is 0.45 (vs. 0.4 for methane). Ammonia produces richer mixtures with lower combustion temperatures. To keep the TIT at 1723 K, the equivalence ratio for pure ammonia at 40% decreases to 0.24 but stays greater than the / blend. Ammonia’s lower reactivity produces richer mixtures, while hydrogen’s higher reactivity produces leaner mixtures, which affects combustion stability.
Figure 10 shows how the compressor work (
) in a gas turbine system changes with the oxidizer’s oxygen level and fuel mixture. In the
/
mix, compressor work reduces as hydrogen content rises because hydrogen has a lower mass. For example, compressor work drops from 51.79 MW for pure methane with 21% oxygen to 50.33 MW for pure hydrogen. As the oxygen amount rises to 30–40%, compressor work decreases, reaching 49.82 MW for pure hydrogen at 30% oxygen and 49.4 MW at 40% oxygen. This indicates a lower oxidizer consumption required to maintain a steady TIT of 1723 K.
The / mix necessitates greater compressor work, especially as the ammonia level increases. For 100% ammonia, compressor work is 42.01 MW. Despite its low heating value, ammonia needs more oxidizer to combust. Compressor work steadily reduces as the oxygen content increases, reaching 41.76 MW at 30% oxygen and 41.31 MW at 40% oxygen for pure ammonia. Oxygen enrichment minimizes compressor effort, but not as much as the / blend.
Figure 11 presents turbine work trends for
/
mixes, which are stable but decrease slightly as the amount of hydrogen grows. Hydrogen’s increased energy per mass boosts combustion efficiency but also results in lower exhaust temperatures, limiting work extraction. Raising oxygen to 30–40% cuts turbine work a bit, as oxygen improves combustion while decreasing exhaust temperatures and expansion energy.
Turbine work falls dramatically in / blends with high ammonia levels. Ammonia’s lower calorific value means less power for the turbine, and higher oxygen levels decrease work even more, as ammonia takes more air for burning, lowering exhaust energy and turbine work.
Figure 12 shows how different levels of hydrogen (
) and ammonia (
) affect the net work (
). The
values for the
/
blend increase as the hydrogen proportion rises, as confirmed by several studies [
4,
71,
72].
Performance decreases when the air’s oxygen content increases because the turbine inlet temperature (TIT) remains constant at 1723 K, which requires reducing the equivalence ratio. The values increase slightly from 39.82 MW at 0% to 40.98 MW at 100% at 21% , and 40.84 MW at 100% at 40% . This behavior is due to the higher calorific value and flame temperature caused by the added hydrogen, which improves combustion and increases energy extraction from the fuel, raising .
The
/
blend shows higher
values with more ammonia. The increase is more significant than with the
/
blend, as shown by multiple experiments [
31], especially at lower
levels (21%). For the 100%
NH3 blend,
reaches 43.46 MW at 21%
. However, as
increases to 30% and 40%, the rise in
slows down because more oxidizer is needed to maintain the TIT at 1723 K.
Figure 13 shows the thermal efficiency performance of a gas turbine fueled by several fuel mixtures, studied at various hydrogen and ammonia ratios with oxygen-enriched air at 21%, 30%, and 40%. Increasing the hydrogen component in the
/
mix enhances thermal efficiency due to its larger energy content and better combustion properties. Hydrogen improves combustion by raising both the reaction rate and the flame temperature. Furthermore, lowering the oxygen concentration improves thermal efficiency, with the best efficiency of 40.01% achieved with 21% oxygen-enriched air. This is due to the higher flow rate into the combustion chamber needed to maintain a constant TIT, which improves combustion efficiency and recovery.
Increasing the ammonia level in the / mixture improves thermal efficiency. The 100% ammonia mixture combined with 21% oxygen-enriched air achieves the best thermal efficiency of 42.7%. Despite its low heating value, ammonia’s steady interaction with oxygen results in a more uniform flame structure, which improves the heating system within the turbine.
Adding
or
to
reduces flue gas temperature, allowing the turbine to capture additional power from the fuels.
Figure 14 demonstrates that increasing the oxygen content in the air greatly increases flue gas temperature, which is supported by [
45]. This behavior is crucial for gas turbine operation because flue gas temperature affects thermal load on downstream components, total cycle efficiency, and emission control. The performance metrics for different oxygen levels and fuel blends are shown in
Table 4.
3.3. Impact of Fuel and Oxidizer Concentrations on Emissions
3.3.1. Impact of and Oxidizer Concentration on Emissions
Figure 15 shows how nitrogen concentration in the oxidizer and hydrogen content in the fuel affect (
) emissions. When it comes to a fuel combination consisting of
/
, the thermal process is the main cause of
generation, and temperature is a major factor in determining emission levels.
For all examined oxygen levels, increasing the amount of in the fuel while keeping the equivalence ratio constant in the rich combustion zone raises the combustion temperature by about 300 K for vol. emissions for = 21% vol. due to this temperature increase multiple-fold, from 65 ppm at vol. to 951 ppm at vol. However, = 40% vol. and pure hydrogen were found to have the greatest emissions, coming in at 19,705 ppm. The combustion temperature of this fuel mixture is more than 600 K higher than that of oxidized in = 21% vol.
The increase in combustion temperature with higher
results from the reduced mass flow of combustion products due to a lower nitrogen content in the oxidizer. The rise in
emissions is further amplified by the increased concentration of oxygen radicals (
) in the flame, which promotes the reaction. The relation between
emissions and the equivalence ratio is shown in
Table 5.
3.3.2. Impact of and Oxidizer Concentration on Emissions
The RQL2 combustion chamber model was used to numerically simulate the combustion process for / mixtures in oxidizers with 21%, 30%, and 40% oxygen. The rich combustion zone (R) and the lean combustion zone (L) are the two separate zones that make up this sort of chamber.
The exhaust gas temperature was kept between 1720 and 1730 K by adjusting the total amount of air delivered to the chamber. Three distinct oxidizer mass fractions (
R = 10 wt.%, 20 wt.%, and 30 wt.%) were given to the rich zone in the simulations, while the remaining air was routed to the lean zone.
Figure 16,
Figure 17 and
Figure 18 show the outcomes of various simulations.
Two main mechanisms contribute to the generation of (
) during the combustion of
/
mixes: the fuel-bound mechanism, which is driven by ammonia oxidation based on the reaction Formula (
7) , and the thermal mechanism, which is dominant for mixtures with low ammonia concentrations.
One essential element that makes this pathway possible is the presence of oxygen in the reaction zone. An examination of the simulation findings under = 21% vol. and = 30% vol. conditions showed that when the fuel’s concentration increases, emissions first rise before starting to fall.
The emission curve’s inflection point was determined to be influenced by the oxidizer’s composition as well as the oxidizer mass fraction (R) added to the rich combustion zone. The maximum combustion temperatures for oxidizers with = 21% and = 30% are limited to 1600 K and 2200 K, respectively, when only 10 weight percent of the oxidizer is supplied to the R zone. In these circumstances, the rich zone’s restricted oxygen availability prevents the creation of fuel-bound and thermal . The subsequent oxidizer delivery to the lean zone (L) causes production in the quenching (PaSR reactor) and lean burn zones. At higher oxidizer mass fractions (R = 20 wt.% and 30 wt.%) and levels of 21% and 30%, generation occurs in the post-flame zone, driven by the thermal process, with simultaneous reduction via reactions involving NHi and OH radicals. Similar behavior is found for = 21% and R = 30 wt.%. Injecting oxidizer into the quenching and lean burn zones, represented by the PASR and PSR reactors, leads to the rapid oxidation of to . In fuel mixtures containing 80–100% vol. , this oxidation pathway occurs concurrently with partial reduction through radical species created by ammonia breakdown.
The distribution of the oxidizer has a major effect on the trend in emissions, with = 40% vol. Rising emissions are caused by raising the / ratio at low oxygen availability in the reaction zone (R = 10 wt.%). In contrast, the reverse trend is seen for R = 20 wt.% and 30 wt.%, when emissions fall as the ammonia content rises.
In situations when = 40% and R values are 10, 20, and 30 wt.%, as well as when = 30% and R = 30 wt.%, the oxygen supply in the rich zone is sufficient to ensure that the fuel is completely oxidized. This causes combustion temperatures to rise over 2300 K and possibly as high as 2900 K (for = 40% and R = 30 wt.%). Significant generation is facilitated by these high temperatures by both fuel-bound and thermal processes, and concentrations at the R zone exit surpass several thousand ppmv. Reactive radicals (O, H, OH, and ) are also found in considerable amounts at the R zone outlet.
When the flue gas is diluted with an oxidizer, the temperature drops, which promotes the reduction of
through reactions involving
radicals, such as:
The combustion analyses of
/
blends in RQL and RQL2 chambers designed for low-calorific fuels, using CRN models, indicate that modifications to current combustion systems are necessary for the practical implementation of ammonia as a fuel. One approach explored in the literature [
73] involves the preliminary thermal or catalytic cracking of
into
and
, followed by the oxidation of the resulting
/
/
mixture.
Table 6 shows
emissions at various
concentrations, oxidizer levels, and rich zone mass fractions.
The production of intermediate radicals like
and
becomes important at high
concentrations, especially in fuel-rich or staged combustion settings. These radicals take part in processes that reduce
, particularly by competing with thermal
generation. This chemical pathway lowers
emissions overall. This change in the major response pathways is reflected in the inflection behavior shown in the simulated findings. These results align with earlier kinetic and experimental investigations of ammonia combustion [
73].
5. Conclusions
This research assessed the performance of a GE LM6000 gas turbine using two fuel blends of methane/hydrogen and methane/ammonia at varying oxygen levels (21%, 30%, and 40% ).
The turbine ran at a constant temperature of 1723 K (TIT) with a heat input of 102 MW. Increasing hydrogen content, especially above 60%, leads to a nonlinear rise in adiabatic flame temperature, a trend further amplified by oxygen enrichment. In contrast, adding ammonia decreases flame temperature despite the elevated oxygen levels. Laminar burning velocity (LBV) increased significantly with higher hydrogen fractions (up to eight-fold at 100% and 40% ), whereas ammonia addition reduced LBV, particularly under oxygen-rich conditions.
To maintain constant turbine temperature, the equivalence ratio reduced as hydrogen concentration increased, especially at 40% . Hydrogen-rich blends required leaner mixtures ( at 100% , 40% ), while ammonia-rich blends required richer mixtures ( at 100% , 21% ).
There was an increase in power output from 39.82 MW to 40.98 MW, with a maximum efficiency of 40.01% at 100% hydrogen and 21% oxygen. Pure ammonia had the highest power production (43.46 MW) and efficiency (42.7%) at 21% . However, performance increases dropped with increased oxygen levels.
blends had increased emissions, particularly at higher hydrogen and oxygen levels. The maximum emissions occurred at 40% and 100% hydrogen, reaching 19,705 ppm. In contrast, blends yielded lower emissions, and increased ammonia concentration further reduced them. Proper oxidizer control also contributed to reduced emissions.
While this study provides useful information, it has limitations, including the lack of experimental validation and detailed CFD simulations. As gas turbine testing requires substantial funding and industrial collaboration, such validation is beyond the current scope. Future research should therefore focus on securing collaborative funding to enable experimental testing and high-fidelity simulations (e.g., GT-Suite, GasTurb), alongside developing effective reduction strategies such as advanced combustion techniques and SCR technologies.


 ,
, 


