
Moderate-Temperature Pyrolysis Characteristics of Lump Coal Under Varying Coal Particle Sizes

Abstract
1. Introduction
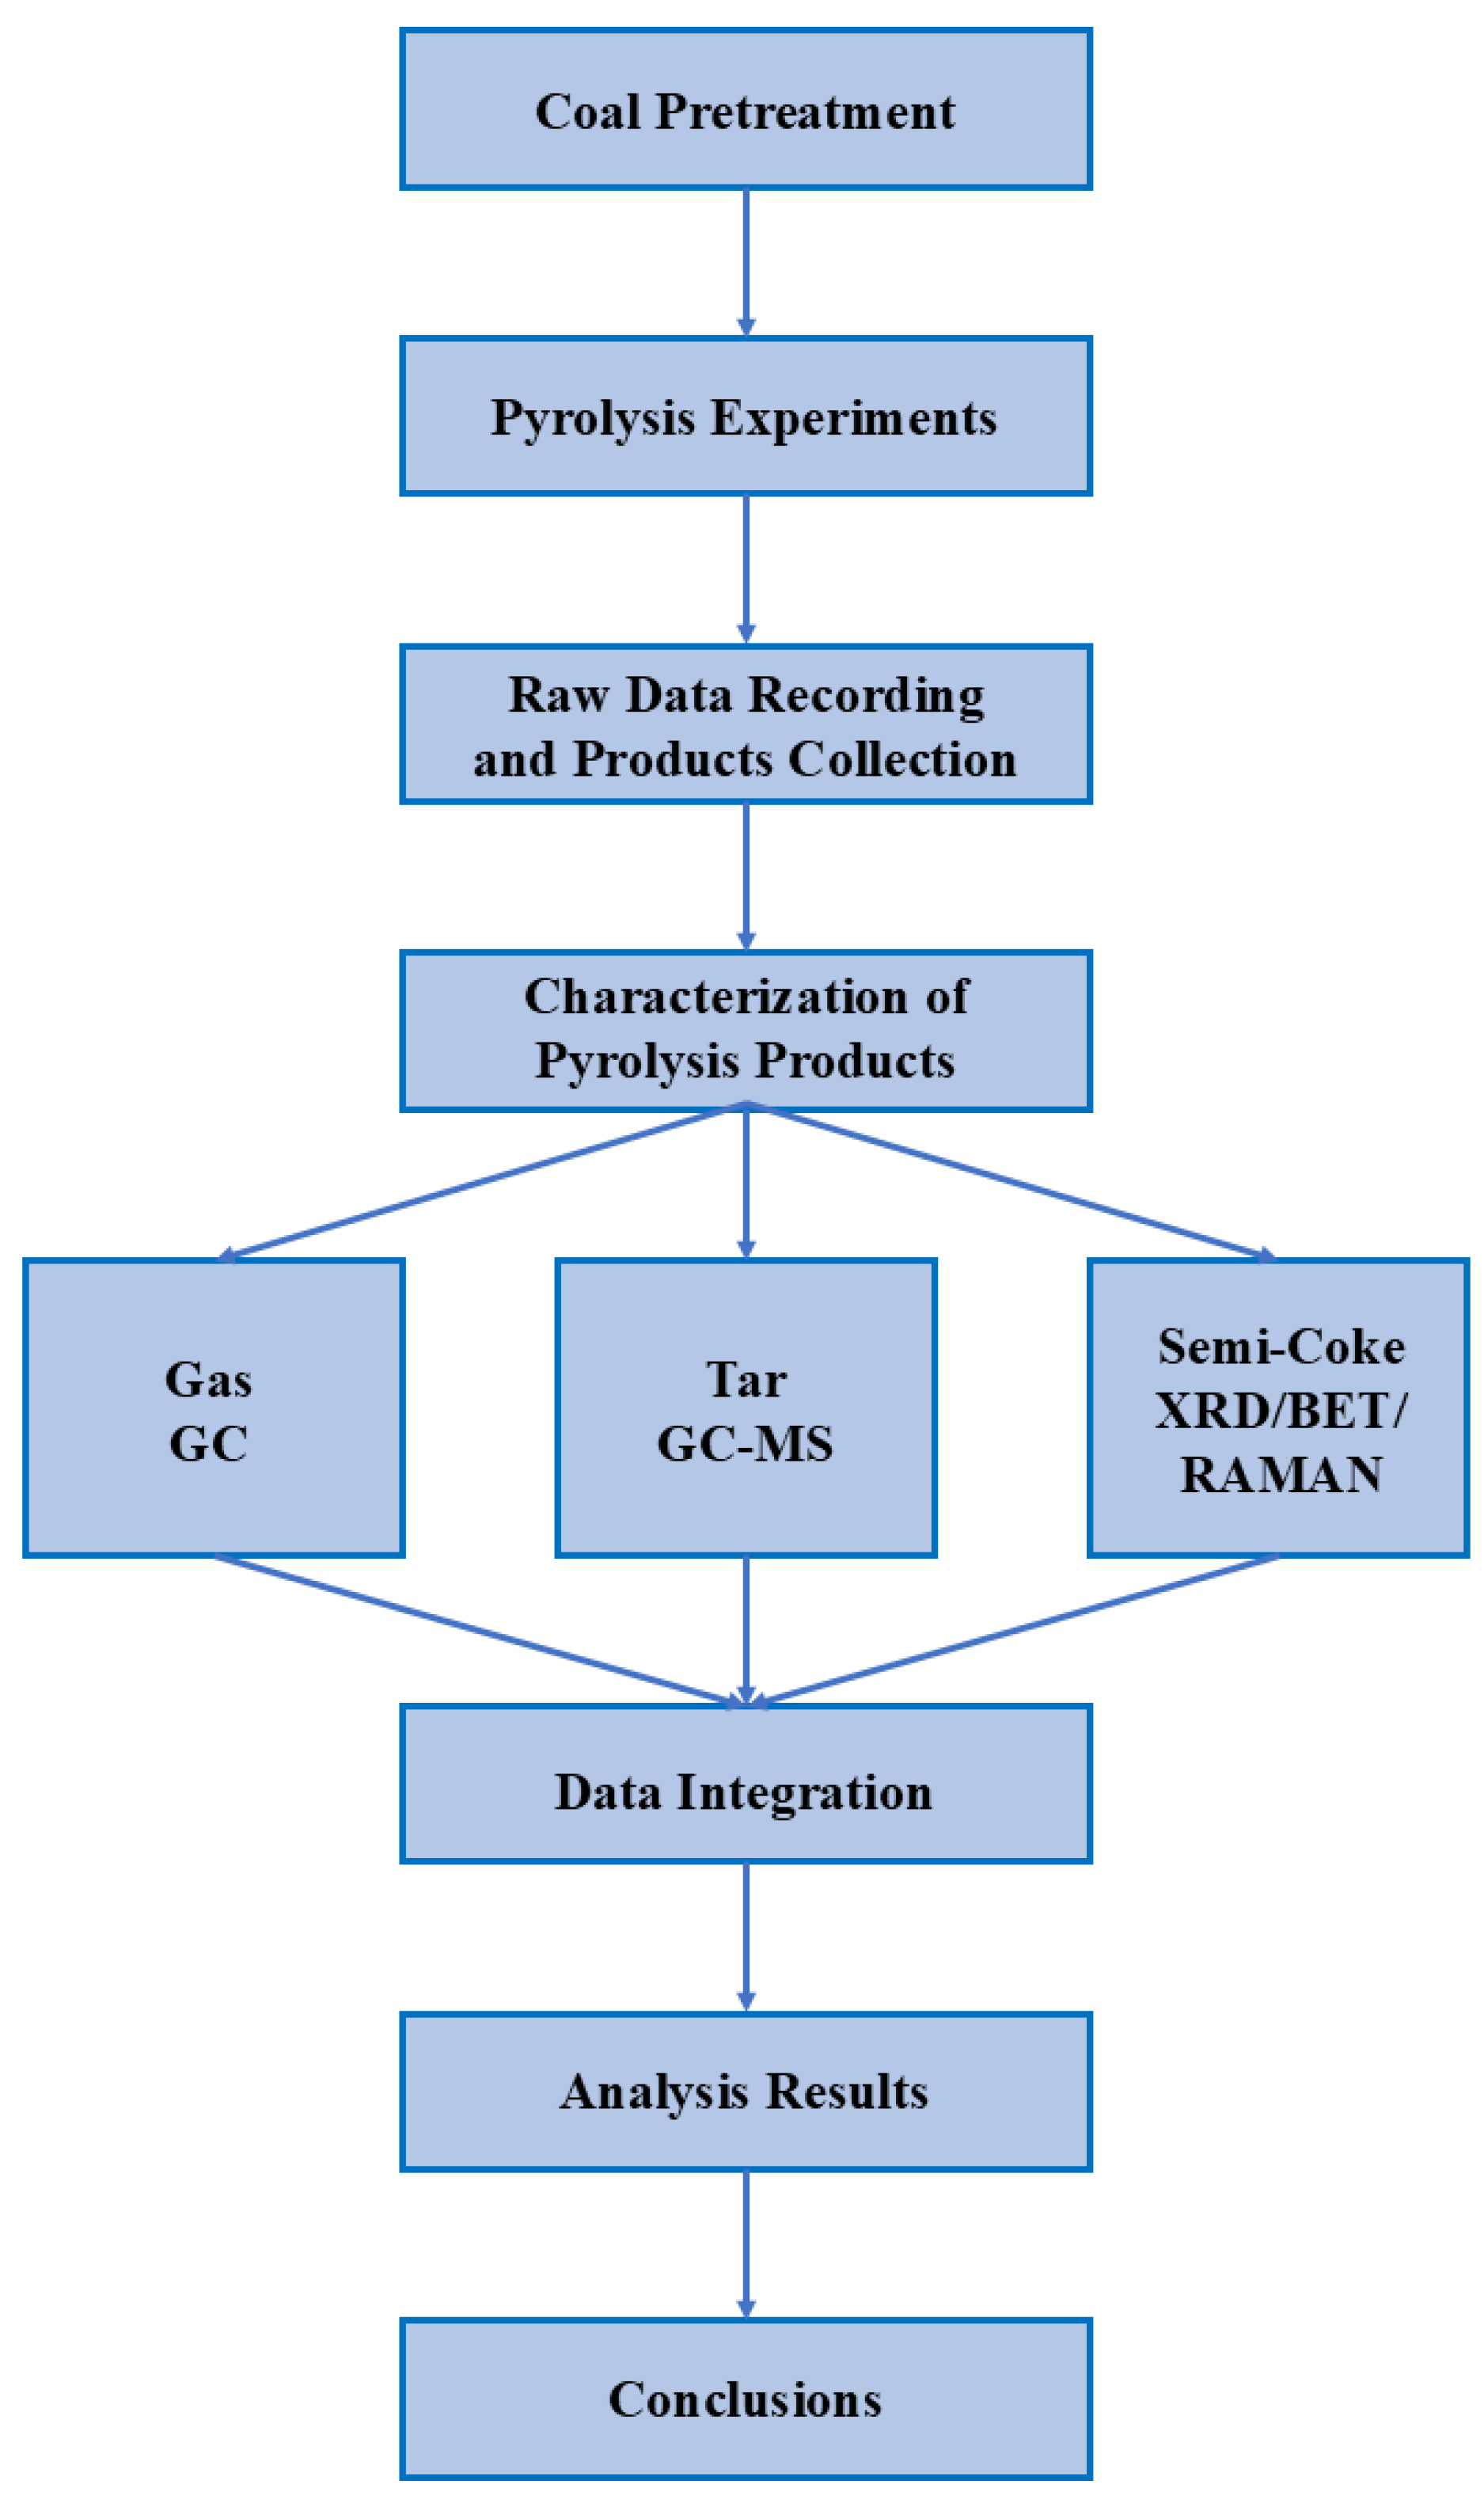
2. Experiment
2.1. Coal Samples Preparation
2.2. Pyrolysis Experiment
2.3. Calculations of the Pyrolysis Product Yield
2.4. Pyrolysis Gas Analysis
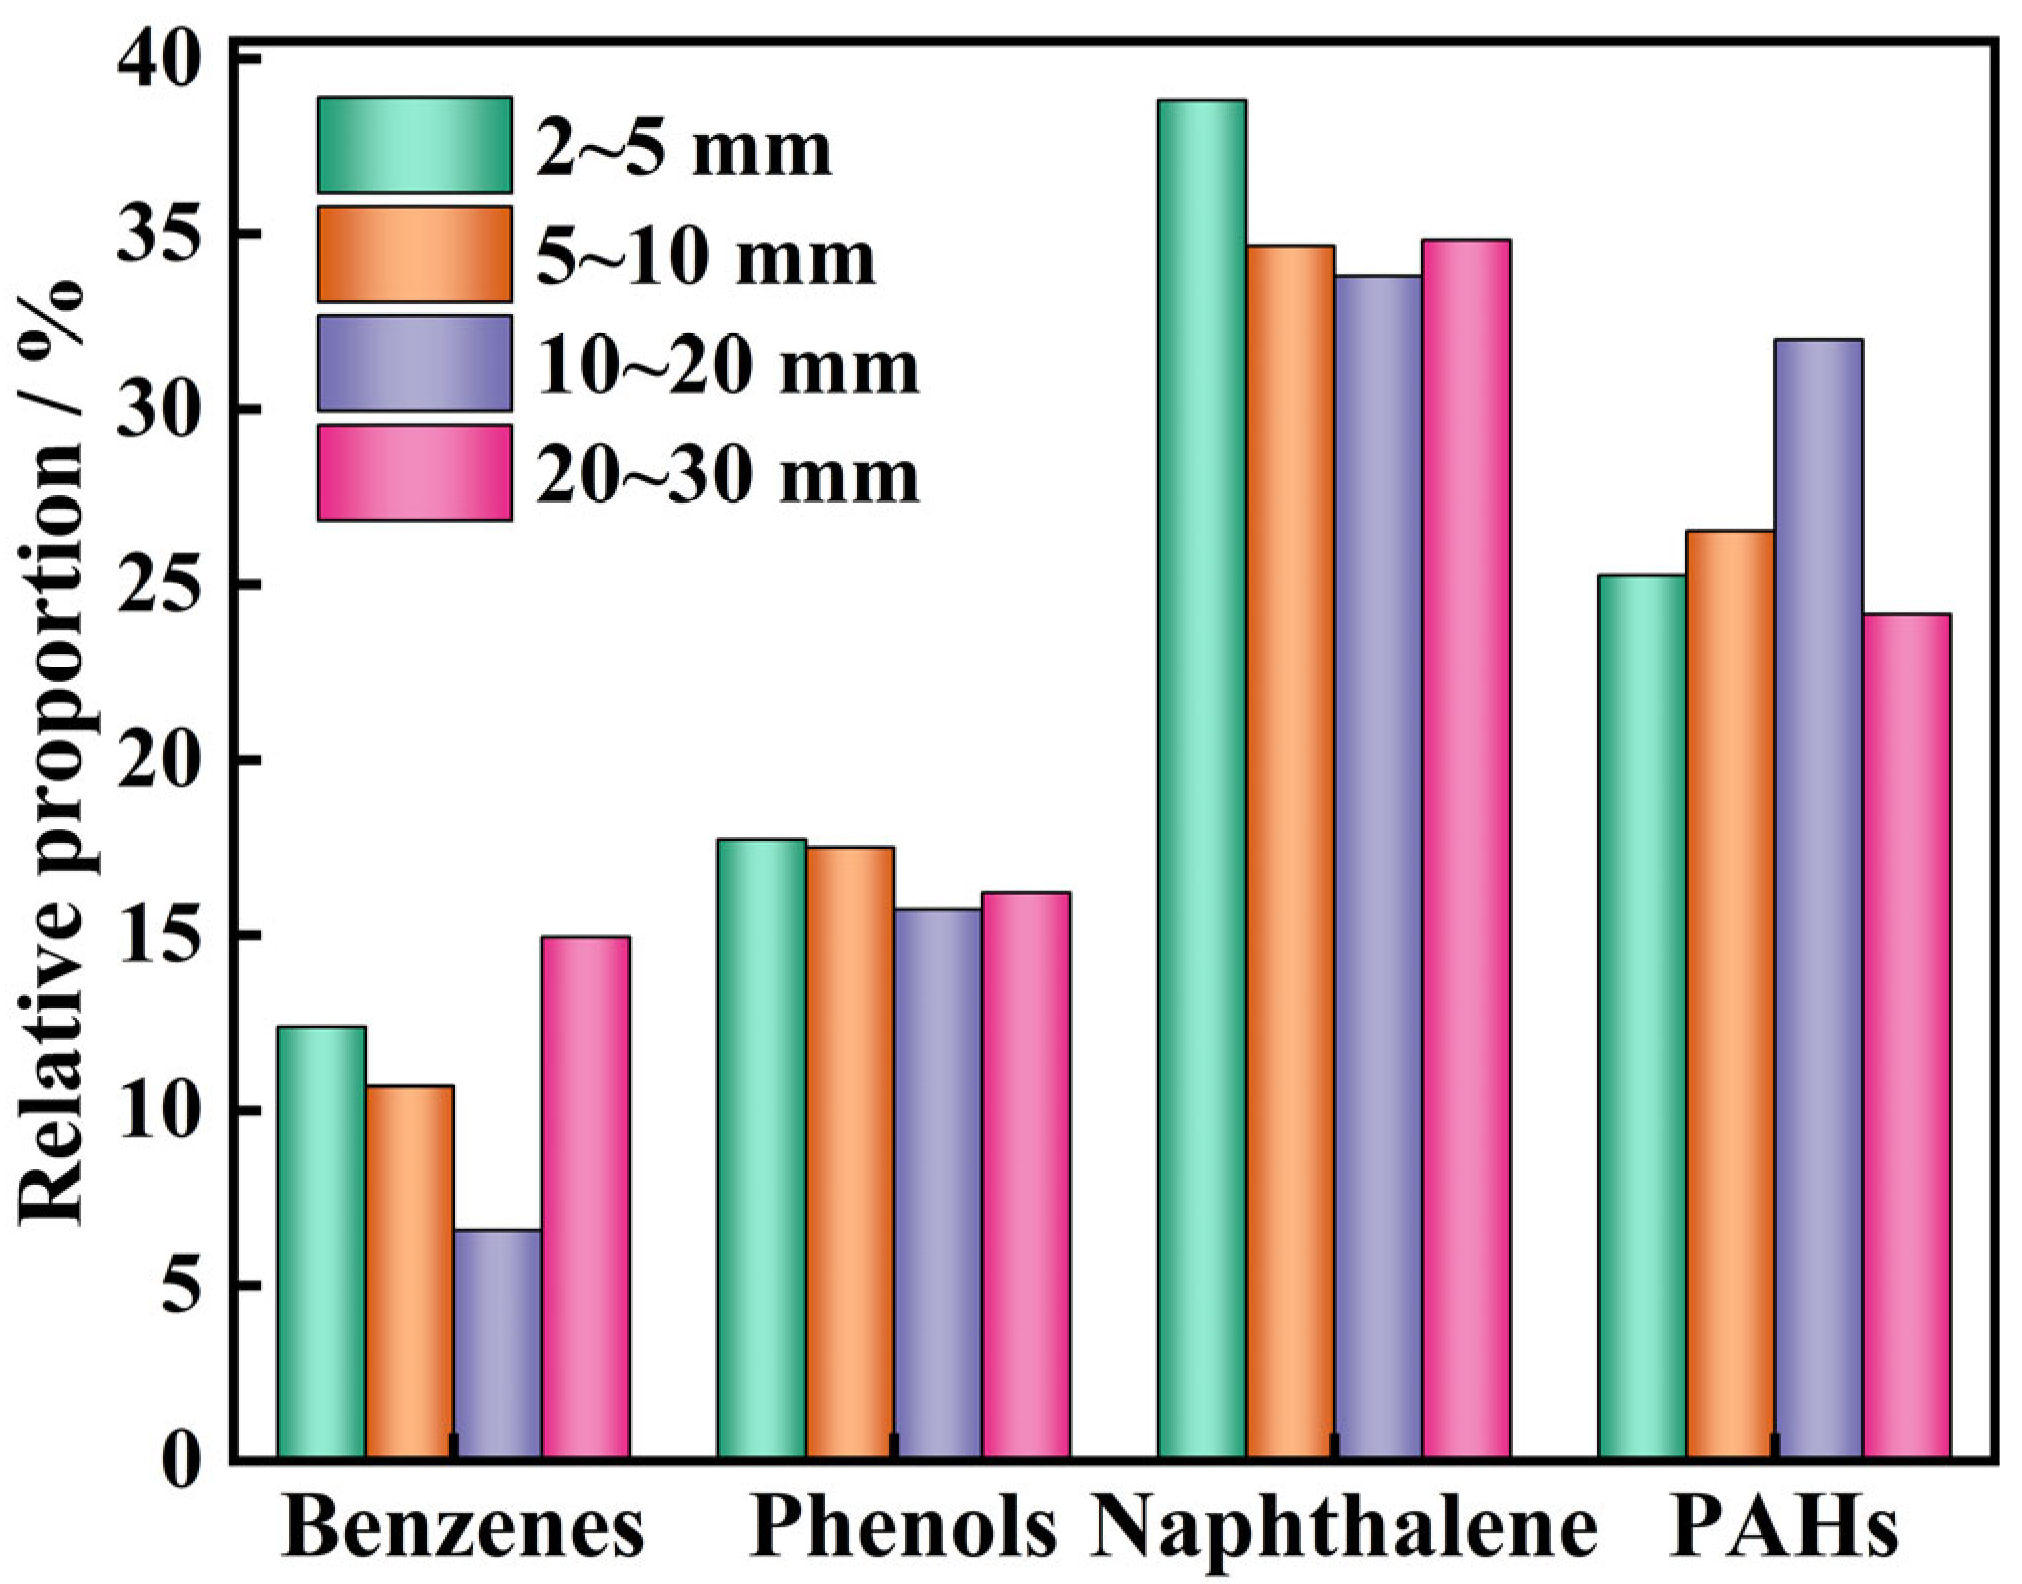
2.5. Tar Analysis
2.6. Char Analysis
3. Results and Discussion
3.1. Heat Transfer Performance of Coal Bed
3.2. Distribution of Pyrolysis Products
3.3. Properties of Pyrolysis Char
4. Conclusions
Author Contributions
Funding
Data Availability Statement
Conflicts of Interest
References
- Energy Institute. 2024 Statistical Review of World Energy; Energy Institute: London, UK, 2024; Available online: https://www.energyinst.org/statistical-review (accessed on 12 January 2025).
- Sun, L.; Li, X.; Su, C.; Wang, X.; Yuan, X. Analysis of dynamic strategies for decision-making on retrofitting carbon capture, utilization, and storage technology in coal-fired power plants. Appl. Therm. Eng. 2025, 264, 125371. [Google Scholar] [CrossRef]
- Yousuf, M.U.; Siddiqui, M.A.; Kumar, M.; Umair, M. Life cycle assessment of lignite-fueled ultra-supercritical coal-fired power plant with evaluation of solar energy integration. Fuel 2025, 385, 134079. [Google Scholar] [CrossRef]
- Zhuang, K.; Zhang, Y.; Wu, T.; Yang, L.; Sheng, Z. Study on the characteristics of sulfate ion in condensable particulate matter from sewage sludge co-combustion in coal-fired power plants. Atmos. Pollut. Res. 2025, 16, 102414. [Google Scholar] [CrossRef]
- Ju, Y.; Zhu, Y.; Zhang, Y.; Iglauer, S.; Pan, B.; Wang, K. Microwave-aided pyrolysis and fragmentation of tar-rich coal and rocks for in situ coal conversion and clean utilization. Int. J. Rock Mech. Min. Sci. 2023, 167, 105391. [Google Scholar] [CrossRef]
- Bai, E.; Guo, W.; Tan, Y.; Wu, D.; Zhang, Y.; Wen, P.; Ma, Z. Green coal mining and water clean utilization under Neogene aquifer in Zhaojiazhai coalmine of central China. J. Clean. Prod. 2022, 368, 133134. [Google Scholar] [CrossRef]
- Chen, Z.; Zhang, H.; Ma, W.; Wu, J. High efficient and clean utilization of coal for the carbothermic reduction of silica. Sustain. Energy Technol. Assess. 2022, 53, 102602. [Google Scholar] [CrossRef]
- Guo, H.; Zhao, S.; Dong, Z.; Wang, Q.; Xia, D.; Jia, J.; Yin, X.; Yu, H. Clean and efficient utilization of coal combined with corn straw by synergistic biodegradation. Renew. Energy 2020, 161, 701–711. [Google Scholar] [CrossRef]
- Zhang, L.; Wang, G.; Xue, Q.; Zuo, H.; She, X.; Wang, J. Effect of preheating on coking coal and metallurgical coke properties: A review. Fuel Process. Technol. 2021, 221, 106942. [Google Scholar] [CrossRef]
- Liu, Z.; Mu, L.; Feng, C.; Li, X.; Liu, T.; Jiang, X.; Bai, H.; Liu, X. Generation and emission mechanism of polycyclic aromatic hydrocarbon (PAHs) during the coking process in Shanxi, China. Sci. Total Environ. 2024, 948, 174619. [Google Scholar] [CrossRef]
- Chen, J.; Wang, Q.; Xu, Z.; E, J.; Leng, E.; Zhang, F.; Liao, G. Process in supercritical water gasification of coal: A review of fundamentals, mechanisms, catalysts and element transformation. Energy Convers. Manag. 2021, 237, 114122. [Google Scholar] [CrossRef]
- Li, Z.; Tian, S.; Zhang, D.; Chang, C.; Zhang, Q.; Zhang, P. Optimization study on improving energy efficiency of power cycle system of staged coal gasification coupled with supercritical carbon dioxide. Energy 2022, 239, 122168. [Google Scholar] [CrossRef]
- Shi, Q.; Zhao, X.; Wang, S.; Zhao, H.; Ji, R.; Li, C.; Kou, B.; Zhao, J. Differences in pyrolysis behavior and volatiles of tar-rich coal with various origins. Fuel Process. Technol. 2025, 268, 108181. [Google Scholar] [CrossRef]
- Cai, J.; Zhang, B.; Dang, J.; Zhao, Y.; Liang, D.; Xie, Q.; Liu, J. Migration, transformation, and enrichment of strategic metal elements including Li, Ga, Ge, In, and Re during the coal pyrolysis process. J. Anal. Appl. Pyrolysis 2025, 186, 106953. [Google Scholar] [CrossRef]
- Zhou, L.; Xiong, K.; Zheng, H.; Zhao, Y.; Li, J.; Zhai, M.; Feng, Z. Research on the occurrence modes and pyrolysis release characteristics of arsenic and lead in low rank coal. J. Energy Inst. 2025, 120, 101989. [Google Scholar] [CrossRef]
- Zhang, T.; Zhang, C.; Ren, H.; Huang, Z.; Feng, J.; Liu, N.; Li, R.; Wu, Y. Co-pyrolysis of coal-derived sludge and low-rank coal: Thermal behaviour and char yield prediction. Fuel Process. Technol. 2025, 267, 108165. [Google Scholar] [CrossRef]
- Sun, Z.; Li, K.; Bu, Y.; Liang, Z.; Jiang, C.; Zhang, J. Molecular insights into bituminous coals pyrolysis: A combined study using spectroscopic techniques, thermogravimetric-mass spectrometry and ReaxFF molecular dynamics simulations. Energy 2025, 315, 134442. [Google Scholar] [CrossRef]
- Qiao, Y.; Chen, Z.; Wu, X.; Li, Z. Investigation on co-combustion of semi-coke and bituminous coal in oxygen-enriched atmosphere: Combustion, thermal conversion, and kinetic analyses. Energy 2023, 269, 126816. [Google Scholar] [CrossRef]
- Li, Z.-y.; Niu, S.-l.; Han, K.-h.; Li, Y.-j.; Wang, Y.-z.; Lu, C.-m. Thermogravimetric analysis on the characteristics of oxy-fuel co-combustion of sub-bituminous coal and semi-coke. J. Fuel Chem. Technol. 2022, 50, 937–951. [Google Scholar] [CrossRef]
- Cai, X.; Shan, S.; Jin, G.; Yu, J.; Zhou, Z. New weighted-sum-of-gray-gases radiation model for oxy-fuel combustion simulation of semi-coke from coal-based poly-generation. Therm. Sci. Eng. Prog. 2023, 46, 102233. [Google Scholar] [CrossRef]
- Zhang, H.; Shen, Z.; Zeng, R.; Liang, Q.; Liu, H. Insights into pyrolysis product characteristics and carbon structure evolution of bituminous coal under high-temperature thermal shock. Fuel 2024, 371, 132096. [Google Scholar] [CrossRef]
- Dou, G.; Zhang, L.; Wang, D.; Zhong, X.; Qin, B. In-situ study on CO/CO2/H2/CH4 emissions during high temperature oxidative pyrolysis of coal via tetrahydrofuran extraction. Thermochim. Acta 2024, 736, 179742. [Google Scholar] [CrossRef]
- Yang, H.; Yang, Y.; Pisupati, S.V.; Jin, L.; Li, Y.; Hu, H. Modeling char surface area evolution during coal pyrolysis: Evolving characteristics with coal rank. J. Anal. Appl. Pyrolysis 2021, 156, 105110. [Google Scholar] [CrossRef]
- Zhang, Y.; Jia, X.; Lai, D.; Han, Z.; Song, X.; Wang, C.; Xu, G. Impact of CO2 atmosphere on coal pyrolysis in indirectly heated fixed bed with internals. J. Anal. Appl. Pyrolysis 2023, 170, 105917. [Google Scholar] [CrossRef]
- Zhou, Q.; Zhang, X.; Wang, Y.; Qu, S.-J.; Zhang, Y.; Bai, X.-Y.; Pei, X.-F. Pyrolysis behavior of coal in a moving bed with baffled internals under different residence times. J. Fuel Chem. Technol. 2021, 49, 703–711. [Google Scholar] [CrossRef]
- Chen, X.; Zhao, Y.; Liu, L.; Zhang, L.; Zhang, Z.; Qiu, P. Evaluation of chemical structure, pyrolysis reactivity and gaseous products of Shenmu coal of different particle sizes. J. Anal. Appl. Pyrolysis 2018, 130, 294–304. [Google Scholar] [CrossRef]
- Zhu, Y.; Wen, W.; Li, Y.; Lu, L.; Yang, J.; Xu, M.; Pan, Y. Pyrolysis study of Huainan coal with different particle sizes using TG analysis and online Py-PI-TOF MS. J. Energy Inst. 2020, 93, 405–414. [Google Scholar] [CrossRef]
- Zhao, H.; Bai, Z.; Bai, J.; Guo, Z.; Kong, L.; Li, W. Effect of coal particle size on distribution and thermal behavior of pyrite during pyrolysis. Fuel 2015, 148, 145–151. [Google Scholar] [CrossRef]
- Tian, B.; Qiao, Y.y.; Tian, Y.y.; Liu, Q. Investigation on the effect of particle size and heating rate on pyrolysis characteristics of a bituminous coal by TG–FTIR. J. Anal. Appl. Pyrolysis 2016, 121, 376–386. [Google Scholar] [CrossRef]
- Wu, H.; Zou, C.; Zhen, X.; Ren, M.M. Effect of particle size on the pyrolysis process of low-rank coal: Assessment of structural evolution by N2 adsorption, Raman, X-ray diffraction, and Fourier transform infrared. Asia-Pac. J. Chem. Eng. 2022, 17, e2751. [Google Scholar] [CrossRef]
- Liu, J.; Jiang, X.; Shen, J.; Zhang, H. Influences of particle size, ultraviolet irradiation and pyrolysis temperature on stable free radicals in coal. Powder Technol. 2015, 272, 64–74. [Google Scholar] [CrossRef]
- Bolin, T.B. S-XANES analysis of thermal iron sulfide transformations in a suite of Argonne Premium Coals: A study of particle size effects during pyrolysis. Int. J. Coal Geol. 2014, 131, 200–213. [Google Scholar] [CrossRef]
- Jayaraman, K.; Kok, M.V.; Gokalp, I. Pyrolysis, combustion and gasification studies of different sized coal particles using TGA-MS. Appl. Therm. Eng. 2017, 125, 1446–1455. [Google Scholar] [CrossRef]
- NIST2008; NIST/EPA/NIH Mass Spectral Library 2008. National Institute of Standards and Technology: Gaithersburg, MD, USA, 2008.
- Wu, Z.; Ma, C.; Jiang, Z.; Luo, Z. Structure evolution and gasification characteristic analysis on co-pyrolysis char from lignocellulosic biomass and two ranks of coal: Effect of wheat straw. Fuel 2019, 239, 180–190. [Google Scholar] [CrossRef]
- Li, M.; Cheng, X.; Hao, J.; Lu, Z.; Wei, J. Experimental and numerical investigation on the heat and mass transfer performance of tar rich coal in-situ pyrolysis. Int. J. Heat Fluid Flow 2024, 107, 109412. [Google Scholar] [CrossRef]
- Cheng, S.; Lai, D.; Shi, Z.; Hong, L.; Zhang, J.; Zeng, X.; Gao, S.; Xu, G. Suppressing secondary reactions of coal pyrolysis by reducing pressure and mounting internals in fixed-bed reactor. Chin. J. Chem. Eng. 2017, 25, 507–515. [Google Scholar] [CrossRef]
- Yang, H.; Li, Y.; Xie, Z.; Cheng, Y.; Han, Z.; Jin, L.; Li, Y.; Hu, H. Increasing condensation polymerization at a higher heating rate during coal pyrolysis and its mechanism. J. Anal. Appl. Pyrolysis 2024, 177, 106361. [Google Scholar] [CrossRef]
- Wu, Y.; Tao, S.; Wang, Z.; Cui, Y.; Jing, Q.; He, W.; Guo, J.; Hai, L.; Pan, Z. Effect of pyrolysis atmospheres on gaseous products evolution of coal pyrolysis at high temperature. Fuel 2024, 366, 131336. [Google Scholar] [CrossRef]
- Wang, S.; Tang, Y.; Schobert, H.H.; Guo, Y.n.; Gao, W.; Lu, X. FTIR and simultaneous TG/MS/FTIR study of Late Permian coals from Southern China. J. Anal. Appl. Pyrolysis 2013, 100, 75–80. [Google Scholar] [CrossRef]
- He, X.; Zhu, H.; Huo, Y.; Wang, W. Study on the Formation Mechanism of the Pyrolysis Products of Lignite at Different Temperatures Based on ReaxFF-MD. ACS Omega 2021, 6, 35572–35583. [Google Scholar] [CrossRef]
- Tian, B.; Qiao, Y.; Bai, L.; Feng, W.; Jiang, Y.; Tian, Y. Pyrolysis behavior and kinetics of the trapped small molecular phase in a lignite. Energy Convers. Manag. 2017, 140, 109–120. [Google Scholar] [CrossRef]
- Wang, M.; Tian, J.; Guo, X.; Yang, S.; Wang, J.; Wang, J. Coupling dry reforming of methane with in-situ catalytic cracking of coal pyrolysis tar over xNi@HZSM-5. Fuel Process. Technol. 2025, 272, 108209. [Google Scholar] [CrossRef]
- Zhu, Y.; Wang, Q.; Yan, J.; Cen, J.; Fang, M. Effect of heating rate on the secondary reaction in low-rank coals pyrolysis with the real-time evolution analysis of in-situ tar. Energy 2024, 297, 131183. [Google Scholar] [CrossRef]
- Sun, S.; Xu, D.; Wei, Y.; Zhi, Y.; Jiang, G.; Guo, Y. Influence laws of operating parameters on coal pyrolysis characteristics. J. Anal. Appl. Pyrolysis 2022, 167, 105684. [Google Scholar] [CrossRef]
- Kou, B.; Shi, Q.; Wang, S.; Ji, R.; Zhao, H.; Mi, Y.; Li, C. Co-evolution with pore and molecular structure during tar-rich coal pyrolysis. Case Stud. Therm. Eng. 2024, 62, 105215. [Google Scholar] [CrossRef]
- Huang, Y.-B.; Zhao, Y.-P.; Qiu, L.-L.; Wu, F.-P.; Liang, J.; Xiao, J.; Liu, F.-J.; Cao, J.-P. Pyrolysis behaviors of lump sub-bituminous coal. Part 1: Structural evolution of chars both at particle surface and center. Fuel 2024, 376, 132709. [Google Scholar] [CrossRef]
- Zhang, C.; Zhao, Y.; Feng, Z.; Wang, L.; Meng, Q.; Lu, Y.; Gao, Q. Comparative study on the chemical structure characteristics of lump coal during superheated water vapor pyrolysis and conventional pyrolysis. Energy 2023, 276, 127613. [Google Scholar] [CrossRef]
- Chen, T.; Feng, Y.; Yang, S.; Yellezuome, D.; Zheng, M.; Qin, J.; Wu, J. Product distribution and carbon structure evolution characteristics of semicoke from isothermal pyrolysis of Naomaohu coal. J. Anal. Appl. Pyrolysis 2024, 179, 106484. [Google Scholar] [CrossRef]
- Feng, Y.; Xu, S.; Wang, K.; Wang, C. Coal pyrolysis under varied atmospheres and temperatures in a moving-bed pyrolyzer for blue-coke production. Fuel Process. Technol. 2022, 234, 107322. [Google Scholar] [CrossRef]


| Proximate Analysis wt.% | Ultimate Analysis wt.% | |||||||
|---|---|---|---|---|---|---|---|---|
| Mad | Ad | Vd | FCd * | Cd | Hd | Nd | Sd | Od * |
| 9.64 | 8.34 | 32.32 | 59.34 | 72.19 | 3.74 | 0.86 | 0.14 | 14.72 |
| Particle Size/mm | Pyrolysis Products/wt.% | |||
|---|---|---|---|---|
| Coke | Gas | Tar | Water | |
| 2~5 | 76.05 | 6.08 | 13.12 | 4.75 |
| 5~10 | 76.32 | 5.34 | 14.66 | 3.68 |
| 10~20 | 76.91 | 6.57 | 13.21 | 3.31 |
| 20~30 | 77.43 | 6.99 | 12.43 | 3.15 |
| Classification of Tar Components | Representative Substance |
|---|---|
| Benzenes | Toluene, p-xylene, o-xylene, m-xylene, mesitylene, styrene, and 4-methylstyrene |
| Phenols | Phenol, o-cresol, m-cresol, 2,4-dimethylphenol, 3,5-dimethylphenol |
| Naphthalene | naphthalene, α-methylnaphthalene, β-methylnaphthalene, 1,2-dimethylnaphthalene, 2,6-dimethylnaphthalene, and 1,5-dimethylnaphthalene |
| Aliphatic hydrocarbon | Undecane and tetradecane |
| PAHs | Acenaphthene, fluorene, phenanthrene, anthracene, fluoranthene, pyrene, 9,10-phenanthrene, and dibenzofuran |
| Particle Size/mm | Cd | Hd | Od | Nd | Sd | Ad | C/H |
|---|---|---|---|---|---|---|---|
| 2~5 | 81.01 | 1.99 | 4.16 | 0.63 | 0.32 | 11.89 | 40.709 |
| 5~10 | 83.38 | 2.08 | 5.10 | 0.65 | 0.18 | 8.60 | 40.087 |
| 10~20 | 82.08 | 1.97 | 4.50 | 0.69 | 0.27 | 10.49 | 41.665 |
| 20~30 | 83.14 | 2.03 | 4.99 | 0.63 | 0.23 | 8.98 | 40.956 |
| Particle Size/mm | d002/nm | Lc/nm | La/nm |
|---|---|---|---|
| 2~5 | 0.3679 | 1.1748 | 2.8730 |
| 5~10 | 0.3645 | 1.1953 | 2.9125 |
| 10~20 | 0.3606 | 1.2260 | 2.9579 |
| 20~30 | 0.3626 | 1.2121 | 2.9426 |
| Band Name | Approximate Band Position/cm−1 | Description |
|---|---|---|
| D1 | 1380 | C-C between aromatic rings and aromatics with no less than six rings |
| D2 | 1620 | Aromatics with three–five rings; amorphous carbon structures |
| D3 | 1500 | Methylene or methyl; semi-circle breathing of aromatic rings; amorphous carbon structures |
| D4 | 1200 | Caromatic-Calkyl; aromatic (aliphatic) ethers; C-C on hydroaromatic rings; C-H on aromatic rings |
| G | 1580 | Graphite E2g2; aromatic ring quadrant breathing; |
| Particle Size/mm | ID1/IG | IG/Iall |
|---|---|---|
| 2~5 | 4.478 | 0.1359 |
| 5~10 | 3.925 | 0.1514 |
| 10~20 | 3.858 | 0.1547 |
| 20~30 | 3.975 | 0.1505 |
| Particle Size mm | Specific Surface Area m2/g | Total Pore Volume cm3/g | Average Pore Size nm |
|---|---|---|---|
| 2~5 | 1.3717 | 0.0028 | 8.1595 |
| 5~10 | 3.1622 | 0.0086 | 10.8799 |
| 10~20 | 2.0002 | 0.0003 | 0.6249 |
| 20~30 | 12.3560 | 0.0106 | 3.4415 |
Disclaimer/Publisher’s Note: The statements, opinions and data contained in all publications are solely those of the individual author(s) and contributor(s) and not of MDPI and/or the editor(s). MDPI and/or the editor(s) disclaim responsibility for any injury to people or property resulting from any ideas, methods, instructions or products referred to in the content. |
© 2025 by the authors. Licensee MDPI, Basel, Switzerland. This article is an open access article distributed under the terms and conditions of the Creative Commons Attribution (CC BY) license (https://creativecommons.org/licenses/by/4.0/).
Share and Cite
Luo, Y.; Liu, L.; Lv, L.; Zhang, S.; Dai, F.; Jin, H.; Sui, J. Moderate-Temperature Pyrolysis Characteristics of Lump Coal Under Varying Coal Particle Sizes. Energies 2025, 18, 3220. https://doi.org/10.3390/en18123220
Luo Y, Liu L, Lv L, Zhang S, Dai F, Jin H, Sui J. Moderate-Temperature Pyrolysis Characteristics of Lump Coal Under Varying Coal Particle Sizes. Energies. 2025; 18(12):3220. https://doi.org/10.3390/en18123220
Chicago/Turabian StyleLuo, Yuanpei, Luxuan Liu, Liangguo Lv, Shengping Zhang, Fei Dai, Hongguang Jin, and Jun Sui. 2025. "Moderate-Temperature Pyrolysis Characteristics of Lump Coal Under Varying Coal Particle Sizes" Energies 18, no. 12: 3220. https://doi.org/10.3390/en18123220
APA StyleLuo, Y., Liu, L., Lv, L., Zhang, S., Dai, F., Jin, H., & Sui, J. (2025). Moderate-Temperature Pyrolysis Characteristics of Lump Coal Under Varying Coal Particle Sizes. Energies, 18(12), 3220. https://doi.org/10.3390/en18123220