Article

Co-Optimization of Market and Grid Stability in High-Penetration Renewable Distribution Systems with Multi-Agent

China Electric Power Research Institute Co., Ltd., Beijing 100192, China
*
Author to whom correspondence should be addressed.
Energies 2025, 18(12), 3209; https://doi.org/10.3390/en18123209
Submission received: 29 April 2025 / Revised: 20 May 2025 / Accepted: 22 May 2025 / Published: 19 June 2025

Abstract

:
The large-scale integration of renewable energy and electric vehicles(EVs) into power distribution systems presents complex operational challenges, particularly in coordinating market mechanisms with grid stability requirements. This study proposes a new dispatching method based on dynamic electricity prices to coordinate the relationship between the market and the physical characteristics of the power grid. The proposed approach introduces a multi-agent transaction model incorporating voltage regulation metrics and network loss considerations into market bidding mechanisms. For EV integration, a differentiated scheduling strategy categorizes vehicles based on usage patterns and charging elasticity. The methodological innovations primarily include an enhanced scheduling algorithm for coordinated optimization of renewable energy and energy storage, and a dynamic coordinated optimization method for EV clusters. Implemented on a modified IEEE test system, the framework demonstrates improved voltage stability through price-guided energy storage dispatch, with coordinated strategies effectively balancing peak demand management and renewable energy utilization. Case studies verify the system’s capability to align economic incentives with technical objectives, where time-of-use pricing dynamically regulates storage operations to enhance reactive power support during critical periods. This research establishes a theoretical linkage between electricity market dynamics and grid security constraints, providing system operators with a holistic tool for managing high-renewable penetration networks. By bridging market participation with operational resilience, this work contributes actionable insights for developing interoperable electricity market architectures in energy transition scenarios.

1. Introduction

In the context of the changing global energy structure, the large-scale integration of multi-subject systems including photovoltaic (PVs), wind turbines (WTs), and electric vehicles (EVs) is reshaping the energy landscape and technical paradigm of distribution networks. These dynamic interactions induce systemic challenges such as bidirectional power flow, node voltage violations, and increasing network losses, while power market reforms have catalyzed the demand for coordinated optimization between market bidding mechanisms and grid physical characteristics. Establishing a multi-agent collaborative operation mechanism that adapts to market environments—safeguarding the economic value of distributed generation (DG) while maintaining grid security boundaries—has become a core proposition for building new power systems and a critical breakthrough to resolve the inadequacy of traditional centralized dispatch modes in accommodating flexible interactions with massive DG [1,2].
Against the backdrop of deepening power market reforms, current research paradigms remain confined to islanded optimization frameworks that separate the economic and technical dimensions. In economic studies, multi-level explorations focus on energy storage configurations and market mechanisms. For energy storage business model innovation, Mu et al. [3] develop an optimization model based on a cost–benefit analysis, employing the non-dominated sorting genetic algorithm (NSGA-II) to design tiered energy storage pricing packages that align user contract periods with storage cost characteristics, providing differentiated business models for electricity retailers. Building on this, Liu et al. [4] incorporate price volatility in day-ahead and real-time markets to propose a multi-market collaborative trading model with energy storage stations, leveraging charge/discharge responses to mitigate load fluctuations and enhance revenue robustness. In investment optimization, Michalski et al. [5] quantify the profit-enhancing effects of energy storage systems on PV integration, revealing their leverage in improving renewable energy economics. Ren et al. [6] innovatively construct a bi-level operation–planning co-optimization framework, optimizing third-party storage capacity portfolios at the upper level while reducing annual operational costs through real-time dispatch at the lower level. Ehsan et al. [7] extend this to wind–PV–storage multi-energy synergy scenarios, proposing a siting and sizing model based on net present value maximization for distribution network operators. For market mechanism innovation, Liu et al. [8] address multi-microgrid interaction congestion by developing a distributed peer-to-peer (P2P) day-ahead trading mechanism, analyzing P2P’s dual economic and technical impacts. Zhao et al. [9] build a multi-energy microgrid optimization model to reduce total system costs through electricity–heat–gas coupling. Vahidinasab et al. [10] establish a stochastic multi-objective framework to co-optimize economic costs and pollution emissions under the dual uncertainties of load and electricity prices. In risk management, Wang et al. [11] introduce Conditional Value-at-Risk (CoVaR) tools to quantify trading strategy risk exposure via nonlinear stochastic programming, revealing the sensitivities of retail profits to load elasticity and price volatility. Jin et al. [12] integrate cyber–physical system technologies to propose real-time price-driven storage–EV coordinated scheduling strategies, offering new paradigms for resource interactions in dynamic markets.
Technical research has achieved systematic breakthroughs in voltage stability and reactive power optimization: Yang et al. [13] first reveal the voltage regulation capabilities of PV–storage systems, demonstrating reduced node voltage deviations and enhanced PV accommodation rates through distributed PV–storage configurations, though lacking dynamic feedback with market bidding strategies. Filip et al. [14] further quantify the differential impacts of EV charging modes on PV accommodation, identifying improved PV utilization via ordered charging and supplementary storage, yet failing to establish price signal–charging behavior linkages, resulting in disconnects between economic and security objectives. Addressing the voltage accumulation effects of large-scale EV integration, Manbachi et al. [15] develop a quantitative EV penetration–voltage deviation relationship model. Xu et al. [16] break new ground by incorporating EVs into traditional renewable-powered distribution networks, constructing a multi-objective reactive power optimization framework that minimizes network losses and voltage deviations, and maximizes static stability margins, with simulations verifying high-quality reactive power regulation strategies. Li et al. [17] validate the superiority of an improved multi-objective particle swarm algorithm, significantly enhancing Pareto solution set uniformity. Xia et al. [18] implement network loss reduction and voltage deviation mitigation in IEEE 33-node systems using dynamic inertia weights and mutation strategies. Dharavat et al. [19] innovatively design renewable energy–EV charging station collaborative allocation methods, reducing power losses and improving voltage uniformity through spatial coupling optimization. In dispatch control, Zhu et al. [20] develop a multi-stage active distribution network coordination model, optimizing EV charging strategies across day-ahead, intra-day, and real-time timescales to exploit EV peak-shaving potential. Liu et al. [21] propose an EV–storage joint peak-shaving strategy coordinating charge/discharge sequences to reduce peak loads and electricity costs. However, most existing studies rely on fixed electricity prices or static scenario assumptions. For instance, the reactive power optimization model in Reference [16] fails to consider the temporal guidance effect of time-of-use electricity prices on energy storage scheduling, while the scheduling strategy in Reference [19] neglects the regulatory potential of electricity retailers’ interest interactions on EV charging behaviors, resulting in collaborative failure between market mechanisms and physical optimizations.
Existing studies on renewable-rich distribution network optimization face three critical limitations. First, market bidding strategies and grid physical characteristics are optimized in isolated frameworks, lacking bidirectional collaborative mechanism between price signals and voltage stability indicators. Second, current EV scheduling approaches generally ignore the spatiotemporal response differences in charging demand elasticity across vehicle types, failing to achieve dynamic alignment between load profiles and peak-shaving requirements. Third, existing collaborative paradigms lack systematic frameworks for deep market–physical coupling of “source–grid–load–storage” resources, resulting in insufficient synergy between economic incentives and grid security constraints.
The main contributions of this study are summarized as follows:
  • A dynamic electricity price-driven multi-agent transaction model is developed, embedding network loss costs and voltage sensitivity into market mechanisms. This establishes a collaborative mechanism between economic objectives and grid security boundaries through price-guided energy storage dispatch sequences.
  • A spatiotemporal response matrix is constructed for four vehicle types (taxis, buses, official vehicles, and private cars), creating a dynamic matching model between charging behavior characteristics and grid flexibility demands, and overcoming the rigidity of conventional homogeneous scheduling methods.
  • A deep coupling interface is designed to integrate market signals with physical regulation, enabling the self-organized optimization of “source–grid–load–storage” resources across temporal price incentives and spatial reactive power coordination.
The core theoretical breakthrough reveals the fundamental interaction mechanisms between electricity market dynamics and grid physical principles. By establishing price-guided multi-timescale coordination, this work provides an integrated technical–market solution for high-renewable distribution networks, charting a coordinated evolution path for “market vitality and physical resilience” in new power systems.

2. Multi-Agent Operation Model

With the energy structure transitioning toward low-carbon and intelligent paradigms, the coordinated operation of DG and flexible loads has emerged as a critical direction for power system optimization. This chapter focuses on multi-agent systems incorporating PVs, WTs, and DG, developing refined operational models to analyze their operational mechanisms. These models establish a foundation for subsequent market mechanism design and dispatch strategy optimization.

2.1. DG Output Model
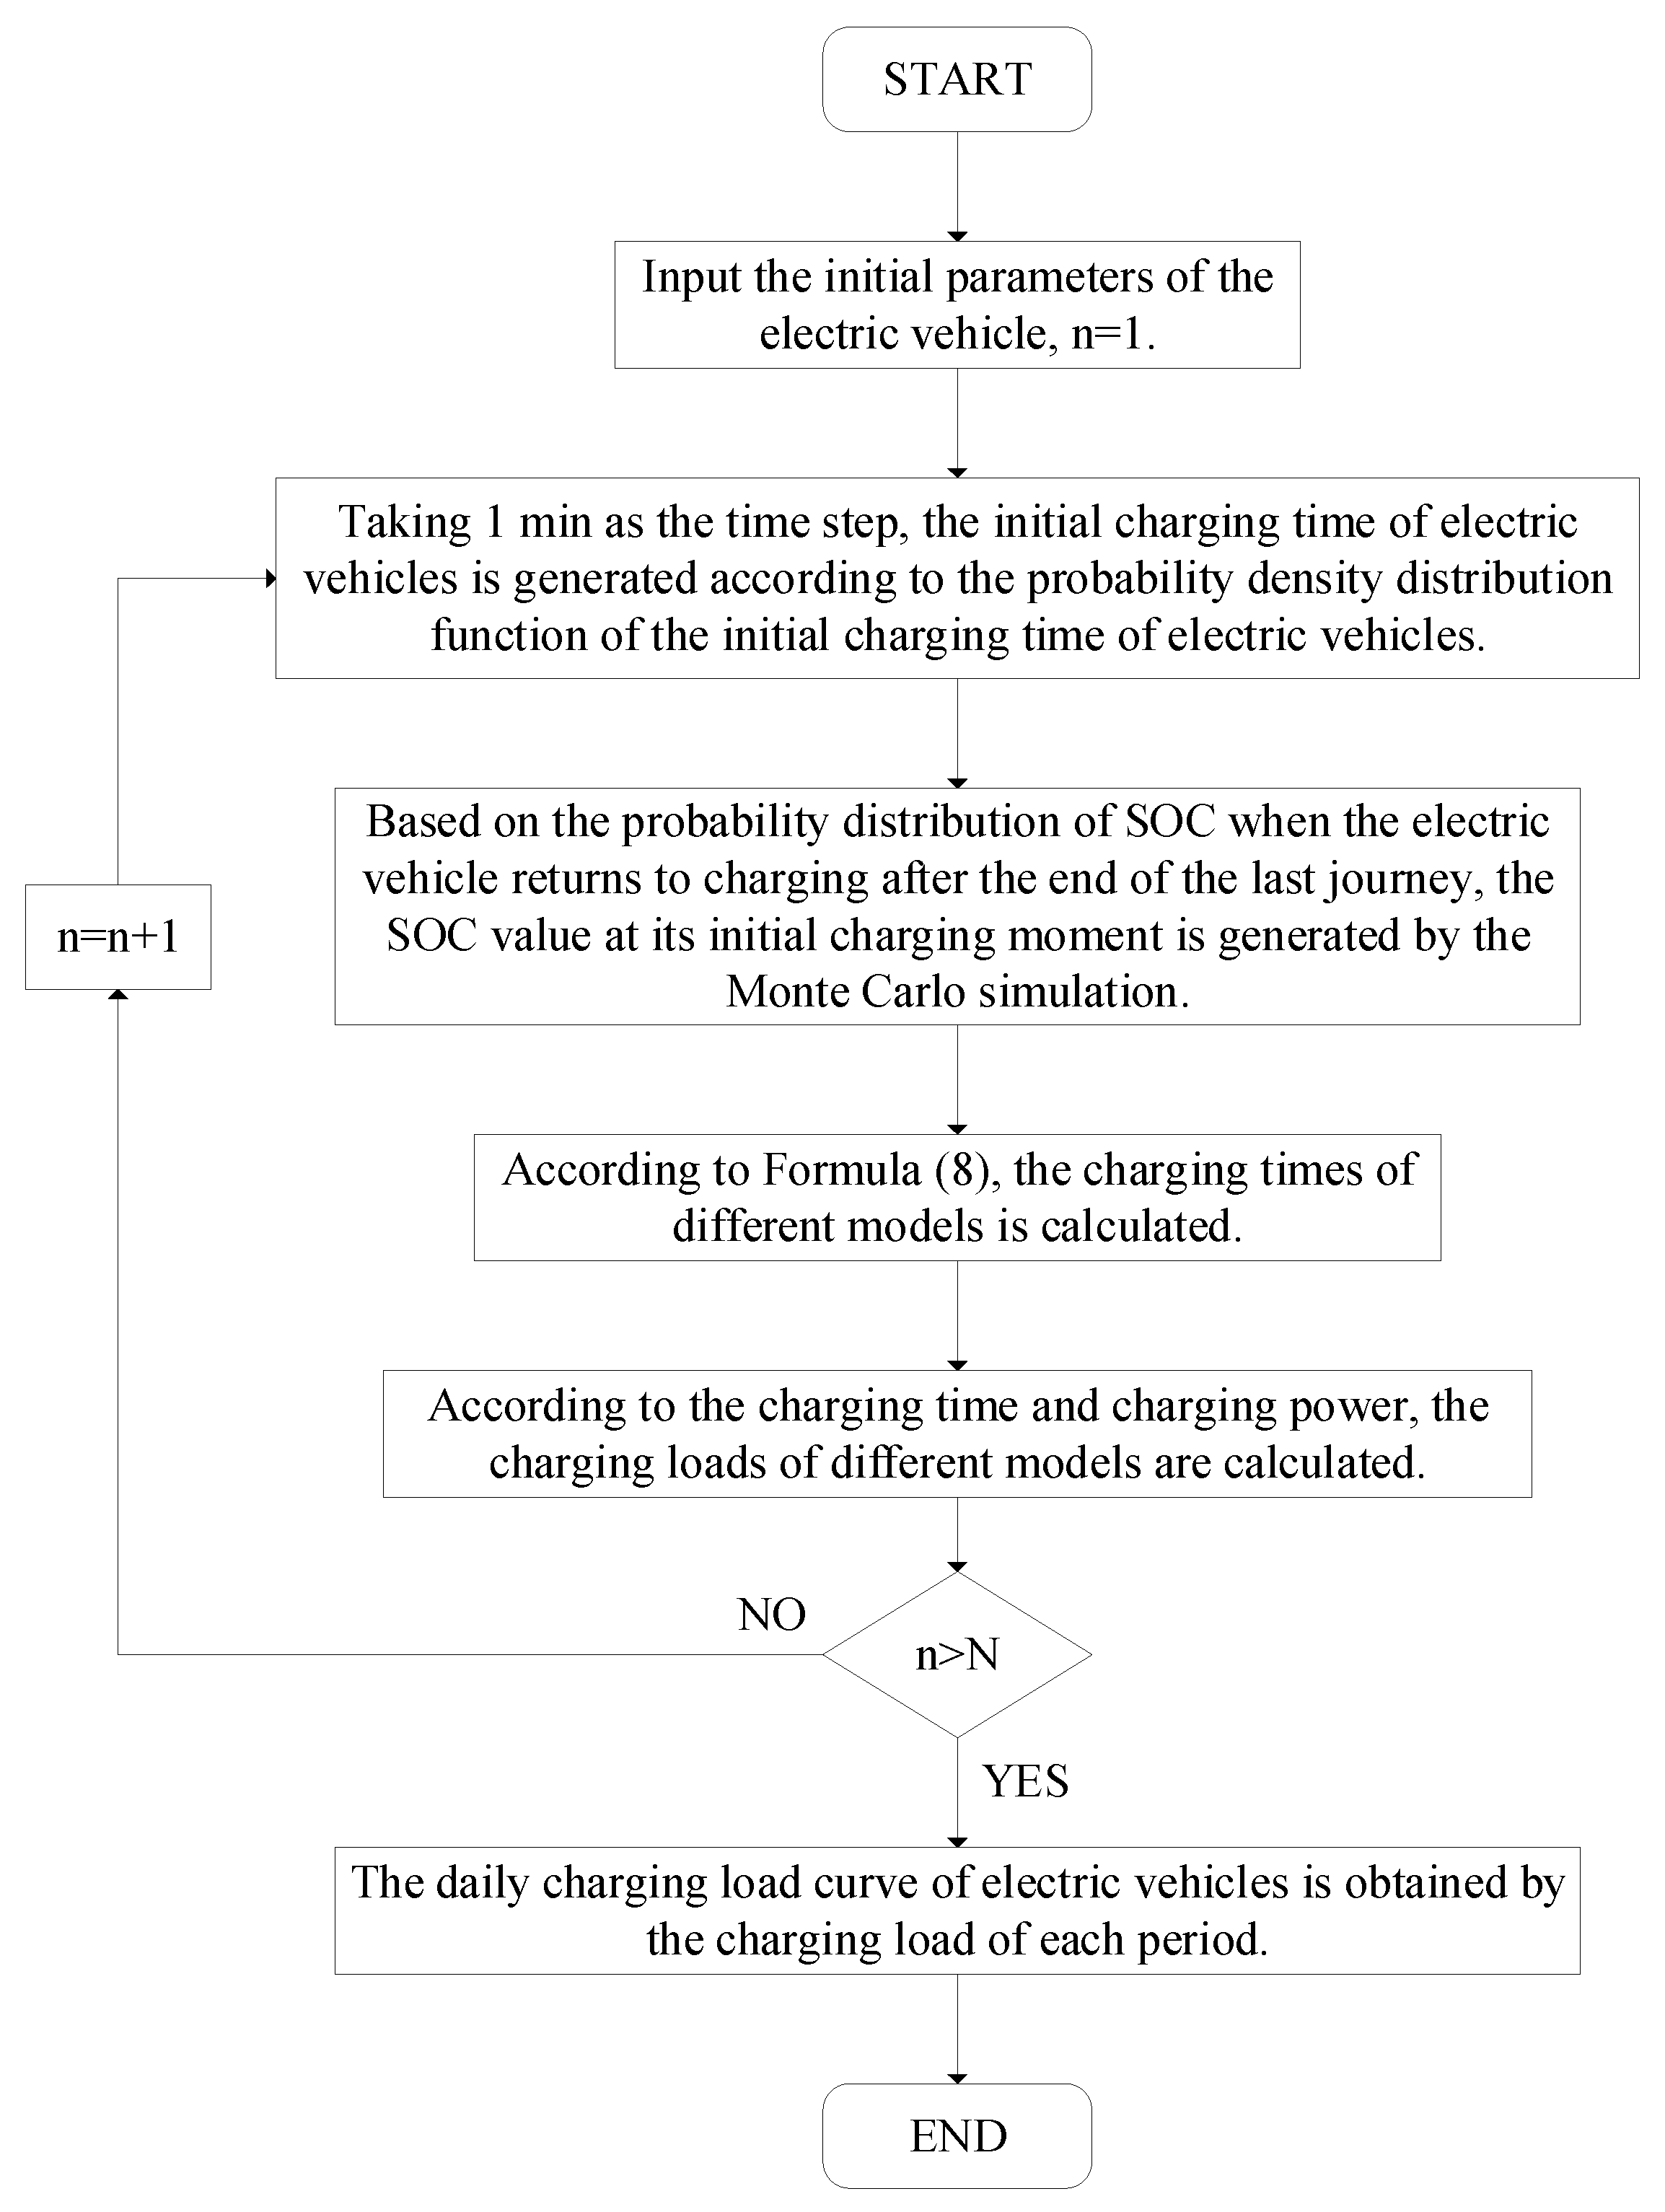
The output of DG such as PV and WT systems is strongly correlated with local meteorological conditions. Specifically, PV output is primarily influenced by solar irradiance, while WT output depends predominantly on wind speed [22,23].
PV exhibits periodic, intermittent, and fluctuating characteristics, with its output governed by solar radiation. Due to the inherent uncertainty of solar radiation, its probability density is typically modeled using a Beta distribution, as follows:
f r a β , b β = Γ ( a β + b β ) Γ ( a β ) Γ ( b β ) r a β 1 ( 1 r ) b β 1
where r is the solar radiation intensity, and aβ and bβ are the shape parameters of Beta distribution. Here, the Gamma distribution represented by the symbol Γ is defined as follows:
Γ ( α ) : = 0 t α 1 e t d t
Through investigation, it was found that the output power of PV systems is influenced by the combined effects of the installation configuration and environmental conditions. Under equivalent horizontal solar irradiance, variations in the tilt angle of PV panels alter the geometric relationship between the incident sunlight and the panel surface, thereby modifying both the effective radiation intensity and irradiation distribution characteristics on the receiving surface, which collectively result in power output fluctuations. Furthermore, ambient temperature variations significantly impact photoelectric conversion efficiency by affecting the carrier mobility in semiconductor materials and the operational characteristics of pn-junctions. This temperature-induced degradation effect typically manifests as a linear variation pattern characterized by power temperature coefficients ranging from −0.3% to −0.5% per °C. The PV output power Pout as a function of solar radiation intensity r can be expressed as follows:
P o u t r = r cos θ cos φ A P V η P V 1 k T T 0
where cos(θ) is the cosine of the angle between the PV panel and the ground, cos(φ) is the cosine of the angle between the PV panel and illumination, APV is the area of the PV panel, ηPV is the conversion efficiency of the PV panel, T and T0 are the actual and reference temperature, respectively, and k is the temperature correction coefficient.
WT output depends on wind speed, and has the characteristics of volatility, intermittently, and diurnal variation. Wind speed in nature varies with time, weather, and the geographical location of the wind field, and its probability density model is usually assumed to follow Weibull distribution [24]:
f ( ν ) = K ω C ω ν C ω K ω 1 exp ν C ω K ω
where v represents wind speed, and Kw and Cw are the shape and scale parameters of Weibull distribution, respectively. The conversion between wind speed v and wind energy output power Pout depends on the wind speed to wind energy conversion function.
The wind speed–wind energy conversion function between the wind energy output power Pout is as follows:
P o u t v = 0 , 0 v v s t a r t 1 2 ρ A v 3 C P λ η w i n d , v s t a r t < v v r a t e d P r a t e d , v r a t e d < v < v c u t o u t 0 , v v c u t o u t
where ρ is the air density, A is the WT cross-sectional area, CP (λ) is the fixed parameter of the unit and is related to λ, ηwind is the conversion efficiency of the WT unit, Prated is the rated output power of the WT, vstart and vrate are the start-up wind speed and rated wind speed, respectively, and vcut-out is the cut-out wind speed.

2.2. EV Load Model

The random and uncontrollable characteristics of the EV charging load are significant, and its spatiotemporal distribution mode is coupled with multiple factors. In order to construct a refined load forecasting model, systematically analyzing the interaction mechanism of key parameters is necessary. This analysis focuses on two core variables, namely, the start time of charging and the initial state of charge (SOC) of the battery, to reveal their quantitative influences on the peak–valley fluctuations of the daily load curve and the continuous time domain characteristics, so as to provide a time series modeling basis for the collaborative scheduling of charging resources on the grid side.
According to the distribution mean μt and standard deviation σt of the initial time, the Gaussian normal distribution model is used to fit the initial charging time [25]:
f ( t ) = 1 σ t 2 π exp ( t μ t ) 2 2 σ t 2
Similarly, according to the mean value μ0 and standard deviation σ0 of the initial SOC, the Gaussian normal distribution model is used to simulate the initial SOC:
S O C = 1 σ s 2 π exp ( x μ s ) 2 2 σ s 2
SOC represents the ratio of the remaining power of the battery to its rated capacity. After knowing the rated capacity of the battery and the charging power, the charging duration can be obtained based on the SOC at the start of charging (this paper does not consider factors such as battery temperature and voltage changes during the charging process):
T c = 1 s o c P c × C
where Tc is the charging duration, Pc is the charging power, and C is the battery capacity.
Monte Carlo simulation is adopted, combined with EV load prediction parameters, and the initial charging time and initial SOC are set as random variables to simulate EV charging behavior. MATLAB R2022b simulation software can be used to obtain the EV charging load timing curve. Assuming that the car starts charging immediately after being connected to the power grid, the Monte Carlo simulation calculation process is shown in Figure 1.

3. Multi-Agent Optimal Operation Model in the Market Environment

The time-of-use electricity price mechanism, as the core price signal of the electricity market reform, can form a strategic synergy with the cross-time period regulation capacity of energy storage systems. Through the price difference arbitrage model of “off-peak electricity storage–peak electricity discharge”, market entities can fully leverage the spatio-temporal transfer characteristics of energy storage systems [26]. This paper aims at the economic interests of power retailers, constructs an output optimization model for DG, and quantitatively analyzes the capacity adaptability of PV/energy storage systems under the incentive of peak–valley electricity prices. To address the operational risks of the power grid brought about by the large-scale integration of EVs, we have innovated a dynamic price-responsive orderly charging strategy. This method achieves the dynamic matching of the morphological characteristics of the load curve and the peak-shaving demand of the power grid by establishing the price elasticity matrix of EV users and the spatiotemporal transfer model of charging demand, and reveals the demand response mechanism and value transfer path of flexible load resources in the electricity market environment.

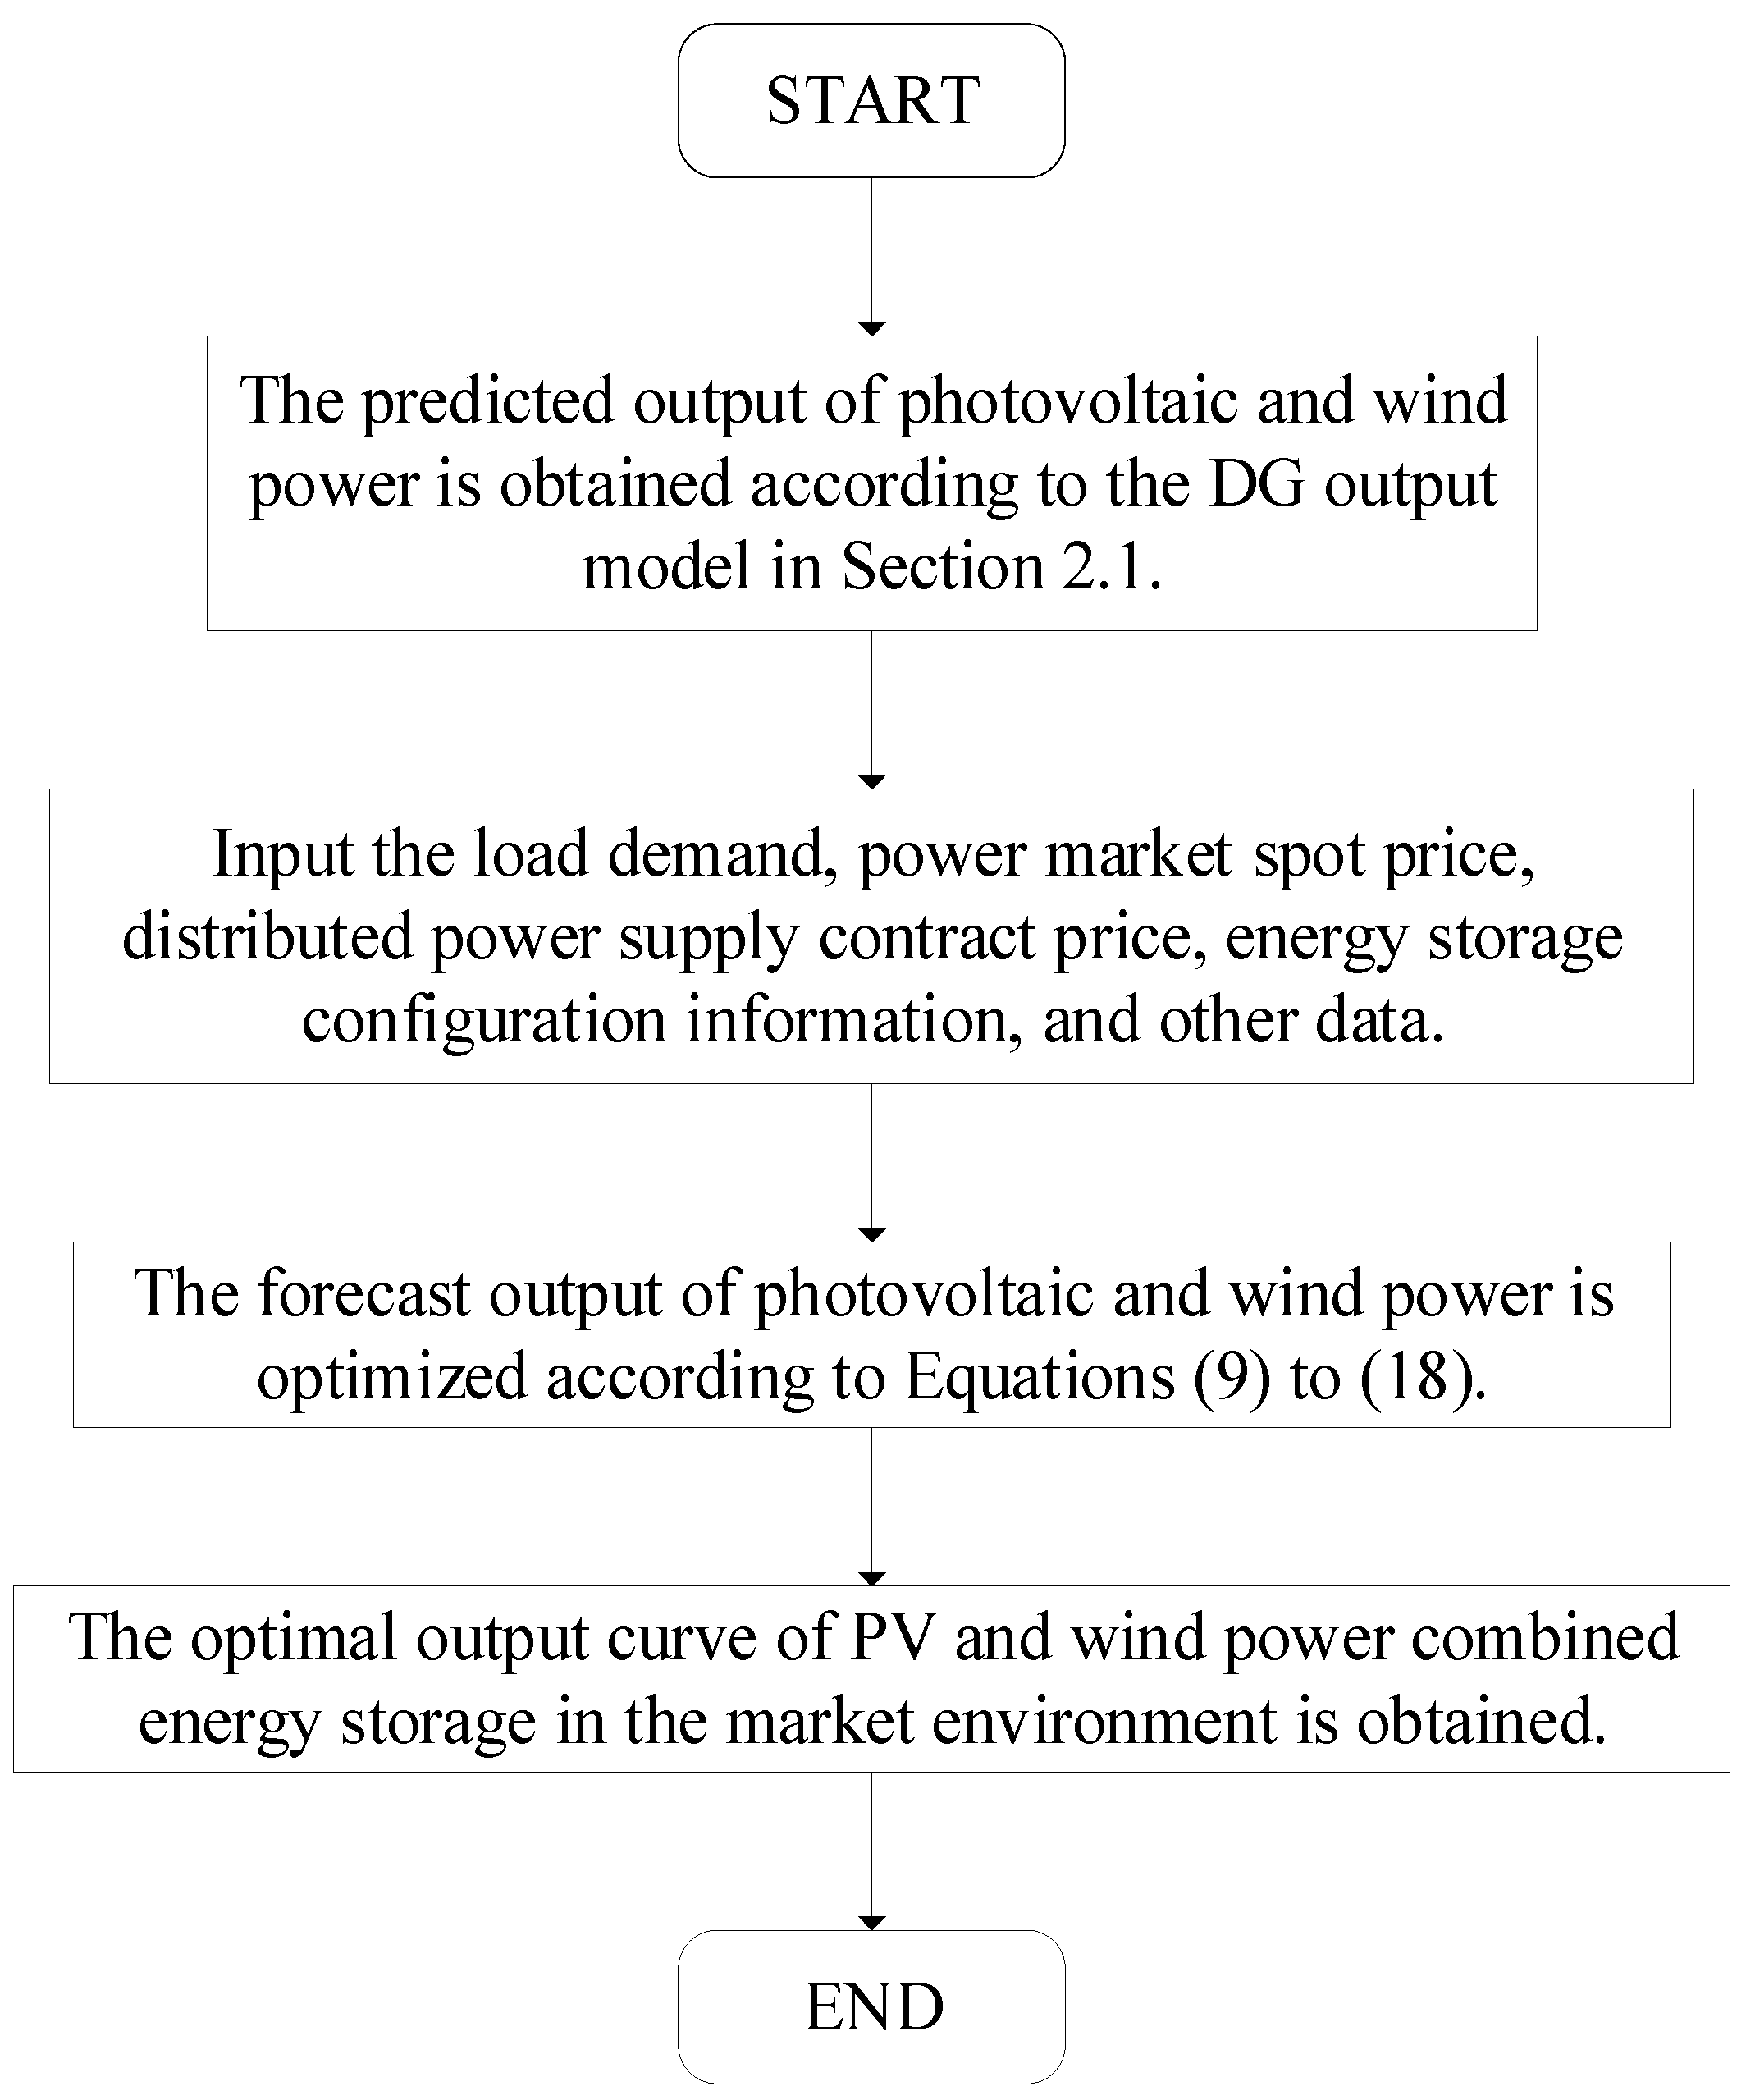
3.1. DG Optimal Output Model in Market Environment

In electricity market transactions, electricity retailers optimize the procurement ratio between the spot market and DG producers based on load forecasting data. By issuing dispatch instructions to DG producers, they coordinate DG unit outputs to achieve precise alignment between power generation plans and demand. Assuming that each DG unit is equipped with an energy storage system, the retailer prioritizes spot market purchases during off-peak price periods to meet load requirements, while DG producers store surplus generation in energy storage systems. During peak price periods, the system directly utilizes real-time DG generation for load consumption. If the DG output exceeds the demand during these periods, surplus energy is stored; if generation falls short, the DG energy storage system discharges to compensate for the deficit.
In this process, its trading decision model can be determined as follows:
f 1 ( t ) = ( P s o l a r , t + λ s o l a r , t d i s P s o l a r d i s ) p s o l a r + ( P w i n d , t + λ w i n d , t d i s P w i n d d i s ) p wind + P g r i d , t p L M P , t
f 2 ( t ) = k l o s s 1 P g r i d , t 2 + k l o s s 2 ( P s o l a r , t + P w i n d , t + λ s o l a r , t d i s P s o l a r d i s + λ w i n d , t d i s P w i n d d i s ) )
min C = t = 1 t = 24 ( f 1 ( t ) + f 2 ( t ) )
where f1 and f2 are the cost directly used for purchasing power and the network loss cost, respectively, and Psolar,t and Pwind,t are the PV and WT outputs directly used for consumption in the time period t, respectively. λ s o l a r , t d i s and λ w i n d , t d i s are the discharge coefficients of PVs and WTs in time period t, respectively. P s o l a r d i s and P w i n d d i s are the discharge powers of PVs and WTs, respectively. psolar and pwind are the prices of PVs and WTs, which can be determined by the time-of-use price; Pgrid,t is the electricity absorbed from the spot market of electricity during the time period t; pLMP,t is the spot price of electricity in time period t; and kloss1 and kloss2 are the network loss cost coefficients of the power spot and DG power, respectively.
The constraints are as follows:
(1) Load balance constraint
P g r i d , t + P s o l a r , t + λ s o l a r , t d i s P s o l a r d i s + P w i n d , t + λ w i n d , t d i s P w i n d d i s = P l o a d , t
where Pload,t is the total load in time period t.
(2) Energy storage state constraint [27]
0 λ dis 1 0 λ c 1 λ dis λ c = 0 Q t + 1 = Q t + η c λ c P c λ d i s P d i s / η d i s S O C min Q N Q t S O C max Q N
where λc and λdis are the charge and discharge coefficients of energy storage; Qt is the amount of energy stored at time t; ηc and ηdis, respectively, are the charge and discharge efficiencies of energy storage; Pc and Pdis, respectively, are the charge and discharge powers of energy storage; SOCmax and SOCmin, respectively, are the upper and lower limits of the energy storage SOC; and QN is the energy storage capacity.
(3) DG accommodation constraint
P s o l a r , t + λ s o l a r , t c P s o l a r c P s o l a r 0 , t
P w i n d , t + λ w i n d , t c P w i n d c P w i n d 0 , t
where λ s o l a r , t c and λ w i n d , t c , respectively, are the charging coefficient of PVs and WTs in the time period t; P s o l a r c and P w i n d c , respectively, are the charging powers of PVs and WTs; and Psolar0,t and Pwind0,t, respectively, are the predicted outputs of PVs and WTs in time period t.
This transaction decision model optimizes the charging and discharging strategies of energy storage based on electricity price signals and achieves the coordinated improvement of grid economy and safety through a dual mechanism. Specifically, the network loss cost coefficient is introduced at the system operation level to construct an economic scheduling model, effectively reducing network loss. In the dimension of voltage regulation, the dynamic governance of node voltage is achieved by relying on the differences in power characteristics during charging and discharging periods.
During the off-peak electricity price period, the model purchases electricity through the spot market to drive the charging of distributed energy storage systems. This not only reduces operating costs by using low-cost electricity but also suppresses the risk of the node voltage exceeding the limit under light load conditions at night by consuming excess power. When the system transitions to the peak electricity price period, the energy storage unit is stimulated by the price signal to implement the discharge strategy. While the active power it releases meets the peak load demand, the dynamic reactive power support it provides can improve the voltage drop problem at heavy-load nodes, forming a dual benefit of “peak shaving and valley filling-voltage support”.
Under the above transaction decision model, the power selling company and the DG generator coordinate with each other to manage the DG output, which can realize the effective allocation and utilization of resources. The flow chart of the transaction process is shown in Figure 2.
This model has certain applicability in different electricity markets. For the distributed energy trading scenario, the grid loss cost calculation and voltage stability index embedded in it can effectively support multi-agent decentralized bidding transactions. In the centralized electricity spot market, the model can dynamically adjust the charging and discharging sequence of energy storage through real-time electricity prices to achieve the dual optimization of market clearing and power grid losses. For regional markets with high penetration rates of WTs and PVs, the model can alleviate the impact of fluctuations in renewable energy on node voltages through the linkage of price signals and energy storage strategies. This characteristic of the coordinated optimization of economy and safety makes it particularly suitable for the connection requirements of the multi-level trading system in the new power market where the proportion of new energy is gradually increasing.

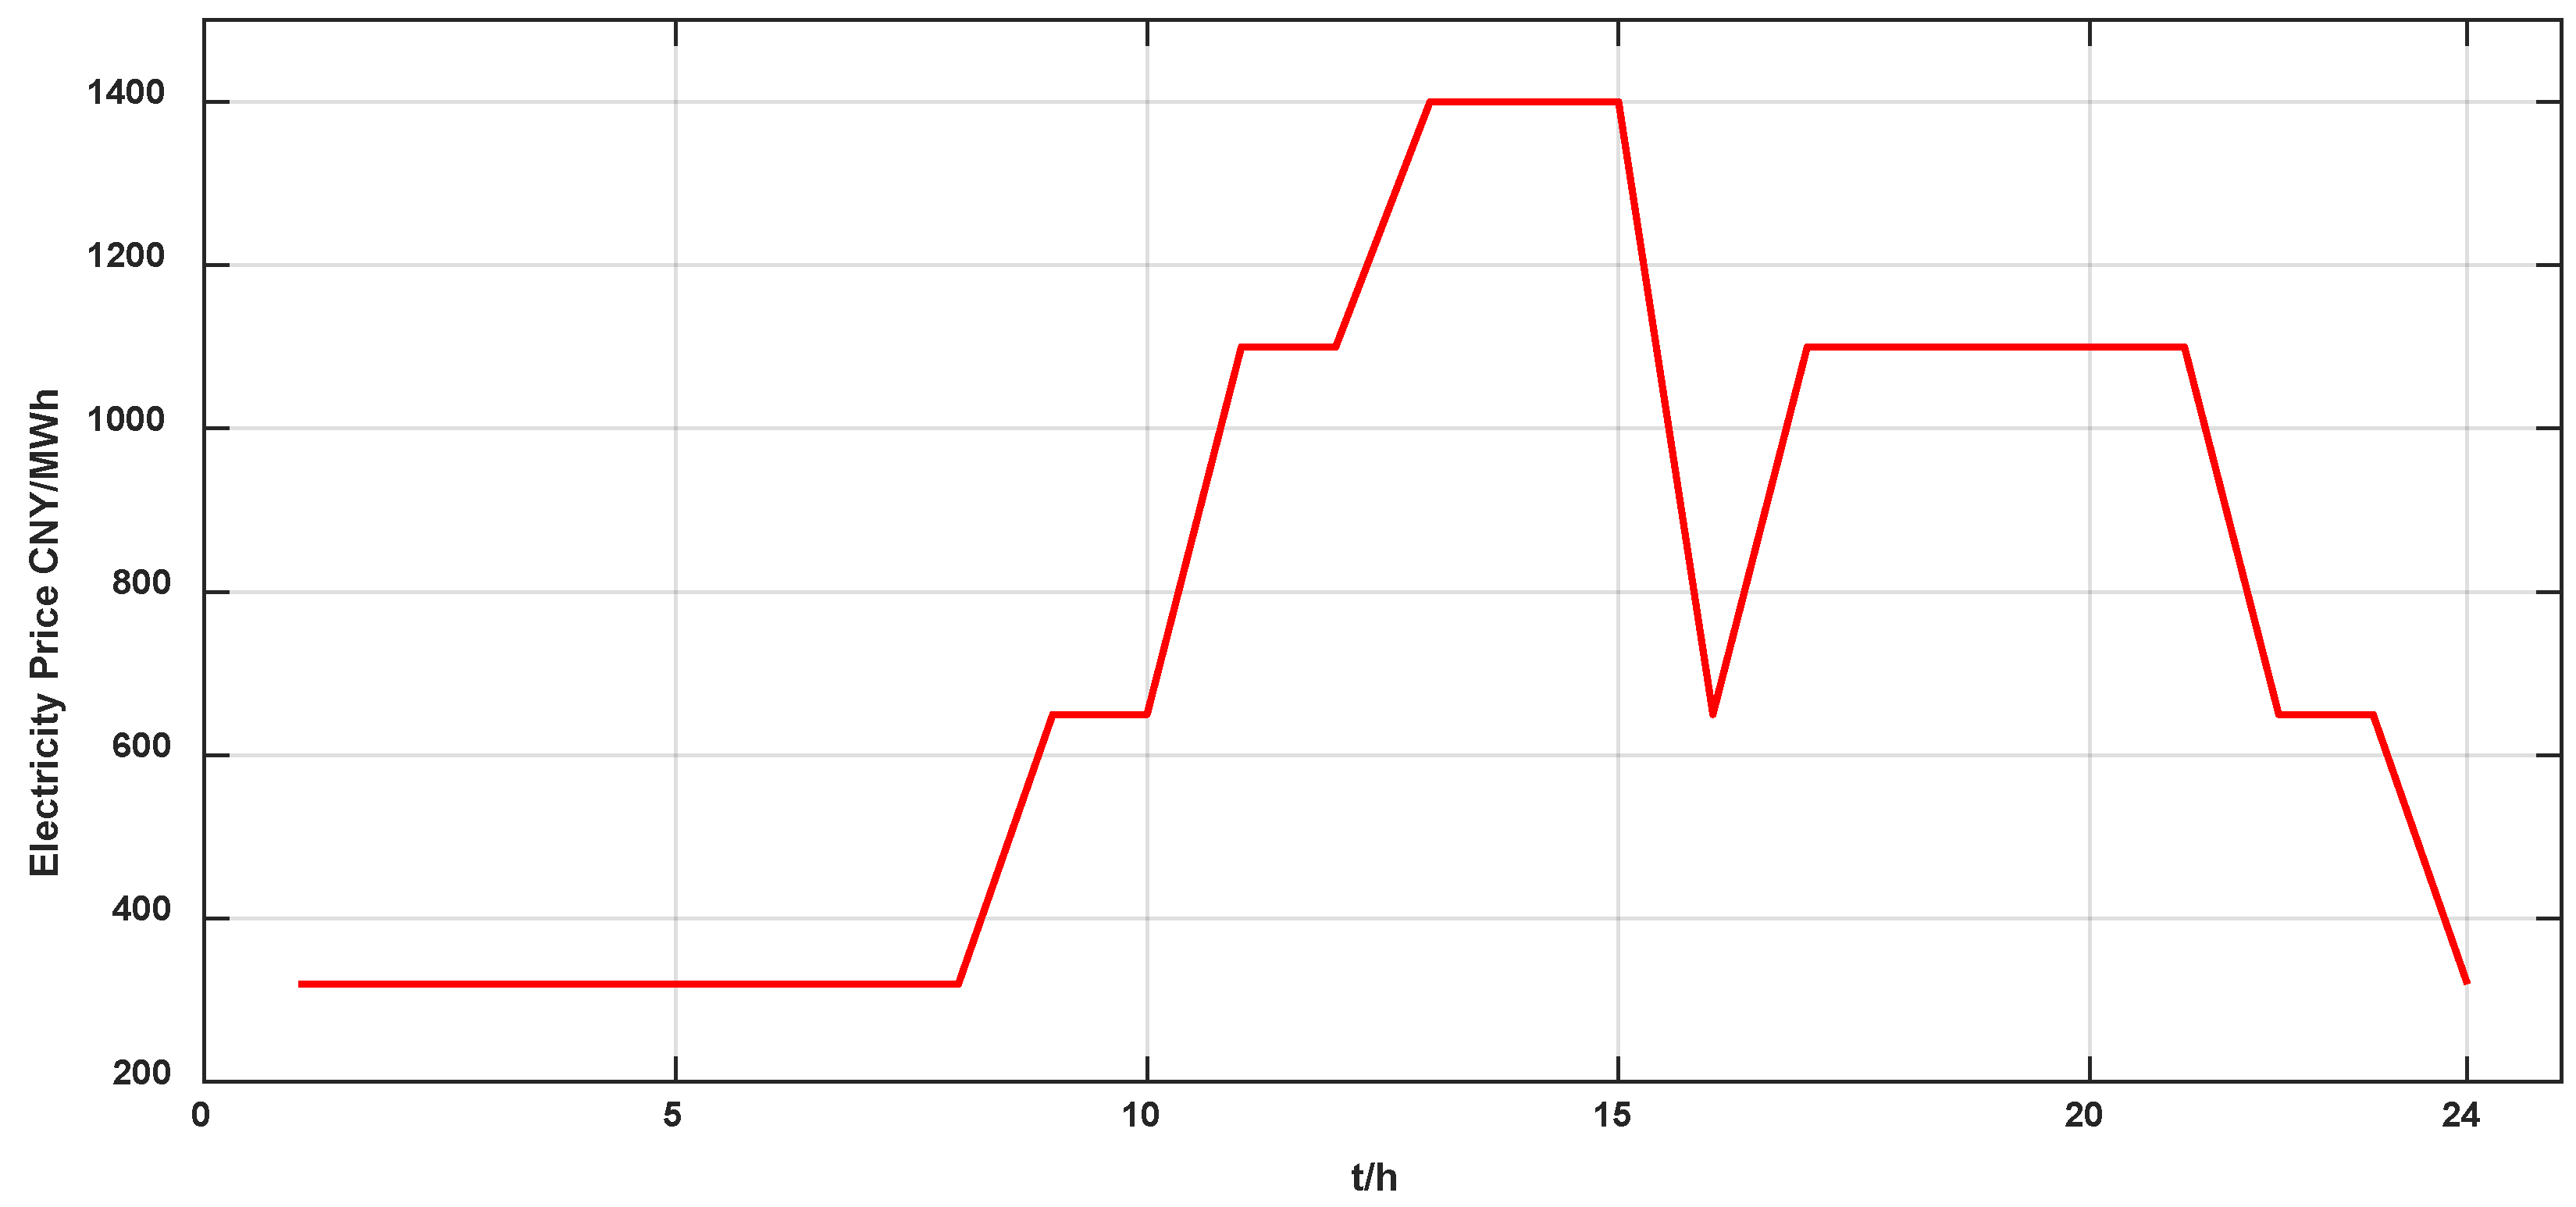
3.2. Price-Responsive EV Ordered Charging Optimization Model

Under the background of time-of-use price, in order to promote the stability of the power grid and play the role of EV load ‘peaking and valley filling’, this paper proposes an orderly charging method to guide EV charging behavior and studies EV load characteristics in the market environment [28].

3.2.1. Dynamic Adjustment Mechanism for Charging Time Windows

In order to maximize the peaking potential of EV load under the time-of-use price tariff mechanism, a dynamic charging time adjustment strategy based on the constraint of the trough price period is proposed.
Set the charging time of a single EV as t and the length of the trough price period as Tvalley; then, the charging start time tstart meets the following:
t start = T valley _ begin , if   T valley t T valley _ begin Δ t , if   T valley < t
where ∆t = tTvalley.

3.2.2. Differentiated Scheduling Model for Multi-Class EVs

EVs are categorized into four types: taxis, buses, official vehicles, and private cars. Considering the electricity demand and operational patterns of each vehicle category, distinct charging periods are established. Based on the price elasticity sensitivity characteristics of specific EV types, their dispatchability is determined. Given that certain EVs have specialized charging requirements, it is impractical to schedule all vehicles with unique power demands for valley-hour charging. Consequently, differentiated charging strategies are developed according to EV type classifications to synchronize operational profiles with grid flexibility needs. While the majority of EVs adopt valley-period ordered charging strategies, those with specialized charging requirements maintain unordered charging patterns.
The specific implementation process of the EV orderly charging method proposed in this paper can be described as follows after considering the actual situation and various EV electricity demand.
Step 1: EVs are divided into four different types, namely, taxis, buses, official vehicles, and private cars, the charging strategy of different types of EVs is determined according to the actual situation, and the proportion of scheduling can be determined.
Step 2: Taking 1 min as the time step, 24 h are divided into 1440 min. The EV load model proposed in Section 2.2 is used to determine the charging time of each type of EV, compare the charging time and valley time of each type of EV, and adjust the initial charging time of the EV that can be scheduled according to Equation (16).
Step 3: After determining the initial charging time, the charging load curve after the orderly scheduling of EVs can be calculated according to the EV load model in Section 2.2.

4. Multi-Objective Reactive Power Optimization Model

Given the stochastic nature of DG output and EV charging loads, their integration into power grids may induce voltage fluctuations and increased active power losses. To address the security and economic requirements of distribution networks, a multi-objective reactive power optimization model is constructed to targeting the minimization of active power loss and voltage deviation. Compared to the objective normalization method, this model achieves more effective coordinated optimization of multiple objectives.

4.1. Objective Function

(1) Active grid loss
Distribution network active loss is [29]
min P loss = i ,   j Ω N G i , j ( U i 2 + U j 2 2 U i U j cos θ i , j )
where Ploss is the system network loss, Gi,j is the branch conductance of node i and j, ΩN is the node set of distribution network, Ui and Uj are the voltage amplitude of node i and node j, respectively, and θi,j is the voltage phase difference between node i and node j.
(2) Node voltage deviation
min Δ U = min i = 1 N Δ U i U i , max U i , min
where N is the number of nodes, ∆Ui is the voltage deviation of node i, and Ui,max and Ui,min are the upper and lower limits of the voltage deviation, respectively.

4.2. Constraint Conditions

(1) Power flow equality constraint
P g r i d + P D G i Ω N P l o a d , i = U i j = 1 n U j ( G i , j cos θ i , j + B i ,   j sin θ i , j )
Q g r i d + Q D G + Q C i Ω N Q l o a d , i = U i j = 1 n U j ( G i , j sin θ i , j + B i ,   j cos θ i , j )
where Pgrid and Qgrid, respectively, are the active and reactive power injected by the power grid; PDG and QDG, respectively, are the active and reactive power injected by DG; Pload,i and Qload,i, respectively, are the active and reactive power required by the load; Qc is the reactive power of the reactive power compensation device; and Bi,j represents the susceptance of nodes i and j branches.
(2) Node voltage constraint
U i , min U i U i , max
where Ui is the node voltage amplitude, and Ui,max and Ui,min are the upper and lower limits of the node voltage amplitude, respectively.
(3) Reactive power compensation device constraints
Q C , min Q C Q C , max
where QC is the power of the reactive power supplement device, and Qc,max and Qc,min, respectively, are the upper and lower limits of the reactive power compensation device power.
(4) On-load tap changer (OLTC) gear constraint
K min K K max
where K is the OLTC gear, and Kmax and Kmin are the upper and lower limits of the OLTC gear, respectively.

5. MOPSO Algorithm

5.1. Principle of the PSO Algorithm

Particle Swarm Optimization (PSO) is a kind of search algorithm based on group cooperation developed by simulating the foraging behavior of birds. Its basic idea is to find the optimal solution through the cooperation and information sharing among individuals in the group [30].
PSO initializes a group of random particles (random solutions) and then finds the optimal solution according to iteration. In each iteration, the particle updates itself by tracking two extremes: the first is the optimal solution found by the particle itself, which is called the individual extremum; the second is the optimal solution currently found for the entire population, which is called the global extreme value.
When identifying these two optimal values, particles update their velocities and positions according to Equations (24) and (25) [31]:
v i j ( t + 1 ) = ω v i j ( t ) + c 1 r 1 ( t ) [ p i j ( t ) x i j ( t ) ] + c 2 r 2 ( t ) [ p g j ( t ) x i j ( t ) ]
x i j ( t + 1 ) = x i j ( t ) + v i j ( t + 1 )
where ω is the inertia weight; c1 and c2 are learning factors, also known as acceleration constants; pij and pgj are, respectively, the optimal positions found by particle i and the population search; r1 and r2 are uniform random numbers in the range of [0, 1], which increase the randomness of particle flight; i, j = [1,2,…,D], vij is the speed of the particle, vij∈[−vmax,vmax]; and vmax is a constant set by the user to limit the speed of the particle.

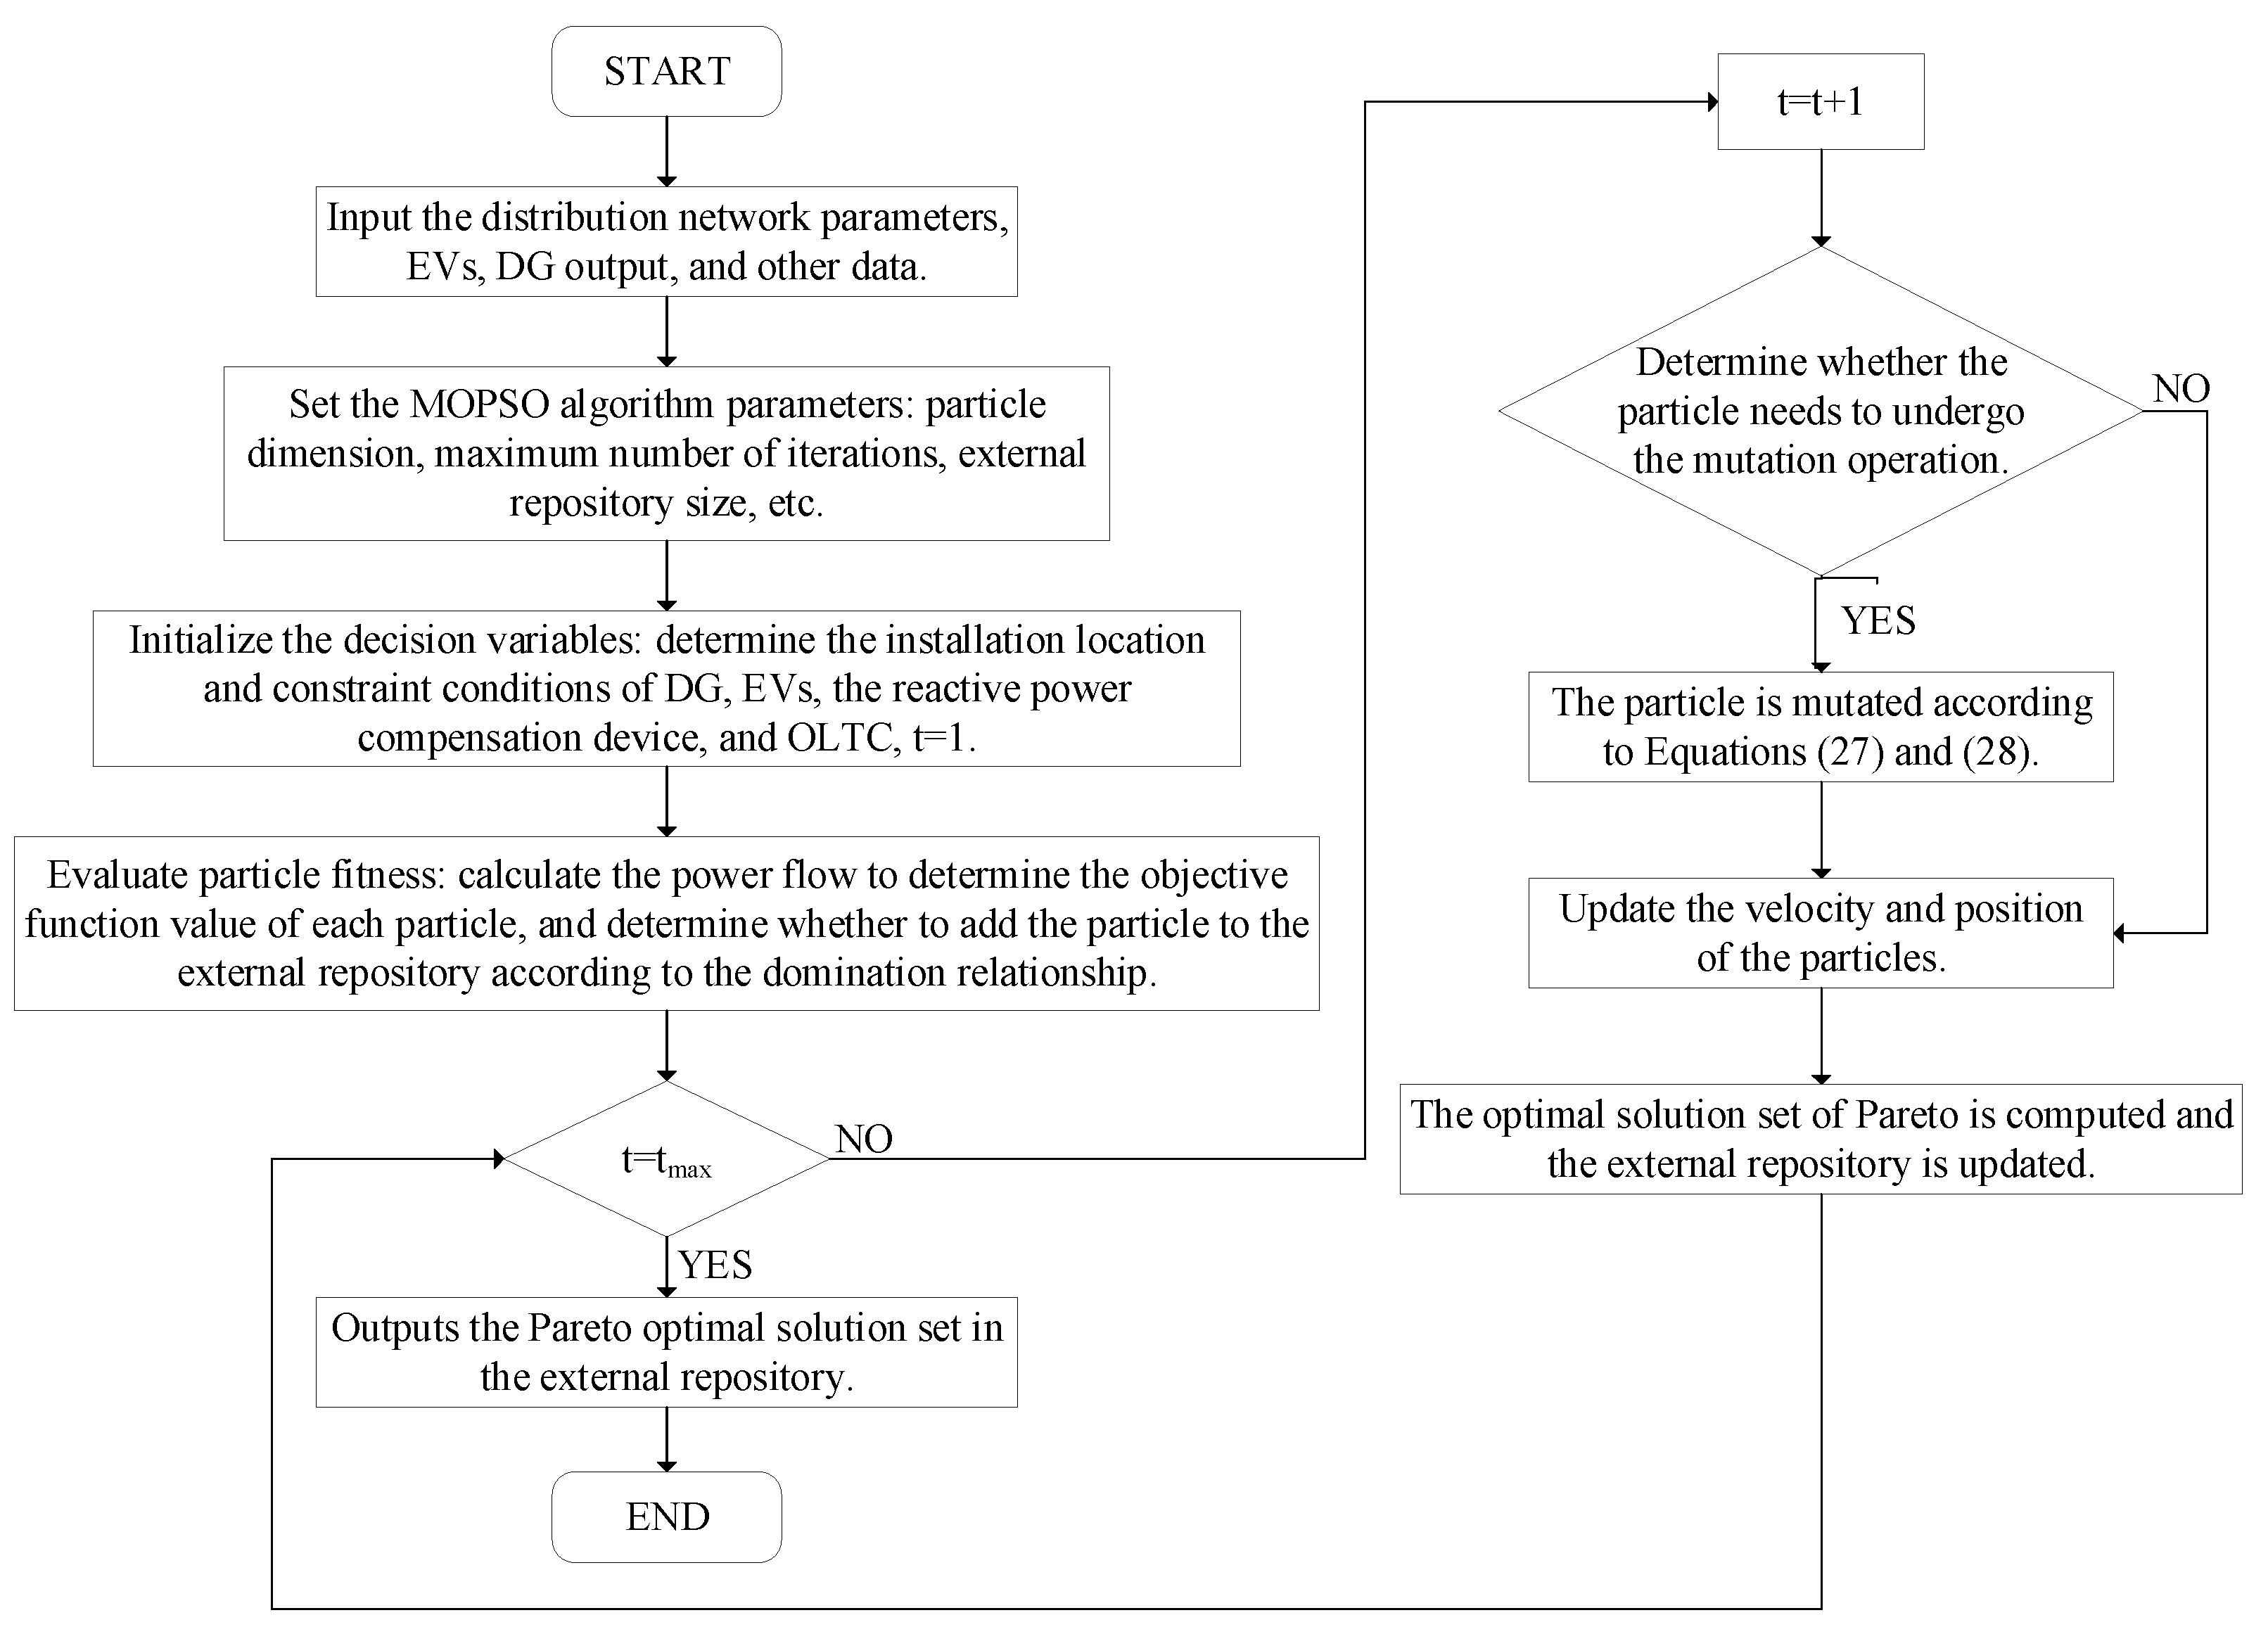
5.2. Principle of the MOPSO Algorithm

PSO is usually used to solve single-objective optimization problems. However, in practical applications, there are often multiple objective functions. Multi-Objective Particle Swarm Optimization (MOPSO) applies PSO, which can only be used for a single objective, to multiple objectives [32]. Compared with the global optimal solution sought by traditional PSO, MOPSO seeks non-inferior solutions and can obtain the Pareto optimal solution set by comparing the dominant relation of each solution [33].
The velocity and position update formula of MOPSO particles is basically similar to that of PSO. The dynamic inertia weight w is incorporated into the MOPSO algorithm to enhance the optimization capabilities. The specific calculation formula is shown in Equation (26):
w = w min + ( ( t max t ) ( w max w min ) ) t max
where wmin is the minimum inertia weight, wmax is the maximum inertia weight, t is the current number of iterations of the particle, and tmax is the maximum number of iterations. At the initial stage of optimization, w is large, and the global optimization ability of particles is strong. In the late stage of optimization, w becomes smaller and smaller, and the local optimization ability of particles is stronger. By introducing the dynamic inertia weight w, the optimization ability of particles can be effectively improved.
The defect of PSO is that it is easy to fall into local optimization. In order to ensure the diversity of the population, variation is added to MOPSO, and the specific steps are as follows:
Step 1—For the current particle x, the disturbance factor p is calculated based on the current number of iterations t, the maximum number of iterations tmax, and the mutation rate m.
p = ( 1 ( t 1 ) ) / ( t max 1 ) ^ ( 1 / m )
Step 2—Obtain a random number rand. If rand < p, one decision variable of the randomly selected particle will be changed, and the other decision variables will remain unchanged. If randp, it remains unchanged.
Step 3—If mutation is required for a particle, first randomly select the jth decision variable obj(j) of particle x, and then compute the perturbation range d based on the perturbation operator.
d = p ( o b j M a x o b j M i n )
where objMax and objMin are the maximum and minimum values of the specified decision variable, respectively.
Step 4—The upper and lower bounds of variation are calculated from d, with the upper bound being ub = obj(j) + d and the lower bound being lb = obj(j) − d. Also, pay attention to the out-of-line handling, and ensure ub = min(ub,objMax) and lb = max(lb,objMin).
Step 5—Finally, according to the range of variation [lb,ub], new decision variables are randomly obtained.
Step 6—After the particle is mutated, comparing whether the mutated particle is better is necessary. If the mutated particle is better, the particle is updated; otherwise, the particle is not updated. Also, compare the new particle and particle pBest. If the new particle is better than pBest, update pBest; otherwise do not update.
The specific optimization flow chart of MOPSO is shown in Figure 3.

6. Example Analysis

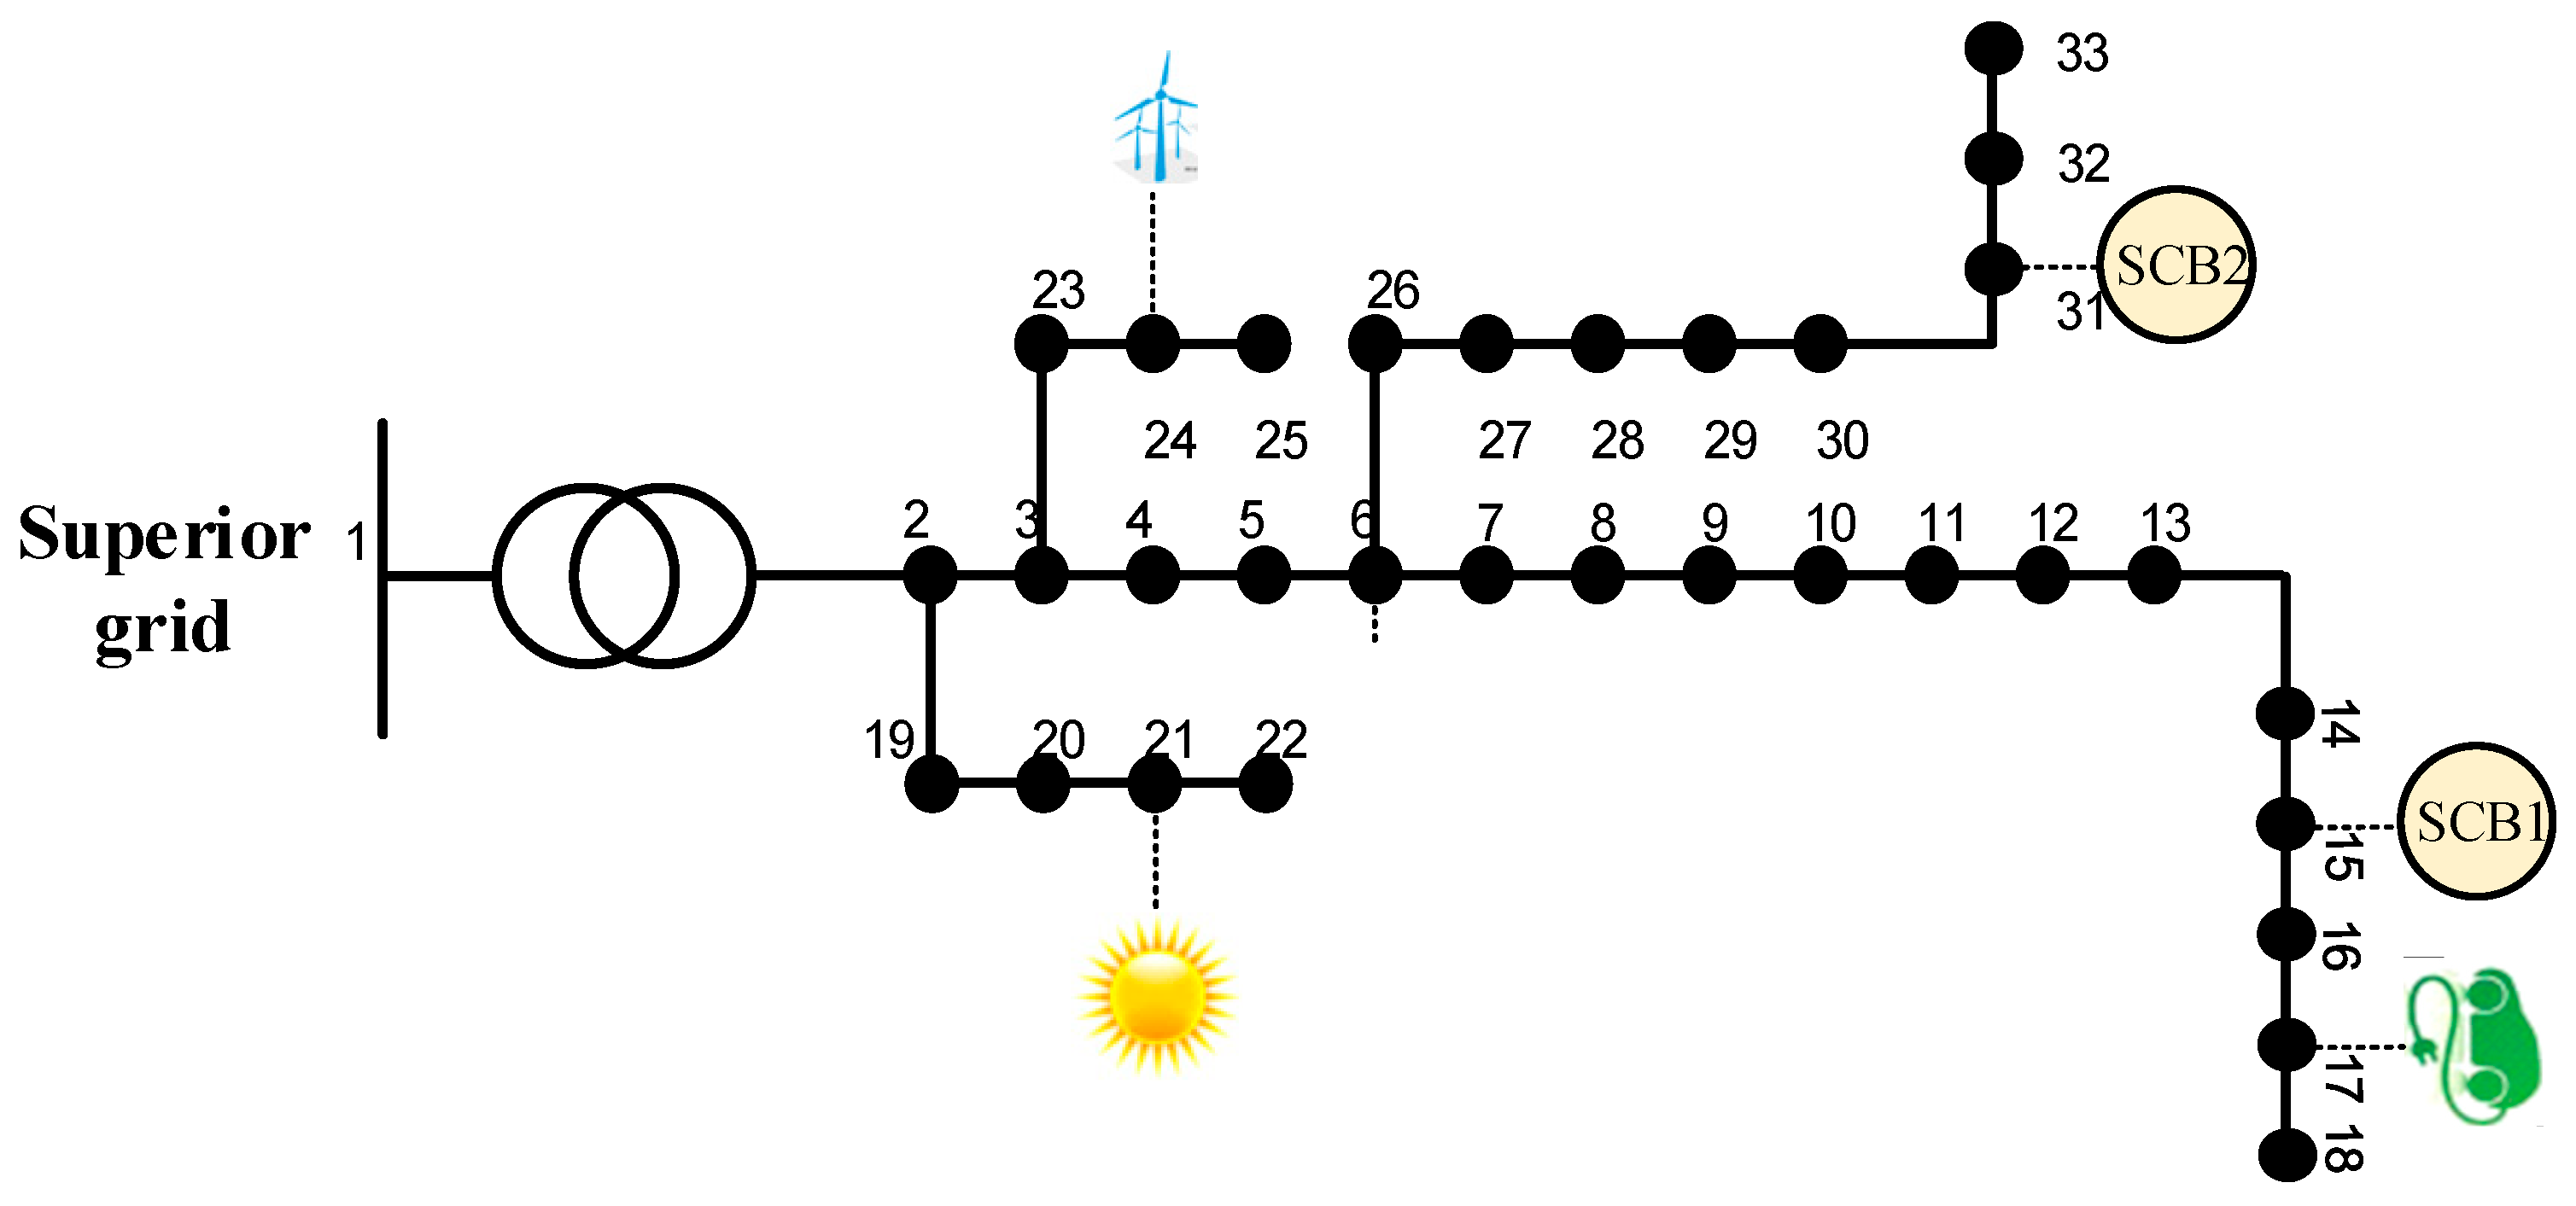
6.1. IEEE 33-Node Example

The IEEE 33-node distribution network system is selected for simulation and verification, and its distribution network structure is shown in Figure 4 [34]. The daily maximum load of the network is 5.3868+j3.4568 MV·A, the line voltage base value is 12.66 kV, the three-phase power base value is 10 MV·A, and the per-unit voltage safe operating range of nodes is set to [0.95, 1.05]. The active power output limit of PVs is 0.3 MW, with 10 PV units connected at node 21. The active power output limit of WTs is 0.3 MW, with 10 WT units connected at node 24. EV loads are connected at node 17. An OLTC is connected between nodes 1 and 2. Reactive power compensators are installed at nodes 15 and 31, with the adjustment range of the reactive power compensators being [0, 800 kvar].

6.2. DG Output and EV Load Profiles

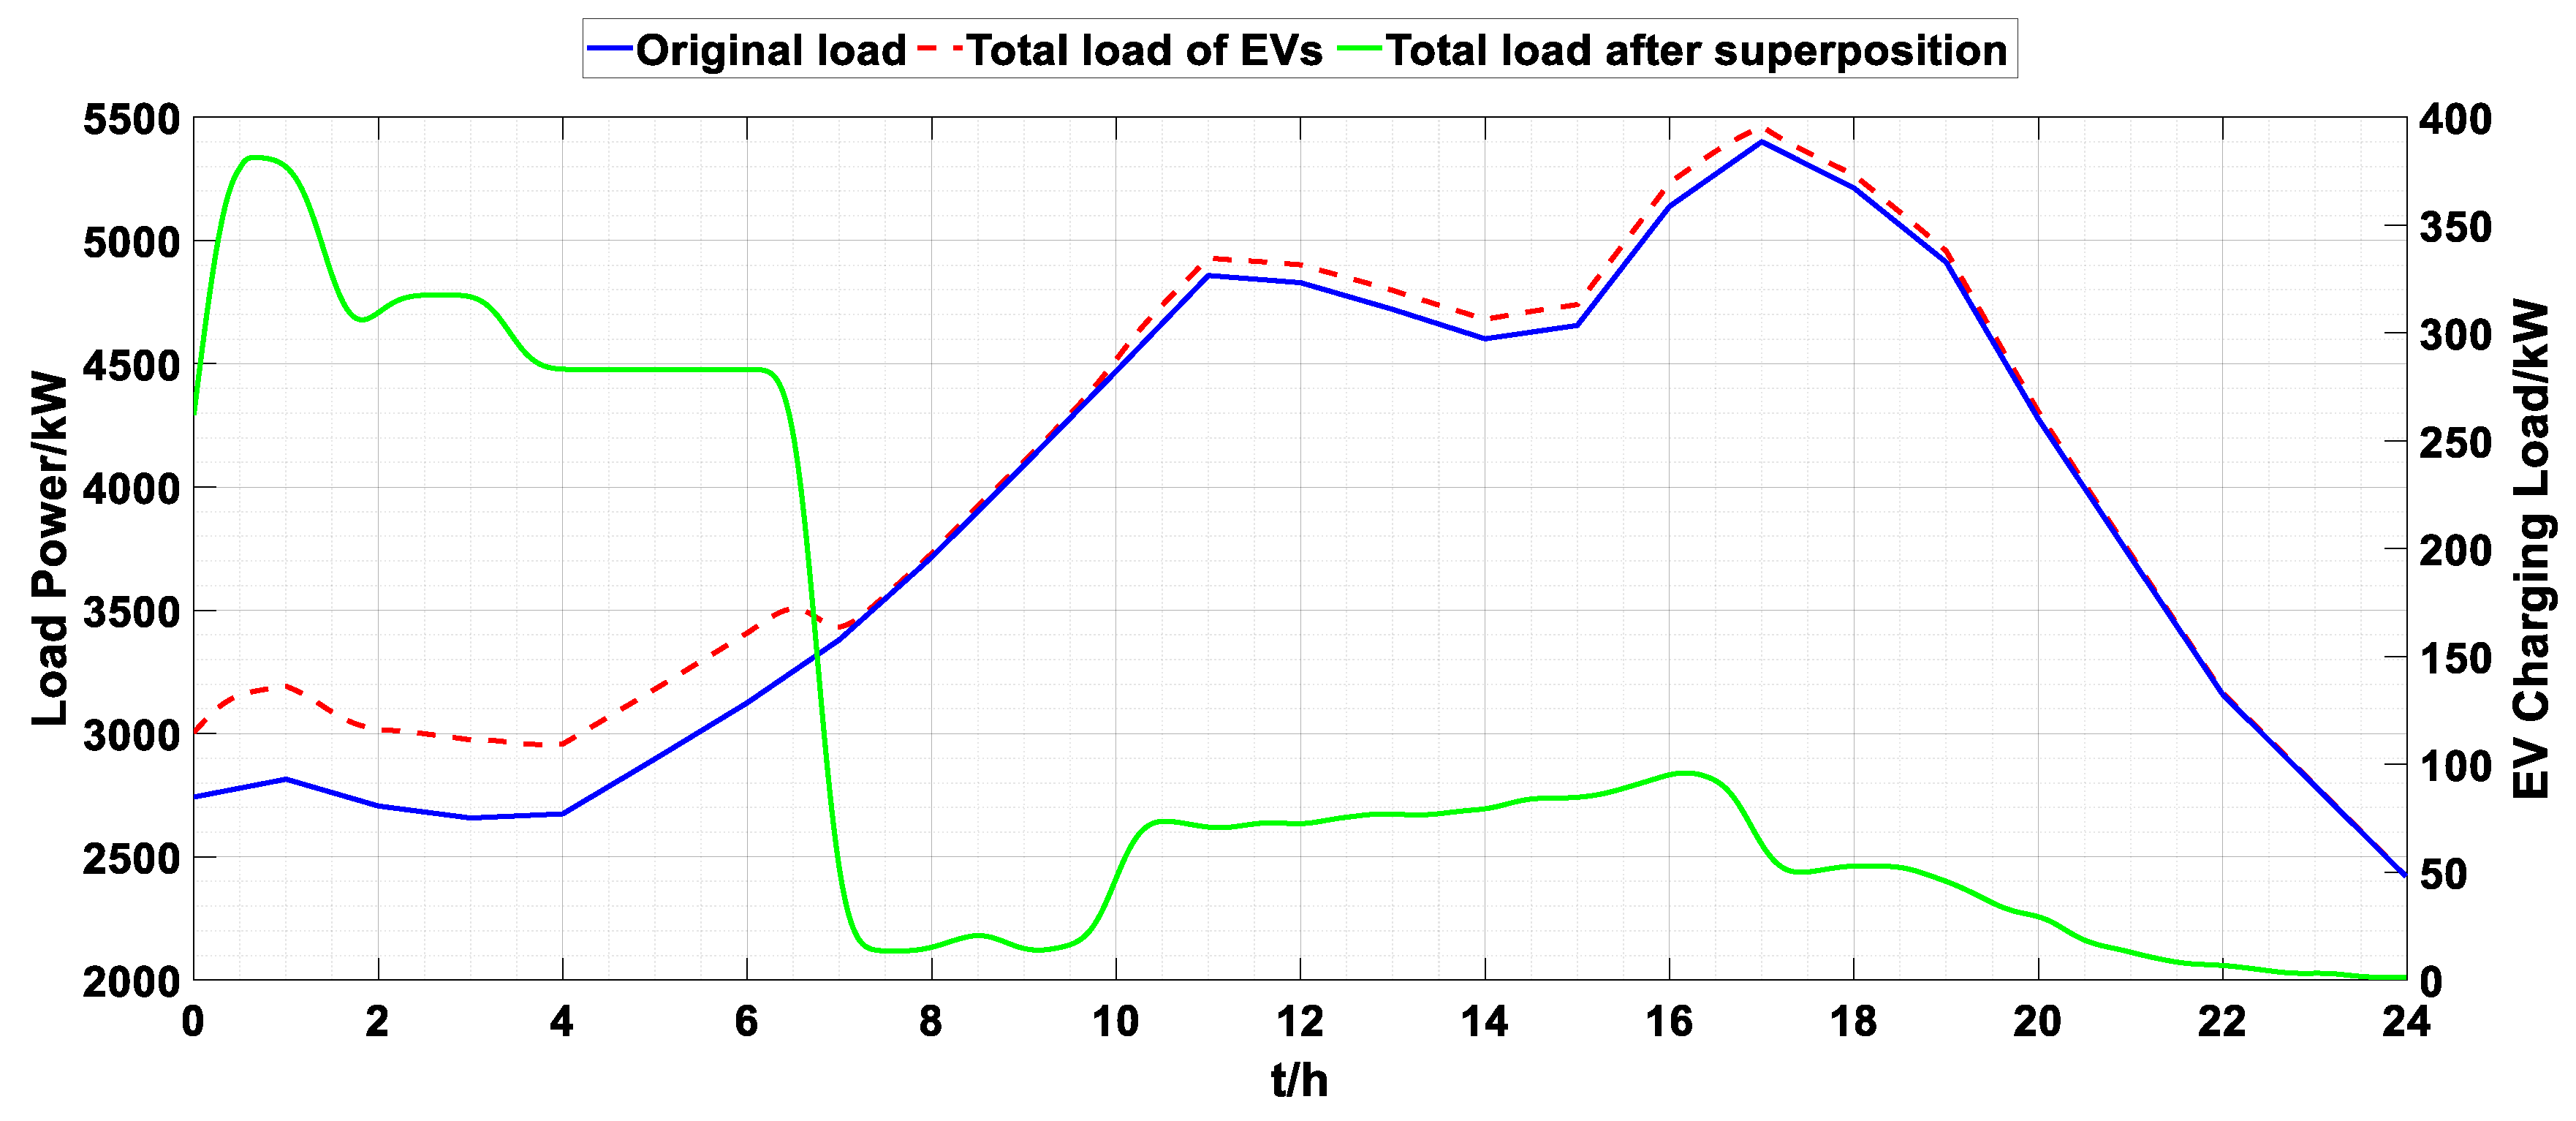
6.2.1. Load Profiles

The valley-hour ordered charging strategy proposed in this study was implemented to regulate EV charging behaviors. After searching for a large amount of information on the internet and industry reports, the time-of-use electricity price structure of a certain area in China shown in Figure 5 was formed, with valley hours identified as 24:00–08:00, based on Figure 5. EVs integrated into the IEEE 33-node system were categorized into four types: taxis, buses, official cars, and private cars. For different EV categories, differentiated charging dispatch strategies were developed based on the operational characteristics and price responsiveness. Taxis, as commercial vehicles with low electricity price sensitivity, have a 20% schedulable capacity limited to nighttime charging loads. Buses exhibit fixed operational patterns, with a 40% dispatchable portion restricted to post-operation charging within one hour after service periods (charging loads occur during both operation and the subsequent interval, but only the latter are dispatchable). Official vehicles demonstrate high flexibility, achieving 70% schedulability with residual loads concentrated in daytime. Private EVs show the strongest price responsiveness, reaching 80% dispatchability while maintaining two concentrated charging peaks during daytime hours and a partial nighttime distribution. This differentiated scheduling strategy aligns with real-world transportation patterns while balancing economic efficiency and grid operational requirements. The specific differentiated charging dispatch strategies are shown in Table 1.
Charging load profiles for all EV types were simulated in MATLAB using the initial parameters (e.g., charging start time distributions and SOC thresholds). The aggregated total EV load curve (Figure 6) was generated by superimposing category-specific profiles, demonstrating an optimized temporal load distribution after strategy implementation.

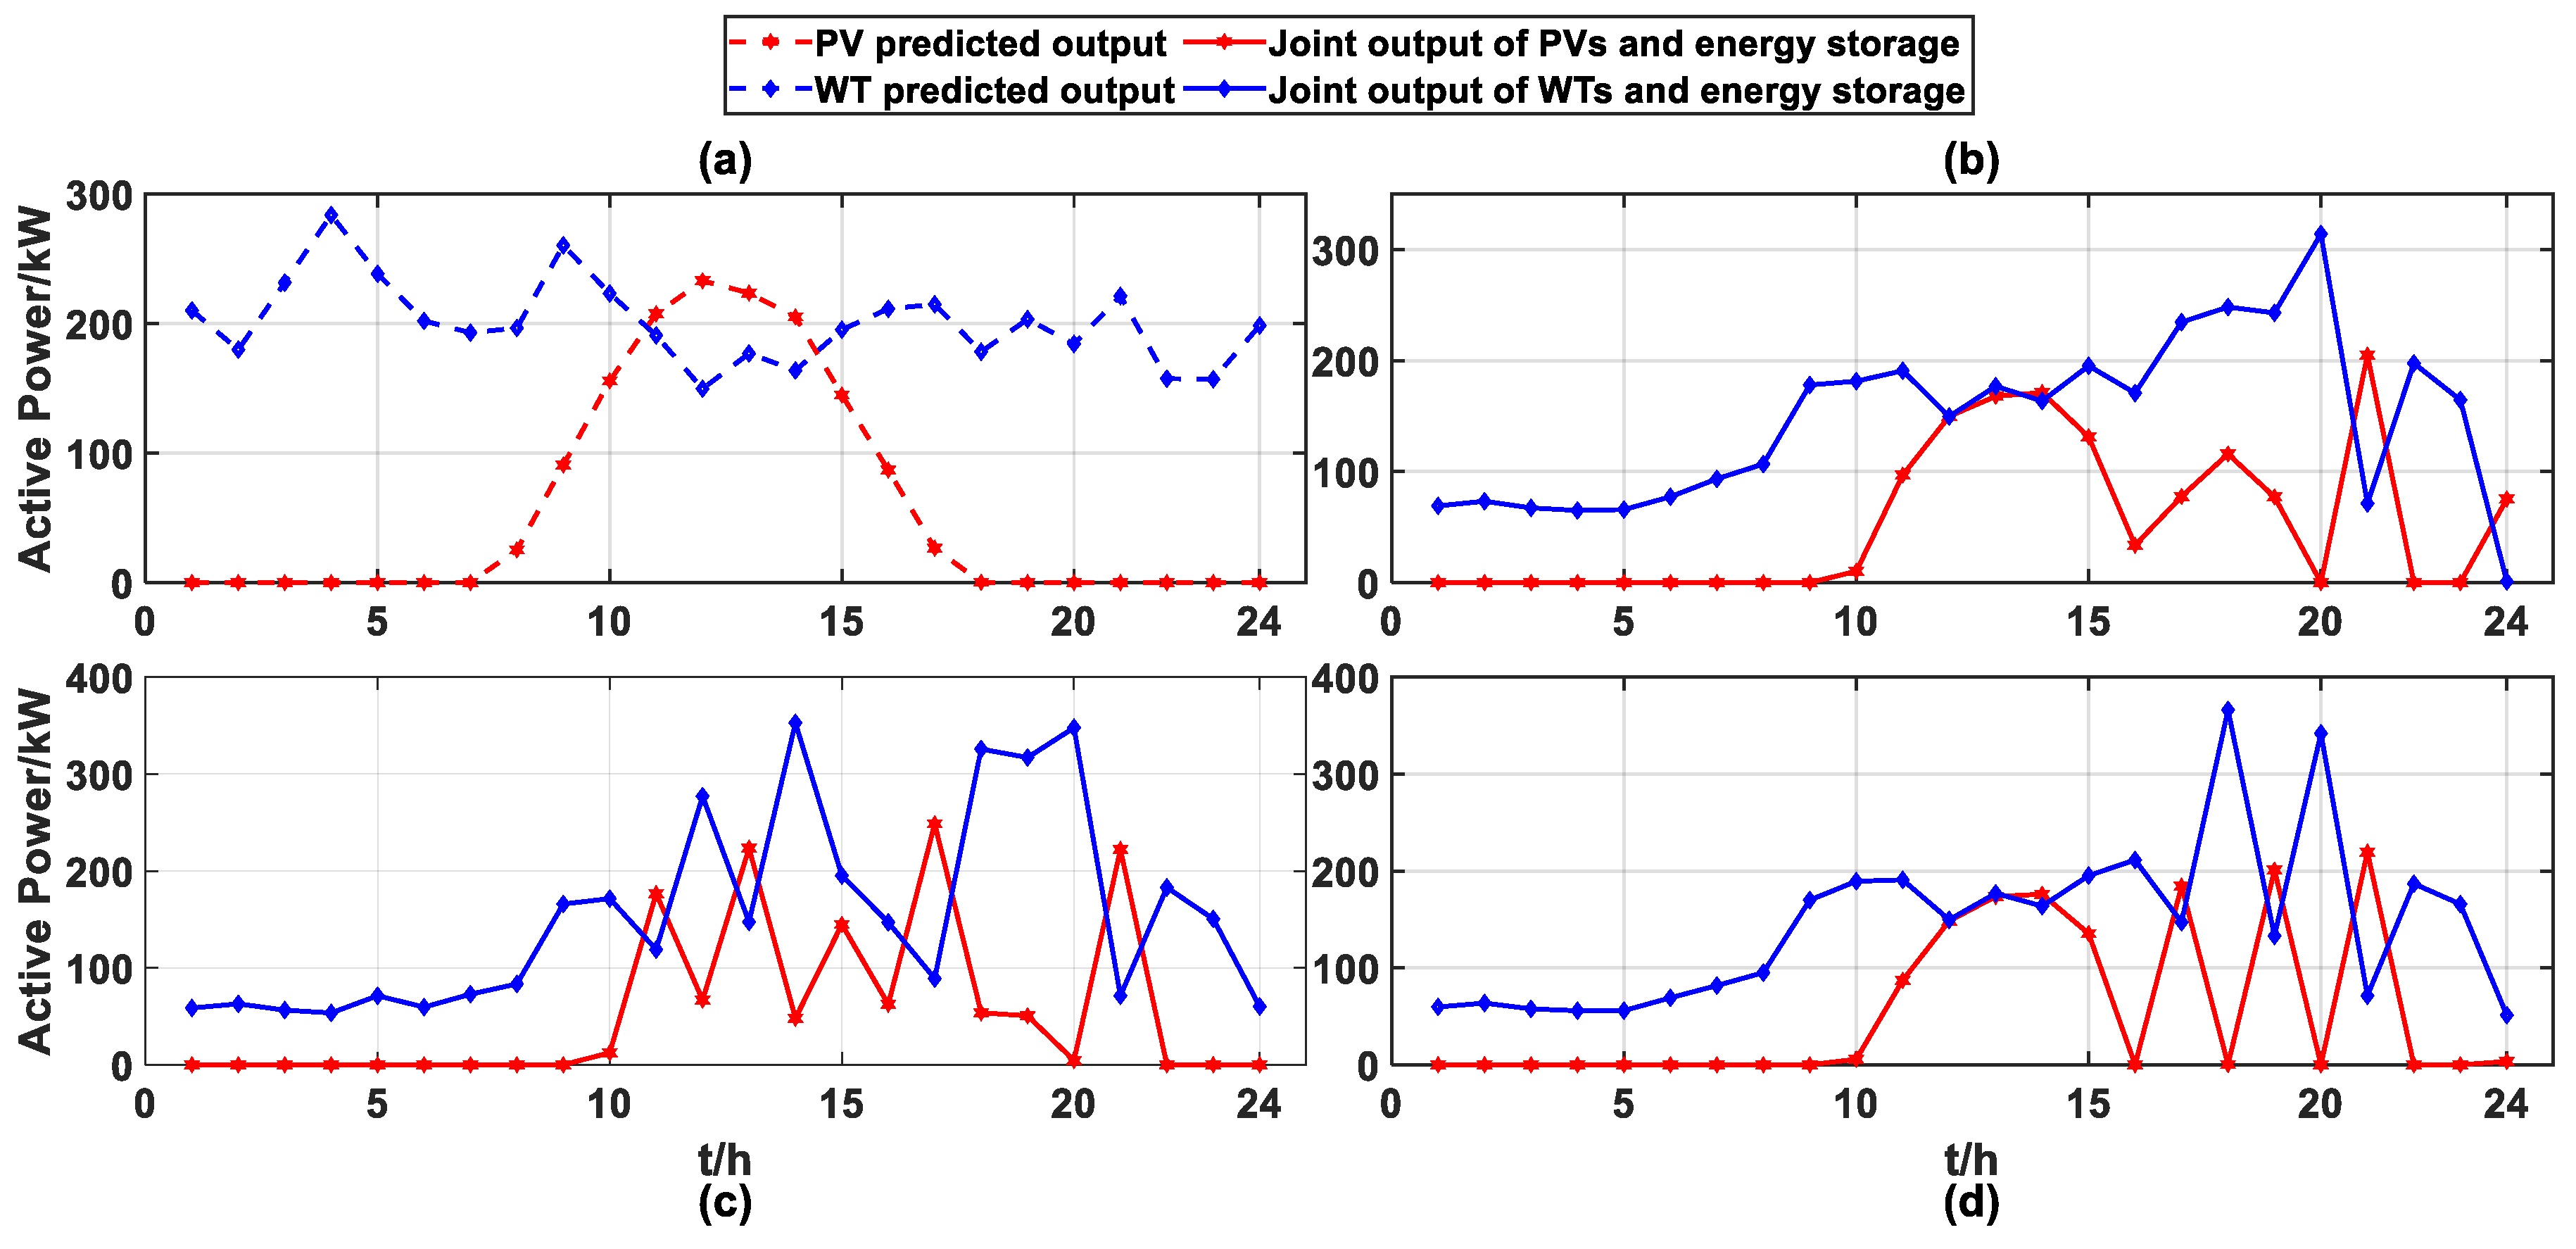
6.2.2. DG Output Profiles

First, the predicted output of DG was obtained using the PV and WT output prediction models proposed in Section 2.1 of this paper. Subsequently, the coordinated electricity trading decision-making model between the electricity retailer and DG generators in Section 3.1 was applied to determine the PV and WT outputs under time-of-use pricing.
The electricity purchase prices negotiated between the retailer and DG generators were determined by the average TOU price and peak-hour prices. As shown in Figure 5, the average TOU price is 751.25 CNY/MWh, with peak-hour prices exceeding 1000 RMB/MWh. Typically, PVs and WTs exhibit price disparities. For WTs, further distinctions exist between onshore and offshore installations, and regional variations also affect PV and WT prices. Consequently, three scenarios were defined for PV and WT purchase prices, as detailed in Table 2. Network loss cost coefficients in the model were set to 0.15 and 0.1, respectively. Based on the load curves, the retailer determines procurement demands and selects power sources (spot market or distributed generators) under different price scenarios via the decision model. By coordinating with PV/WT energy storage systems to manage output, profit maximization is achieved. Due to the presence of nonlinear constraints in energy storage formulations, the IPOPT solver in MATLAB was employed, yielding the coordinated PV–WT–storage output profiles under the three scenarios, as illustrated in Figure 7.
Driven by the time-of-use pricing curve in the electricity spot market, the electricity retailer achieves coordinated economic operation strategies for PV–energy storage systems and WT–energy storage systems through the proposed transaction decision optimization model. Comparative curves between market-optimized output patterns and predicted output patterns indicate the outcomes listed below.
Under the time-of-use pricing mechanism, to maximize their own profits, the output trends of PVs and WTs integrated with energy storage systems are largely consistent. Specifically, during periods of low electricity prices, the outputs of PVs and WTs integrated with energy storage remain low. At this time, the outputs of PVs and WTs are primarily used to charge the energy storage device, and the retailer purchases a small amount of WT power mainly to reduce line loss costs. During periods of high electricity prices, the outputs of PVs and WTs integrated with energy storage increase significantly, with the output in certain time intervals exceeding the total output generated by PVs and WTs during those periods. At this time, the energy storage discharges to meet the load demand. Through this mechanism, the retailer not only maximizes profits but also effectively achieves the “peak-shaving and valley-filling” effect by coordinating with energy storage systems, transferring surplus DG output from low-price valley periods to high-price peak periods. This promotes the integration of renewable energy and contributes to the economic and stable operation of the distribution network.

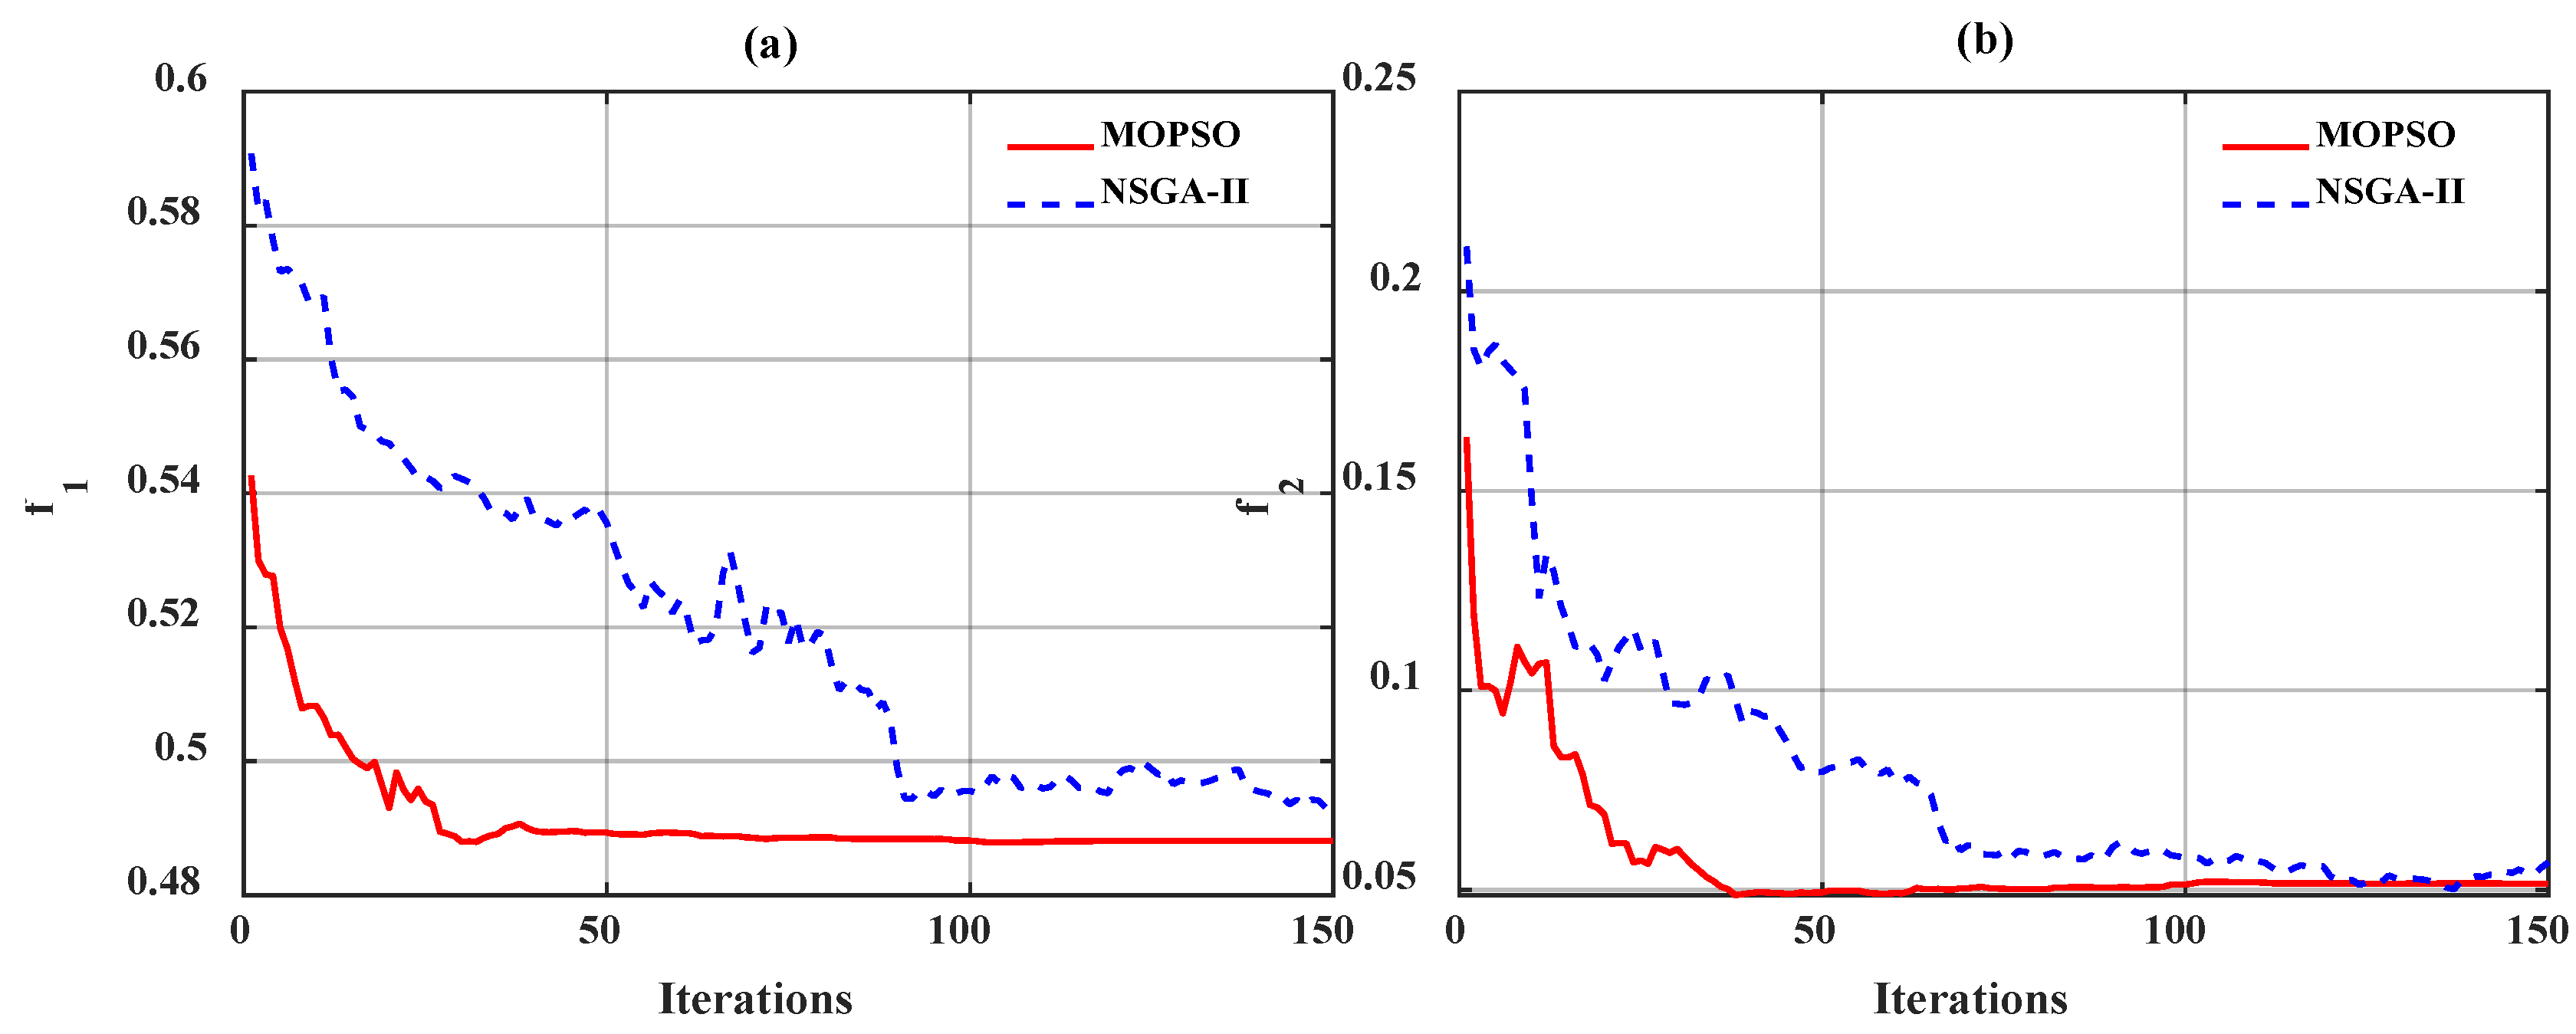
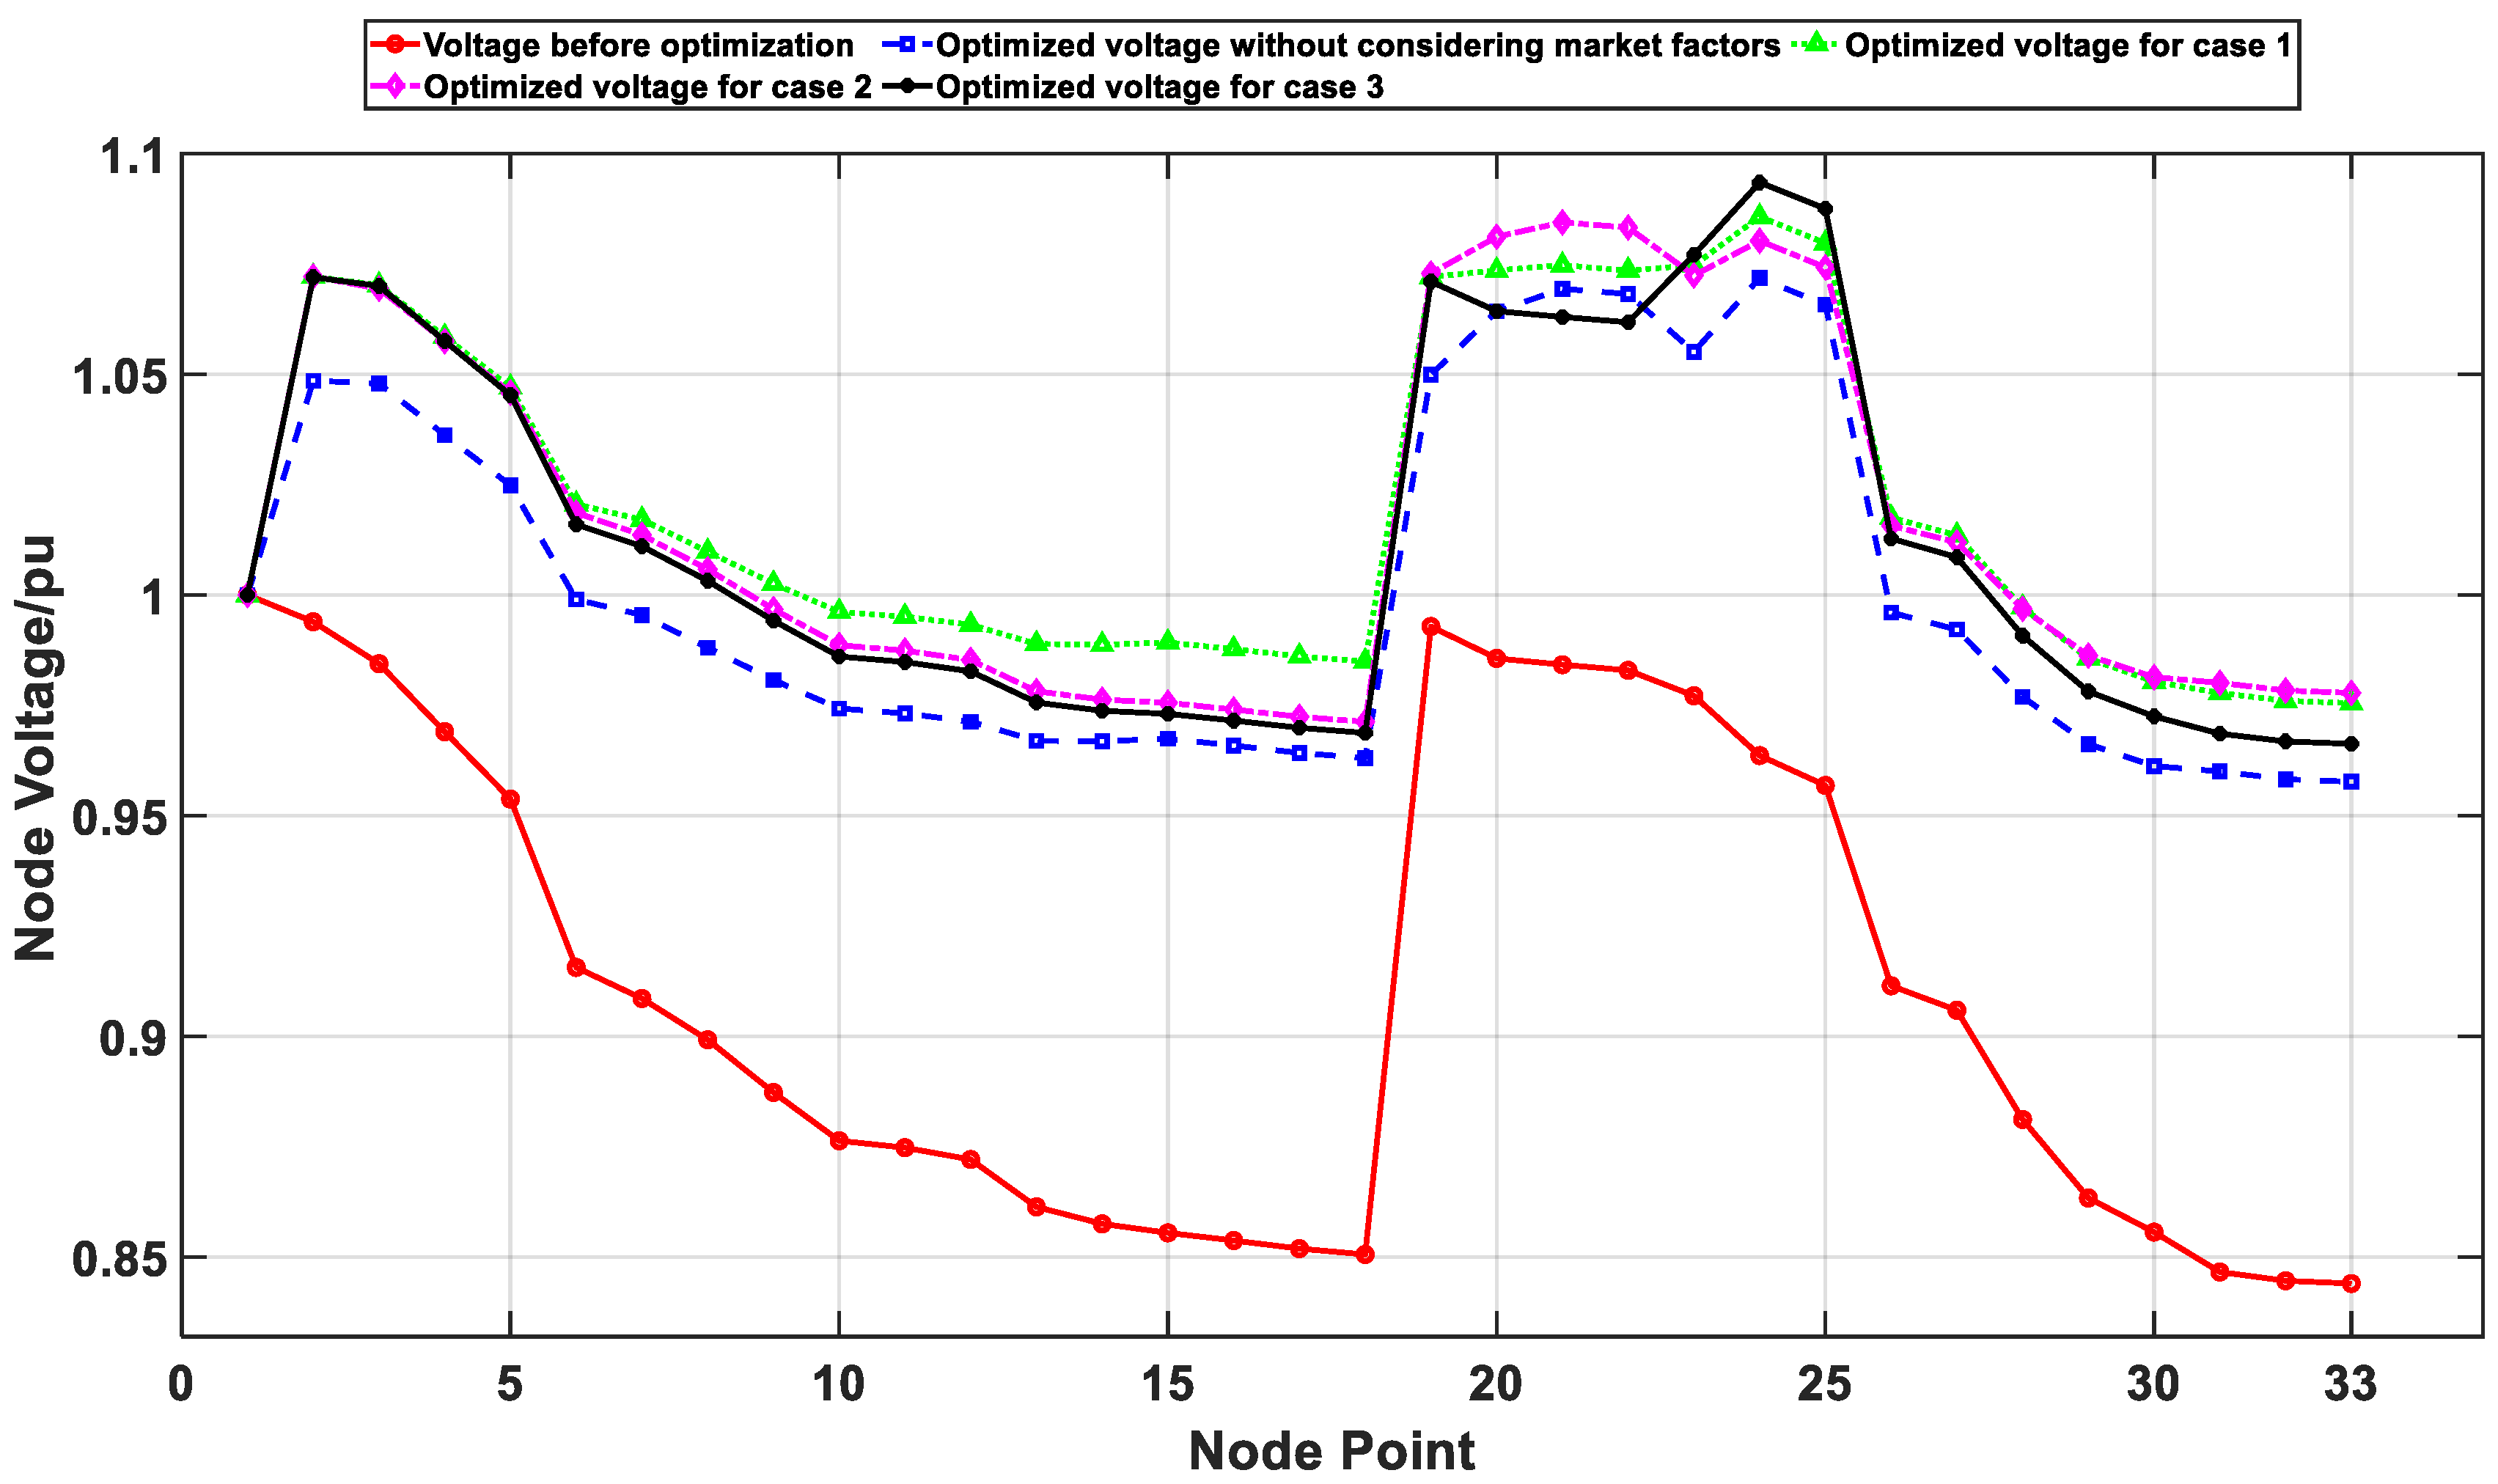
6.3. Optimization Analysis Results

The proposed MOPSO algorithm is solved using Matlab R2022b, with a population size set to 100, a capacity threshold of the Pareto optimal solution set to 100, and a maximum iteration number of 100. The learning factors c1 and c2 are set to 0.1 and 0.2, respectively, the mutation rate is set to 0.1, and the inertia weight is set to 0.5.
To demonstrate the superiority of the proposed model, the performance of the MOPSO and NSGA-II is compared, and the outer solutions of the two targets are selected for evaluation. The outer solution refers to the solution when a certain target component in the Pareto solution set is optimal in each iteration process. By comparing the change process of the outer solution of a certain target component during the iteration process and the size of the final generation, the convergence and robustness of the algorithm can be seen. The convergence curves of the outer solutions of the two algorithms are shown in Figure 8.
In the process of multi-objective optimization, balancing the conflict relationships among various objective functions is the core challenge. In this paper, for the collaborative optimization problem of voltage deviation and network loss, firstly, the non-inferior solution set is screened based on the Pareto dominance relationship. Then, the grid density method is adopted to ensure the diversity of the Pareto front. In the decision-making stage, considering the perspective of power grid safety, the differentiated weight coefficients (1.0 and 0.8) of voltage deviation and network loss are assigned to prioritize the guarantee of voltage stability requirements, achieving a balance between safety and economy.
The Pareto optimal frontier (Pareto efficient boundary), rooted in economic Pareto efficiency theory, defines a non-dominated solution set in multi-objective optimization where any improvement in one objective necessitates degradation in others, representing the optimal trade-off configuration between competing goals [35]. The Pareto optimal fronts under four scenarios shown in Figure 9. Figure 10 and Figure 11, respectively, show the reactive power output and OLTC ratio of the SCB of the IEEE33-node system.
The PV and WT outputs before considering the market factors and the PV and WT outputs under the three optimized scenarios after considering the market factors were separately input into the IEEE 33-node system for reactive power optimization using MOPSO. The optimization results are shown in Table 3 and Figure 12.
Through a quantitative analysis of the reactive power optimization results, the mechanism of the effects of market factors on voltage regulation can be revealed. Through the comparison of the above data, it is indicated that after the introduction of the time-of-use electricity price mechanism, the reactive power optimization performance of the PV–WT–storage integrated system exhibits significant characteristics.
Compared with the optimization scheme that does not consider market factors, the combined optimization mode of wind, solar, and energy storage can further improve the voltage stability and has a certain promoting effect on the increase in node voltage. Compared with the voltage optimization results without considering market factors, the average voltage standard deviations under the three different working conditions of case 1, case 2, and case 3 were further reduced by 9.7%, 8.2%, and 9.6%, respectively, verifying the promoting effect of the market mechanism on voltage stability. From the perspective of the increase in voltage amplitude, the voltage amplitudes under the three working conditions have all improved to a certain extent compared with the optimization results without considering market factors, which further verifies the correctness of the model proposed in Section 3.1.
Empirical research shows that the market-driven coordinated operation of wind, solar, and energy storage can generate multiple optimization benefits. The system guides the charging and discharging sequence of energy storage through price signals to effectively reduce voltage fluctuations and compensates for load demand through the “peak-shaving and valley-filling” effect of DG to a certain extent, which can promote an increase in voltage. This verifies the deep coupling law between the electricity market mechanism and the physical characteristics of the power grid, providing a theoretical basis for the construction of a new type of power system.
The network loss results after MOPSO optimization are shown in Table 4 and Figure 13.
The quantitative analysis of the market mechanism-based PV-WT-storage coordinated loss reduction effect demonstrates that reactive power optimization without considering market factors reduced the average network loss of the system by 30.18% (from 296.9 kW to 207.3 kW), verifying the effectiveness of the traditional optimization methods. After the introduction of the time-of-use electricity price mechanism, cases 1/2/3 achieved reductions of 39.74%, 35.16%, and 37.42% in network losses, respectively, which were additional increases of 4.98–9.56 percentage points compared with the traditional model. This efficiency improvement stems from the optimization and regulation of the charging and discharging sequence of energy storage by market signals, which enhances the reactive power support strength during the sensitive period of network loss.
Case 1 demonstrated the optimal loss reduction effect (178.9 kW), mainly due to the fact that the power purchase cost of WTs in case 1 was 5.9% lower than that of PVs (800 vs. 850 CNY/MWh), guiding power sales companies to give priority to purchasing WTs (with the proportion of nighttime output reaching 68%). Because WTs have the characteristic of continuous output for 24 h, their reactive power regulation contribution duration is longer than that of PVs, forming a continuous voltage support effect.
The sudden drop in network loss during the 16:00 period reveals the market–physical coupling law. From the load curve, it can be seen that the load is relatively low at 16:00. In addition, from the time-of-use electricity price curve, it can be seen that 16:00 is a rather special time, with high electricity prices both before and after it. This period is in the transition zone of the dual-peak electricity price structure. During this period, the output of the combined PV and WT energy storage will be relatively high, and so the reactive power optimization effect during this period will be better. Therefore, the network loss will be suddenly reduced. The voltage optimization result graph at 16:00 is shown in Figure 14. It can be seen that after considering the market factors, compared with the optimization result without considering the market factors, the voltage at each node has been significantly increased further.
This study proposes a market-driven collaborative optimization paradigm for renewable energy systems, providing an implementable solution for high-penetration renewable energy systems. By constructing a price–output coordinated optimization model, it achieves the organic integration of electricity commodity attributes and grid operational principles, innovatively establishes a dynamic trading mechanism between electricity retailers and DG operators, and effectively activates the spatiotemporal regulation potential of energy storage systems. The research results establish a management mode of “economic incentives—output optimization—grid security,”, providing theoretical foundations for the coordinated evolution of electricity market rules and grid operational standards. While safeguarding market entities’ interests, it significantly enhances system voltage stability and the renewable energy accommodation capacity, holding significant practical value for advancing unified electricity market development and accelerating the transition to new power systems.

7. Conclusions

Traditional single-dimensional optimization paradigms are overcome through the innovative establishment of a “market–physical” collaborative framework, with a three-level methodology being developed: first, designing a multi-agent transaction mechanism driven by dynamic electricity prices and embedding network loss costs and voltage sensitivity into market models to achieve dynamic balance between economic objectives and security constraints; second, establishing differentiated EV scheduling strategies and analyzing the response characteristics of multiple types of vehicles through charging demand elasticity matrices to precisely align load profiles with peak-shaving requirements; and third, developing improved multi-objective optimization algorithms to enhance DG coordination efficiency. This framework provides systematic solutions for high-penetration renewable energy distribution networks.
The intrinsic coupling mechanisms between price signals and grid security are identified through a systematic analysis. By guiding energy storage charging/discharging schedules via time-of-use pricing, the system prioritizes storage charging during low-price periods to suppress voltage fluctuations and discharges storage during peak periods to strengthen reactive power support, forming a collaborative mechanism between market incentives and physical regulation. Simulation verifications demonstrate that this method effectively reduces load peak–valley differences, improves the voltage distribution uniformity, and significantly enhances the renewable energy accommodation capacity.
Addressing challenges from large-scale EV integration, the proposed classification-based scheduling strategy overcomes the rigid constraints of traditional orderly charging. By constructing spatiotemporal response models for four vehicle types (e.g., taxis and buses), dynamic alignment between user demands and grid peak-shaving capabilities is achieved. This approach safeguards user charging rights while reshaping load curves, offering a new paradigm for flexible load participation in market regulation.
A theoretical path is established for “economy–security” coordinated optimization in new power systems, with multi-faceted practical value: providing electricity retailers with dynamic trading decision tools to activate energy storage’s spatiotemporal regulation potential; equipping grid operators with market–signal-integrated optimization algorithms to strengthen resilience under high renewable penetration; and offering policymakers wind–PV coordination reference metrics to drive the synergistic evolution of market rules and grid standards. The systematic framework proposed here provides theoretical foundations for building a unified electricity market and advancing the energy transition.

Author Contributions

Investigation, D.J.; resources, D.J.; software, D.J.; visualization, D.J.; data curation, D.J.; writing—original draft, Z.R.; supervision, Z.R.; reviewing, Z.R.; editing, K.L.; project administration, K.L.; formal analysis, K.L. All authors have read and agreed to the published version of the manuscript.

Funding

This work was supported by the project “Research on in-depth analysis and control technology of active distribution network line losses for multi-party interaction in the distributed generation market” [grant numbers 5400-202319202A-1-1-ZN].

Data Availability Statement

The data are contained within the article.

Conflicts of Interest

Authors Dongli Jia, Zhaoying Ren and Keyan Liu were employed by the company China Electric Power Research Institute Co., Ltd. The authors declare no conflicts of interest.

References

  1. Abdel-Mawgoud, H.; Ali, A.; Kamel, S.; Rahmann, C.; Abdel-Moamen, M.A. A modified manta ray foraging optimizer for planning inverter-based photovoltaic with battery energy storage system and wind turbine in distribution networks. IEEE Access 2021, 9, 91062–91079. [Google Scholar] [CrossRef]
  2. Mathew, M.S.; Kolhe, M.L.; Kandukuri, S.T.; Omlin, C.W. Data driven approach for the management of wind and solar energy integrated electrical distribution network with high penetration of electric vehicles. J. Clean. Prod. 2023, 421, 138467. [Google Scholar] [CrossRef]
  3. Mu, Q.; Gao, Y.; Yang, Y.; Liang, H. Design of power supply package for electricity sales companies considering user side energy storage configuration. Energies 2019, 12, 3219. [Google Scholar] [CrossRef]
  4. Liu, H.; Wang, L.; Li, J.; Shao, L.; Zhang, D. Research on Smart Power Sales Strategy Considering Load Forecasting and Optimal Allocation of Energy Storage System in China. Energies 2023, 16, 3341. [Google Scholar] [CrossRef]
  5. Michalski, M.; Polański, J.; Nemś, M. Storing Electric Energy Generated by a Photovoltaic Installation to Increase Profit from Its Sale—Case Study in Poland. Sustainability 2024, 16, 5635. [Google Scholar] [CrossRef]
  6. Ren, Z.; Guo, H.; Yang, P.; Zuo, G.; Zhao, Z. Bi-level optimal allocation of flexible resources for distribution network considering different energy storage operation strategies in electricity market. IEEE Access 2020, 8, 58497–58508. [Google Scholar] [CrossRef]
  7. Ehsan, A.; Yang, Q. Coordinated investment planning of distributed multi-type stochastic generation and battery storage in active distribution networks. IEEE Trans. Sustain. Energy 2018, 10, 1813–1822. [Google Scholar] [CrossRef]
  8. Liu, H.; Li, J.; Ge, S.; He, X.; Li, F.; Gu, C. Distributed day-ahead peer-to-peer trading for multi-microgrid systems in active distribution networks. IEEE Access 2020, 8, 66961–66976. [Google Scholar] [CrossRef]
  9. Zhao, J.; Wang, W.; Guo, C. Hierarchical optimal configuration of multi-energy microgrids system considering energy management in electricity market environment. Int. J. Electr. Power Energy Syst. 2023, 144, 108572. [Google Scholar] [CrossRef]
  10. Vahidinasab, V. Optimal distributed energy resources planning in a competitive electricity market: Multiobjective optimization and probabilistic design. Renew. Energy 2014, 66, 354–363. [Google Scholar] [CrossRef]
  11. Wang, G.; Tan, Z.; Lin, H.; Tan, Q.; Yang, S.; Ju, L.; Ren, Z. Multi-level market transaction optimization model for electricity sales companies with energy storage plant. Energies 2019, 12, 145. [Google Scholar] [CrossRef]
  12. Jin, C.; Tang, J.; Ghosh, P. Optimizing electric vehicle charging with energy storage in the electricity market. IEEE Trans. Smart Grid 2013, 4, 311–320. [Google Scholar] [CrossRef]
  13. Yang, S.; Wang, X.; Yang, Y.; Li, J. Bi-level planning model of distributed PV-energy storage system connected to distribution network under the coordinated operation of electricity-carbon market. Sustain. Cities Soc. 2023, 89, 104347. [Google Scholar] [CrossRef]
  14. Filip, R.; Püvi, V.; Paar, M.; Lehtonen, M. Analyzing the impact of EV and BESS deployment on PV hosting capacity of distribution networks. Energies 2022, 15, 7921. [Google Scholar] [CrossRef]
  15. Manbachi, M.; Sadu, A.; Farhangi, H.; Monti, A.; Palizban, A.; Ponci, F.; Arzanpour, S. Impact of EV penetration on Volt–VAR Optimization of distribution networks using real-time co-simulation monitoring platform. Appl. Energy 2016, 169, 28–39. [Google Scholar] [CrossRef]
  16. Xu, B.; Zhang, G.; Li, K.; Li, B.; Chi, H.; Yao, Y.; Fan, Z. Reactive power optimization of a distribution network with high-penetration of wind and solar renewable energy and electric vehicles. Prot. Control Mod. Power Syst. 2022, 7, 51. [Google Scholar] [CrossRef]
  17. Li, Z.; Xiong, J. Reactive Power Optimization in Distribution Networks of New Power Systems Based on Multi-Objective Particle Swarm Optimization. Energies 2024, 17, 2316. [Google Scholar] [CrossRef]
  18. Xia, L.; Lin, X.; Zhou, R.; Zhang, K. Research on Multi-Objective Reactive Power Optimization of Distribution Grid with Photovoltaics. World Electr. Veh. J. 2025, 16, 70. [Google Scholar] [CrossRef]
  19. Dharavat, N.; Sudabattula, S.K.; Velamuri, S.; Mishra, S.; Sharma, N.K.; Bajaj, M.; Elgamli, E.; Shouran, M.; Kamel, S. Optimal allocation of renewable distributed generators and electric vehicles in a distribution system using the political optimization algorithm. Energies 2022, 15, 6698. [Google Scholar] [CrossRef]
  20. Zhu, X.; Han, H.; Gao, S.; Shi, Q.; Cui, H.; Zu, G. A multi-stage optimization approach for active distribution network scheduling considering coordinated electrical vehicle charging strategy. IEEE Access 2018, 6, 50117–50130. [Google Scholar] [CrossRef]
  21. Liu, J.; Wang, H.; Du, Y.; Lu, Y.; Wang, Z. Multi-objective optimal peak load shaving strategy using coordinated scheduling of EVs and BESS with adoption of MORBHPSO. J. Energy Storage 2023, 64, 107121. [Google Scholar] [CrossRef]
  22. Gong, L.; Wang, X.; Tian, M.; Yao, H.; Long, J. Multi-objective optimal planning for distribution network considering the uncertainty of PV power and line-switch state. Sensors 2022, 22, 4927. [Google Scholar] [CrossRef]
  23. Barutcu, I.C. Examination of the chance constrained optimal wt penetration level in distorted distribution network with wind speed and load uncertainties. Eng. Technol. Appl. Sci. Res. 2021, 11, 7311–7320. [Google Scholar] [CrossRef]
  24. Ozay, C.; Celiktas, M.S. Statistical analysis of wind speed using two-parameter Weibull distribution in Alaçatı region. Energy Convers. Manag. 2016, 121, 49–54. [Google Scholar] [CrossRef]
  25. Qian, K.; Zhou, C.; Allan, M.; Yuan, Y. Modeling of load demand due to EV battery charging in distribution systems. IEEE Trans. Power Syst. 2010, 26, 802–810. [Google Scholar] [CrossRef]
  26. Eyer, J.; Corey, G. Energy storage for the electricity grid: Benefits and market potential assessment guide. Sandia Natl. Lab. 2010, 20, 5. [Google Scholar]
  27. Shi, Z.; Wang, W.; Huang, Y.; Li, P.; Dong, L. Simultaneous Optimization of Renewable Energy and Energy Storage Capacity with the Hierarchical Control. CSEE J. Power Energy Syst. 2020, 8, 95–104. [Google Scholar]
  28. Liu, H.; Ge, S. Optimization of TOU Price of Electricity Based on Electric Vehicle Orderly Charge. In Proceedings of the 2013 IEEE Power & Energy Society General Meeting (PESGM 2013), Vancouver, BC, Canada, 21–25 July 2013; IEEE: Piscataway, NJ, USA, 2013; pp. 1–5. [Google Scholar]
  29. Yu, L.; Zhang, L.; Meng, G.; Zhang, F.; Liu, W. Research on Multi-Objective Reactive Power Optimization of Power Grid with High Proportion of New Energy. IEEE Access 2022, 10, 116443–116452. [Google Scholar]
  30. Coello, C.A.C.; Pulido, G.T.; Lechuga, M.S. Handling Multiple Objectives with Particle Swarm Optimization. IEEE Trans. Evol. Comput. 2004, 8, 256–279. [Google Scholar] [CrossRef]
  31. Fu, C.; Liu, J.; Zeng, J.; Ma, M. Adaptive Reactive Power Optimization in Offshore Wind Farms Based on an Improved Particle Swarm Algorithm. Electronics 2024, 13, 1637. [Google Scholar] [CrossRef]
  32. Coello, C.A.C.; Lechuga, M.S. MOPSO: A proposal for multiple objective particle swarm optimization. In Proceedings of the 2002 Congress on Evolutionary Computation (CEC’02), Honolulu, HI, USA, 12–17 May 2002; Volume 2, pp. 1051–1056. [Google Scholar]
  33. Niknam, T.; Meymand, H.Z.; Mojarrad, H.D. A practical multi-objective PSO algorithm for optimal operation management of distribution network with regard to fuel cell power plants. Renew. Energy 2011, 36, 1529–1544. [Google Scholar] [CrossRef]
  34. Adetunji, K.E.; Hofsajer, I.W.; Abu-Mahfouz, A.M.; Cheng, L. An optimization planning framework for allocating multiple distributed energy resources and electric vehicle charging stations in distribution networks. Appl. Energy 2022, 322, 119513. [Google Scholar] [CrossRef]
  35. Kuang, H.; Su, F.; Chang, Y.; Wang, K.; He, Z. Reactive power optimization for distribution network system with wind power based on improved multi-objective particle swarm optimization algorithm. Electr. Power Syst. Res. 2022, 213, 108731. [Google Scholar]
Figure 1. EV charging load calculation flowchart.
Energies 18 03209 g001
Figure 2. PV and WT joint energy storage transaction decision flowchart.
Energies 18 03209 g002
Figure 3. MOPSO reactive power optimization flowchart.
Energies 18 03209 g003
Figure 4. IEEE 33-node distribution network system.
Energies 18 03209 g004
Figure 5. Time-of-use price curve.
Energies 18 03209 g005
Figure 6. Daily load curve.
Energies 18 03209 g006
Figure 7. The combined energy storage output curves of PVs and WTs under different cases. (a) The forecast output of PVs and WTs. (bd) The combined energy storage output of PVs and WTs under cases 1–3, respectively.
Energies 18 03209 g007
Figure 8. Convergence curves of the outer solutions for different targets. (a) The variation curve of the outer solutions of the objective function f1. (b) The variation curve of the outer solutions of the objective function f2.
Energies 18 03209 g008
Figure 9. Pareto optimal frontier. (a) The Pareto optimal frontier before PVs and WTs are optimized. (bd) The Pareto optimal frontiers under cases 1–3, respectively.
Energies 18 03209 g009
Figure 10. Reactive power output of the SCB.
Energies 18 03209 g010
Figure 11. Curves of the OLTC ratio.
Energies 18 03209 g011
Figure 12. Comparative change diagram of the IEEE 33-node voltage amplitude.
Energies 18 03209 g012
Figure 13. The change diagram of the IEEE33 grid loss.
Energies 18 03209 g013
Figure 14. IEEE 33-node voltage amplitude comparison at 16:00.
Energies 18 03209 g014
Table 1. Charging strategies for different EV models.
Types of EVsCharging Start TimeInitial SOC
Probability Distribution TypeCharging PeriodCharging Ratio
TaxiN(μ, σ2)0:00–8:000.1 VN(μ, σ2)
Uniform distribution8:00–20:000.8 UN(μ, σ2)
N(μ, σ2)20:00–24:000.1 VN(μ, σ2)
BusUniform distribution12:00–18:000.6 UN(μ, σ2)
N(μ, σ2)23:00–24:000.4 VN(μ, σ2)
Official carUniform distribution10:00–20:000.7 VN(μ, σ2)
Uniform distribution8:00–24:000.25 UN(μ, σ2)
N(μ, σ2)0:00–8:000.05 UN(μ, σ2)
Private carN(μ, σ2)0:00–8:000.04 UN(μ, σ2)
N(μ, σ2)8:00–12:000.08 UN(μ, σ2)
N(μ, σ2)15:00–19:000.08 UN(μ, σ2)
Uniform distribution0:00–24:000.8 VN(μ, σ2)
V represents the proportion of vehicles using the valley charging method proposed in this paper, and U represents the proportion of vehicles that use the unordered charging method.
Table 2. The electricity prices of PVs and WTs in different cases.
Contract Price of DG (CNY/MWh)Case 1Case 2Case 3
PVs850850800
WTs800850850
Table 3. Comparison of voltage indicators.
SceneAverage Voltage Amplitude/puMean Voltage Standard Deviation
The DG is not connected0.92880.04455
The unoptimized DG has been connected1.0090.03492
The case 1-optimized DG has been connected1.0150.03153
The case 2-optimized DG has been connected1.0160.03206
The case 3-optimized DG has been connected1.0160.03156
Table 4. Network loss comparison.
SceneNetwork Loss/kW
The DG is not connected296.9
The unoptimized DG has been connected207.3
The case 1-optimized DG has been connected178.9
The case 2-optimized DG has been connected192.5
The case 3-optimized DG has been connected185.8
Disclaimer/Publisher’s Note: The statements, opinions and data contained in all publications are solely those of the individual author(s) and contributor(s) and not of MDPI and/or the editor(s). MDPI and/or the editor(s) disclaim responsibility for any injury to people or property resulting from any ideas, methods, instructions or products referred to in the content.

