Article

Effect of Blade Profile on Flow Characteristics and Efficiency of Cross-Flow Turbines

by
Ephrem Yohannes Assefa
1,2 and
Asfafaw Haileselassie Tesfay
1,2,3,*
1
School of Mechanical and Industrial Engineering, Ethiopian Institute of Technology, Mekelle, Mekelle University, Mekelle P.O. Box 231, Ethiopia
2
Institute of Energy, Mekelle University, Mekelle P.O. Box 231, Ethiopia
3
Department of Civil Environmental Engineering, Norwegian University of Science and Technology, 7491 Trondheim, Norway
*
Author to whom correspondence should be addressed.
Energies 2025, 18(12), 3203; https://doi.org/10.3390/en18123203
Submission received: 28 April 2025 / Revised: 2 June 2025 / Accepted: 14 June 2025 / Published: 18 June 2025
(This article belongs to the Special Issue Optimization Design and Simulation Analysis of Hydraulic Turbine)

Abstract

This study presents a comprehensive numerical investigation into the influence of blade profile geometry on the internal flow dynamics and hydraulic performance of Cross-Flow Turbines (CFTs) under varying runner speeds. Four blade configurations, flat, round, sharp, and aerodynamic, were systematically evaluated using steady-state, two-dimensional Computational Fluid Dynamics (CFD) simulations. The Shear Stress Transport (SST) k–ω turbulence model was employed to resolve the flow separation, recirculation, and turbulence across both energy conversion stages of the turbine. The simulations were performed across runner speeds ranging from 270 to 940 rpm under a constant head of 10 m. The performance metrics, including the torque, hydraulic efficiency, water volume fraction, pressure distribution, and velocity field characteristics, were analyzed in detail. The aerodynamic blade consistently outperformed the other geometries, achieving a peak efficiency of 83.5% at 800 rpm, with improved flow attachment, reduced vortex shedding, and lower exit pressure. Sharp blades also demonstrated competitive efficiency within a narrower optimal speed range. In contrast, the flat and round blades exhibited higher turbulence and recirculation, particularly at off-optimal speeds. The results underscore the pivotal role of blade edge geometry in enhancing energy recovery, suppressing flow instabilities, and optimizing the stage-wise performance in CFTs. These findings offer valuable insights for the design of high-efficiency, site-adapted turbines suitable for micro-hydropower applications.

1. Introduction

1.1. Background and Motivation

Approximately 700 million people worldwide—primarily in Sub-Saharan Africa and South Asia—remain without access to electricity, according to the International Energy Agency (IEA) [1]. In these regions, the expansion of centralized power grids is often economically and logistically challenging. As a result, decentralized renewable energy systems are being promoted by global frameworks, such as the United Nations Sustainable Development Goal 7 (Affordable and Clean Energy), which emphasizes inclusive and localized energy solutions [2,3].
Micro-hydropower (MHP) has emerged as a particularly attractive option for decentralized electrification due to its low environmental impact, site-specific adaptability, and reliable performance. Among various MHP technologies, Cross-Flow Turbines (CFTs), also known as Michell-Banki turbines, stand out for their ability to operate under low-to-medium heads (2–200 m) [4,5], accommodate flow rates from 0.025 to 13 m³/s, and tolerate sediment-rich conditions [6]. Their simple mechanical design, ease of local fabrication, and reliable operation with minimal maintenance make them highly suitable for remote and underserved communities [7].
Despite these advantages, the adoption of CFTs has lagged behind conventional turbine technologies, such as Pelton, Francis, and Kaplan, largely due to their comparatively lower hydraulic efficiencies (typically 70–85%, versus 90–95% for conventional designs) and the absence of standardized, performance-optimized design methodologies [8,9,10]. A key factor influencing the performance of CFTs is the blade geometry, particularly the leading and trailing edge profiles, which play a critical role in the flow interaction, energy transfer, and mechanical durability. The leading edge determines the jet penetration and flow attachment, while the trailing edge governs the flow detachment and wake dynamics [11,12]. Sharp-edged profiles may enhance guidance and reduce separation but are more susceptible to erosion, whereas rounded profiles offer improved structural resilience but may induce turbulence and associated energy losses [13]. Design parameters such as blade curvature, thickness, and inclination angle directly affect both the hydraulic performance and structural integrity [14].
Although considerable research has addressed nozzle configurations, flow regulation strategies, and runner speed optimization, systematic studies on blade profile effects in CFTs remain limited [15,16,17,18]. In contrast, conventional turbines have benefited from aerodynamic advancements, including twisted blades in Francis turbines for cavitation control and adjustable blades in Kaplan turbines for load adaptability. Some computational investigations into CFT blade profiles have reported inconsistent performance outcomes under varying flow conditions [19,20,21]. Moreover, the interaction between blade geometry and the two-phase flow behavior inherent in the open-runner configuration of CFTs remains poorly understood, limiting the generalization of design guidelines.
Existing optimization efforts for CFTs predominantly adopt single-objective approaches focusing solely on the hydraulic efficiency. However, for sustainable deployment in decentralized systems often operating under budgetary, material, and fabrication constraints, a multi-objective design framework is crucial. Advanced blade geometries may yield efficiency gains but frequently require precision manufacturing and specialized materials, thereby increasing costs. Conversely, flat or rounded profiles may be easier to fabricate and structurally more robust, but can underperform in turbulent or unsteady flow conditions. Enhancing the hydraulic efficiency of CFTs through targeted blade design improvements is critical for increasing their cost-effectiveness and competitiveness in decentralized electrification initiatives. Given the operational constraints typical of off-grid and rural applications, such as limited fabrication capabilities and budgetary limitations, optimized blade geometries must provide a balance between performance gains and practical manufacturability.
Furthermore, in the context of decentralized hybrid renewable energy systems, the integration of hydropower with solar photovoltaic (PV) and wind energy technologies is increasingly essential [22]. Such hybrid configurations improve overall system performance, reduce environmental impact, enhance cost efficiency, and strengthen long-term resilience. Therefore, the development of efficient and adaptable CFTs directly supports the broader goals of sustainability, reliability, and universal energy access in emerging and underserved regions.
Therefore, an effective design must balance hydraulic performance, structural durability, and manufacturability.
Computational Fluid Dynamics (CFD) provides a high-resolution, non-invasive method for analyzing internal flow phenomena, including jet impingement dynamics, velocity distributions, pressure gradients, and turbulence development, across the two energy conversion stages. Among the turbulence models, the Shear Stress Transport (SST) k–ω model is widely favored for its robust near-wall treatment and capacity to predict flow separation. Nonetheless, its limitations in modeling free shear layers warrant consideration of more advanced models such as Scale-Adaptive Simulation (SAS) and Detached Eddy Simulation (DES), which provide improved turbulence resolution at higher computational costs [23,24]. For validation, experimental techniques such as Particle Image Velocimetry (PIV) and Laser Doppler Anemometry (LDA) offer precise, high-resolution flow field measurements and are essential for validating numerical predictions [25].
This study aims to systematically investigate the influence of blade profile geometry on the internal flow characteristics and hydraulic performance of Cross-Flow Turbines using CFD-based numerical simulations. Four geometries, flat, round, sharp, and aerodynamic, were evaluated under a constant head of 10 m and varying runner speeds (270 to 940 rpm). The analysis focuses on the velocity field evolution, pressure distribution, and turbulence intensity during both energy conversion stages. Key performance metrics include stage-wise efficiency and energy losses attributed to jet impingement, leakage, and air-water entrainment. The findings are expected to guide the development of more efficient, durable, and cost-effective CFT designs for decentralized hydropower applications.

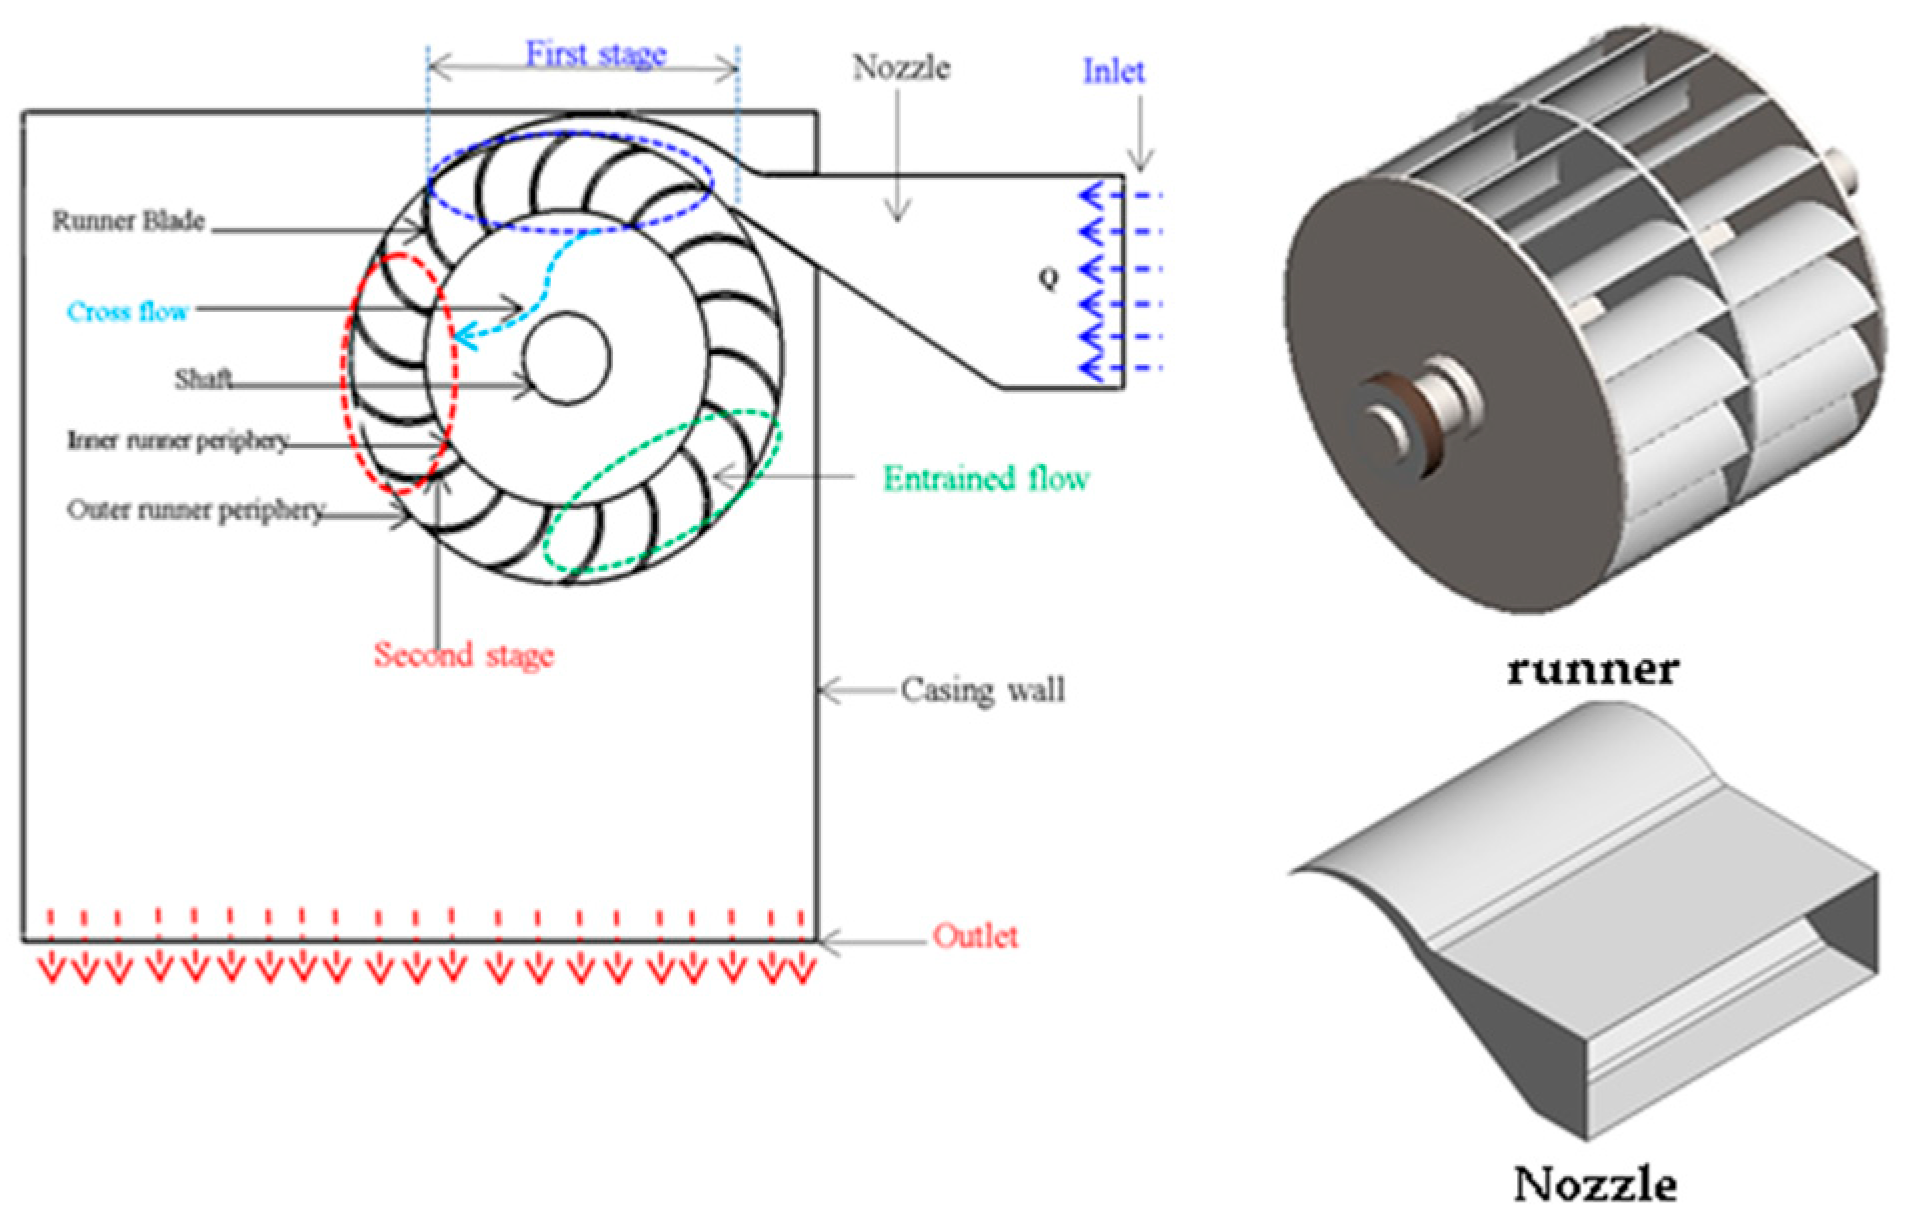
1.2. Principles of Flow Characteristics and Operation

The CFT facilitates energy conversion through a two-stage process that capitalizes on both the reaction and impulse mechanisms (see Figure 1). In the inward flow first stage (reaction-dominated), water enters the turbine through a nozzle where its pressure energy is converted into kinetic energy. The high-velocity jet impinges tangentially on the runner blades, initiating rotation. As the water flows radially inward, guided along the curved blades, it experiences a pressure drop that induces a reaction force, contributing significantly to the torque generation. As the water flows through the central air-filled region of the runner—maintained at atmospheric pressure—the flow undergoes a directional shift. In the outward flow second stage (impulse-dominated), the remaining kinetic energy of the fluid is extracted as the water is redirected outward across the blade surface.
This secondary interaction enables additional energy recovery through the impulse action, while the open-center configuration ensures negligible backpressure and supports efficient pressure recovery. A central element governing this two-stage energy extraction is the blade geometry, which directly affects the flow guidance, pressure distribution, and momentum transfer. The blade curvature, along with the inlet (β₁) and outlet (β₂) angles, defines the velocity triangles that govern the tangential component of the fluid velocity responsible for torque production. The optimal blade design minimizes flow separation, reduces turbulence intensity, and ensures high hydraulic efficiency throughout the passage. The runner configuration consists of radially arranged blades enclosed between two circular end discs, forming a cylindrical rotor that accommodates both energy conversion stages under varying hydraulic loads. High-fidelity CFD analysis, supplemented by empirical design principles, was employed to characterize the internal flow behavior and optimize the geometric parameters for improved performance under a specified head (H) and flow rate (Q). This dual approach ensures that the design refinements align with both theoretical expectations and practical operational constraints.

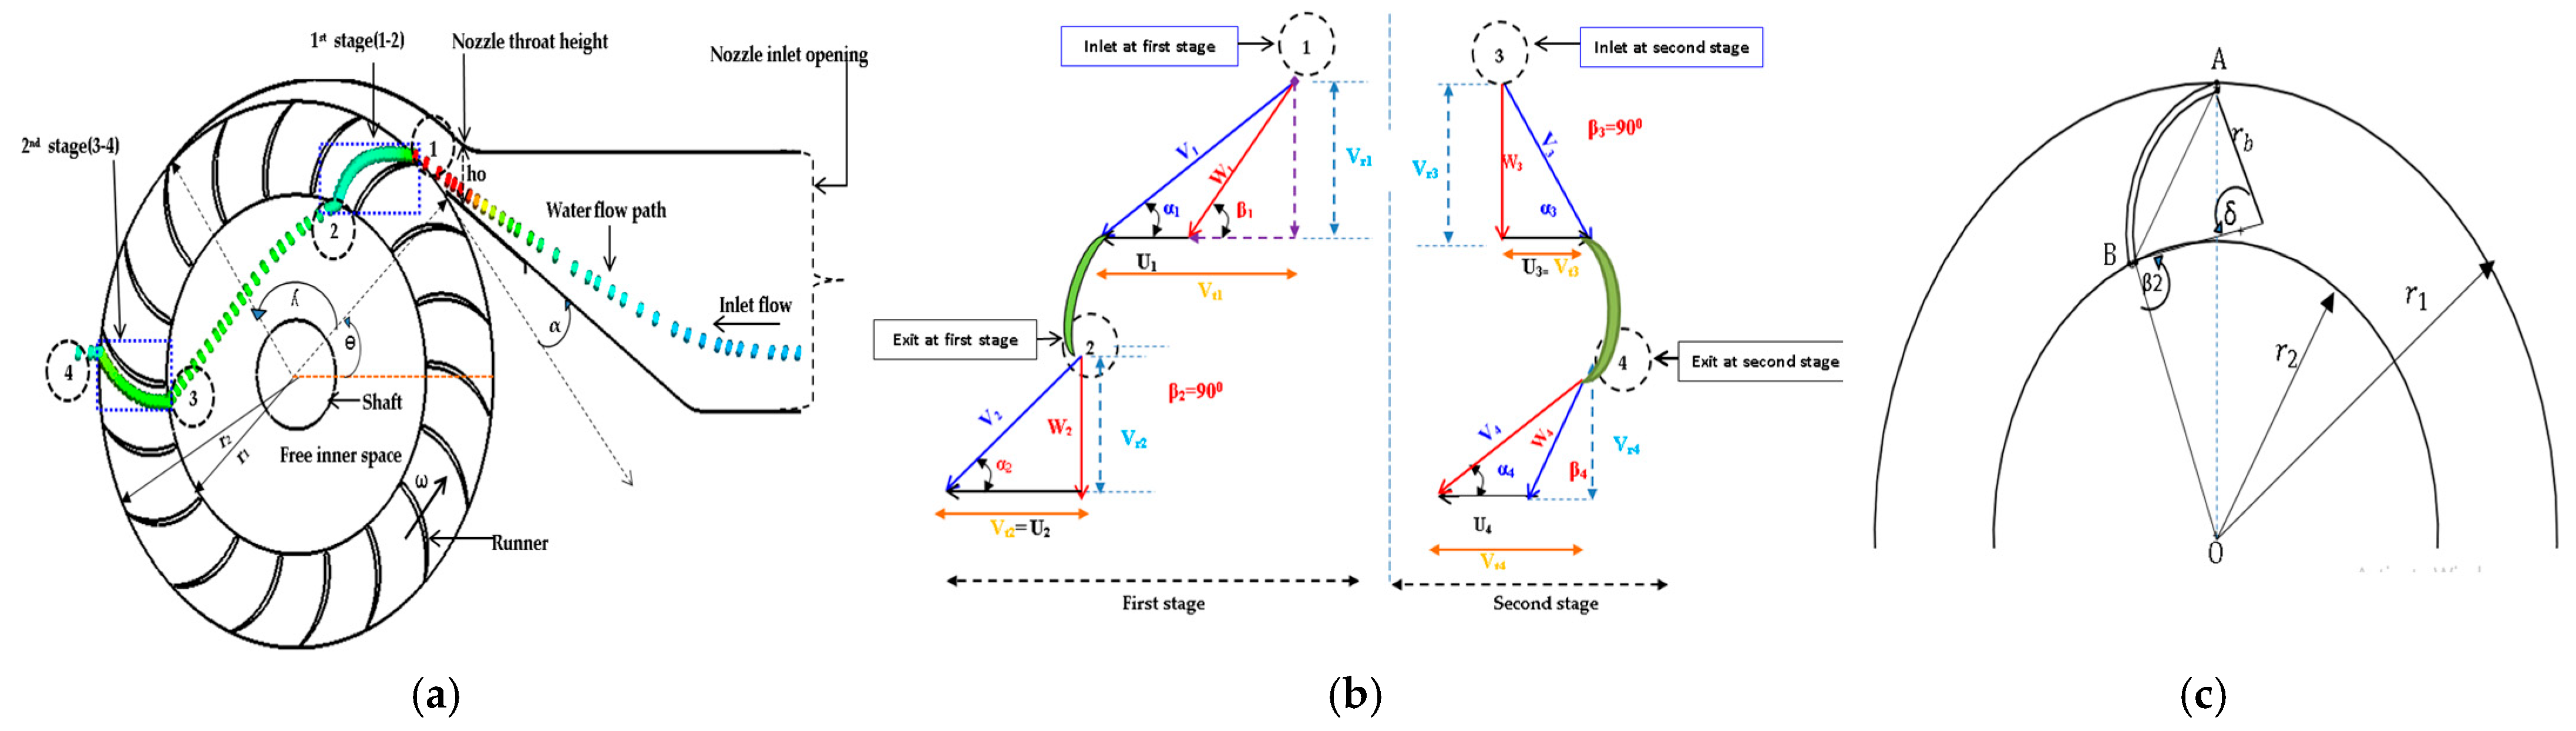
1.3. Turbine Configuration and Design Approach

1.3.1. Nozzle Design

The CFT receives water from the penstock, where it is accelerated through a converging nozzle to form a high-velocity jet that impinges on the runner blades. The exit velocity of this jet, which is critical for performance modeling, is estimated using Bernoulli’s principle accounting for head losses:
V 1 = C n 2 g H
where C n is the nozzle loss coefficient (0.95), g is the gravitational acceleration, and H is the net head.
The nozzle is angularly positioned to span with a nozzle entry angle of 90° (ranging between 40° and 130°), ensuring effective flow admission to the first runner stage (Figure 2a).
To quantify the inlet conditions accurately using the numerical method, the area-weighted velocity magnitudes and directions were extracted from a cross-sectional plane intersecting the nozzle arc. As illustrated in Figure 2b, the tangential component of the velocity is then expressed as:
V t = V cos α 1
where α 1 = 16° is the jet incidence angle optimized for effective entry alignment.
The relative velocity angle at the blade entry ( β 1 )   is then computed as follows:
tan ( β 1 ) = 2 tan   ( 1 )
The fluid advances through the first-stage blades, and assuming ideal flow conditions, the shock losses at the entry of the second stage are considered insignificant. A 90° ( β 2 )   inter-blade angle is incorporated between the stages to ensure smooth and efficient flow redirection.

1.3.2. Operating Parameter

The blade peripheral velocity, relative to the jet speed, defines the velocity ratio:
V r = U 1 V 1 = 1 2 cos 1
An optimal velocity ratio of approximately 0.48 was selected to maximize the energy transfer to the runner. Using this, the runner diameter is calculated from:
D 1 = 42.3 cos ( 1 ) H 1 N

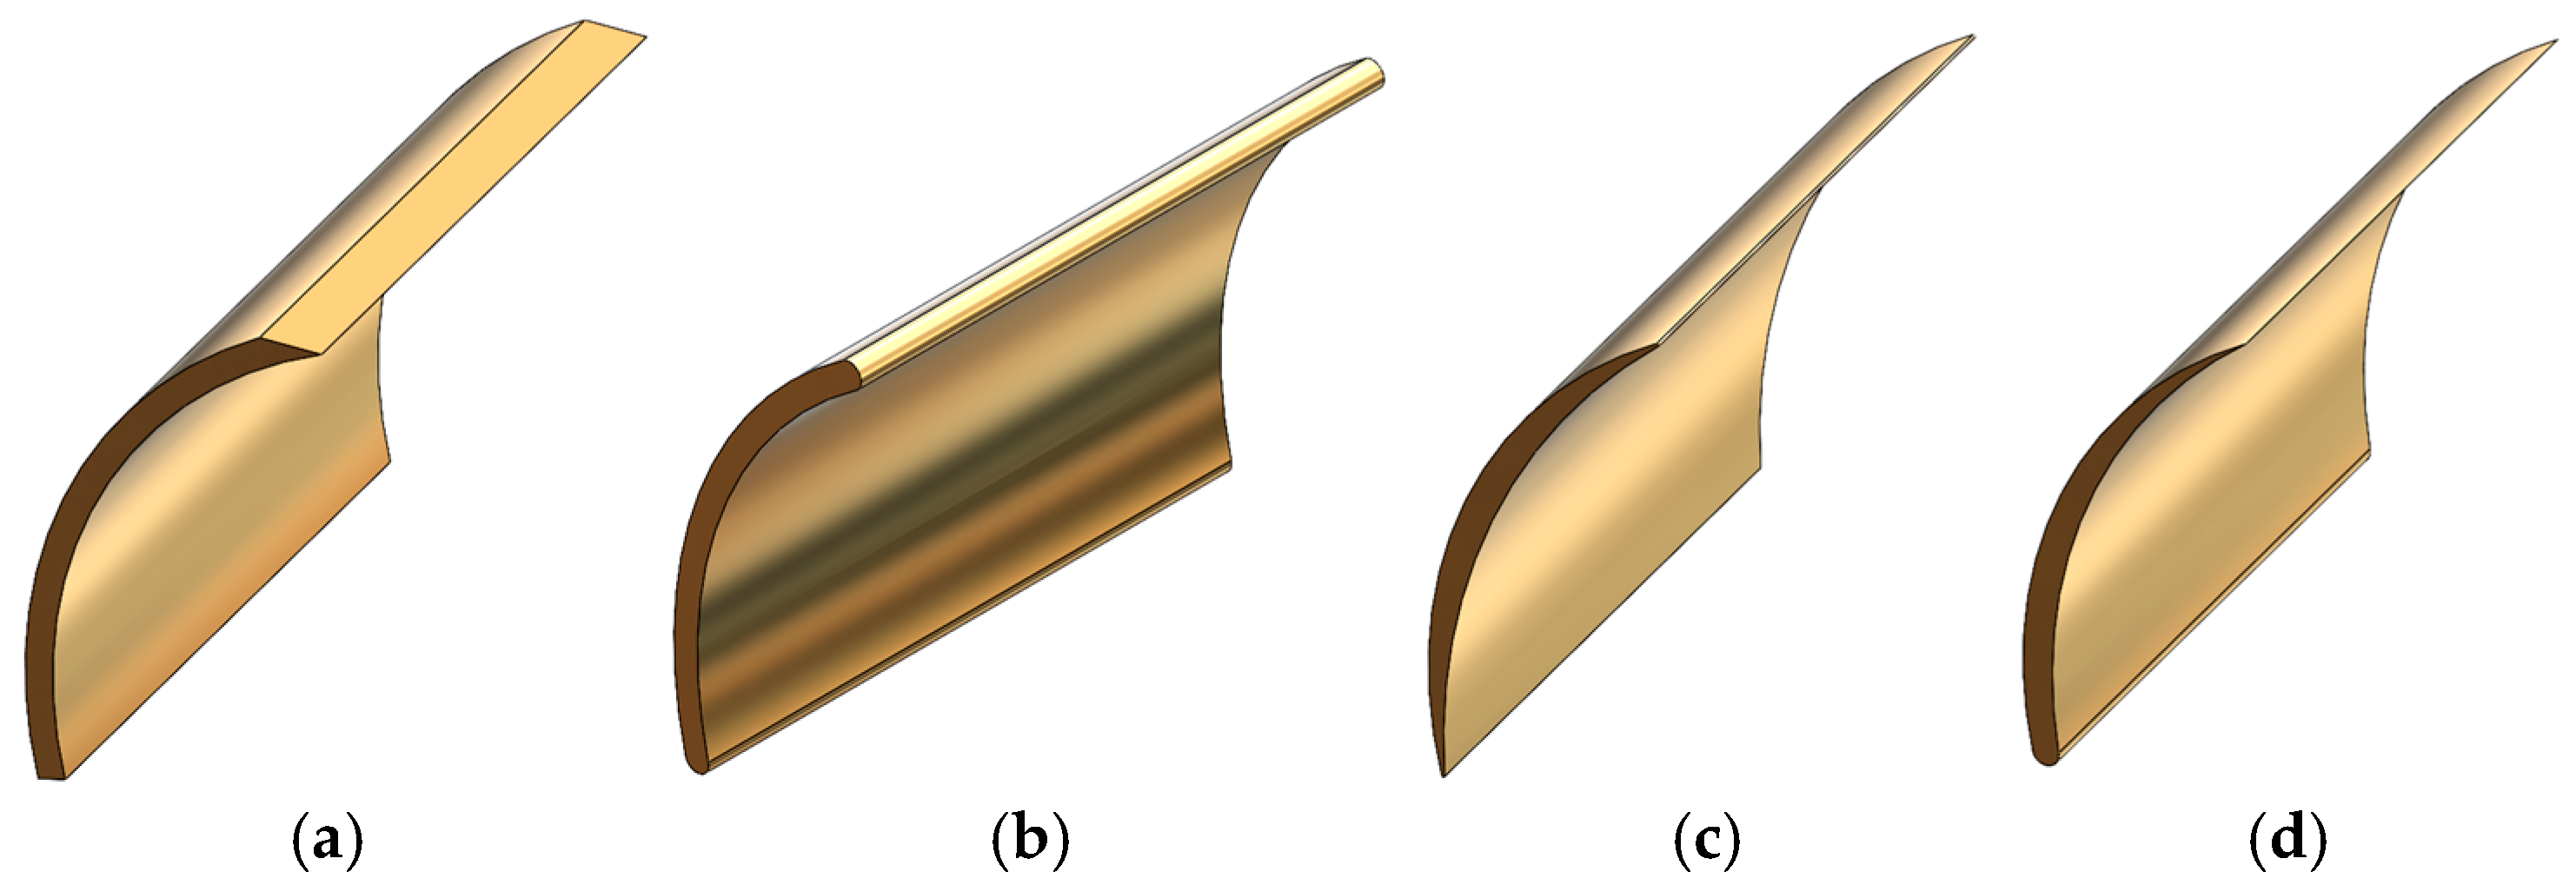
1.3.3. Blade Geometry and Runner Design

The blade design parameters, including the number, spacing, and curvature, are derived empirically and geometrically. The jet thickness is expressed as: S 1 = k D 1 , where k (empirical coefficient) is often K = 0.085 for practical cases.
Blade spacing ( t 1 ), number of blades ( Z b ), and runner width ( B w ) are calculated respectively by:
t 1 = S 1 sin β 1
Z b = π D 1 t 1
B w = Q S 1 V 1
In CFT, the aspect ratio ( a r ), the ratio of the runner diameter (D) to blade width (b), often termed the runner length, exhibits a fundamental geometric and functional interdependence. This relationship directly affects the turbine’s ability to accommodate flow, maintain structural stability, and achieve optimal hydraulic performance, making it a critical consideration in turbine design. The Aspect ratio ( a r ) must be between 0.8 and 1.2 for optimal flow and structural integrity [26].
The diameter ratio, D r = 0.66 was selected to optimize the flow recovery in the second stage. The blade curvature radius ( r b ) and central angle ( δ ) are then derived on the basis of the runner geometry and velocity triangle (see Figure 2c) as follows:
r b = D 1 ( 1 D r 2 ) 4 cos β 1
tan δ 2 = cos β 1 sin β 1 + D r

1.3.4. Performance Evaluation

Hydraulic efficiency is defined by the ratio of the mechanical power to the available water power:
η h = T ω γ H Q
where T is the torque and ω is angular velocity. The torque is evaluated via numerical post-processing in ANSYS CFX® 2023 as:
T = r τ ̿ . n ) ) d s . a
where, d s is the position vector, τ ̿ is the stress tensor, n is the unit normal to the surface, and a is aligned with the rotational axis. Circular sampling planes were positioned along the runner perimeters to extract the velocity and pressure profiles at both stages, facilitating a comprehensive assessment of the flow behavior and efficiency trends.

2. Methodology

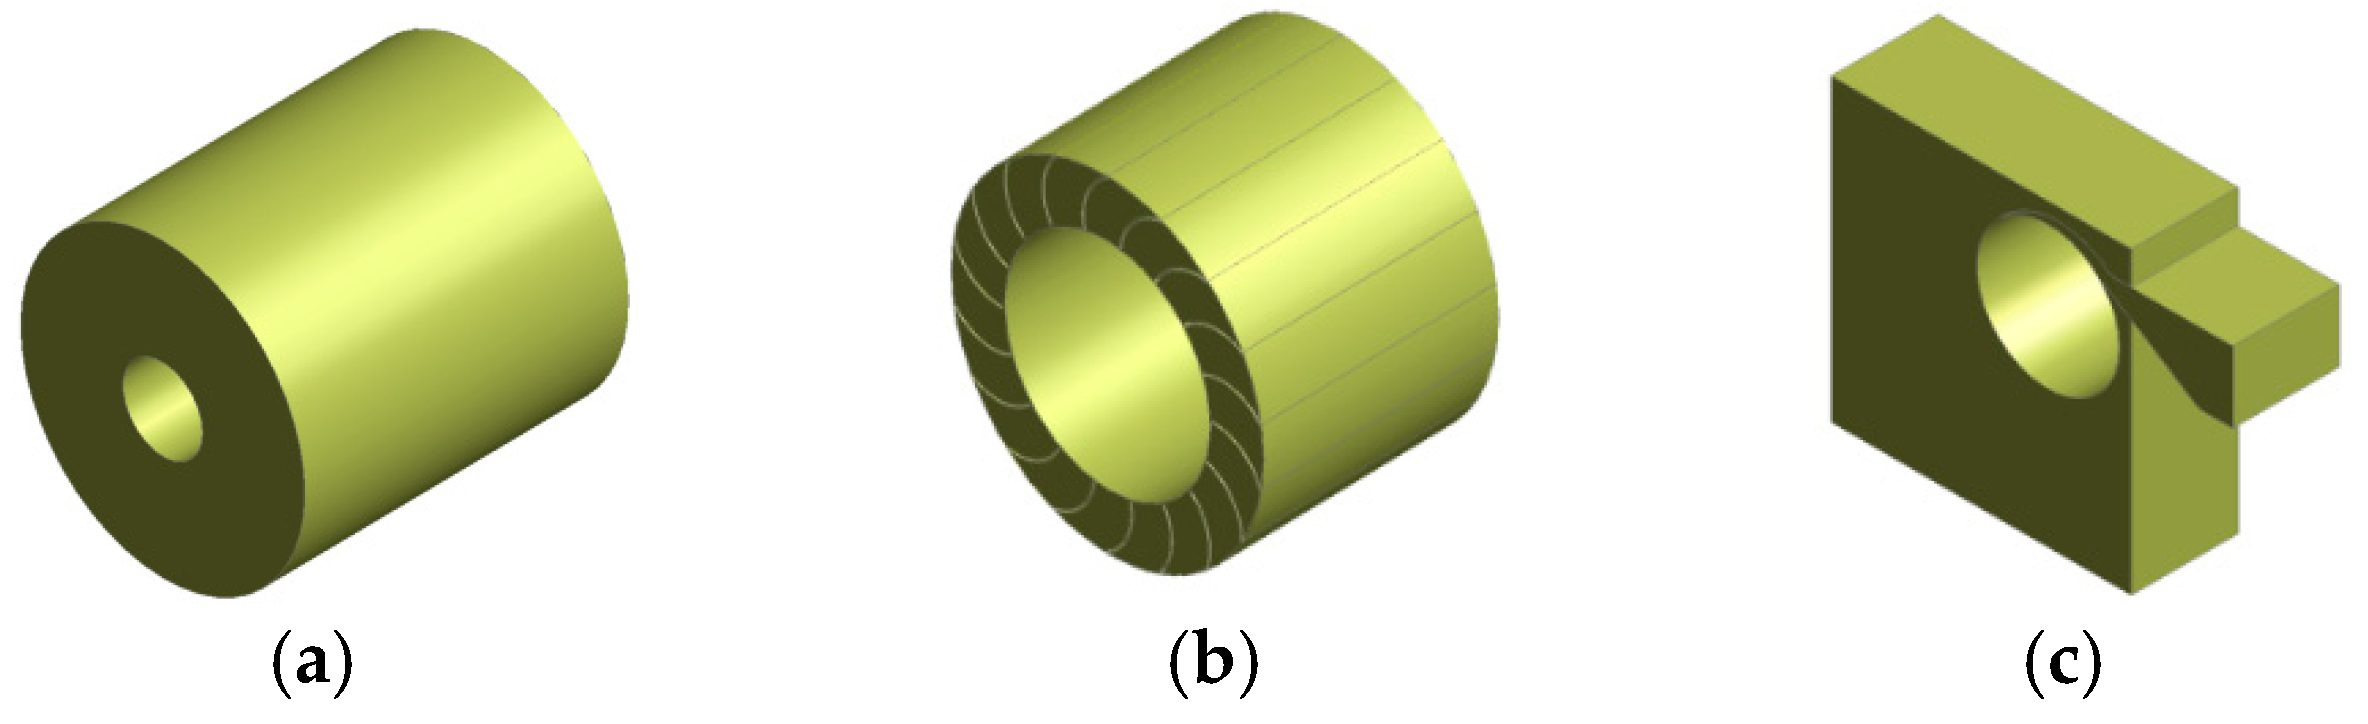
2.1. Blade Profile and Turbine Specifications

In this study, four blade profiles such as flat, round, sharp edged, and aerodynamic, were selected based on their manufacturability and anticipated hydraulic performance (see Figure 3). Each blade design was geometrically modeled with uniform thickness, except for the sharp-edged profile, which featured a 1 mm leading edge, and the aerodynamic profile, which adopted an asymmetric airfoil-inspired geometry to improve flow adherence and minimize separation.
The turbine geometry was designed to reflect a typical micro-hydropower CFT configuration. Table 1 summarizes the key design parameters, which remained constant across all simulations to isolate the influence of the blade profile variations.

2.2. Computational Setup

The computational domain was modeled using the ANSYS Design Modeler and included three main components: the nozzle, the runner with blades, and the casing (see Figure 4). To accurately capture the interaction between the stationary and rotating regions, the Multiple Reference Frame (MRF) approach was employed. The runner and blades were assigned to the rotating zone, while the nozzle and casing were treated as stationary.
To model the interaction between the stationary and rotating zones, a frozen rotor interface was implemented. This approach retains the relative orientation between frames, facilitating a quasi-steady-state simulation of the flow while avoiding the high computational demand associated with fully transient simulations. Although three-dimensional modeling offers enhanced capability in resolving secondary flows and complex turbulence structures, prior studies have shown that 3D simulations often report slightly lower efficiency predictions by approximately 3% to 4%, due to additional secondary flow losses [27,28]. Given the comparative nature of this study and its focus on isolating the effects of blade geometry, a two-dimensional steady-state simulation provides an optimal balance between computational efficiency and accuracy.

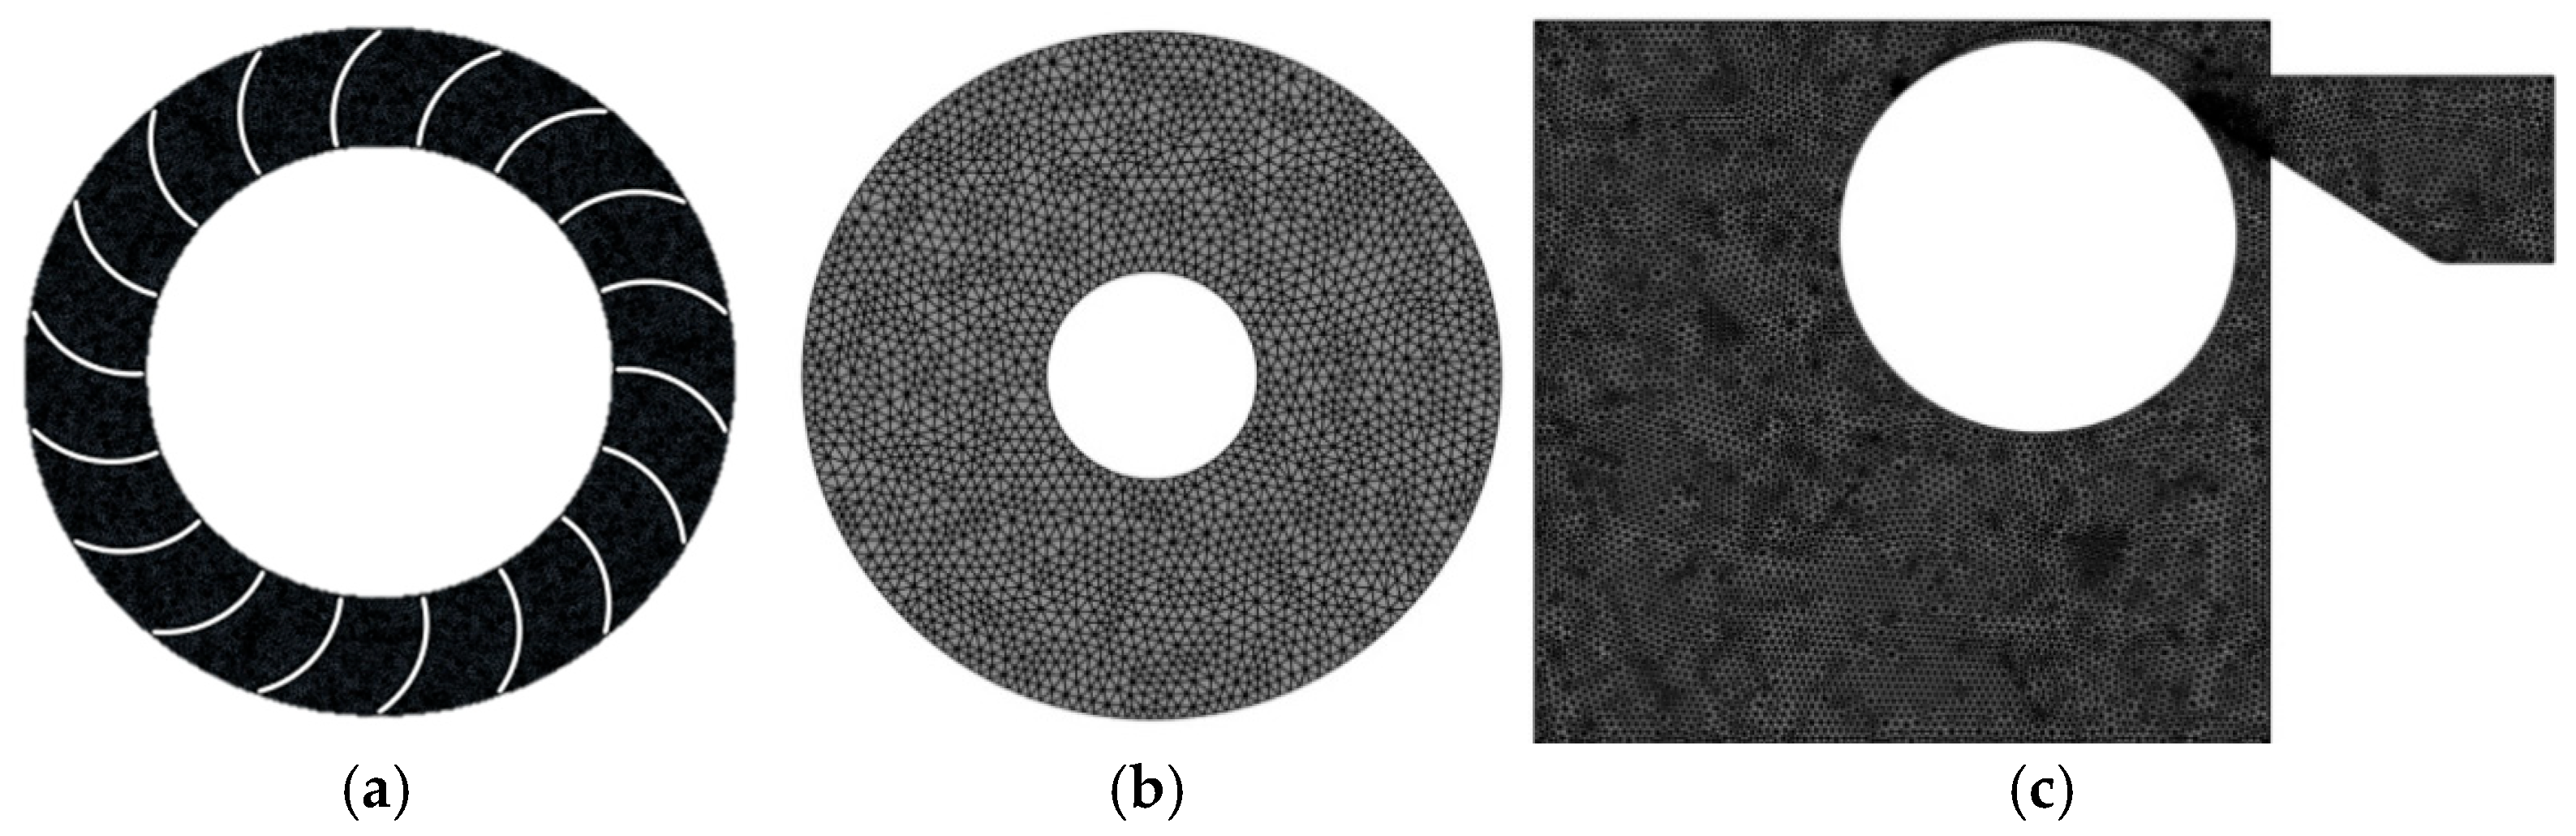
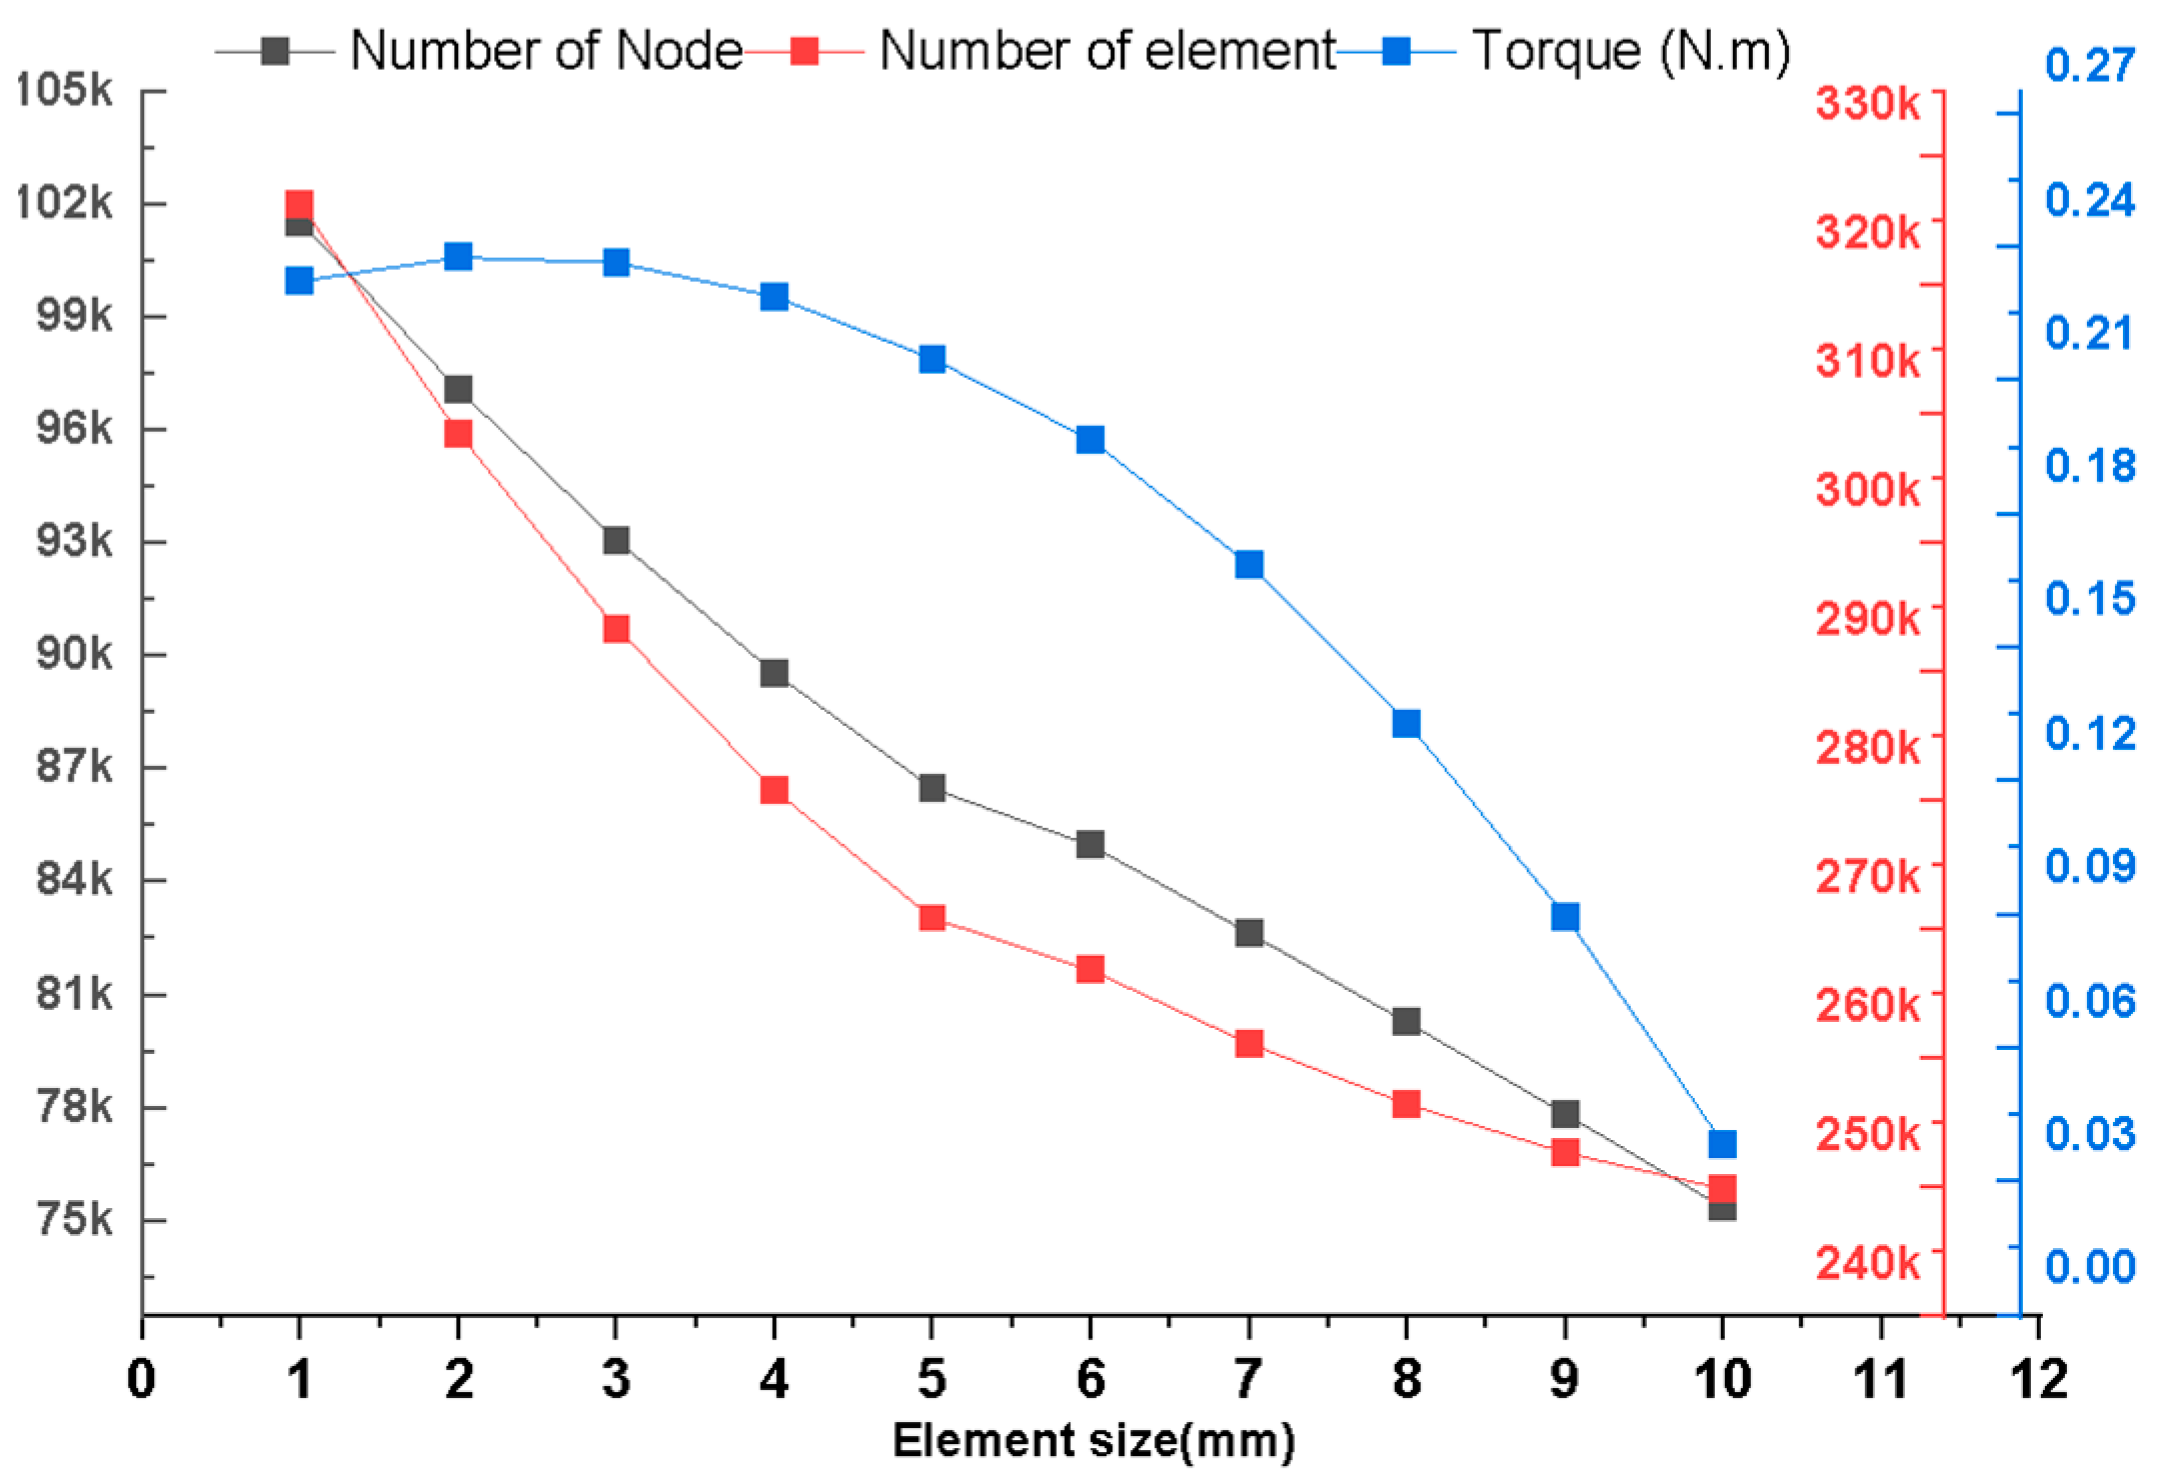
2.3. Mesh Sensitivity and Grid Convergence Study

To ensure the reliability and numerical accuracy of the CFD simulations, a systematic grid sensitivity analysis was conducted, followed by a quantitative uncertainty evaluation using the Grid Convergence Index (GCI) method. The computational domain—including runner, nozzle, and casing—was discretized with a structured tetrahedral mesh (See Figure 5). Critical regions such as blade surfaces and boundary layers were refined using a local element size of 1 mm, incorporating 20 inflation layers with a growth rate of 1.2, resulting in wall-resolved y⁺ values below 5, thus meeting the requirements of near-wall turbulence modeling.
An initial mesh independence test was conducted by varying the characteristic element size from 10 mm to 1 mm. Solution stability, particularly in the predicted torque and mass flow rate, was achieved below the 1 mm threshold, which informed subsequent grid refinement levels (see Figure 6).
Three progressively refined grids were generated with characteristic element sizes of 1.0 mm (coarse), 0.75 mm (medium), and 0.5 mm (fine), as shown in Table 2. Torque (τ) was selected as the primary quantity of interest. The refinement ratios between the mesh levels were calculated as r 21 = h 2 h 1 and r 32 = h 3 h 2 , Where h 1 , h 2 , and h 3 are the characteristic grid spacings of the fine, medium, and coarse meshes, respectively.
The observed order of convergence (q) was determined via Richardson extrapolation [29,30], and the theoretical torque was estimated using standard formulations (Equation (14)).
q n + 1 = ln τ 3 τ 2 τ 2 1 r 12 q n 1 + r 12 q n ln r 12 r 23
τ e x a c t = τ 1 τ 2 τ 1 r 12 q n + 1 1
The GCI was computed for each mesh transition using a refinement factor and safety factor of 1.25 as follows.
G C I 12 = F s 1 τ 1 τ 2 τ 1 r 12 q n 1 100 %
G C I 32 = F s 1 τ 2 τ 2 τ 3 r 23 q n 1 100 %
The relative errors between the grid levels were calculated as
ε 21 = τ 1 τ 2 τ 1
ε 32 = τ 2 τ 3 τ 2
where
ε i j is the relative error between the mesh level i (coarse) and j (finer)
τ j torque on the coarse grid
τ i torque on the finer grid
The results (see Table 3) show that relative errors and GCI values remained within acceptable engineering limits (GCI < 2%), with the observed order of accuracy q = 0.33.
Consequently, the 1-mm mesh was selected for all subsequent simulations, balancing computational efficiency and prediction accuracy. This mesh resolution adequately captured critical flow features such as separation, reattachment, and wake development in the turbine domain.

2.4. Boundary Conditions and Turbulence Modeling

The computational domain was initialized with appropriate boundary conditions to replicate the realistic operating conditions of the CFT. A constant pressure inlet boundary condition was applied to simulate a net hydraulic head of 10 m, corresponding to a water volume fraction (α-w) of 1 and an air fraction (α-a) of 0. At the outlet, an atmospheric pressure condition was imposed with and, allowing free discharge of the flow. No-slip, adiabatic wall conditions were imposed on all wall boundaries, including the casing, runner, and blades, to accurately model the viscous effects and thermal insulation. The interface between the stationary and rotating regions was handled using the frozen rotor approach within the Multiple Reference Frame (MRF) framework. This method enables the simulation of the steady-state rotor–stator interaction with reduced computational expense compared to the transient rotor–stator models. Turbulence effects were modeled using the Shear Stress Transport (SST) model, which is known for its robustness in handling complex internal flows. The SST model combines the near-wall accuracy of the formulation with the free-stream stability of the model through a blending function. This hybrid approach is well-suited for resolving the boundary layer separation, recirculation zones, and shear-dominated regions prevalent in turbine applications.

2.5. Numerical Solution and Governing Equations

Steady-state simulations were carried out using a homogeneous, two-phase, free-surface model in ANSYS CFX, treating water and air as interpenetrating continua with shared velocity, pressure, and turbulence fields. This approach simplifies the interface treatment while preserving the essential dynamics of the free-surface flow relevant to CFT operations. The governing equations are based on the Reynolds-Averaged Navier–Stokes (RANS) formulation, modified to include rotational effects in the rotating domain via a rotating reference frame [31,32]. These equations consist of:
Continuity equation (mass conservation):
α P ρ P x + . α P ρ P = S P
Momentum conservation (in rotating frame)
α P ρ P V r t + . α P ρ P V r V r . μ e f f V r + α P ρ P ( 2 ω × v r + ω × ω × r + α × r + a ) = P ˙ + . μ e f f V r T + S M P
where
P ˙ = P + 2 3 ρ P k + 2 3 μ e f f . V
The variable α P represents the phase volume fraction, while α P denotes the phase density, and S P indicates the phase mass flow rate. V r is the relative flow velocity, ω is the angular velocity, and 2 ω × v r r represents the Coriolis acceleration. The term ω × ω × r accounts for the centripetal acceleration, and, α × r reflects the acceleration due to irregular variations in the rotational speed, alongside a linear changes in the relative velocity. In all cases, the subscript “p” is used to refer to the specific properties of each phase.
Effective viscosity using the SST model
μ e f f = μ + μ t
where μ (kg/m·s) is the dynamic viscosity, and μ t (kg/m·s) represents the turbulent viscosity. In the k-ε model, the turbulent viscosity is calculated using Equation (23), which depends on the turbulent kinetic energy (k) and the dissipation rate (ε):
μ t = C μ ρ k 2 ε
where Cμ (-) is a constant, ρ (kg/m³) is the fluid density, k (J/kg) is the turbulent kinetic energy, ε (m²/s³) is the turbulent dissipation rate, and ω (s⁻¹) is the mean turbulent frequency. In contrast, the k-ω model computes the turbulent viscosity using the turbulent kinetic energy and the turbulent frequency (ω) as shown in Equation (24).
μ t = ρ k ω
Homogeneous two-phase mixture properties
The mixture density and viscosity were calculated based on the volume fractions of each phase as: [11,32].
ρ = p α P ρ P
μ = p α P μ P
where α (-) is the volume fraction, p represents the phase, and ρ (kg/m³) and μ (kg/m·s) are the density and viscosity, respectively, of the average mixture used in the modified RANS equations. The air density ρa (kg/m³) is assumed to be a function of the pressure P (Pa) according to the state equation:

2.6. Simulation Scenarios and Performance Evaluation

To evaluate the influence of blade geometry on turbine performance, four blade profiles, such as flat, round, sharp, and aerodynamic, were systematically investigated under varying runner speeds of 270, 540, 670, 800, and 940 rpm.
These speeds represent the operational ranges commonly encountered in MHP applications. The primary performance indicators considered were torque, hydraulic efficiency, and internal flow behavior. For each scenario, the simulations assessed the velocity ratio and its relationship with both global (overall) and stage-wise hydraulic performance. A detailed grid sensitivity analysis was performed for all configurations, and the Grid Convergence Index (GCI) was computed to ensure the numerical accuracy and reliability of the results. Post-processing focused on analyzing the velocity and pressure fields to capture internal flow phenomena, including flow separation, recirculation zones, and vortex structures. Special attention was directed toward the interaction between the incoming jet and blade surfaces, particularly the leading and trailing edge impingement zones, as these regions are critical in determining the energy transfer efficiency across both turbine stages.

3. Results and Discussion

This section presents a comprehensive analysis of the velocity and pressure distributions across four blade profiles—flat, round, sharp, and aerodynamic —under varying runner speeds (270–940 rpm), highlighting their influence on torque generation, flow dynamics, and energy conversion efficiency.

3.1. Velocity Field and Flow Component Analysis

The velocity field within the runner was examined to evaluate the impact of the blade profile and runner speed on the internal flow behavior and turbine performance. Figure 7 compares the relative velocity fields across the flat, round, sharp, and aerodynamic blades at various runner speeds.
At 270 rpm (Figure 8), the flat and round blades exhibited high relative velocities and prominent flow misalignment, leading to turbulence and poor flow attachment near the blade leading edges. In contrast, the sharp and aerodynamic blades demonstrated improved flow guidance and reduced separation, with the aerodynamic profile showing the most coherent velocity patterns.
At 670 rpm (Figure 9), a more favorable alignment between the blade motion and the incoming flow was observed. The aerodynamic blade profile facilitates smooth velocity transitions with minimal flow disturbance, contributing to the peak hydraulic efficiency. Sharp blades also maintain effective flow control, whereas flat and round blades continue to suffer from localized recirculation.
At 940 rpm (Figure 10), the relative velocities declined across all profiles due to the reduced velocity differentials. However, the aerodynamic blade preserves effective flow control and minimizes losses. Sharp blades show moderate performance, while flat and round blades display intensified turbulence and vortex shedding near the trailing edge.

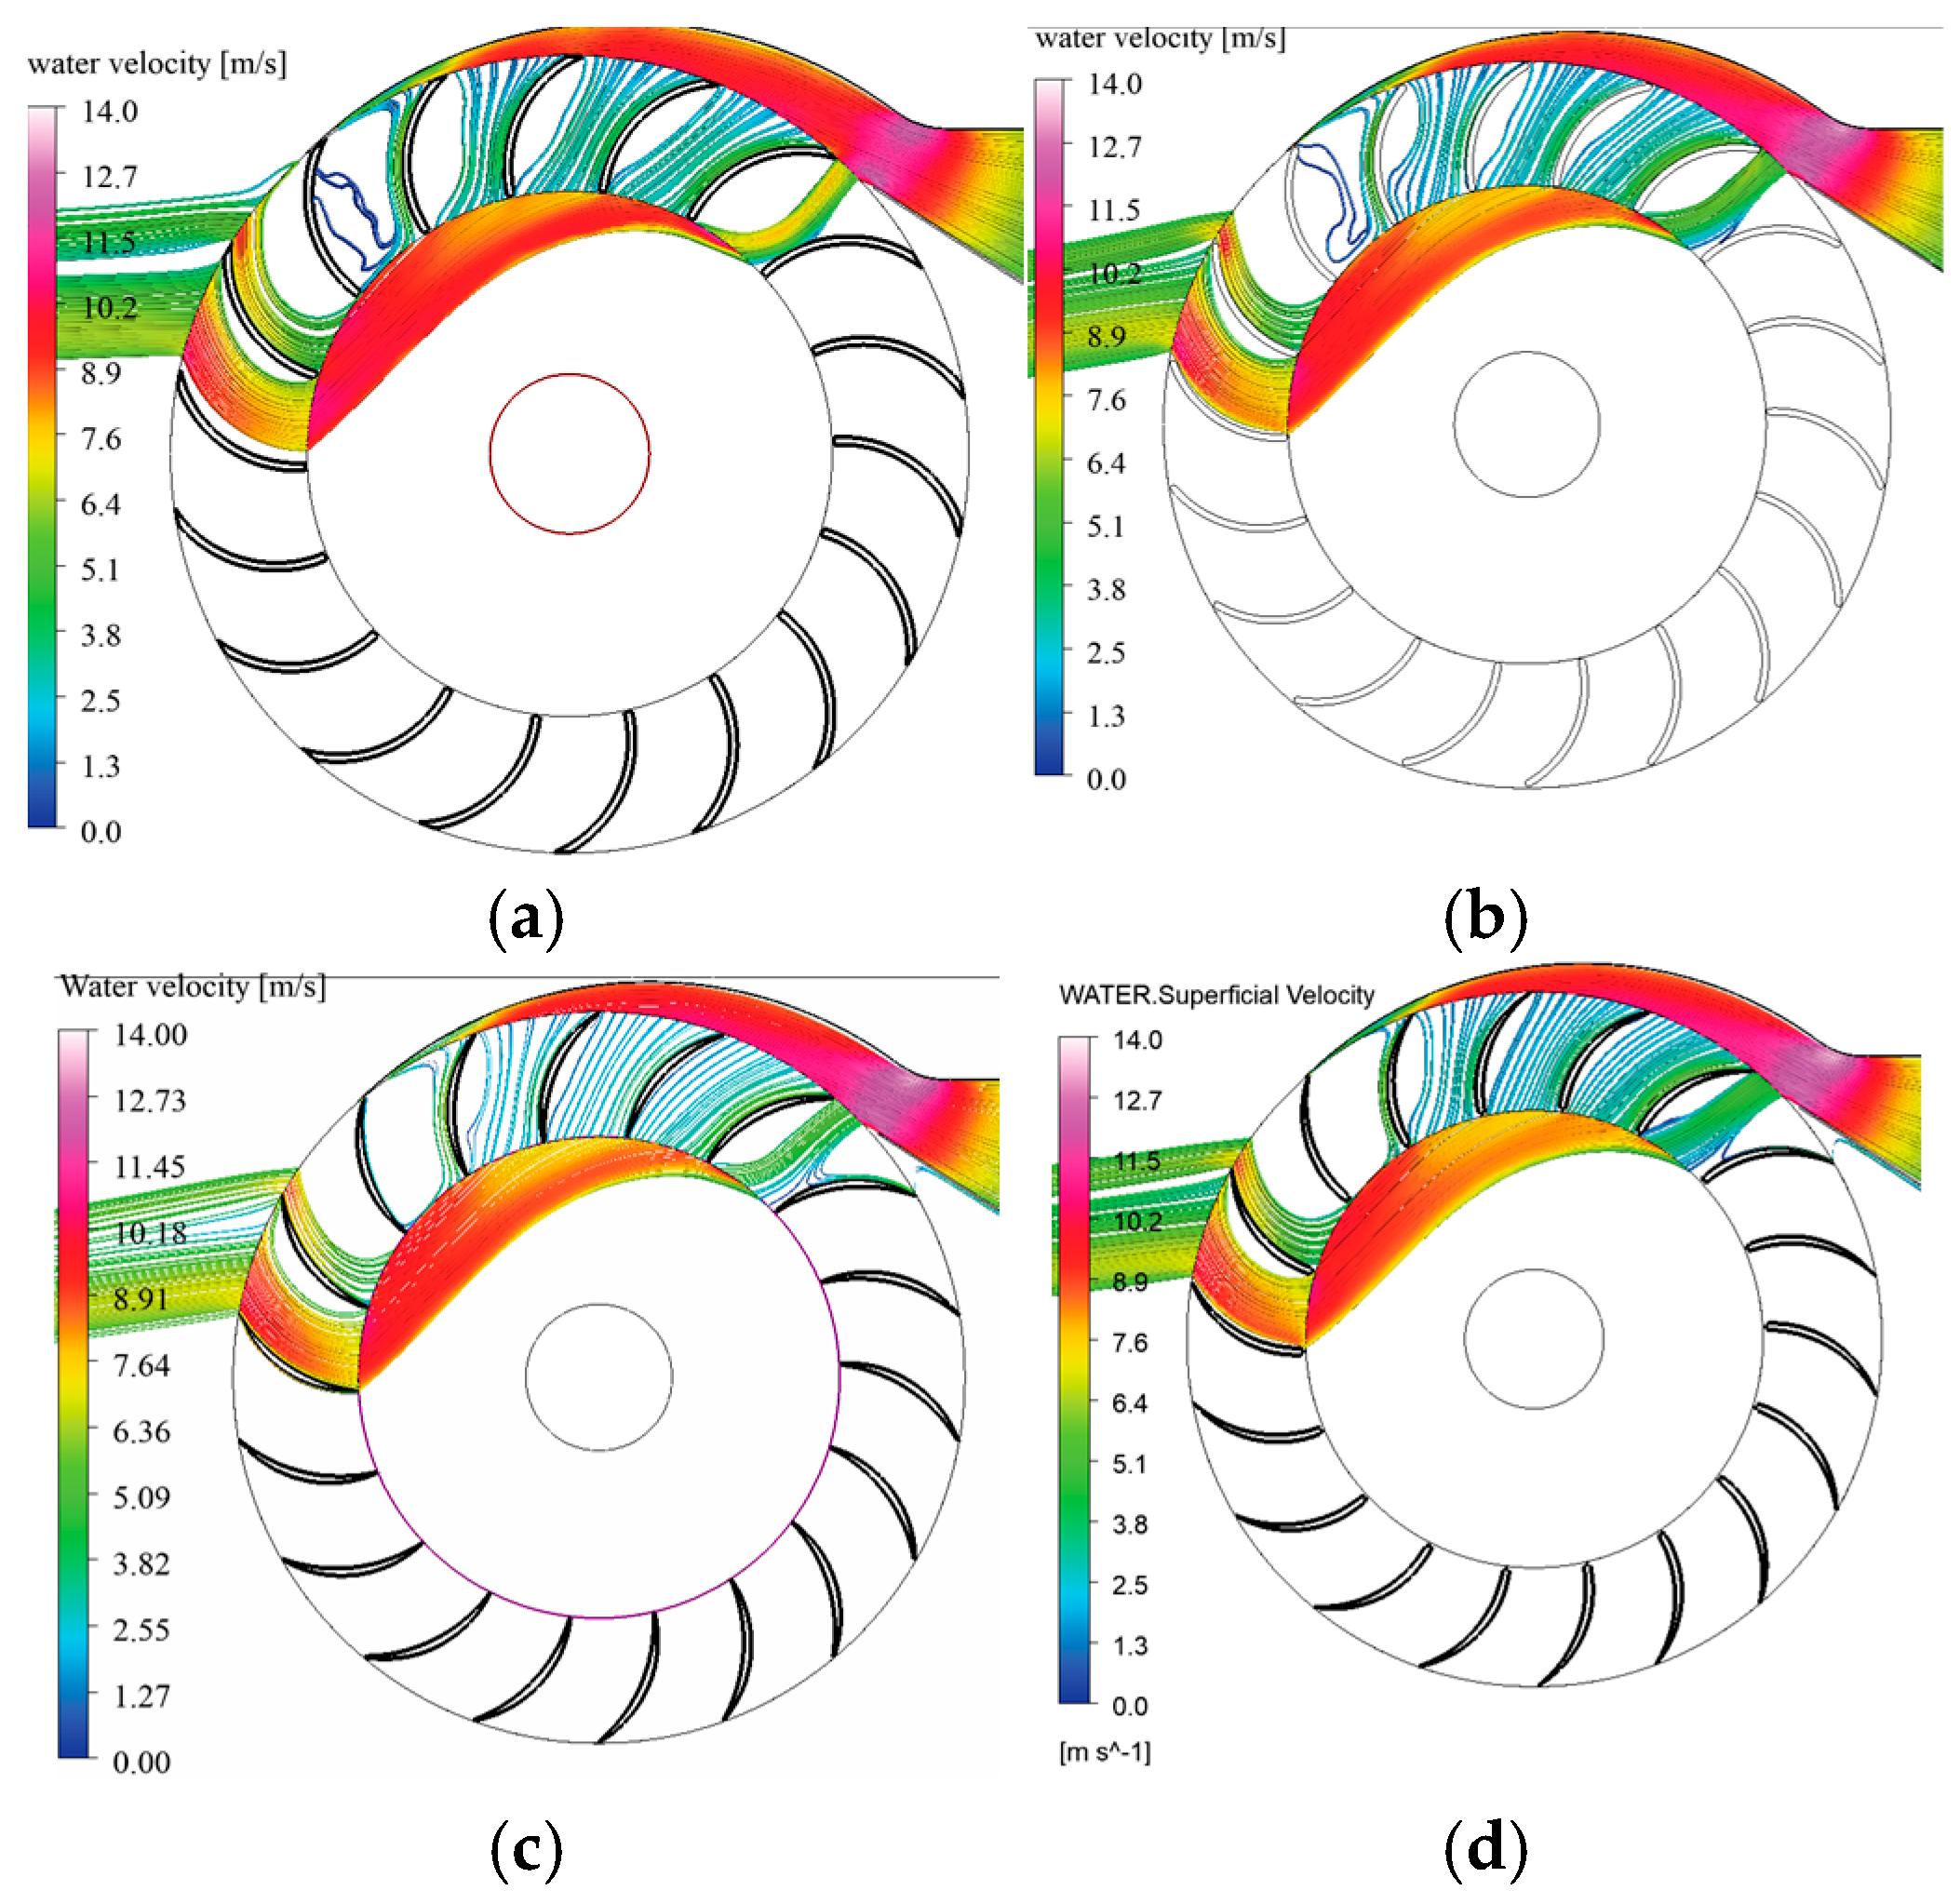
3.1.1. Tangential Velocity Component

Figure 11 illustrates the distribution of the tangential velocity at the runner periphery. At low speeds (270 rpm), a significant portion of the tangential momentum exits the runner unutilized, especially for flat and round blades. As the speed increases to 670 rpm, the aerodynamic and sharp blades demonstrate improved deceleration of the tangential velocity, enhancing the torque generation. At speeds beyond 800 rpm, the reduction in the tangential velocity differential limits further energy extraction. Nonetheless, the aerodynamic blades maintained better momentum transfer and reduced losses compared to the other profiles.

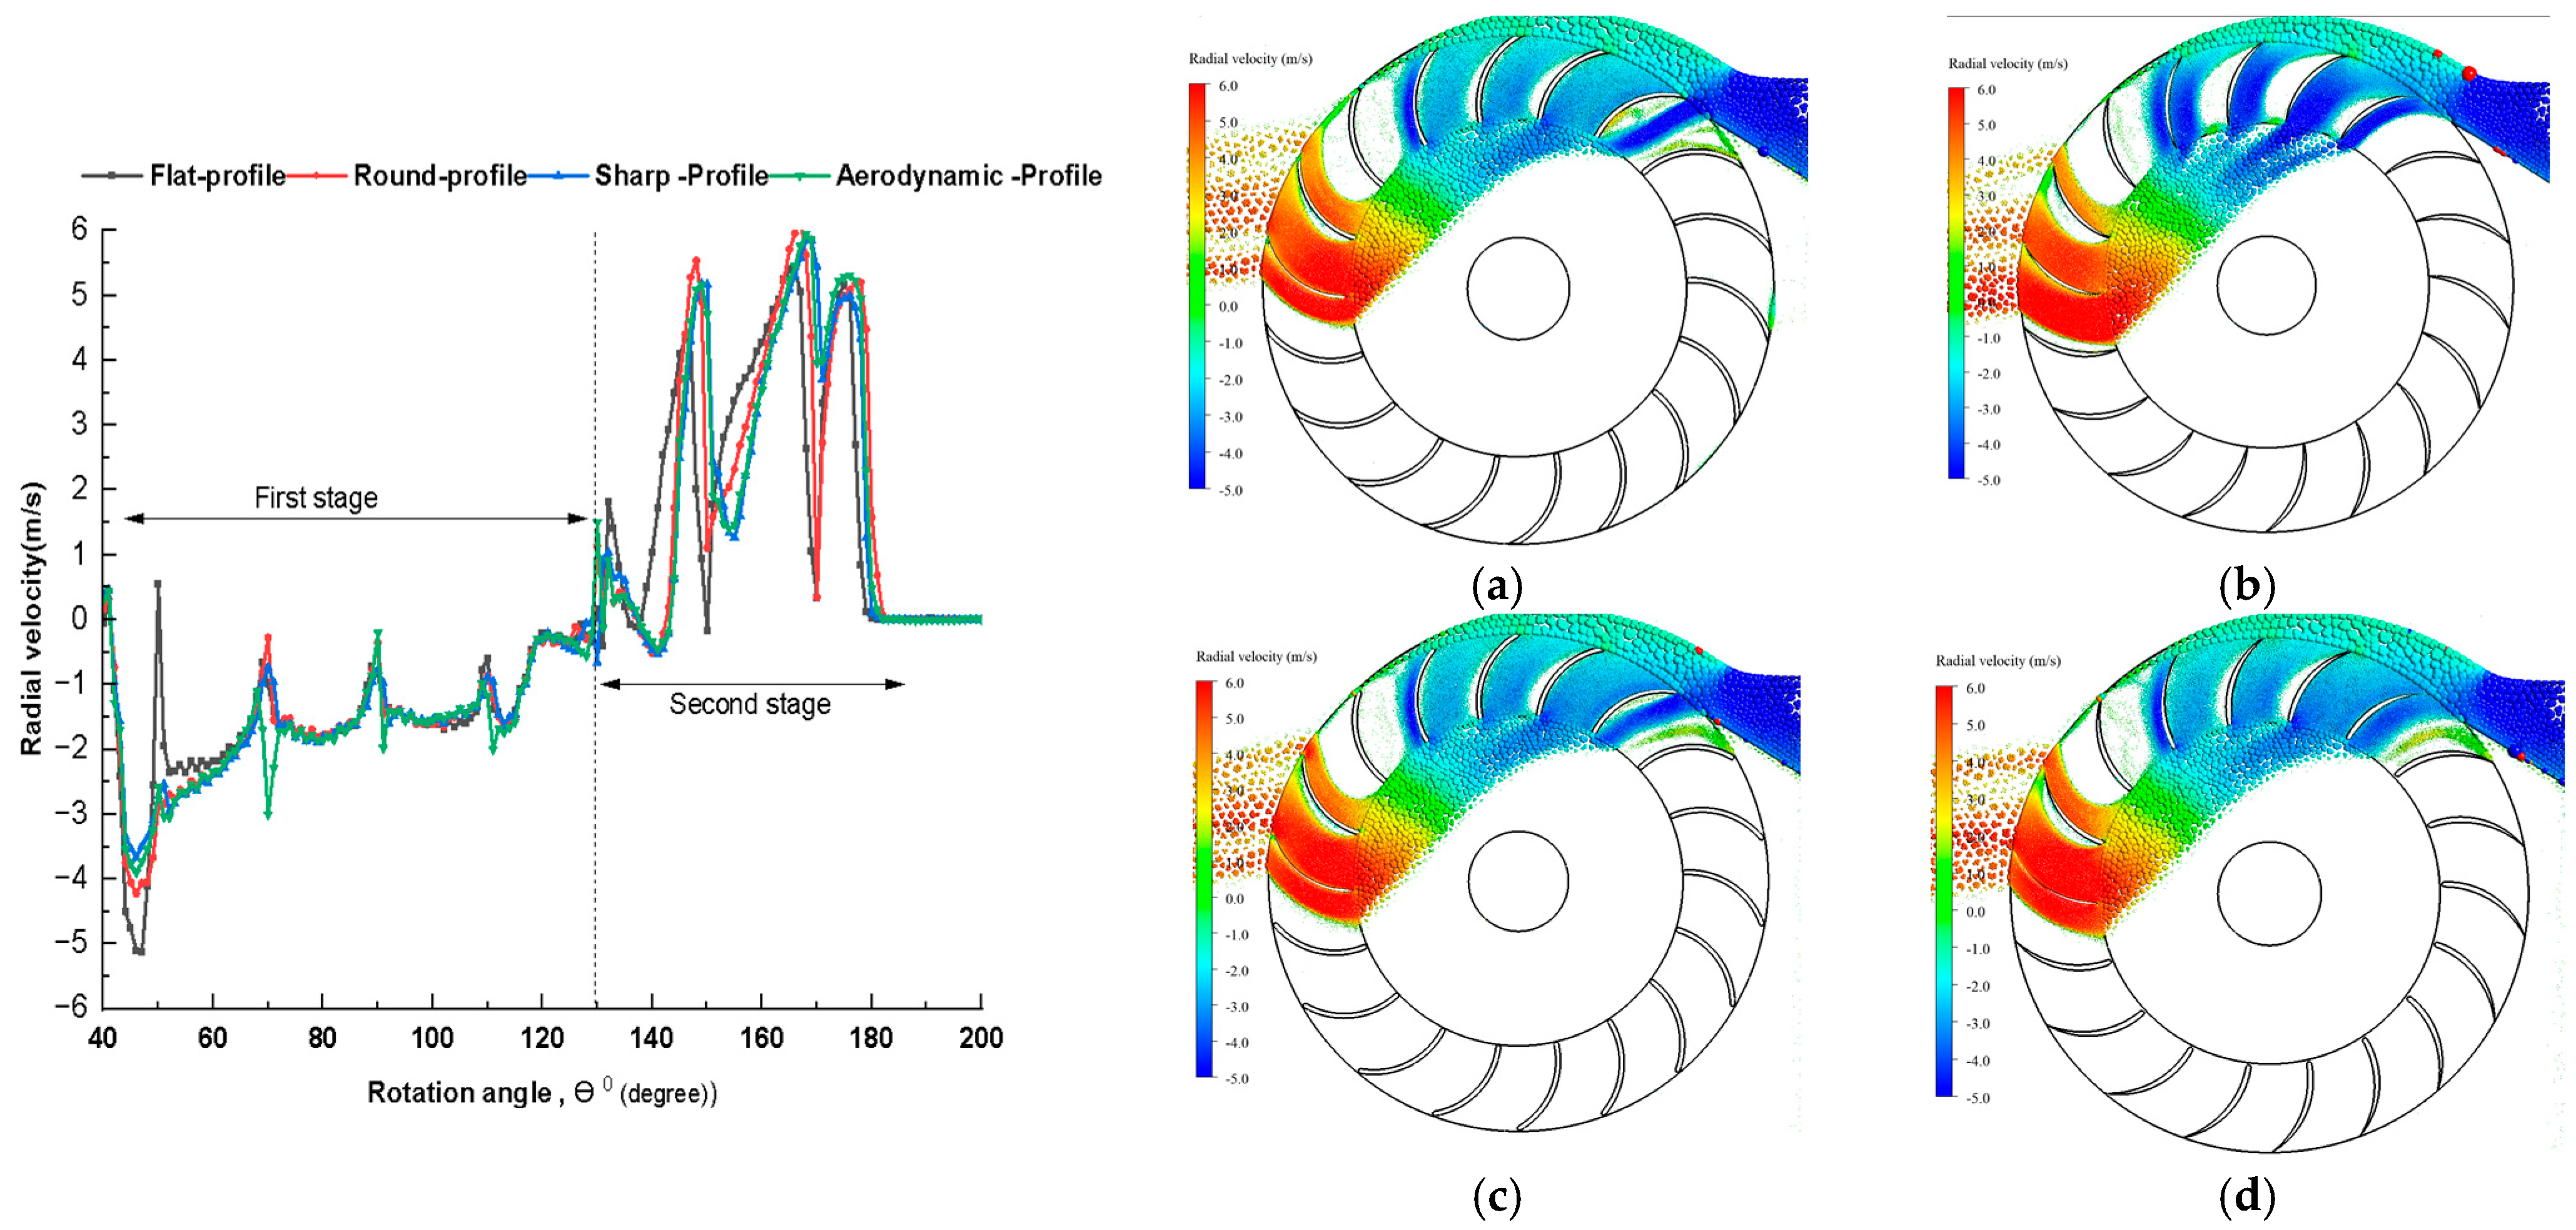
3.1.2. Radial Velocity Component

The radial velocity distributions at 800 rpm are shown in Figure 12. The flat and sharp blades exhibit flow irregularities, including backflow and radial dispersion. The aerodynamic and round blades maintain a smoother radial progression and reduced separation. The aerodynamic blade, in particular, sustains a more uniform radial flow conducive to stable energy transfer. In general, Aerodynamic and sharp blades consistently promote favorable flow structures across runner speeds. Peak performance is observed at 670–800 rpm, where both tangential and radial velocity components are optimally aligned with the blade motion. At lower and higher speeds, increased turbulence and misalignment reduce the performance, particularly in flat and round profiles. Among the tested geometries, the aerodynamic blade provided the most stable flow, lowest turbulence, and highest efficiency across the operational range.

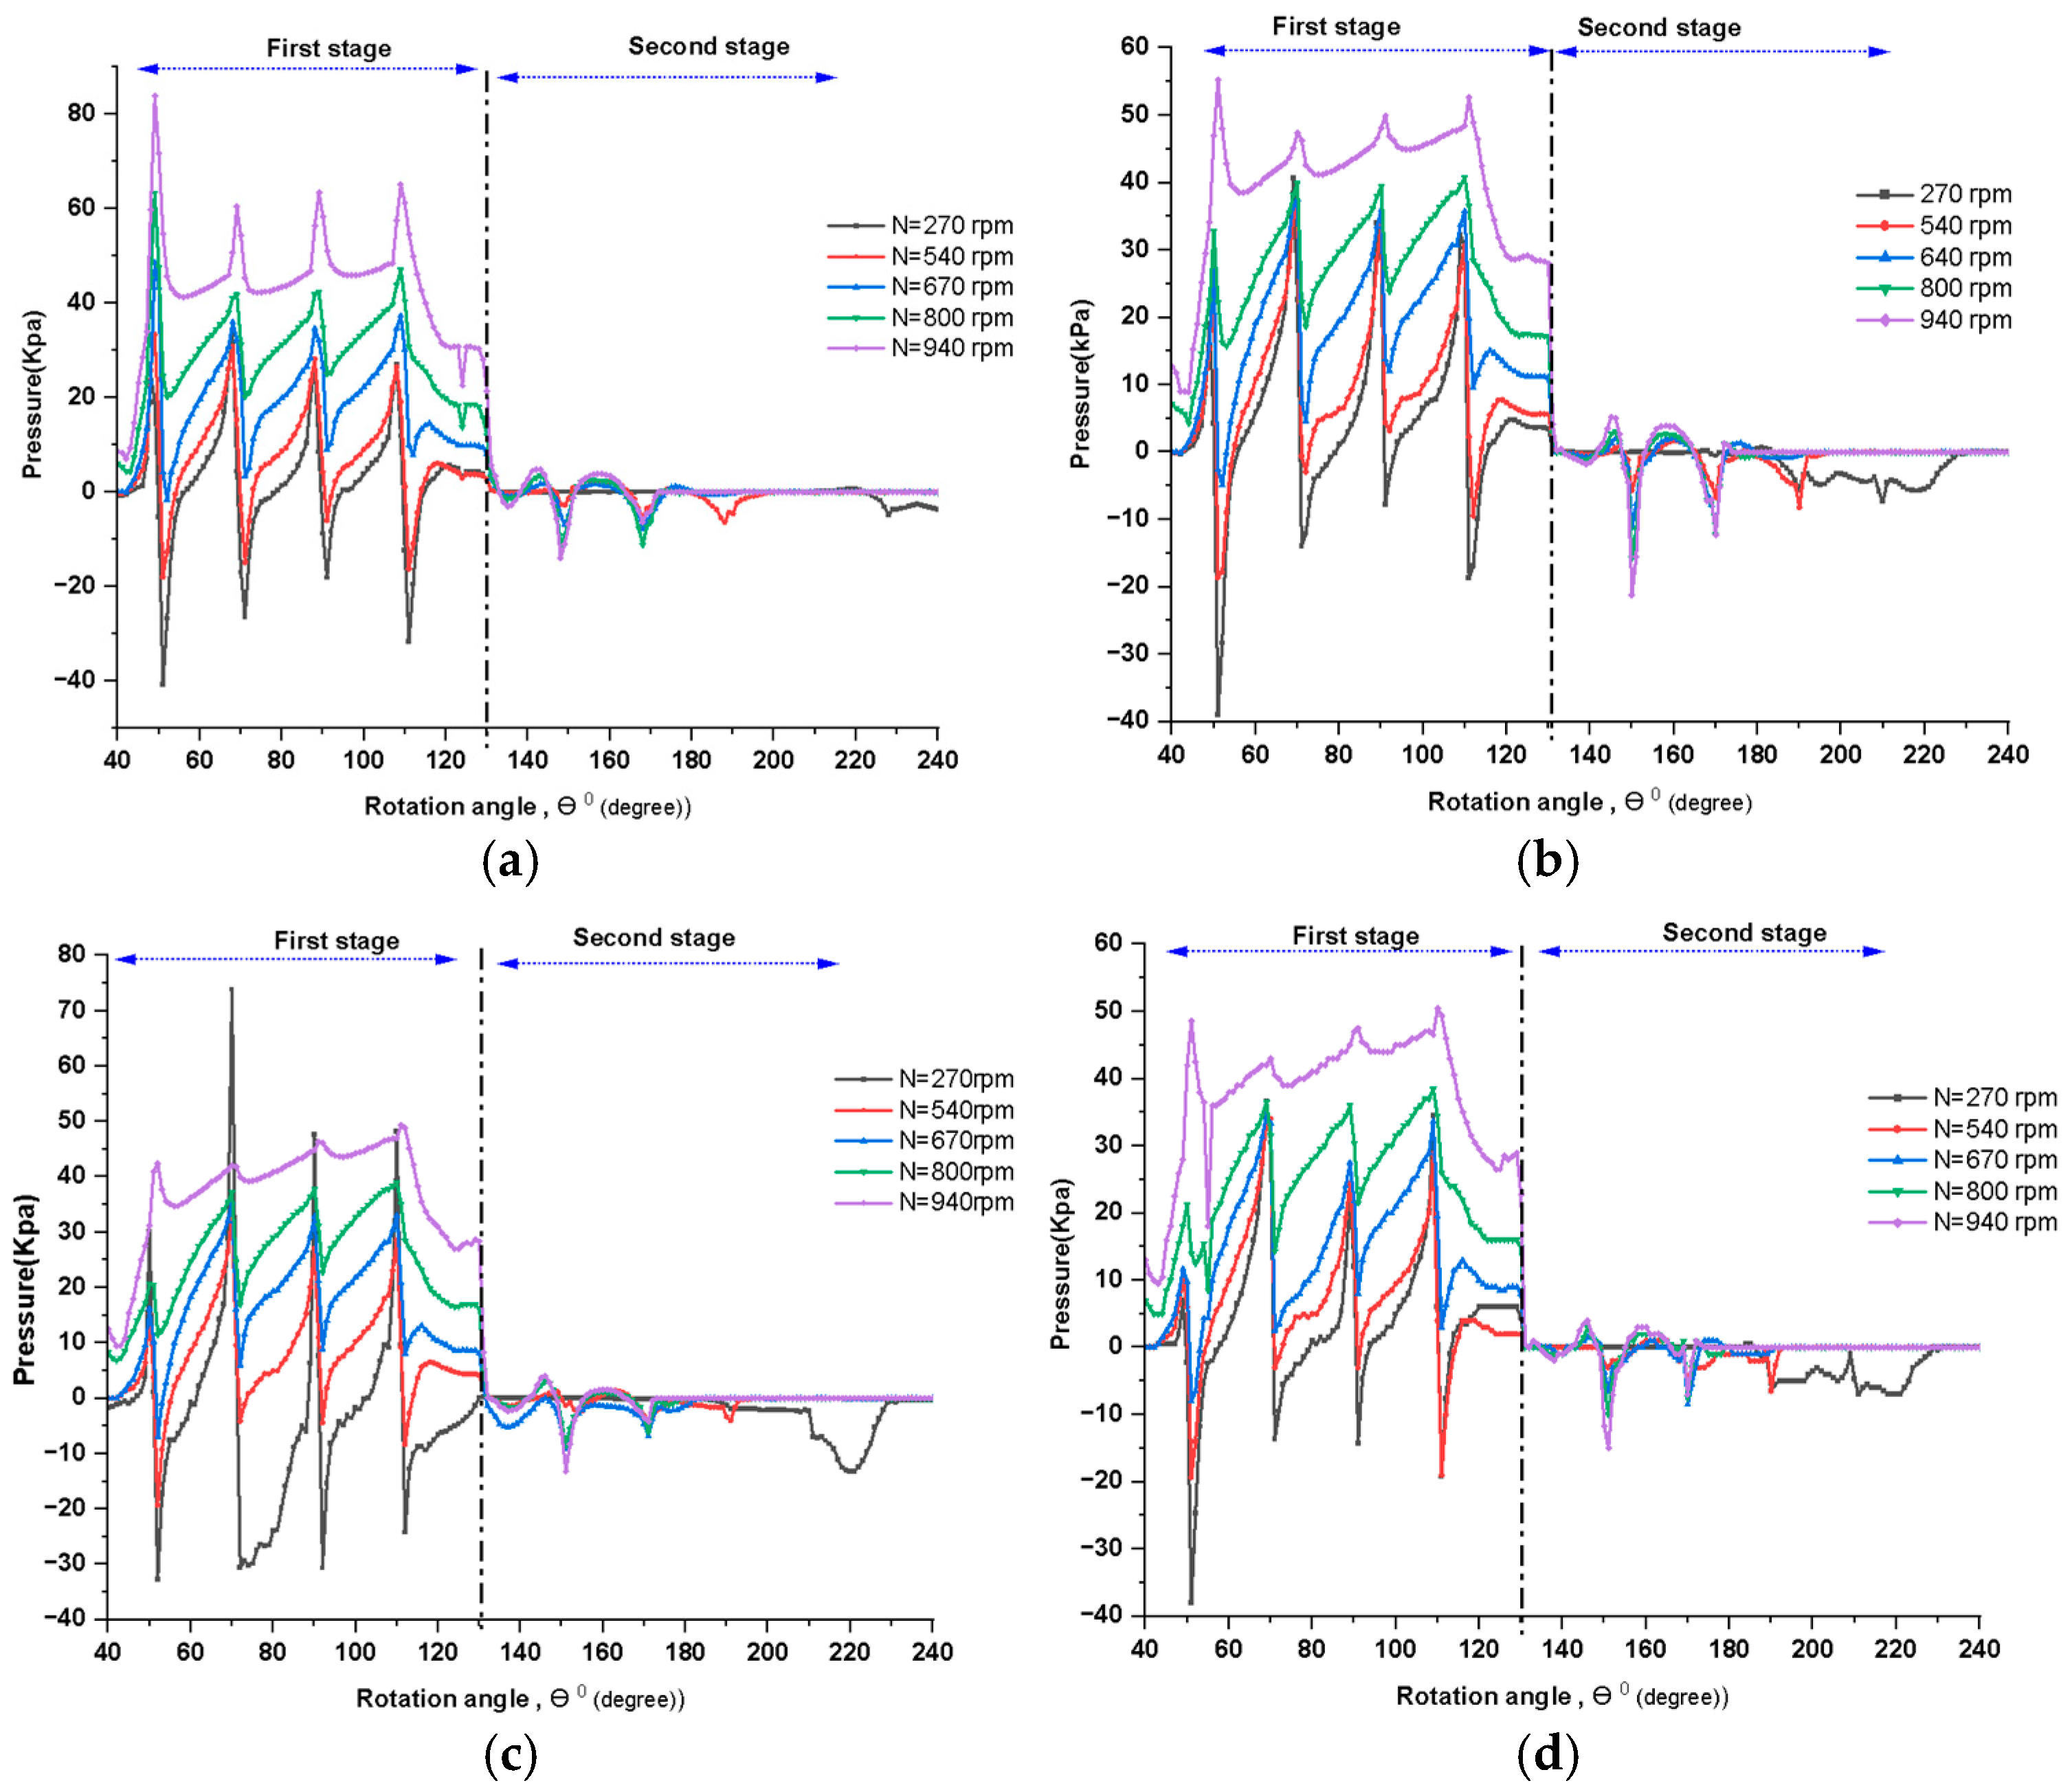
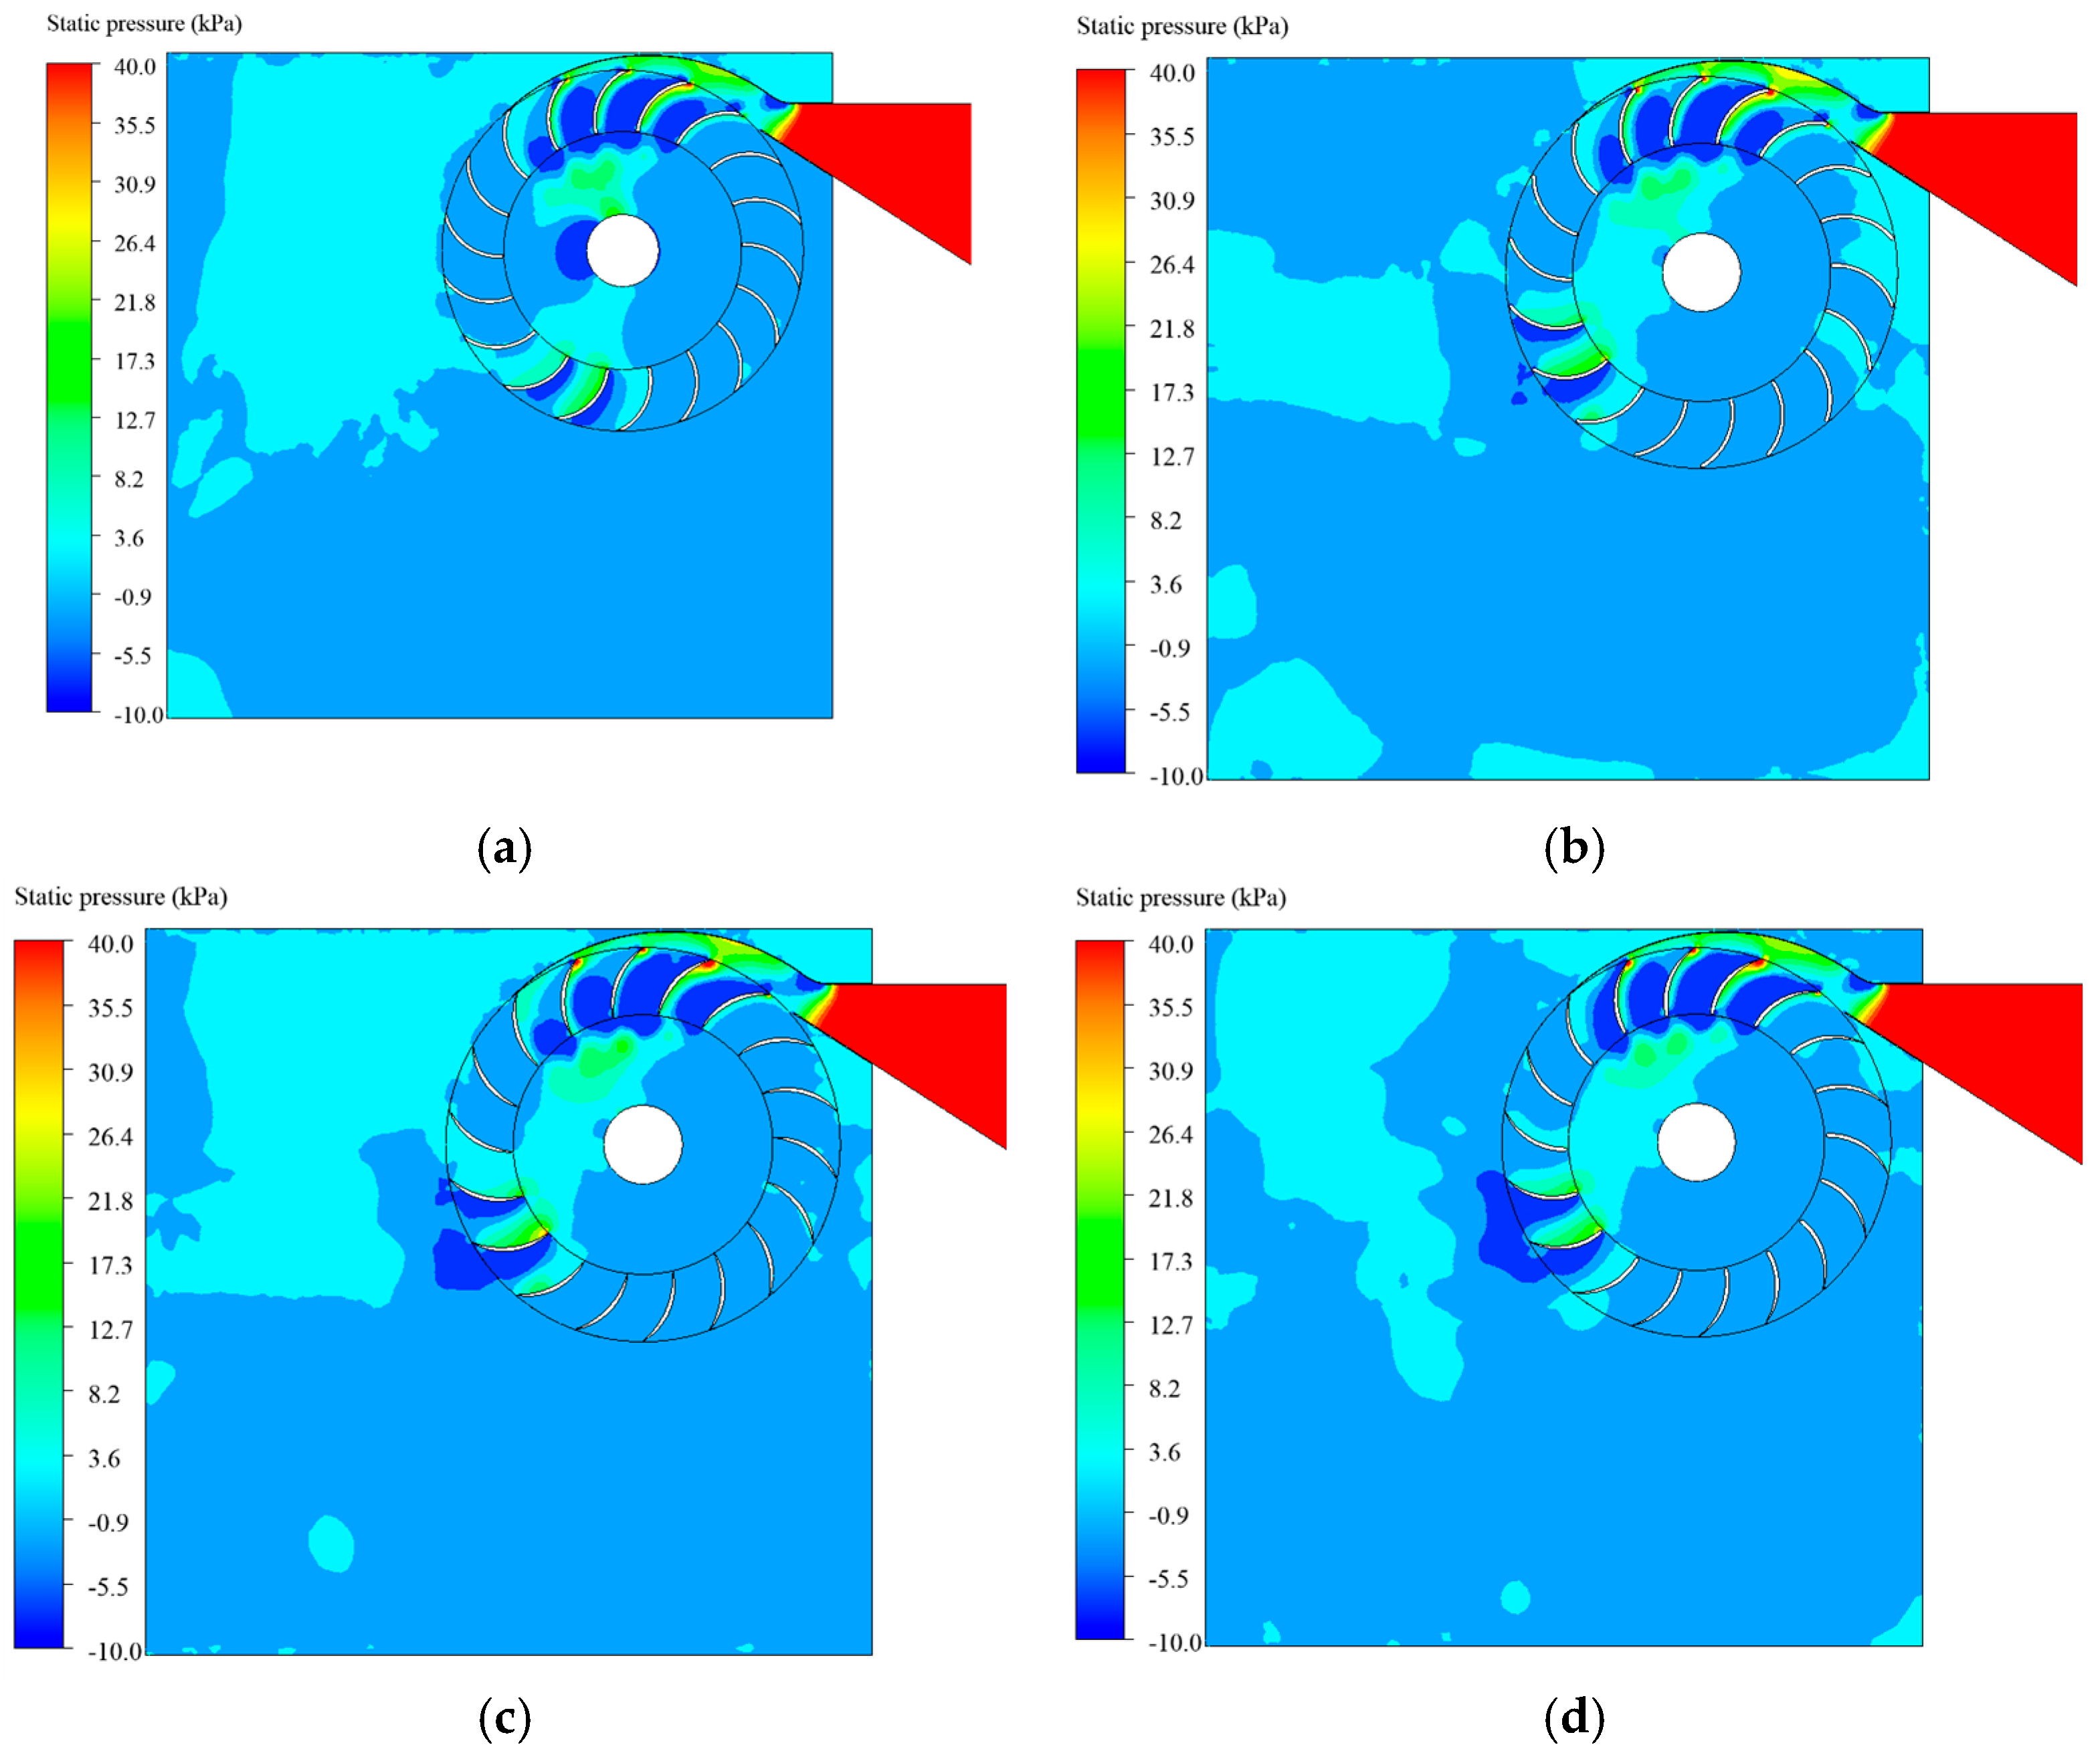
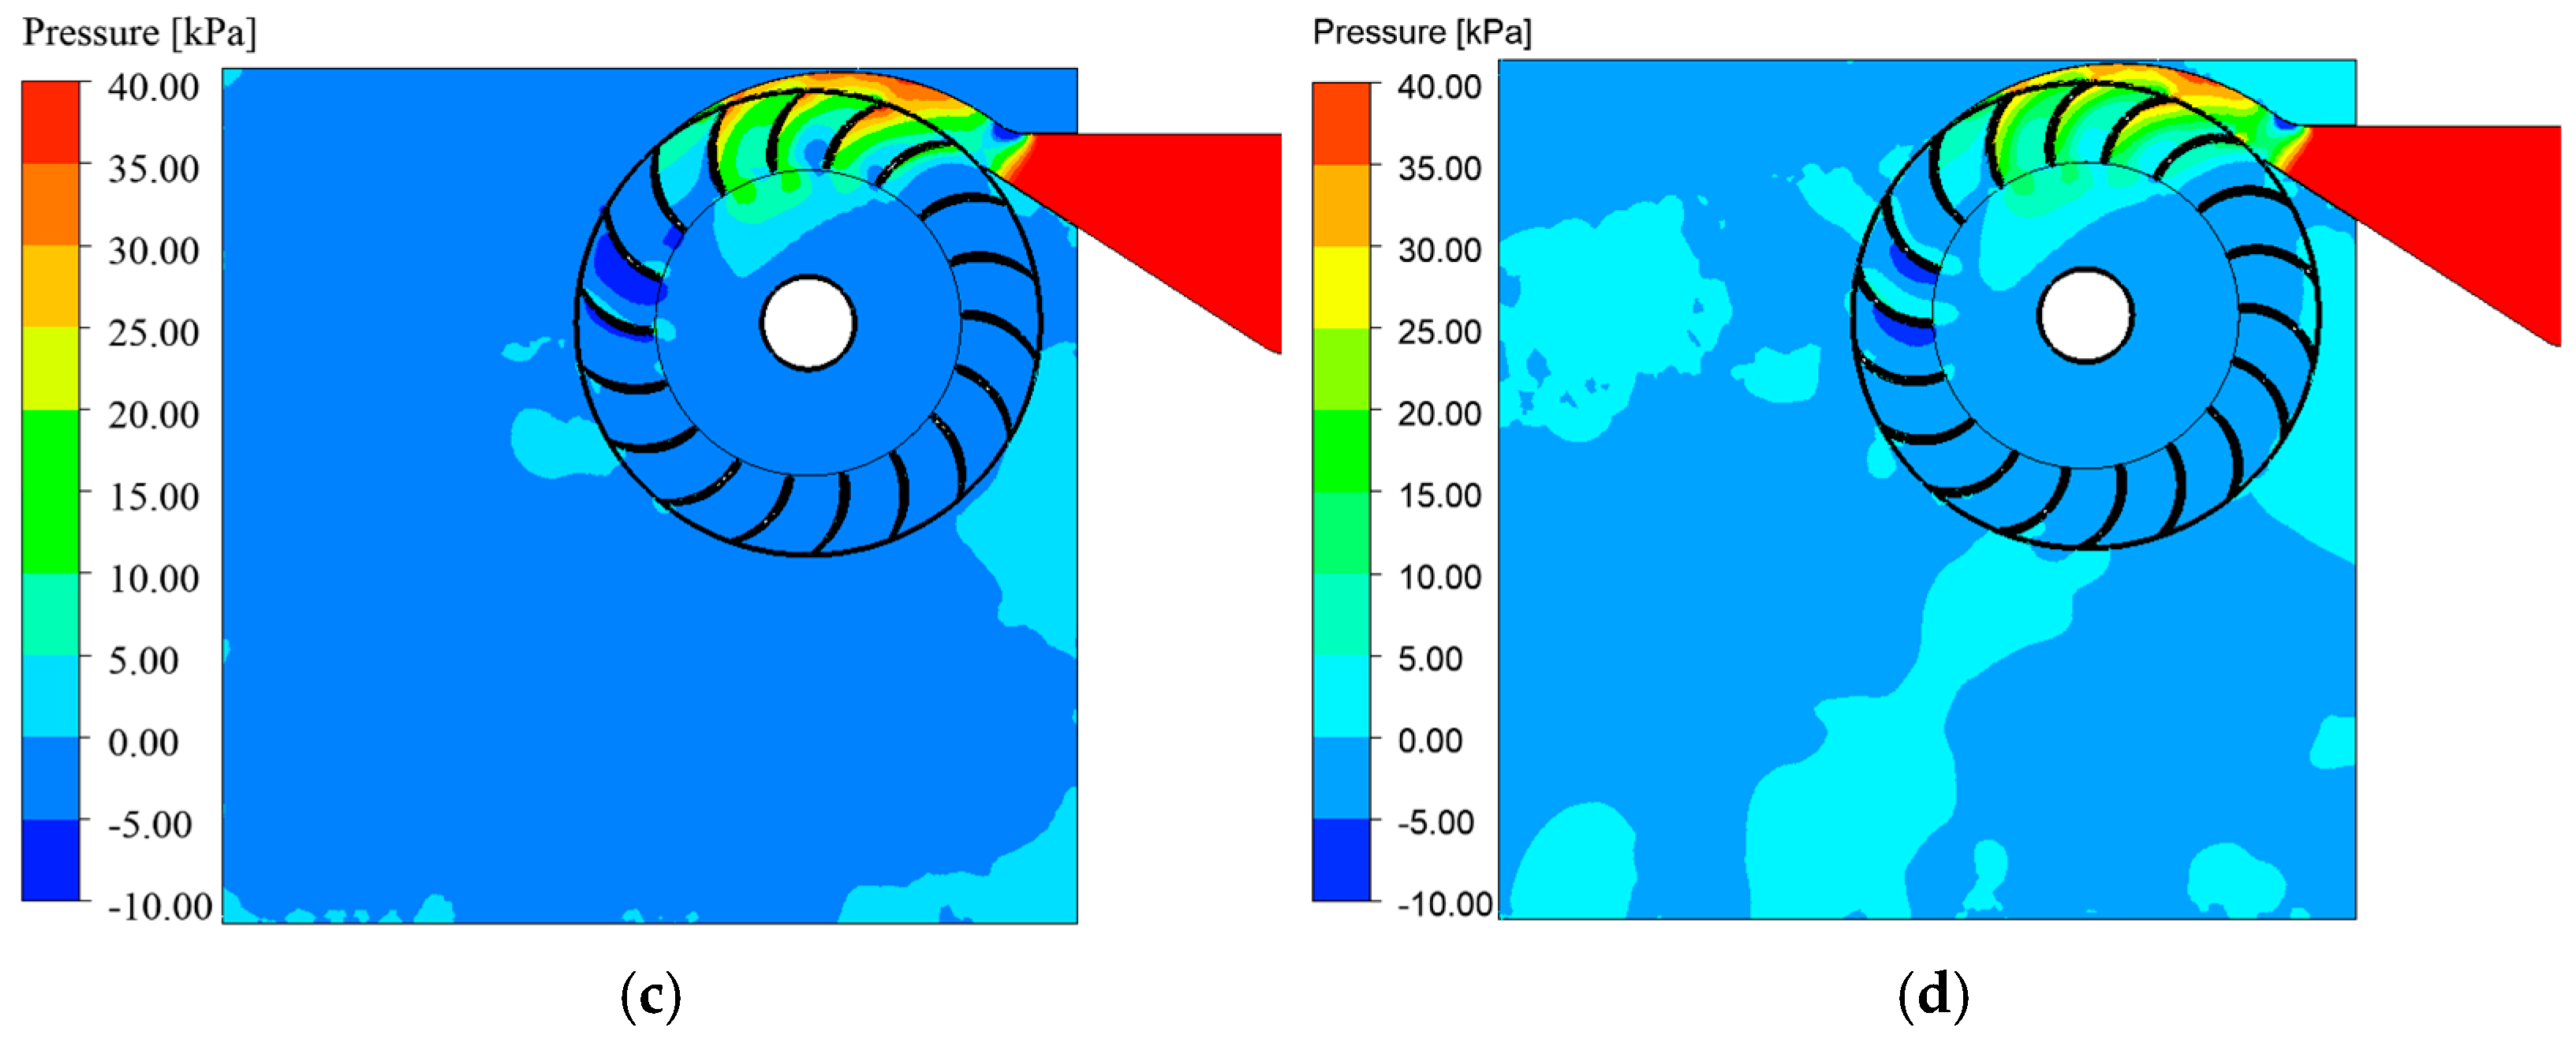
3.2. Pressure Distribution Analysis

The pressure distribution within the runner domain provides critical insight into the energy conversion mechanisms across the blade profiles and operating speeds. Figure 13 presents the static pressure contours for different blade geometries and runner speeds. As expected, the pressure gradients intensified with increasing runner speed, with the most significant static pressure drop occurring in the first stage, confirming its partially reactive behavior. In contrast, the second stage—vented to atmospheric conditions—exhibits the characteristics of an impulse stage.
At lower speeds (270–540 rpm), inefficient blade–fluid interaction leads to non-uniform pressure fields and stagnation zones, particularly with flat and round blades. These profiles suffer from premature pressure losses due to poor flow redirection and localized recirculation (Figure 14). Aerodynamic blades demonstrate a more favorable pressure recovery, with smoother gradients across the runner.
At the optimal runner speed of 670 rpm, the aerodynamic profile exhibits the steepest and most uniform pressure drop (Figure 15), indicating efficient energy transfer and minimal flow detachment. Sharp blades also maintain a relatively smooth pressure profile, whereas flat and round blades show residual pockets of high pressure due to flow misalignment.
At higher speeds (800–940 rpm), increased blade–flow velocity differentials induce localized pressure disturbances, especially for flat and round blades. The aerodynamic and sharp blades mitigate these instabilities by maintaining smooth deceleration and pressure recovery. Figure 16 details the angular variation in the static and total pressures along the runner periphery at 800 rpm. The aerodynamic blade sustains a gradual pressure decline through the first stage and prevents abrupt pressure recovery in the second, thereby reducing the cavitation risks.
Overall, the pressure distribution trends confirm that the blade geometry significantly influences the internal flow stability and energy extraction. Aerodynamic blades consistently exhibit superior pressure gradients and smoother transitions, especially at optimal runner speeds, reinforcing their suitability for high-efficiency CFT.

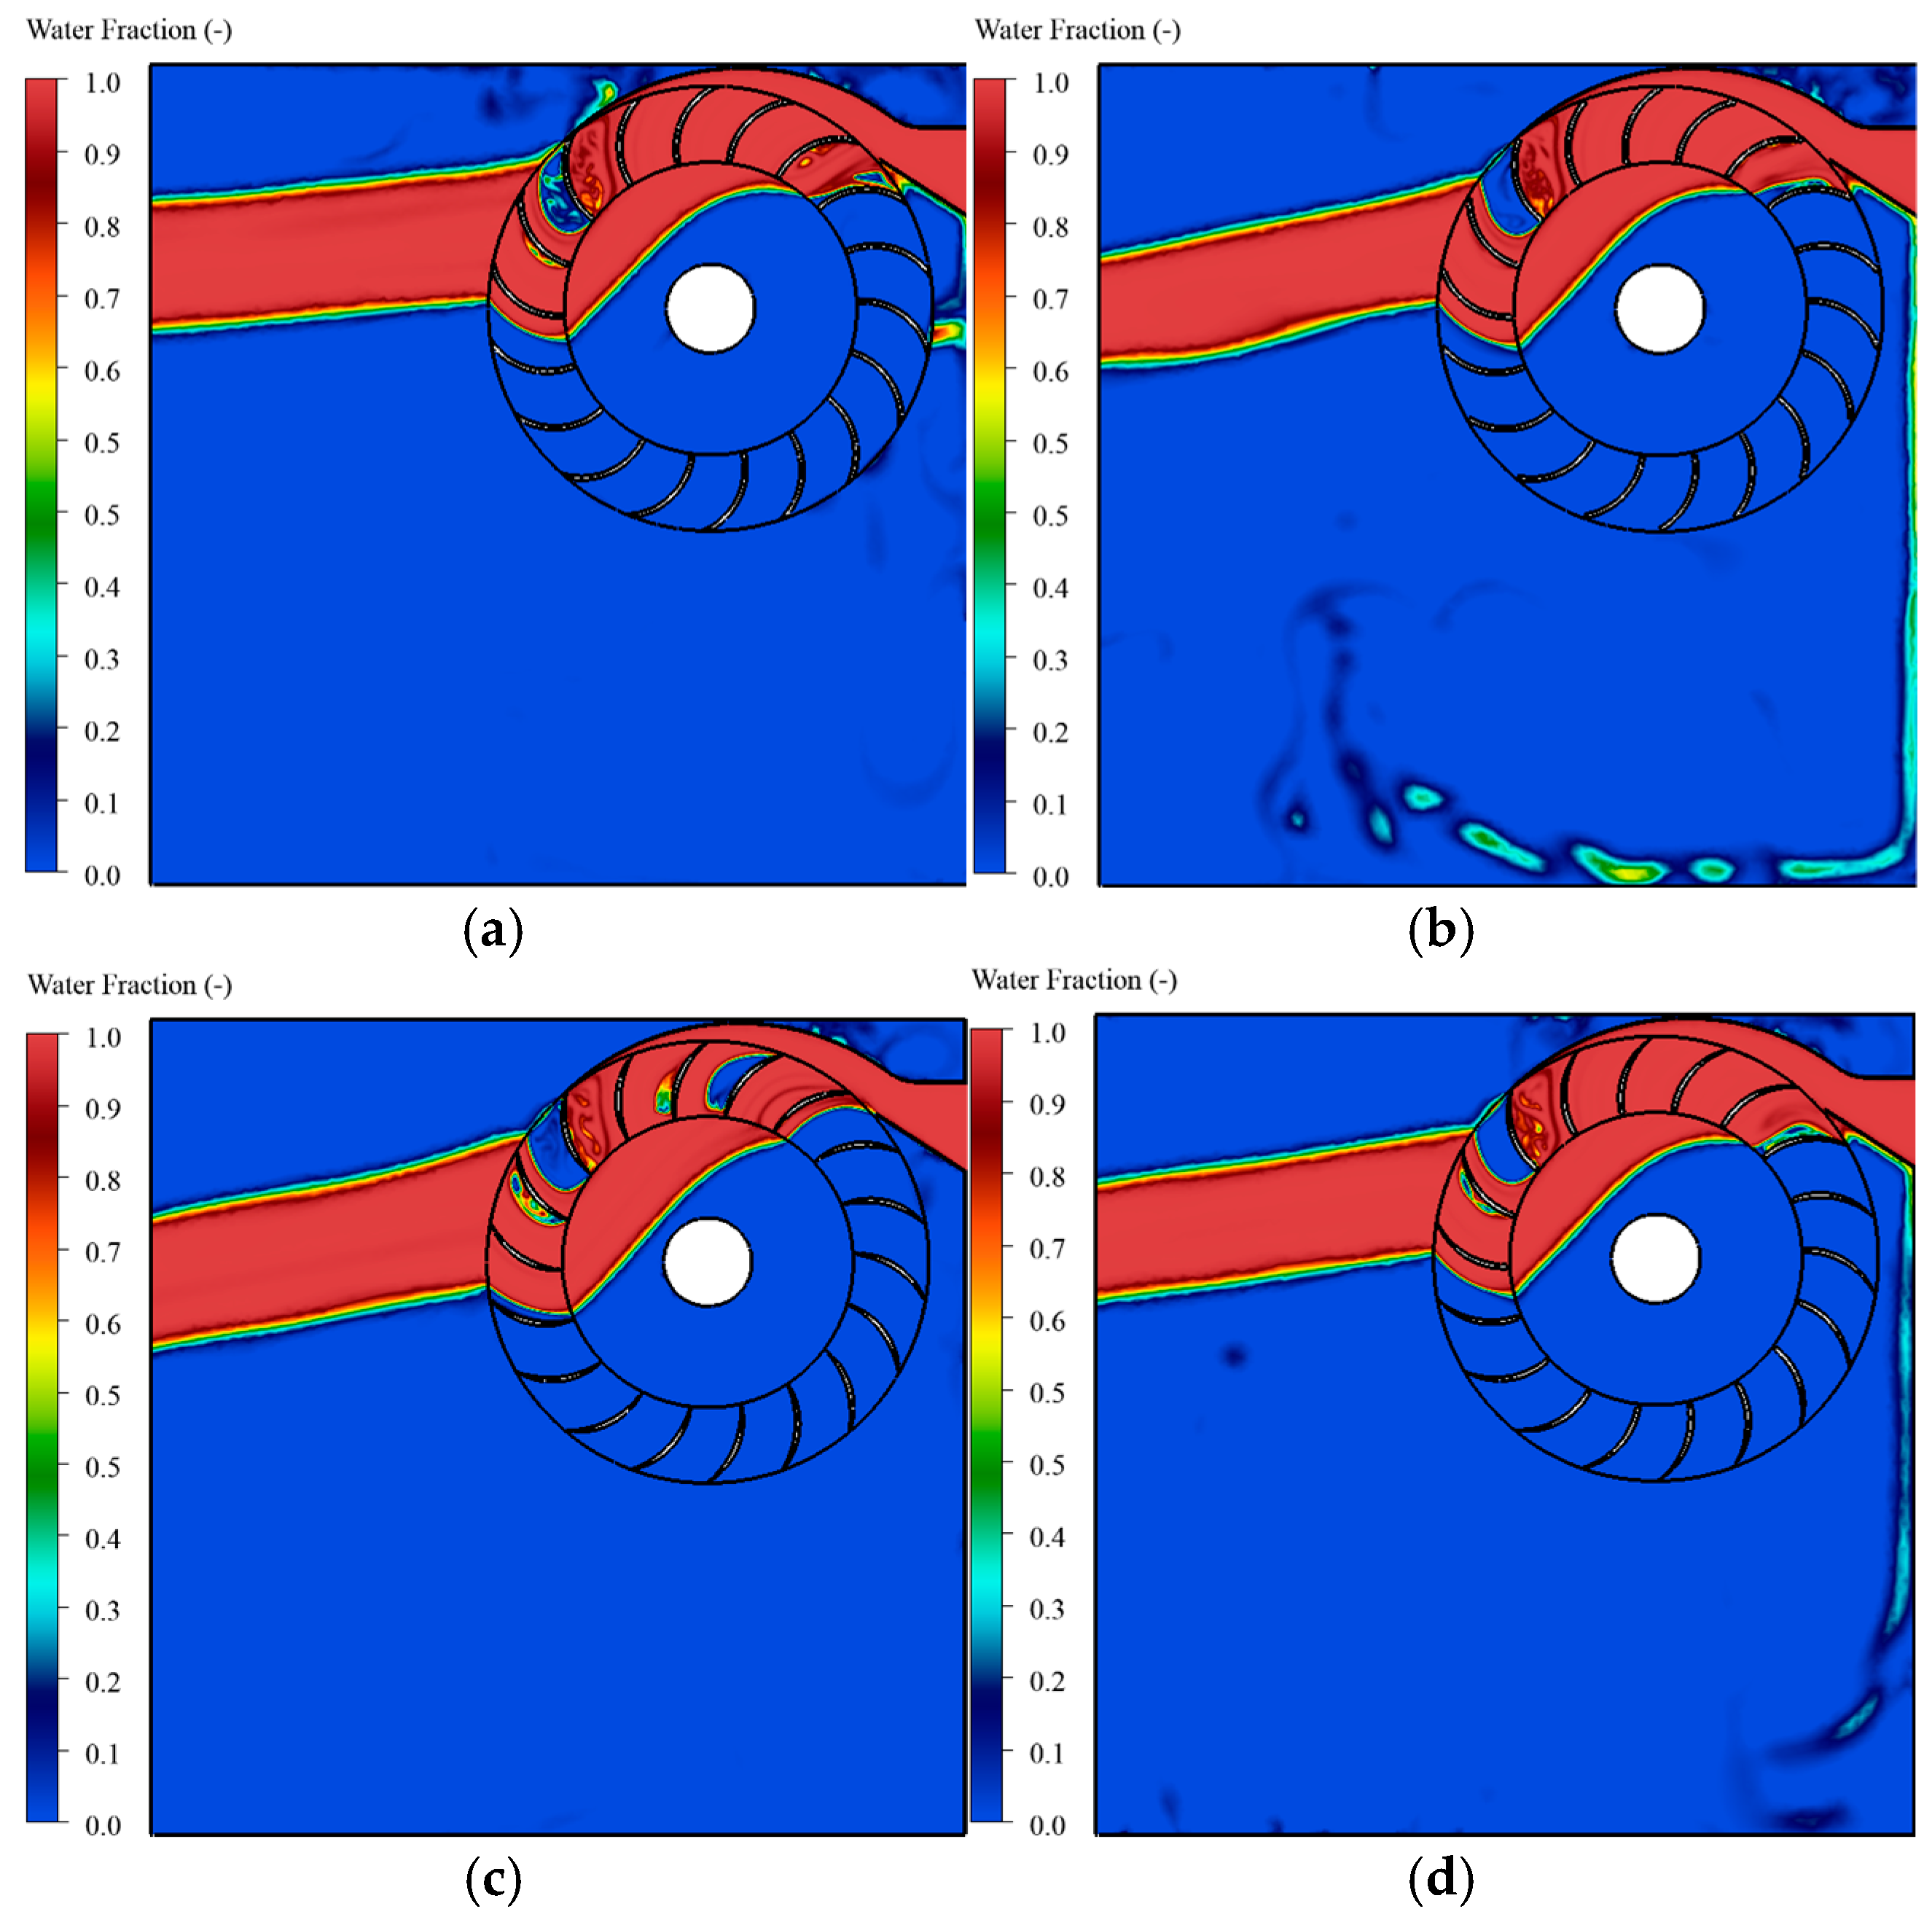
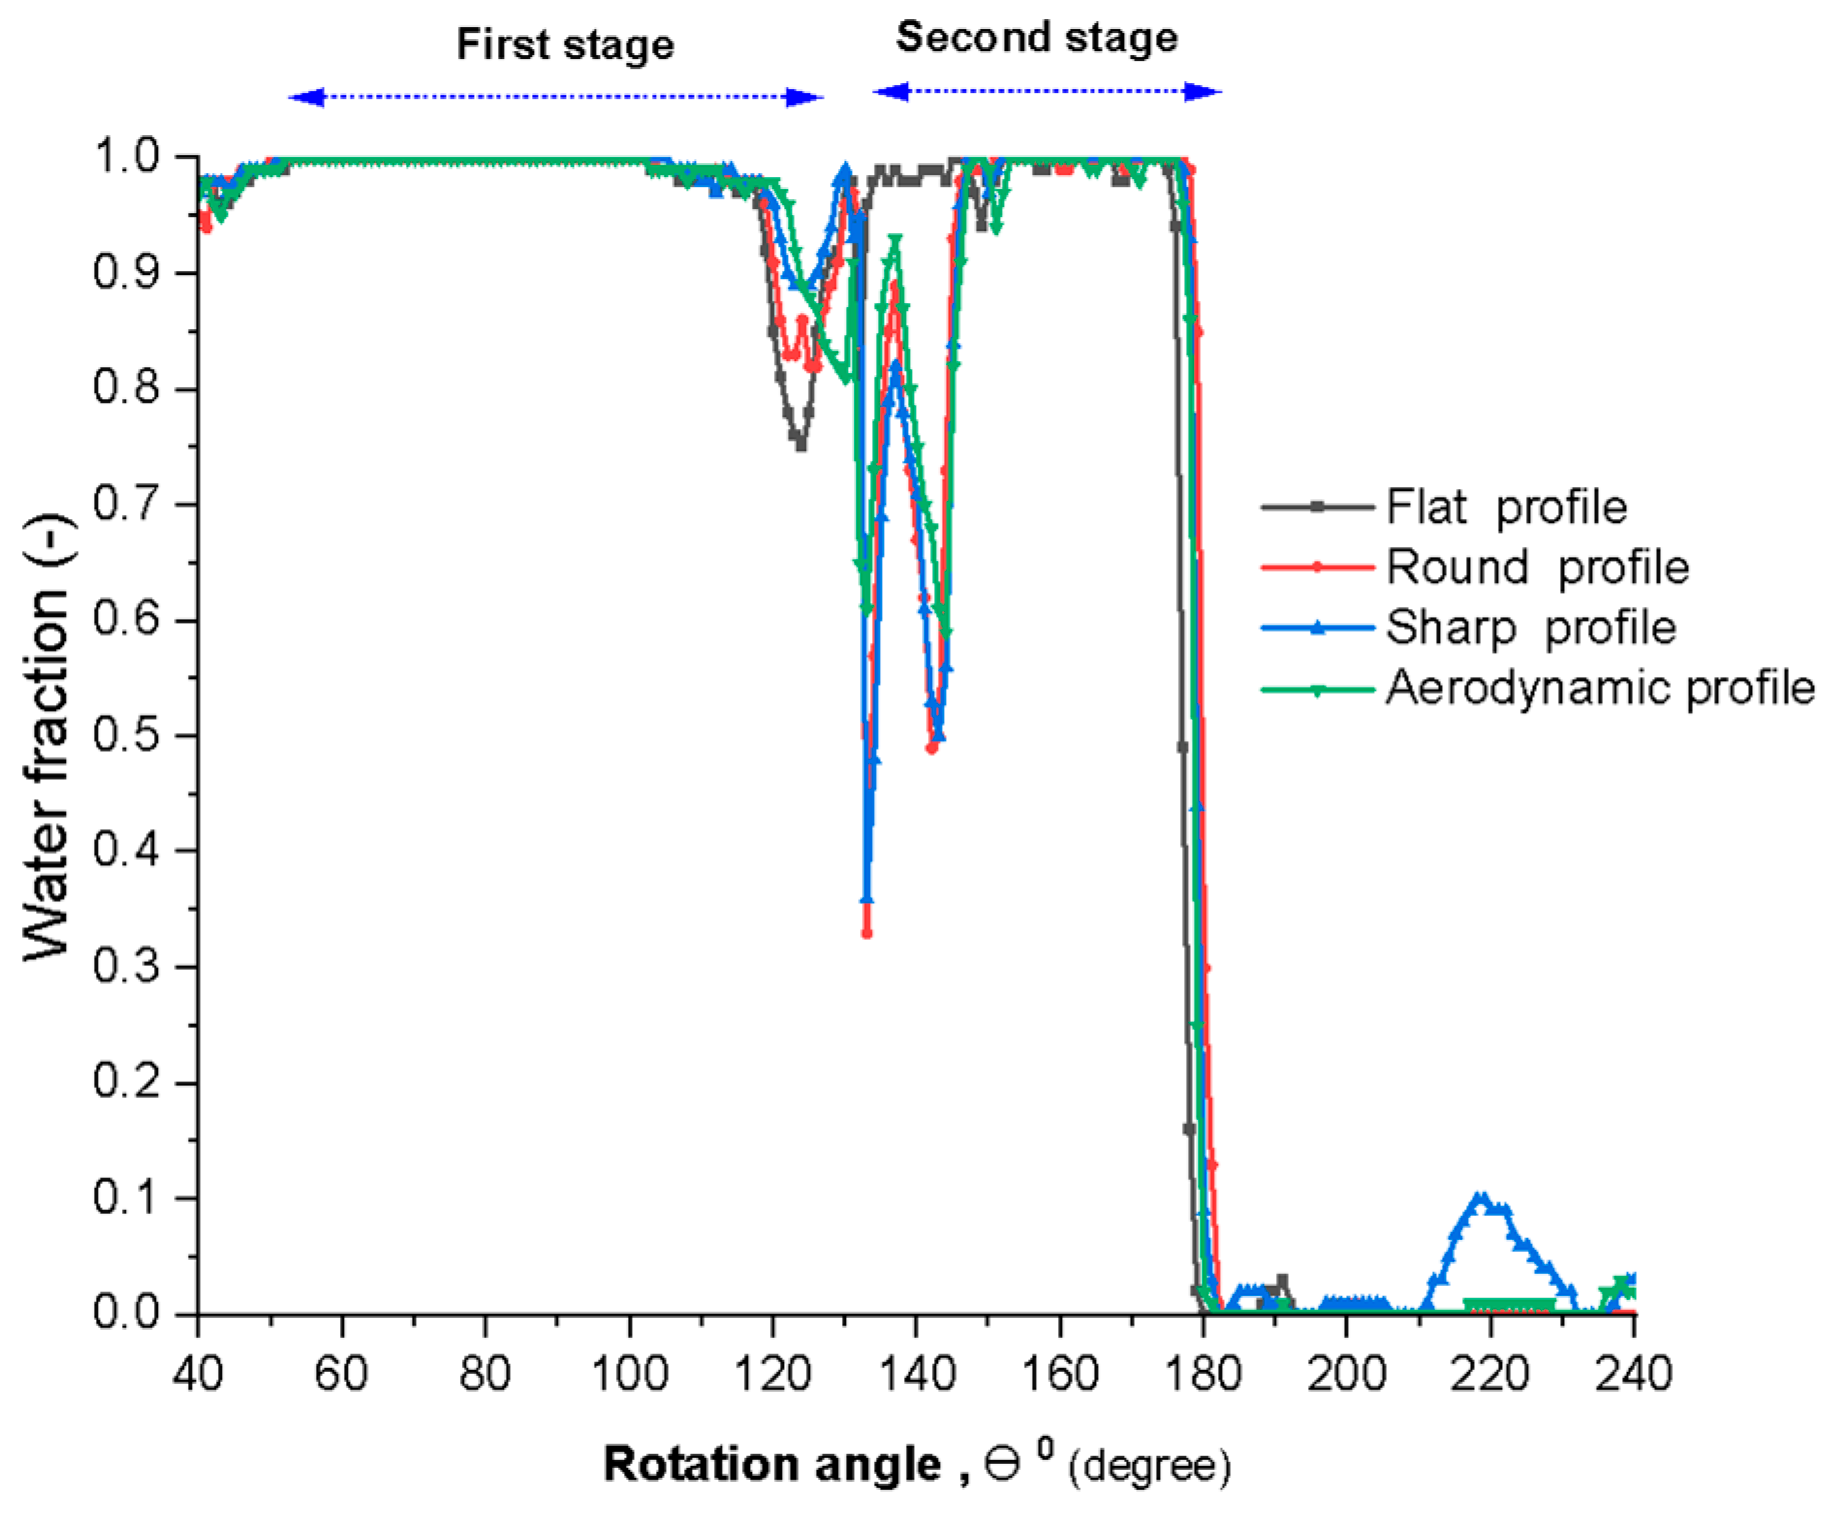
3.3. Water Volume Fraction Distribution

The water volume fraction (WVF), representing the proportion of the liquid phase within the computational domain, serves as a critical metric for evaluating the flow stability, phase continuity, and potential cavitation within a CFT. A near-unity WVF indicates minimal entrainment of vapor or air and confirms consistent energy transmission across the rotor stages. Figure 17 depicts the water fraction profile at the optimal runner speed. The aerodynamic blade demonstrates the most favorable performance, sustaining high liquid phase continuity across both turbine stages. In contrast, the flat and round blades showed localized voids near the trailing edge and hub regions, indicative of poor flow guidance and incipient cavitation.
At low runner speeds (e.g., 270 rpm), reduced blade rotation relative to the flow velocity leads to significant flow misalignment, vortex shedding, and recirculation. These effects result in sporadic vapor pockets near structural boundaries—particularly in the flat and round blade configurations—due to their suboptimal hydrodynamic profiles. As the runner speed increases to intermediate levels (540–670 rpm), the blade motion becomes better synchronized with the incoming flow, thereby reducing void formation and promoting full-phase continuity.
At the optimal speed of 670 rpm, the WVF nears unity across the entire runner for the sharp and aerodynamic blade profiles, reflecting improved flow attachment, minimal detachment zones, and reduced turbulence. These profiles facilitate smoother transitions and preserve water integrity throughout the rotor, especially in the second stage, where pressure recovery is critical. However, at higher runner speeds (800–940 rpm), increased blade-induced turbulence introduces secondary flow instabilities, particularly in the flat and sharp profiles. Despite this, the aerodynamic blades continue to exhibit the most stable WVF distribution, sustaining near-complete water occupancy throughout the domain. Figure 18 further illustrates the localized WVF variations at 800 rpm, emphasizing the enhanced flow continuity achieved by the aerodynamic profile.

3.4. Influence of Runner Speed and Blade Geometry on the Internal Flow Behavior

A precise understanding of the internal flow behavior in CFTs is vital for optimizing blade performance under various operating conditions. Critical flow phenomena such as separation, recirculation, vortex shedding, and pressure recovery directly impact turbine efficiency and are highly dependent on both runner speed and blade geometry.

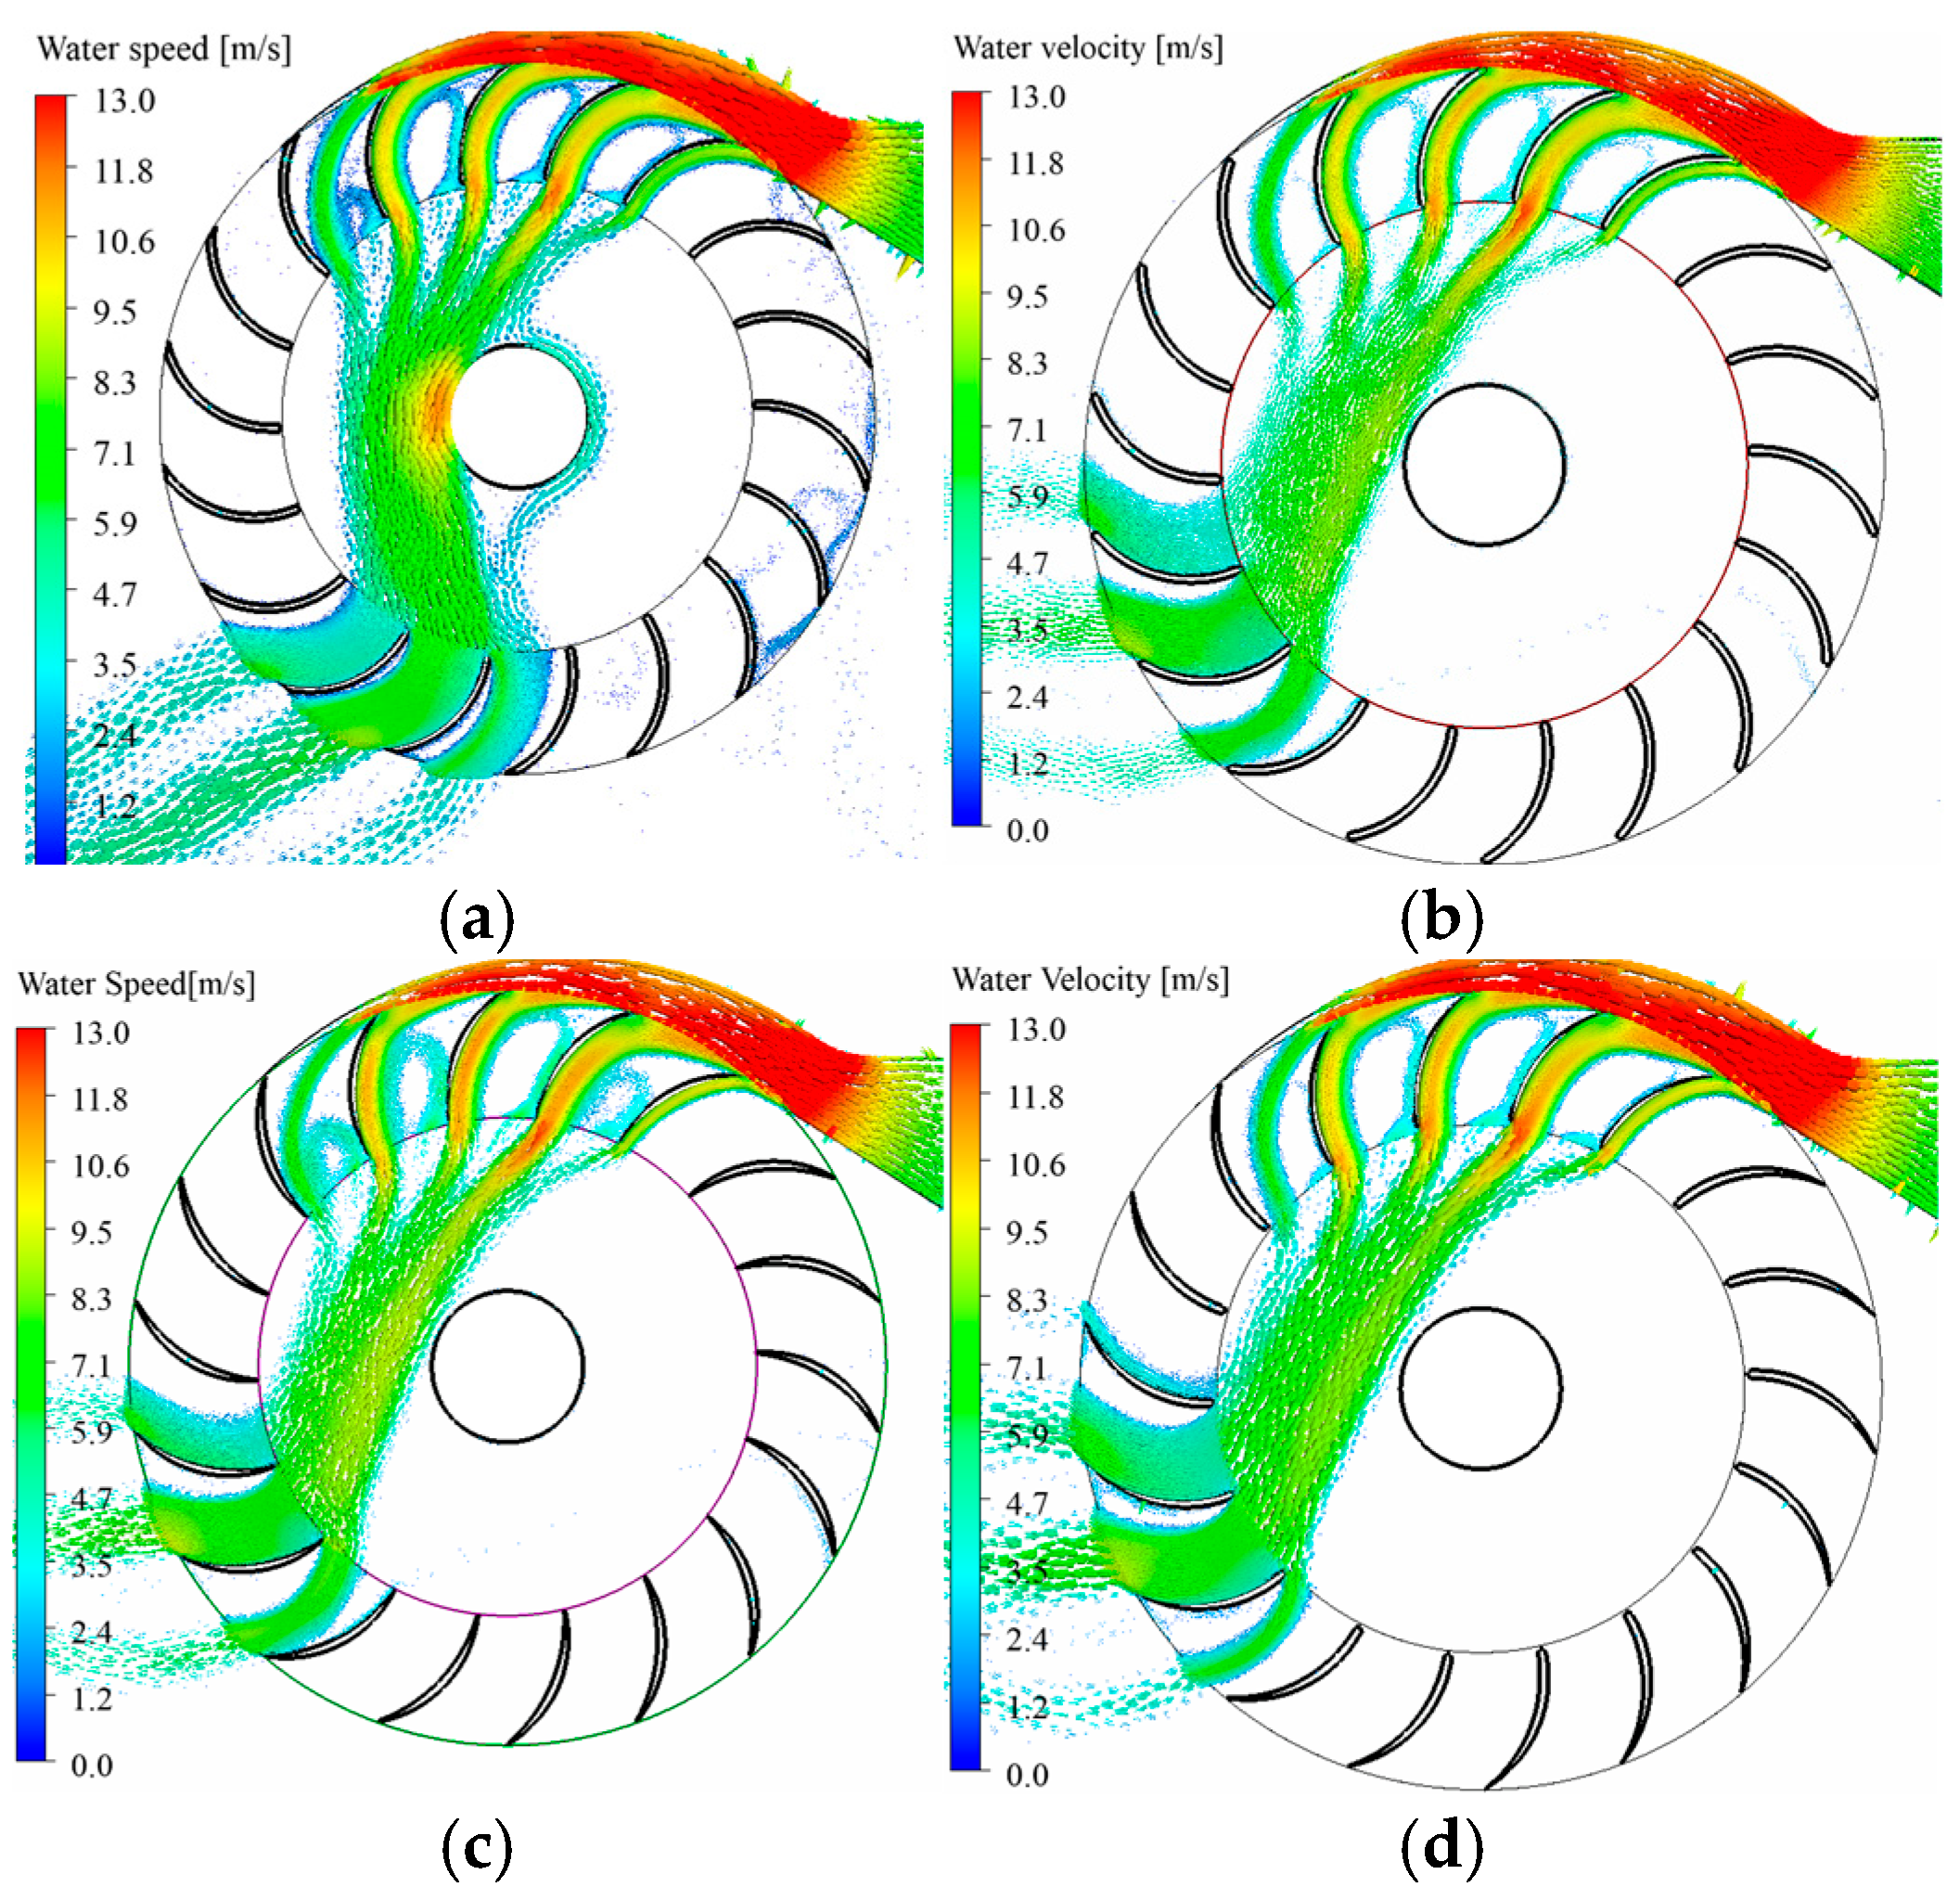
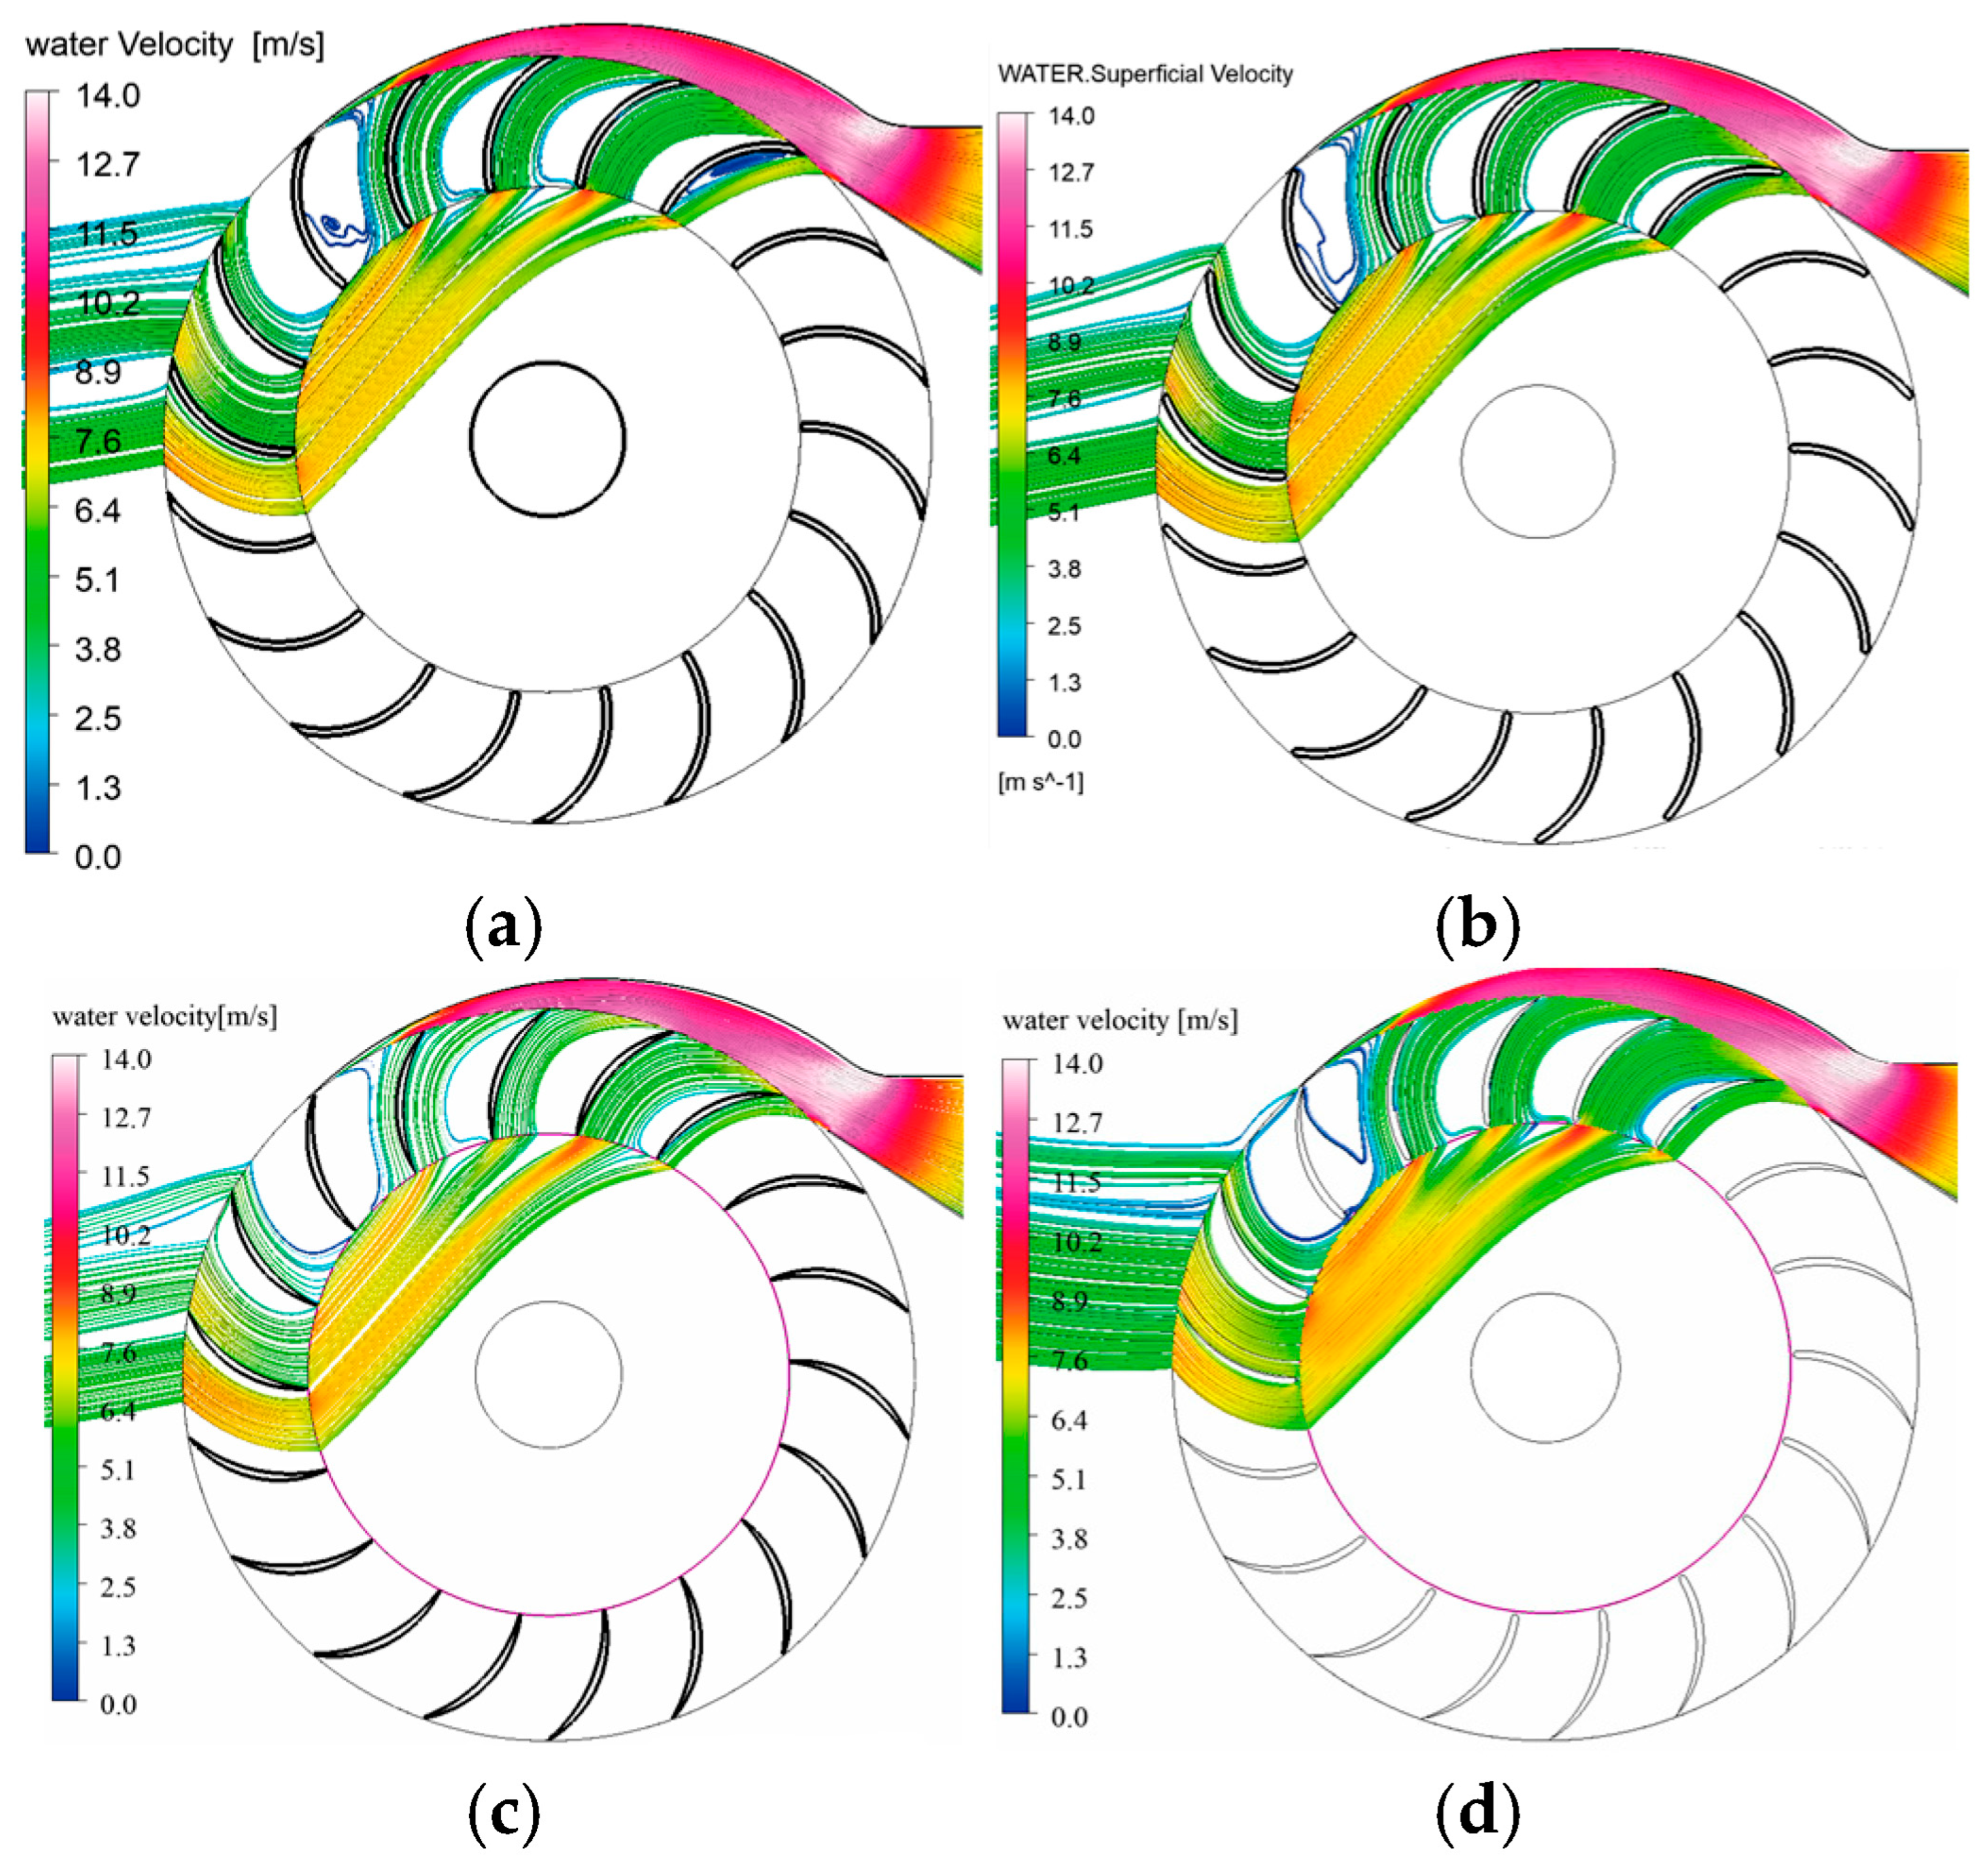
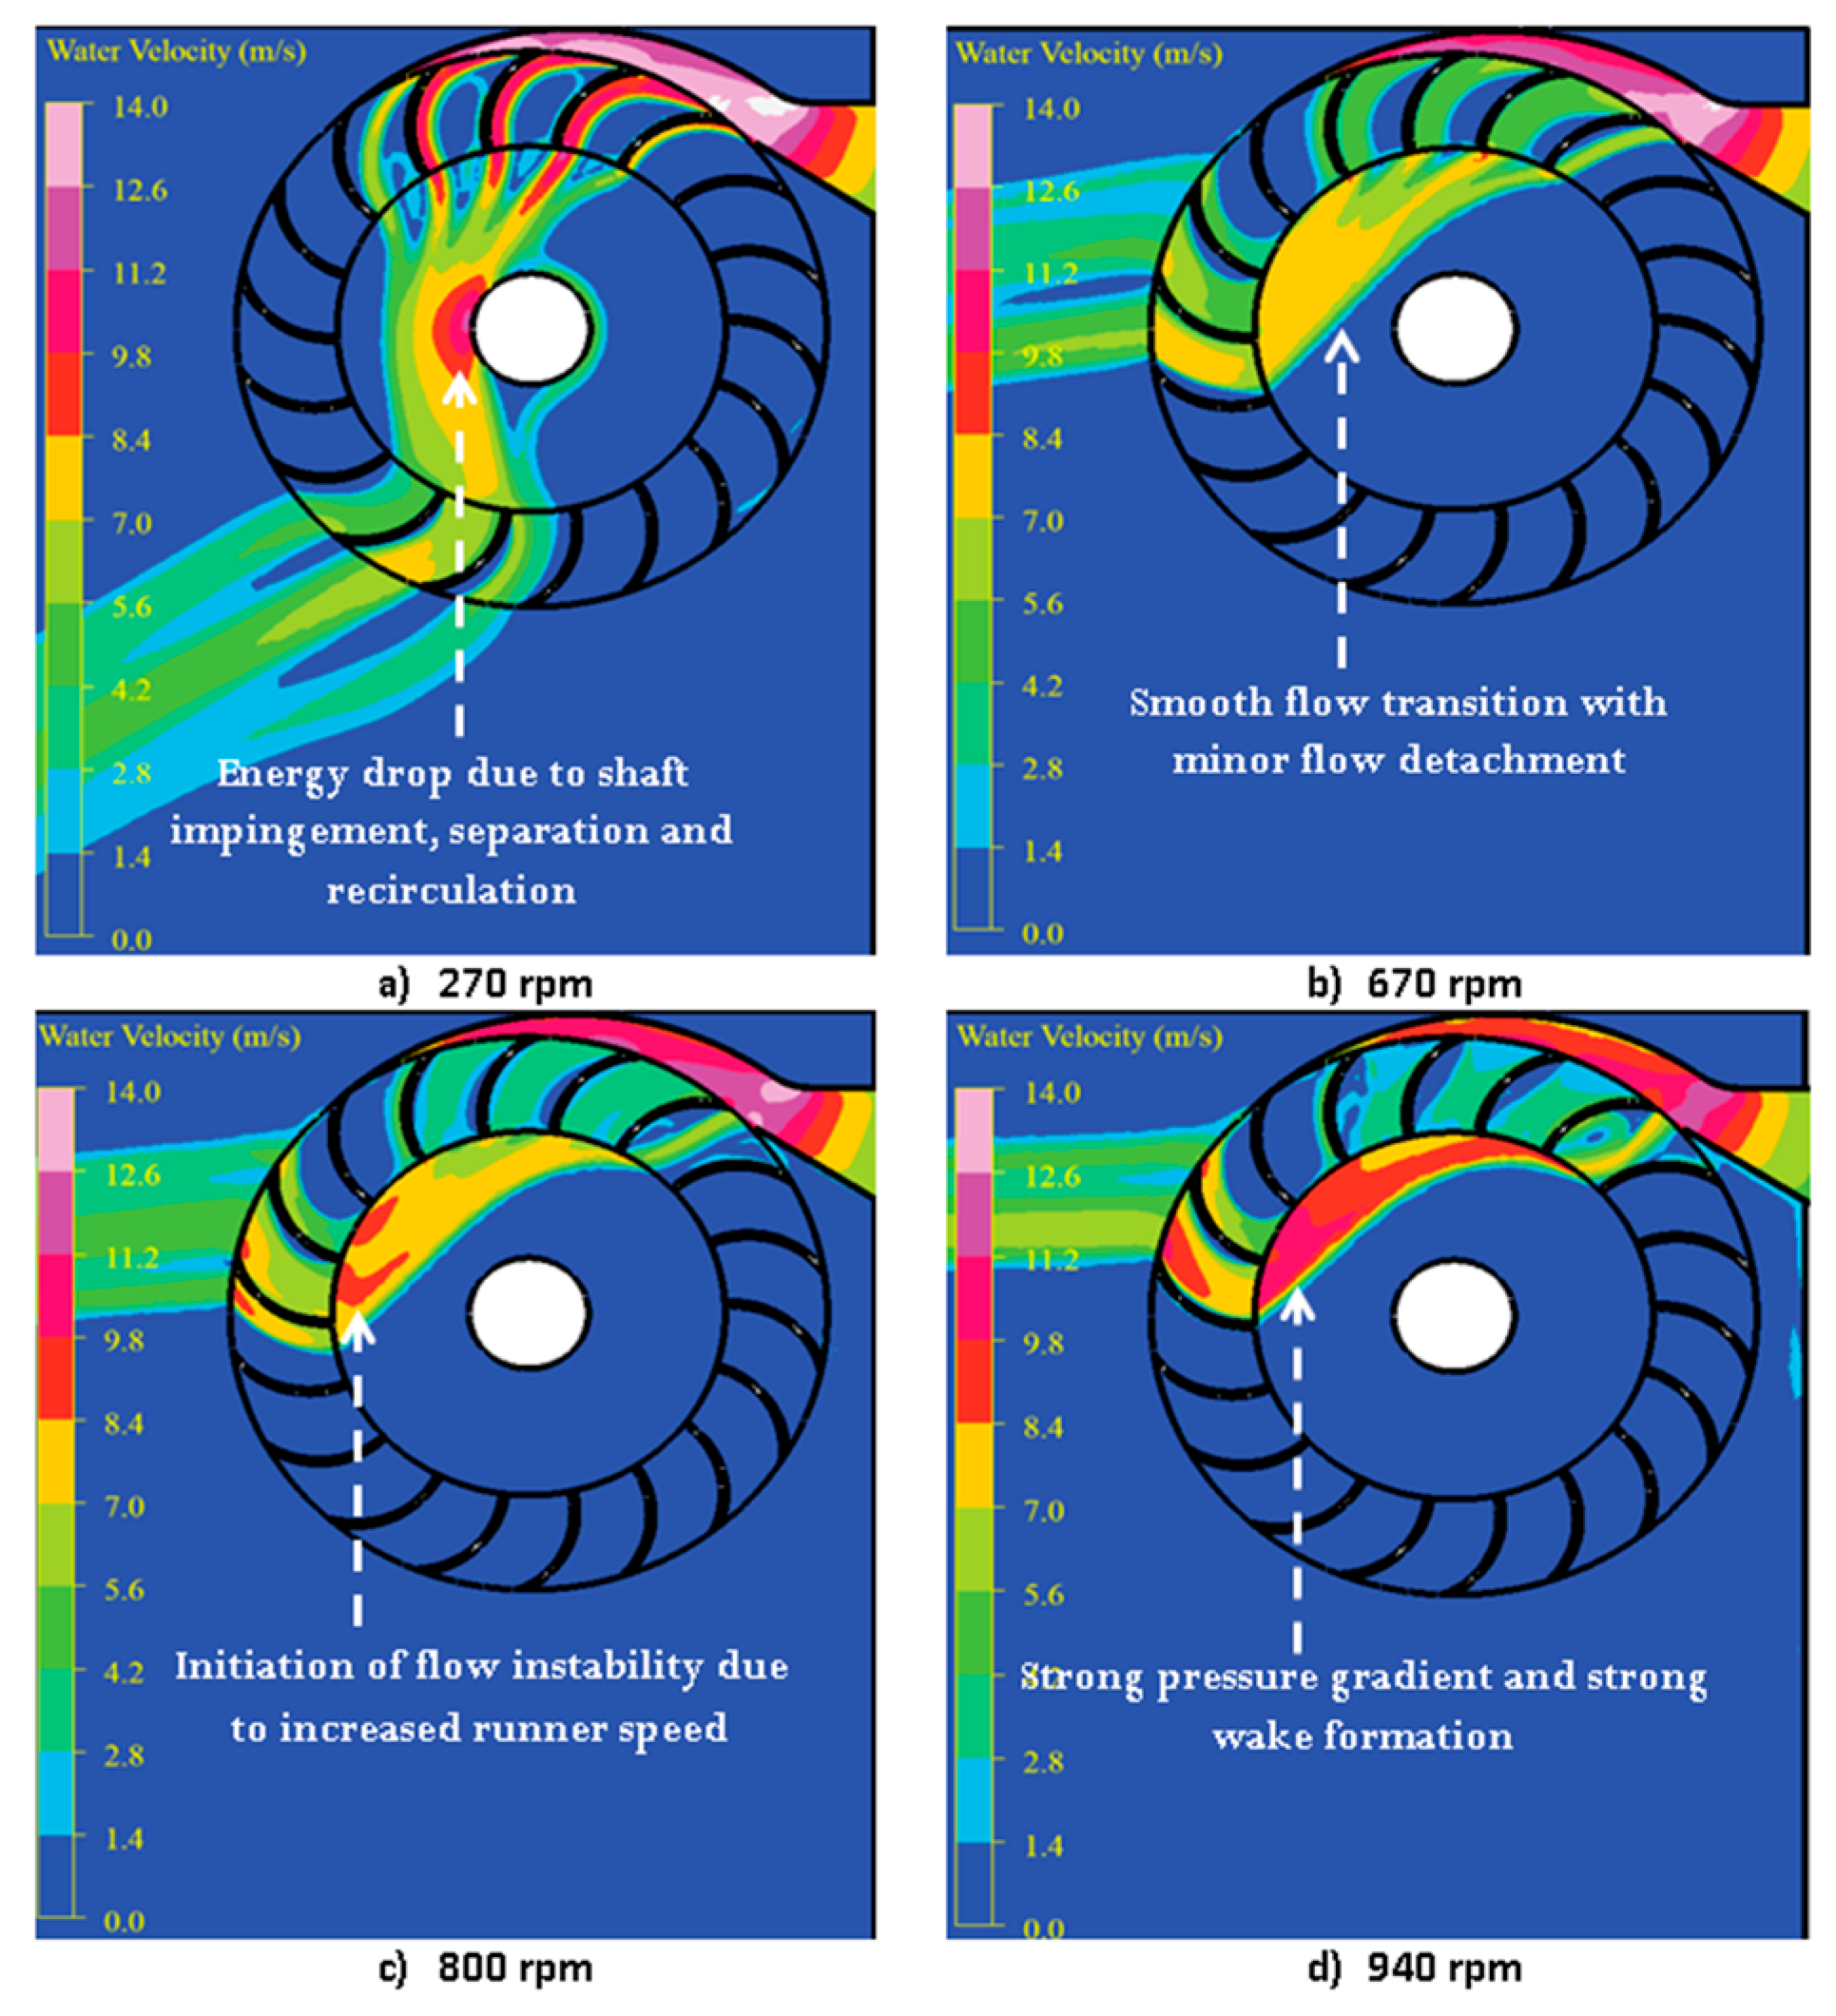
3.4.1. Flat Blade Profile

Flat blades, characterized by their abrupt leading and trailing edges, introduce significant hydrodynamic disturbances. At low runner speeds (270 rpm), the inflowing jet encounters sudden deflection surfaces, triggering early flow separation and large recirculation zones downstream (see Figure 19-a). With increasing speeds (540–670 rpm), unsteady vortex shedding at the trailing edge intensifies turbulence, reducing momentum transfer.
With increasing speeds (540–670 rpm), unsteady vortex shedding at the trailing edge intensifies turbulence, reducing momentum transfer. At high speeds (800–940 rpm), adverse pressure gradients and amplified centrifugal forces further destabilize the flow, leading to considerable efficiency loss

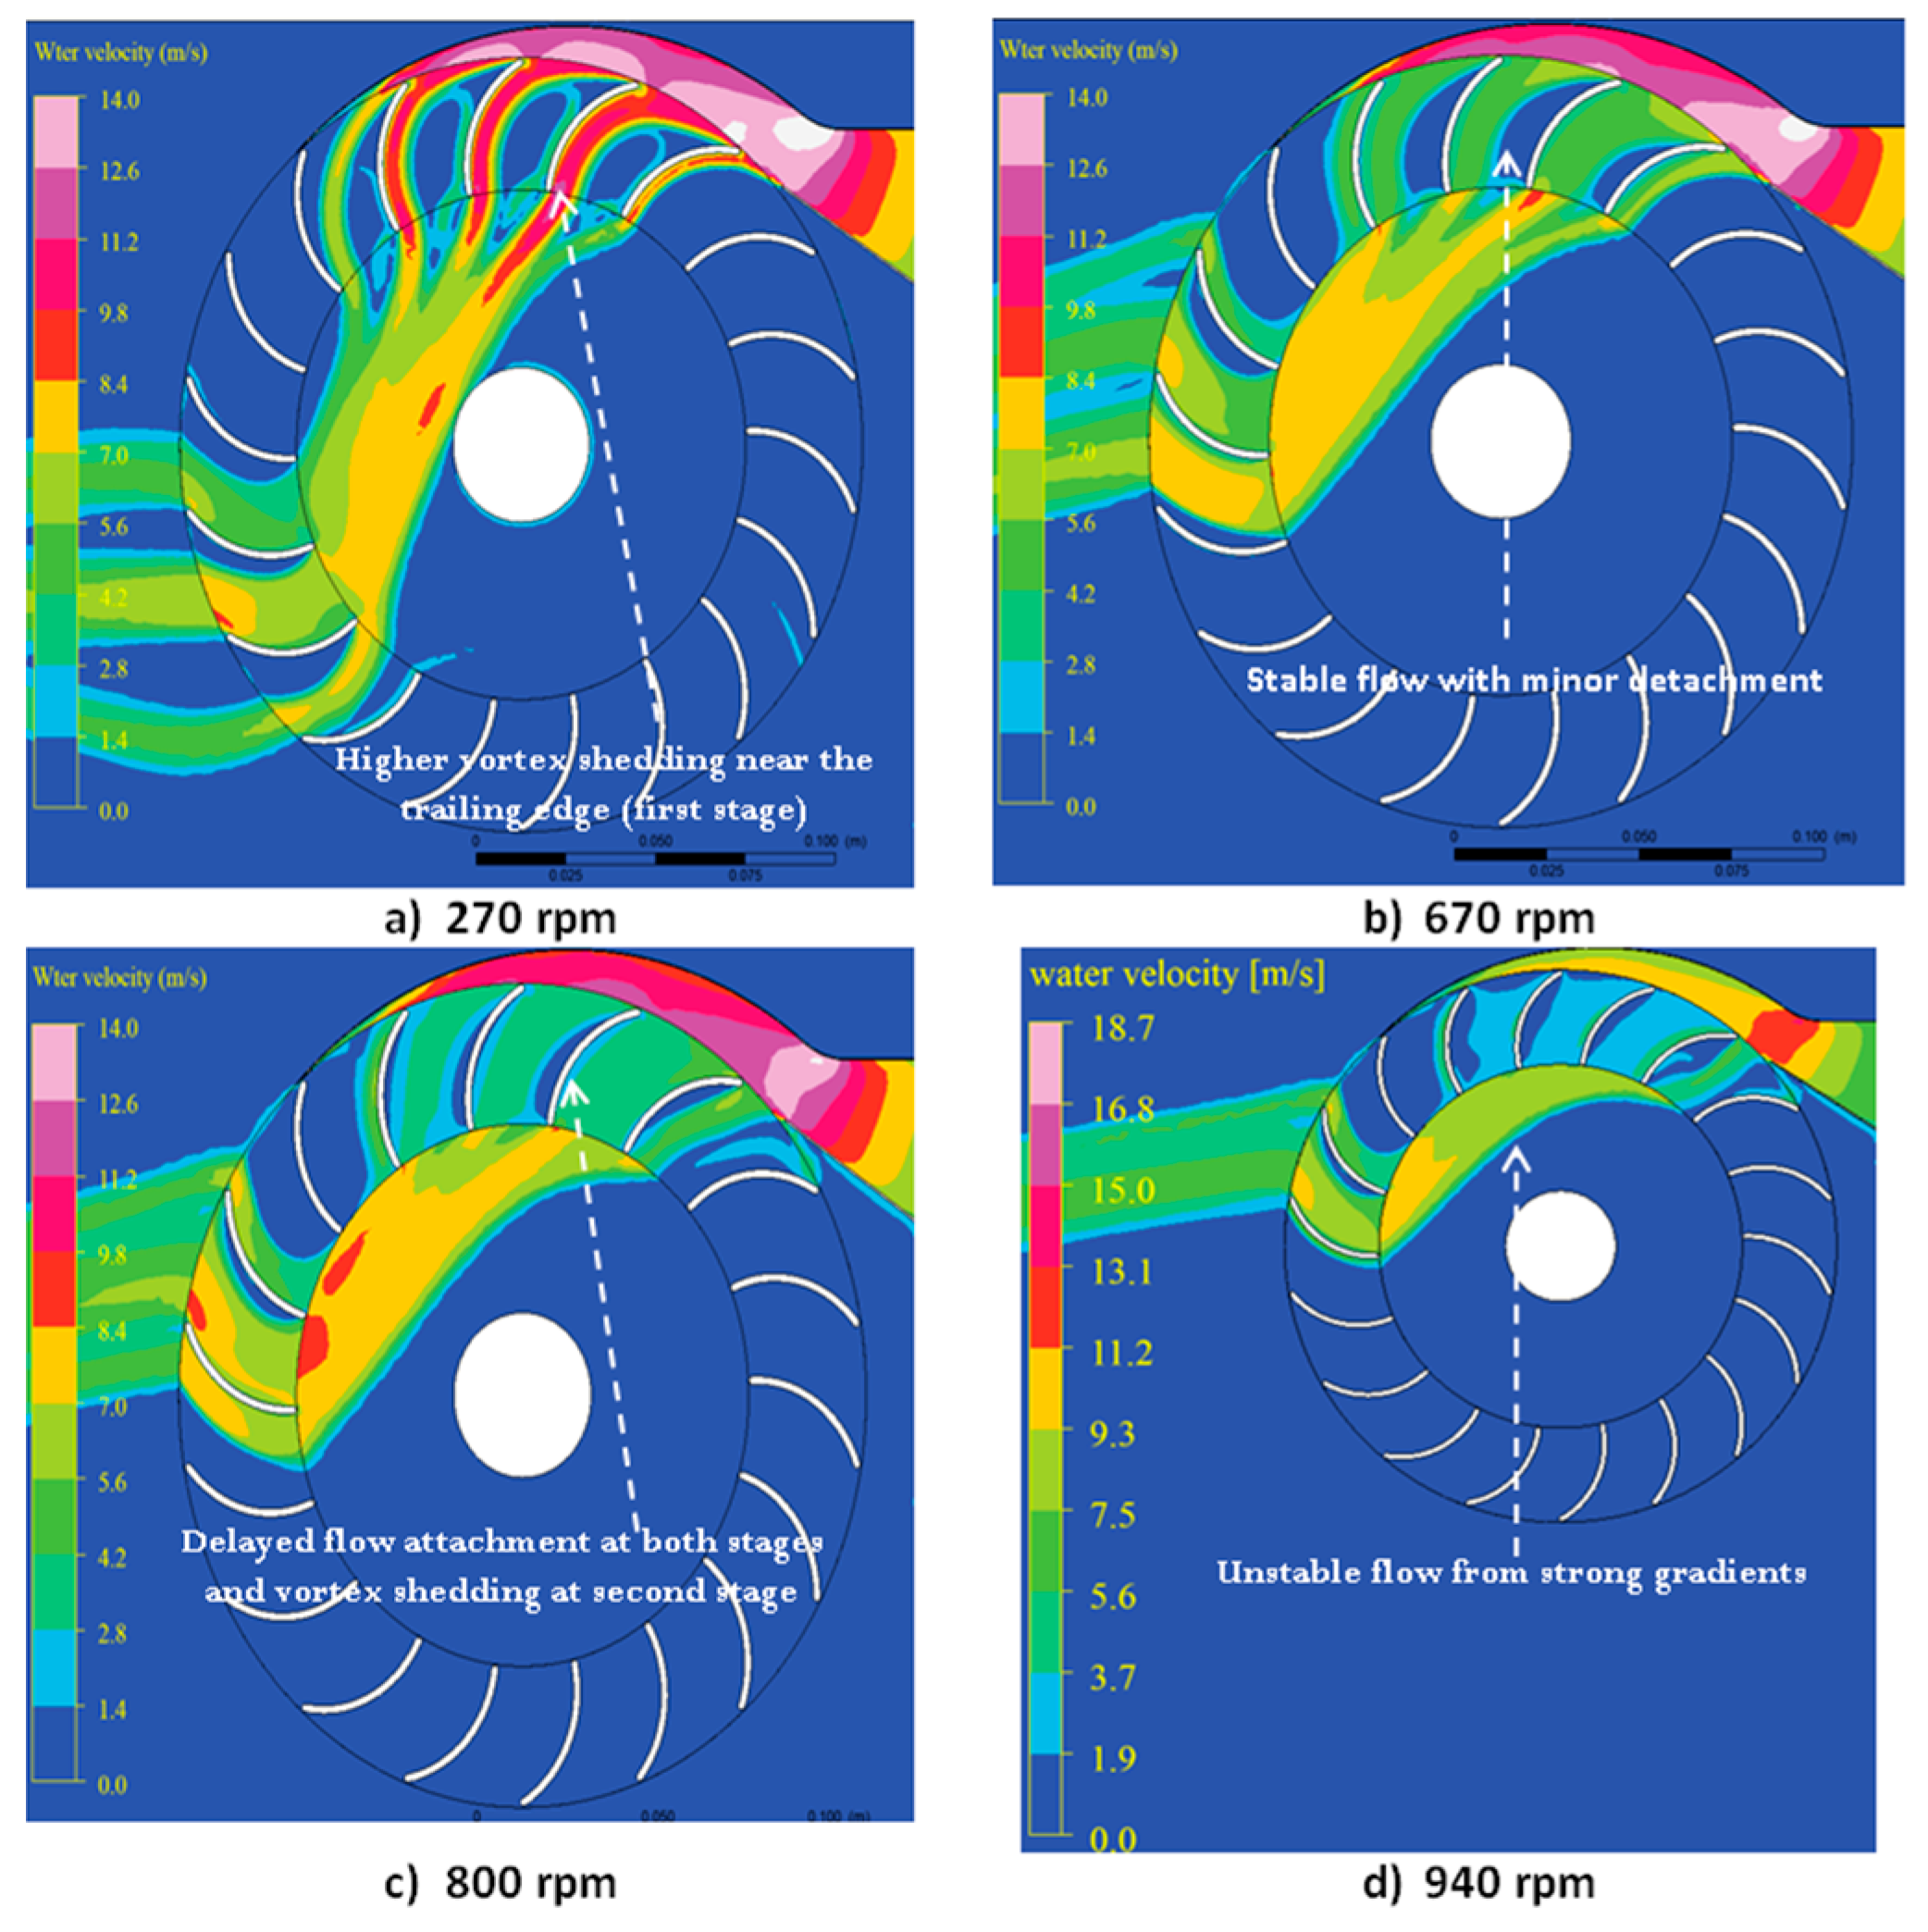
3.4.2. Round Blade Profile

Round blades, with their smooth curvature, enhance flow continuity by minimizing abrupt transitions. At low speeds (270–540 rpm), the gradual turning of the flow reduces stagnation and detachment compared to flat blades (see Figure 20).
While moderate recirculation zones persist near the trailing edge, turbulence remains subdued. At higher speeds (800–940 rpm), coherent vertical structures reappear due to steeper velocity gradients, though they are notably weaker than those seen with flat profiles.

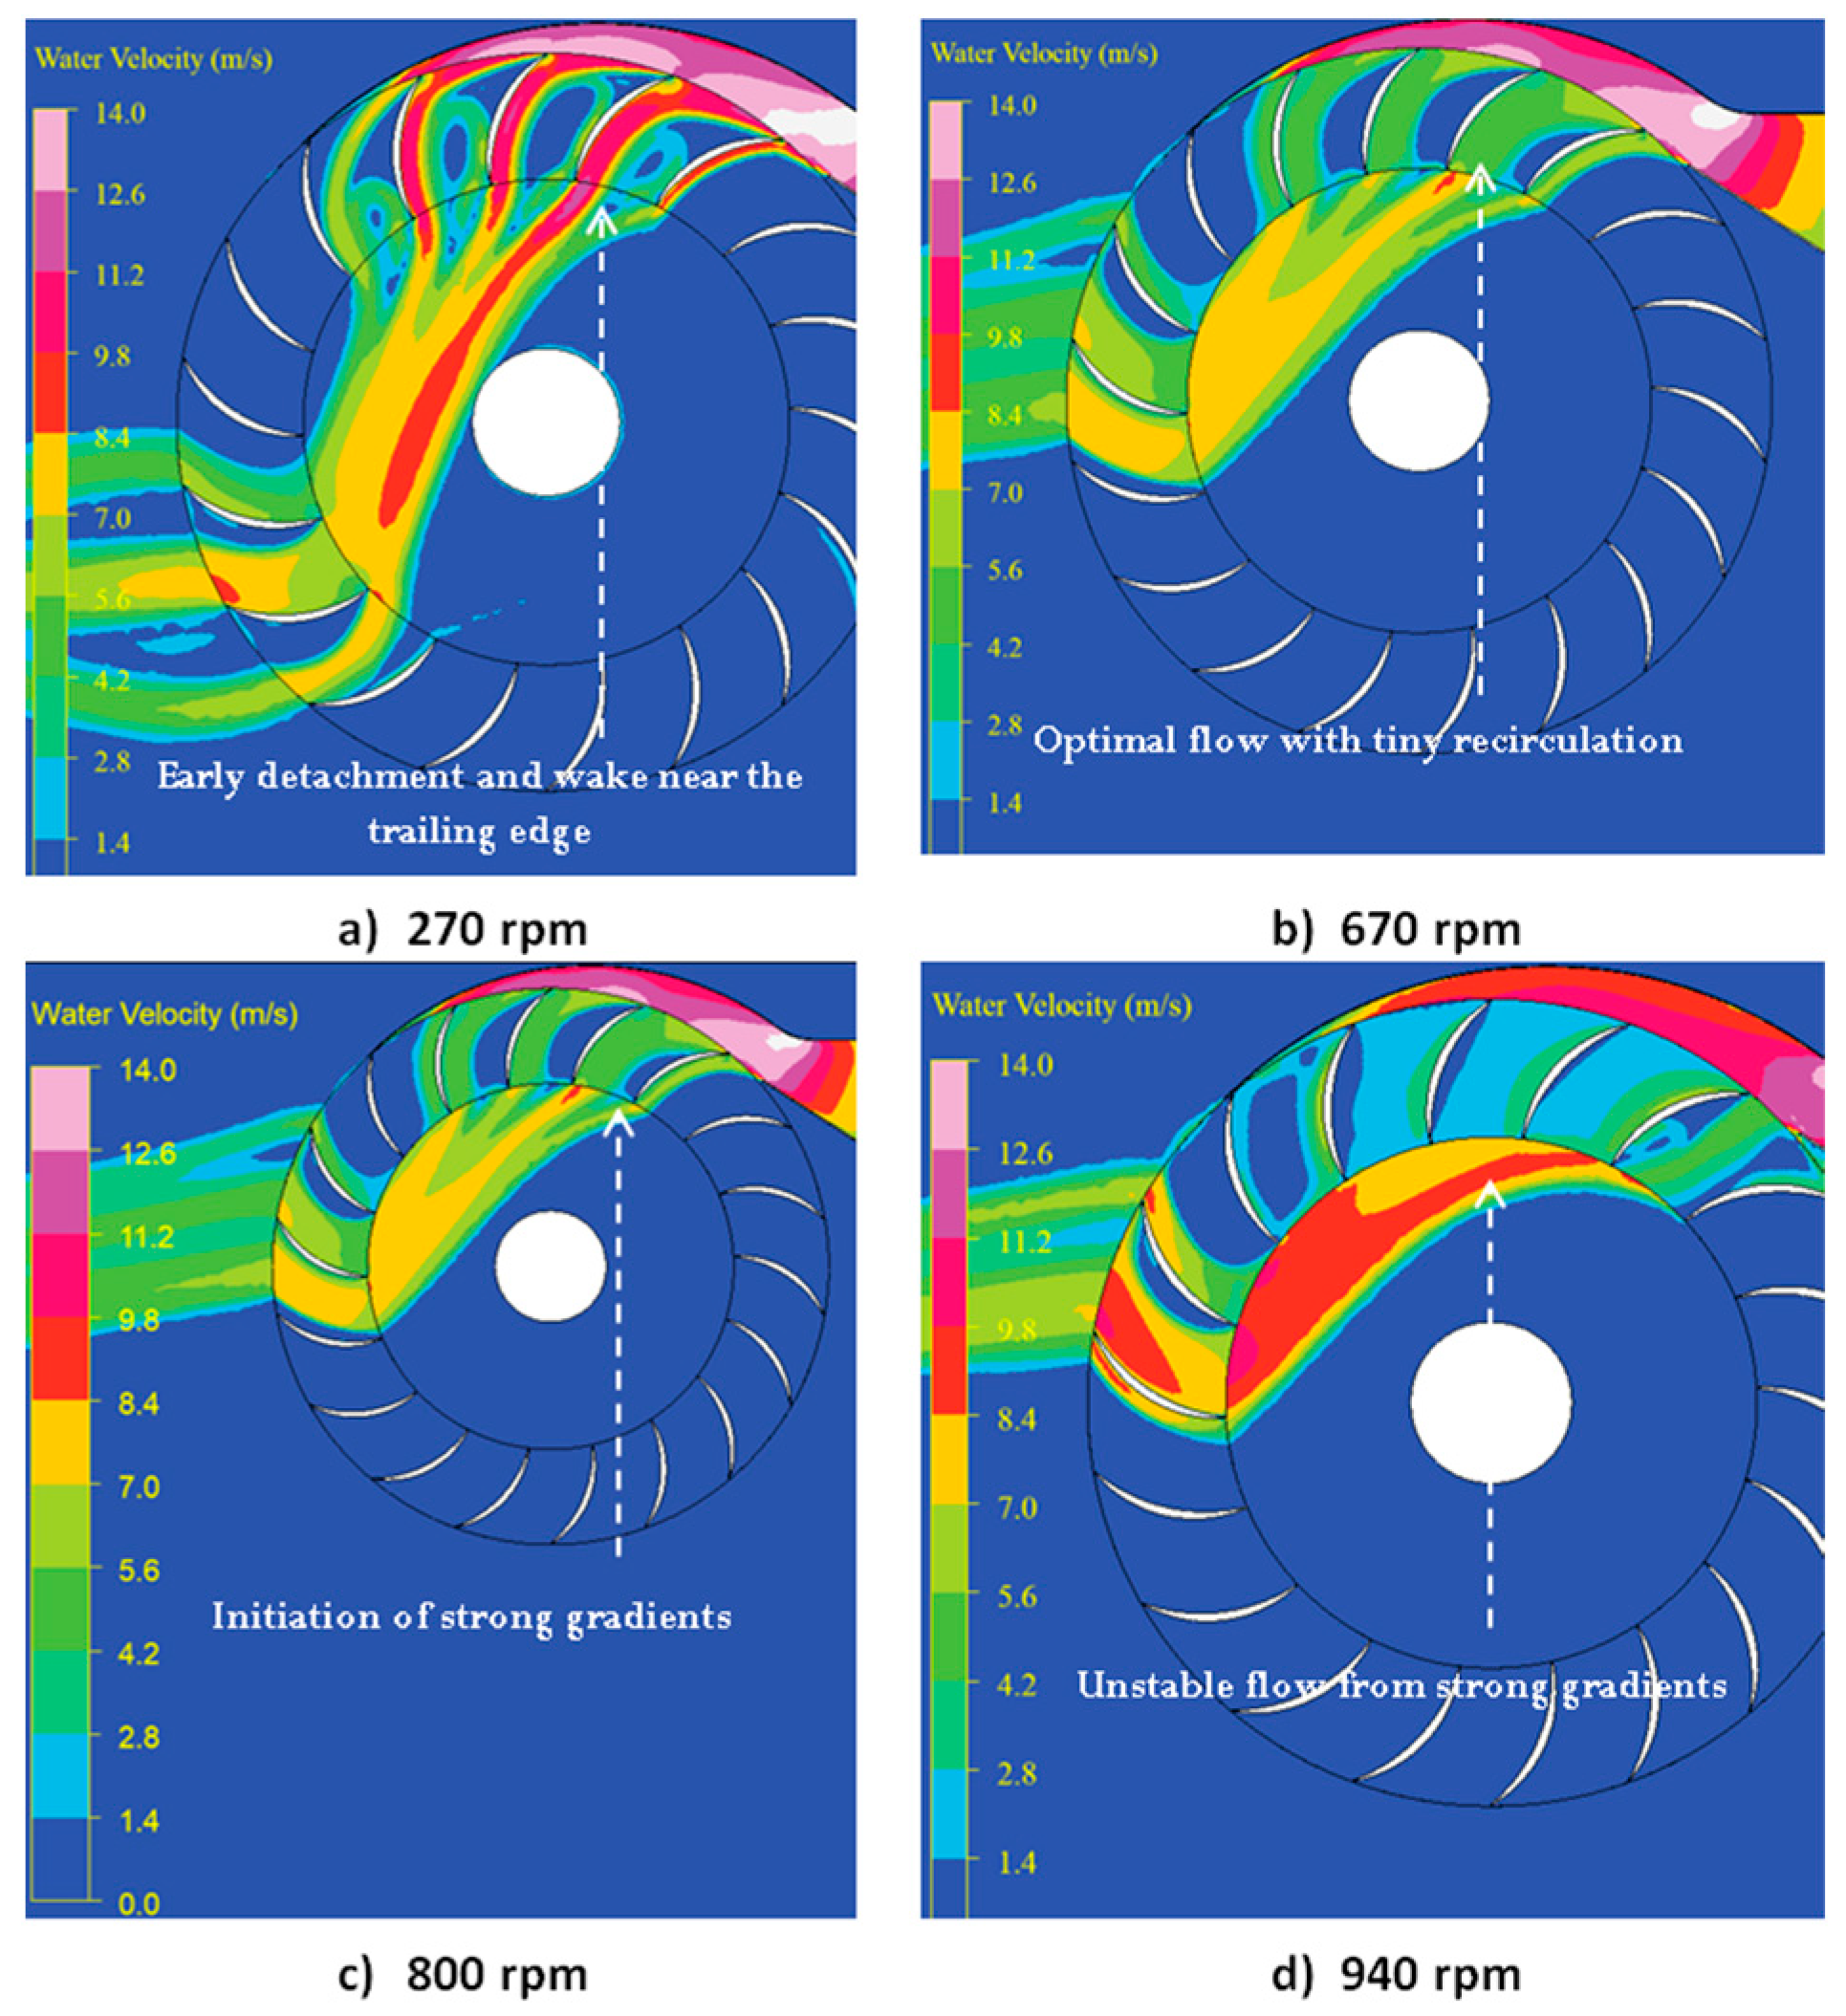
3.4.3. Sharp-Edged Blade Profile

Sharp-edged blades are tailored for high flow deflection and efficient energy transfer within a narrow speed window. At intermediate runner speeds (540–670 rpm), they demonstrate effective jet redirection with limited separation (see Figure 21). However, at lower speeds (270 rpm), insufficient flow momentum causes premature separation and strong vortex formation near the blade root. At higher speeds (800–940 rpm), intense pressure gradients at the trailing edge promote vigorous vortex shedding, resulting in substantial energy dissipation.

3.4.4. Aerodynamic Blade Profile

The aerodynamic blade, modeled on a NACA airfoil, exhibits superior flow behavior across all tested runner speeds (Figure 22). At 270 rpm, the smoothly contoured profile maintains attached flow with negligible wake formation. Between 540 and 800 rpm, efficient pressure recovery and momentum transfer are sustained with delayed separation and low turbulence levels. Even at 940 rpm, the flow remains stable and coherent, underscoring the profile’s robustness across a wide operational range.
A comparative overview of the internal flow behavior and corresponding hydraulic performance for each blade type across different runner speeds is presented in Table 4.
The table highlights that flat and sharp-edged profiles exhibit substantial flow separation and turbulence, particularly outside their optimal speed ranges. In contrast, round and aerodynamic profiles maintain more stable internal flows, resulting in better efficiency and broader operational flexibility.

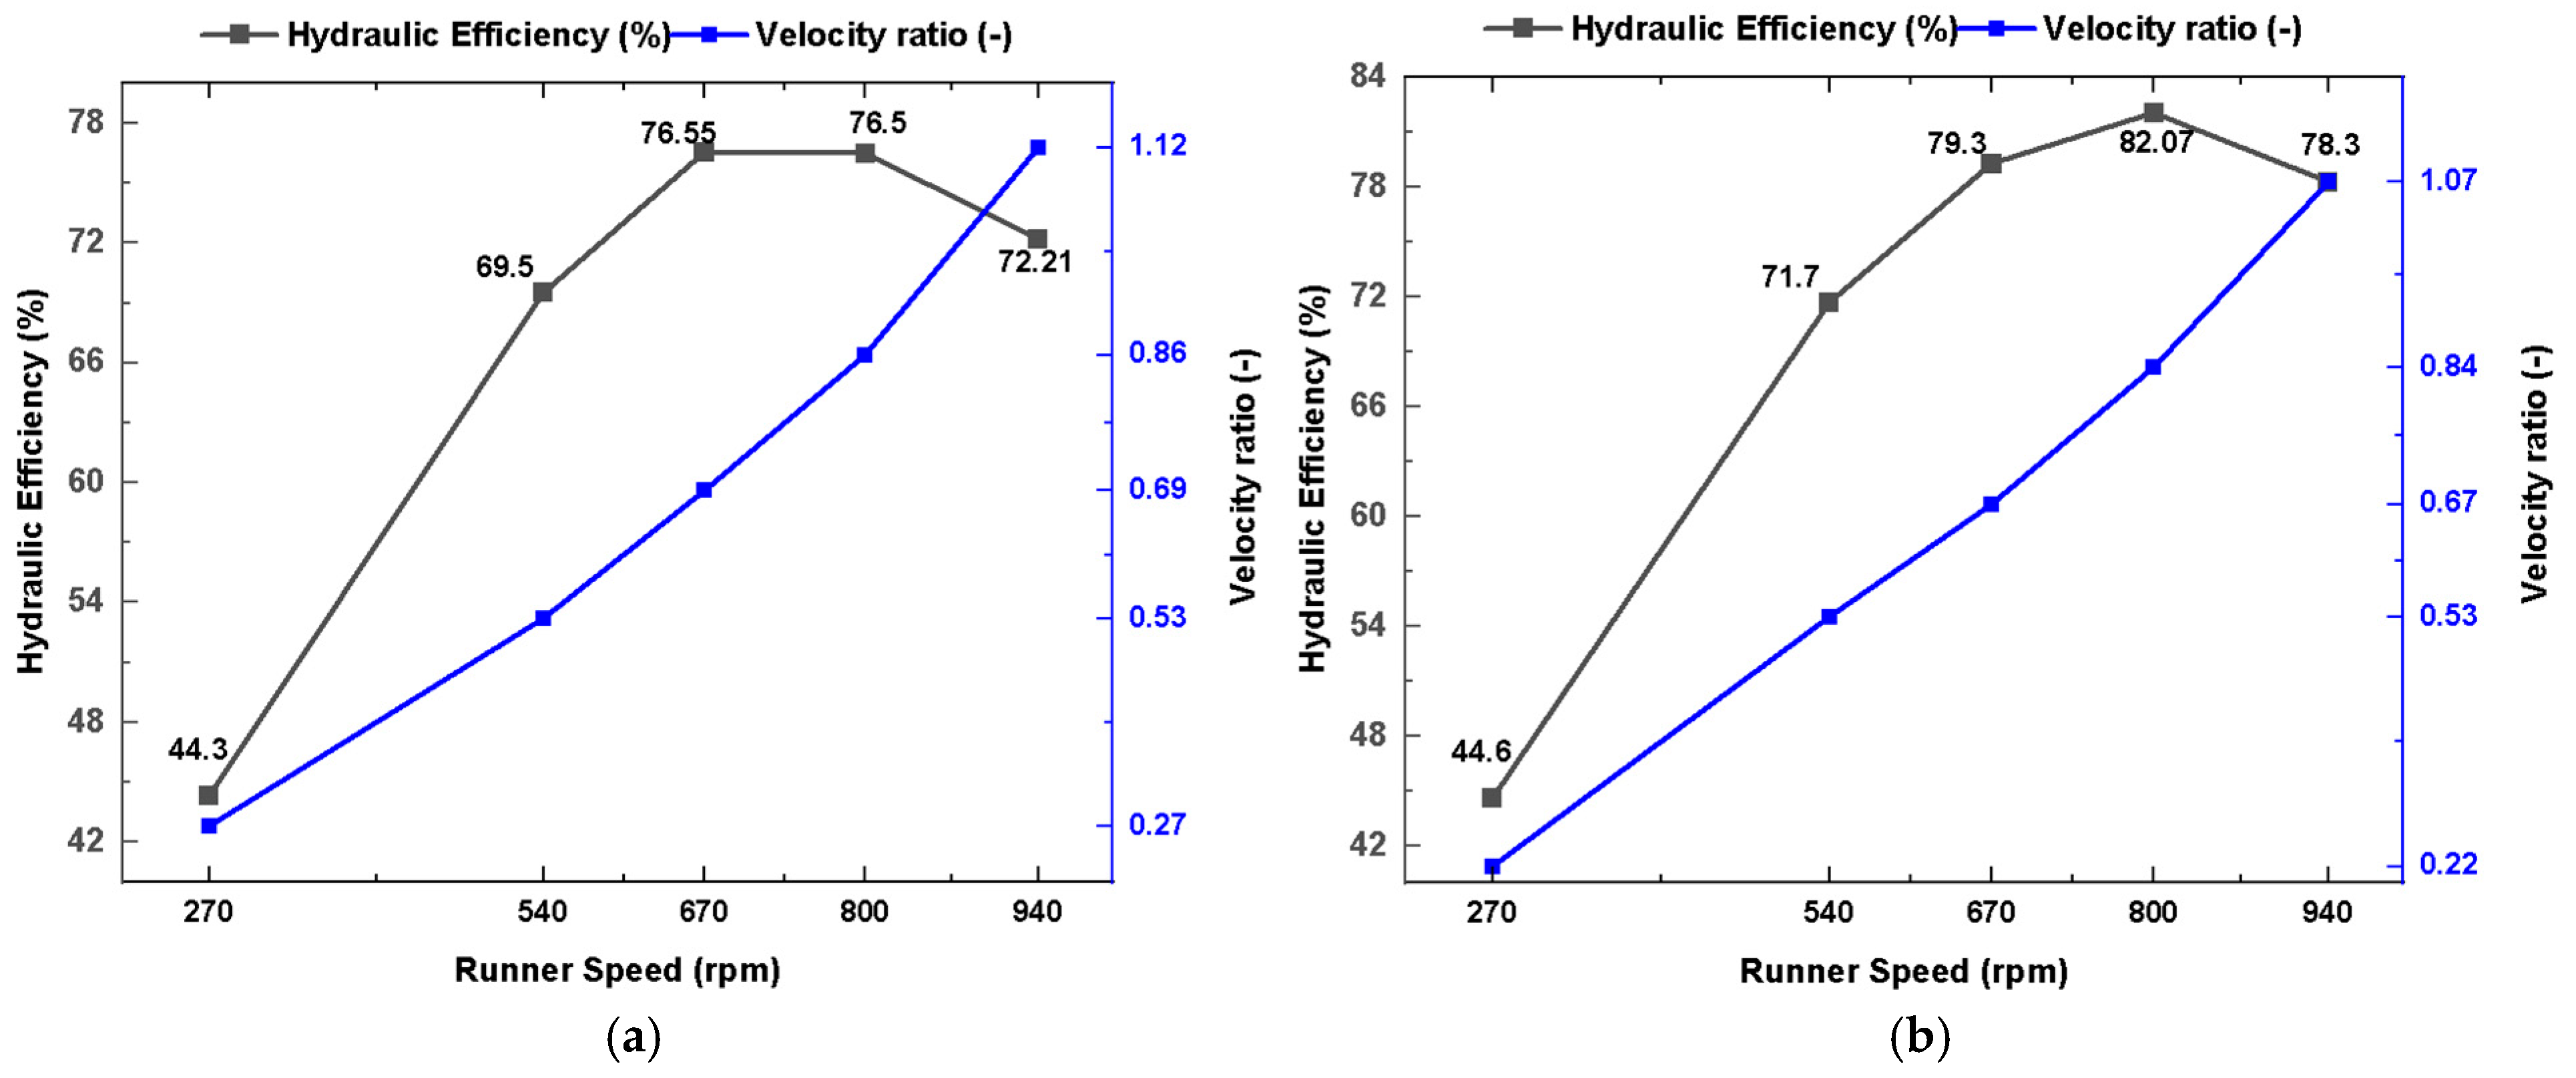
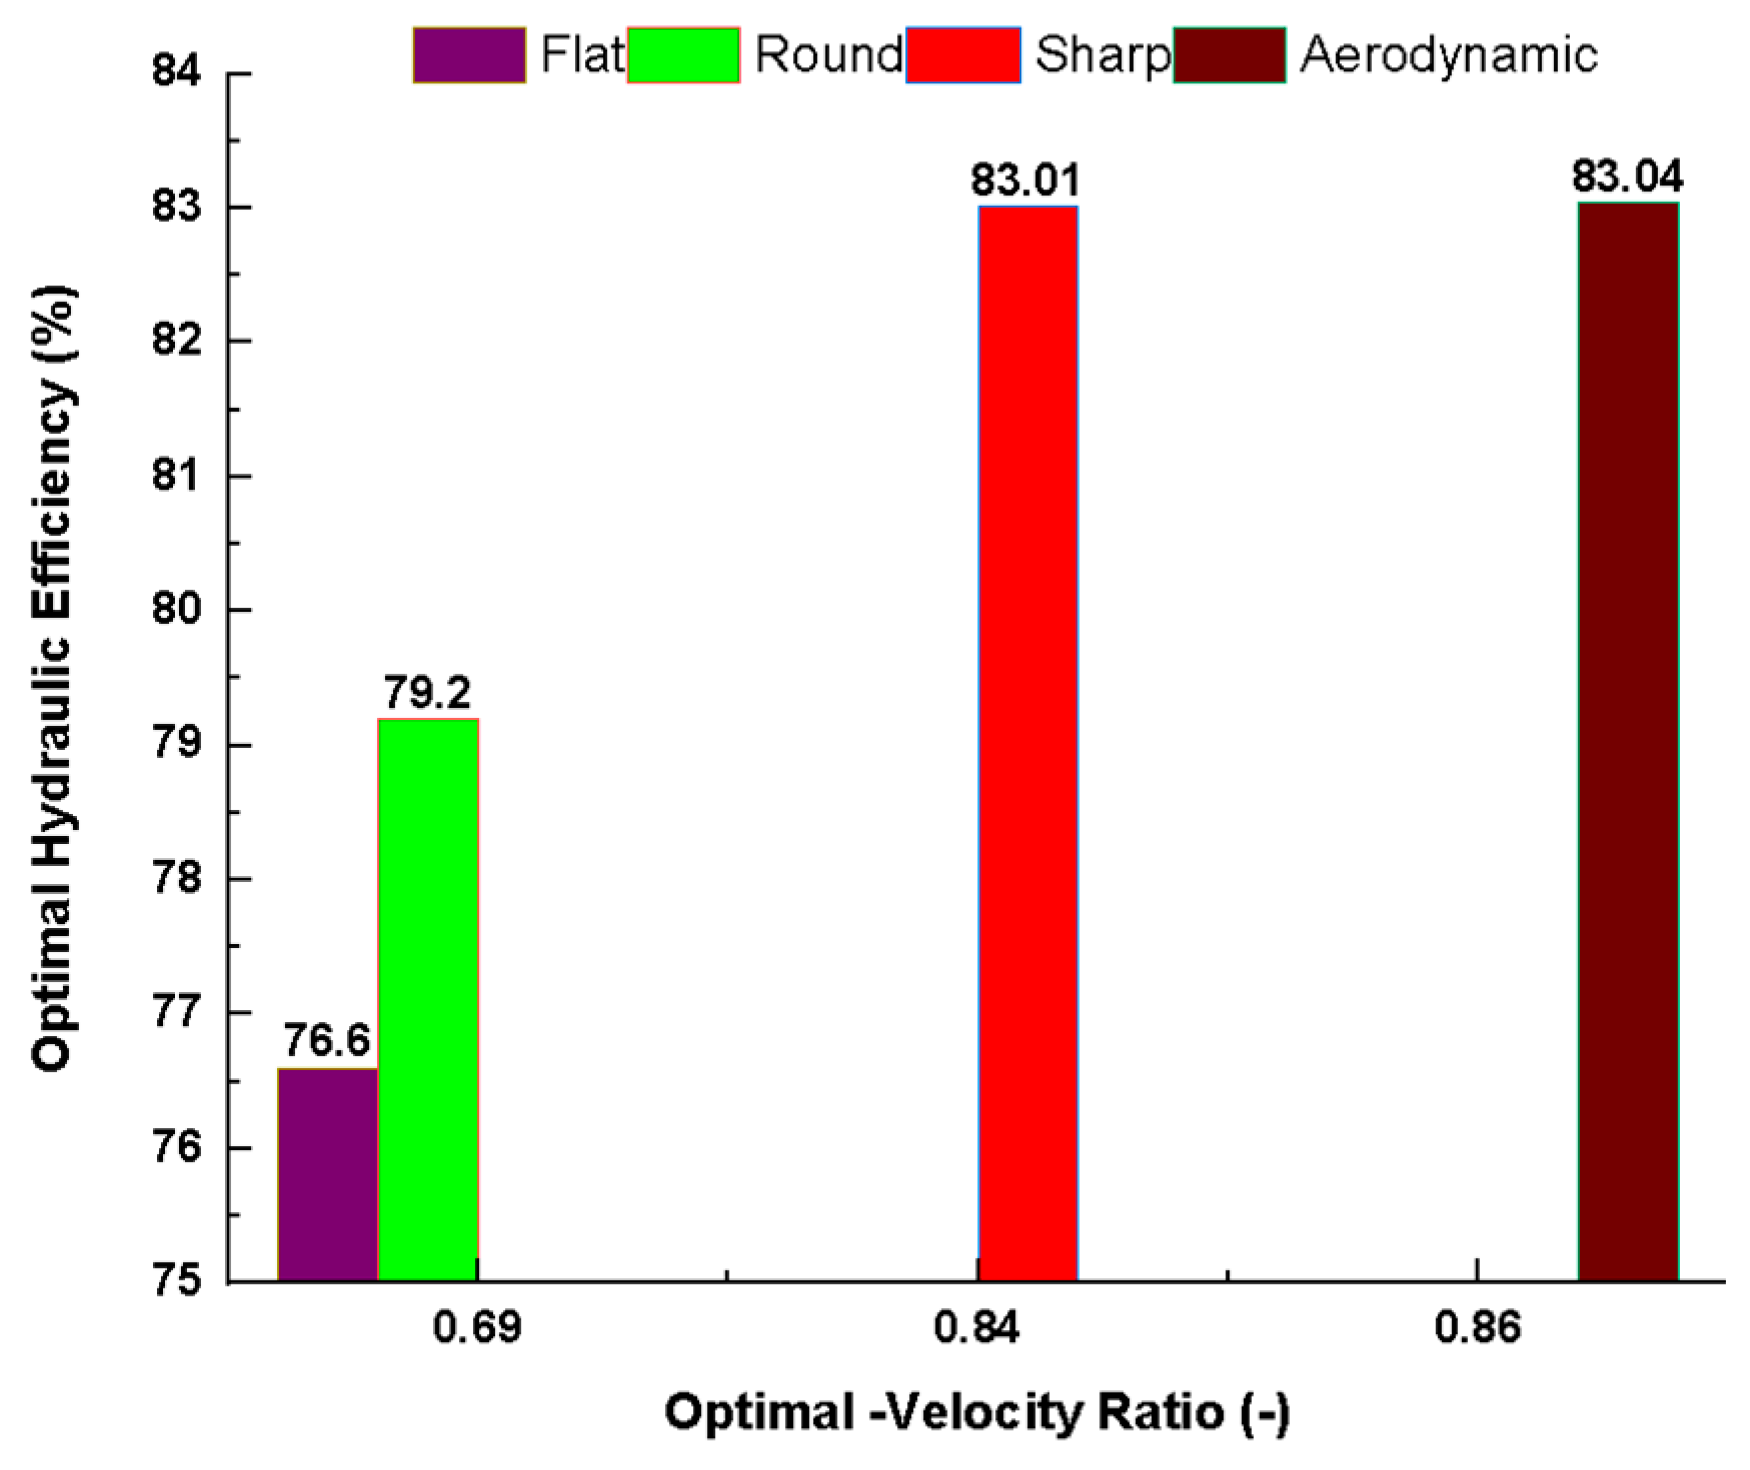
3.5. Comparative Hydraulic Performance Study

The hydraulic efficiency of the CFT was evaluated across four distinct blade profiles—flat, round, sharp, and aerodynamic—under varying runner speeds corresponding to different velocity ratios. The results reveal a clear dependence of the turbine performance on both the blade geometry and the operational velocity ratio. Among the profiles tested, the aerodynamic and sharp blade geometries demonstrated superior hydraulic performance, particularly at higher velocity ratios. The aerodynamic blade profile achieved the highest hydraulic efficiency of 83.04% at a velocity ratio of 0.84 (runner speed of 800 rpm), closely followed by the sharp blade profile, which reached an efficiency of 83.01% at a velocity ratio of 1.14 (see Figure 23 – c&d). This indicates that these profiles are more effective in directing and maintaining the kinetic energy of the water jet through the runner passage, resulting in reduced energy losses due to flow separation and turbulence.
The sharp blade profile consistently outperformed the flat and round profiles across the examined range, achieving over 70% efficiency beyond a velocity ratio of 0.57. This trend suggests that the sharp edge facilitates smoother water entry and reduced flow blockage, which contributes to better energy conversion. Similarly, the aerodynamic blade showed a marked improvement in efficiency with increasing runner speed, beginning from a relatively low efficiency of 34.8% at 270 rpm (velocity ratio 0.22) and progressively reaching 81.36% at 940 rpm (velocity ratio 1.07). This profile appears particularly advantageous in high-speed operation, where streamlined geometry minimizes the drag forces and enhances the flow alignment with the blade curvature. Conversely, the flat and round blade profiles exhibited moderate performance. The flat blade attained a peak efficiency of 76.55% at a velocity ratio of 0.69, while the round blade reached a slightly higher peak of 79.15% at a velocity ratio of 0.69 (See Figure 24). However, both profiles showed a decline in efficiency beyond this point, indicating performance limitations due to flow detachment and recirculation zones at higher operating speeds.
In summary, the results emphasize the critical influence of blade geometry on the hydraulic performance of the CFT. While traditional flat and round profiles provide satisfactory performance within a narrow operational window, sharp and aerodynamic blade designs offer superior and more consistent efficiency across a broader range of velocity ratios. These findings support the adoption of optimized blade profiles—particularly sharp and aerodynamic for enhanced energy capture in MHP applications.

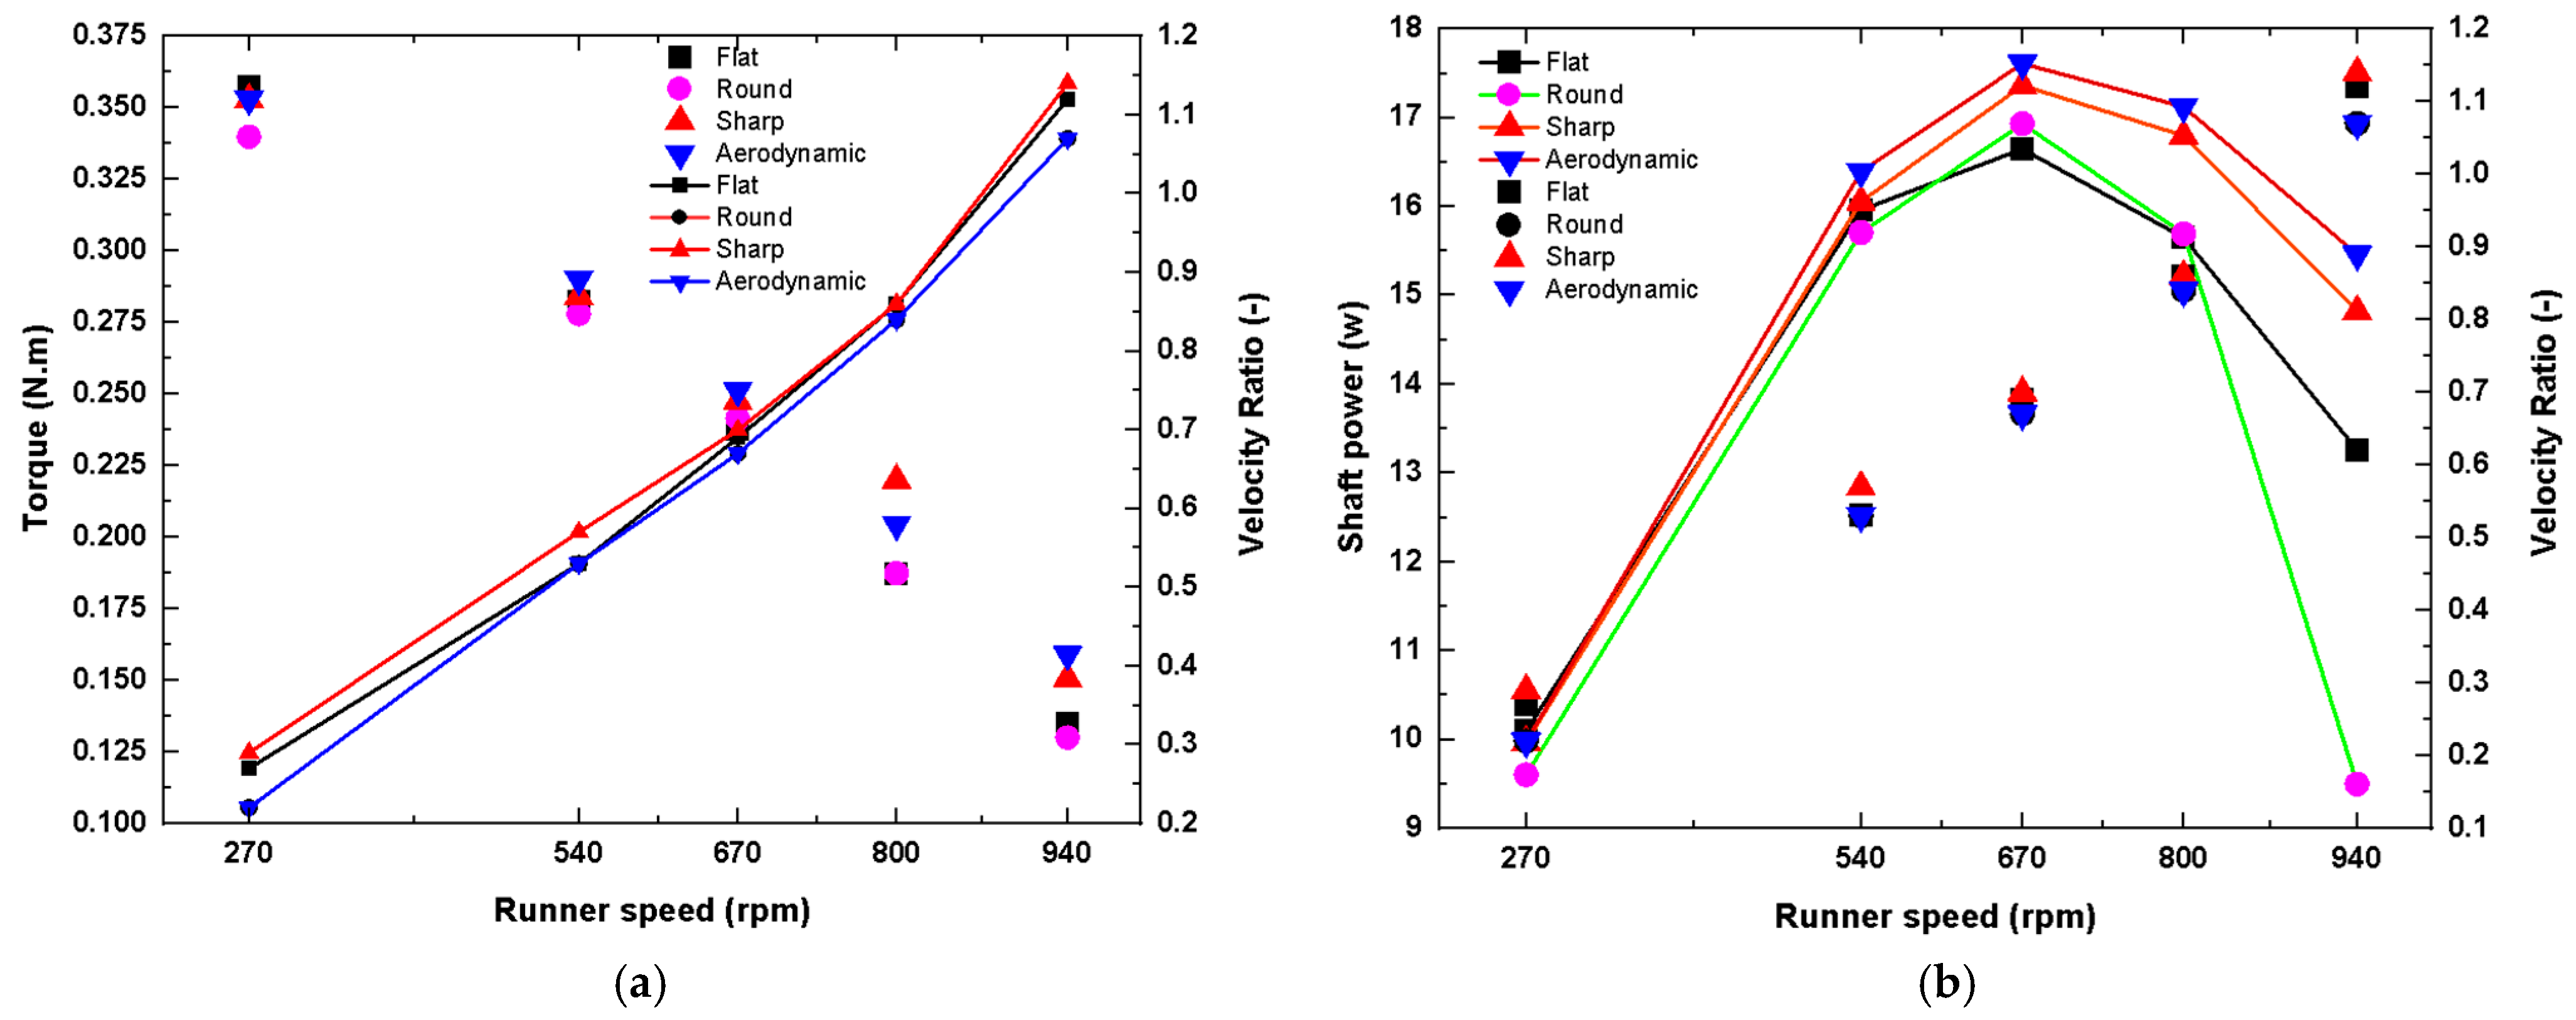
3.6. Torque and Power Output

The torque generation behavior of the CFT was systematically assessed for four blade profiles—flat, round, sharp, and aerodynamic—across a range of runner speeds and corresponding velocity ratios. The analysis reveals important insights into how blade geometry influences the turbine’s mechanical response under different operational conditions. For all blade profiles, the measured torque exhibited a declining trend with increasing runner speed (and velocity ratio). This inverse relationship reflects the fundamental principle of turbine operation: as the rotational speed of the runner increases, the angular acceleration rises, while the torque tends to decrease due to the diminishing resistance from the water jet and the reduced effective momentum transfer at higher angular velocities.
At lower speeds (270 rpm), all blade types generated relatively high torque, ranging between 0.34 and 0.36 N·m. The flat blade produced the highest initial torque of 0.36 N·m, closely followed by the aerodynamic and sharp blades at 0.35 N·m (See Figure 25–(a)). This indicates that at lower velocity ratios (0.22–0.29), the kinetic energy of the jet is effectively utilized by most profiles to produce torque, owing to the longer residence time of water within the runner and favorable jet-blade interaction.
However, as the runner speed increased, the aerodynamic and sharp blade profiles demonstrated slightly better retention of torque relative to their flat and round counterparts. For instance, at 800 rpm (velocity ratio ≈ 0.84–0.86), the aerodynamic and sharp blades produced torque values of 0.20 N·m and 0.22 N·m, respectively, compared to 0.19 N·m for both the flat and round blades (See Figure 25-(b)). Notably, at the highest speed tested (940 rpm), the sharp and aerodynamic profiles continued to sustain relatively higher torque values (0.15 and 0.16 N·m, respectively), suggesting their enhanced capability to maintain effective jet momentum capture even at elevated angular velocities.
The torque trends further highlight the aerodynamic blade’s superior ability to maintain torque generation, particularly in the mid-range velocity ratios (0.53–0.67), where it consistently outperformed others with a peak of 0.29 N·m at a velocity ratio of 0.53. This is likely attributed to its streamlined geometry, which reduces drag and improves flow attachment, thereby facilitating more efficient energy transfer to the rotational motion. In contrast, the flat and round blade profiles displayed the steepest decline in torque, dropping from 0.36 N·m and 0.34 N·m at 270 rpm to just 0.13 N·m at 940 rpm, indicating that their relatively blunt geometry may not sustain optimal jet interaction and energy transfer at higher operational speeds. In summary, while all blade profiles showed similar torque behavior at low speeds, the sharp and aerodynamic blades provided a more favorable torque response across a wider range of velocity ratios. These findings underscore the advantage of the refined blade geometry in sustaining the torque generation efficiency in CFT, particularly under high-speed conditions relevant to practical MHP applications.

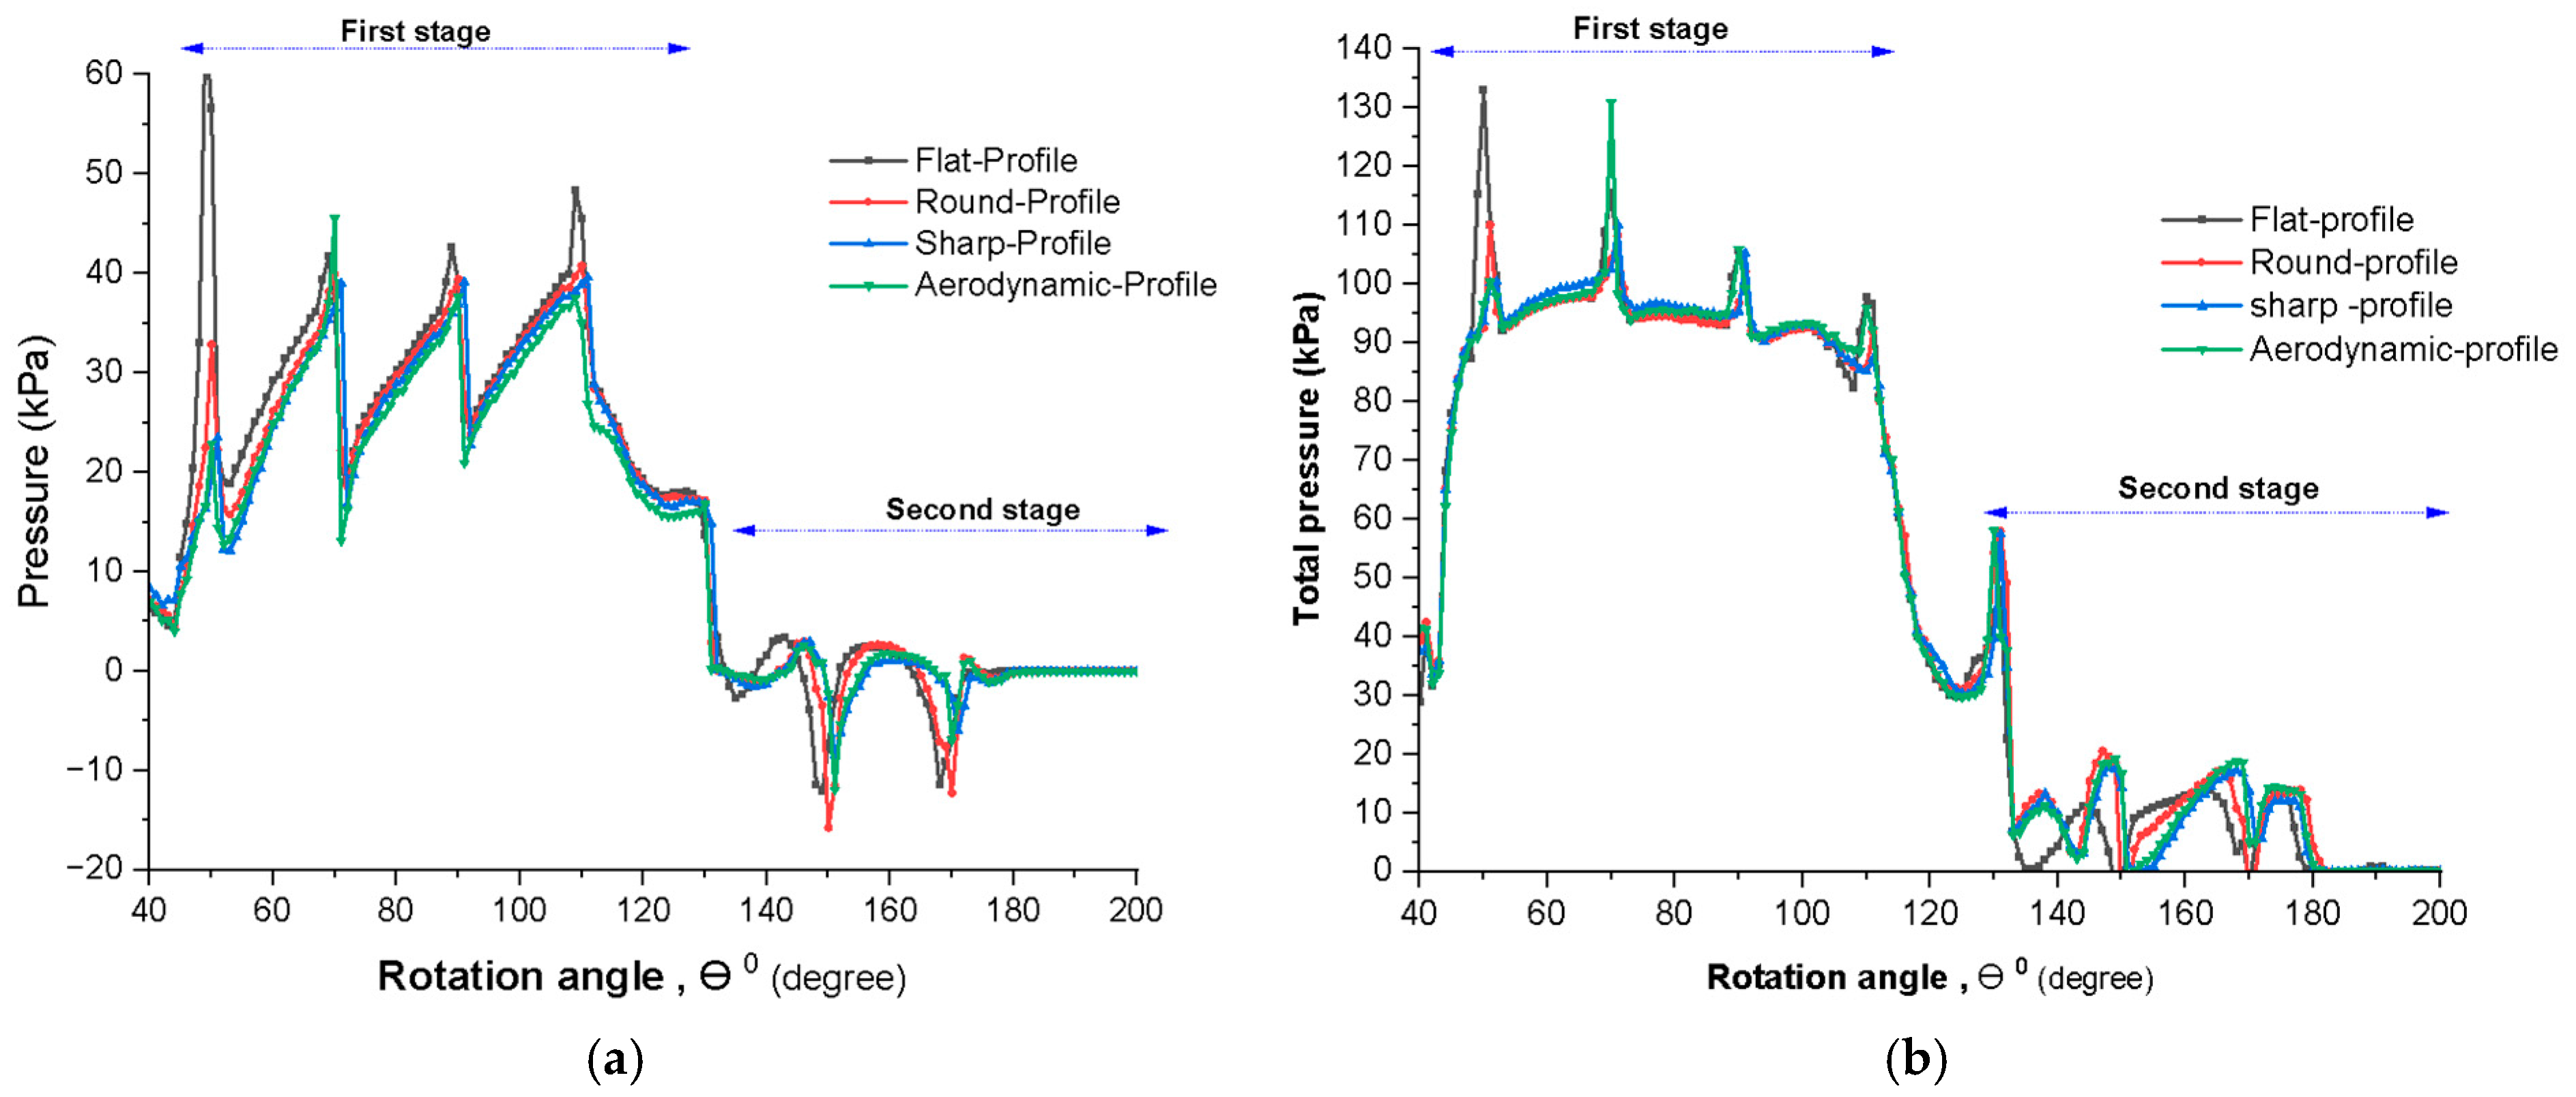
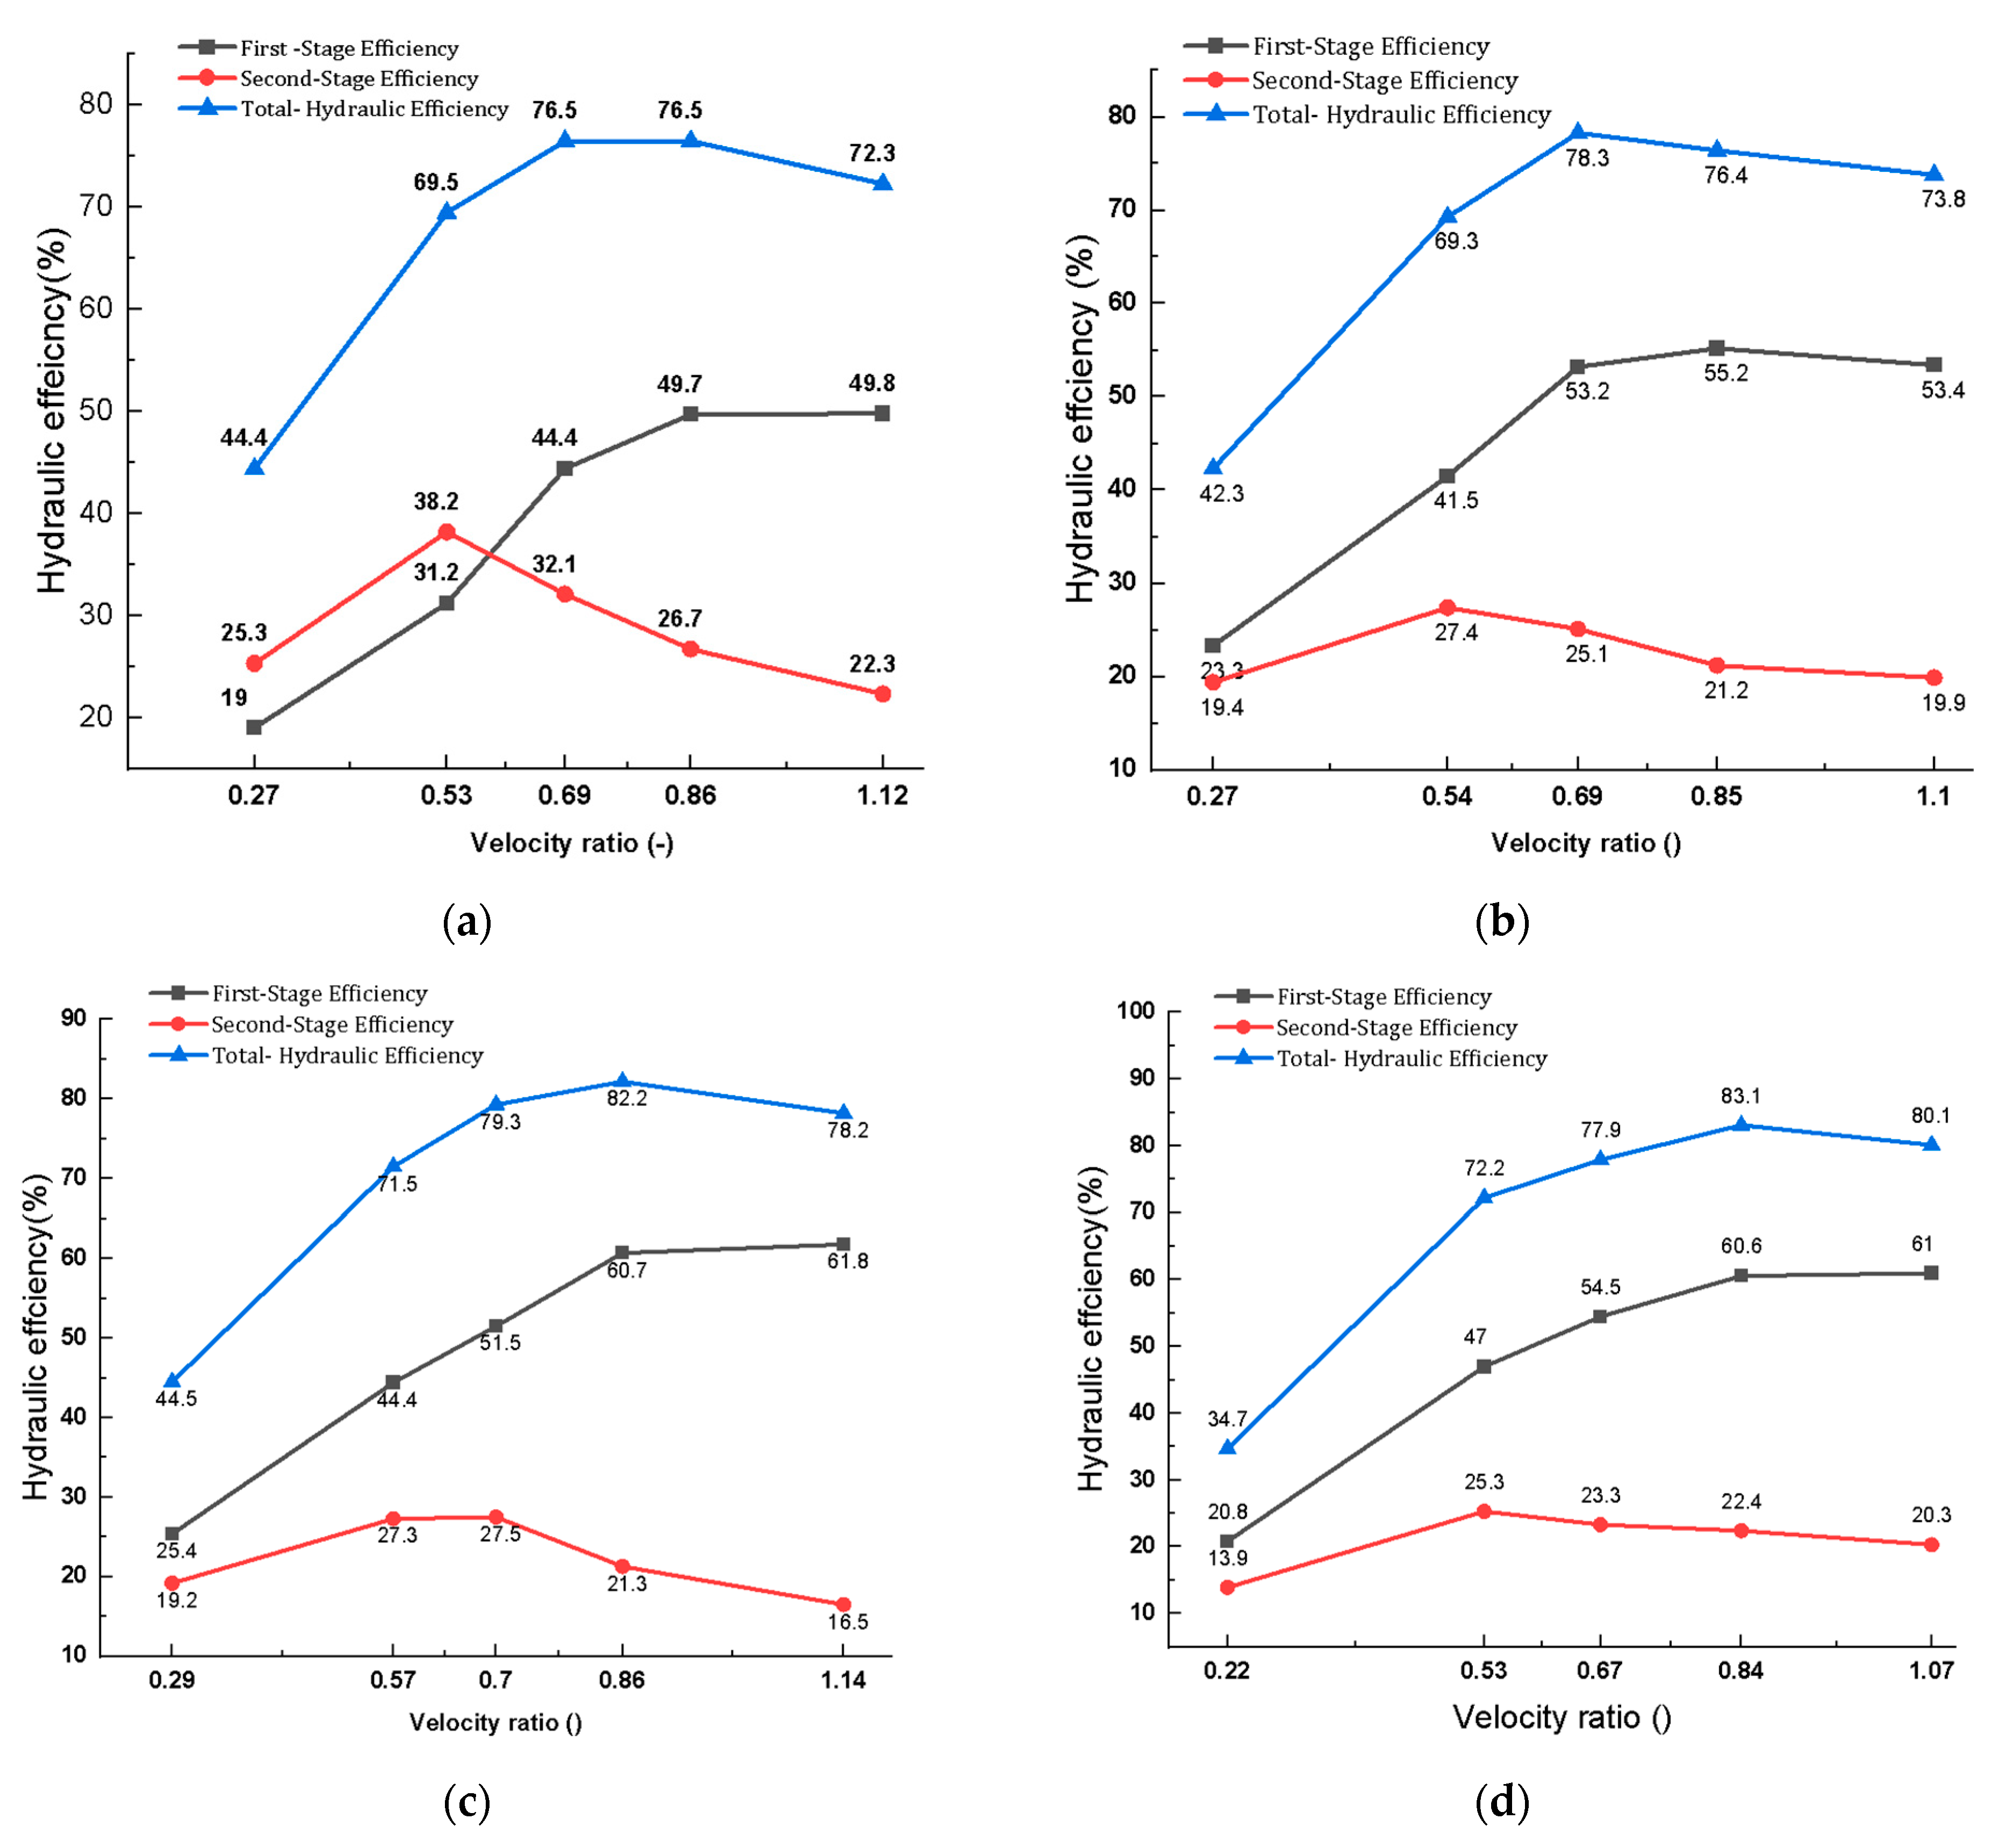
3.7. Stage-Wise Efficiency Analysis

The CFT operates with a unique two-stage energy conversion mechanism: the first stage, where the jet initially impinges on the runner blades, and the second stage, where the residual kinetic energy is extracted as the flow re-engages the runner on the opposite side. The effectiveness of each stage is strongly governed by the runner speed, blade geometry, and the internal flow dynamics between stages.

3.7.1. First Stage: Primary Energy Extraction Zone

The first stage is the principal energy conversion zone, where the high-velocity jet directly transfers its momentum to the blades, generating torque and accounting for approximately 60–70% of the total hydraulic efficiency. The magnitude of the pressure and velocity gradients is highest in this phase, especially near the blade leading edge. At intermediate runner speeds (540–670 rpm), the round and aerodynamic blades exhibit optimal flow alignment, with reduced vortex formation and efficient pressure recovery. Notably, at 670 rpm, these profiles achieved minimal flow separation, promoting smooth transitions and enhancing energy extraction. In contrast, at low speeds (270 rpm), inadequate blade-jet synchronization causes flow misalignment, recirculation, and premature detachment, especially in flat and sharp-edged profiles. At high runner speeds (800–940 rpm), centrifugal effects intensify, often leading to premature water ejection and disrupted flow paths, thereby diminishing the contribution from the first stage, particularly in non-streamlined blade configurations.

3.7.2. Second Stage: Secondary Energy Recovery Zone

The second stage used the residual kinetic energy from the first-stage outflow. Its effectiveness is highly dependent on the quality of the flow handed over from Stage I. Turbulence, misalignment, or large-scale vortices from the primary stage significantly reduce the recovery potential. The aerodynamic and round blades demonstrate superior second-stage performance, especially at 540–670 rpm, characterized by stable radial velocity fields and high water volume fractions. The flat blades, however, consistently underperform due to persistent separation and poorly structured wakes. At 670 rpm, the second-stage energy contribution peaks at approximately 30–35% for the round and aerodynamic profiles, while the flat blades fall short, exhibiting high turbulence intensity and pressure losses. The findings emphasize the necessity of maintaining coherent flow transitions between stages and achieving high overall efficiency.

3.8. Influence of Blade Geometry on Stage-Wise Efficiency

The blade geometry plays a pivotal role in defining the stage-wise efficiency through its control over the flow deflection, pressure recovery, and turbulence mitigation. As shown in Figure 26, the aerodynamic blades provide the most balanced and robust performance across both stages, especially at higher runner speeds.
Flat blades show a higher second-stage contribution at lower speeds (e.g., 38% at 540 rpm), but their performance degrades as the speed increases. At 940 rpm, the first stage dominates with 50%, yet the overall efficiency remains modest due to the severe turbulence.
The round blades deliver peak first-stage efficiency (~53%) at 670 rpm, while the second-stage efficiency peaks (~27%) at 540 rpm, reflecting relatively balanced yet moderate performance.
Sharp blades reach maximum first-stage efficiency (62%) at 940 rpm and highest second-stage contribution (~27.5%) at 670 rpm, but exhibit sensitivity to off-optimal conditions.
Aerodynamic blades consistently yield the best results, achieving up to 83.1% total efficiency at 940 rpm, with over 70% of the energy extracted during the first stage. At 540 rpm, these blades attain an overall efficiency of 72.2%, with a well-balanced stage-wise contribution.
These results confirm that while flat and sharp-edged blades suffer from inefficient energy distribution and turbulence, round and aerodynamic profiles ensure smoother flow behavior, especially under mid-to-high runner speeds. For optimized CFT performance, the blade geometries must facilitate pressure recovery and minimize flow disruption in both energy conversion stages.

3.9. Exit Pressure Trends and Blade Geometry Influence

Efficient energy extraction in CFTs is closely tied to exit pressure behavior, which serves as an indicator of how effectively the hydraulic energy is converted into mechanical work. Ideally, exit pressures should remain near atmospheric levels sufficiently low to confirm efficient energy recovery, but not so low as to induce cavitation risks. Conversely, elevated exit pressures often signify incomplete kinetic energy extraction and turbulent flow detachment at the runner exit. Among the blade geometries tested, the aerodynamic blades consistently produced the lowest exit pressures, coupled with high residual velocities and minimal turbulence. These flow characteristics favor smoother interactions with downstream components such as draft tubes or tailrace channels, thereby enhancing the overall system efficiency.
Conversely, the flat blades exhibited elevated exit pressures, often exceeding 14 kPa at high speeds, reflecting their limited ability to manage flow detachment and suppress vortex shedding at the exit region.
At 270 rpm, the aerodynamic blades achieved the lowest exit pressure (6.62 kPa) with moderate efficiency (44.6%), while the sharp blades, despite a higher exit pressure (9.98 kPa), delivered the highest efficiency in this speed regime (Figure 27). The round blades exhibited a moderate pressure level (7.95 kPa) but yielded the lowest efficiency (42.4%).
At 540 rpm, all blade types experienced a drop in the exit pressure. The aerodynamic blades reached peak efficiency (72%), demonstrating superior jet deflection and energy recovery potential. Round and sharp blades followed closely, while flat blades continued to underperform.
At 670 rpm, the sharp blades achieved maximum efficiency (79%), albeit with higher exit pressures, suggesting a trade-off between pressure buildup and momentum transfer. Aerodynamic blades maintained high efficiency while also minimizing pressure spikes, indicating robust flow control and favorable blade-jet interaction.
At higher runner speeds (800–940 rpm), exit pressures significantly increased across all profiles, with flat blades peaking at ~15 kPa, corresponding to the lowest efficiency (76.5%) in this regime. The aerodynamic blades retained their dominance, maintaining exit pressures below 10 kPa and achieving efficiencies exceeding 83%, attributed to their streamlined profile and reduced wake turbulence.
Figure 27. Comparative influence of blade profile on hydraulic efficiency, torque output, and exit pressure distribution: (a) Flat, (b) Round, (c) Sharp, (d) Aerodynamic.
Energies 18 03203 g027aEnergies 18 03203 g027b
The flat blades exhibited consistently high exit pressures and low performance, highlighting ineffective flow redirection.
The round blades maintained moderate pressure and efficiency but lacked peak performance.
Sharp blades delivered high efficiency at select speeds, although they were susceptible to pressure spikes at higher rms.
Aerodynamic blades outperformed across all conditions, showing low exit pressures and consistent energy recovery, establishing them as the most suitable profile for performance-critical MHP applications.
In summary, the blade geometry governs the exit pressure behavior and post-runner flow quality, which directly affect the stage efficiency and downstream hydraulic interactions. The aerodynamic profile demonstrated superior performance by maintaining favorable pressure conditions, ensuring high energy conversion and operational reliability.

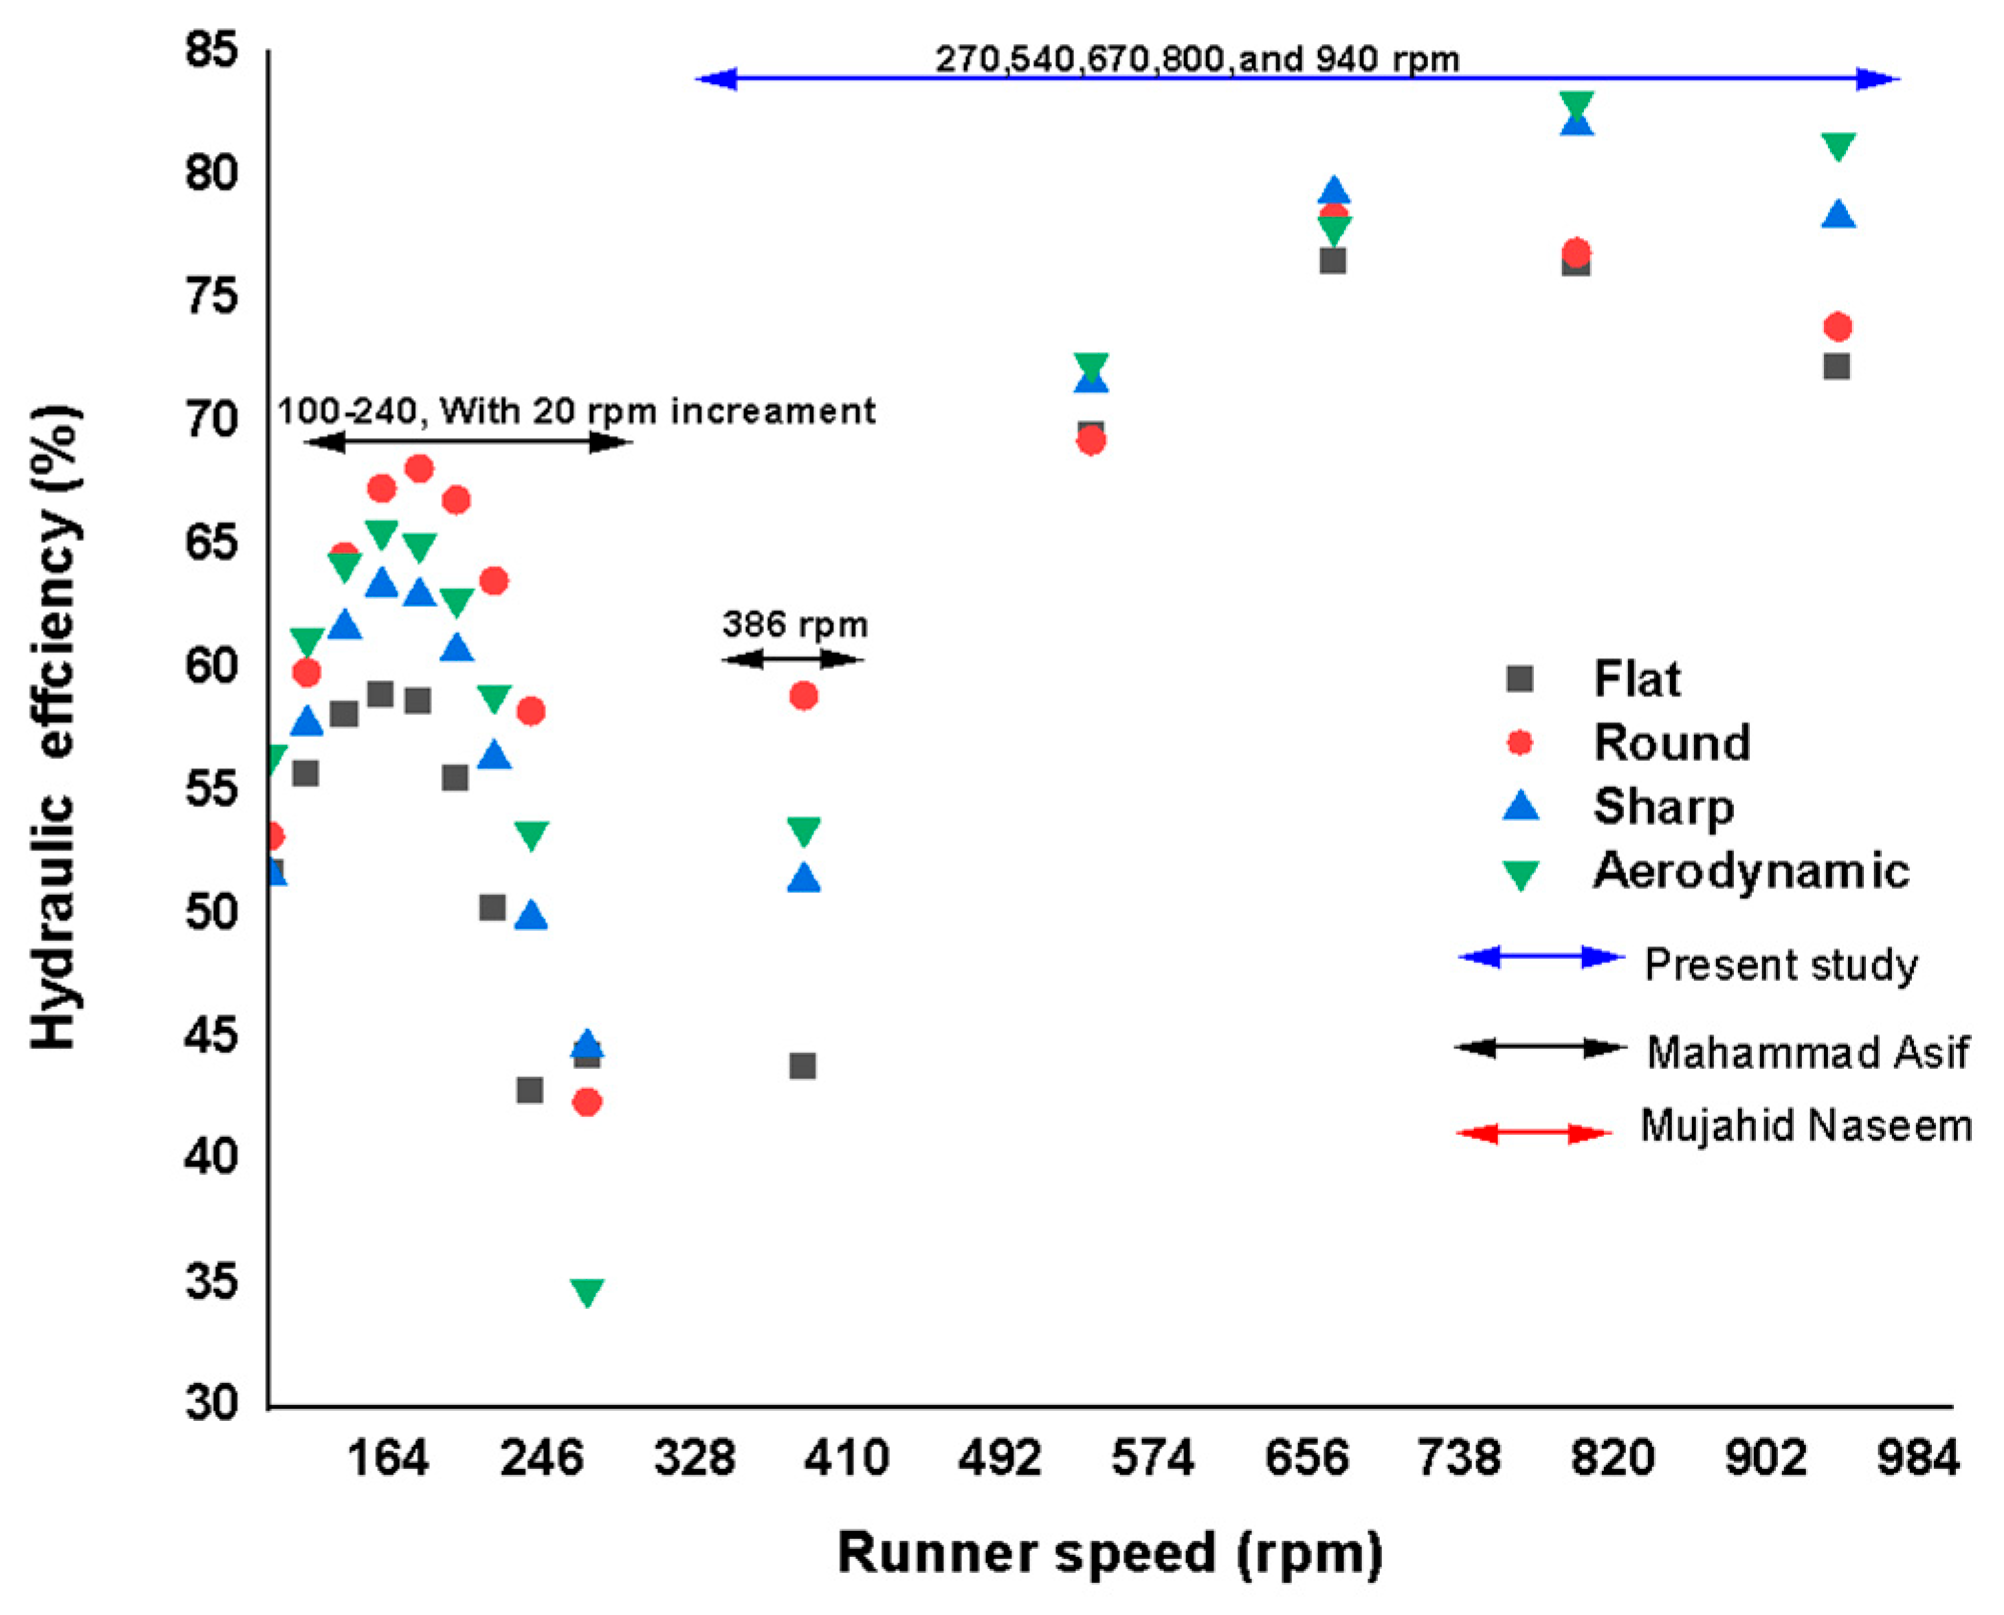
3.10. Comparison with Prior Studies

To contextualize the findings, the performance of the tested blade profiles was compared with findings reported in previous numerical investigations by Naseem [21], Asif [33], and others(see Figure 28). These studies primarily focused on lower runner speed regimes (100–386 rpm), limiting their applicability to high-speed MHP operations. Naseem [21] analyzed the impact of various leading-edge blade profiles across runner speeds ranging from 100 to 240 rpm in 20 rpm increments. The round blade profile achieved the highest efficiency (68%) at 180 rpm, whereas the flat blade consistently underperformed, recording a minimum efficiency of 59%. The aerodynamic and sharp blades in Naseem’s work demonstrated near-optimal performance around 160 rpm but showed limited gains with increased speed. Similarly, Asif reported a peak efficiency of 59% for the round blade at 386 rpm. Although both studies revealed consistent performance trends across blade types, the overall efficiency levels remained significantly lower than those obtained in this study. In a related investigation, a modified NACA 6512 airfoil with adjusted curvature and chord length was tested against a conventional tabular blade at speeds between 100 and 200 rpm under identical hydraulic conditions [16]. The airfoil profile demonstrated a 6% improvement in efficiency over the tabular design, peaking at 140 rpm. In contrast, the present study explored a broader speed range (270–940 rpm) and observed markedly superior efficiency, particularly for the aerodynamic blade, which reached a maximum of 83.5% at 800 rpm. The sharp blade also performed strongly, achieving an optimal efficiency of 79% at 670 rpm, while the round blade attained 78% efficiency. As anticipated, the flat blade lagged behind, with a peak of 76%, supporting its continued use primarily in cost-constrained applications. These results demonstrate that the aerodynamic and sharp blades exhibit strong efficiency gains at elevated speeds, validating their suitability for high-performance CFT applications. The findings also suggest that previous studies may have underestimated the turbine efficiency at higher speeds due to the limited operational range and suboptimal blade-flow interaction models.

4. Conclusions

This study has demonstrated that the blade profile geometry exerts a significant influence on the internal flow behavior and hydraulic performance of Cross-Flow Turbines (CFTs). Through high-resolution CFD simulations, it was found that the aerodynamic blade profile, inspired by NACA airfoils, provided superior performance across all runner speeds, achieving a maximum efficiency of 83.5% at 800 rpm. This profile exhibited favorable flow characteristics, including stable velocity fields, low turbulence intensity, and optimal stage-wise energy extraction. The sharp-edged blades also showed high efficiency at intermediate speeds, although with reduced robustness under off-design conditions. Conversely, flat and round blade profiles, while structurally simple and economically favorable, were associated with increased flow detachment, pressure losses, and elevated exit pressures, limiting their performance.
Stage-wise analysis revealed that the first stage dominates energy extraction, contributing up to 70% of the total output for well-optimized profiles. However, the efficiency of the second stage remains critically dependent on the upstream flow quality, which is best preserved by the aerodynamic and round blades. Exit pressure analysis further confirmed that effective pressure recovery and suppression of cavitation-prone regions are directly correlated with blade geometry. The water volume fraction and streamline visualizations supported these conclusions, highlighting the aerodynamic profile’s ability to sustain continuous, stable flow with minimal air entrainment or void formation. The findings not only validate the efficiency benefits of aerodynamic profiles in high-speed micro-hydropower applications but also suggest the feasibility of hybrid blade designs that merge structural simplicity with hydrodynamic performance.
Moreover, the optimization of CFT blade designs holds substantial promise for broader deployment within decentralized hybrid renewable energy systems. When integrated with complementary technologies such as solar photovoltaic (PV) and battery storage, these optimized turbines can enhance energy reliability, grid resilience, and cost-effectiveness in off-grid or weak-grid settings. Such systems align strongly with the goals of Sustainable Development Goal 7 (Affordable and Clean Energy), supporting rural electrification, sustainable infrastructure planning, and cross-sector energy policy. Expanding the application of high-efficiency CFTs beyond isolated hydropower contexts into multi-source renewable frameworks presents a critical step toward scalable and inclusive energy solutions.

5. Recommendations

Design Optimization: Future turbine designs should prioritize aerodynamic or sharp-edge profiles for improved hydraulic efficiency and internal flow stability, particularly in high-speed operations typical of decentralized energy systems.
Hybrid Geometry Exploration: A promising design avenue lies in hybrid blades that integrate a rounded leading edge (to suppress stagnation) with an aerodynamic trailing edge (to minimize separation), balancing manufacturability and performance.
Experimental Validation: To further support the simulation results, physical prototype testing under controlled conditions using PIV or LDA techniques is recommended for capturing transient effects and validating the turbulence behavior.
Three-Dimensional Modeling: Extending the study to three-dimensional and transient CFD simulations using LES or DES models would help capture secondary flow phenomena and assess unsteady behavior, particularly near blade tips and the runner-shaft interface.
Multi-objective Optimization: Incorporate techno-economic metrics into future design frameworks to simultaneously optimize hydraulic performance, material cost, and fabrication feasibility for scalable implementation in remote or resource-constrained regions.

Author Contributions

Both authors contributed to the conceptualization, analysis, and interpretation. E.Y.A. performed intensive analysis, drafting the manuscript and editing, and A.H.T. performed supervision, drafting, reviewing, and editing. All authors have read and agreed to the published version of the manuscript.

Funding

This study received no external funding.

Data Availability Statement

All important data is included in the manuscript.

Acknowledgments

We authors are grateful to NTNU (Norwegian University of Science and Technology) and Institute of Energy (IOE) for their unwavering support for this study.

Conflicts of Interest

The authors declare no conflicts of interest.

Abbreviations

SymbolDescriptionUnit
αpVolume fraction of a particular phase-
ρ P Density of a particular phaseKg/m3
μ P Viscosity of a particular phase
S P Continuity equation source term for a particular phase Kg/s
V r relative velocity of the flowm/s
μ e f f Effective viscositykg/m. s
μ t Turbulence viscositykg/m. s
μMean viscosity(kg/m.s)
ω Angular velocity of the flow:m/s
r Radius of the runnerm
α Angular acceleration m2/s
a Linear acceleration m2/s
S M P
∇ (-)
Momentum equation source term for a particular phase
Del operator
N/m3
P ˙ Modified pressure pa
P PressurePa
Po Reference pressurepa
V Absolute velocity of the flow
TTranspose-
tTimesec
k Turbulence kinetic energyJ/kg
εTurbulent Dissipation ratem3/s3
ωTurbulent frequencys−1
wVolume fraction of water-
aVolume fraction of air-
C μ Constants -
ρDensity of the fluid, and(kg/m3)
γaAir compressibility coefficient-
T Torque N.m
τThe total stress tensorPa
sSurface aream2
n Unit Vector Perpendicular to the Surface
rRadial position of the vectorm
a Unit vector parallel to the rotation axis
PturbineShaft powerkN
PwaterWater powerkN
HEffective net headm
QFlow ratem3/s
γSpecific weightN/m3
η Hydraulic efficiency %
VAbsolute water velocity m/s
UPeripheral blade velocity m/s
WRelative blade velocitym/s
VfThe radial velocity component m/s
V u The tangential velocity componentm/s
αAngle of attack: 0°deg
βBlade angle deg
ϴAngular (azimuthal)positiondeg
hCharacteristic grid spacingmm
r i j Refinement ratio-
NNumber of cells-
ε i j Relative error%
q n + 1 Observed order of accuracy-
τ e x a c t Richardson’s extrapolated torque
AbbreviationsDescription
PIVParticle Image Velocimetry
LDALaser Doppler Anemometry
CFTCross-flow turbine
MHPMicro hydropower
CFDComputational fluid dynamics
SSTShear-stress turbulence
WVFWater volume fraction
GCIGrid convergence index
FSSafety Factor

References

  1. International Energy Agency (IEA). Access to Electricity. Paris, France. Available online: http://www.iea.org/weo/electricity.asp (accessed on 24 January 2024).
  2. The High-Level Political Forum Goals Energy Action. Available online: https://hlpf.un.org/ (accessed on 19 February 2025).
  3. Eludoyin, E.O. The Nature of Sustainable Energy Access Transitions: Realities and possibilities for Lagos, Nigeria. Ph.D. Thesis, UCL Energy Institute, University College London, London, UK, 2018; 421p. Available online: http://discovery.ucl.ac.uk/10057177/7/Eludoyin_10057177_thesis_redacted_photo.pdf (accessed on 13 July 2023).
  4. Kaunda, C. Energy situation, potential and application status of small scale hydropower systems in Malawi. Renew. Sustain. Energy Rev. 2013, 26, 1–19. [Google Scholar] [CrossRef]
  5. Del Rio, J.S.; Galvis-Holguin, S.; Hincapié-Zuluaga, D.; Chica, E. Effect of hydrodynamically designed blades on the efficiency of a michell-banki turbine. Int. J. Renew. Energy Res. 2020, 10, 1165–1173. [Google Scholar] [CrossRef]
  6. Sammartano, V.; Aricò, C.; Carravetta, A.; Fecarotta, O.; Tucciarelli, T. Bank-Michell optimal design by computational fluid dynamic testing and hydynamic analysis. Energies 2013, 6, 2362–2385. [Google Scholar] [CrossRef]
  7. Muchtar, M.; Rasyid, S.; Nur, R. Welding fixture design for the production of cross-flow turbine runner. AIP Conf. Proc. 2018, 1977, 030020. [Google Scholar] [CrossRef]
  8. Adhikari, R.; Wood, D. The design of high efficiency crossflow hydro turbines: A review and extension. Energies 2018, 11, 267. [Google Scholar] [CrossRef]
  9. Baidar, B.; Koirala, R.; Neopane, H.P.; Shrestha, M.V.; Thapa, B. Strategic rehabilitation of the earthquake affected microhydropower plants in Nepal. IOP Conf. Ser. Earth Environ. Sci. 2016, 49, 102003. [Google Scholar] [CrossRef]
  10. Yildiz, V. Numerical Simulation Model of Run of River Hydropower Plants: Concepts, Numerical Modeling, Turbine System and Selection, and Design Optimization; University of California: Irvine, CA, USA, 2015; p. 84. [Google Scholar]
  11. Assefa, E.Y.; Tesfay, A.H. Effect of Blade Number on Internal Flow and Performance Characteristics in Low-Head Cross-Flow Turbines. Energies 2025, 18, 318. [Google Scholar] [CrossRef]
  12. Yadav, V.K.; Singal, S.K. Performance analysis of cross-flow turbine: Variation in shaft diameter. In Development of Water Resources in India. Water Science and Technology Library; Springer: Cham, Switzerland, 2017; Volume 75, pp. 487–497. [Google Scholar]
  13. Guo, Q.; Zhou, L.; Wang, Z. Numerical evaluation of the clearance geometries effect on the flow field and performance of a hydrofoil. Renew. Energy 2016, 99, 390–397. [Google Scholar] [CrossRef]
  14. Adanta, D.; Sari, D.P.; Syofii, I.; Prakoso, A.P.; Saputra, M.A.A.; Thamrin, I. Performance Comparison of Crossflow Turbine Configuration Upper Blade Convex and Curvature by Computational Method. Civ. Eng. J. 2023, 9, 154–165. [Google Scholar] [CrossRef]
  15. Desai, V.R.; Aziz, N.M. An experimental investigation of cross-flow turbine efficiency. J. Fluids Eng. Trans. ASME 1994, 116, 545–550. [Google Scholar] [CrossRef]
  16. Anand, R.S.; Jawahar, C.P.; Bellos, E.; Malmquist, A. A comprehensive review on Crossflow turbine for hydropower applications. Ocean. Eng. 2021, 240, 110015. [Google Scholar] [CrossRef]
  17. Woldemariam, E.T.; Lemu, H.G.; Wang, G.G. CFD-driven valve shape optimization for performance improvement of a micro cross-flow turbine. Energies 2018, 11, 248. [Google Scholar] [CrossRef]
  18. Rasmussen, I.J. Design of a Francis Model Test Rig at Kathmandu University. Master’s Thesis, Institutt for Energi-og Prosessteknikk, Trondheim, Norway, 2014. [Google Scholar]
  19. Sinagra, M.; Picone, C.; Aricò, C.; Pantano, A.; Tucciarelli, T.; Hannachi, M.; Driss, Z. Impeller optimization in crossflow hydraulic turbines. Water 2021, 13, 313. [Google Scholar] [CrossRef]
  20. Chelabi, M.A.; Dobrotvorskiy, S.; Basova, Y.; Aleksenko, B.A.; Edl, M.; Zdebor, J.; Machado, J. Influence of the Main Geometrical Parameters on the Design and Performance of Mixed Inflow Turbines. Appl. Sci. 2022, 12, 12165. [Google Scholar] [CrossRef]
  21. Naseem, M.; Saleem, A.; Naseem, M.S. Investigation of blade design parameters for performance improvement of hydraulic cross flow turbine. Ocean Eng. 2022, 257, 111663. [Google Scholar] [CrossRef]
  22. Urame, C.; Hoole, P.R. Design and Implementation of Hybrid Pico-Hydro—Photovoltaic (PV) Solar Power Plant in Massy-Gahuku LLG. Eur. J. Electr. Eng. 2020, 22, 395–403. [Google Scholar] [CrossRef]
  23. Sedlar, M.; Ji, B.; Kratky, T.; Rebok, T.; Huzlik, R. Numerical and experimental investigation of three-dimensional cavitating flow around the straight NACA2412 hydrofoil. Ocean Eng. 2016, 123, 357–382. [Google Scholar] [CrossRef]
  24. Georgescu, A.M.; Georgescu, S.C.; Degeratu, M. Experimental setup designed for testing a cross-flow water turbine in a wind tunnel. UPB Sci. Bull. Ser. D Mech. Eng. 2008, 70, 191–200. [Google Scholar]
  25. Japan International Cooperation Agency. Guideline and Manual for Hydropower Development Vol. 2. Small Scale Hydropower. 2011. Available online: https://openjicareport.jica.go.jp/pdf/12024881_01.pdf (accessed on 3 April 2025).
  26. Oberkampf, W.L.; Trucano, T.G. Verification and validation in computational fluid dynamics. Prog. Aerosp. Sci. 2002, 38, 209–272. [Google Scholar] [CrossRef]
  27. Menter, F.R.; Kuntz, M.; Langtry, R. Ten Years of Industrial Experience with the SST Turbulence Model Turbulence heat and mass transfer. Turbul. Heat Mass Transf. 2004, 4, 625–632. [Google Scholar]
  28. Phillips, T.S.; Roy, C.J. Richardson extrapolation-based discretization uncertaint estimation for computational fluid dynamics. J. Fluids Eng. Trans. ASME 2014, 136, 121401. [Google Scholar] [CrossRef]
  29. Ahn, S.Y.; Kim, K.Y. Thermal performance of t-shaped obstacles in a solar air heater. Processes 2020, 8, 1305. [Google Scholar] [CrossRef]
  30. Kaunda, C.S.; Kimambo, C.Z.; Nielsen, T.K. A numerical investigation of flow profile and performance of a low cost crossflow turbine. Int. J. Energy Envrion. 2014, 5, 275–296. [Google Scholar]
  31. Javaherchi, T.; Stelzenmuller, N.; Seydel, J.; Aliseda, A. Experimental and Numerical Analysis of a Scale-Model Horizontal Axis Hydrokinetic Turbine. In Proceedings of the 2nd Marine Energy Technology Symposium METS2014, Seattle, WA, USA, 15–18 April 2014. [Google Scholar]
  32. Menter, F.R.; Sechner, R.; Matyushenko, A. Best Practice: RANS Turbulence Modeling in ANSYS CFD. 2021. 295p. Available online: https://www.ansys.com/resource-center/technical-paper/best-practice-rans-turbulence-modeling-in-ansys-cfd (accessed on 19 February 2025).
  33. Ibrahim, B.; Chattha, J.A.; Asif, M. Optimization of Blade Profiles of Cross Flow Turbine (CFT). Int. J. Power Energy Convers. IJPEC 2018, 9, 311–326. [Google Scholar] [CrossRef]
Figure 1. Flow path characteristics and components of the CFT.
Energies 18 03203 g001
Figure 2. (a) Flow path and design workflow; (b) Velocity triangles and (c) Blade parameters.
Energies 18 03203 g002
Figure 3. Blade profiles considered: (a) Flat, (b) Round, (c) Sharp edged, and (d) Aerodynamic.
Energies 18 03203 g003
Figure 4. Computational domain components: (a) Free inner zone, (b) Runner, and (c) Nozzle and casing.
Energies 18 03203 g004
Figure 5. Discretization of the computational domain: (a) Runner domain, (b) Free inner surface, and (c) Casing and nozzle regions.
Energies 18 03203 g005
Figure 6. Grid sensitivity analysis based on the torque convergence.
Energies 18 03203 g006
Figure 7. Effect of runner speed and blade profile on the relative velocity at the outer runner periphery: (a) Flat, (b) Round, (c) Sharp, and (d) Aerodynamic.
Energies 18 03203 g007
Figure 8. Water velocity distribution for different blade profiles at 270 rpm: (a) Flat, (b) Round, (c) Sharp, and (d) Aerodynamic.
Energies 18 03203 g008
Figure 9. Water velocity distribution profiles at 670 rpm: (a) Flat, (b) Round, (c) Sharp, and (d) Aerodynamic.
Energies 18 03203 g009
Figure 10. Water velocity distribution profiles at 940 rpm: (a) Flat, (b) Round, (c) Sharp, and (d) Aerodynamic.
Energies 18 03203 g010
Figure 11. Effect of runner speed and blade profile on the tangential velocity component at the outer runner periphery: (a) Flat, (b) Round, (c) Sharp, and (d) Aerodynamic.
Energies 18 03203 g011
Figure 12. Effect of blade profile on radial flow distribution at 800 rpm: (a) Flat, (b) Round, (c) Sharp, and (d) Aerodynamic.
Energies 18 03203 g012
Figure 13. Static Pressure distribution profile at different runner speeds: (a) Flat, (b) Round, (c) Sharp, and (d) Aerodynamic.
Energies 18 03203 g013
Figure 14. Static pressure distribution profile at 540 rpm: (a) Flat, (b) Round, (c) Sharp, and (d) Aerodynamic.
Energies 18 03203 g014
Figure 15. Static pressure distribution at 670 rpm for the four blade profiles: (a) flat, (b) round, (c) Sharp, and (d) Aerodynamic.
Energies 18 03203 g015aEnergies 18 03203 g015b
Figure 16. Pressure distribution profile at 800 rpm for the four blade profiles: (a) static pressure and (b) Total pressure.
Energies 18 03203 g016
Figure 17. Effect of WVF distribution profile at 800 rpm for the four blade profiles: (a) Flat, (b) Round, (c) Sharp, and (d) Aerodynamic.
Energies 18 03203 g017
Figure 18. Localized water volume fraction distribution at 800 rpm for different blade profiles.
Energies 18 03203 g018
Figure 19. Streamline evolution and recirculation patterns for the flat blades at 270, 670, 800 and 940 rpm.
Energies 18 03203 g019
Figure 20. Streamline evolution for the round blades at 270, 670, and 940 rpm.
Energies 18 03203 g020
Figure 21. Streamline evolution for the sharp-edged blades at 270, 670, and 940 rpm.
Energies 18 03203 g021
Figure 22. Streamline evolution for the aerodynamic blades at 270, 670, and 940 rpm.
Energies 18 03203 g022
Figure 23. Hydraulic efficiency trends across varying runner speeds and velocity ratio (a) Flat, (b) Round, (c) Sharp, and (d) Aerodynamic.
Energies 18 03203 g023aEnergies 18 03203 g023b
Figure 24. Optimal velocity ratio for each blade profile.
Energies 18 03203 g024
Figure 25. Effect of runner speed across each blade profile. (a) Torque generation, (b) shaft power.
Energies 18 03203 g025
Figure 26. Stage-wise efficiency distribution for (a) Flat, (b) Round, (c) Sharp, and (d) Aerodynamic blade profiles at different runner speeds.
Energies 18 03203 g026
Figure 28. Comparative analysis of blade efficiency trends from prior and current studies.
Energies 18 03203 g028
Table 1. Geometrical and operating specifications of the CFT used in the simulation.
Design ParameterSymbolValueUnit
Effective pressure headH10m
Flow rateQ55l/s
Flow attack angle α 1 16deg
Blade entry angle (1st stage) β 1 30deg
Blade exit angle (1st stage) β 2 90deg
Optimal runner speedN670rpm
Outer runner diameter D 1 200mm
Inner runner diameter D 2 130mm
Diameter ratio D r 0.66-
Jet thickness S 1 17mm
Blade spacing t 1 34mm
Number of blades Z b 18-
Blade thickness (except sharp)t3mm
Nozzle entry arch angleλ90deg
Blade curvature radius r b 33mm
Central angle δ 73.5deg
Blade width B w 225mm
Table 2. Torque results across the grid levels.
Grid LevelNumber of Cells (N)Torque (Nm)Grid Spacing (h)
Coarse 321,5000.2430.00176
Medium 620,0000.24350.00127
Fine 915,6000.24380.00105
Table 3. Grid convergence and numerical uncertainty metrics.
ParametersSymbolValueUnit
Fine-to-medium refinement ratio r 21 1.39-
Medium-to-coarse refinement ratio r 32 1.22-
Observed order of accuracy q n + 1 0.33-
Richardson’s extrapolated torque τ e x a c t 0.25N.m
Relative Error (fine-to-medium) ( ε 21 )0.0013-
Relative Error (medium-to-coarse) ( ε 32 )0.0014-
Grid Convergence Index (fine-to-medium)GCI_211.38(%)
Grid Convergence Index (medium-to-coarse)GCI_321.56(%)
Table 4. Summarizes the internal flow behavior across the runner speed range for each blade geometry.
Blade ProfileLow Runner Speed
(270–540 rpm)
Medium Runner Speed
(540–640 rpm)
Higher Runner Speed
(800–940 rpm)
Hydraulic Performance
Flat High separation, strong recirculationVortex shedding, unstable wakeSevere instability, low efficiency Poor
Round Improved flow, minor voidsStable flow with minor detachment Coherent vortex structure Moderate
sharpEarly detachment, vortex near the rootOptimal flow redirection Unstable from strong gradients Speed dependent
Aerodynamic Attached flow, minimal wakeStable, efficient pressure recoveryDelayed separation, reduced sheddingHigh efficiency across most speed ranges
Disclaimer/Publisher’s Note: The statements, opinions and data contained in all publications are solely those of the individual author(s) and contributor(s) and not of MDPI and/or the editor(s). MDPI and/or the editor(s) disclaim responsibility for any injury to people or property resulting from any ideas, methods, instructions or products referred to in the content.

