Article

Cable Aging State Diagnosis Adapted from Frequency-Domain Dielectric Spectroscopy and Polarization–Depolarization Current

1
State Grid Beijing Electric Power Co., Ltd., Beijing 100015, China
2
School of Electrical Engineering, Xi’an Jiaotong University, Xi’an 710049, China
*
Authors to whom correspondence should be addressed.
Energies 2025, 18(12), 3169; https://doi.org/10.3390/en18123169
Submission received: 30 April 2025 / Revised: 3 June 2025 / Accepted: 11 June 2025 / Published: 17 June 2025

Abstract

:
Cross-linked polyethylene (XLPE) cables will gradually experience aging under various stresses during long-term operation, which may lead to faults and seriously affect the safe and stable operation of the power system. This article prepares aged cable samples by accelerating the thermal aging of XLPE cables, and combines frequency-domain dielectric spectroscopy (FDS) and the polarization–depolarization current method (PDC) for detection and analysis. By measuring the dielectric loss of aged cables using frequency-domain dielectric spectroscopy, it was found that the dielectric loss value in the low-frequency region significantly increases with aging time, indicating that aging leads to an increase in polarity groups and polarization loss. The high-frequency dielectric loss also significantly increases with the strengthening of dipole polarization. At the same time, using the polarization–depolarization current method to measure the polarization current and depolarization current of cables, it was found that the stable value of polarization current increases with aging time, further verifying the changes in the conductivity and polarization characteristics of insulation materials. Combining the broadband dielectric response characteristics of FDS (0.001 Hz–1 kHz) with the time-domain charge transfer analysis of PDC, the molecular structure degradation (dipole polarization enhancement) and interface defect accumulation (space charge effect) of cable aging are revealed from both frequency- and time-domain perspectives. The experimental results show that the integral value of the low-frequency region of the frequency-domain dielectric spectrum and the stable value of the polarization depolarization current are positively correlated with the aging time, and can make use of effective indicators to evaluate the aging state of XLPE cables.

1. Introduction

Power cables are integral elements of modern power transmission and distribution systems, with their insulation status holding paramount significance for the operational reliability of the power grid. Compared with overhead lines, cable systems achieve compact urban space utilization through underground installation. However, their long-term operation under electro-thermal coupled stress leads to insulation aging, which has become a major hidden hazard threatening the safe operation of power systems [1]. Cross-linked polyethylene (XLPE), as a common insulation material, undergoes molecular chain fracture after aging, which generates free radicals and triggers chain degradation reactions. This leads to changes in crystallinity and polar groups. Such microstructural deterioration results in macroscopic property degradation through reduced mechanical performance, lowered insulation resistance, and increased dielectric loss, ultimately causing a decline in dielectric performance [2]. Statistics have shown that over 60% of cable failures are caused by insulation aging. Therefore, accurate evaluation of power cable aging has become a vital issue in power system operation and maintenance.
Traditional AC withstand voltage tests often adapt 2–3 times the rated voltage to verify insulation strength. Although the AC test can determine overall insulation withstand capability, the high voltage may accelerate dielectric damage, with the results only providing a binary judgment of pass or fail. They cannot quantify the degree of aging or provide predictive capability for insulation status. Against this background, both time-domain and frequency-domain dielectric response technologies have gained widespread attention due to their non-destructive testing characteristics. Peter Werelius applied high-voltage dielectric spectroscopy (HVDS) to study the aging characteristics of XLPE cables. The experiments revealed that aging induced voltage nonlinearity, which was a unique dielectric response manifested as significant dispersion in complex permittivity under increasing test voltages [3]. S. Hvidsten demonstrated that traditional dielectric loss measurements have significant limitations in detecting local defects in long cables, as intact sections may mask localized aging signals. They found that the nonlinearity in the dielectric spectrum was not affected by the cable length ratio [4]. Wang Wei systematically studied the effects of combined thermal and electrical aging on the insulation properties of XLPE cables. Their results showed that the dielectric loss peak increased by up to 300% in the 10−2–101 Hz frequency range, indicating that the accumulation of polar groups intensified dielectric relaxation [5]. Du Boxue carried out accelerated thermal aging experiments on XLPE cable press sheets and observed a strong consistency among physicochemical indicators such as oxidation induction time, carbonyl index, and elongation at break in assessing aging degree. Broadband dielectric impedance spectroscopy (BDIS) tests further revealed a strong correlation between the low-frequency dielectric spectrum and the aging state [6]. The polarization–depolarization current (PDC) method is an efficient offline and non-destructive technique for insulation diagnostics. Its principle involves applying a DC voltage to the test cable to induce polarization, followed by monitoring the variation in polarization and depolarization currents to evaluate the insulation performance and aging status. Bhumiwat developed a field-applicable, non-destructive dielectric response diagnostic method for motor insulation based on the PDC technique [7]. The study found that the unaged insulation exhibited power-law decay in PDC curves, whereas in aged insulation, polarization phenomena (e.g., interfacial water adsorption and thermal degradation byproducts) increased polarization current, deviating from the power-law behavior and exhibiting a steady-state component [7]. Dakka M.A. investigated the dielectric property changes in underground XLPE cable insulation during the aging process using the PDC method. Their study showed that the integral value of the low-frequency depolarization current increased with polarization time and varied significantly with aging [8]. Yang Fan et al. applied PDC measurements to XLPE cables at different aging stages, focusing on the low-frequency behavior of the depolarization current. The results demonstrated that aged cables had faster current decay and higher steady-state currents than new ones, indicating slower charge dissipation and the presence of residual charges [9]. Cai Gang proposed a dual-parameter diagnostic method based on PDC analysis for aged cables, incorporating both DC conductivity and nonlinear coefficients. Experimental results revealed that the aged samples exhibited a two-order-of-magnitude increase in DC conductivity, accompanied by increased nonlinearity. This combined parameter approach addressed the limitations of relying solely on conductivity, which improves the accuracy and reliability of insulation diagnostics [10].
Adapted from the PDC and FDS experimental results, this paper constructs cable aging condition parameters and performs correlation analysis with aging degree using the Pearson correlation coefficient method. We also compare the sensitivity and applicable scope of the two diagnostic techniques, providing a theoretical basis for insulation condition assessment of power cables.

2. Experimental Scheme

2.1. Thermal Aging Test

The experiment takes the YJV62 single-core cable produced by Hengrui Co., Ltd. (Lianyungang, China) as the test sample. The insulation material of the cable is made of XLPE with a rated voltage of 10 kV. In the preparation stage, it is necessary to process the cable into a three-electrode system, as shown in Figure 1. Firstly, a cable segment with a length of 0.6 m was cut and stripped of the outer sheath, armor, insulation sheath, and copper shielding layer. The exposed outer semi-conducting layer was taken as the measuring electrode. Then, a wire stripping tool was employed to remove the 4 cm material of the insulation layer, and the exposed copper conductor cores were made use of at both ends as high-voltage electrodes for measurement. Afterwards, we stripped off the 3 cm semi-conducting layers at both ends of the cable, added two copper shielding rings at each end of the insulation layer, and grounded them as protective electrodes. The semi-conducting layer must be treated as above, otherwise surface leakage current may occur, seriously influencing the experimental results’ accuracy [11,12].
The prepared cable samples were then placed in a constant-temperature aging oven for thermal aging. The acceleration temperature range is usually between 120 and 140 °C, as it is found that a higher temperature may melt the XLPE sample, while a lower temperature will not effectively accelerate the aging process. So, we chose to take 135 °C as the accelerating temperature [13]. During the test, the samples were suspended within the aging chamber to prevent contact with the chamber walls or stacking, thereby ensuring uniform exposure. For each aging period, at least three cable samples were prepared to ensure data reliability. The different sample groups were removed weekly and cooled naturally to room temperature in a dry environment before subsequent measurements were carried out.

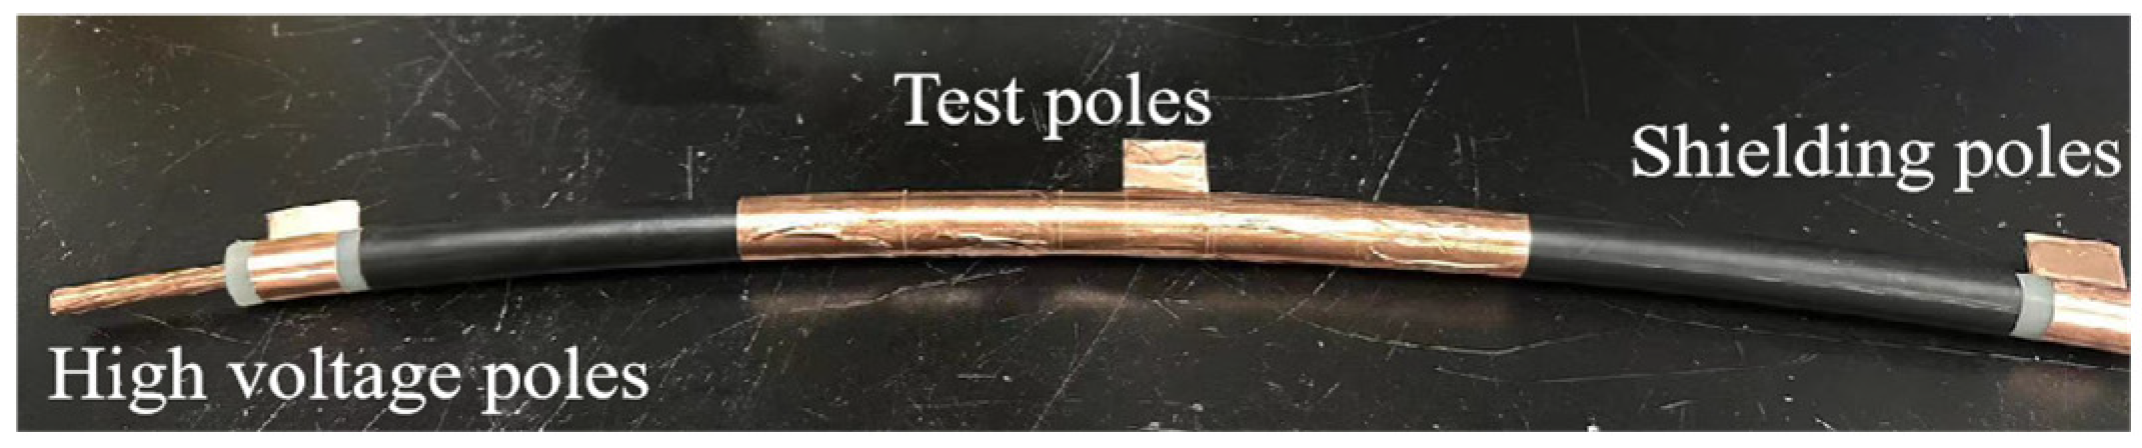
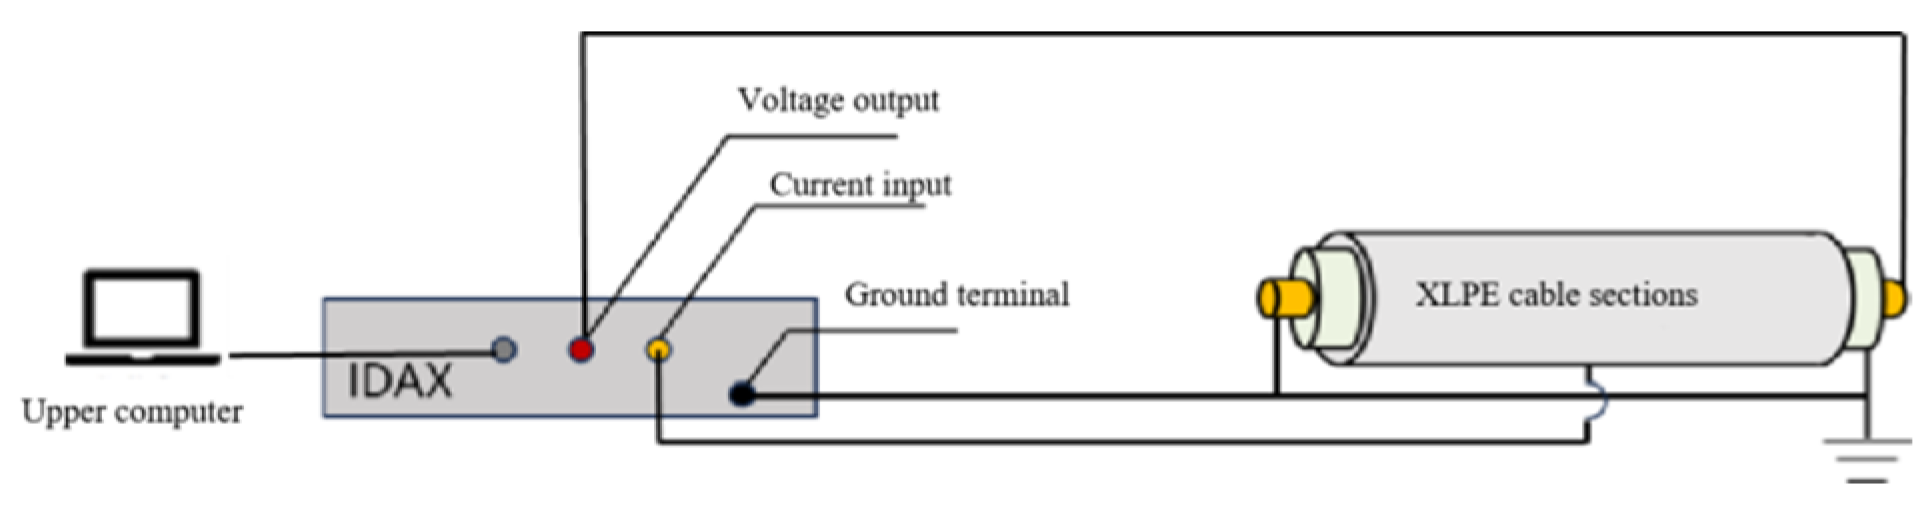
2.2. High-Voltage Dielectric Spectroscopy Test

The IDAX-300 dielectric response analyzer produced by Megger (Fort Collins, CO, USA) was adapted in FDR measurements in this study, which allows testing in the frequency range from 10−4 Hz to 104 Hz and maximum voltage of 2 kV. Figure 2 shows the schematic diagram of the FDS measurement. A sinusoidal test signal of 100 V was applied in the experiment, with a selected frequency sweep range of 10−3 Hz to 103 Hz. A higher frequency cannot efficiently reflect the property change by aging, and an even lower frequency will cost too much time but provide no further information. Each measurement session lasts 60 min. During the test, the response current signal was transmitted back to the analyzer by the low-voltage electrode, which was then transferred to a computer via a data interface and processed by specialized software to derive the dielectric response characteristics of the cable insulation. The schematic diagram of the test principle is shown in Figure 3. After the test, the cable samples were grounded to discharge. Multiple repeated tests were conducted following the above steps.

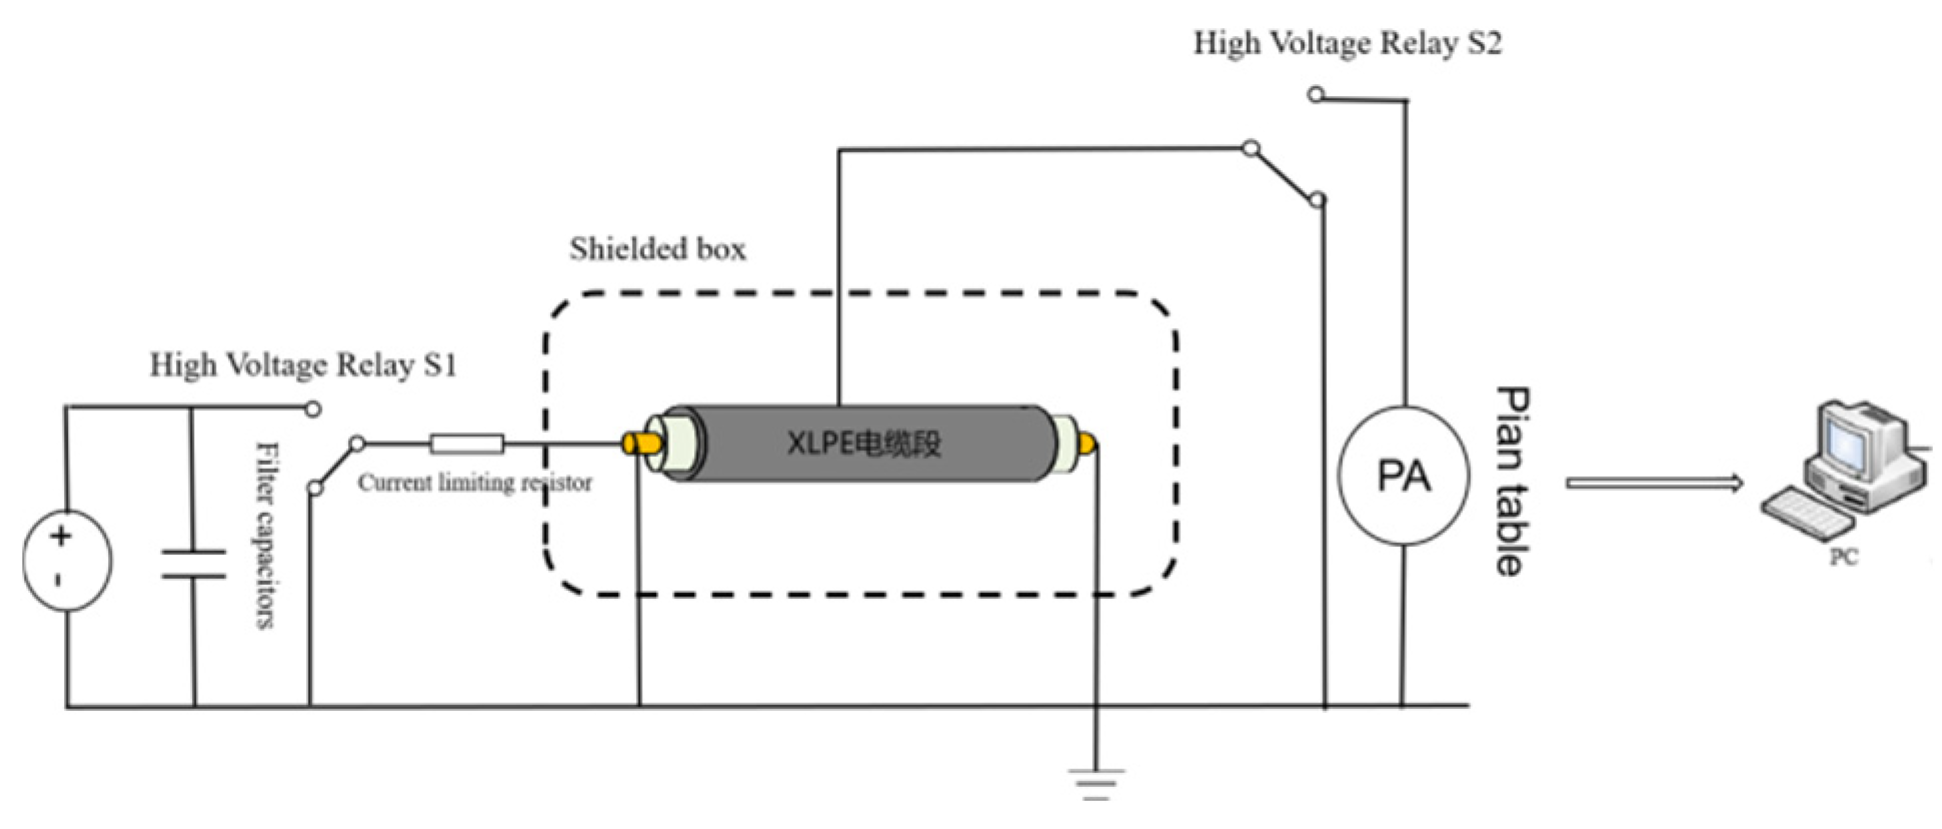
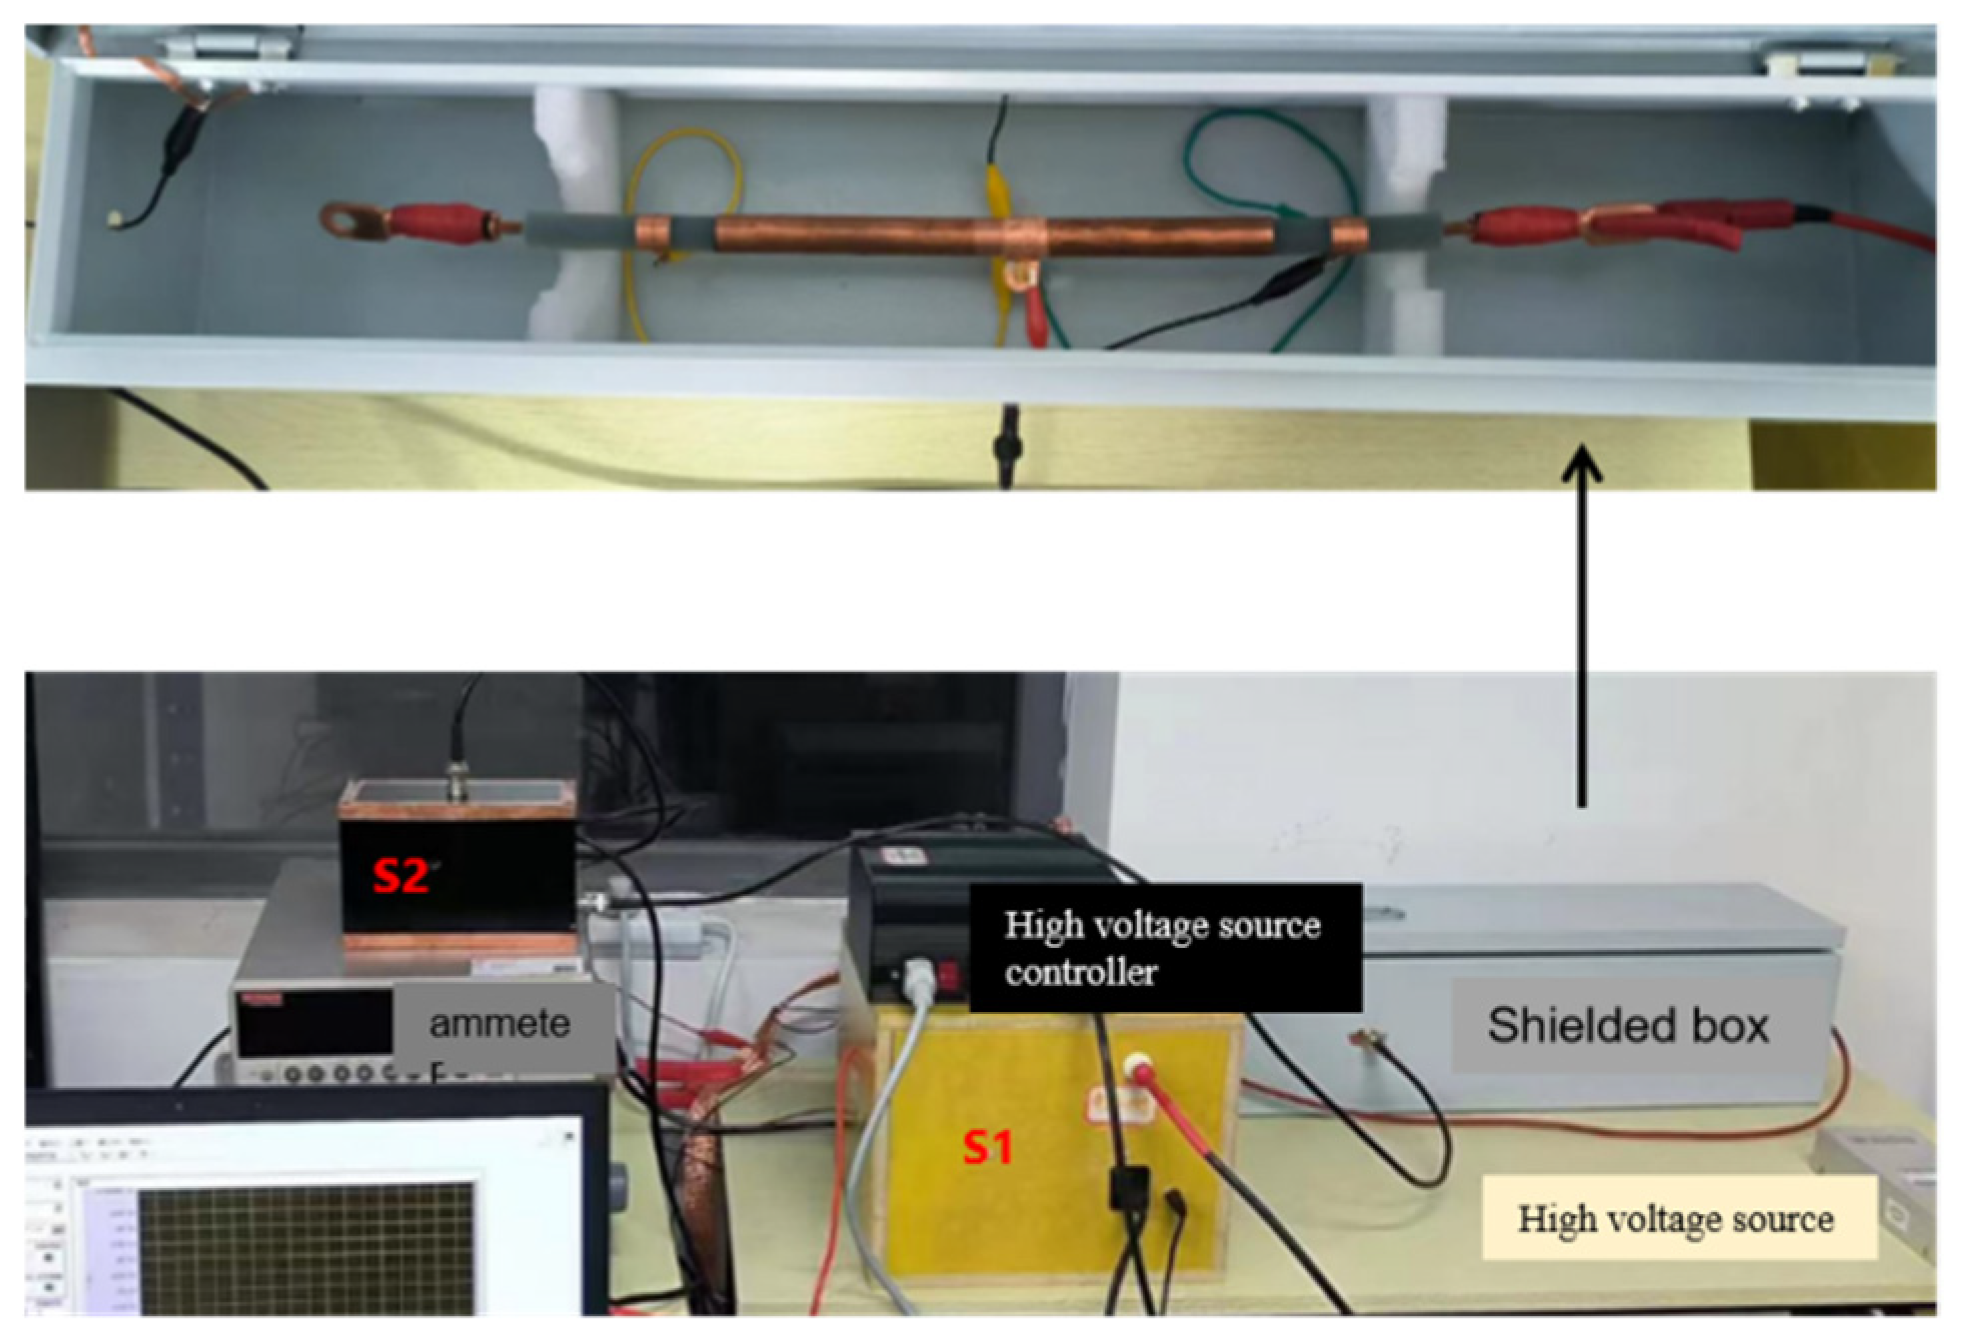
2.3. Polarization and Depolarization Current Test

Figure 4 presents a schematic diagram of the PDC measurement setup. The system primarily consists of a high-voltage power supply, high-voltage relays, a protection circuit, a pico-ammeter, a shielding enclosure, a controller, and a signal acquisition and storage module.
Before the experiment, the high-voltage relays S1 and S2 remained in the open state, with both the cable conductor and the outer semi-conducting layer grounded. Once the measurement started, the high-voltage DC power supply first charged the filter capacitor. Then, the relay S1 was closed to apply the polarization voltage to the cable. To prevent damage to the pico-ammeter and avoid distortion due to the initial surge current, the relay S2 was closed with a delay of 1 s after S1 closure, initiating the measurement of the polarization current. The recorded polarization current comprises the leakage current and absorption current. After the test, S1 was opened and the cable conductor was grounded, initiating the depolarization process. All current signals were transmitted via the pico-ammeter to the computer, where the polarization and depolarization waveforms were generated using the Lab-VIEW (21.0.1). A photograph of the cable PDC testing platform is shown in Figure 5.

3. Frequency-Domain Dielectric Spectrum Experimental Results and Analysis

3.1. Dielectric Spectrum Testing of Aged Cables

The dielectric spectroscopy measurement was performed on XLPE cable segment specimens subjected to different thermal aging durations by an IDAX frequency-domain dielectric response analyzer. The testing was conducted over a frequency range from 0.001 Hz to 1 kHz. To better visualize the dielectric loss factor at low frequencies, the horizontal axis is presented on a logarithmic scale. The dielectric response results of the XLPE cable segments are shown in Figure 6.
Across the entire frequency spectrum, the dielectric loss factor (tanδ) of the unaged XLPE cable remains nearly constant, indicating a structurally uniform material with minimal frequency-dependent polarization response. As thermal aging time increases, the dielectric loss factor rises at all frequencies, which is reflected in the dielectric spectra as an overall upward shift in the curve. Simultaneously, the frequency dependence of tanδ becomes more pronounced. Particularly, the apparent increases in dielectric loss are observed at both low and high frequency extremes, especially after prolonged aging, where tanδ values become substantially higher. The growth in dielectric loss in the initial stage is relatively slow, but it accelerates obviously with the continued aging. Overall, the dielectric loss behavior of aged samples exhibits a characteristic shape in the dielectric spectrum: a relatively flat middle region with sharp increases at both ends.
In the low-frequency region, as the frequency decreases from 0.1 Hz to 0.001 Hz, the tanδ of XLPE specimens gradually increases. For unaged cables, this frequency dependence remains minimal. However, with increasing thermal aging time, the slope of the tanδ–frequency curve in the low-frequency range becomes steeper, and the difference in tanδ values among different aging durations becomes more distinct. This makes the tanδ–f characteristics increasingly sensitive to aging, enabling more effective differentiation between varying aging states. In the most severely aged condition, the tanδ value at 0.001 Hz reaches as high as 0.37. The increase in dielectric loss at low frequency mainly corresponds to the increase in conduction current due to thermal aging. This will be discussed in the next section, together with the polarization current results.
In the high-frequency region, the dielectric loss factor (tanδ) of XLPE specimens gradually increases with rising frequency. With prolonged thermal aging, the dielectric loss becomes markedly more severe. After 7-week aging, the tanδ value peaks at 0.83 at 1000 Hz, reflecting significant deterioration in the dielectric performance of the cable insulation at higher frequencies. The increase in dielectric loss at high frequency corresponds to the increase in polar groups which enhances the reorientation polarization at relatively high frequency. The increased polar groups are considered to be generated by the broken bonds and increased C-O bond due to thermal oxidation.

3.2. Relationship Between Cable Insulation Thermal Aging Time and High-Voltage Dielectric Spectrum

An increase in polar groups in a material will increase the relative permittivity of the material. To make this clear, the relative permittivity of the cables at different aging stages was calculated at selected frequencies of 1000 Hz, 50 Hz, 1 Hz, 0.1 Hz, 0.01 Hz, and 0.001 Hz. The variation in relative permittivity with aging time at these frequencies is illustrated in Figure 7.
As shown in Figure 7, the relative permittivity of XLPE cables exhibits a significant increase with prolonged thermal aging, rising from 2.44 in the unaged state to 2.99 under severe aging conditions. This change is attributed to thermal degradation, which induces molecular chain fracture and the formation of polar groups such as carbonyl and carboxylic acid groups. These polar groups possess much higher dipolar polarization capability compared to the non-polar polyethylene matrix, thereby enhancing the overall polarizability of the XLPE material and significantly increasing εr.
In unaged XLPE, the dielectric response is primarily governed by electronic displacement polarization and a small amount of impurity ion migration, both of which respond almost instantaneously and exhibit negligible frequency dependence over a wide frequency range. However, as aging progresses, especially by the ninth week of thermal aging, a clear frequency dependence of εr emerges. For severely aged cables, εr increases from 2.91 at 1000 Hz to 2.99 at 0.001 Hz. This frequency-dependent behavior in aged samples reflects the dynamic nature of polarization responses. The results in Figure 7 show that the relative permittivity of XLPE increases with the thermal aging. This is consistent with the increase in polar groups due to thermal aging.
To further analyze the dielectric behavior, the integral values of dielectric loss (tanδ) over the low-frequency range (0.001 Hz–1 Hz) and the high-frequency range (100 Hz–1000 Hz) were quantitatively evaluated. Figure 8 presents the trends in these integrals as a function of aging duration, highlighting the distinct evolution of dielectric loss characteristics in different frequency domains.
Comparing Figure 6, Figure 7 and Figure 8, it can also be seen that the trend of integral values of dielectric loss show similar trends with the relative permittivity on the relationship with aging time. However, the changing rate of the integral values are much higher than the values of relative permittivity and the values of dielectric loss at a specific frequency. This shows that the integral values of dielectric loss are more sensitive with the changes in aging.
At low frequencies, dielectric loss is primarily dominated by conductive losses. As the frequency increases, the relaxation polarization cannot establish itself in time, and the dielectric material exhibits minimal relaxation loss. With increasing aging time, the dielectric loss factor at low frequencies significantly increases, with more pronounced changes occurring as aging time lengthens. Thermal aging causes the long chains of cross-linked polyethylene (XLPE) to break, generating a large number of polar groups, which leads to an increase in the low-frequency dielectric loss factor of XLPE. Furthermore, the dielectric loss increases more at lower frequencies.
In the high-frequency region, dielectric loss is mainly governed by dipolar polarization or reorientation polarization and the rapid movement of molecular chains. These processes have short response times and are highly sensitive to changes in the material’s microstructure. Thermal aging results in the breakdown of the XLPE cross-linking network, leading to molecular chain fracture and making dipoles more responsive to high-frequency electric fields. The enhanced mobility of molecular chains accelerates the polarization response, resulting in an increase in high-frequency tanδ.
The dielectric loss factor shows a strong correlation with aging time, which suggests that the dielectric loss integral values can be used to characterize the overall aging state of the cable. To overcome the limitations of analyzing a single frequency range, a composite aging parameter, denoted as A2, is proposed in this study to comprehensively represent the synergistic degradation characteristics of high-frequency and low-frequency dielectric responses. The definition of this parameter is given by the following equation:
A 2 = 1 2 · 10 1000 tan δ n f d f 10 1000 tan δ 0 f d f + 1 2 · 0.001 0.1 tan δ n f d f 0.001 0.1 tan δ 0 f d f
Here, tanδn represents the dielectric loss value of the cable aged for n weeks, and tanδ0 represents the dielectric loss value of the unaged cable.
Adapted from the experimental data, the criterion values for different aging periods were calculated, and the results are shown in Table 1. The criterion value A exhibits a monotonic increasing trend with aging time, rising from 9.36 to 69.28 over the 1-week to 7-week period. This demonstrates a strong correlation with the aging time. Even though the results in Table 1 are from a single experiment for each aging time, the duplicated samples show the similar values and quite the same trend.
The prediction error of the model is less than ±5%, indicating that the criterion A2 effectively quantifies the aging degree of the cable insulation. Compared to the single-frequency model, the composite criterion significantly enhances the stability of the evaluation results by integrating information from multiple frequency bands. This makes it particularly suitable for complex scenarios involving non-uniform aging or local defects.

4. Polarization and Depolarization Current Testing

4.1. Polarization and Depolarization Current Tests on Cables

The polarization–depolarization current method is a commonly used technique for assessing the aging state of cable insulation. Under the same DC voltage, the longer the polarization testing time, the more thoroughly the cable insulation material becomes polarized. After applying the DC voltage, the polarization current initially decreases exponentially and then gradually stabilizes. After 20 min of voltage application, the polarization current has essentially stabilized, and the depolarization current also becomes stable after approximately 10 min. The polarization and depolarization currents at 20 min and 40 min are similar, with charge accumulation slowing down after 20 min. Considering the accuracy and convenience of the measurement, a polarization time of 20 min was selected for subsequent cable polarization–depolarization current measurement tests.
To investigate the effect of aging time on the polarization–depolarization characteristics of cable insulation materials, this study conducted current response tests on thermally aged cable samples under multiple voltage levels; 1 kV, 3 kV, and 5 kV DC voltages were applied to XLPE cable samples at different aging periods. Both the polarization and depolarization measurements lasted 20 min. The test results are shown in Figure 9.
As the voltage increases, both the polarization and depolarization current decay rates decrease, and the stable values of the polarization current increase. In the early stages of aging, the cable insulation material exhibits good performance, resulting in relatively small levels of polarization and depolarization currents. Consequently, the stable polarization–depolarization current values for the 1-week-aged cable samples are close to the noise level at all three voltage levels. Despite implementing shielding measures, external environmental and measurement equipment noise still interfered with the actual measurements. This interference is particularly noticeable in the polarization current, while the depolarization current is less affected. In the later stages of aging, significant changes in the polarization and depolarization current characteristics are observed. The polarization current’s decay rate slows significantly, and at 5 kV, it takes around 15 min for the polarization current to stabilize, indicating that the dramatic increase in deep trap density is hindering charge migration. The steady-state value increases, and the difference in steady-state polarization current values becomes more pronounced with higher testing voltages, with a clear discrepancy between high and low voltage steady-state values.
The polarization current is mainly made up of the capacitance current and conduction current. The capacitance current is determined by the capacitance of the cable and the applied voltage. So, the higher the voltage, the higher the polarization current at the beginning of the voltage application. The conduction current takes the dominant part of the polarization current after several tens of seconds, once the capacitance charge on the electrodes of the cable has been fully charged. The thermal aging process can influence both the capacitance current via permittivity and the conduction current.

4.2. Relationship Between Thermal Aging Development and Polarization–Depolarization Current

To determine the influence of aging on the polarization–depolarization currents, Figure 10 compares the PDC test results for cable samples subjected to 5 kV voltage at different aging stages. Under a constant polarization voltage, as the aging degree of the cable samples increases, the measured steady-state polarization current gradually rises. For the 1-week-aged cable samples, the depolarization current decays to the noise level around 300 s, then increases due to external interference. For the 3-week- and 5-week-aged cable samples, the depolarization current stabilizes around 800 s, while for the 7-week-aged cable samples, the depolarization current stabilizes around 1200 s.
As the aging time increases, the peak value of the polarization current increases, showing that the capacitance current increases with the aging time. It corresponds to the increase in relative permittivity as shown in Figure 7. The conduction current at the end of the polarization also increases with the aging time. This is due to the increase in charge density and/or mobility caused by thermal aging. The increase in conduction current also consists with the increased dielectric loss at low frequency.
The conductivity of the cable sample can be calculated using the polarization current value. The average current over the last 100 s of the polarization is taken as the conduction current. The conductivity is then calculated using the following formula:
σ = J E = I U l n r 2 r 1 2 π L 1 + g
where σ represents the conductivity (S·m−1), J is the conductive current density (A·m−2), E is the electric field strength (V·m−1), I is the conductive current (A), U is the applied voltage (V), r is the radius at the middle of the insulation layer (m), r1 represents the radius of the copper core (m), r2 is the radius at the outer surface of the insulation layer (m), L is the length of the outer semi-conductive layer (m), and g is the distance between the copper shielding ring and the outer semi-conducting layer (m).
As shown in Table 2, the calculated conductivity of the aged cable increases with the aging time.
The conductivity measurements at different aging durations reveal a significant increase in the electrical conductivity of aged cables. Notably, the 7-week-aged cable exhibits an order-of-magnitude enhancement in conductivity compared to the 1-week aged specimen. This phenomenon can be attributed to oxidation reactions between the insulation material and atmospheric oxygen during aging, which generate polar molecules and free radicals. These chemical byproducts act as charge carriers to enhance conductivity, thereby compromising the insulation performance of the cable. These results are also consistent with the results of lower-frequency dielectric loss. Both of the results suggest an increase in the conduction current with the thermal aging time. But the increasing rate of conductivity during aging is not the same as the low-frequency dielectric loss. This is because the conductivity obtained from the PDC is a quasi-steady state, while the lower-frequency dielectric loss obtained from FDS is a dynamic result. It is hard to directly compare the results of FDS at 0.001 Hz with the results of PDC at 1000 s.
The conduction current is determined by the charge density, mobility, and electric field. The influence of thermal aging on the conduction current of the cable insulation should relate to the change in charge density and mobility. The charge dissipates in the depolarization process are all accumulated during the polarization process. So, by integrating the depolarization current, the dissipated space charge amount during the depolarization can be obtained. It also reflects the charge accumulation inside the sample during the polarization. The formula for calculating the charge amount is as follows:
Q = 0 t d i d p t d t
In the formula, Q represents the total charge (C), td is the total time during the depolarization phase (s), and idp(t) is the depolarization current (A).
The charge density of the cable refers to the charge per unit volume within the cable, which can be calculated by dividing the total charge of the cable by the volume of the cable’s insulation layer. The specific formula is:
ρ = Q π r 2 2 r 1 2 L
where ρ represents charge density (C·m−3).
Currently, there is no feasible experimental method to directly measure the carrier mobility. As the conductivity and charge density have been obtained with the above method, the apparent charge mobility can be calculated as follows:
μ = σ ρ
where μ represents carrier mobility (m2·(V·s)−1).
In the depolarization test after a 5 kV polarization, the charge amount and carrier mobility of cable samples with different aging times were calculated by integrating the depolarization current, as shown in Table 3. It was observed that both the total charge and the carrier mobility increased as the aging time increased, which is consistent with the changes in conductivity. It should be noted that the charge density and charge mobility did not change linearly with the aging time. At the beginning of the aging, the charge amount and mobility increased sharply in the first 3 weeks, and then increased slightly afterwards. The increase in charge density is mainly due to the degradation of insulation causing a higher charge injection rate at the electrode interface. The increased charge mobility is probably due to the weaker charge blocking ability with more broken bonds.

5. Correlation Analysis of Cable Aging State Parameters

To evaluate and compare the capability of different aging state parameters in characterizing aging time, statistical analysis was conducted by the Pearson correlation coefficient (r) and significance testing. The Pearson correlation coefficient was employed to quantify the linear correlation between two variables, as in:
r = n x i y i x i y i n x i 2 x i 2 · n y i 2 y i 2
The conductivity, charge density (ρ), carrier mobility (μ), total charge (Q), low-frequency integral, high-frequency integral, and aging parameter A of aged cable were analyzed for their correlation with aging time, with a significance level set at α = 0.05. The analysis results are shown in Table 4.
The results indicate that all parameters exhibit strong positive correlations with aging time (r > 0.7), confirming their reliability as indicators for insulation aging characterization. In the FDS test, the high-frequency integral ratio shows a correlation coefficient of r = 0.992 with aging time, demonstrating the sensitivity of high-frequency components to microscopic mechanisms of thermal aging. The low-frequency integral ratio also shows a strong positive correlation (r = 0.990), although its growth rate is slower, reflecting the gradual accumulation of deep polarization effects. The aging parameter A, which integrates both high- and low-frequency features, achieves an enhanced correlation of r = 0.998, outperforming single-frequency-band analyses. The evolution pattern of dielectric spectral integrals during thermal aging has clear physical significance of high-frequency integral domination in early degradation, while low-frequency integrals reflect long-term polarization damage. The proposed parameter A not only enables effective integration of multi-frequency information but also provides a theoretical foundation for rapid insulation assessment in practical application.
In the PDC test, charge amount, charge density, carrier mobility, and conductivity all increase significantly with aging time. Among these, conductivity has the highest correlation coefficient (r = 0.972), indicating its highest sensitivity to aging status. Not only does conductivity exhibit strong correlation, but its value also increases exponentially with aging time, making it a clear differentiator of aging stages and the most effective parameter for evaluating insulation aging status.

6. Conclusions

In this study, thermal aging of XLPE cables is investigated through accelerated aging experiments of varying durations. Samples from different aging cycles are subjected to FDS and PDC tests. The main findings are concluded as follows:
(1)
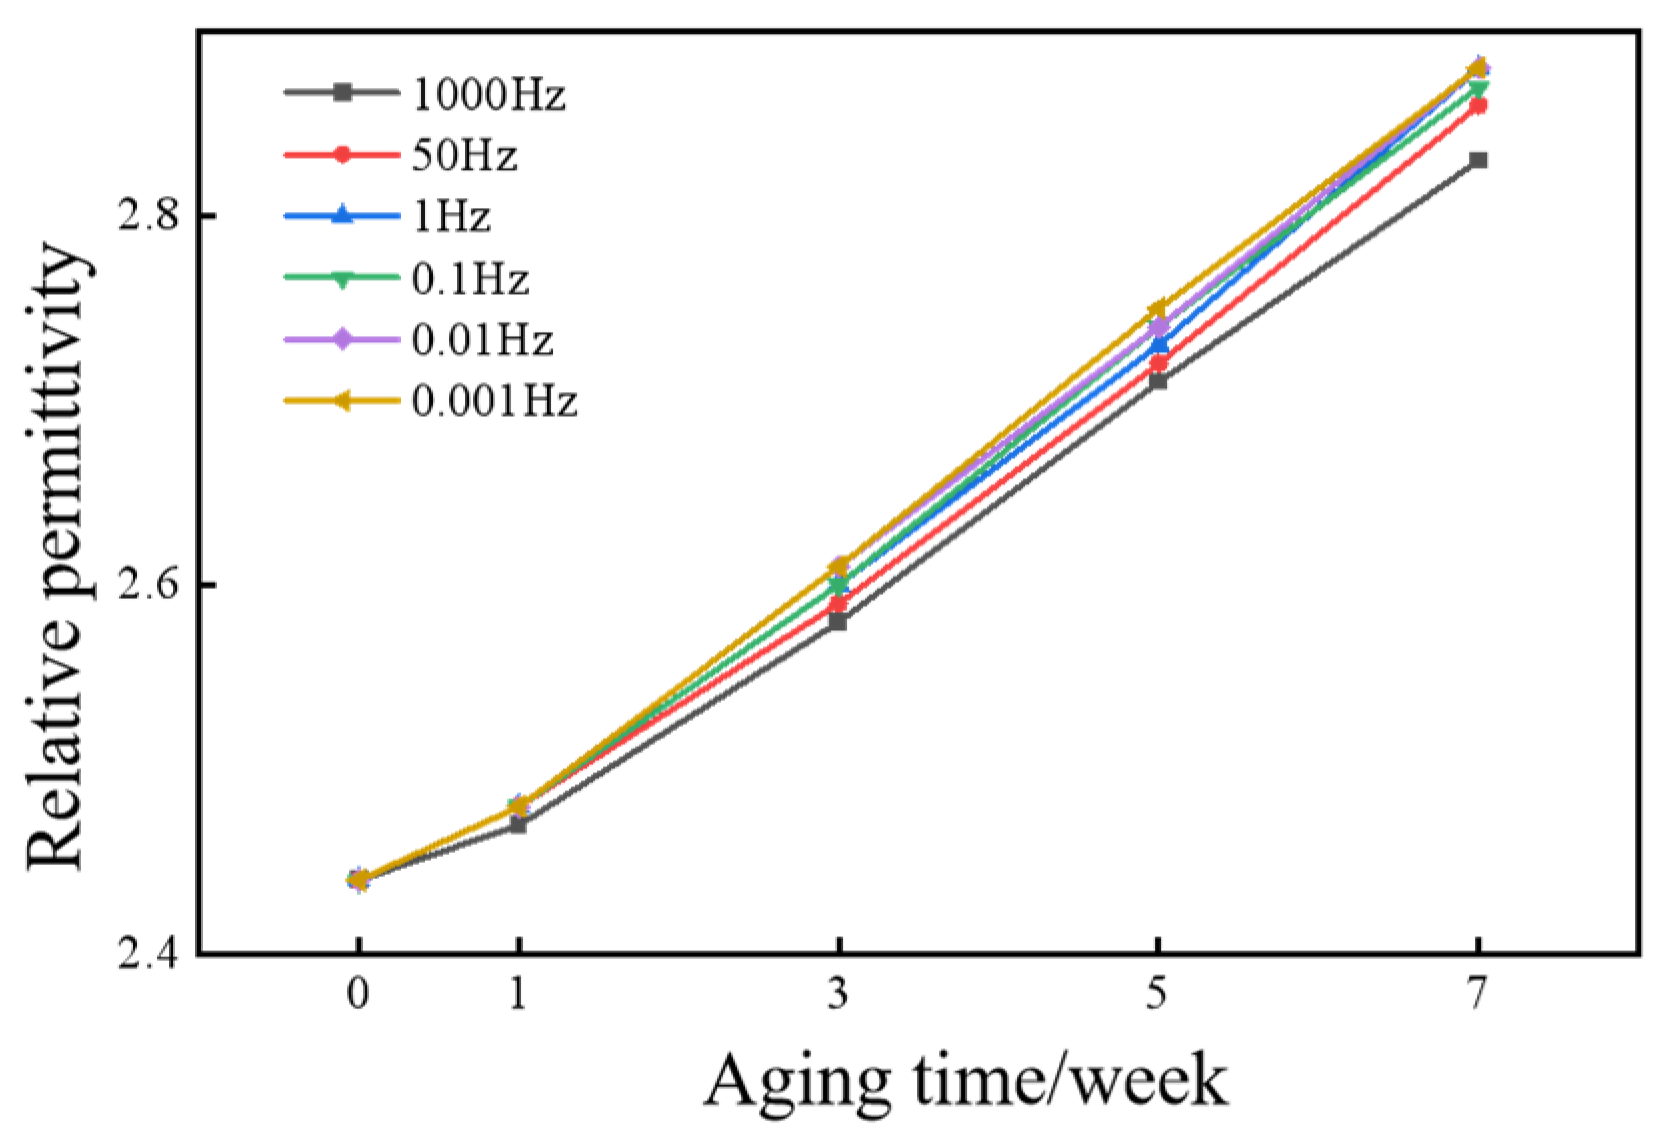
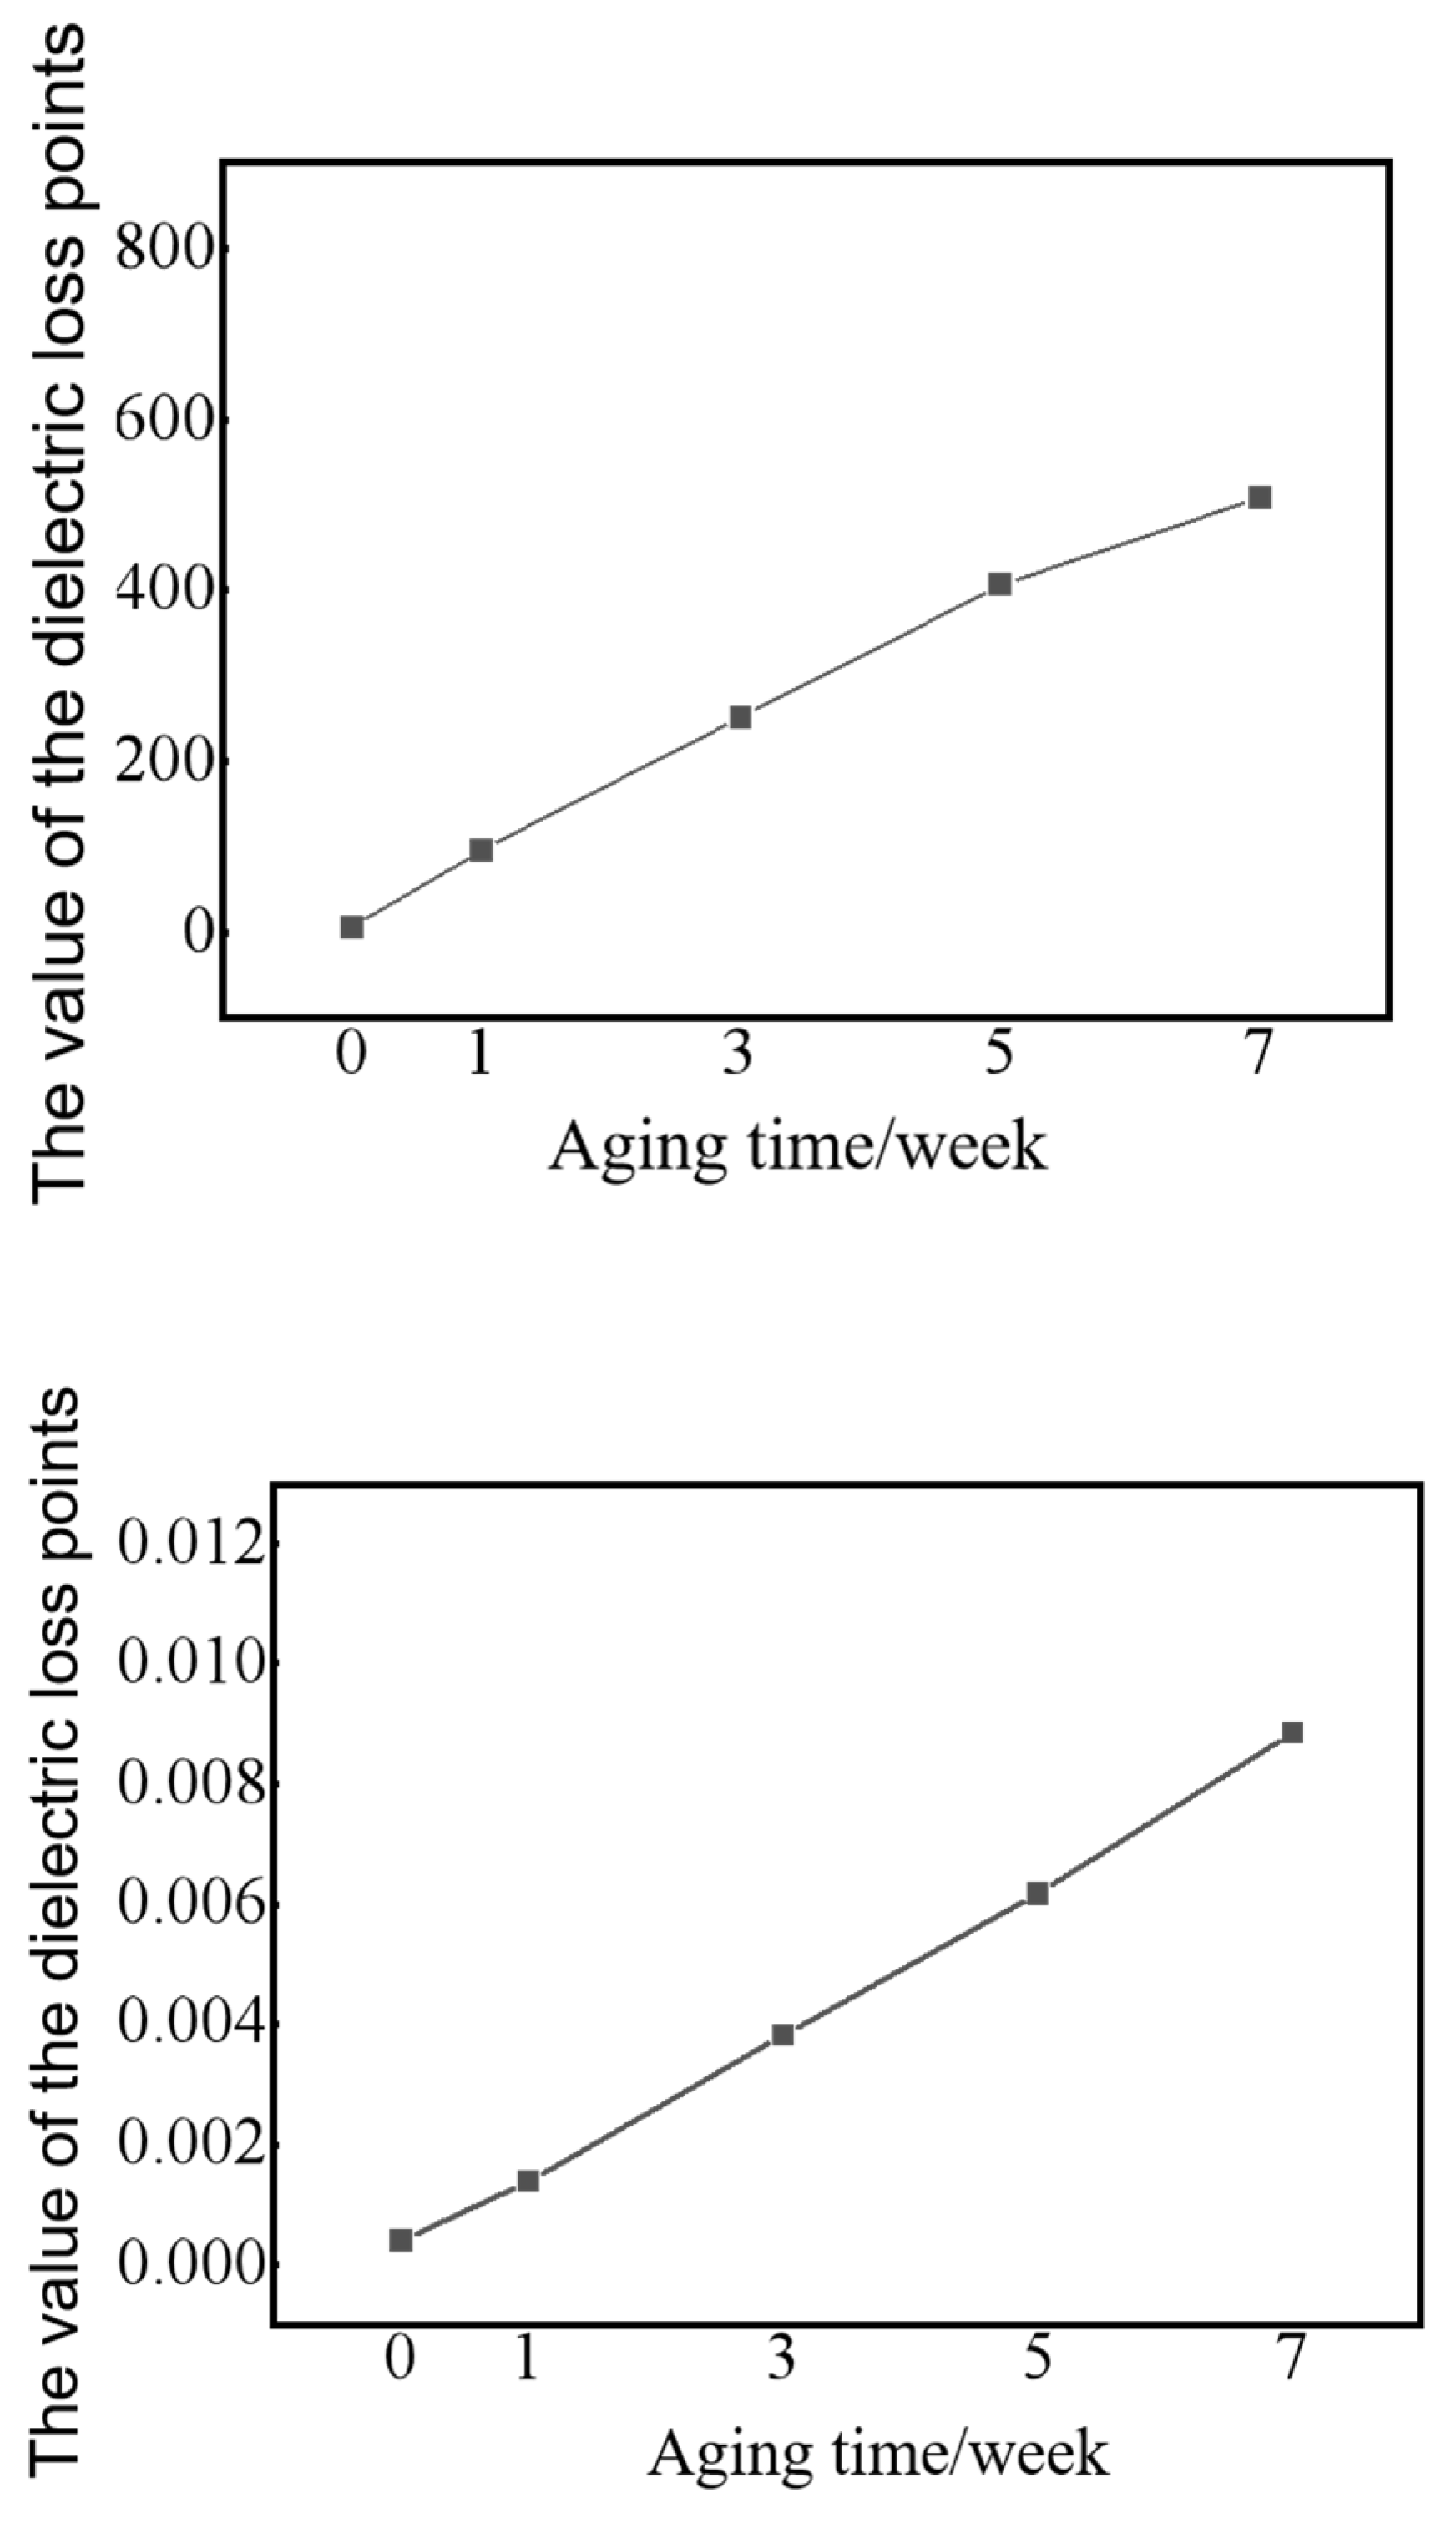
FDS measurement on aged cables reveals a general upward trend in dielectric loss. The low-frequency dielectric loss factor of XLPE increases with aging duration. The lower the frequency, the greater the increment in dielectric loss. The integral of the dielectric loss from FDS measurement also shows a monotonic increase with aging time, indicating that the integral value serves as an effective indicator for XLPE insulation aging state evaluation.
(2)
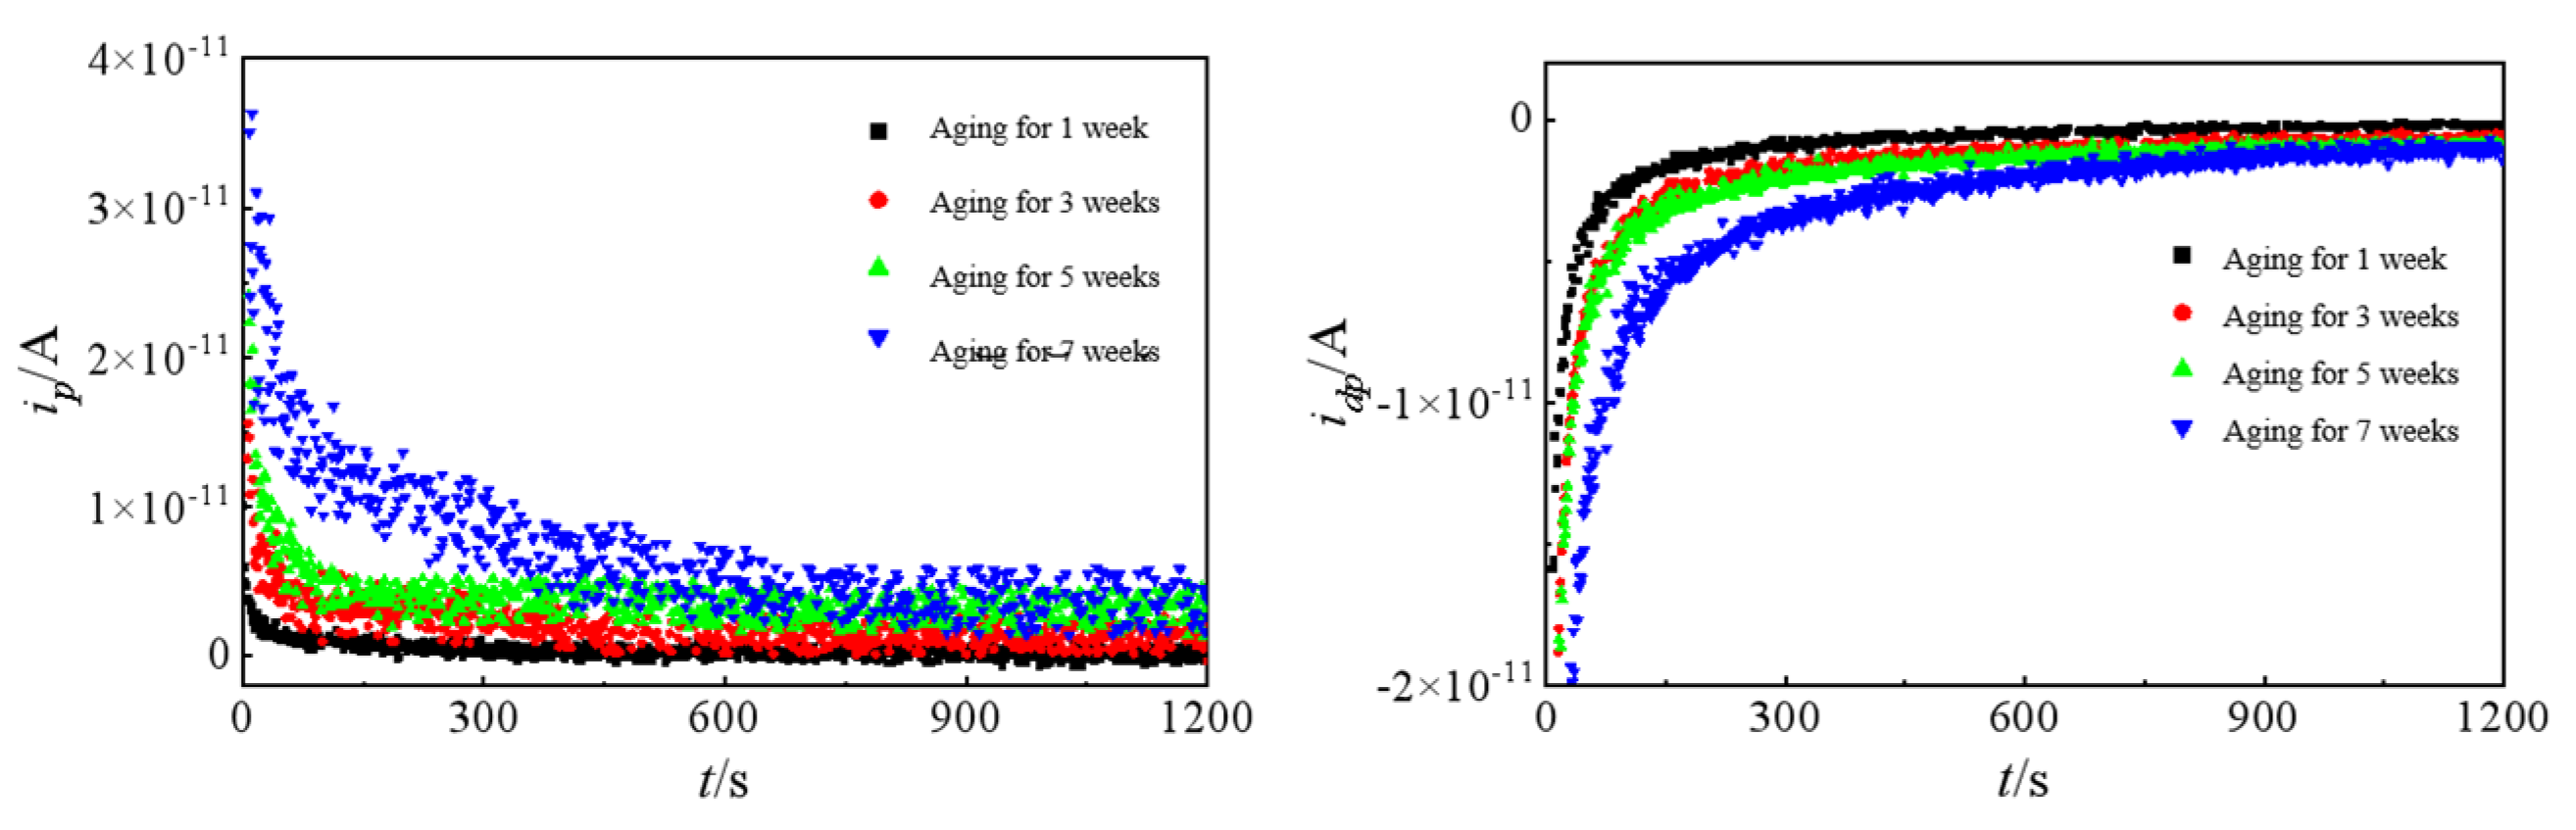
From the PDC tests, it can be seen that the decay rates of the polarization and depolarization currents significantly decrease after aging, while the steady-state values increase. DC conductivity, space charge density, and carrier mobility are calculated and adapted from the measurement results. Both conductivity and carrier mobility increase notably with aging duration, suggesting that these parameters can be used as reliable indicators of cable insulation aging.
(3)
Correlation analysis between aging time and parameters extracted from FDS and PDC tests, including conductivity, charge density (ρ), carrier mobility (μ), charge amount (Q), low-frequency integral, high-frequency integral, and aging parameter (A) shows the strongest correlation between the conductivity and the aging time (r = 0.9, p < 0.05). Outperforming charge density and mobility, the DC conductivity is better suited for aging assessment. In FDS tests, the high-frequency integral exhibits a non-significant correlation with a significance level p > 0.05, whereas the low-frequency integral demonstrates a strong correlation coefficient of 0.99 (p < 0.05), indicating a robust relationship with cable aging degradation. This establishes the low-frequency integral as a reliable metric for characterizing the insulation aging state of cables.

Author Contributions

Conceptualization, Y.S.; Methodology, Y.S. and Z.L. (Ziheng Li); Validation, Y.Z., H.J., J.M. and J.C.; Investigation, Z.L. (Ziheng Li) and K.W.; Data curation, Y.S., J.M. and Z.L. (Ziheng Li); Writing—original draft, Y.S., J.M. and J.C.; Writing—review & editing, Z.L. (Zepeng Lv). All authors have read and agreed to the published version of the manuscript.

Funding

This research was funded by the Science and Technology Project of State Grid Beijing Electric Power Company, titled Research and Application of Cable Insulation Defect Detection and Aging Assessment Technology Based on Frequency Domain Dielectric Spectroscopy (Project Code: 520246230008).

Data Availability Statement

The original contributions presented in the study are included in the article, further inquiries can be directed to the corresponding author.

Conflicts of Interest

Authors Yingqiang Shang, Yang Zhao, Hongquan Ji and Kejia Wang were employed by the company State Grid Beijing Electric Power Co., Ltd. The remaining authors declare that the research was conducted in the absence of any commercial or financial relationships that could be construed as a potential conflict of interest.

References

  1. Du, B.X.; Li, Z.; Yang, Z.; Li, J. Application and research progress of HVDC XLPE cables. High Volt. Eng. 2017, 43, 14–24. [Google Scholar]
  2. Zhou, Y.; Zhao, J.; Liu, R.; Chen, Z.; Zhang, Y.X. Key technical analysis and prospect of high voltage and extra-high voltage power cable. High Volt. Eng. 2014, 40, 2593–2612. [Google Scholar]
  3. Werelius, P. Development and Application of High-Voltage Dielectric Spectroscopy for Diagnosis of Medium-Voltage XLPE Cables; Kungliga Tekniska Hogskolan: Stockholm, Sweden, 2001. [Google Scholar]
  4. Hvidsten, S.; Ildstad, E.; Sletbak, J.; Faremo, H. Understanding water treeing mechanisms in the development of diagnostic test methods. LEEE Trans. Dielectr. Electr. Insul. 2002, 5, 754–760. [Google Scholar] [CrossRef]
  5. He, D.; Gu, J.; Lu, J.; Wang, W. Electrical-thermal ageing test design of 10 kV XLPE cable. Insul. Mater. 2016, 49, 53–58. [Google Scholar]
  6. Xue, C. Research on Assessment Method for Insulation Aging State of XLPE Cables; Tianjin University: Tianjin, China, 2014. [Google Scholar]
  7. Bhumiwat, S.A. On-site non-destructive dielectric response diagnosis of rotating machines. IEEE Trans. Dielectr. Electr. Insul. 2010, 17, 1453. [Google Scholar] [CrossRef]
  8. Abou Dakka, M.; Bulinski, A.; Bamji, S.S. On-site diagnostics of medium-voltage underground cross-linked polyethylene cables. IEEE Electr. Insul. Mag. 2011, 27, 34–44. [Google Scholar] [CrossRef]
  9. Yang, F.; Shen, Y.; Wang, Y.; Zhao, A.; Zhang, X.; Deng, J.; Zhang, G. Thermal Aging Status Diagnosis of XLPE Cable Using Polarization/Depolarization Current Method. High Volt. Eng. 2016, 42, 496–503. [Google Scholar]
  10. Cai, G.; Liu, X.; Pu, J.; Zhou, K.; Huang, M. Insulation diagnosis of water-treed cables based on polarization and depolarization current method. Insul. Mater. 2016, 49, 61–64+71. [Google Scholar]
  11. Lu, C.; Guangmao, L.; Sen, Y. Review of research on frequency domain response method and its application in defect location of power cables. South. Power Syst. Technol. 2023, 17, 53–64. [Google Scholar]
  12. Zhou, K.; Yuan, H.; Li, Y.; Li, M.; Li, Z.; Lin, S. Assessing aging status and type of XLPE cable insulation with a graphic approach based on PDC measurement. IEEE Trans. Power Deliv. 2022, 37, 5114–5123. [Google Scholar] [CrossRef]
  13. GB/T 11026.1-2012; Electrical Insulating Materials—Thermal Endurance—Part 1: Aging Procedures and Evaluation of Test Results. Jointly Issued by the General Administration of Quality Supervision, Inspection and Quarantine of the People’ Republic of China: Beijing, China, 2012.
Figure 1. The cable segment sample with three electrodes used in the measurement.
Energies 18 03169 g001
Figure 2. Schematic diagram of frequency domain dielectric spectrum testing of cable segment samples.
Energies 18 03169 g002
Figure 3. The cable segment sample with different thermal aging times. The cable insulation shows a darker color with longer thermal aging time.
Energies 18 03169 g003
Figure 4. Schematic diagram of polarization depolarization current test for cable segment samples.
Energies 18 03169 g004
Figure 5. The photo of the polarization depolarization current testing platform.
Energies 18 03169 g005
Figure 6. Frequency-domain dielectric spectrum test results of thermally aged cables. The values of dielectric loss increase significantly with the thermal aging time at 0.001 Hz and 1000 Hz.
Energies 18 03169 g006
Figure 7. The changes in relative permittivity of aged cables at different frequencies. The permittivity increases with the thermal aging time, and the permittivity shows an even greater change at lower frequency.
Energies 18 03169 g007
Figure 8. Integrated values of low-frequency dielectric spectra of thermally aged cables in the frequency domain. The integrated values of dielectric losses increase the changing rate of dielectric losses, and become more sensitive with the aging condition.
Energies 18 03169 g008
Figure 9. Polarization-depolarization current measurement results of aged cable samples under different polarization voltages.
Energies 18 03169 g009
Figure 10. Polarization and depolarization currents of different aged cables under the same voltage. Both the polarization and depolarization currents increase with the aging time. The polarization current at the end of measurement time increases with the aging time, and the total dissipated charge amount during the depolarization process increases with the aging time.
Energies 18 03169 g010
Table 1. Integral values of dielectric loss of cable insulation with different aging times.
Aging TimeNo
Aging
1 Week Aging3 Week Aging5 Week Aging7 Week Aging
Low-frequency integration (10−4)3.813.938.161.888.6
High-frequency integration6.45797.28251.96406.25508.87
A219.3624.5239.5951.06
Table 2. Conductivity of cables in different aging states.
Aging Time1 Week3 Weeks5 Weeks7 Weeks
electrical conductivity/×10−17 S·m−11.867.318.8111.9
Table 3. The charge amount, density, and mobility of insulation with different aging times.
Aging Time1 Week3 Weeks5 Weeks7 Weeks
The total amount of charge/C1.5 × 10−92.6 × 10−92.8 × 10−93.3 × 10⁻⁹
Charge density/C·m−38.74 × 10−61.52 × 10−51.63 × 10−51.92 × 10−5
Charge mobility/m2·(V·s)−12.13 × 10−124.81 × 10−125.41 × 10−126.19 × 10⁻¹²
Table 4. Correlation analysis of aging state parameters.
Pearson Correlation Coefficient (r)p
Electrical conductivity σ0.9720.0281
Charge density ρ0.7500.0250
Carrier mobility μ0.8030.0197
The total amount of charge Q0.9520.0479
Low-frequency integration0.9900.0157
High-frequency integration0.9920.1255
Aging parameter A0.9980.0438
Disclaimer/Publisher’s Note: The statements, opinions and data contained in all publications are solely those of the individual author(s) and contributor(s) and not of MDPI and/or the editor(s). MDPI and/or the editor(s) disclaim responsibility for any injury to people or property resulting from any ideas, methods, instructions or products referred to in the content.

