Article

Study on the Impact of Large-Scale Photovoltaic Systems on Key Surface Parameters in Desert Area Regions of Xinjiang, China

School of New Energy and Power Engineering, Lanzhou Jiaotong University, Lanzhou 730070, China
*
Author to whom correspondence should be addressed.
Energies 2025, 18(12), 3170; https://doi.org/10.3390/en18123170
Submission received: 9 May 2025 / Revised: 29 May 2025 / Accepted: 10 June 2025 / Published: 17 June 2025
(This article belongs to the Section A2: Solar Energy and Photovoltaic Systems)

Abstract

:
This study evaluated the effects of photovoltaic (PV) arrays on critical surface parameters through analysis of observational data collected from a utility-scale PV power station located in Wujiaqu City, Xinjiang, in 2021. The results reveal that: (1) Installation of PV panels reduces surface albedo, which is significantly altered by dust storm conditions; (2) the installation of PV arrays increases the aerodynamic and thermal roughness length by increasing the frictional velocity across the mixed underlying surface; (3) the overall transport coefficients within the PV plant are higher than that of the reference site, with greater diurnal variation than nocturnal variation. The overall transport coefficient is highest in the unstable stratification conditions and lowest under stable stratification conditions; and (4) soil thermal property parameters exhibit seasonal variations. Significant changes in thermal conductivity and specific heat capacity were observed during spring thaw, high and fluctuating diffusivity in summer, and low and stable values in winter. The findings demonstrate that installing PV arrays in arid regions modifies surface energy balance and heat transfer characteristics. This provides a basis for optimizing PV station layouts and conducting climate impact assessments.

1. Introduction

To address the increasingly severe environmental challenges, coordinated and effective global action is crucial to curb greenhouse gas (GHG) emissions; otherwise, irreversible and catastrophic climate change impacts will occur [1,2,3]. Therefore, as the world’s largest energy consumer, China must take the lead in promoting the use of renewable energy and optimizing its energy structure [4,5]. By the end of 2024, China’s installed renewable energy capacity had attained 1.889 GW, constituting approximately 35 % of the aggregate power generation [6]. The large-scale installation of solar PV panels has direct benefits on local and possibly regional climate in addition to its indirect climate effect by reducing GHG [7,8]. With the advancement in technology, solar energy technology can be applied in many fields, and the conversion efficiency of PV panels is constantly improving, which not only helps to reduce the dependence on non-renewable energy sources, but also effectively reduces carbon emissions and promotes the realization of the goal of sustainable development [9,10,11].
Land surface processes are of pivotal significance in regards to the climate system of Earth, as they encompass a wide array of physical, biological, and chemical processes related to the exchange of heat, momentum, and moisture between land and the atmosphere [12]. The study of land–atmosphere interaction parameters date back to the mid-20th century [13]. Early scholars proposed the initial theoretical framework for turbulent exchange between the land surface and the atmosphere [14]. This achievement provides a significant scientific foundation for understanding how turbulence transmits heat and momentum at the land–atmosphere interface. Its widespread application in regional surface flux inversion, chemical transport models, and ecosystem models is also worthy of note [15,16,17]. These pioneering studies have laid the foundation for the subsequent development of parametric procedures for land–atmosphere interactions.
In recent years, there has been growing concern about the radiative impacts of large-scale PV deployment. Related studies have primarily focused on changes in surface albedo, local surface radiation, and air temperature within PV facility areas [18,19,20]. As demonstrated by Xu et al. [21], installing PV panels reduces reflected radiation, thereby lowering surface temperatures. In high-altitude regions, surface albedo exhibits a ‘U’-shaped pattern from spring to autumn and an inverted ‘V’-shaped pattern in winter [22]; in arid regions, there is a significant correlation between precipitation and albedo, with more pronounced seasonal variations in summer [23]. It is worth noting that the manufacturing process of PV panels is critical to their ability to absorb specific wavelengths of solar radiation, and there are differences in their radiation absorption capacity under different weather conditions, which directly affects PV conversion efficiency [24,25,26], In numerical simulations, Beljaars et al. [27] note that z 0 m and z 0 h are different and that the physical mechanisms of momentum transfer and heat exchange should be addressed independently. Research has demonstrated that an increase in roughness results in enhanced turbulence, leading to accelerated heat loss from the soil surface, a reduction in surface temperatures, and a decrease in soil thermal diffusion rates [28,29]. These phenomena not only affect the surface energy balance but also influence the heat transfer process within the soil. Therefore, it is of great significance to conduct an in-depth study on the effects of PV power plant installation on changes in soil thermodynamic parameters [30,31].
Due to limited observational data, most studies have focused on the effects of PV power plants on temperature and radiation balance. However, systematic comparisons of the differences in environmental parameters inside and outside PV farms in desert regions are still scarce. Existing studies mainly focus on a specific parameter (e.g., surface albedo, or sensible heat flux) and its dynamics at different time scales (e.g., hourly, daily, and seasonal), while less attention is paid to the changes in other surface parameters induced by the installation of PV panels and their potential modulation of the energy distribution pattern. Thus, determining the key parameters of surface processes in the subsurface soil layers of PV power plants in desert regions, understanding the land–atmosphere interaction processes, and revealing the structure of the atmospheric boundary layer to enhance numerical simulation capabilities are of great scientific significance and practical value [32]. Therefore, the research objective of this paper is to analyze the changes in land surface characteristic parameters using the measured data from a PV power plant in Wujiaqu, Xinjiang.

2. Observation Experiment, Study Design, and Methods

2.1. Site Characteristics

The present study utilized meteorological and eddy covariance data collected from utility-scale PV plants in the Wujiaqu (44.4 °N, 87.65 °E, WJQ) Gobi area, situated within the Xinjiang Uygur Autonomous Region (Figure 1). The PV plant covers an area of about 1.15 km2 and has an installed capacity of about 70 MW. The left side of the figure shows the observation site within the PV plant, and the right side shows the reference site, which is 910 m away from the PV plant. The subsurface of both sites is Gobi desert with sparse vegetation and the soil type is sandy.

2.2. Study Design

As shown in Figure 2, the PV observing system mainly targets the mean field, radiative flux, and turbulence field to obtain relevant environmental parameters. The sensors for measuring wind, temperature, and humidity are located at a height of 2 m, 4 m, and 10 m above the PV plant and the reference point, respectively. Two layers of radiation instruments were installed at 1.5 m and 10 m. The tilt angle of the PV panel is 37° and the field of view of the radiometer downward sensor is 150°, so the 10 m height observation results can better characterize the radiation balance of the underground of PV integration, while the 1.5 m height observation data mainly reflect the radiation balance of the internal surface of the PV field. Radiation data were collected at a frequency of 10 min and the EC system bandwidth frequency was 10 Hz. The instrument types and main technical parameters used in the PV power plant and reference field observation program are shown in Table 1. For more details about the observation system, refer to the paper by Jiang and others [33].

2.3. Method

2.3.1. Surface Albedo

Considering the duration of field observations and the continuity of data, this paper selects the four components of radiation at 10 m height from observation points inside and outside the PV power station for the year 2021 to analyze the characteristics of surface albedo. These components include total downward solar radiation ( D S R ), reflected shortwave radiation ( U S R ), atmospheric counter radiation ( D L R ), and surface long-wave radiation ( U L R ). The selected period has no missing data, ensuring good data quality. Net radiation and surface albedo are calculated from the observational data using Equations (1) and (2), respectively.
R n = D S R U S R + D L R U L R
α = U S R / D S R
where R n refers to the net radiation (W·m−2), and α stands for the surface albedo (W·m−2).

2.3.2. Surface Roughness

Using the Monin–Obukhov similarity theory [34], the profile functions of wind speed and atmospheric temperature in the surface layer can be expressed as:
ln z d z 0 m = k U u * + ψ m ζ
ln z d z 0 h = k ( T T 0 ) T * + ψ n ( ζ )
z 0 m represents the aerodynamic roughness length (m); z 0 h denotes the thermal roughness length (m); k is the von Kármán constant, which has a value of 0.4; z represents the installation height of the observation instruments (m), which is 5.5 m within the PV power station and 3 m at the reference site; U denotes the horizontal wind speed at the observation height (m/s); u * is the friction velocity (m/s); T represents the air temperature at height z (K); T 0 denotes the surface temperature (K); T * is the characteristic temperature (K); and d is the zero-plane displacement, which is taken as two-thirds of the PV array height, and d = 1.53   m .
k U = u * ln z 0 m z d
k T T 0 = T * ln z 0 h z d

2.3.3. Overall Transfer Coefficient

In the surface layer, the calculation formula for the overall flux transfer coefficient is as follows [35,36]:
C d = τ ρ U 2 C h = H ρ c p U T s T a
C d , C h represent the overall transfer coefficients for momentum and sensible heat; τ , H denote the momentum flux (kg·m−1·s−2) and sensible heat flux in the surface layer (W·m−2), respectively; U , T a are the horizontal wind speed and temperature at the reference height. T s represent the surface temperature, ρ represents the air density (kg·m−3).
At present, there are about ten kinds of classification methods for atmospheric stability [37]. In this paper, the Monin–Obukhov atmospheric stability parameters calculated directly from the observations of the flux observation system are used.
ζ = ( z d ) / L
The length scale parameters L are calculated as follows [38]:
L = u * 3 T ¯ k g w T ¯
T ¯ indicates the absolute mean temperature (K), T is the temperature pulsation (K), T = T T ¯ . w is the vertical wind speed component (m/s).

2.3.4. Soil Thermal Properties

The thermal conductivity of soil is defined as the amount of heat transferred through a unit area of soil per unit time under a unit temperature gradient [39].
λ = G T z
λ represents the thermal conductivity of soil (W·m−1·K−1); G denotes the soil heat flux (W·m−2); T / z is the soil temperature gradient. Assuming there are no other heat sources or sinks within the soil and only considering vertical energy exchanges, the heat conduction process in the soil can be expressed according to the second law of thermodynamics as follows [40]:
C g T t = G z
T t = k 2 T z 2
k represents the thermal diffusivity (m2·s−1), k = λ / C g . The calculation of soil thermodynamic parameters is an exacting process, and it is important to note that different methods will produce certain differences [41,42]. The heat conduction–convection method can theoretically fit the heat transfer process in the soil more accurately [43]. This paper adopts the convection method to calculate the soil thermal diffusivity. The soil heat conduction equation is solved using periodic upper boundary conditions at depth z 0 .
T ( z 0 , t ) = T ¯ ( z 0 ) + A sin ( ω t + φ ) , ( t 0 )
A = T max T min 2
T ¯ is the daily average soil temperature at depth z 0 , A is the amplitude of the daily change in soil temperature at depth z 0 , φ is the initial temperature phase at depth z 0 , ω is the rotational angular velocity of the earths, ω = 2 π / P (rad/s), and P is the daily cycle of soil temperature at depth z 0 .
Gao et al. [44] coupled the thermal convection effect in soil and provided an improved soil heat conduction equation. Applying the upper boundary conditions from Equation (13), an analytical solution for Equation (14) and a formula for calculating the soil thermal diffusivity can be derived:
T ( z , t ) = T ¯ ( z ) + A exp ( M z ) × sin ( ω t + φ N z )
k = ( z 1 z 2 ) 2 ω ln ( A 1 / A 2 ) ( φ 1 φ 2 ) ( φ 2 φ 1 ) 2 + ln 2 ( A 1 / A 2 )
A 1 , A 2 , φ 1 , φ 2 represent the temperature amplitudes at depths z 1 and z 2 , and the temperature phases at depths z 1 and z 2 , respectively.

3. Results and Discussion

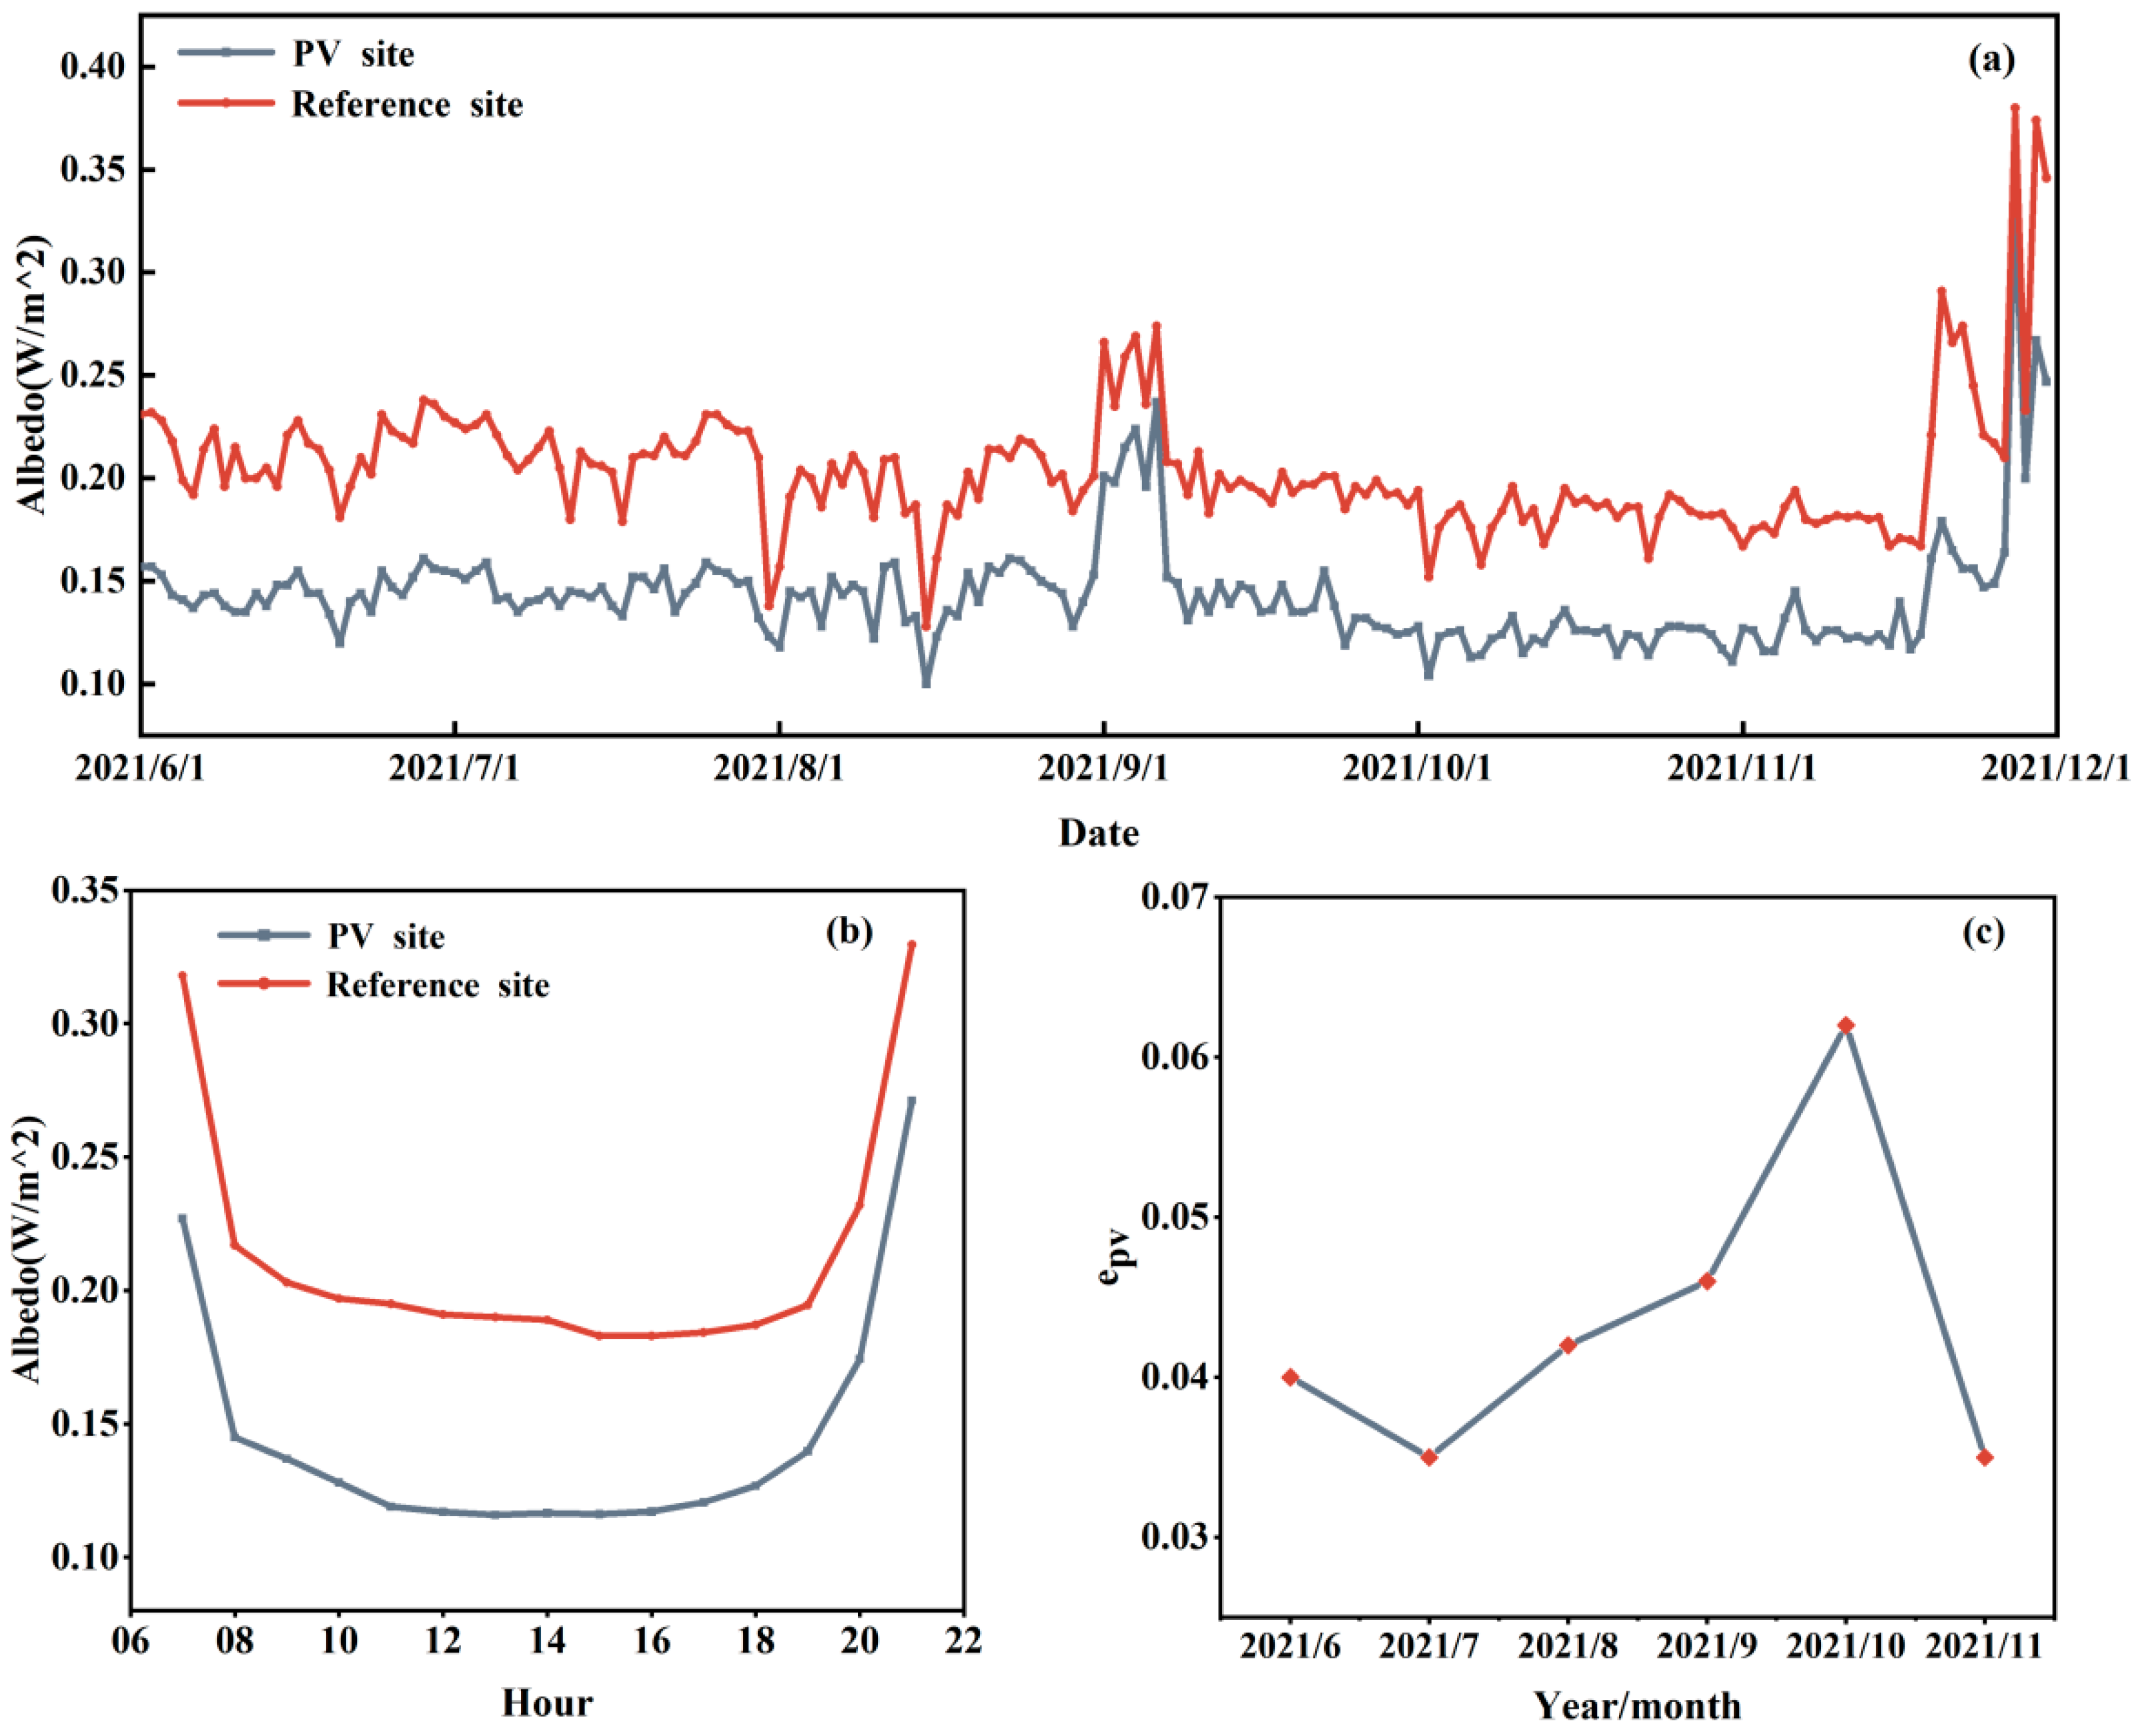
3.1. Characteristics of Surface Albedo Variation

To circumvent any potential influences on reflected radiation and surface upward long-wave radiation, the data collected at a height of 10m serve as the primary metric for adequately characterizing the radiation balance of the PV synthetic subsurface. Using radiation observation data from two observation towers located inside and outside a PV power station, we analyzed surface albedo for the period from June to December 2021, focusing on data from 8:00 to 20:00 daily. The variation trends of surface albedo inside and outside the PV power station are shown in Figure 3a. The surface albedo within the PV power station ranges from 0.1 to 0.334, while the reference station shows a range of 0.128~0.38. During the transition from autumn to winter, higher surface albedo values are observed. The diurnal variation of surface albedo during summer at both sites (Figure 3b) shows a “U-shaped” pattern, with higher values in the morning and evening and lower values at midday, consistent with the findings of Heusinger et al. [45]. In terms of numerical values, the diurnal range of surface albedo within the PV power station is 0.116~0.271, with a daily difference of 0.155. For the reference station, the range is 0.183~0.329, with a daily difference of 0.146. The diurnal difference in surface albedo at the PV power station is significantly greater than that at the reference station. The construction and operation of the PV power station significantly reduce surface albedo, mainly due to the formation of shaded areas by the PV arrays and the absorption of solar radiation by the PV modules, which lowers the surface albedo in the corresponding areas. Figure 3c shows the trend of the conversion rate e p v as a part of the calculation of the total daily power generation PE as a fraction of the total solar radiation DSR within the PV plant ( P E / D S R ). The lower albedo of the PV panels usually leads to an increase in the absorbed shortwave radiation, while the PV panels convert a small portion of the absorbed shortwave radiation into electricity. It can be seen that during the summer period, the PV panels receive more solar radiation, but the high temperature of the PV panels reduces the conversion rate, which is basically lower than 0.05 during the hotter seasons. In the fall, the PV panels have the highest PV conversion rate, which is above 0.05. This seasonal variation in conversion rate is mainly due to the high temperature of the PV panels, which reduces the conversion rate. This seasonal variation in conversion rate is mainly determined by the amount of solar radiation received by the PV panel and the temperature of the PV panel.
Considering the variability of summer weather, we selected six weather conditions (Table 2) to analyze the surface albedo variation characteristics of PV plants. The albedo of the PV panels remains relatively constant under both sunny and cloudy weather conditions (Figure 4), mainly because the PV panels are designed to maximize the absorption of solar radiation rather than reflection. Rainfall has been shown to wet the surface of PV panels, which can slightly increase their albedo. However, this is still lower than the value in the natural surface state. Rainfall also helps to clean the surface of the PV panels of dust and contaminants. During dust storms, there is an increase in suspended particles in the air, leading to a decrease in atmospheric transparency. This reduces the total amount of solar radiation reaching the ground and the PV panels, reducing the amount of energy that the panels can capture. The albedo of the PV panels increases and more solar radiation is reflected rather than absorbed for conversion into electrical energy, reducing the effectiveness of the PV system.

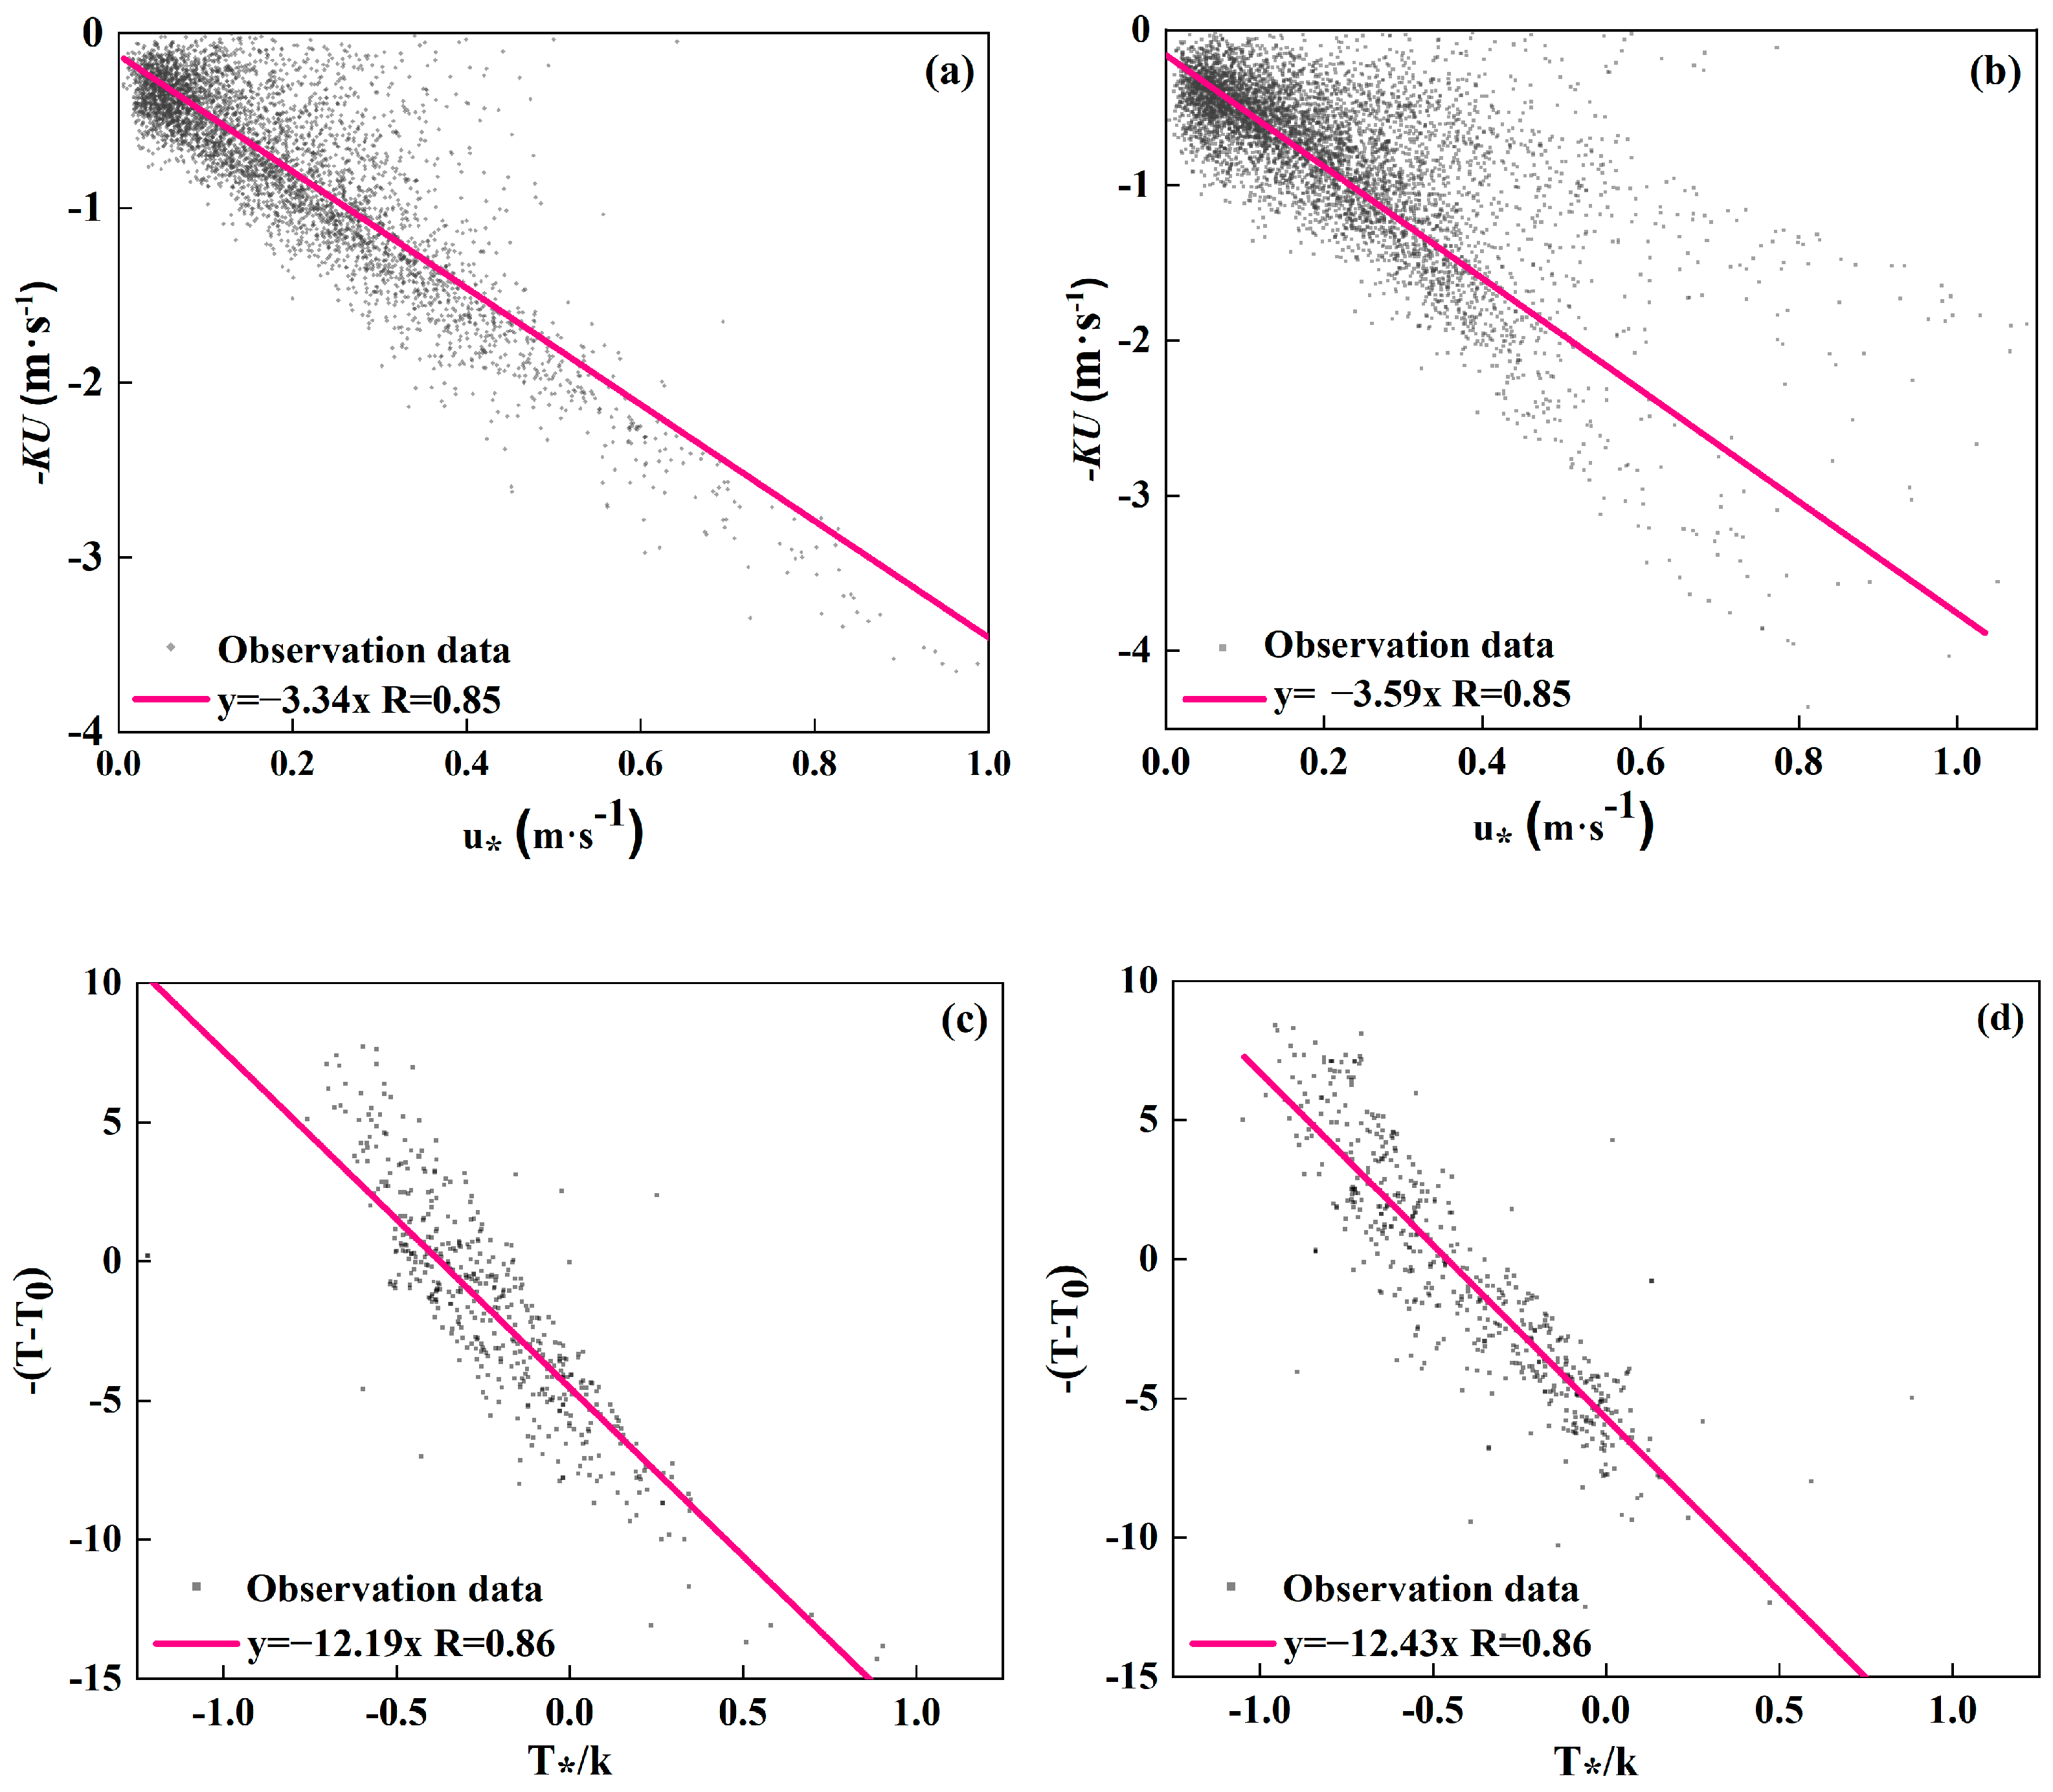
3.2. Characteristics of Surface Roughness Variation

Friction velocity represents the velocity scale of turbulent motion and is used to assess the interactions between near-surface airflow and underlying roughness elements. It reflects the capacity for diffusion and transport in all spatial directions. The daily trends of the friction velocity at the PV plant and the reference site are generally consistent (Figure 5a), reaching a maximum in the late afternoon as time progresses, and the difference between the two gradually increases. The difference can be up to 0.0346. The top edge of the PV panels is about 2.5 m above the ground and is placed in a south-facing direction, creating a blockage in the north–south airflow channel and obstructing the airflow in the north–south direction. During the daytime, there was a significant decrease in wind speed at the 2 m height, with reductions ranging from 0.081 to 0.795 m/s. The trend of wind speed change at 10 m height is basically the same as that at 2 m. The difference between the two reaches its maximum at 8:00 a.m., when the wind speed can be reduced by 0.56 m/s. Due to the blocking effect of the PV panels on the airflow at a height of 2 m, the air that was originally flowing in the north–south direction was forced to turn and disperse to the east and west, respectively. The frequency of southeasterly winds increased, while the frequency and intensity of northwesterly winds decreased significantly. The frequency of easterly and westerly winds decreased, but wind speeds did not change much (Figure 5c).
The surface roughness calculated from eddy covariance observations during the summer of 2021 for both within the PV power station and at the reference site is shown in Figure 6. The dynamic roughness length z 0 m and thermal roughness length z 0 h of the surface beneath the PV array are denoted as 0.1407 m and 2.017 × 10⁻⁵ m, and the reference stations were 0.0406 m and 0.588 × 10⁻⁵ m, respectively. Significantly larger than the roughness of the natural Gobi subsurface studied by previous researchers, the kinetic roughness of the Black Gobi subsurface in Dongjiang is 1.13 × 10⁻³ m [46], the Gobi subsurface in Dunhuang is 1.9 × 10⁻³ m [47], and the average value of the Yarlung Zangbo Jiangshannan region is 0.6 × 10⁻³ m [48]. The erection of PV arrays makes the kinetic roughness of the mixed subsurface consisting of the PV plant and the Gobi larger.

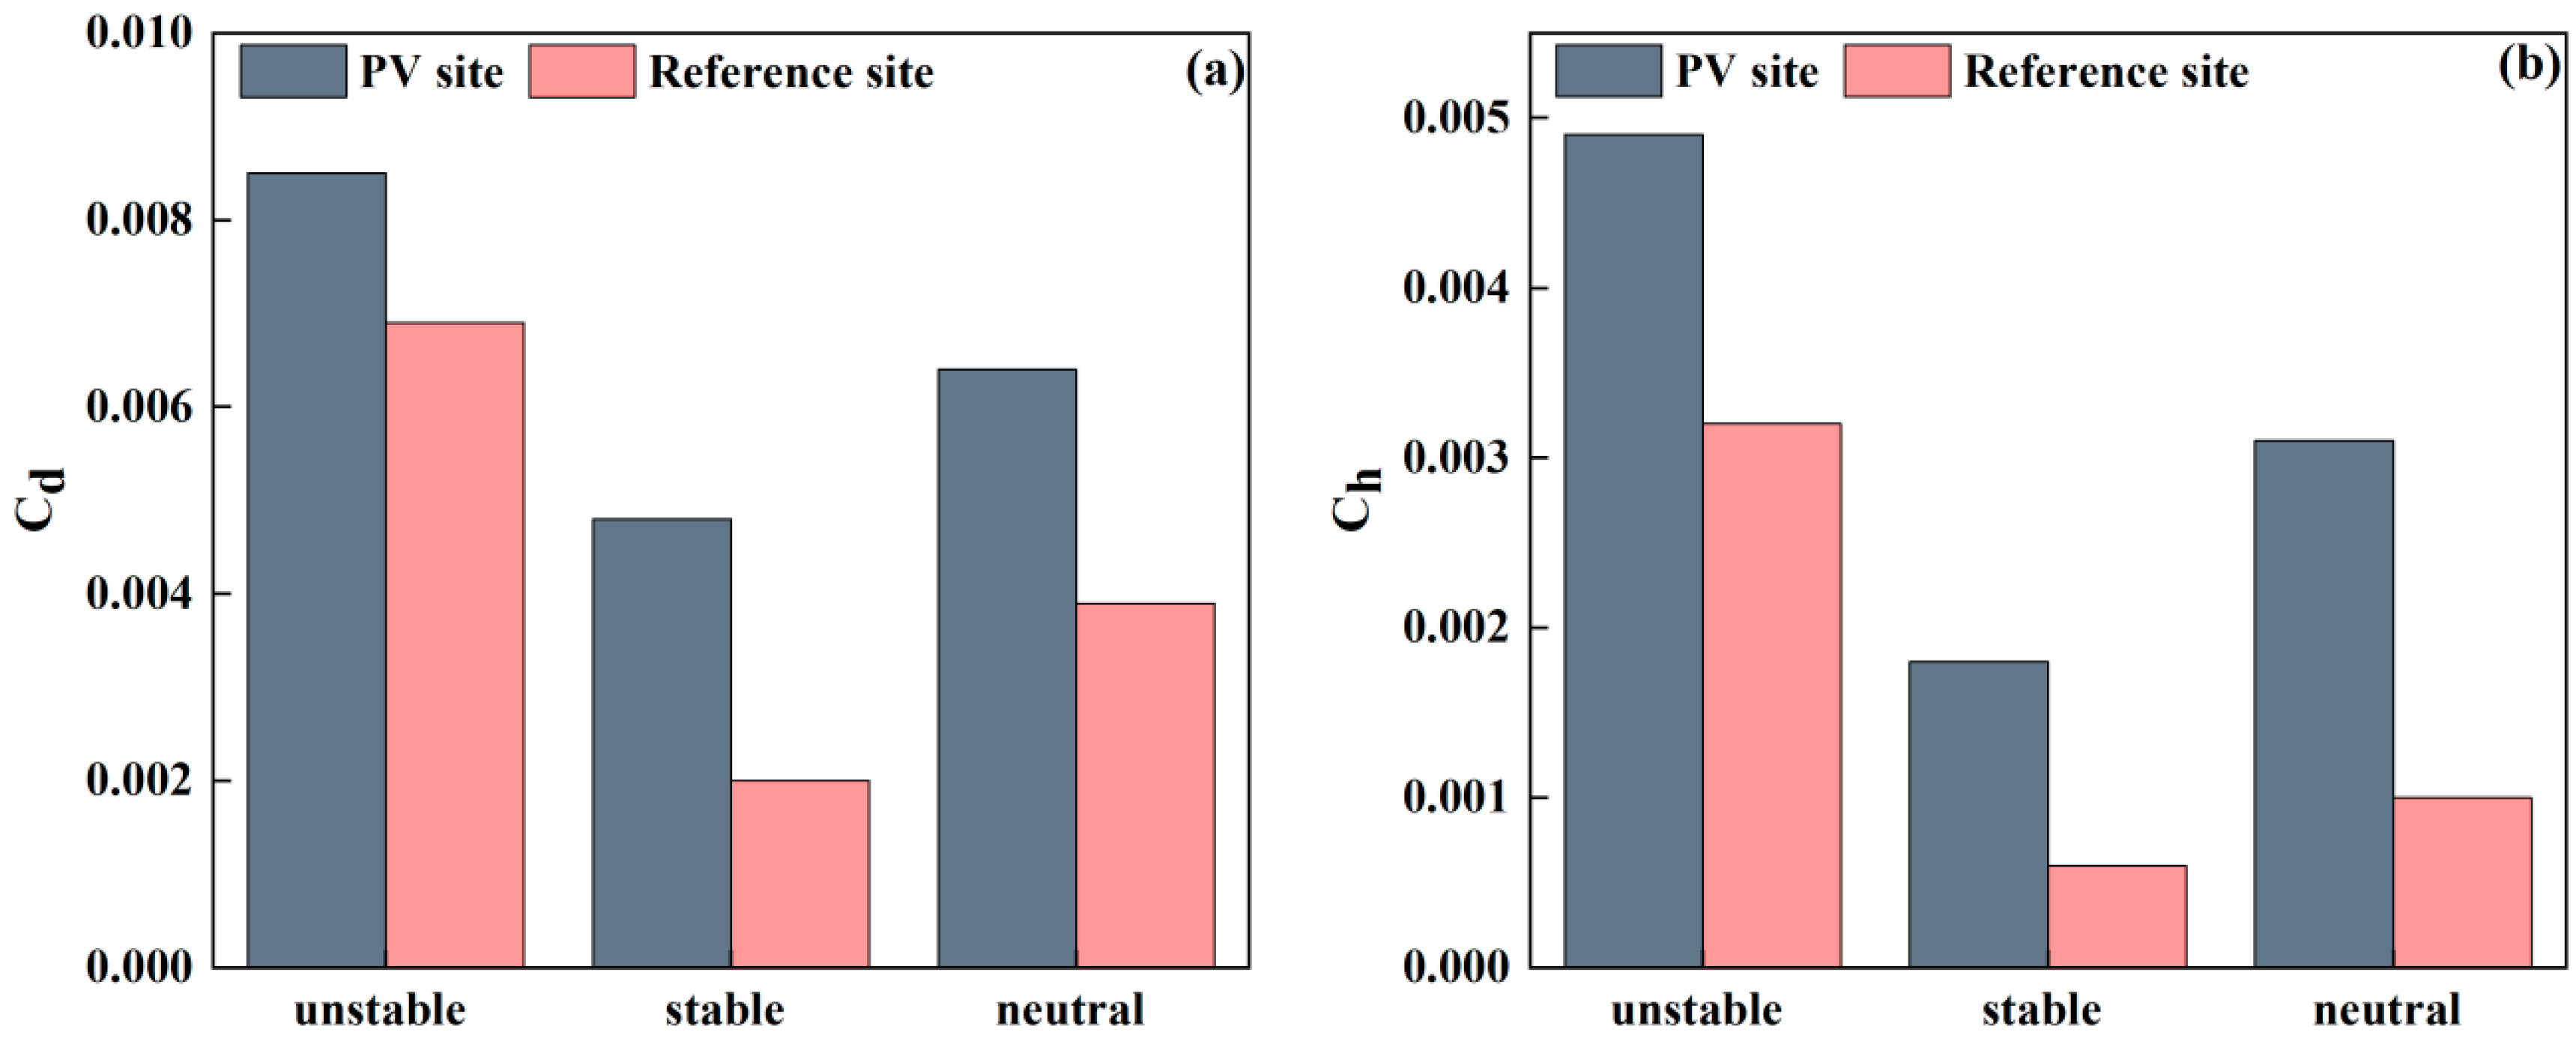
3.3. Characteristics of Overall Transfer Coefficient

In summer, the value of C d within the PV power station is significantly higher than that in the reference area, indicating stronger momentum transfer within the station. This can be attributed to the PV panels altering the surface roughness and turbulence structure. The presence of the panels increases the surface roughness coefficient while enhancing wind shear and boundary layer turbulence characteristics due to shading effects. Around midday, as solar radiation intensifies, the value of the PV power station rises sharply. After 18:00, it gradually decreases but remains higher than that at the reference site, likely due to the release of heat stored during the day. The variation in C h follows a similar pattern to C d but with slightly smaller fluctuations. The absorption of radiant heat by the PV panels increases the surface temperature gradient, thereby enhancing the transfer of sensible heat flux. In contrast, the reference site, being a natural environment, exhibits weaker heat transfer. For comparison, the average summer C h value in Dunhuang is 0.0023 [49], while in the Taklamakan Desert in August, it is 0.0022 [50]. Within the PV power station, the average C h value is 0.0049, which is significantly higher than those observed for typical Gobi Desert surfaces (Figure 7).
The overall transport coefficient is related to atmospheric stability, and we further explore the average overall transport coefficient under different stability conditions. In unstable stratification conditions, turbulent transport within the PV plant is strong, with momentum transport coefficients of 0.0085 and sensible heat transport coefficients of 0.0049; the reference site has coefficients of 0.0069 and 0.0032, respectively. In stable stratification conditions, turbulent transport is suppressed, and the momentum and sensible heat transport coefficients are significantly reduced to 0.0048 and 0.0018, respectively. The transport parameters for conditions of neutral stratification are intermediate between those for stable and unstable stratification. The overall transmission coefficient of momentum and of heat-sensing flux of the PV power station is greater than that of the reference station, indicating that the dynamic and thermal effects of the PV power station are stronger than those of the reference station after the layout of the PV panel (Figure 8).

3.4. Characterization of Soil Thermal Properties Variation

The annual variation in soil temperature and water content within the PV power plant was studied. As shown in Figure 9, the study was carried out on shallow soil (5–20 cm) within the PV plant. The results reveal distinct seasonal variation characteristics within the PV power station. Overall, values are lower during the dry season and higher during the wet season. During the transition from winter to spring, the surface’s ability to absorb solar radiation increases, and the thawing of frozen soil layers causes a rapid rise in soil moisture. Correspondingly, soil parameters exhibit similar trends, with maximum thermal conductivity and heat capacity reaching 1.28 W·m−1·K−1 and 4.85 MJ·m−3·K−1, respectively. According to Wang Yu et al. [51], the average thermal conductivity of 5 cm and 10 cm soil layers calculated from soil heat flux is 0.77 W·m−1·K−1 and 0.90 W·m−1·K−1, respectively. The installation of PV panels has significantly increased soil thermal conductivity. During summer, the values are relatively higher and more variable, likely due to increased rainfall during this season. The PV panels retain rainwater, facilitating greater infiltration into the soil, which enhances soil moisture content and, subsequently, soil thermal diffusivity. After each rainfall, as moisture in the topsoil evaporates, soil moisture content decreases, leading to corresponding declines in related parameters. In autumn, the average soil thermal conductivity increased by 0.05 W·m−1·K−1 compared to the same period in 2019 [31]. Over the course of the year, the average soil thermal diffusivity is 3.4 × 10⁻⁷ m2·s−1, which differs from the natural Gobi regions without PV installations (Table 3). The primary reason for this discrepancy is that the PV11 panels block part of the sunlight, reducing surface temperature and evaporation from the soil. This results in higher soil moisture content, which, in turn, influences the thermal properties of the soil.
Soil thermal properties are closely related to soil moisture content. Soil thermal parameters outside the station were not analyzed because the pond had a large effect on the soil moisture content outside the station. In order to study the effect of the PV station on soil thermal diffusivity, soil data from observation stations with the same subsurface conditions were selected for analysis. We believe that this alternative helps to enhance the relative understanding of soil moisture dynamics under PV systems and informs site selection for similar studies in the future. Obviously, the k value increases rapidly in the wet season and decreases slowly in the dry season, because the soil water content increases rapidly during rainfall, and the soil water content decreases slowly through evaporation in the later stage of rainfall. Soil heat diffusivity in the area of the PV plant was higher than that of the reference site in most months, especially during the spring and summer periods. Under cold winter conditions, PV panels block some of the solar radiation, resulting in lower surface temperatures, which affects the thermal diffusion properties of the soil. The PV panels have a cooling effect on the soil during the daytime and an insulating effect at night, which reduces the magnitude of the daily change in soil temperature [56]. The difference with the soil thermal diffusivity at the reference point arises from the shading effect of the PV panels, which makes the soil temperature change in the PV power plant smaller, and the soil thermal diffusivity increase (Figure 10).

4. Discussion

By comparing the observational data from the PV power station in Wujiaqu City, Xinjiang, in 2021 with those from the reference site, this study analyzes the impact of PV module installation on key surface parameters. Due to the high solar radiation absorption rate of PV module materials, their installation reduces surface albedo, resulting in more solar radiation being absorbed by the surface. At the reference site, the albedo ranged from 0.128 to 0.38, while at the PV power plant, it ranged from 0.1 to 0.334. In the event of a dust storm, the surface of the PV panels tends to accumulate a layer of floating sand, which not only changes the radiation characteristics of the surface, but also may adversely affect the energy absorption and conversion efficiency of the PV system.
The erection of PV panels also significantly increases surface roughness. The obstruction of airflow by PV arrays increases the friction velocity, thereby altering the characteristics of the near-surface wind field, such as the wind speed and direction at a height of 2 m. These changes not only augment kinetic roughness but also contribute to thermodynamic roughness, as variations in the surface temperature distribution further affect the local heat flux transmission. The observed changes in surface parameters incorporated into coupled land–atmosphere models allow for an accurate characterization of the impact of PV installations on the surface energy balance and heat transport processes. Previous studies have shown that the WRF model is reliable for simulating the climate in China. It was also found that the simulated temporal and spatial variations of near-surface meteorological variables, such as 2 m temperature, 10 m wind speed, surface short wave radiation, and surface pressure, are highly consistent with reanalysis data and observation data [57,58,59]. The dynamic roughness length within the PV system is 0.1407 m, and the kinetic roughness length at the reference point is 0.0406 m. The thermodynamic roughness lengths are 2.017 × 10⁻⁵ m and 0.588 × 10⁻⁵ m. This complex interaction makes the momentum exchange between the surface and the atmosphere more pronounced, resulting in an overall increase in the heat transport coefficient. The overall transport coefficient of the PV plant is one order of magnitude higher than that of the ground without PV panels. Future climate models should take into account dynamic changes in surface roughness when simulating large-scale PV deployment scenarios to more accurately reflect their potential impact on the atmospheric boundary layer. Additionally, the installation of PV panels alters the proportion of solar radiation absorbed and reflected, thereby modifying the heat received by the soil and influencing its thermodynamic state. Soil thermal parameters are to be closely related to soil moisture content, and exhibit significant seasonal variations. In spring, as permafrost gradually thaws, increased soil moisture content significantly enhances soil thermal conductivity and volumetric heat storage capacity. In summer, soil thermal parameters reach their peak values, while in winter, lower soil moisture limits thermal conductivity.
The research findings indicate that PV arrays have a certain impact on surface parameters. This study will help predict the long-term regional climate impacts of solar PV, including potential temperature changes, changes in precipitation patterns, and changes in atmospheric stability. However, to accurately assess the impacts of utility-scale PV arrays on local climate, additional observations and analyses at different time scales are required. In addition, the surface parameters calculated using the observed data will be used in regional climate models to study how PV arrays of different sizes and climatic conditions affect the local environment. This not only helps to understand the interference of human activities with surface processes, but also provides a scientific basis for the formulation of relevant policies, thereby promoting a balance between sustainable energy development and ecological environmental protection.

Author Contributions

J.J.: writing—original draft, visualization, validation, software, investigation, formal analysis, data curation, conceptualization, and funding acquisition. H.D.: methodology, software, investigation, and visualization. H.Y.: validation, investigation, and data curation. H.S.: validation, investigation, and data curation. All authors have read and agreed to the published version of the manuscript.

Funding

This work was supported by the National Natural Science Foundation of China (Grant No. 42205156), the Natural Science Foundation of Gansu Province (Grant No. 25JRRA183), the Natural Science Foundation of Gansu Province (Grant No. 23DFA011), and the Youth Science Foundation of Lanzhou Jiaotong University (No. 2022029).

Data Availability Statement

The datasets generated and analyzed during the current study are available from the corresponding author upon reasonable request.

Conflicts of Interest

The authors declare no conflicts of interest.

References

  1. Lin, T.Y.; Chiu, Y.H.; Chen, C.H.; Ji, L. Renewable energy consumption efficiency, greenhouse gas emission efficiency, and climate change in Europe. Geoenergy Sci. Eng. 2025, 247, 213665. [Google Scholar] [CrossRef]
  2. Lenton, T.M.; Rockström, J.; Gaffney, O.; Rahmstorf, S.; Richardson, K.; Steffen, W.; Schellnhuber, H.J. Climate tipping points—Too risky to bet against. Nature 2019, 575, 592–595. [Google Scholar] [CrossRef] [PubMed]
  3. Breyer, C.; Bogdanov, D.; Gulagi, A.; Aghahosseini, A.; Barbosa, L.; Koskinen, O.; Barasa, M.; Caldera, U.; Afanasyeva, S.; Child, M.; et al. On the role of solar photovoltaics in global energy transition scenarios. Prog. Photovolt. 2017, 25, 727–745. [Google Scholar] [CrossRef]
  4. Rao, A.; Kumar, S.; Karim, S. Accelerating renewables: Unveiling the role of green energy markets. Appl. Energy 2024, 366, 123286. [Google Scholar] [CrossRef]
  5. Hassan, Q.; Viktor, P.; J Al-Musawi, T.; Mahmood Ali, B.; Algburi, S.; Alzoubi, H.M.; Khudhair Al-Jiboory, A.; Zuhair Sameen, A.; Salman, H.M.; Jaszczur, M. The renewable energy role in the global energy Transformations. Renew. Energy Focus 2024, 48, 100545. [Google Scholar] [CrossRef]
  6. National Electric Automobile (NEA). Operation of Renewable Energy Grid Integration in 2024. Available online: https://www.nea.gov.cn/20250221/e10f363cabe3458aaf78ba4558970054/c.html (accessed on 27 January 2025).
  7. Taha, H. The potential for air-temperature impact from large-scale deployment of solar photovoltaic arrays in urban areas. Sol. Energy 2013, 91, 358–367. [Google Scholar] [CrossRef]
  8. Kumar, L.; Ahmed, J.; El Haj Assad, M.; Hasanuzzaman, M. Prospects and Challenges of Solar Thermal for Process Heating: A Comprehensive Review. Energies 2022, 15, 8501. [Google Scholar] [CrossRef]
  9. Huot, M.; Kumar, L.; Selvaraj, J.; Hasanuzzaman, M.; Rahim, N.A.; El Haj Assad, M. Performance Investigation of Tempered Glass-Based Monocrystalline and Polycrystalline Solar Photovoltaic Panels. Int. J. Photoenergy 2021, 2021, 2335805. [Google Scholar] [CrossRef]
  10. Kumar, L.; Hasanuzzaman, M.; Rahim, N.A. Real-Time Experimental Performance Assessment of a Photovoltaic Thermal System Cascaded with Flat Plate and Heat Pipe Evacuated Tube Collector. J. Sol. Energy Eng. 2021, 144, 011004. [Google Scholar] [CrossRef]
  11. Abed, F.M.; Ahmed, A.H.; Hasanuzzaman, M.; Kumar, L.; Hamaad, N.M. Experimental investigation on the effect of using chemical dyes on the performance of single-slope passive solar still. Sol. Energy 2022, 233, 71–83. [Google Scholar] [CrossRef]
  12. Zarakas, C.M.; Kennedy, D.; Dagon, K.; Lawrence, D.M.; Liu, A.; Bonan, G.; Koven, C.; Lombardozzi, D.; Swann, A.L.S. Land Processes Can Substantially Impact the Mean Climate State. Geophys. Res. Lett. 2024, 51, e2024GL108372. [Google Scholar] [CrossRef]
  13. Xueli, S. Research on Land-Surface Process Modeling—A review. J. Appl. Meteorol. Sci. 2001, 12, 102–112. [Google Scholar]
  14. Businger, J.A.; Wyngaard, J.C.; Izumi, Y.; Norman, J.M. Turbulent flux profiles in the convective boundary layer. J. Atmos. Sci. 1971, 28, 181–189. [Google Scholar] [CrossRef]
  15. Allen, R.G.; Tasumi, M.; Trezza, R. Satellite-based energy balance for mapping evapotranspiration with internalized calibration (METRIC)-model. J. Irrig. Drain. Eng. 2007, 133, 395–406. [Google Scholar] [CrossRef]
  16. Tschopp, D.; Jensen, A.R.; Dragsted, J.; Ohnewein, P.; Furbo, S. Measurement and modeling of diffuse irradiance masking on tilted planes for solar engineering applications. Sol. Energy 2022, 231, 365–378. [Google Scholar] [CrossRef]
  17. Chang, R.; Shen, Y.B.; Luo, Y.; Wang, B.; Yang, Z.B.; Guo, P. Observed surface radiation and temperature impacts from the large-scale deployment of photovoltaics in the barren area of Gonghe, China. Renew. Energy 2018, 118, 131–137. [Google Scholar] [CrossRef]
  18. Helbig, M.; Gerken, T.; Beamesderfer, E.R.; Baldocchi, D.D.; Banerjee, T.; Biraud, S.C.; Brown, W.O.J.; Brunsell, N.A.; Burakowski, E.A.; Burns, S.P.; et al. Integrating continuous atmospheric boundary layer and tower-based flux measurements to advance understanding of land-atmosphere interactions. Agric. For. Meteorol. 2021, 307, 108509. [Google Scholar] [CrossRef]
  19. Rui, S. Simulation Study on the Characteristics of Land Surface Processes in the Cold Zone. Master’s Thesis, Lanzhou University, Lanzhou, China, 2007. [Google Scholar]
  20. Cortes, A.; Murashita, Y.; Matsuo, T.; Kondo, A.; Shimadera, H.; Inoue, Y. Numerical evaluation of the effect of photovoltaic cell installation on urban thermal environment. Sustain. Cities Soc. 2015, 19, 250–258. [Google Scholar] [CrossRef]
  21. Xu, Z.J.; Li, Y.; Qin, Y.Z.; Bach, E. A global assessment of the effects of solar farms on albedo, vegetation, and land surface temperature using remote sensing. Sol. Energy 2024, 268, 112198. [Google Scholar] [CrossRef]
  22. Guosheng, W.; Qing, H.; Hongyan, X.; Xu, T. Surface Radiation Budget and Surface Albedo Characteristics in Eastern Pamir Plateau. Plateau Meteorol. 2023, 42, 619–631. [Google Scholar] [CrossRef]
  23. Yanlong, G.; Ranghui, W.; Jian, Y.; Jinkai, Q.; Mian, Z. Characterisation of surface albedo in the Tianshan region in the context of climate change. Arid Zone Geogr. 2015, 38, 351–358. [Google Scholar] [CrossRef]
  24. Han, S.S.; Ghafoor, U.; Saeed, T.; Elahi, H.; Masud, U.; Kumar, L.; Selvaraj, J.; Ahmad, M.S. Silicon Particles/Black Paint Coating for Performance Enhancement of Solar Absorbers. Energies 2021, 14, 7140. [Google Scholar] [CrossRef]
  25. Basuhaib, A.; Selvaraj, J.; Hasanuzzaman, M.; Anjum, T.; Kumar, L. Experimental investigation the effect of different operating parameters and optimized the water-based PVT system for domestic applications. Sol. Energy 2024, 268, 112278. [Google Scholar] [CrossRef]
  26. Hossain, M.S.; Kumar, L.; Arshad, A.; Selvaraj, J.; Pandey, A.K.; Rahim, N.A. A Comparative Investigation on Solar PVT- and PVT-PCM-Based Collector Constancy Performance. Energies 2023, 16, 2224. [Google Scholar] [CrossRef]
  27. Beljaars, A.C.M.; Holtslag, A.A.M. Flux Parameterization over Land Surfaces for Atmospheric Models. J. Appl. Meteorol. Climatol. 1991, 30, 327–341. [Google Scholar] [CrossRef]
  28. Liu, J.Q.; Kimura, R.; Miyawaki, M.; Kinugasa, T. Effects of plants with different shapes and coverage on the blown-sand flux and roughness length examined by wind tunnel experiments. Catena 2021, 197, 104976. [Google Scholar] [CrossRef]
  29. Stull, R.B. An Introduction to Boundary Layer Meteorology; Reidel Publishing Co.: Dordrecht, The Netherlands, 1988; Volume 115. [Google Scholar]
  30. Di, X. Research on Soil Thermal Condition and Its Effect on Energy Balance in the Tibetan Plateau. Ph.D. Thesis, Lanzhou University, Lanzhou, China, 2009. [Google Scholar]
  31. Junxia, J. Research on Land Surface Process Characteristics and Parameterisation Scheme for Large-Scale Photovoltaic Power Plants in Desert Areas. Ph.D. Thesis, University of Chinese Academy of Sciences, Beijing, China, 2021. [Google Scholar]
  32. Yaoming, M. Mount Everest Integrated Atmosphere and Environment Observatory of the Chinese Academy of Sciences: A new integrated base for studying the earth-air interaction processes in the Himalayas. Highl. Meteorol. 2007, 26, 1141–1145. [Google Scholar]
  33. Jiang, J.; Gao, X.; Bolong, C.J.A. The Impact of Utility-Scale Photovoltaics Plant on Near Surface Turbulence Characteristics in the Barren Areas. Atmosphere 2020, 12, 18. [Google Scholar] [CrossRef]
  34. Monin, A.; Obukhov, S. Basic laws of turbulent mixing in the surface layer of the atmosphere. Tr. Akad. Nauk SSSR Geophiz. Inst. 1954, 24, 163–187. [Google Scholar]
  35. Patil, M.N. Aerodynamic drag coefficient and roughness length for three seasons over a tropical western Indian station. Athmos. Res. 2006, 80, 280–293. [Google Scholar] [CrossRef]
  36. Shengjie, N.; Lijuan, Z.; Chunsheng, L.; Jun, Y.; Jing, W.; Weiwei, W. Observational Evidence for the Monin-Obukhov Similarity under All Stability Conditions. Adv. Atmos. Sci. 2012, 29, 285–294. [Google Scholar]
  37. Zhen, Y.; Yiping, Z.; Guirui, Y. Characteristics of atmospheric stability at the boundary of atmosphere-tropical seasonal rainforest canopy in Xishuangbanna of Southwest China. Chin. J. Ecol. 2008, 27, 130–134. (In Chinese) [Google Scholar] [CrossRef]
  38. Lewellen, W.S.; Teske, M. Prediction of the Monin-Obukhov Similarity Functions from an Invariant Model of Turbulence. J. Atmos. Sci. 1973, 30, 1340–1345. [Google Scholar] [CrossRef]
  39. Zhi-Qiu, G.; Lingen, B.; Yabin, Z. Analytical solution of soil heat conduction equation and study of soil heat diffusivity in Nagqu. J. Meteorol. 2002, 03, 352–360. [Google Scholar]
  40. Bhumralkar, C.M. Numerical Experiments on the Computation of Ground Surface Temperature in an Atmospheric General Circulation Model. J. Appl. Meteorol. Climatol. 1975, 14, 1246–1258. [Google Scholar] [CrossRef]
  41. de Silans, A.M.B.P.; Monteny, B.A.; Lhomme, J.P. Apparent soil thermal diffusivity, a case study: HAPEX-Sahel experiment. Agric. For. Meteorol. 1996, 81, 201–216. [Google Scholar] [CrossRef]
  42. Horton, R.; Wierenga, P.J.; Nielsen, D.R. Evaluation of Methods for Determining the Apparent Thermal Diffusivity of Soil Near the Surface. Soil Sci. Soc. Am. J. 1983, 47, 25–32. [Google Scholar] [CrossRef]
  43. Miao, Y.C.; Liu, S.-H.; Lü, S.-H.; Zhang, Y. A comparative study of computing methods of soil thermal diffusivity, temperature and heat flux. Chin. J. Geophys. 2012, 55, 441–451. [Google Scholar] [CrossRef]
  44. Gao, Z.Q.; Tong, B.; Horton, R.; Mamtimin, A.; Li, Y.B.; Wang, L.L. Determination of Desert Soil Apparent Thermal Diffusivity Using a Conduction-Convection Algorithm. J. Geophys. Res.-Atmos. 2017, 122, 9569–9578. [Google Scholar] [CrossRef]
  45. Heusinger, J.; Broadbent, A.M.; Sailor, D.J.; Georgescu, M. Introduction, evaluation and application of an energy balance model for photovoltaic modules. Sol. Energy 2020, 195, 382–395. [Google Scholar] [CrossRef]
  46. Maimaitiaili, M.; Ajiguli, S.; Wang, Y.; Gao, J.; Liu, J.; Ju, C. Land Surface Process Parameters and Offline Simulation of Land Surface Models in the Hei Gobi of Eastern Xinjiang. Desert Oasis Meteorol. 2024, 18, 20–27. [Google Scholar]
  47. Qiang, Z.; Ronghui, H.; Hui, T. A Parameterization Scheme of Surface Turbulent Momentum and Sensible Heat over the Gobi Underlying Surface. Adv. Atmos. Sci. 2003, 20, 111–118. [Google Scholar] [CrossRef]
  48. Liu, T.; Jia, X.; Chen, D.; Yixi, L.; Zhang, Y.; Pan, K.; Zhang, Z. Surface aerodynamic characteristics of flat quicksand in the middle reaches of Yarlung Tsangpo River. Desert China 2023, 43, 194–203. [Google Scholar]
  49. Qiang, Z.; Guoan, W.; Ronghui, H. Overall Transfer Coefficients of Momentum and Sensible Heat over Desert and Gobi in the Arid Region of Northwest China. Earth Sci. 2001, 31, 783–792. [Google Scholar]
  50. Wang, Y.; Maimaitiaili, M.; Qing, H.; Xinghua, Y.; Wen, H.; Jiantao, Z. Characteristics of surface energy balance at the northern edge of Taklamakan Desert. Desert Oasis Meteorol. 2014, 8, 34–41. [Google Scholar]
  51. Yu, W.; Zeyong, H.; Xueyi, X.; Lijiao, X.; Pengcheng, X. Optimization and Validation of Soil Thermal Conductivity Parametrization Scheme on the Northern Tibetan Plateau. Plateau Meteorol. 2013, 32, 646–653. [Google Scholar]
  52. Qiang, Z.; Xiaoyun, C.; Guoan, W.; Rronghui, H. Impact of Climate Change on Water Resources in Cold and Arid Regions. J. Cold Arid Reg. Environ. Eng. 2010, 32, 345–356. [Google Scholar]
  53. Yongqiang, L.; Qing, H.; Hongsheng, Z.; Mamtimin, A. Study on Land-Atmosphere Interaction Parameters in the Inland of the Taklimakan Desert. Plateau Meteorol. 2011, 30, 1294–1299. [Google Scholar]
  54. Xingbing, Z. Study on Surface Energy Balance Characteristics and Turbulent Flux Parametrization over Gobi in Western Tibetan Plateau. Ph.D. Thesis, Nanjing University of Information Science & Technology, Nanjing, China, 2021. [Google Scholar]
  55. Hui, Z.; Shuhua, L. Parameterization and Simulation of Desert Land Surface Processes. Chin. J. Geophys. 2013, 56, 2207–2217. [Google Scholar] [CrossRef]
  56. Gao, X.; Yang, L.; Lv, F. Study on the effect of photovoltaic power plant on soil temperature in Golmud desert area. Acta Energiae Solaris Sin. 2016, 37, 1439–1445. [Google Scholar]
  57. Sun, H.; Luo, Y.; Zhao, Z.; Chang, R. The impacts of Chinese wind farms on climate. J. Geophys. Res. Atmosphere 2018, 123, 5177–5187. [Google Scholar] [CrossRef]
  58. Yang, L.W. Study on Local Climate Effect of the Large Solar Farm in Desert Areas of Golmud. Master’s Thesis, Cold and Arid Regions Environment and Engineering Research Institute, Chinese Academy of Sciences, Beijing, China, 2015. (In Chinese). [Google Scholar]
  59. Chang, R.; Yan, Y.; Luo, Y.; Xiao, C.; Wu, C.; Jiang, J.; Shiz, W. A coupled WRF-PV mesoscale model simulating the near-surface climate of utility-scale photovoltaic plants. Sol. Energy 2022, 245, 278–289. [Google Scholar] [CrossRef]
Figure 1. Satellite image of the observation platform for the climate effect of the utility-scale PV plant in WJQ, Xinjiang, China.
Energies 18 03170 g001
Figure 2. Schematic diagram of the observing system.
Energies 18 03170 g002
Figure 3. Trends in surface albedo changes from June to November 2021 for the PV power station and reference sites (a), comparison of daily variations during summer (b), conversion rate of PV panels (epv, the proportion of total daily power generation to the solar radiation) (c).
Energies 18 03170 g003
Figure 4. Comparison of net radiation (a) and surface albedo (b) between PV sites and reference sites under different weather conditions during summer.
Energies 18 03170 g004
Figure 5. Diurnal variation of friction velocity (a), wind speed (b), and rose diagram of wind direction at 2 m height (c) for the summer of 2021 at the PV plant and the reference site.
Energies 18 03170 g005
Figure 6. Dynamics roughness (a,b) and thermal roughness (c,d) of the PV power station and reference sites.
Energies 18 03170 g006
Figure 7. Diurnal variations of overall transfer coefficients at the PV power station and reference sites: momentum transfer coefficient (a), sensible heat transfer coefficient (b).
Energies 18 03170 g007
Figure 8. Momentum transfer coefficients (a), sensible heat transfer coefficients (b) for different stable stratification conditions at the PV plant and the reference site.
Energies 18 03170 g008
Figure 9. Daily series of thermal property parameters for the 0~20 cm soil layer within the PV power station from January 2021 to December 2021. (a) Soil volumetric water content, (b) soil thermal conductivity, (c) soil volumetric heat capacity, (d) soil thermal diffusivity.
Energies 18 03170 g009
Figure 10. Annual variation in soil thermal diffusivity at PV power plants and reference sites.
Energies 18 03170 g010
Table 1. Sensor model, observation height (depth), and the main technical specifications for observation items in the PV plant and the reference site.
Instrument NameInstrument ModelMeasuring Height/DepthAccurate
Four-component net radiation sensingCNR4 (Kipp & Zonen, Delft, Holland)1.5, 10 m5~10 μv/W/m2
Ultraviolet radiation sensorCUV5 (Kipp & Zonen, Delft, Holland)1.5, 10 m7~20 μv/W/m2
Soil heat flux sensorCampbell HFP01 (Logan, UT, USA)5, 20 cm50 μv/W/m2
Soil moisture sensorsCampbell CS616-L (Logan, UT, USA)5, 10, 20, 40, 80, 180 cm±2.5%
Soil temperature sensorsCampbell 109SS-L (Logan, UT, USA)±0.2 K
Ultrasonic eddy current systemCampbell IRGASON-IC-BB (Logan, UT, USA)5.5 m, 3 m±8 cm/s
Table 2. Different weather conditions in a PV plant in summer.
DateClimatic ConditionsDateClimatic Conditions
22 June 2021Clear sky3 July 2021Cloudy
28 June 2021Overcast30 July 2021Light rain
14 August 2021Moderate rain25 August 2021Dust storm
Table 3. Soil thermal diffusivity in the desert and Gobi regions.
NumberDistrictk/m2·s−1
1Dunhuang Gobi in Gansu [52]1.65 (±0.49) × 10−7
2Taklamakan Desert [53]1.50 (±0.11) × 10−7
3Western Gobi of the Tibetan Plateau [54]2.89 × 10⁻⁷
4Badain Jaran Desert in Xinjiang [55]3.34 × 10⁻⁷
Disclaimer/Publisher’s Note: The statements, opinions and data contained in all publications are solely those of the individual author(s) and contributor(s) and not of MDPI and/or the editor(s). MDPI and/or the editor(s) disclaim responsibility for any injury to people or property resulting from any ideas, methods, instructions or products referred to in the content.

