Abstract
While power system resilience studies continue to grow due to the criticality of electrical infrastructures, the challenge of inconsistencies in evaluation frameworks remains. Furthermore, the desire for researchers to contribute towards the development of practical assessment frameworks continues to grow. In addition, the locality of resilience issues has challenged researchers to find context-based resilience solutions. This paper addresses these by proposing an assessment framework, which evaluates the five phases of the resilience trapezoid: preventive, absorptive, adaptive, restorative, and transformative. This framework presents metrics for measuring preventive indicators for the anticipating system status, frequency of functionality degradation, how low functionality drops, extension in a degraded state, the promptness of recovery, and system transformation—the AFLEPT model. The AFLEPT framework is applied, with its resilience indicators and capacities, to evaluate the resilience of Malawi’s transmission network to the 2022 Tropical Cyclone Ana (TCA). DigSILENT PowerFactory 2023 SP5 was utilised to support this research. The results indicate significant resilience challenges, manifested by an inadequate generation reserve, significant decline in grid functionality, extended total grid outage hours, longer restoration times, and a lack of transformation. Eight percent of key transmission lines and eighteen percent of power generation infrastructure were completely damaged by the TCA, which lasted up to 25 days and 16 months to, respectively, before restoration. Thus, the analysis reveals gaps in preventive, absorptive, adaptive, restorative, and transformative resilience capacities. The results underscore the need for context-based infrastructural and operational resilience enhancement measures, which have been discussed in this paper. Directions for further research have been proposed, which include exploring multiple grid improvement measures and an economic modelling of these measures.
1. Introduction
Electrical grids transmit electrical power from generation stations to load centres and are usually vulnerable to severe weather events such as floods [1], earthquakes [2], cyclones [3], ice [4,5,6], typhoons [7,8], and hurricanes [9,10,11]. These severe weather conditions have proved to cause substantial damage to power system infrastructure and often lead to total system power cuts and the imposition of high economic losses resulting from restoration, recovery, and reconstruction costs. Malawi is one of the countries which has been hit by tropical cyclones [12]. As shown in Figure 1, the country is landlocked, bordered by Tanzania (north/northeast), Mozambique (east/south/southeast), and Zambia (west). Shire River is the largest river in Malawi, on which about 90 percent of hydropower plants are cascaded. Figure 1 also shows the power generation plants and existing and planned transmission network, as of November 2022. Some transmission infrastructures are steel, while others are wooden.
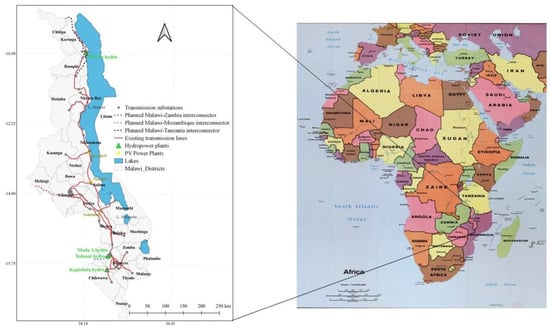
Figure 1.
Map of Malawi showing the power system: generation and transmission infrastructure.
Over twenty catastrophes linked to extreme rainfall occurrences, such as floods, landslides, and storms, have happened in the last decade only and have shown an incremental ascending pattern in the number of populations affected. These frequent disasters inflict substantial costs for repairs and reconstruction on the nation, redirecting insufficient resources from other development requirements. The effects of the 2019 Tropical Cyclone Idai (TCI) put Malawi in the top five countries globally most affected by severe weather events [12]. The 2022 Tropical Storm Ana (TCA) and Tropical Cyclone Gombe (TCG) resulted in 64 fatalities and 945,934 people involved. More recently, the 2023 Tropical Cyclone Freddy (TCF) affected over two million people, including over 650,000 displaced, 679 deaths, 537 people missing, and 2186 injuries [12]. Failures caused by tropical cyclones are expected to worsen due to climate change [13]. In January 2022, the TCA caused long hours of national blackout due to lost power generation and transmission systems. The Kapichila hydropower plant was severely damaged [14,15], and many transmission towers along the Shire River were brought down, overwhelming the mitigation measures that were put in place [16]. Operational challenges have been evidenced by multiple total power system shutdowns even when there were no extreme events. A detailed study on the resilience of Malawi’s grid operator is reported in [17], where operational, technological, regulatory, political, financial, and management issues were identified as some of the factors affecting the response capabilities. The issues discussed above underscore the need to move from response to long-term resilience [18].
The concept of resilience was first defined ecologically by Holling [19] as the capacity of systems to return to their original state after severe system disruptions. Over the years, this resilience concept has moved from ecology to power systems. Power systems resilience (PSR) has been defined differently [20,21]. All the definitions describe resilience capacities, including preparedness (prevention), absorption, restoration, adaptation, and sometimes transformation, which have been reviewed and explained in [20,22,23,24,25,26].
The assessment of PSR has increasingly relied on a diverse array of indicators that quantify the capacity of the network to withstand, adapt to, and recover from adverse events. Different studies have presented a range of indicators [26]. Ahmadi and others [26] presented a set of varied measurable indicators for various energy systems alongside their formulations. It is worth noting that there was no uniformity in these resilience indicators. The resilience trapezoid and other indicators were classified as numerical measures in [21]. A resilience trapezoid has also been considered an alternative way to define PSR [25] and a quantitative resilience indicator [21]. One of the quantitative frameworks covering operational and infrastructural resilience is that proposed by Panteli [27], which systematically captures the performance of a power system during phases of the resilience trapezoid, called , which is pronounced as FLEP. (or F) defines the rate of resilience degradation while (or L) characterises the extent of degradation during event. shows the duration in the degraded state and (or P) quantifies the recovery rate. Since its introduction, few studies [27,28,29,30,31,32] have used the FLEP metric system to quantify resilience. However, the review of the literature in Section 2 found the following literature gaps, which form the basis of this paper:
- The existing FLEP metric only quantifies absorption, adaptation, and restoration (recovery) features for the critical resilience characteristics.
- Existing studies that applied the FLEP metric framework did not integrate the framework, its indicators, or the essential resilience capacities.
- Infrastructure quantitative indicators with respect to hydro-based generators have not been explored.
- Although Malawi is exposed to severe weather-related disruptions and while resilience challenges are location-specific, resilience studies on Malawi’s power system have not been conducted.
If these gaps are not addressed, there could be a risk of only partially solving resilience challenges, for example, concentrating on corrective strategies, emergency responses, and damage assessments while unintentionally leaving out asset management and system upgrades [33]. In addition, resilience challenges are location-specific, and context is very important in resilience buildings. As one way of ensuring quick restoration following a disruption, Cesar [34] showed that it is important for grid operators to develop resilience strategies which classify hazards and devise preparatory measures. These strategies are usually context- and time-based because resilience improvement strategies are not one-size-fits-all [35]. To address the gaps identified above, this paper, therefore, aims to (i) develop an extended metric framework which can quantify all the basic (standard) resilience capacities including preventive, absorptive, adaptive, restorative, and transformative, (ii) provide an integrated analysis of the proposed framework and how it relates to its resilience indicators and capacities, (iii) propose a generator-based infrastructure indicator, and (iv) apply the proposed methods (framework) on Malawi’s transmission network.
In this work the existing FLEP metric framework is modified to the novel AFLEPT, called , which is pronounced as AFLEPT. (or A) assesses the preventive ability before the event, i.e., providing the status of the resilience indicator before the event, while maintained the original definitions. (or T) estimates the power system’s transformative capacity. An integrated analysis of the AFLEPT framework, its indicators, and resilience capacities are also conducted, demonstrating a comprehensive, integrated framework for assessing power grid resilience (which accounts for all the resilience phases of a resilience trapezoid). Further, a performance evaluation of Malawi’s transmission grid during the 2022 TCA is performed using DigSILENT PowerFactory (PF) 2023 model SP5 (×64) software. Conducting this assessment on a real power system with actual power system data, using industry-based software, presents a platform for solving real resilience challenges.
The AFLEPT metric provides a comprehensive view of performance over a specified period. It can allow utilities and grid operators to measure their performance against regulatory standards and benchmarks, facilitating compliance, encouraging continuous improvement in resilience and offering support in decision-making processes. However, its accuracy may depend on the availability and quality of input data. Moreover, its effectiveness may vary depending on the application scale, potentially limiting its utility in certain contexts. This approach enables the evaluation of both the operational aspects and the inherent capabilities of a power grid to withstand, adapt to, and recover from severe disturbances. This combination aims to complement performance metrics and underlying capabilities. Thus, a mixed approach ensures that both the symptoms of resilience weaknesses, as highlighted by the AFLEPT metrics, and the underlying capabilities, as highlighted by resilience capacities, to address these weaknesses are considered, resulting in more informed and effective resilience-improving techniques. The integrated framework further provides a valuable tool for planning, operating, and managing resilience within power systems. It also offers a practical resource for policymakers, reflecting on the potential implications of resilience strategies. Finally, it serves as a guideline for those responsible for managing the electricity grid, offering a roadmap to validate their resilience strategies. It is interesting to investigate if the power system performance curve for real power systems using actual power system data could produce a similar pattern to that produced by simulated data and using test versions of power systems.
Thus, the main contributions of this paper are as follows:
- New methods: an integrated framework for assessing power grid resilience and a new quantitative indicator.
- New work: resilience evaluation of Malawi’s transmission grid to tropical cyclones.
- Context-based infrastructural and operational resilience enhancement strategies.
2. Literature Review
The definition of PSR is derived from definitions provided by other disciplines [21]. In the context of PSR definitions, the words “grid,” “infrastructure,” “network,” “power system,” and “system” are used interchangeably. The definition used in this paper is adapted from Malin [35]: the capacity of an interconnected system—comprising components, institutions, and operators—to proactively plan, prepare, cope with threats, respond, and transform, lessening impacts, allowing fast recovery, promoting adaptive improvements, reducing risks and vulnerabilities, and addressing current and future threats. This definition considers all the periods of the resilience trapezoid and all the standard resilience capacities (preventive, absorptive, adaptive, restorative, and transformative). The assessment of PSR has increasingly relied on a diverse array of indicators that quantify the ability of the grid to withstand, adapt to, and recover from adverse events. Different studies have presented a range of indicators [26]. Ahmadi and others [26] presented a collection of different quantitative indicators for various energy systems alongside their formulations. It is worth noting that there was no uniformity in these resilience indicators. Indicators were selected to reflect the vulnerability of the system and its resilience, which may include ecological, physical, social, economic, institutional, and infrastructure variables [36]. The chosen indicator should align with the system’s purpose (systems’ functionality), be tied to the system’s unique features (characteristics), and be easy to understand and apply (simplicity). In addition, indicators should detect meaningful changes (sensitivity), accurately measure the intended attribute (validity), and provide ease of obtaining data (accessibility). Further, resilience indicators should directly tie to system goals and stakeholders (relevance) and be reliable under varying conditions (robustness). Furthermore, selected indicators should produce consistent results when replicated (reproducibility) and be able to cover relevant system aspects (scope). Moreover, when choosing indicators, it should be established if data are available and can be obtained (availability). Finally, indicators should be cost-effective to measure (affordability) [36].
The resilience trapezoid and other indices were presented as quantitative indicators in [21]. A resilience trapezoid has also been considered an alternative way to define PSR [25] and a quantitative resilience indicator [21]. The resilience trapezoid visualises the capacities of power systems throughout the phases of disruption, i.e., represents the resilience level with respect to time [35], as shown in Figure 2. The time of the resilience trapezoid in the X-axis could be in seconds, minutes, hours, days, weeks, or months. In this example, the event is assumed to be in days. is day 0, before the event strikes. is the day that the event strikes, while is the day the event ends. Restoration or recovery starts on day and ends on day . is the day when transformative work ends.
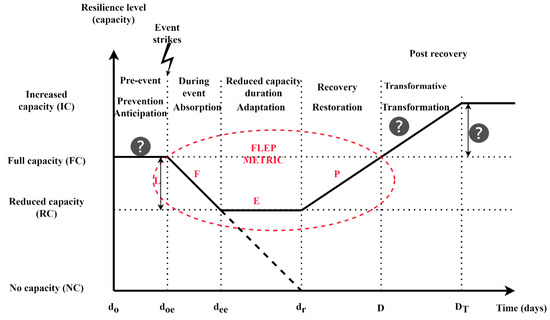
Figure 2.
Resilience trapezoid. F—how fast system degrades, L—how low system degrades, E—extension in degraded state, P—how promptly system is recovered and ?—unexplored metrics in FLEP framework.
The Y-axis shows the measured quantity (the resilience capacity), such as the grid functionality [20], performance level [5,28,37], resilience level [38], resilience indicator [39], system function [21], power system status [5,7], performance index [40], resilience [37], and system performance [23]. Although different terminologies have been used, the Y-axis represent a suitable resilience indicator, which can include the number of transmission lines online, the number of affected customers, the load energy unserved, the maximum number of online units, the amount of generation capacity, and the load demand. The units of measure may be represented as a percentage or absolute value, for example, megawatts to represent the amount of power consumption.
Before the event, the resilience level is assumed to be adequate from to . This stage represents the pre-event stage and has been associated with the preventive, mitigative, and anticipative resilience features. In this phase, the system’s regular operation has been assumed [41,42]; the resilience indicators are supposed to be at their total capacity. The system is also considered to be in its primary operation mode (intact and functional) [23]. However, this may not always be the case. Other studies have claimed that in this stage, systems are robust [37], resilient [43], reliable, stable [20], reconditioned [37], and prepared for impending grid events [23]. Preparing for an impending disaster may mean having an adequate generation reserve (thus, the percentage of the generated capacity to operational installed capacity, , leaves enough reserve), redundant transmission lines, emergency generators, a prepositioned repair crew and materials [42], preventive maintenance, and non-exposed infrastructure. Although this stage has been associated with robustness and resistance, it can be more accurately described as preparation, anticipation, and prevention whose effectiveness can be observed when an event strikes. Thus, this phase is associated with preparedness capacity indicators. Some of the resilience activities in this phase may include resilience planning, damage forecasting, impact estimation, the prepositioning of resources such as a repair crew and materials, and system monitoring [21,28]. Cesar [34] indicated that the planning strategies could take two approaches—when there are no disasters and when there is an upcoming disaster.
When a severe event strikes on day , the system functionality drops or starts to drop. How fast or how low the system functionality drops depends on how robust the system is, thus the ability of the system to absorb or resist the impacts of severe events. By implication, the rate of degradation may manifest the system’s absorptive (/coping/resistive/survivability) capacity [5,7,23,37,38,44]. Depending on the level of the absorptive capacity, the system can lose part of or its total capacity (how low the resilience indicator in the Y-axis drops). How the system responds to the extreme event manifests the system’s vulnerability, fragility, and survivability [20,37,40], but also the intensity of the event [42]. Thus, the rate and magnitude of the decrease in functionality, or degradation, have manifested the system’s vulnerability, survivability, or absorptive capacity. By extension, the indicators that measure the rate and magnitude of system degradation are mapped to this absorption phase. However, the decline in functionality may sometimes be masked by adequate alternative resources, such as the generation reserve, for example, in terms of number of affected customers. The time it takes for the system to remain at the reduced capacity depends on the prevailing weather conditions and the preparedness, adaptive, recovery, and restorative capabilities. As resilience is usually associated with severe events, the power grid operators may only monitor the disaster and damages to ascertain the system health and update the stakeholders. Operators can also start planning for restoration based on preliminary monitoring reports to quicken the recovery process [34].
to has been reported to be a response phase [23,37,44] where most systems have been claimed to be degraded [5,7,28,37,39,45], disrupted [20], or be in an extremis (critical) state [41]. The duration that the system remains degraded may imply the system’s fragility, agility, and the level of redundancy measures in place [20,37,44,45]. This transition phase has also been considered an adaptation stage where the event experiences are used as learning points to moderate future occurrences [38]. Thus, the adaptive capacity, duration of a system between the time that the event stops to the time that restoration starts, and their associated indicators have been connected to this phase. Zidane [42], however, described the adaptation stage as a long-term preparatory stage and that it starts when restoration stops until the next impending event. While it is true that there is long-term learning and planning in the adaptive strategy, this learning and planning actually starts before restoration commences, i.e., the period when the system is in a degraded state. Assessments and observations may be conducted to evaluate the extent of the impact, which may guide the emergency response, if need be, resource mobilization, and recovery plans [5]. The strategies made during the event transition phase may be assessed, re-evaluated, and approved to optimize the resources [34].
to demonstrates the recovery [20,23,37,38,40,44] or restoration [5,7,39,41,45] stage. Although restoration and recovery have been used differently, they all aim to ensure functionality is reinstated. The restorative ability is responsible for the rate at which this restoration takes place. Thus, recovery or restoration rate is associated with the recovery phase. The speed with which the system is restored to its original status depends on several factors, including the availability of repair materials, the maintenance crew, the accessibility of the affected infrastructure, weather conditions, and financial resources. Although only restoration and recovery have been associated with this stage, declaring the system obsolete or unrepairable, and thus scrapping it, may sometimes occur. Zidane [42] indicated that restoration is bi-dimensional—either the speed of functionality recovery or the portion of the functionality or equipment that is restored. In this paper, both dimensions are accounted for in the analysis.
After restoration, the system has been claimed to have recovered and is in a stable [20], normal [5,7,41], transformed [38], or an ultimate operational mode [23]. The system may be improved or transformed based on lessons learned from the extreme event. Instead of reverting to the original state, the system achieves a transformed, new normal or a better state (building back bigger, stronger, and better). Even though Malin [35] did not associate transformation to increase but any form of change, the change that is being considered in this context is an increasing transformation. Consequently, the increase in resilience indicators can be mapped to the transformative capacity and phase to . Thus, severe environmental conditions can sometimes be used as the basis for building the systems back better [46]. This is when the systems’ functionality or capacities are increased. It may depend on finances, politics, technology, and human resources.
Assessing the resilience of power systems to severe weather conditions has always been challenging due to the unavailability of standard assessment frameworks, indicators, and metrics. One of the quantitative frameworks covering operational and infrastructural resilience is that proposed by Panteli [27], which systematically captures the performance of a power system during phases of the resilience trapezoid, called , which is pronounced as FLEP. (or F) defines the rate of resilience degradation while (or L) characterises the extent of degradation between to , shows the duration in the degraded state between to , and (or P) quantifies the recovery rate between to . A fifth area metric, which depends on all four metrics, was also proposed in [27]. A resilience trapezoid shown in Figure 2 demonstrates how the FLEP metric relates to the resilience transition phases. The figure demonstrates that the existing FLEP metric only defines absorption, adaptation, and restoration (recovery) features for the critical resilience characteristics. Moreover, existing studies on applying the FLEP metric framework do not integrate the framework, its indicators, and the essential resilience capacities. These gaps are covered in this paper.
Since its introduction, few studies [27,28,29,30,31,32] have used the FLEP metric system to quantify resilience. In these studies, different severe weather conditions were presented, all simulated, as shown in Table 1. Furthermore, operational and infrastructural indicators have been used, although some case studies [29,31] only used operational indicators. However, it is noted that the transmission lines [27,28] and distribution feeder circuits [30] have, so far, been used as infrastructure indicators. In contrast, the amount of generation and load connected were used as operational indicators. Furthermore, a test version of the Great Britain (GB) transmission network was used. Only part of the distribution network was used for a real power system (Minnesota). Ref. [29] discovered that the FLEP metric is inversely proportional to the area of the resilience trapezoid but directly proportional to the resilience capacities. Hossain et al. [29] validated the resilience quantification using the FLEP metric by the resilience capacity metric. Kemabonta [30] proposed a syncretistic framework for grid resilience and reliability. Although Kemabonta [30] claimed to have combined FLEP and resilience capacities to assess the power system’s resilience, this was not demonstrated. The resilience capacities were explained in resilience enhancement, that is, how specific enhancement techniques could potentially enhance the capacities.

Table 1.
Previous studies on applying the FLEP metric to assess power system resilience.
The quantitative resilience evaluation has frequently been centred on the quantification of system performances. So far, different quantitative resilience frameworks have been reported in the literature [7,8,21,25,39,40,43,44,45,47,48,49,50,51,52,53,54], from where numerous conclusions or recommendations were drawn. There was no uniformity and consistency in frameworks as there has not been a standard metric or framework [34]. While some start with threat identification and/or characterisation [7,43,44,50,53], others start by defining the resilience goals [47,52]. Others begin by defining data requirements [8,21,45,48,55] and the resilience metrics [40]. There are limited studies on pre-event resilience assessments (preparedness). One framework demonstrated the need for planning resilience, which helps identify weak points and informs planning and operational decisions [8]. The resilience frameworks depend on the location because events are area-specific. Although resilience studies are location-specific, and while Malawi is exposed to severe disruptions, resilience studies on Malawi’s power system have not been conducted. These extreme disasters have been classified with different return times for mitigation purposes, and these return periods are usually location-specific. For example, the Malawi 2015 floods were classified as a 1 in 500-year event [18], while the 2016 drought was classified as a 1 in 35-year event [56]. While the 2022 TCA was associated with a 1 in 50-year return period [57], the 2023 TCF could not be classified in terms of the return period. However, the TCF reached the equivalent intensity of a category five hurricane at its peak [58]. The impacts of tropical cyclones or hurricanes have been evaluated in the United States [13], India [59,60], Republic of Korea [61], and China [3]. Ref. [47] demonstrated that resilience frameworks are not one-size-fits-all methods by developing a framework in a developing country setting, using Uganda as a case study, to facilitate sustainable development. They argued that most frameworks, which are atomistic in their classifications of indicators, failed to demonstrate how local actions contribute to globally defined sustainable development targets. This is why it is suggested that resilience enhancement should incorporate the locality of resilience challenges by conducting location-specific assessments.
3. Methodology: An Assessment Framework
3.1. Developing the AFLEPT Metric Framework
To modify the existing FLEP metric, three additional metrics were introduced by referring to Figure 2. Two metrics are added to the prevention and transformation phases. Firstly, the Greek letter Alpha, , (capital A), was added to the FLEP (making AFLEP), to assess the preventive ability before the event. This indicator provides the status of the resilience indicator before the event, such as the status of the generation reserve. This information improves the operators’ predictive abilities, emergency preparedness, facilitation of fast restoration, and optimisation of investments. Secondly, a metric to estimate the transformative capacity of the power system, denoted by the Greek letter and using a capital T for pronunciation. This addition modifies the AFLEP to the AFLEPT metric. Transformative metrics can provide information about innovation potential, pinpointing specific barriers that need to be overcome to facilitate the transformation process and estimate the resilience of change against shocks. Transformative metrics can guide strategic planning, resource allocation, and the implementation of initiatives designed to motivate notable change. The metric can help operators to be initiative-taking agents of change, capable of addressing complex challenges in innovative and sustainable ways. Knowing the transformative capability can provide a roadmap for regulatory compliance and developing policies promoting PSR. Policymakers can use this information to incentivise power grid stewards to invest in resilience and improving technologies and practices. Transformative metrics assessments may foster disaster preparedness and response plans. This can result in deploying resilient power system infrastructure and implementing more effective emergency response plans. Thirdly, a metric based on the and , the ratio of the recovery rate to the degradation rate, as a way of quantifying the restoration rapidity. For a better acronym, the pronunciation is deliberately left silent. This metric can provide a multidimensional view of the restoration process, giving operators a more comprehensive understanding of the recovery dynamics. These dimensions could be the magnitude of impact, socioeconomic implications, effectiveness of the efficiency of restoration methods, resilience of the system, and recovery threshold identification. The assessment of the restoration rapidity can enable the grid operator to make informed decisions about investments, resource allocation, and emergency preparedness, leading to a more reliable and resilient power delivery for all users. The drive to improve the restoration rapidity can spur innovation, leading to the adoption of modern technologies such as automation, advanced grid analytics, and artificial intelligence (AI)-driven predictive maintenance. These technologies can significantly reduce restoration times by predicting failures before they occur, automating certain restoration procedures and optimising the dispatch of repair crews. Through this parameter, power system operators may develop more effective contingency plans and rapid response protocols, ensuring that power grids and services are restored quickly following a disruption.
3.2. Resilience Indicators and AFLEPT Metric Framework Formulation
Selecting indicators that accurately reflect the existing operational and infrastructure resilience during disruptive events is critical [27]. In this study, which focuses on evaluating the resilience of the power system, especially generators and transmission lines to the TCA, the following indicators were used:
- The amount of generation capacity, percentage of installed capacity generated, and load demand during the event were used as operational resilience indicators.
- The number of hydroelectric generators and transmission lines were used as infrastructure resilience indicators.
These resilience indicators were then linked to the resilience measures using the AFLEPT metric. The measuring units and their mathematical formulations are presented in Table 2. The variables in Table 2 are from Figure 2. Although other previous studies, such as [9], indicate that damages to the distribution network cause power outages, the transmission network has a significant impact because more MW are interrupted per km of length [3].
Table 2.
Mathematical presentation of resilience metrics [27].
3.3. AFLEPT Metric Framework and Resilience Capacities
The power system is considered resilient if it (i) degrades at a slower rate (absorptive capacity), (ii) does not lose a huge capacity (absorptive capacity), (iii) does not stay degraded for long (adaptive capacity), (iv) goes back to its pre-event status as quickly as possible (restorative capacity), and (v) takes a shorter time to recover than it took to degrade (restorative capacity). The power system is also considered to possess the following:
- A preventive capacity if the power system model has some redundancy and an adequate alternative generation capacity (has an adequate reserve). . Based on the N-1 security principle, an adequate generation reserve was considered to correspond to the capacity of the Kapichila Power plant, which was exposed to tropical cyclones and was washed away.
- An absorptive capacity if the slope of degradation is not too steep () and the power system does not lose more than 50% of its capacity (functionality). In the absence of accurate data on the number of critical loads, and due to complex network connections, it was assumed that 50% of functionality would supply most critical loads, considering that most grid customers are essential. The demand (priority) consumption for 2020 was 44% of the total consumption [62].
- An adaptive capacity if the power system does not stay long in the post-event degraded state. The UK Standards of Performance set how quickly power should be restored following a disruption, varying from 24 to 48 h in extreme weather [63,64]. Its duration in a degraded state after 24 h for operational indicators and 48 h for infrastructural indicators were considered exceedingly long in this case.
- A restorative capacity if the rate of recovery is higher than the rate of degradation; that is, if the ratio of the recovery rate to the degradation rate is at least equal to 1.
- A transformative capacity if the system functionality or capacity is increased after a complete restoration. It was expected that after the event, resilience indicators should show a positive change (increase), i.e., infrastructure capacity indicators to increase by and operational indicators at the end of the event to be greater than before the event.
3.4. Linking the AFLEPT Metric and Resilience Capacities
Table 3 shows the interlinking of the AFLEPT metric to resilience indicators and capacities. Each resilience indicator is linked to AFLEPT metrics corresponding to different resilience capacities. The preventive capacity is matched to the α metric. The absorption capacity is associated with the Φ and Λ metrics; thus, how fast the resilience indicator drops and how low it drops depends on the ability of the power system to absorb or withstand the shocks. How long the system stays in the degraded state, E, depends on the capacity of the system to adjust, recover, and adapt to disturbances. This capacity can be a function of technological, organisational, human, and regulatory factors. How fast restoration takes place, Π, and the ratio of restoration to degradation rates, Π/Φ, are associated with the restorative capacity. The transformative capacity is associated with Ƭ. An increase in infrastructure can indicate a transformative capacity, especially when it aligns with strategic goals to adapt or anticipate future challenges. Infrastructure development can be both a driver and a manifestation of a transformative capacity in technological advancement. However, infrastructure development alone is not a comprehensive measure of a transformative capacity as distinct factors must be considered.
Table 3.
Linkage of resilience indicators, AFLEPT metric framework, and resilience capacities.
3.5. Power System Model and Simulation Data
As of November 2022, Malawi’s power system consisted of 172 buses operating across different voltage levels: 400 kV, 132 kV, 66 kV, 33 kV, 11 kV, and 0.4 kV. There were 67 transmission lines with a total length of about 2683 km. The transmission voltage ranges from 33 to 400 kV. In total, 59 lines fall within the 66 to 400 kV voltage levels. The electricity network is shown in Figure 3, which was provided by the grid operator, but modified to show only two voltage levels. The system includes the generation, transmission, distribution, and load centres. Information about generation facilities, including their capacities, locations, and technical details, are presented in Table 4. Power system upgrades, such as an additional generation capacity and transmission line upgrades, could have been made from the data collection date, which were not included in this analysis.
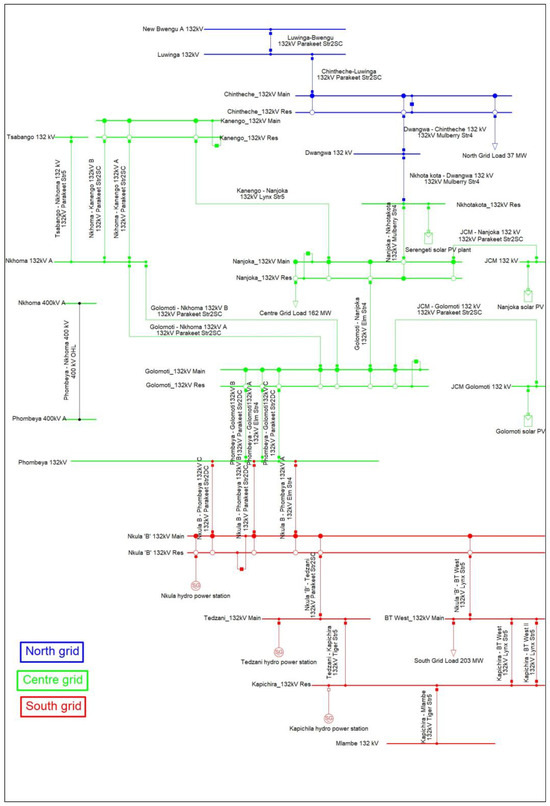
Figure 3.
Power system model.
Table 4.
Generation facilities: names, types, capacities, and locations. Data source [65].
The system comprises 55 load centres: 14 in the north, 22 in the centre, 18 in the south, and 1 in the generation section. For this analysis, capacitor banks at Nanjoka, Kanengo, Chintheche, and Karonga were switched on. The Grid Operator and the electricity generating company (the Generator) provided the model parameters. The model was validated by the Grid Operator, who is the custodian. The power system model features only two transmission voltage levels for demonstration purposes (although the analysis used all the available voltage levels) in Figure 3. Furthermore, the regional loads were consolidated into three aggregated loads, each assigned to a specific area to simplify the representation of all regional loads. The generators are also a consolidation of all individual generating units within each power station. The colour codes present the standard colours used by the grid operator: red for the south grid, green for the centre grid, and blue for the north grid.
To establish the correct network performance data to use, an extreme event which affected the network’s resilience was identified (unpublished work) since the grid is exposed to multiple disasters, as highlighted in the introduction. Historical disaster data were loaded into the quantum geographical information system (QGIS) to map the grid elements exposed to several disasters. The impacts of recent climate change are not captured in the historical data and there may be new areas at risk that have not yet been identified. Tropical cyclones, which are associated with rainfall and wind intensities, were identified as a severe resilience threat based on their physical damage and economic impact (damage losses, recovery costs, and reconstruction costs). Threat characterisation is not the scope of this work. However, the information was used to determine the temporal scale of power system performance data. The TCA hit Malawi from 22 to 31 January 2022. Therefore, the power system performance data during the 2022 TCA was requested from the grid operator, which had inherent disaster damage impact characteristics. Since the power system performance data were historical, the impact of damage was inherent in the actual performance data. Historical generation and load profile data were collected for January and February 2022 to represent power system performance data before, during the event, and after the event, at one (1) hour resolution. The most ideal case would be to analyse the performance for different types of cyclone disasters or other equally disturbing events. Due to data availability challenges, the practical approach was using 2022 TCA data, which limit the generalisation of the findings. However, the 2022 TCA was validated by the grid operator as the worst grid event in the history of the network [17], which provides a basis for resilience planning. While using historical data provides actual system performance, historical-based analyses may lead to incorrect assessments and possibly inadequate resilience improvement approaches.
Since the focus is on assessing the impact of cyclones on the power system (transmission network), the cyclone fragility curves of steel transmission towers only under wind and rain loading are presented in Figure 4. These curves were constructed based on the researcher knowledge of historical data on transmission line failures and weather conditions. Historical cyclone damage data were used to establish fragility and breakoff points to validate or assess the physical impact of cyclones on the infrastructure. The curves were fitted proximally in Excel according to Fu and others [66], where fragility curves for transmission towers under combined wind and rain intensities were modelled. While proxy fitting is faster and simpler than direct fitting, it may introduce inaccuracies, which is a limitation. Unlike in Fu and others [66], this study’s curve was shifted to the left based on the actual failure data from the Electricity Supply Corporation of Malawi (ESCOM) in Blantyre [67]. The curve shifting also demonstrates that fragility curves are not the same, even for the same structures, which can be due to different reasons, including where the structures are located and the standard of construction. Hence resilience enhancement measures need to be context-based. However, within the transmission system in Malawi, there are some wooden structures. The curve from Figure 4 was used in all cases. The implication of this is that a lower probability of failure is likely to be estimated for wooden structures. This will have a negligible impact on the conclusions because the assessment used actual historical power system performance data where the actual probability of failure is inherent. Otherwise, the generic fragility curve of Figure 5 is used for the hydropower-generating power plants.
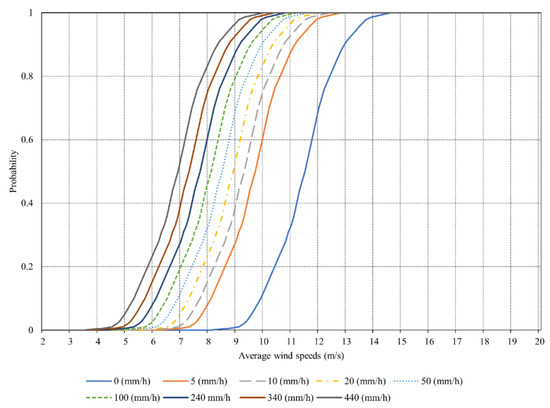
Figure 4.
Multi-hazard fragility curves of transmission lines. Data sources [67,68,69].
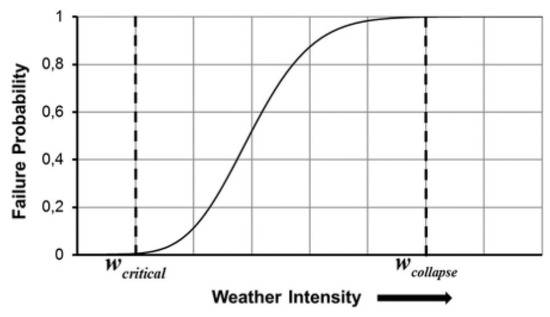
Figure 5.
Generic fragility curve. Source [27].
3.6. Quasi-Dynamic Simulation (QDS)
A QDS was used to analyse the historical performance of the power system. The QDS toolbox in DigSILENT® PowerFactory executes medium-to-long-term simulation studies. This simulation performs multiple load-flow analyses using user-defined, configurable time-step increments to assess the network state over time. The tool is designed for planning studies that establish a long-term load and generation profiles with network changes simulated through operational variations and staged expansion upgrades [70]. QDS uses the concept of state variables, which are defined by their time derivative equations, as it is the case for time-domain simulations [71]. The key advantage of QDS is its ability to provide insights into the system behaviour over time, making it invaluable for planning and operational analysis in the face of changing system conditions and renewable integration challenges. This was completed in DIgSILENT PowerFactory 2023 model SP5 (×4) with 250 nodes.
The simulation process is shown in Figure 6. The configuration of the simulation data included importing the time series load and generation profile data from external files. System scenarios, which consisted of the load data, generation data, and topology, were loaded into PowerFactory (PF). The power system model of Figure 3 was set up in PF and was validated by the grid operator and a PF expert. The model’s initial setup included verifying all the grid elements and their associated parameters. The result variables (resilience indicators) were then defined, followed by scenario and variation management. Scenarios included light and peak loads and Shunts ON or OFF. Variations had networks representing the system profile before and during the event, during the recovery phase, and after the restoration. Running the QDS initially involved load flow configuration by setting up the Newton–Raphson method (power equations, classical) as a calculation method, time series simulation, and definition of simulation parameters. A balanced AC, positive sequence load flow with a 1 h step size was used. The simulation was run for a defined time scale of the format dd.mm.yyyy hh.mm.ss, corresponding to pre-defined variations. Time-dependency states of models and simulation events were considered. Relevant monitored features (resilience indicators) were extracted and stored. The resilience metrics were calculated based on mathematical formulas in Table 2. Extracted resilience indicators were plotted, showing the performance of the power system before, during, and after the TCA. From the plots, statistical values such as the pre-disturbance system state, slope of degradation and recovery, duration in the degraded state, and extent of functionality decrease were identified using mathematical equations in Table 2. The limitation of using an average value is that a linear relationship is assumed when the actual relationship is non-linear.
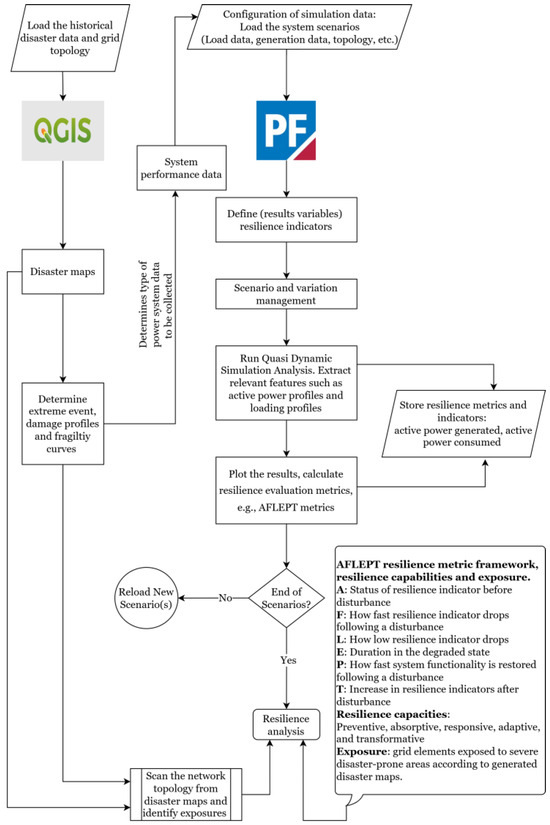
Figure 6.
Simulation process.
Determining the resilience status (resilience analysis) considers the results of the calculated AFLEPT metrics, resilience capacities (as explained in Section 3.3), and the network exposure to disasters as based on the disaster mapping of the network topology, which was carried out in the QGIS. Knowledge of network exposure also helps in resilience improvement planning, as was proposed by Chivunga [72]. These disaster maps were assessed (scanned) to identify exposures that predispose the network, thereby compromising its resilience capacities. Since the resilience capacities were also used in this analysis, damage profiles and grid exposure to disasters were also used in decision making.
The methodology discussed in this paper can be transferable to other counties with similar infrastructural challenges such as Mozambique and Madagascar, even though they are location-specific [34]. For example, although Mozambique, Malawi, and Madagascar may be exposed to the same tropical cyclones, they may have a different infrastructure and operational capabilities, which may determine how low resilience indicators drop and the speed with which restoration takes place. As the scope of this study, limitations, type of data, and validation methods were acknowledged, the methodology should be adapted in other countries after addressing the identified challenges. Specifically, for Malawi, data availability was the biggest challenge. Otherwise, the generalisation of the findings would be ideal if a system performance over a longer period was conducted, performance data for all the tropical cyclones were used, or a comparative analysis of the impact of the same tropical cyclones for different countries was performed. This presents an area of further study.
3.7. Simulation Software
There are different power system analysis tools, such as DIgSILENT PowerFactory (PF) 2023 model SP5 (×64), PowerWorld, ETAP, PSCAD, SimPowerSystem, PSS/E, NEPLAN, WindMil, GE PSLF, PSAF, ATP-EMTP, SPICE, CAPE, EDSA, ASPEN PLEXOS, RTDS Simulator, and EasyPower [73,74]. Although DIgSILENT PowerFactory (PF) is comparable to ETAP and PLEXOS (used by the National Grid) in terms of the number of buses, packages, and functions, DIgSILENT PowerFactory (PF) 2023 model SP5 (×64) with 250 nodes was used in this research to observe the power system’s behaviour. However, DigSILENT was not compared with these tools for QDS. This tool was selected because it is used by the Malawi grid operator, providing a platform for comparable results that reflect the network’s actual behaviour. However, exploring other novel network calculation tools would benefit the operator and justify the selection of DigSILENT for validation. The project started with the 2021 model, and the license was upgraded to the latest 2023 software version.
4. Results and Discussion
4.1. Obtaining Time-Dependent Resilience Indicators and AFLEPT Metric Framework
4.1.1. Amount of Hydroelectric Power Generated (MW) and Consumed (MW)
Figure 7 shows the power system performance during the TCA, thus, the amount of hydroelectric generation capacity and consumption in MW. The consumption is shown as the total load (red), which is categorised into consumption for the south, centre, and north grids. It also shows a considerable disturbance where the power system faced a total shutdown following the TCA between 22 and 31 January 2022. It depicts a resilience phase before, during, and immediately after a disaster. The shape is a resilience trapezoid, which is consistent with that of Jefferson County’s utility during Hurricane Harvey [33], suggesting that the findings could be transferable. A complete system shutdown is consistent with the Indian power system experience during the Super Cyclone Amphan, although only major stations experienced it [59]. During the 2019 TCI, the 533 kV Mozambique–South Africa HVDC link line 2 was completely down, reducing the power transmission on the HVDC by 43 percent [75]. The disruption depicts a resilience trapezoid [37]. Unlike the trapezoids in the literature [27,29], the resilience trapezoids presented in this work show a steep resilience degradation slope, like the system load loss resilience trapezoids in [7]. The average active power values for generation and consumption after the event are lower than before, indicating that the system did not return to its pre-event status. As opposed to many reported resilience trapezoids, successive disturbances were observed after the recovery, indicating additional trapezoids. This is because the generation capacity was reduced by approximately 130 MW due to the damage of the Kapichila hydropower plant, as shown in Section 4.1.2, suggesting that only 82% of the generation was restored, and any contingency in the power system caused system disturbances. During the TCI, the tripping of the HVDC link caused the successive tripping of the central interface corridor between Zimbabwe and Botswana due to undamped power oscillations [75]. This demonstrates that non-resilient or vulnerable systems can produce multiple resilience trapezoids following one extreme event. Double-resilience trapezoids were observed in [27] following two successive windstorms. Active power loss was highest during recovery because although some generation was restored, other lines were not.
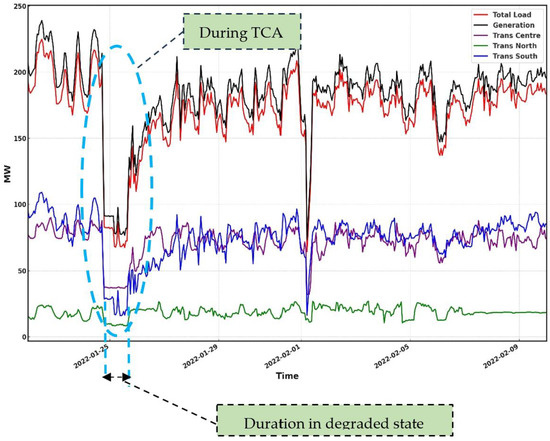
Figure 7.
Active power generation and consumption, and transmission grid operational power flow from 22 January to 10 February 2022. Data sources [76,77].
Immediately after the event, the system suffered severe disturbances on 1 February and another disturbance on 6 February 2022, especially in the south, due to high voltage challenges and frequency instability. The south grid suffered the worst degradation and had a slower recovery rate than other grids. This is consistent with [60] where the cyclone trajectory influenced the number of damaged towers and the population associated with corresponding substations. Although the south grid suffered the worst degradation, the north grid stayed longer in the reduced functionality state than the south grid. Under system disturbances, the north is usually disconnected from the centre (Nanjoka substation) until the system is stable again.
The operational resilience indicators, as shown in the performance curve of Figure 7, were associated with the variables of the AFLEPT metrics, as shown in Table 5. The rate of active load recovery was approximately six times lower than the degradation rate. In comparison, the rate of generation recovery was about three times lower than the generation degradation rate. The lower recovery rate is in line with that of the India power system [59], GB test system [27], Minnesota power system [30], and the Southern African electric power grid [75]. It took up to 48 h to restore the loads in Odisha and Bengal in India following Super Cyclone Amphan. While the recovery time was reduced due to the early movement of spares and towers in Odisha, it was delayed in Bengal due to a communication breakdown. On the GB test system, a recovery rate up to nine times lower than the degradation rate for the highest simulated speed was observed. It was assumed that one repair crew was required for each collapsed transmission corridor, which introduced a restriction on the number of corridors that could be repaired at the same time. In the Minnesota power grid, the recovery rate was the same as the degradation rate, although up to 5 percent of loads were disconnected. This could be attributable to the shortest assumed fault duration of 2 h only. During the 2019 TCI, it took up to 106 h to restore the power transmission on the tripped HVDC link line 1 due to severe weather. The repair crew could not inspect faulted lines because of broken bridges and severe flooding. The active power lost in the first hour was 41.27 MW for the south and centre grids and 6.55 MW for the north grid. The total active power lost represents 40% of the rated active power for the south grid and 36% for the centre and north grids. This is comparable to the 50% reduced demand faced by the Indian power system during the 2020 Super Cyclone Amphan [59]. In other studies, operational resilience indicators reduced by 5 percent in the GB test system [27] and Minnesota power system [30], 29 percent in the Texas electricity system [31], and 43 percent in the Southern African electric power grid [75].
Table 5.
January–February 2022 operational resilience indicators.
4.1.2. The Number of Transmission Lines Brought Down and Hydroelectric Generators out of Service
The number of hydroelectric generators out of service and transmission lines brought down during the TCA were visualised in the inverted resilience trapezoid presented in Figure 8 and Figure 9, respectively. All these are in the southern region, specifically along the Tropical Cyclone trajectory, which is consistent with [60]. From Figure 9, up to five transmission conductors were brought down, representing 8 percent of transmission conductors as of November 2022. Although only 8 percent were brought down, these transmit power to significant load centres like Mlambe, Fundis Cross, and Mapanga that do not have alternative supply routes. Figure 10 presents pictures of collapsed transmission towers in Chikwawa, Thyolo, and Blantyre, some of the districts in the southern region. The inverted resilience trapezoids indicate that while generator loss was maximum on day three of the event with the highest rainfall intensity, transmission line loss was observed on day four with the highest wind intensity. Hydro-based generators are vulnerable to flooding during a cyclone event, while transmission lines and towers are vulnerable to high winds.
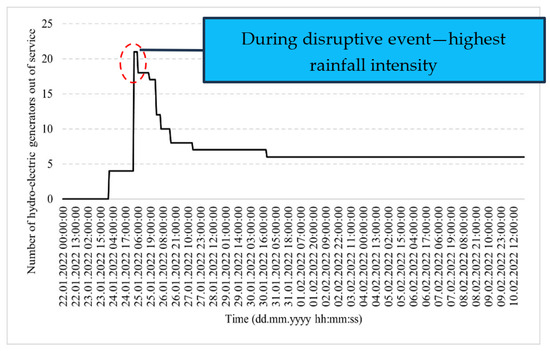
Figure 8.
The number of hydroelectric generators out of service during a TCA. Data source [76].
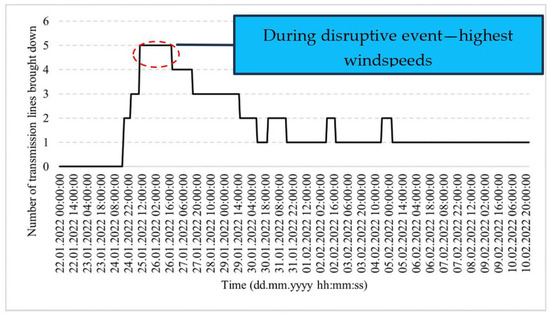
Figure 9.
The number of transmission lines brought down during a TCA. Data source [67].
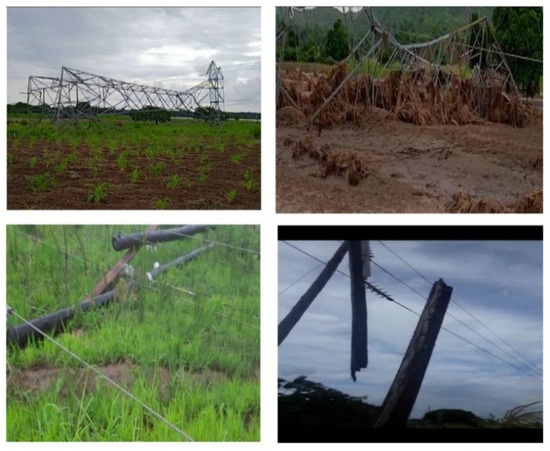
Figure 10.
Selected transmission infrastructure physical damages caused by TCA [67].
The loss of transmission infrastructure compares with effects of the Super Cyclone Amphan in India [59], simulated windstorms on the GB test system [27], snowstorms on Minnesota power system [30], Winter Storm Uri on the Texas electricity system [31], and the TCI on the Southern African electric power grid [75]. In India, 29 lines tripped and six major substations along the cyclone’s direct path faced total shutdown. The percentage of these lines is small compared to Malawi’s case, but their outage resulted in an 80 percent reduction in the connected load. In a GB test system, up to 25 percent of transmission lines and 12 percent of generators tripped. This, however, may not be a true reflection of an actual GB system, given the differences in the actual windspeeds. Approximately 4 percent of feeder circuits experienced faults in Minnesota, leading to losing 5 percent of the connected load. During the 2019 TCI, a tower on the 533 kV HVDC link connecting Mozambique and South Africa collapsed, which led to a reduction in the power transmission of 43 percent. However, the Mozambique–South Africa HVDC link had a parallel redundant line which made it possible to continue supplying power, although at a reduced capacity.
The 2022 TCA washed away (damaged) the Kapichira generation power station dam, which caused a loss of 130 MW, as shown in Figure 11 [78]. The TCA also damaged T&D structures, causing power outages in the Chikwawa, Nsanje Mulanje, Phalombe, Machinga, Zomba, Thyolo, Mwanza, and Mangochi districts, as shown in Figure 10.
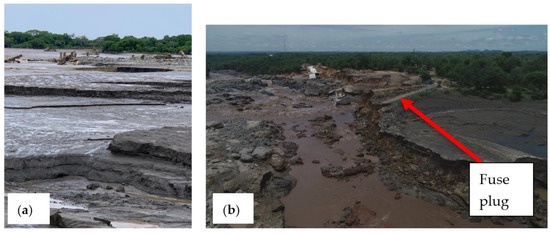
Figure 11.
Impacts on 2022 TCA on Kapichira hydropower station. (a) Extensively damaged dike and (b) completely washed away fuse plug. Source [79].
The infrastructural resilience indicators, as shown in the inverted performance curves of Figure 8 and Figure 9, were associated with the variables of the AFLEPT metric, as shown in Table 6. Table 6 presents the infrastructural performance during the 2022 TCA. It took up to 16 months to restore the hydro-based generation to its pre-event status. While 82% of generation was fixed within 24 h, some load centres could not be supplied until after 587 h (24.5 days). During the 2020 Super Cyclone Amphan in India, the whole system was restored by 48 h [59]. The system was restored quickly because of proper planning, which involved the early movement of emergency restoration system towers to strategic locations.
Table 6.
Infrastructural resilience indicators.
4.2. AFLEPT Metric and Resilience Capacities
The power system does not have all the capabilities. Table 7 summarises how the resilience capacities are linked with the AFLEPT metric and the associated indicators. Preventive ability: About 51 percent of the installed capacity was generated before a severe event, leaving no adequate generation reserve in case of generation loss. With the outage of the Kapichila power station (120 MW) because of the TCA, the remaining installed capacity could not support the maximum demand, leading to massive load shedding. The model shows partial redundancy. The north grid is easily disconnected from the Nanjoka substation. The breakage of the Nanjoka–Nkhotakota line renders the whole north without a supply. In addition, the south and centre grids show ring networks through the BT West and Nanjoka substations, respectively, while the north does not. Arguments could concern the economic advantage of ring networks in the north grid. However, some parts of the south and centre would have resilience advantages with ring networks, considering how exposed the southern region is to disasters. Ring networks are inherently disruption-tolerant. If a disturbance strikes in one part of the system, power can be redirected through alternative routes, restricting the impact of the disruption, and decreasing the lost time for customers. All the generations in the south are cascaded in one river, which is exposed to tropical cyclones’ impacts. The river is also at risk because of recurrent droughts. Overdependence on one river shows a lack of a preventive capacity.
Table 7.
Linking the resilience capacities with the FLEP metric and associated indicators.
Absorptive capacity: The significant degradation rate for the operational and infrastructural indicators shows a lack of an absorptive capacity. The rate at which active power generated or consumed decreases is steep. Although the rates at which hydroelectric generators were lost or transmission lines were brought down were less than 1, the generator loss went up to 100%, representing a severe impact. Similarly, while the transmission lines brought down were only 8% of the installed transmission capacity, these lines supplied major load centres, representing approximately 33% of affected grid-connected customers. Populations affected were used as a performance of the network under cyclone events in India [60]. Furthermore, substantial operational and infrastructure degradation (a functionality decrease of more than fifty percent) indicates a lack of an absorptive capacity. As the load loss followed the generation loss, this stated the system’s incapability to contain the generation loss. Also, hydroelectric generators and some transmissions lines that were brought down indicate a lack of an infrastructure capacity to withstand the impacts of tropical cyclones.
Adaptive capacity: Both operational and infrastructure flexibility are lacking. It took up to 23 h to restore most of the lost load. Although this was less than the targeted duration (24 h), not all the load was restored within the 24 h window. Although 82 percent of hydro-electric generation was restored within the 24 h window, some load centres could not be supplied due to degraded transmission and distribution infrastructures, which took up to approximately 25 days. Furthermore, it took up to 16 months to restore the hydroelectric components that were washed away by the floods. Prolonged recovery times are a resilience setback. Delayed recovery was consistent with the impacts of Hurricane Maria on Puerto Rico’s electricity system in 2017, where transmission capacity recovery reached just 20 percent within the first month, with full system restoration requiring over twelve months [80].
Restorative capacity: The restoration or recovery rates were slower than the degradation rates, demonstrating a lack of ability to restore the functionality as quickly as possible. In addition, the recovery rate to the degradation rate is less than 1, thus lacking the ability to regain the generation or load loss and components. A survey conducted at the Grid Operator suggested that one of the major causes for the lack of restorative capacity was/is financial constraints. The damaged parts were restored using emergency restoration funding from the World Bank [81].
Transformative ability: The unavailability of increased changes in operational or infrastructural indicators shows a lack of a capacity for changes. The AFLEPT metric could not be used to estimate preparedness because qualitative indicators were used. The AFLEPT metric is limited, especially when using a QDS to extract the metrics for some indicators that do not have definite patterns.
The above discussion reveals weaknesses in resilience that need to be addressed. Notably, the resilience weaknesses are complex, ranging from operational to infrastructural. Infrastructural weaknesses are mainly from an underdeveloped energy infrastructure which leads to generation and transmission capacity inadequacy, overdependence on hydroelectric generation, obsoleteness, and non-redundancy. The operational challenges that were identified according to Chivunga and others [17] included, but were not limited to, a lack of institutional freedom to make independent decisions without the political stronghold, political will, financial and response resources (such as repair and restoration), resilience management systems (e.g., guidelines, plans, frameworks, and policies), anticipatory skills (e.g., damage estimation for proactive decision making), and unfavourable office procedures which, among other things, delay the supply chain. A detailed discussion of operational resilience weaknesses concerning Malawi’s grid can be read from [17]. The national energy policy (NEP) of 2018 [82] provided for the development of the energy sector. However, the study by Chivunga and others [83] established that NEP failed to achieve these due to political interference, financial constraints (because the policy is not adequately funded), poor policy administration (leading to the formulation of unachievable targets and a lack of policy monitoring), a lack of statistical energy data (which could be the reason for over ambitious targets), incapacitation of the ministry of energy (MoE) who are custodians of NEP, and a lack of coordination with key stakeholders. Thus, addressing these challenges requires multidimensional measures including structural, operational, and regulatory resilience enhancement measures, which were discussed by Chivunga and others [84].
4.3. Resilience Enhancement
Grid resilience enhancement strategies serve two primary objectives: (1) minimising the immediate impact severity of extreme weather events and (2) expediting recovery timelines to restore grid functionality to pre-event operational levels [21,85]. Grid enhancement is categorised into two distinct approaches: infrastructural (physical hardiness) and non-structural (operational capability) [86]. Infrastructural enhancements aim to mitigate the magnitude of the disruptions, and non-structural (or operational) strategies focus on expediting restoration timelines or enhancing operational functionality [21].
4.3.1. Infrastructural Resilience Enhancement
Grid-hardening measures are usually employed long before the onset of an event [87]. These grid improvement measures aim to reduce the magnitude of the impact either through robust infrastructure that withstand threats or alternative supply options such as diversified generation supply sources or redundant transmission infrastructure. In this work, these measures are classified according to the power system components that they improve, namely generation, lines, and substations, as shown in Figure 12.
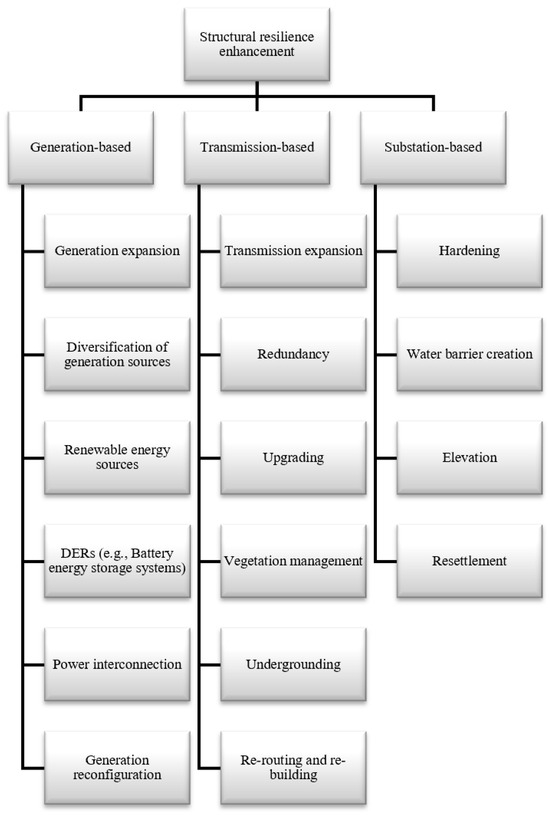
Figure 12.
Summary of structural resilience enhancement measures.
Generation structural enhancement measures usually involve generation expansion, which may thwart mitigation endeavours [88]. For example, coal-fired power plants may increase the generation capacity, but they will increase energy-related emissions. Nonetheless, whichever resource type is used, network expansion provides operational flexibility, which contributes to preventing cascading failures [43] and enhances frequency stability [89]. A network which has an adequate generation capacity manages the supply and demand imbalance-related operational challenges. However, ref. [13] argued that capacity expansion does not significantly improve resilience under tropical cyclones, based on a potential demand increase. As hydro-dominated power systems are severely affected by climatic disasters such as floods and droughts [90], other generation enhancement measures, which include diversification [91], increasing the capacity of renewable energy sources [90], distributed energy resources (DERs) [91,92], and power interconnection [93,94], may be ideal for specific for hydro-dominated power systems. Diversification is considered one of the resilience indicators [36,95] and provides a resilient transition in case of failures in one type of energy source or electricity supplier. However, the potential for solar, hydroelectric, and geothermal energy diversification to significantly enhance the resilience of Texas’ power grid has faced substantial limitations, hindered by infrastructural bottlenecks, policy constraints, and integration challenges [96], validating the contextual nature of resilience improvement. DERs such as battery energy storage (BES) technologies are deemed vital because they ramp up faster than hydro, provide primary frequency responses in disturbances [97], are widely used to offer backup power during crises, and provide black start services [29].
Transmission and distribution lines improvement includes expansion, redundancy, upgrading, vegetation management, undergrounding, re-routing, and rebuilding. Transmission expansion, upgrading, and redundancy fall under the umbrella of expansion. Expansion could involve constructing more lines to accommodate a growing demand and addition of the generation capacity. Redundancy means adding identical transmission lines either in parallel with existing ones or in alternate routes. Transmission lines are upgraded by improving their design standards, for example, moving their fragility curves to the right, thus increasing the resistance of lines and towers (increasing their breakoff points) [98], for example, replacing concrete and wooden poles with higher-order ones [85,99]. Vegetation management includes trimming trees to avoid falling on lines and granting access to repair crews [85,100]. For example, between 2018 and 2021, about 2.1 percent of Malawi’s electricity grid outage hours resulted from trees falling on lines [101]. Replacing overhead lines with underground is another structural improvement measure from the transmission side. Undergrounding can be selective, full [29,99], or strategic [13]. Selective undergrounding is where specific areas only, as opposed to an entire transmission network, are undergrounded due to several factors including logistical, financial, aesthetic, and environmental, just to mention a few. Full undergrounding can be expensive and time-consuming. Line re-routing, as suggested in [85,99,102], recommended transmission line measures, although the cost of rerouting may be prohibitive [103]. It might be helpful to compare the cost of relocating and making the existing lines more robust to the severe event. While this is helpful, it is to be noted that under certain circumstances, relocation may be more beneficial than strengthening, irrespective of associated costs, especially if it can be life-threatening. Line redundancy is an essential feature in ensuring the stability of power grids [104]. With effective redundancy in place, it is assumed that there will be continuity of supply if one line fails. However, this is possible if the redundant line is not affected by the same disaster.
Substation improvement includes hardening [1], creating a water barrier [105], elevation, and resettlement [85,99,102]. Hardening substations include either constructing substations with stronger materials to withstand any weather-related disasters or improving their design standards. For hydrometeorological disasters such as flooding, water barriers may be created to either block the water from reaching the substations or diverting the water course away from the substations. In addition, flood-related disasters may be mitigated by elevating the substations to be above the highest flood level. However, if hardening water barrier creation and elevation are less favourable solutions, relocating the substations to less prone areas could be ideal, although expensive.
Based on the above discussion and the identified physical resilience weaknesses in Section 4.1 and Section 4.2, Malawi’s grid will benefit from generation and transmission capacity expansion, the diversification of electricity generation in terms of technologies and the generation location, and upgrading wooden transmission infrastructures to cyclone-resistant ones and DERs, especially BES. The effectiveness of transmission line redundancy on Malawi’s grid is demonstrated in [72]. It was demonstrated that transmission line redundancy effectively reduced the amount of energy not supplied. However, it was established that not all lines require redundancy measures. In some areas, the redundant lines would be affected by the same disaster. The only option is either making the lines more robust to the disaster or having alternative supply options such as DERs close to the loads. In addition, although technically feasible, it might not be economical to run redundant lines, especially in areas with low economic activities. This, however, may thwart access for all initiatives. The experience with current grid-connected PVs demerits grid-connected PVs. Grid-connected PVs could work if their connection were controlled and they have a battery bank. In a study by Chivunga and others [17], RE integration was a less favourable structural resilience measure because any disruption in the existing Justin Christian Martin (JCM) PV plants caused grid outages due to frequency variabilities. Nevertheless, extensive grid studies could help identify resilience-oriented optimal integration levels and combinations. Through the Southern African Power Pool (SAPP) agreement, the Malawi national energy policy of 2018 provided for the regional power interconnection to Tanzania, Zambia, and Mozambique. The Mozambican–Malawi (Mo-Ma) interconnector, which will import 50 MW initially, is under construction. The Mo-Ma interconnector passes through a cyclone-prone zone and needs to be robust enough. Interviews that were conducted with the grid operator suggested that contractors used the highest flood level to design the interconnector.
As structural measures are capitally intensive, and this being one of the biggest threats to resilience improvement, one approach would be for the government to make deliberate efforts to fund the energy policy through grants or green bonds. Recently, the World Bank approved a USD 350 m grant to help with the development of the Mpatamanga hydropower plant [106]. Sometimes, the mismatch between political and developmental agendas could be the biggest challenge because the government is run by the political leaders who also have political agendas, which might not align with long-term infrastructure investments as political cycles are 5-year terms.
4.3.2. Operational Measures
The operational measures boost a power system’s observability, controllability, and operational flexibility, especially during high-impact disruptions [43]. This means that with advanced smart technologies, load management, minimisation of active power losses, precise data monitoring, flexible expansion, and integration of RE become easier than without these smart technologies. Effective operating procedures are considered a key climate change adaptation measure [107]. These operating procedures are essential in building resilience because they provide system operators with real-time situational awareness and directive authority to expedite mitigation protocols during high-risk contingencies. This helps lower the extent of loss during extreme events, which is essential in supporting speedy recovery and restoration.
Operational resilience focuses on mitigating disruptions during and immediately following major outages, prioritising reduced customer disconnections and accelerated restoration timelines [98]. For distribution networks, resilience is more effectively enhanced through adaptive automation and dynamic response mechanisms to extreme weather, rather than physical redundancy in energy flow infrastructure [98]. While smart resilience strategies are often considered short-term measures, they provide a cost-effective and simpler implementation compared to structural upgrades [43,108]. Table 8 summarises the selected operational measures, classified into types and techniques.
Distributed energy systems can deliver power to essential local loads and maintain an electricity supply to customers following severe weather events [109]. Different techniques have so far been employed to enhance the operational capacity using these systems, such as BES planning, a full-time scale-enhancement framework, improving their design standards and coordinating the power schedule. BES planning may involve the optimal placement and sizing of BES systems using different objective functions including the maximisation of an uninterrupted supply of critical loads [2]. Ref. [110] considered minimising energy not supplied (ENS) while [111] minimising the load shedding on critical loads and the maximisation of the time that essential loads are being supplied under severe events.
MGs can be used as operational measures through network partitioning to maximise the total internal loads supplied to reduce service disruption for a specific supply and load condition [54], preventive islanding to maximise fault isolation and connection return [112], and well-regulated islandable MGs to allow the changing of the power grid status between normal and contingency statuses [113].
Preventive control actions include risk-based annual pole replacement, by lining up poles based on the reduction in the risk of a supply cut in the distribution system when a pole is reinstated [114]. It may also focus on the optimum organisation of power system dispatches to maximise the safety of the transmission network and the guaranteed continuity of power delivery during disasters [6]. In addition, network reconfiguration and repair crew prepositioning prior to system failure to quicken the expected post-disruption activities are also considered as operational measures [115]. However, in repair crew preposition, the availability of the repair crew and their technical capabilities are assumed.
Strategies for enhancing operational resilience through response measures include shorter repair times [7], responsiveness enhancement [27,28,98], and resource enhancement [27], for example, reducing the time to repair (TTR) with an extension to increasing the number of repair teams. A combination of preventive and emergency responses to minimise the operating costs and load shedding and maximise the power yield of the generator was also claimed to be an operational enhancement technique by [108]. Finally, a full-time scale transmission system improvement framework to spot critical lines and then activate a reaction (e.g., de-icing) and maintain according to importance was proposed in [4].
Artificial intelligence (AI) approaches are engaged to make the electrical network smarter to climate change influences through blackout approximation using the number of impacted customers, load loss, and blackout extent [116]. In addition, online controlling using past experience learning to inform network learning is sometimes used [117]. Furthermore, destruction prediction [118] and a real-time network assessment and control framework [119] can be used. Accurate predictions inform the preparatory decision making that allows a decrease in the outage hours or a drop in the intensity of the impacts.
Advanced and adaptive restoration through critical load restoration [49] and the feeder restoration technique applied MGs with inadequate generation resources to provide for the critical load on distribution feeders following an extreme event. Ref. [120] describes a dual-maximisation of the post-restoration reliability of the restored loads to replace the power distribution to the essential loads in an event of an intense disaster.
Table 8.
Summary of selected operation resilience measures.
Table 8.
Summary of selected operation resilience measures.
| References | Operational Resilience Type | Techniques |
|---|---|---|
| [2] | Distributed energy systems | BES planning |
| [4] | Full-time scale transmission system enhancement framework | |
| [5] | Improving design standards | |
| [6] | Power schedule coordination | |
| [7] | Response | Shorter repair time |
| [117] | Online controlling | |
| [113] | Controllable and islandable MGs | |
| [27,28,98] | Responsiveness improvement | |
| [112] | Proactive islanding | |
| [86] | Design standards upgrade | Resilient substation design |
| [108] | Integration of preventive and emergency response | |
| [49] | Advanced and adaptive restoration | Critical load restoration |
| [120] | Feeder restoration | |
| [110] | BES operation strategy | |
| [111] | BES intelligent control | |
| [54] | Microgrids | Network partitioning |
| [121] | Preventive control | Risk-based annual pole replacement strategy |
| [115] | Network reconfiguration | |
| Crew prepositioning | ||
| [122] | Resilient transmission system designs | |
| [116] | Advanced visualisation and situational awareness systems | Blackout estimation |
| [118] | Damage forecasting | |
| [119] | Real-time assessment and control framework | |
| [123] | Ancillary services | Generation reserve |
| Frequency control | ||
| Voltage control | ||
| Active/reactive power support | ||
| Black start |
In the context of Malawi’s case, the operational enhancement measures are associated with the grid operator’s response capabilities. These operational enhancement measures address the operational challenges that were identified in a study which was conducted on the grid operator by Chivunga and others, whose details are published in [17]. In summary, the challenges affected the preventive, anticipative, absorptive, adaptive, and transformative capacities which unanimously affect how the grid operator responds to severe grid disasters. The operational challenges of Malawi’s grid operator are multifaceted. The operator lacked some tools and technologies such as real-time situation monitoring tools and hazard prediction tools. In addition, there was little coordination with other stakeholders, especially political stakeholders, who were claimed to have a stronghold on the operator, which was believed to be one of the reasons for a lack of operational freedom by the operator to make independent response decisions. Although staff training in short resilience courses was identified as lacking according to the interview responses, the staff were deemed technically capable of responding to field-related challenges. Response ability also depends on a robust grid infrastructure.
Thus, to address these issues, operational needs were established, in addition to identified challenges. Based on the interview question, “What resources would you need (would be required) to reduce the repair/recovery time during disasters?,” experts’ views were solicited. The procedure for soliciting these experts’ views is not the scope of this paper. The resources required by the grid operator to respond to the impacts of shocks quickly were thematically classified into financial, human resource, infrastructural, technological, and recovery needs, as shown in Table 9. All the responses that related to human resources were grouped into human resource needs, while those relating to infrastructure were classified as infrastructural needs. The same was applied to the rest of the classification. Some of these needs directly address the operational challenges highlighted in Chivunga and others [17]. This procedure of needs identification to enhance the operational response is consistent with the guidelines provided in the Emergency Response and Recovery document [124]. Although the guidelines in the Emergency Response and Recovery document are not specific to the power sector resilience, they provide directions for organisations to decide specific recovery structures, which can be technical, financial, legal, or human, based on what suits their needs for particular situations. The guidelines also outline the need for the special deployment of staff and resources in an emergency mode, effective information management, and the preservation of established structures. Thus, the effective enhancement of the operator response also highly depends on the operators’ ability to identify their operational response requirements. This, however, is a learning process, based on past disasters’ negative experiences. The list may not be exhaustive as this was based on historical experiences. New disasters could present new requirements.
Table 9.
Required resources to enhance operator response during disturbances.
Based on past experiences, infrastructural challenges affected the rate of response. Some machines took longer to prepare for black-starting than others. Successful black-starting depends on which machines are available. Some machines required to have some load somewhere, a situation which may not be possible under total grid shutdown. For example, some machines at Nkula A needed to be stopped and started again and some need to be on a load. The process of having to switch OFF and ON again delays the power restoration. Having reliable transmission lines for re-routing power when one line fails was one of the critical identified resources. During a black start, the voltage instability is high because of no-load starting. According to the interview responses, only one line from Nkula to Blantyre was reliable to withstand the voltage fluctuations, suggesting a compromised absorptive capacity. In the event that this reliable line was affected, it took a long time for the operator to transmit power after a shutdown. Not having mechanised equipment to aid restoration works delayed power restoration in most areas, especially when heavy-duty equipment was required. Proper mechanical tools such as cranes to support tower restorations and other heavy lifting would enhance the response. In addition, designating warehouses for critical spares in disaster-prone areas was considered another key resource for a quick response. However, there could be challenges to justify the resources tied in critical spares. Also, sometimes, the disaster impacts surpass the mitigation measures including spare reserves, so having warehouses in disaster-prone centres would only work if the disaster impact were within the planned spares. However, it is to be noted that having these in place does not automatically translate to a quick response as sometimes restoration may be delayed due to bad weather.
The availability of load or damage forecasting tools can enhance anticipatory skills which enhance preparation. With the accurate damage forecast, the right quantity and type of spares would be in place in preparation for impending disasters, reducing the reaction time. Sometimes, a response is delayed due to not being able to identify the fault location since the Supervisory Control and Data Acquisition (SCADA) was not connected to the entire network (from generation to customers). Consequently, time was lost in fault tracing. Advanced fault tracing tools would be necessary for an enhanced response. Advanced communication tools which would monitor and report are also important in response improvement.
Adequate repair crews who are experienced were one of the critical components under consideration. During a grid emergency, the workforce would usually be pooled from less impacted areas to disaster zones to assist with restoration works. However, during that time, the other centres would still be experiencing faults which need the same workforce, delaying a response in those areas. Finally, regarding adequate financial resources, every required resource needs a certain level of financial commitment. Funding is a significant investment required to improve grid resilience [29]. This is consistent with [125], where resilience bonds were used as a flood-resilient infrastructure-financing mechanism. Resilience bonds are financial tools where investors provide initial funding through bond purchases to support resilience projects [125]. The emergency financing facility was assessed in [126], although this was specific for pandemic finance. Therefore, enhancing the grid operator response, in Malawi’s context, requires the provision and availability of infrastructural, technological, recovery, human, and financial resources.
In addition to the need-based operational enhancement measures, based on identified challenges, ensuring resilient operations, resilience management, system security enhancement, laws and regulations development and enforcement, system studies, and staff capacity building were also critical in building overall operator resilience. These were explained in Chivunga and others [84]. The sensitisation of staff and the general public on the economic sabotage of vandalism, the staff’s continuous learning and development, employee training, threat familiarisation by staff, and their respective response measures were considered important operational measures.
5. Conclusions and Future Research Plans
This study proposed an integrated resilience framework for assessing the resilience of electrical grids. The framework integrates the resilience indicators, AFLEPT metrics system, and the five standard resilience capacities to show a comprehensive resilience assessment. Malawi’s real power system, with real power system data, was used as a case study to apply the method by evaluating its resilience to the 2022 TCA. This was run in DigSILENT PowerFactory 2023 SP5 to provide a true picture of the actual system. The active power generated and consumed were used as the operational resilience indicators, while the number of transmission lines brought down and hydroelectric generators out of service were used as the infrastructural resilience indicators. The performance of these indicators over time was observed by running a QDS before, during, and after the TCA. The resilience analysis was performed by comparing the obtained time-dependent indicators with the predefined thresholds. Further, these were evaluated by establishing how the indicators, AFTEPT metrics, and resilience capacities were related. For indicators which fell short of the thresholds and had a decreasing relationship with the AFLEPT metrics and capacities, infrastructural resilience challenges that cause the deficit were identified which informed resilience improvement planning. The results suggest that Malawi’s power system is vulnerable to extreme power system events (tropical cyclones), presenting a state of unpreparedness and a preventive capacity for shocks. The power system could not withstand the impacts of the TCA. Over 50 percent of the grid’s total active power was lost within 24 h, with a degradation rate almost six times higher than the recovery rate. The power system’s lack of flexibility was observed throughout the duration, and the infrastructure remained dilapidated, which led to reduced electricity delivery. The power system stayed for up to 23 h in a reduced functionality state. Up to 100 percent of the hydroelectric power generation machines were rendered out-of-service following the impacts of the TCA. A hydropower plant of a 130 MW capacity was left non-operational for 16 months, representing about 18 percent of the grid generation capacity. About 8 percent of transmission lines, which are key transmission lines supplying major load centres, were brought down, translating to a considerable share of grid-connected customers who were left with no electricity supply. The recovery rate was lower than the degradation rate during the TCA, which thwarts the recovery and restorative priorities. This reduced response capacity could be due to infrastructural and operational challenges, such as (a) an insufficient infrastructure capacity, (b) overdependence on hydro, weak, and aged infrastructure, and (c) the compromised response capacity of the grid operator, which could be due to a lack of repair materials, access to the disaster-hit areas, and a shortage of repair crews and resilience funds. Furthermore, no transformation happened after restoration, following the non-implementation of the national energy policy. The power system lacks the preventive, absorptive, adaptive, restorative, and transformative resilience capacities for power grid enhancement. Consequently, infrastructural and operational (focusing on improving the operator response) resilience improvement measures have been discussed, which aim to address the identified resilience challenges. While the proposed resilience enhancement measures have demonstrated their effectiveness in some studies, future research would benefit from evaluating other grid-hardening measures and economic modelling. Further studies on other grid-hardening measures could include (i) other generation-based enhancement measures such as the extent of generation expansion, the diversification of generation sources, and RE integration for specific resilience goals, and (ii) evaluating the effectiveness of different infrastructural enhancement measures. Economic modelling could include (i) comparing the cost of line rerouting and making the existing lines more robust, (ii) a cost–benefit analysis of different redundant enhancement scenarios to determine which of those would provide economic benefits, and (iii) a cost–benefit analysis of different infrastructural enhancement measures.
Author Contributions
J.N.C.—Conceptualisation, methodology, software, writing—original draft, writing—reviewing and editing, visualisation, validation, data curation, analysis. F.G.-L.—software, validation. Z.L.—supervision, writing—reviewing and editing. R.B.—visualisation, supervision, analysis, writing—reviewing and editing. All authors have read and agreed to the published version of the manuscript.
Funding
This research received no external funding.
Data Availability Statement
The data presented in this study are available on request from the corresponding author due to ethical reasons.
Acknowledgments
The authors thank the Electricity Corporation of Malawi (ESCOM) management for granting them access to conduct this case study. Specifically, we would like to acknowledge Julia Nchilamwela, Charles Kagona, and Christopher Mapata of ESCOM for providing this study with the necessary information. The authors would also like to thank the Commonwealth Scholarship Commission and Schlumberger Faculty for the Future Fellowship for granting the author financial assistance during her studies, of which this work is a part.
Conflicts of Interest
The authors declare no conflicts of interest.
Abbreviations
The following abbreviations are used in this manuscript:
| AFLEPT | Metrics for measuring preventive indicators for anticipating the system status, the frequency of functionality degradation, how low functionality drops, extension in the degraded state, the promptness of recovery, and system transformation |
| TCI | Tropical cyclone Idai |
| TCA | Tropical cyclone Ana |
| TCG | Tropical cyclone Gombe |
| TCF | Tropical cyclone Freddy |
| PSR | Power systems resilience |
| FLEP | Metrics for measuring the frequency of functionality degradation, how low functionality drops, extension in the degraded state, and the promptness of recovery |
| DigSILENT | Digital simulation of electrical networks |
| PF | PowerFactory |
| GB | Great Britain |
| AI | Artificial intelligence |
| MW | Megawatt |
| FC | Full capacity |
| InC | Installed capacity |
| RC | Reduced capacity |
| IC | Increased capacity |
| MWh | Megawatt hours |
| UK | United Kingdom |
| kV | Kilovolt |
| QGIS | Quantum geographic information system |
| ESCOM | Electricity supply corporation of Malawi |
| QDS | Quasi-dynamic simulation |
| AC | Alternating current |
| HVDC | High-voltage direct current |
| T&D | Transmission and distribution |
| BT | Blantyre |
| NEP | National energy policy |
| MoE | Ministry of energy |
| CO2 | Carbon dioxide |
| DERs | Distributed energy resources |
| PV | Photovoltaic |
| JCM | Justin Christian Martin |
| Mo-Ma | Mozambique–Malawi |
| MGs | Microgrids |
| BES | Battery energy storage |
| ENS | Energy not supplied |
| TTR | Time to repair |
| SCADA | Supervisory control and data acquisition |
| RTDS | Real-time digital simulator |
| ETAP | Electrical transient analyser program |
| PS CAD | Power systems computer-aided design |
| PSS/E | Power system simulator for engineers |
| PSLF | Positive sequence load flow |
| SPICE | Simulation program with integrated circuit emphasis |
| CAPE | Computer-aided protection engineering |
| EDSA | Electrical distribution system analysis |
| PSAF | Power systems analysis framework |
| ATP-EMTP | Alternative transients program—electromagnetic transients program |
| ASPEN | Advanced system for power engineering |
References
- Souto, L.; Yip, J.; Wu, W.Y.; Austgen, B.; Kutanoglu, E.; Hasenbein, J.; Yang, Z.-L.; King, C.W.; Santoso, S. Power system resilience to floods: Modeling, impact assessment, and mid-term mitigation strategies. Int. J. Electr. Power Energy Syst. 2022, 135, 107545. [Google Scholar] [CrossRef]
- Nazemi, M.; Moeini-Aghtaie, M.; Fotuhi-Firuzabad, M.; Dehghanian, P. Energy storage planning for enhanced resilience of power distribution networks against earthquakes. IEEE Trans. Sustain. Energy 2020, 11, 795–806. [Google Scholar] [CrossRef]
- Qiu, H.; Gu, W.; Member, S.; Sheng, W.; Wang, L.; Member, S.; Sun, Q.; Wu, Z. Resilience-Oriented Multistage Scheduling for Power Grids Considering Nonanticipativity Under Tropical Cyclones. IEEE Trans. Power Syst. 2022, 38, 3254–3267. [Google Scholar] [CrossRef]
- Zhao, N.; Yu, X.; Hou, K.; Liu, X.; Mu, Y.; Jia, H.; Wang, H.; Wang, H. Full-time scale resilience enhancement framework for power transmission system under ice disasters. Int. J. Electr. Power Energy Syst. 2021, 126, 106609. [Google Scholar] [CrossRef]
- Lu, J.; Guo, J.; Jian, Z.; Yang, Y.; Tang, W. Resilience assessment and its enhancement in tackling adverse impact of ice disasters for power transmission systems. Energies 2018, 11, 2272. [Google Scholar] [CrossRef]
- Yan, M.; Ai, X.; Shahidehpour, M.; Li, Z.; Wen, J.; Bahramira, S.; Paaso, A. Enhancing the Transmission Grid Resilience in Ice Storms by Optimal Coordination of Power System Schedule with Pre-Positioning and Routing of Mobile DC De-Icing Devices. IEEE Trans. Power Syst. 2019, 34, 2663–2674. [Google Scholar] [CrossRef]
- Yang, Y.; Tang, W.; Liu, Y.; Xin, Y.; Wu, Q. Quantitative Resilience Assessment for Power Transmission Systems under Typhoon Weather. IEEE Access 2018, 6, 40747–40756. [Google Scholar] [CrossRef]
- Liu, X.; Hou, K.; Jia, H.; Zhao, J.; Mili, L.; Jin, X.; Wang, D. A Planning-Oriented Resilience Assessment Framework for Transmission Systems under Typhoon Disasters. IEEE Trans. Smart Grid 2020, 11, 5431–5441. [Google Scholar] [CrossRef]
- Ouyang, M.; Dueñas-Osorio, L. Multi-dimensional hurricane resilience assessment of electric power systems. Struct. Saf. 2014, 48, 15–24. [Google Scholar] [CrossRef]
- Watson, E.B.; Etemadi, A.H. Modeling Electrical Grid Resilience under Hurricane Wind Conditions with Increased Solar and Wind Power Generation. IEEE Trans. Power Syst. 2020, 35, 929–937. [Google Scholar] [CrossRef]
- Mahzarnia, M.; Moghaddam, M.P.; Haghifam, M.-R. A novel three-stage risk-based scheme to improve power system resilience against hurricane. Comput. Electr. Eng. 2021, 93, 107309. [Google Scholar] [CrossRef]
- Government of Malawi. Malawi 2023 Tropical Cyclone Freddy Post-Disaster Needs Assessment; Department of Disaster and Management Affairs (DoDMA): Lilongwe, Malawi, 2023. Available online: https://immalawi.org/documentsviewer/Tropical%20Cyclone%20Freddy%20Post%20Disaster%20Needs%20Assessment%20Government%20of%20Malawi%20%20April%202023/645dd92e6a214409852edbb9 (accessed on 22 June 2023).
- Feng, K.; Ouyang, M.; Lin, N. Tropical cyclone-blackout-heatwave compound hazard resilience in a changing climate. Nat. Commun. 2022, 13, 4421. [Google Scholar] [CrossRef] [PubMed]
- Chitawo, M.L. Diversifying Power Generation; Malawi National Energy Conference, Salima; Renewable Energy Industries Association of Malawi (REIAMA): Lilongwe, Malawi, 2023. [Google Scholar]
- Maravi Express. Over K18bln Needed to Restore 32% of Power Lost from Kapichira due to Cyclone Ana. 2022. Available online: https://www.maraviexpress.com/over-k18bln-needed-to-restore-32-of-power-lost-from-kapichira-due-to-cyclone-ana/ (accessed on 8 February 2022).
- Nation Online. A Dark, Disastrous Night After Storm Ana. Nation Online. 2022. Available online: https://www.mwnation.com/a-dark-disastrous-night-after-storm-ana/ (accessed on 8 February 2022).
- Chivunga, J.N.; Lin, Z.; Blanchard, R. Critical infrastructure organisational resilience assessment: A case study of Malawi’s power grid operator. Electr. J. 2024, 37, 107427. [Google Scholar] [CrossRef]
- Government of Malawi. Malawi 2015 Floods Post Disaster Needs Assessment (PDNA) Report. 2015. Available online: https://www.gfdrr.org/sites/default/files/publication/pda-2015-malawi.pdf (accessed on 4 October 2021).
- Holling, C.S. Resilience and stability of ecological systems. In The Future of Nature: Documents of Global Change; Yale University Press: New Haven, CT, USA, 2013; pp. 245–256. [Google Scholar] [CrossRef]
- Hosseini, S.; Barker, K.; Ramirez-Marquez, J.E. A review of definitions and measures of system resilience. Reliab. Eng. Syst. Saf. 2016, 145, 47–61. [Google Scholar] [CrossRef]
- Jufri, F.H.; Widiputra, V.; Jung, J. State-of-the-art review on power grid resilience to extreme weather events: Definitions, frameworks, quantitative assessment methodologies, and enhancement strategies. Appl. Energy 2019, 239, 1049–1065. [Google Scholar] [CrossRef]
- Martin-Breen, P.; Anderies, J.M. Resilience: A Literature Review. 2011. Available online: https://opendocs.ids.ac.uk/articles/report/Resilience_A_Literature_Review/26441968?file=48186541 (accessed on 21 July 2022).
- Mahzarnia, M.; Moghaddam, M.P.; Baboli, P.T.; Siano, P. A Review of the Measures to Enhance Power Systems Resilience. IEEE Syst. J. 2020, 14, 4059–4070. [Google Scholar] [CrossRef]
- Rahi, K. Indicators to assess organizational resilience—A review of empirical literature. Int. J. Disaster Resil. Built Environ. 2019, 10, 85–98. [Google Scholar] [CrossRef]
- Raoufi, H.; Vahidinasab, V.; Mehran, K. Power systems resilience metrics: A comprehensive review of challenges and outlook. Sustainability 2020, 12, 9698. [Google Scholar] [CrossRef]
- Ahmadi, S.; Saboohi, Y.; Vakili, A. Frameworks, quantitative indicators, characters, and modeling approaches to analysis of energy system resilience: A review. Renew. Sustain. Energy Rev. 2021, 144, 110988. [Google Scholar] [CrossRef]
- Panteli, M.; Mancarella, P.; Trakas, D.N.; Kyriakides, E.; Hatziargyriou, N.D. Metrics and Quantification of Operational and Infrastructure Resilience in Power Systems. IEEE Trans. Power Syst. 2017, 32, 4732–4742. [Google Scholar] [CrossRef]
- Panteli, M.; Trakas, D.N.; Mancarella, P.; Hatziargyriou, N.D. Power Systems Resilience Assessment: Hardening and Smart Operational Enhancement Strategies. Proc. IEEE 2017, 105, 1202–1213. [Google Scholar] [CrossRef]
- Hossain, E.; Roy, S.; Mohammad, N.; Nawar, N.; Dipta, D.R. Metrics and enhancement strategies for grid resilience and reliability during natural disasters. Appl. Energy 2021, 290, 116709. [Google Scholar] [CrossRef]
- Kemabonta, T.; Mowry, G. A syncretistic approach to grid reliability and resilience: Investigations from Minnesota. Energy Strategy Rev. 2021, 38, 100726. [Google Scholar] [CrossRef]
- Kemabonta, T. Grid Resilience analysis and planning of electric power systems: The case of the 2021 Texas electricity crises caused by winter storm Uri (#TexasFreeze). Electr. J. 2021, 34, 107044. [Google Scholar] [CrossRef]
- Mujjuni, F.; Chivunga, J.N.; Betts, T.; Lin, Z.; Blanchard, R. A Comparative Analysis of the Impacts and Resilience of the Electricity Supply Industry against COVID-19 Restrictions in the United Kingdom, Malawi, and Uganda. Sustainability 2022, 14, 9481. [Google Scholar] [CrossRef]
- Nejati Amiri, M.H.; Guéniat, F. Towards a framework for measurements of power systems resiliency: Comprehensive review and development of graph and vector-based resilience metrics. Sustain. Cities Soc. 2024, 109, 105517. [Google Scholar] [CrossRef]
- Vega Penagos, C.A.; Diaz, J.L.; Rodriguez-Martinez, O.F.; Andrade, F.; Luna, A.C. Metrics and Strategies Used in Power Grid Resilience. Energies 2024, 17, 168. [Google Scholar] [CrossRef]
- Göteman, M.; Panteli, M.; Rutgersson, A.; Hayez, L.; Virtanen, M.J.; Anvari, M.; Johansson, J. Resilience of offshore renewable energy systems to extreme metocean conditions: A review. Renew. Sustain. Energy Rev. 2025, 216, 115649. [Google Scholar] [CrossRef]
- Manyena, B.; Machingura, F.; O’Keefe, P. Disaster Resilience Integrated Framework for Transformation (DRIFT): A new approach to theorising and operationalising resilience. World Dev. 2019, 123, 104587. [Google Scholar] [CrossRef]
- Bhusal, N.; Abdelmalak, M.; Kamruzzaman, M.; Benidris, M. Power system resilience: Current practices, challenges, and future directions. IEEE Access 2020, 8, 18064–18086. [Google Scholar] [CrossRef]
- Mujjuni, F.; Betts, T.; To, L.S.; Blanchard, R.E. Resilience a means to development: A resilience assessment framework and a catalogue of indicators. Renew. Sustain. Energy Rev. 2021, 152, 111684. [Google Scholar] [CrossRef]
- Shen, L.; Tang, Y.; Tang, L.C. Understanding key factors affecting power systems resilience. Reliab. Eng. Syst. Saf. 2021, 212, 107621. [Google Scholar] [CrossRef]
- Gholami, A.; Shekari, T.; Amirioun, M.H.; Aminifar, F.; Amini, M.H.; Sargolzaei, A. Toward a consensus on the definition and taxonomy of power system resilience. IEEE Access 2018, 6, 32035–32053. [Google Scholar] [CrossRef]
- Panteli, M.; Mancarella, P. Modeling and evaluating the resilience of critical electrical power infrastructure to extreme weather events. IEEE Syst. J. 2017, 11, 1733–1742. [Google Scholar] [CrossRef]
- Zidane, T.E.K.; Muis, Z.A.; Ho, W.S.; Zahraoui, Y.; Aziz, A.S.; Su, C.L.; Mekhilef, S.; Campana, P.E. Power systems and microgrids resilience enhancement strategies: A review. Renew. Sustain. Energy Rev. 2025, 207, 114953. [Google Scholar] [CrossRef]
- Panteli, M.; Mancarella, P. The grid: Stronger, bigger, smarter? Presenting a conceptual framework of power system resilience. IEEE Power Energy Mag. 2015, 13, 58–66. [Google Scholar] [CrossRef]
- Zhang, H.; Yuan, H.; Li, G.; Lin, Y. Quantitative resilience assessment under a tri-stage framework for power systems. Energies 2018, 11, 1427. [Google Scholar] [CrossRef]
- Panteli, M.; Mancarella, P. Influence of extreme weather and climate change on the resilience of power systems: Impacts and possible mitigation strategies. Electr. Power Syst. Res. 2015, 127, 259–270. [Google Scholar] [CrossRef]
- United Nations Office for Disaster Risk Reduction (UNDRR). Sendai Framework for Disaster Risk Reduction 2015–2030. UNDRR n.d. Available online: https://www.undrr.org/media/16176/download?startDownload=20250515 (accessed on 1 June 2023).
- Mujjuni, F.; Blanchard, R.; Betts, T. A case for a new approach in theorizing and operationalisation of resilience for electrical systems in developing countries. In The Virtual International Conference on Aligning Local Interventions with the UN Sustainable Development Goals; Bhattacharyya, S., Ed.; Institute of Energy and Sustainable Development: Leicester, UK, 2021. [Google Scholar]
- Amani, A.M.; Jalili, M. Power Grids as Complex Networks: Resilience and Reliability Analysis. IEEE Access 2021, 9, 119010–119031. [Google Scholar] [CrossRef]
- Gao, H.; Chen, Y.; Xu, Y.; Liu, C.C. Resilience-Oriented Critical Load Restoration Using Microgrids in Distribution Systems. IEEE Trans. Smart Grid 2016, 7, 2837–2848. [Google Scholar] [CrossRef]
- Li, Z.; Shahidehpour, M.; Aminifar, F.; Alabdulwahab, A.; Al-Turki, Y. Networked Microgrids for Enhancing the Power System Resilience. Proc. IEEE 2017, 105, 1289–1310. [Google Scholar] [CrossRef]
- Liu, X.; Hou, K.; Jia, H.; Zhao, J.; Mili, L.; Mu, Y.; Rim, J.; Lei, Y. A resilience assessment approach for power system from perspectives of system and component levels. Int. J. Electr. Power Energy Syst. 2020, 118, 105837. [Google Scholar] [CrossRef]
- Chiu, B.; Brown, S.; Chalamala, B.; Khodaei, A.; Liu, J.; Novosel, D.; Mazurek, J.; Novosel, D. Resilience Framework, Methods, and Metrics for the Electricity Sector (PES-TR83); IEEE PES Resource Center: New York, NY, USA, 2020. [Google Scholar] [CrossRef]
- Espinoza, S.; Panteli, M.; Mancarella, P.; Rudnick, H. Multi-phase assessment and adaptation of power systems resilience to natural hazards. Electr. Power Syst. Res. 2016, 136, 352–361. [Google Scholar] [CrossRef]
- Biswas, S.; Singh, M.K.; Centeno, V.A. Chance-Constrained Optimal Distribution Network Partitioning to Enhance Power Grid Resilience. IEEE Access 2021, 9, 42169–42181. [Google Scholar] [CrossRef]
- Sabouhi, H.; Doroudi, A.; Fotuhi-Firuzabad, M.; Bashiri, M. Electrical Power System Resilience Assessment: A Comprehensive Approach. IEEE Syst. J. 2020, 14, 2643–2652. [Google Scholar] [CrossRef]
- World Bank Group; United Nations; European Union. Malawi Drought 2015–2016: Post Disaster Needs Assessment (PDNA); World Bank: Washington, DC, USA, 2016. [Google Scholar] [CrossRef]
- World Weather Attribution. Climate Change Increased Rainfall Associated with Tropical Cyclones Hitting Highly Vulnerable Communities in Madagascar, Mozambique & Malawi. World Weather Attribution. 2022. Available online: https://www.worldweatherattribution.org/climate-change-increased-rainfall-associated-with-tropical-cyclones-hitting-highly-vulnerable-communities-in-madagascar-mozambique-malawi/ (accessed on 23 April 2025).
- JBA Event Response. Tropical Cyclone Freddy: February–March 2023. 2023. Available online: https://www.jbarisk.com/knowledge-hub/event-response/tropical-cyclone-freddy-february-march-2023/ (accessed on 23 April 2025).
- Gautam, A.; Sudhakar, G.; Gupta, M.K.; Shukla, R.; Porwal, R.K.; De, D.; Narasimhan, S.R. Proactive Operation Strategy to enhance resiliency of Indian Power System During Super Cyclone Amphan. In Proceedings of the 2021 9th IEEE International Conference on Power Systems (ICPS), West Bengal, India, 16–18 December 2021. [Google Scholar] [CrossRef]
- Raj, S.V.; Bhatia, U.; Kumar, M. Cyclone preparedness strategies for regional power transmission systems in data-scarce coastal regions of India. Int. J. Disaster Risk Reduct. 2022, 75, 102957. [Google Scholar] [CrossRef]
- Oh, S.; Jufri, H.; Choi, M.-H.; Jung, J. A study of tropical cyclone impact on the power distribution grid in South Korea for estimating damage. Renew. Sustain. Energy Rev. 2022, 156, 112010. [Google Scholar] [CrossRef]
- Government of Malawi. Annual Economic Report 2020. Ministry of Finance (MoF). 2020. Available online: https://www.finance.gov.mw/index.php/our-documents/annual-economic-reports (accessed on 25 June 2021).
- National Grid. The Guaranteed Standards of Performance Customer Payment Scheme. 2023. Available online: https://www.nationalgrid.co.uk/downloads-view-reciteme/660296 (accessed on 28 March 2024).
- National Grid. Metered Connections Guaranteed Standards of Service. n.d. Available online: https://www.nationalgrid.co.uk/customers-and-community/standards-of-performance (accessed on 28 March 2024).
- Electricity Generation Company (Malawi) Limited—EGENCO. Generating Power for Generations. EGENCO n.d. Available online: https://www.egenco.mw/# (accessed on 9 January 2022).
- Fu, X.; Li, H.N.; Li, G.; Dong, Z.Q. Fragility analysis of a transmission tower under combined wind and rain loads. J. Wind. Eng. Ind. Aerodyn. 2020, 199, 104098. [Google Scholar] [CrossRef]
- Electricity Supply Corporation of Malawi (ESCOM). Interim Report on ESCOM Infrastructure Damage by the Tropical Cyclone Ana: Analysis and Recovery Plan; Electricity Supply Corporation of Malawi: Lilongwe, Malawi, 2022. [Google Scholar]
- Daily Temperature and Windspeed Data (2010–2021); Department of Meteorology (Malawi): Blantyre, Malawi, 2022.
- Daily Rainfall Data for 15 Stations (2010–2021); Department of Meteorology (Malawi): Blantyre, Malawi, 2022.
- Gaitán, L.F.; Gómez, J.D.; Rivas-Trujillo, E. Quasi-Dynamic Analysis of a Local Distribution System with Distributed Generation. Study Case: The IEEE 13 Node System. TecnoLógicas 2019, 22, 195–212. [Google Scholar] [CrossRef]
- DIgSILENT GmbH. PowerFactory 2023: User Manual; Online; DIgSILENT GmbH: Gomaringen, Germany, 2023. [Google Scholar]
- Chivunga, J.N.; Longatt, F.G.; Lin, Z.; Blanchard, R. Transmission line redundancy for grid resilience enhancement: The concept of Transmission Lines contributing to Energy Not Supplied (TLENS) on Malawi’s transmission grid. Energy Rep. 2024, 12, 4670–4685. [Google Scholar] [CrossRef]
- Bam, L.; Jewell, W. Review: Power system analysis software tools. In Proceedings of the IEEE Power Engineering Society General Meeting, San Francisco, CA, USA, 16 June 2005; Volume 1, pp. 139–144. [Google Scholar] [CrossRef]
- Hay, S.; Ferguson, A. A Review of Power System Modelling Platforms and Capabilities; The Institute of Engineering and Technology (IET): Stevenage, UK, 2015; Available online: https://www.theiet.org/impact-society/factfiles/energy-factfiles/modelling-system-resilience/paper-3-review/ (accessed on 13 February 2022).
- Zimba, S.K.; Houane, M.J.; Chikova, A.M. Impact of Tropical Cyclone Idai on the Southern African Electric Power Grid. In 2020 IEEE PES/IAS PowerAfrica, Proceedings of the PowerAfrica 2020, Nairobi, Kenya, 25–28 August 2020; Institute of Electrical and Electronics Engineers Inc.: Piscataway, NJ, USA, 2020. [Google Scholar] [CrossRef]
- Electricity Generation Company (EGENCO) Malawi Limited. Hourly Generation Log Sheets (Profiles): January–February 2022; Electricity Generation Company (EGENCO) Malawi Limited: Lilongwe, Malawi, 2022. [Google Scholar]
- Electricity Supply Corporation of Malawi (ESCOM). Hourly Consumption Data for South, Centre and North Grids: January–February 2022; Electricity Supply Corporation of Malawi (ESCOM): Lilongwe, Malawi, 2022. [Google Scholar]
- Njalammano, H. Kapichira Shuts Down. Zodiak Online. 2022. Available online: https://muckrack.com/happy-njalammano/articles (accessed on 2 February 2022).
- Electricity Generation Company (Malawi) Limited—EGENCO. Damage to Kapichira Dam and Associated Structures by Cyclone Ana; EGENCO: Lilongwe, Malawi, 2022. [Google Scholar]
- Karagiannakis, G.; Panteli, M.; Argyroudis, S. Fragility Modeling of Power Grid Infrastructure for Addressing Climate Change Risks and Adaptation. WIREs Clim. Change 2025, 16, e930. [Google Scholar] [CrossRef]
- The Maravi Post. World Bank Pumps US$60m Towards Malawi’s Emergency Power Restoration. n.d. Available online: https://www.maravipost.com/world-bank-pumps-us60m-towards-malawis-emergency-power-restoration/ (accessed on 22 August 2023).
- Government of Malawi. Malawi National Energy Policy. Ministry of Energy (MoE). 2018. Available online: https://npc.mw/wp-content/uploads/2020/07/National-Energy-Policy-2018.pdf (accessed on 25 June 2021).
- Chivunga, J.N.; Lin, Z.; Blanchard, R. Energy Policy as a Tool for Promoting Power System Resilience: Malawi’s Challenges and Potential Solutions; Springer: Cham, Switzerland, 2023; pp. 187–207. [Google Scholar] [CrossRef]
- Chivunga, J.N.; Lin, Z.; Blanchard, R. Integrated Analysis of Operator Response Capacity, Energy Policy Support and Infrastructure Robustness in Power Grid Resilience Under Severe Weather Events: Lessons from Malawi. Energies 2025, 18, 2755. [Google Scholar] [CrossRef]
- Wang, Y.; Chen, C.; Wang, J.; Baldick, R. Research on Resilience of Power Systems under Natural Disasters—A Review. IEEE Trans. Power Syst. 2016, 31, 1604–1613. [Google Scholar] [CrossRef]
- Ghiasi, M.; Dehghani, M.; Niknam, T.; Baghaee, H.R.; Padmanaban, S.; Gharehpetian, G.B.; Aliev, H. Resiliency/Cost-Based Optimal Design of Distribution Network to Maintain Power System Stability against Physical Attacks: A Practical Study Case. IEEE Access 2021, 9, 43862–43875. [Google Scholar] [CrossRef]
- Daeli, A.; Mohagheghi, S. Power Grid Infrastructural Resilience against Extreme Events. Energies 2023, 16, 64. [Google Scholar] [CrossRef]
- Handayani, K.; Filatova, T.; Krozer, Y.; Anugrah, P. Seeking for a climate change mitigation and adaptation nexus: Analysis of a long-term power system expansion. Appl. Energy 2020, 262, 114485. [Google Scholar] [CrossRef]
- Ayamolowo, O.J.; Manditereza, P.; Kusakana, K. Combined Generation and Transmission Expansion Planning Model for Improved Modern Power System Resilience. Electr. Power Compon. Syst. 2023, 51, 898–914. [Google Scholar] [CrossRef]
- Guerra, O.J.; Tejada, D.A.; Reklaitis, G.V. Climate change impacts and adaptation strategies for a hydro-dominated power system via stochastic optimization. Appl. Energy 2019, 233–234, 584–598. [Google Scholar] [CrossRef]
- Rahiminejad, A.; Ghafouri, M.; Atallah, R.; Lucia, W.; Debbabi, M.; Mohammadi, A. Resilience enhancement of Islanded Microgrid by diversification, reconfiguration, and DER placement/sizing. Int. J. Electr. Power Energy Syst. 2023, 147, 108817. [Google Scholar] [CrossRef]
- Cicilio, P.; Swartz, L.; Vaagensmith, B.; Rieger, C.; Gentle, J.; McJunkin, T.; Cotilla-Sanchez, E. Electrical grid resilience framework with uncertainty. Electr. Power Syst. Res. 2020, 189, 106801. [Google Scholar] [CrossRef]
- Blyden, B.K.; Lee, W.J. Holistic approach for grid interconnection in Africa. In Proceedings of the IEEE PES Conference and Exposition in Africa, Durban, South Africa, 11–15 July 2005; pp. 195–201. [Google Scholar] [CrossRef]
- Juma, D.; Munda, J.; Kabiri, C. Progress in grid interconnection in East Africa: Challenges, Experiences and Opportunities. In Proceedings of the IEEE PES/IAS PowerAfrica, Nairobi, Kenya, 25–28 August 2020. [Google Scholar] [CrossRef]
- Jesse, B.J.; Heinrichs, H.U.; Kuckshinrichs, W. Adapting the theory of resilience to energy systems: A review and outlook. Energy Sustain. Soc. 2019, 9, 27. [Google Scholar] [CrossRef]
- Oberg, K.; Srinivas, A.; Rahman, F.; Wang, Z.; Ranganathan, P. Strengthening Grid Resilience: Lessons from the Texas Power Blackout and Implications. In North American Power Symposium (NAPS); Institute of Electrical and Electronics Engineers Inc.: Piscataway, NJ, USA, 2023. [Google Scholar] [CrossRef]
- Schreider, A.; Bucher, R. An auspicious combination: Fast-ramping battery energy storage and high-capacity pumped hydro. Energy Procedia 2018, 155, 156–164. [Google Scholar] [CrossRef]
- Panteli, M.; Pickering, C.; Wilkinson, S.; Dawson, R.; Mancarella, P.; Member, S. Power System Resilience to Extreme Weather: Fragility Modeling, Probabilistic Impact Assessment, and Adaptation Measures. IEEE Trans. Power Syst. 2017, 32, 3747–3757. [Google Scholar] [CrossRef]
- Najafi Tari, A.; Sepasian, M.S.; Tourandaz Kenari, M. Resilience assessment and improvement of distribution networks against extreme weather events. Int. J. Electr. Power Energy Syst. 2021, 125, 106414. [Google Scholar] [CrossRef]
- Taylor, W.O.; Watson, P.L.; Cerrai, D.; Anagnostou, E. A Statistical Framework for Evaluating the Effectiveness of Vegetation Management in Reducing Power Outages Caused during Storms in Distribution Networks. Sustainability 2022, 14, 904. [Google Scholar] [CrossRef]
- Electricity Supply Corporation of Malawi (ESCOM). Substations and Overhead Lines (OHL) Report (2017–2022); Electricity Supply Corporation of Malawi: Blantyre, Malawi, 2022. [Google Scholar]
- Bresch, D.; ECA Working Group. Building a Resilient Energy Gulf Coast: Executive Report. 2010. Available online: https://www.research-collection.ethz.ch/handle/20.500.11850/130361 (accessed on 29 August 2024).
- Aziz, T.; Lin, Z.; Waseem, M.; Liu, S. Review on optimization methodologies in transmission network reconfiguration of power systems for grid resilience. Int. Trans. Electr. Energy Syst. 2021, 31, e12704. [Google Scholar] [CrossRef]
- Plietzsch, A.; Schultz, P.; Heitzig, J.; Kurths, J. Local vs. global redundancy—Trade-offs between resilience against cascading failures and frequency stability. Eur. Phys. J. Spec. Top. 2016, 225, 551–568. [Google Scholar] [CrossRef]
- Boggess, J.M.; Becker, G.W.; Mitchell, M.K. Storm & flood hardening of electrical substations. In Proceedings of the IEEE Power Engineering Society Transmission and Distribution Conference, Chicago, IL, USA, 14–17 April 2014. [Google Scholar] [CrossRef]
- World Bank. Malawi: World Bank Approves Grant Financing for Landmark 358.5 Megawatt Mpatamanga Hydropower Storage Project. World Bank Group. 2025. Available online: https://www.worldbank.org/en/news/press-release/2025/05/15/malawi-afe-world-bank-approves-grant-financing-for-landmark-358-5-megawatt-mpatamanga-hydropower-storage-project (accessed on 17 May 2025).
- Mohamed, M.A.; Chen, T.; Su, W.; Jin, T. Proactive Resilience of Power Systems against Natural Disasters: A Literature Review. IEEE Access 2019, 7, 163778–163795. [Google Scholar] [CrossRef]
- Huang, G.; Wang, J.; Chen, C.; Qi, J.; Guo, C. Integration of Preventive and Emergency Responses for Power Grid Resilience Enhancement. IEEE Trans. Power Syst. 2017, 32, 4451–4463. [Google Scholar] [CrossRef]
- Mehrabanifar, K.; Shayeghi, H.; Younesi, A.; Siano, P. Enhancing Modern Distribution System Resilience: A Comprehensive Two-Stage Approach for Mitigating Climate Change Impact. Smart Cities 2025, 8, 76. [Google Scholar] [CrossRef]
- Lai, K.; Wang, Y.; Shi, D.; Illindala, M.S.; Zhang, X.; Wang, Z. A Resilient Power System Operation Strategy Considering Transmission Line Attacks. IEEE Access 2018, 6, 70633–70643. [Google Scholar] [CrossRef]
- Mohan, G.; Chandrashekhar, B.N.; Srivastava, A.K. Intelligent Control of Battery Storage for Resiliency Enhancement of Distribution System. IEEE Syst. J. 2022, 16, 2229–2239. [Google Scholar] [CrossRef]
- Liu, J.; Qin, C.; Yu, Y. Enhancing Distribution System Resilience with Proactive Islanding and RCS-Based Fast Fault Isolation and Service Restoration. IEEE Trans. Smart Grid 2020, 11, 2381–2395. [Google Scholar] [CrossRef]
- Liu, X.; Shahidehpour, M.; Li, Z.; Liu, X.; Cao, Y.; Bie, Z. Microgrids for Enhancing the Power Grid Resilience in Extreme Conditions. IEEE Trans. Smart Grid 2017, 8, 589–597. [Google Scholar] [CrossRef]
- Mohammadi Darestani, Y.; Sanny, K.; Shafieezadeh, A.; Fereshtehnejad, E. Life cycle resilience quantification and enhancement of power distribution systems: A risk-based approach. Struct. Saf. 2021, 90, 102075. [Google Scholar] [CrossRef]
- Taheri, B.; Safdarian, A.; Moeini-Aghtaie, M.; Lehtonen, M. Enhancing resilience level of power distribution systems using proactive operational actions. IEEE Access 2019, 7, 137378–137389. [Google Scholar] [CrossRef]
- Shen, L.; Tang, L.C. Enhancing resilience analysis of power systems using robust estimation. Reliab. Eng. Syst. Saf. 2019, 186, 134–142. [Google Scholar] [CrossRef]
- Kamruzzaman, M.; Duan, J.; Shi, D.; Benidris, M. A Deep Reinforcement Learning-based Multi-Agent Framework to Enhance Power System Resilience using Shunt Resources. IEEE Trans. Power Syst. 2021, 36, 5525–5536. [Google Scholar] [CrossRef]
- Oh, S.; Heo, K.; Jufri, F.H.; Choi, M.; Jung, J. Storm-Induced Power Grid Damage Forecasting Method for Solving Low Probability Event Data. IEEE Access 2021, 9, 20521–20530. [Google Scholar] [CrossRef]
- Sun, K.; Xiao, H.; Pan, J.; Liu, Y. VSC-HVDC Interties for Urban Power Grid Enhancement. IEEE Trans. Power Syst. 2021, 36, 4745–4753. [Google Scholar] [CrossRef]
- Poudel, S.; Dubey, A. Critical Load Restoration Using Distributed Energy Resources for Resilient Power Distribution System. IEEE Trans. Power Syst. 2019, 34, 52–63. [Google Scholar] [CrossRef]
- Kumar, N.; Poonia, V.; Gupta, B.B.; Goyal, M.K. A novel framework for risk assessment and resilience of critical infrastructure towards climate change. Technol. Forecast. Soc. Change 2021, 165, 120532. [Google Scholar] [CrossRef]
- Nezamoddini, N.; Mousavian, S.; Erol-Kantarci, M. A risk optimization model for enhanced power grid resilience against physical attacks. Electr. Power Syst. Res. 2017, 143, 329–338. [Google Scholar] [CrossRef]
- Mishra, D.K.; Eskandari, M.; Abbasi, M.H.; Sanjeevkumar, P.; Zhang, J.; Li, L. A detailed review of power system resilience enhancement pillars. Electr. Power Syst. Res. 2024, 230, 110223. [Google Scholar] [CrossRef]
- HM Government. Emergency Response and Recovery: Non Statutory Guidance Accompanying the Civil Contingencies Act 2004, 5th ed.; Cabinet Office: London, UK, 2013.
- Song, Y.; Medda, F.; Wang, M. The value of resilience bond in financing flood resilient infrastructures: A case study of Towyn. J. Sustain. Financ. Investig. 2024, 14, 889–912. [Google Scholar] [CrossRef]
- Zheng, X.; Mamon, R. Assessment of a pandemic emergency financing facility. Prog. Disaster Sci. 2023, 18, 100281. [Google Scholar] [CrossRef]
Disclaimer/Publisher’s Note: The statements, opinions and data contained in all publications are solely those of the individual author(s) and contributor(s) and not of MDPI and/or the editor(s). MDPI and/or the editor(s) disclaim responsibility for any injury to people or property resulting from any ideas, methods, instructions or products referred to in the content. |
© 2025 by the authors. Licensee MDPI, Basel, Switzerland. This article is an open access article distributed under the terms and conditions of the Creative Commons Attribution (CC BY) license (https://creativecommons.org/licenses/by/4.0/).