1. Introduction
Electric vehicles currently have significantly longer battery loading times compared to re-fueling time of internal combustion engine vehicles [
1]. Therefore, providing adequate charging infrastructure is a necessary condition for the development of this type of transportation. The coming decades are likely to be a period of rapid expansion of energy infrastructure related to the development of renewable energy sources and electromobility [
2]. The integration of EV into the power grid affects its stability, causing potential problems such as an increase in peak energy demand [
3]. Smart grids are important for the effective integration of RES and EV [
4,
5]. One solution to reduce investments, which also generate CO2 emissions like any other, is the construction of autonomous electric vehicle charging stations. Autonomous electric vehicle charging stations will reduce the need to expand the power grid by utilizing local energy sources and energy storage.
Policy drivers: the development of electric vehicle charging infrastructure is shaped by specific regulations and directives. The European Union replaced the previous Directive 2014/94/EU on the development of alternative fuels infrastructure (AFID) with the AFIR regulation in July 2023, which entered into force on 13 April 2024 [
6]. According to provisions of the AFIR regulation, the total capacity of the charging infrastructure in Poland should be adapted to the number of registered electric cars with the location of electric vehicle charging stations every 60 km and hydrogen refueling stations every 100 km [
7]. In addition, the regulations specify the requirement to ensure sufficient power at each newly registered station for electric vehicles.
In Poland, the number of electric vehicles is small. The EV sales share in Poland was 5.7%, where the EV share in Europe was 22.0% in 2024 [
8]. Currently, the provisions of the regulation are met in terms of the appropriate power of the charging network. In December 2024, the installed capacity in the network of publicly available charging infrastructure was 363 MW, which means that taking into account the existing fleet of electric vehicles in the amount of 215,275, we exceed the level of installed capacity at charging stations required by the AFIR regulation by 69%. According to the forecasts of the Polish Alternative Fuels Association, in connection with the planned development of electromobility in Poland, in 2027 and in the following years, the power of charging stations may be insufficient in relation to the planned number of vehicles on the roads in these years. The situation is similar in other European countries, although the dynamics of capacity growth is different [
9].
With the ongoing decarbonization, the energy system will become less reliant on hydrocarbons and more dependent on electricity. Decarbonizing transportation and other sectors of the economy by reducing the use of natural gas, coal, and petroleum will increase the demand for electrical energy [
10]. According to the International Energy Agency (IEA), achieving net-zero carbon dioxide emissions by 2050 will require increasing the share of electricity produced from renewable sources from 20% to 50% [
11].
Achieving the goals set in the AFIR will require various solutions to fulfill them. One of them could be the operation of charging stations based on hybrid power sources. Then, a microgrid will be created as a system in which local energy sources, such as photovoltaic panels, wind turbines, or biogas generators, are connected to a local energy storage and distribution network. Thanks to the power microgrid, the autonomous charging station can use local, renewable energy sources, as well as store excess energy for later charging of vehicles.
Technical factors there are also a number of technical issues that play an important role in ensuring the efficient and stable operation of the charging infrastructure. These include long charging times, the impact on the stability of the power grid, and variability of renewable energy sources.
2. Source Overview
Energy balancing is an important issue in renewable energy systems, such as PV farms and wind farms (WF). The purpose of energy balancing is to maintain equilibrium between energy supply and demand, ensure the reliability and stability of the system, and improve its efficiency. To achieve this, energy storage systems like batteries are used to store surplus energy and deliver it to the grid or consumers when needed. Various aspects of utilizing renewable energy sources to support Electric Vehicle Charging Stations (EVCS) have been analyzed in [
12]. The use of hybrid energy systems that can manage renewable energy sources, ensuring a consistent power output and uninterrupted service has been explored in [
13]. An interesting algorithm for managing EV charging stations in DC microgrids, taking into account power constraints and driver choices, was proposed in [
14], with simulation results confirming the effectiveness of the proposed strategy. The energy management technique described in [
15] confirms the possibility of operating an isolated microgrid in the form of an EV charging station powered by highly variable sources when supported by an energy storage. Different energy management strategies and battery sizes were analyzed in the context of sustainable energy supply in such microgrids. A procedure for selecting appropriate sizes of energy storage devices and converters was proposed [
16].
3. Materials and Methods
The study presents an energy balance needed to power stations from various sources and simulates their optimal participation
Energy demand (left side of the equation) results from the number of vehicles being charged at a given power over time, taking into account losses due to energy conversion and transmission. This can be described by the formula:
where EEV is the demand for energy of vehicles, P
i is the charging power of the i-th vehicle at time t, and x
i is the losses.
Charging time = battery capacity/(charging power × efficiency factor × power factor), where the efficiency factor takes into account energy losses during charging, and the power factor considers changes in charging power depending on the battery’s state of charge.
Supplying the station with energy (right side of Equation (1)) compiles the energy production from various sources with energy storage, which can be described by the following formulas:
Wind energy generation
where p is the power generated by the turbine in W, ρ is air density in kg/m
3, A is the cross-sectional area of the blades in m
2, v is wind speed in m/s, and C
p is the power coefficient, which depends on the shape and pitch angle of the blades. This is the basic formula for determining the power of a wind turbine.
The output power from a wind turbine under normal pressure and temperature conditions can be expressed by Equation (4) [
17],
where P
r, v
r, v
cut-in, and v
cut-out denotes the rated power, rated velocity, cut-in velocity, and cut-out velocity of the wind turbine.
3.1. Solar Energy Generation
The basic formula for generating energy from photovoltaic panels is as follows:
where E
PV is the energy generated by the farm in kWh/year, A is the total surface area of the panels in m
2, r is the efficiency of the panels in kWh/m
2, H is the average annual sunlight in kWh/m
2, and PR is the performance ratio, which takes into account losses due to the tilt angle, orientation, temperature, conversion, and transmission.
The output power of the PV generator during the year is calculated by Equation (6) [
18],
where P
v is the rated capacity (kW), D
pv is the P
V derating factor (%), G
T is incident solar radiation (kW/m
2), GT,STC is the radiation in STC (standard test conditions), αp is the power temperature coefficient (%/°C), T
cell and T
cell, STC is the cell temperature (°C) under operating and STC conditions, respectively.
3.2. Battery Energy Storage
Battery energy storage is used to store excess electrical energy and deliver it back to the system when needed. The formula for energy stored by the battery is as follows:
where E is the energy stored by the battery (BAT) in Wh, Q is the battery’s electric charge in Ah, and V is the battery voltage in V.
In the proposed hybrid system in the study, battery storage plays a significant role as it is responsible for storing surplus energy generated from renewable sources and supplying it back to the system. It is crucial to characterize the battery system to adapt to the dynamic energy demand of the designed hybrid system [
19]. Detailed mathematical modeling related to renewable energy can be found in the literature [
20].
The Global Solar Atlas [
21] and Global Wind Atlas [
22] were used to determine the necessary resources.
The article presents a simulation study of an autonomous charging station for electric vehicles powered by renewable energy sources. However, its limitations result primarily from the level of detail and scope of the simulation, which, although useful for initial assessment, may affect the precision and generality of the conclusions.
The basic operational parameters of the charging station were determined, including the following:
Traffic-related parameters such as the number of vehicles charged per day, the load structure of the station by charged vehicles during the day, and seasonality;
The characteristics of the batteries and charging were also taken into account, such as the average battery capacity, battery charge level, and charger power.
For above parameters appropriate power supply from renewable energy sources was selected, taking into account the characteristic windiness and insolation. In order to limit the supply of energy to the station from the grid, the energy storage was included in the model.
Figure 1 shows a flowchart describing the simulation steps.The project uses an iterative approach, enabling gradual refinement of the optimal configuration. Excel analysis allows for flexible modeling of various scenarios. A key element is to consider the known EV charging profile as a constant around which the power system configuration is optimized, simplifying the design process.
Based on the characteristic wind and insolation of the location, the appropriate power supply from renewable energy sources was selected. This includes wind farms and photovoltaic systems to generate electricity for charging stations. In addition, it was considered that energy storage in the form of batteries would provide a stable power supply.
To simulate the optimal proportion of these power sources, a mathematical model was developed. The model takes into account the generation of energy from wind farms and photovoltaic systems based on historical weather data for a given location. It also takes into account the energy consumption of the charging station, which is determined by the number of vehicles charged per day and their charging patterns.
The model aims to find the optimal allocation of energy from wind farms, photovoltaic systems, and batteries to meet the energy demand of the charging station while maximizing the use of renewable energy sources. It takes into account factors such as the availability of wind and solar resources, battery capacity and charging efficiency.
The simulation is carried out for different scenarios, taking into account differences in vehicle charging patterns, seasonality, and renewable energy efficiency. The goal is to determine the optimal combination of power sources and their share to ensure reliable and sustainable operation of the charging station.
The main problem is the modeling of hybrid systems, which often leads to significant over-sizing of individual system components, such as energy generators and storage units, due to the specific nature of the load (e.g., fast EV chargers requiring high power in a short time). This over-sizing also results from the instability of renewable energy sources and the difficulty in forecasting them.
4. Results of the Electric Vehicle Charging Station Operating Model Based on Energy from RES and Energy Storage
This chapter presents the results obtained from the operational model of an electric vehicle charging station powered by renewable energy sources (RES) and supported by an energy storage. After a detailed discussion of the initial assumptions, the description of the reference station, and the adopted model design parameters in the previous sections, this part focuses on the presentation and analysis of the key results resulting from the simulation of the system operation under defined conditions.
4.1. Preliminary Assumptions
European electricity Transmission System Operators (TSOs) play a key role in developing electricity system into green technology [
23]. The problem of ensuring the operational efficiency of the National Transmission System when connecting to the RES system and energy consumers in the form of charging stations has been considered. One of the solution is to create a smart grid, the elements of which are so-called Smart Grids will operate autonomously, connecting producers of energy from conventional and renewable sources, line owners, and consumers, automatically adapting to their needs [
24].
Due to the low flexibility of the power system in Poland in the context of further increasing the share of renewable energy sources in the EE System [
25], various Smart Grid configurations, including off-grid systems, will play an increasingly important role.
One of such elements may be a hybrid fuel-electric or fully electric vehicle charging station located in places of high energy demand, such as highways. When constructing the model of the charging station, it was assumed that the station would be powered in a hybrid way from its own RESs such as WF and PV supported by BAT.
The work omitted the issue of introducing electricity from RESs to the power grid and Smart Grid. Interesting observations on this subject include study [
26].
In order to quickly charge the vehicle, the use of direct current is preferred, and commercial stations are equipped with such chargers. Charging with direct current makes it possible to significantly shorten this process, because power from 41 to 150 kW is used [
27].
In the time needed to charge a single electric vehicle, about 30 combustion vehicles can be refueled because refueling a combustion vehicle without paying formalities takes about 1 min (the dispenser provides 40 L/min). Therefore, in order to charge a similar number of electric vehicles as internal combustion vehicles, the power of the chargers and/or the number of charging points should be increased. Both of these methods lead to increased power requirements. At a station located on a highway, the availability of the charger and its appropriate power are important, allowing you to shorten the charging time as much as possible. The solution is direct current (DC) fast chargers with a minimum power of 150 kW.
4.2. Description of the Existing Charging Station and Its Operating Capacity
To construct the model, traffic load data from an existing petrol station located on the A4 motorway in southern Poland was used. It is a large petrol station with 12 dispensers for passenger cars, 6 dispensers for trucks, and 4 chargers for electric vehicles.
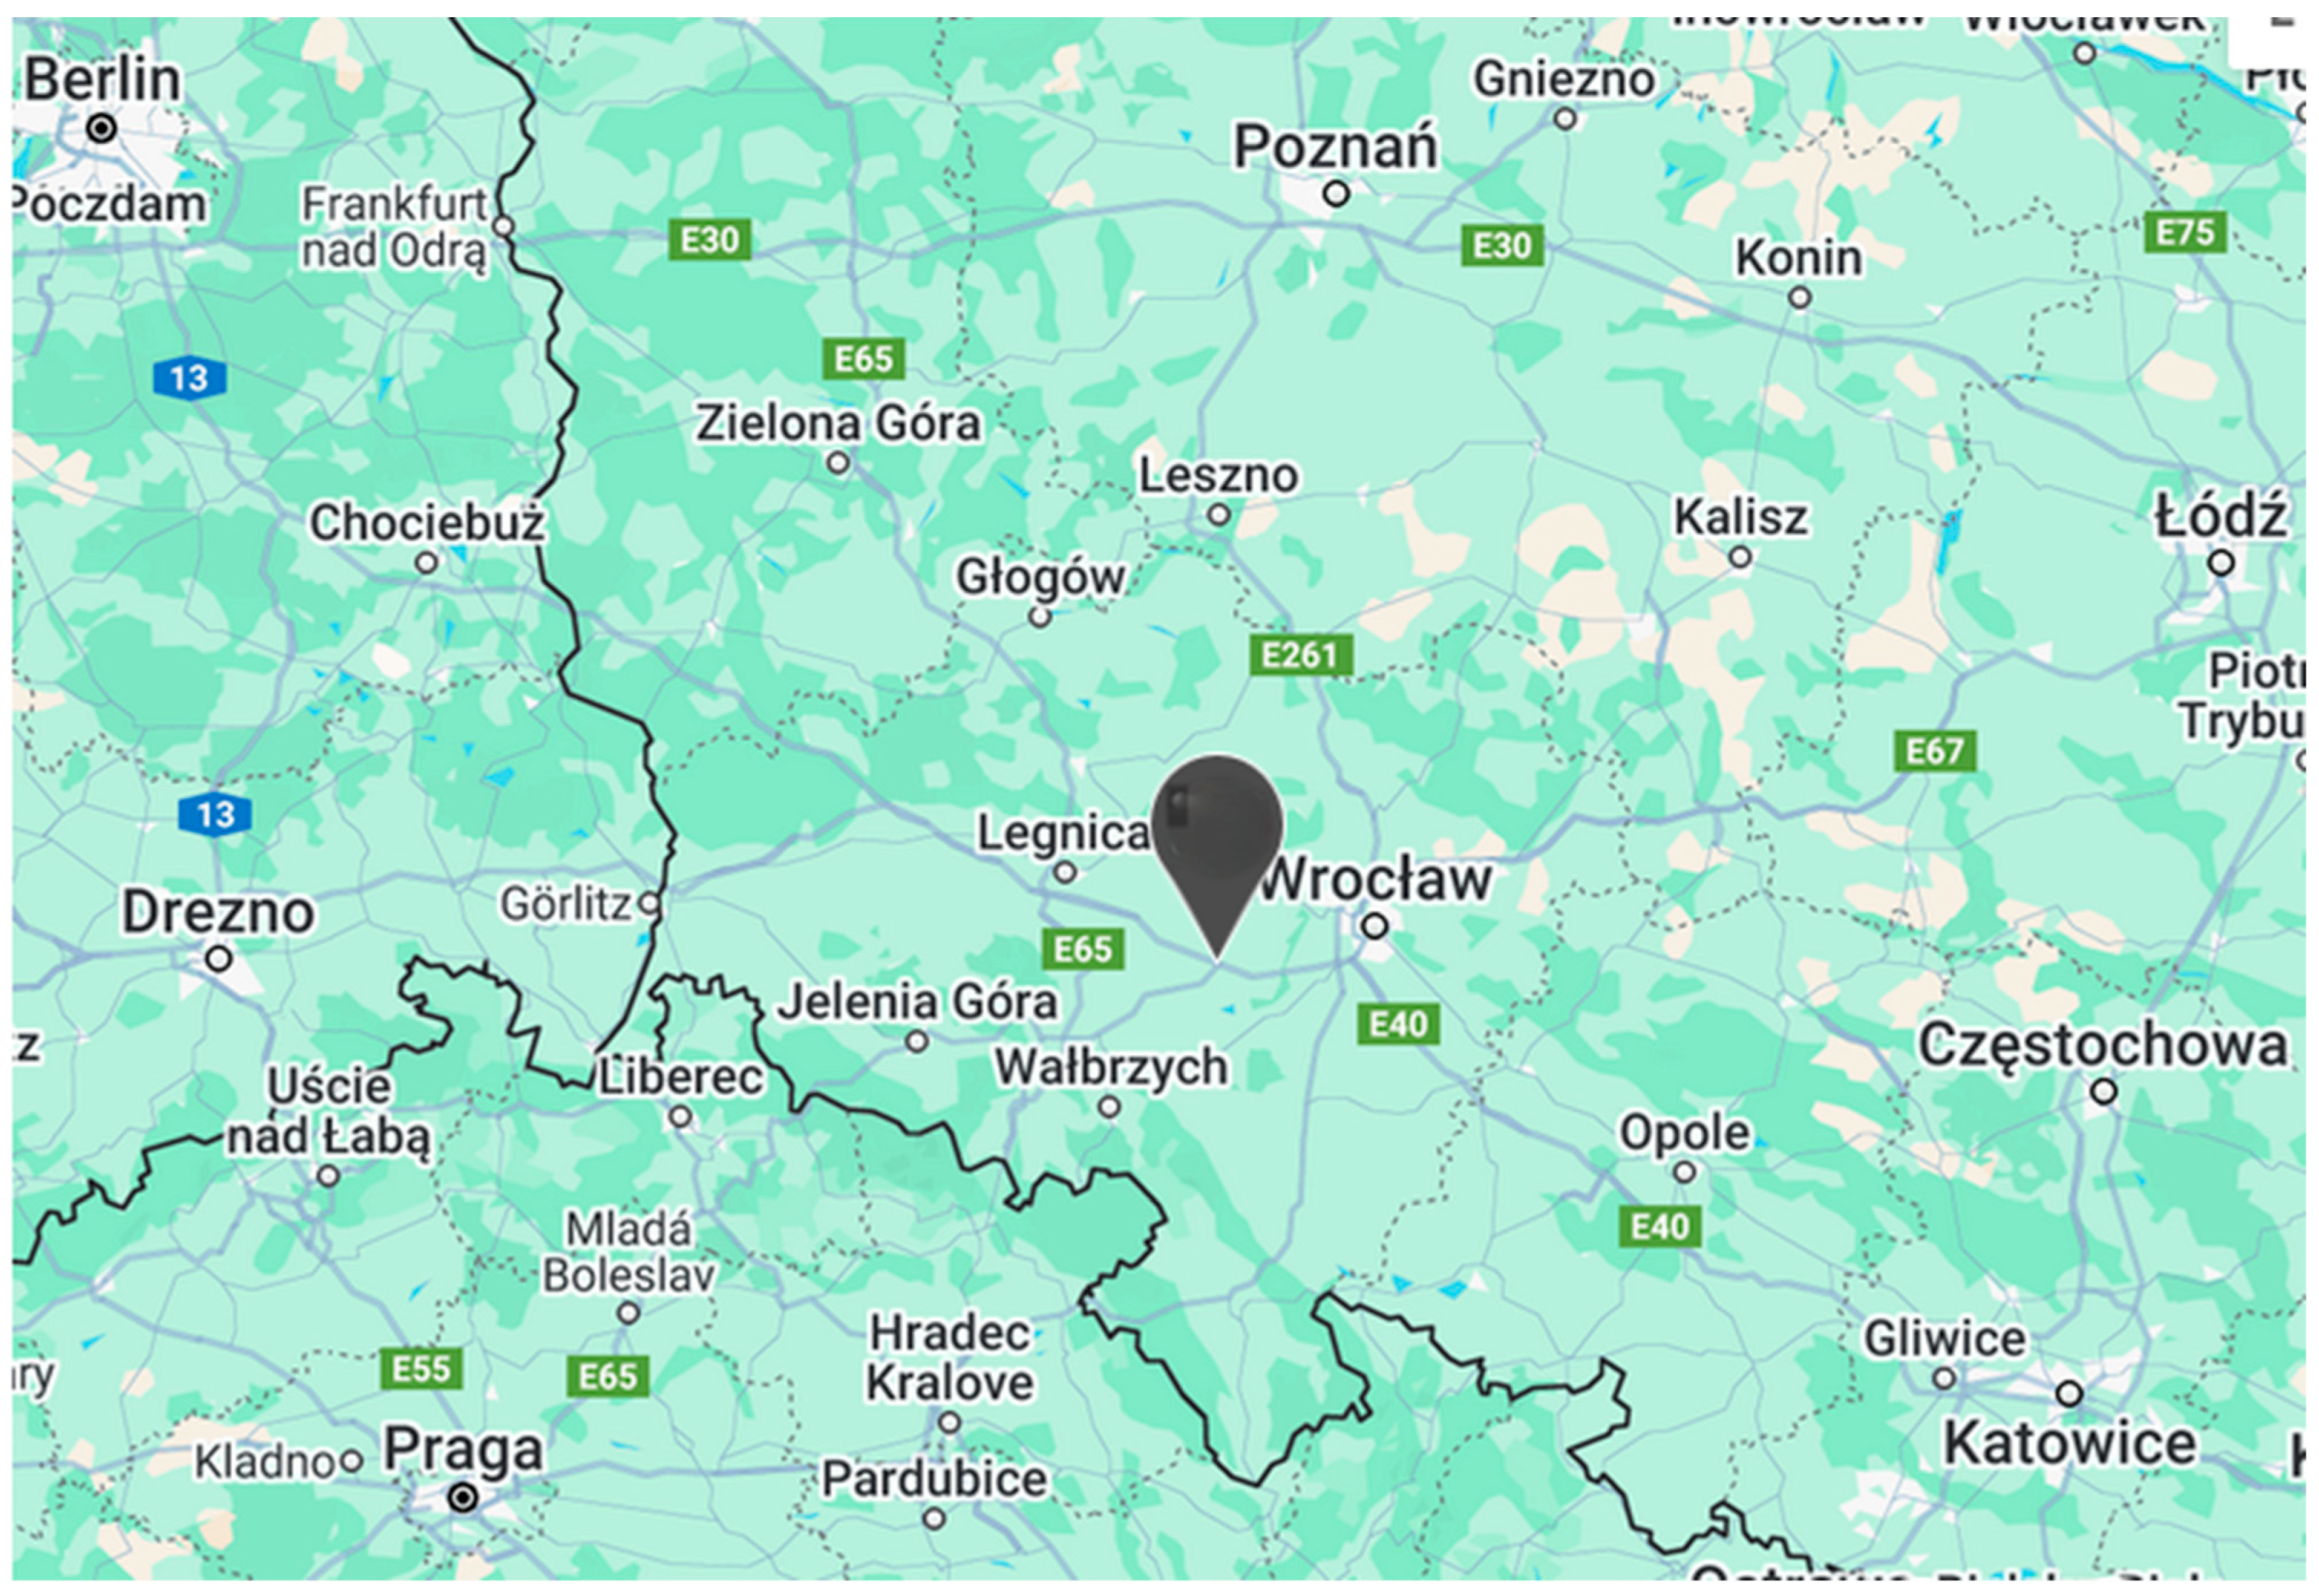
Figure 2 shows an overview map with the charging station in question marked.
The station supports transit traffic from Poland to Germany and communication between the city of Wrocław and the mountainous region of the Sudety Mountains, which is of great tourist importance and is a reservoir of employees and students for the agglomeration.
The station currently allows you to charge electric cars from four fast Tesla chargers with a capacity of up to 150 kW. Currently, they are heavily loaded, due to the fact that it is the first charging station in Poland equipped with fast chargers for vehicles coming from abroad.
The station is located in a favorable location due to the wind. A wind farm consisting of nine turbines with a capacity of 3 MW each was built near the station.
4.3. Design Assumption of Their Charging Station
4.3.1. Station Charging Data
Table 1 shows the number of cars charged per hour depending on the time of day and month.
It was assumed that the station will have 20 DC chargers with a maximum power of 150 kW.
Table 2 shows main parameters of the charging station that were adopted in the analysis.
Table 3 shows the demand for electric energy by EV on a daily basis in a given month.
4.3.2. Characteristics of the Weather Conditions of the Selected Location
Based on the data collected by the Global Solar Atlas and the Global Wind Atlas, the weather conditions for the selected location were assumed. These tools allow you to choose the optimal location due to the weather conditions ensuring the operation of RES or, as in our case, to determine the parameters of wind and insolation for the previously selected location and select the appropriate turbines and photovoltaic panels, determining their efficiency.
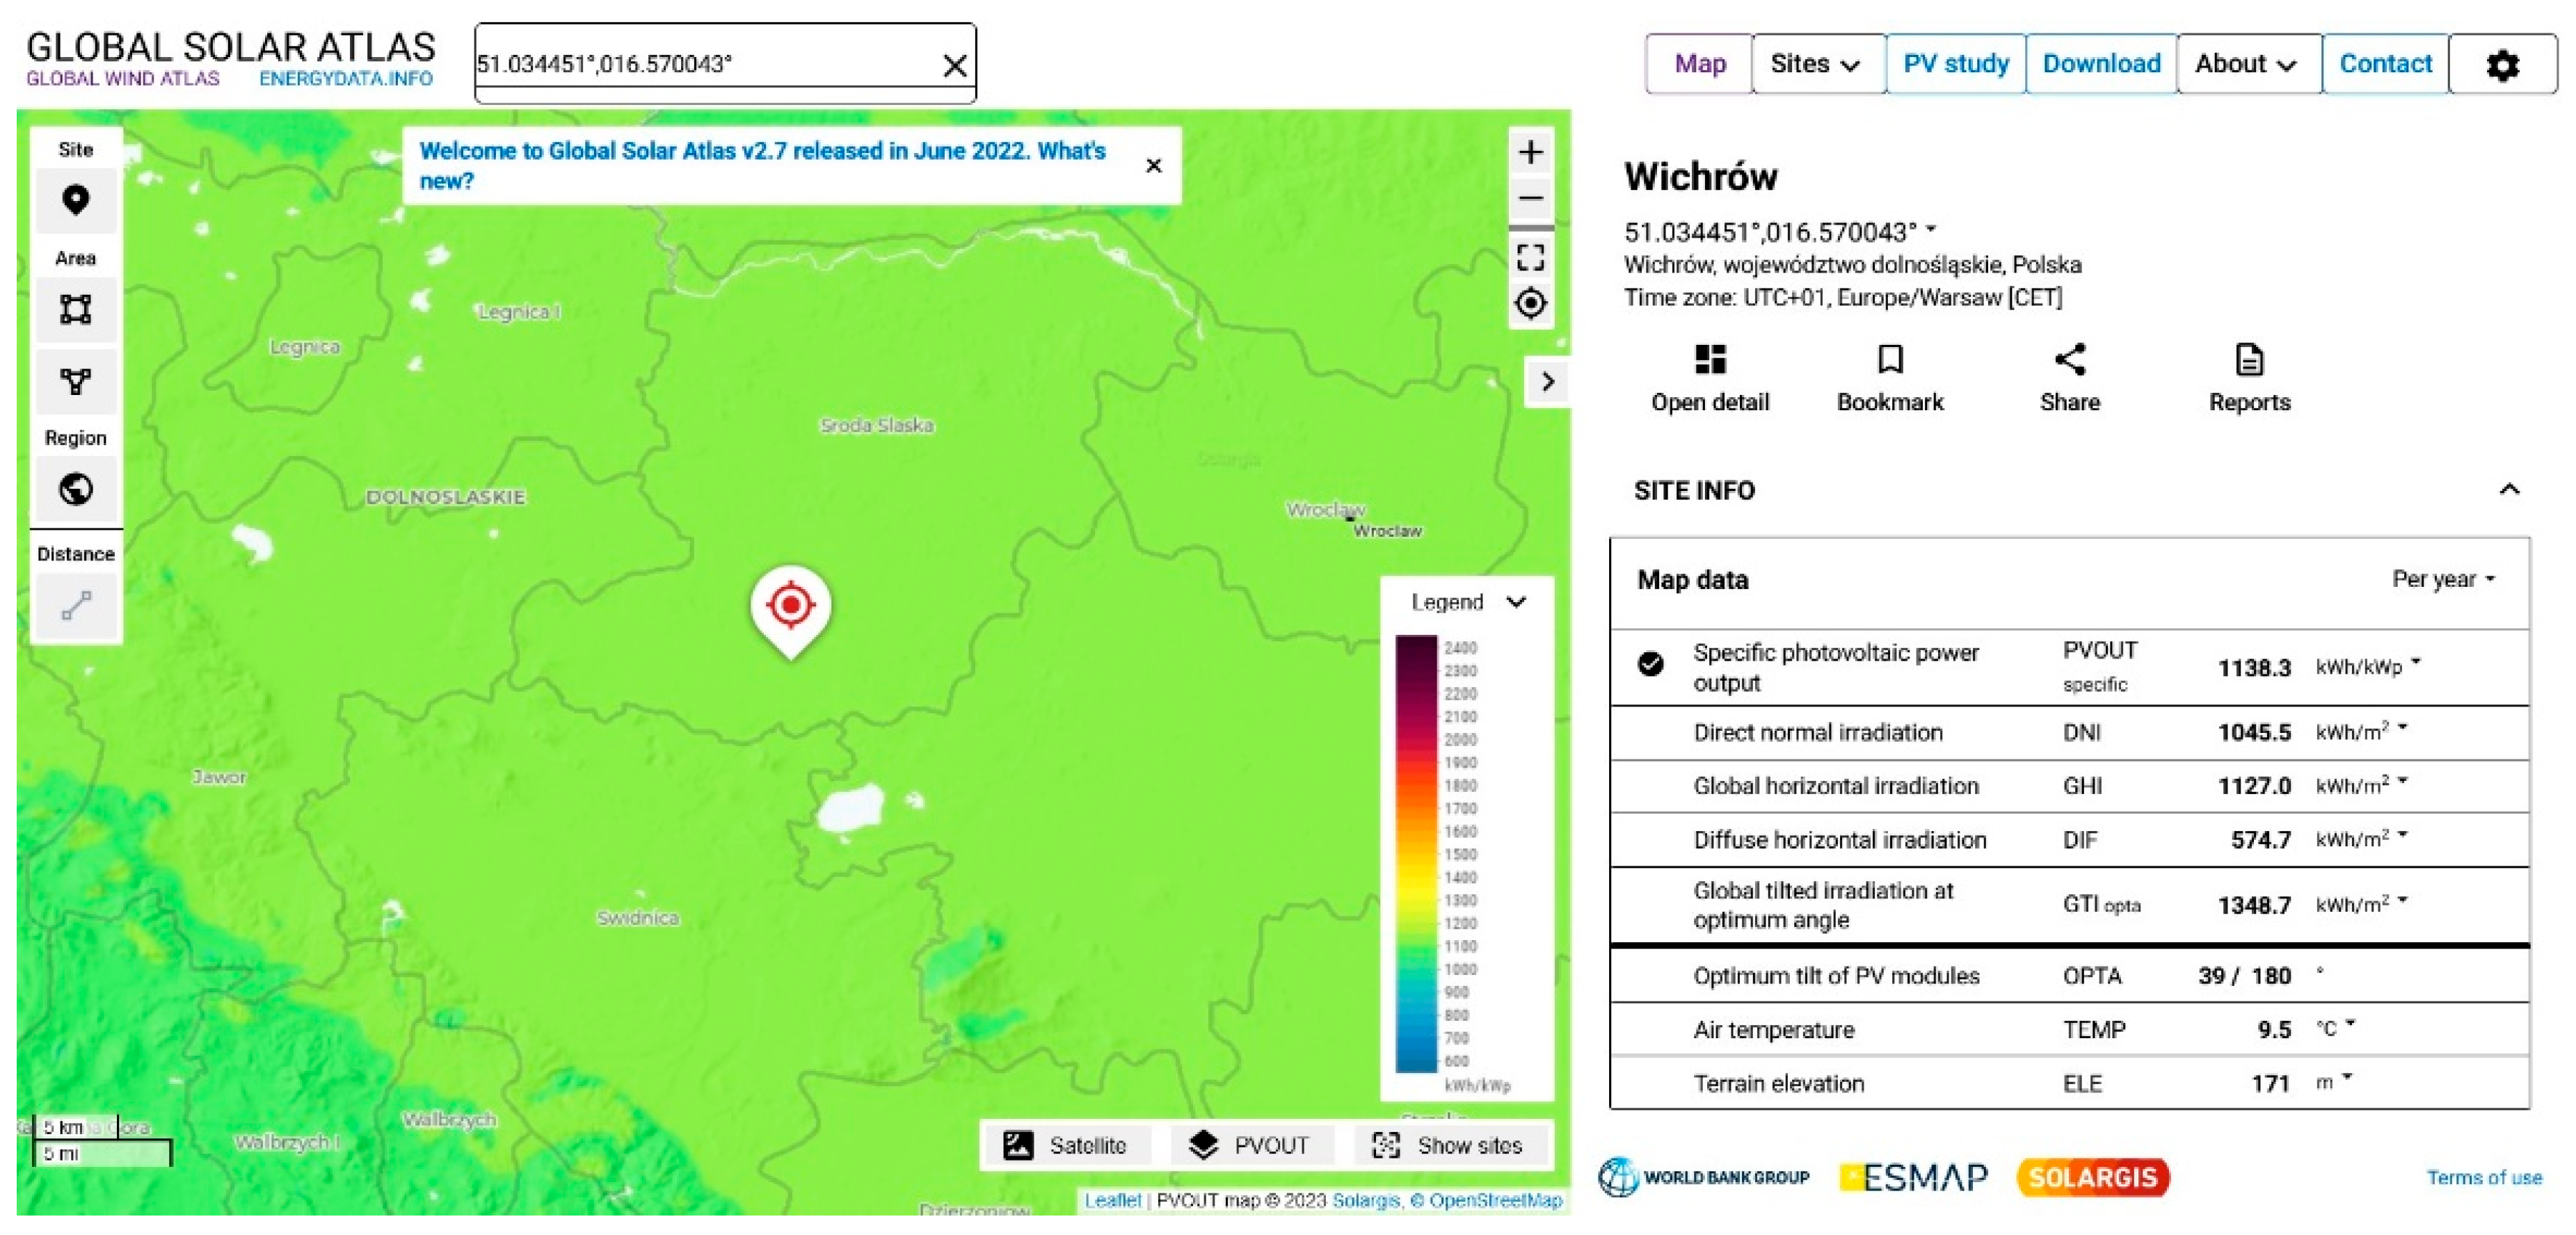
Figure 3 shows the characteristics of weather conditions for the solar farm in the selected location. It has been generated from The Global Solar Atlas software.
The weather at this location in Wichrów, Poland, is characteristic of a temperate climate with significant cloudiness. While not an extremely high-insolation area, it possesses a good potential for solar power generation, particularly when photovoltaic systems are optimized by tilting them at a 36° angle to the south. The moderate average temperature is also a positive factor for solar panel efficiency. The data points to a climate with distinct seasons, where a significant amount of the annual solar energy is received during the summer months.
Table 4 shows the entire configuration of the PV system, including the amount of energy generated individually and during the year in the selected location.
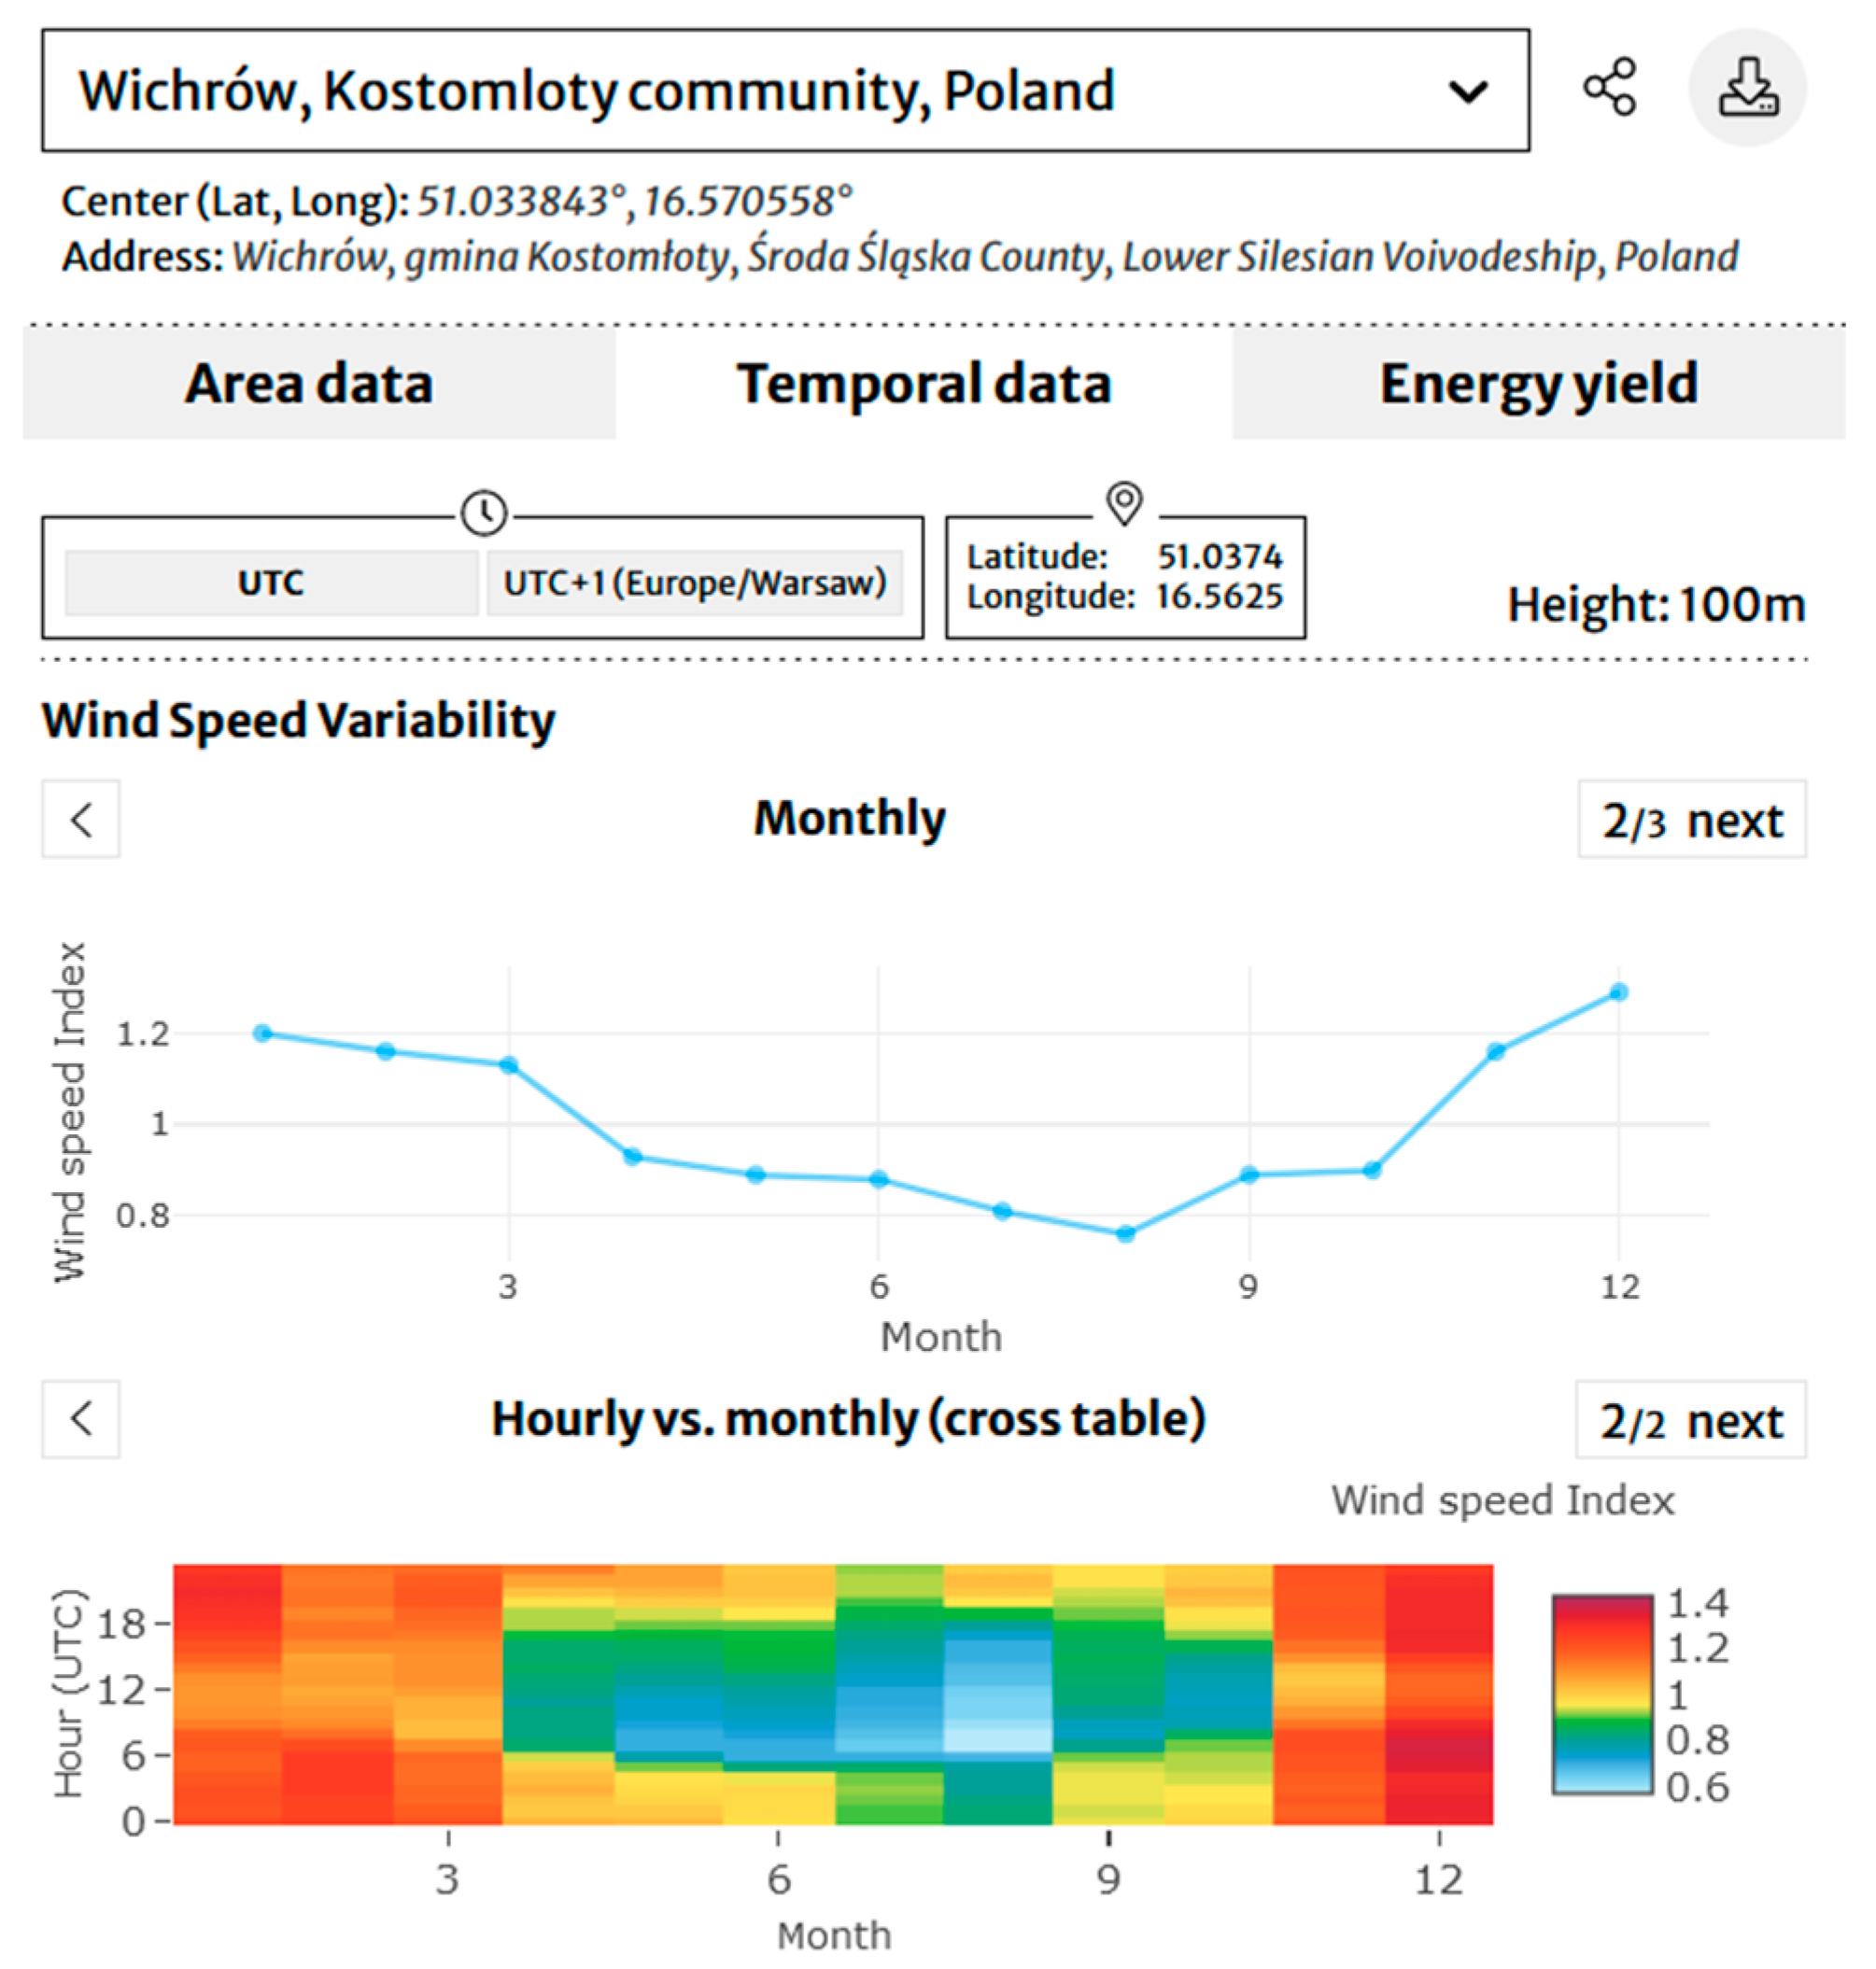
Figure 4 shows the characteristics of weather conditions for the wind farm in the selected location. It has been generated from The Global Wind Atlas software (
https://globalwindatlas.info/en/, accessed on 18 May 2025).
This area possesses a strong and commercially attractive wind resource. The key characteristics are good wind speeds and power density at a typical turbine operational height and a clear and dominant wind direction from the southwest, which simplifies wind farm design and optimization.
To ensure energy from wind turbines within the assumed parameters, energy from three turbines with a capacity of 3 MW is needed, supplemented with energy from a photovoltaic farm and an energy storage facility with the parameters listed below.
The initial selection of wind turbines (3 × 3 MW) and a photovoltaic (PV) installation (3.36 MWp) resulted from taking into account the existing infrastructure: a large petrol station on the A4 motorway in southern Poland, near which a wind farm consisting of nine turbines with a capacity of 3 MW each was already built. In the next iteration of the project, considering the characteristic windiness and insolation for this location, the smallest possible wind farm power (9 MW) and its complementary photovoltaic (PV) installation power (3.36 MWp PV) were determined. The remaining energy deficits are covered by the battery (BAT) energy storage, which acts as a buffer, storing surpluses, and releasing them during periods of insufficient production, effectively eliminating dependence on the external power grid.
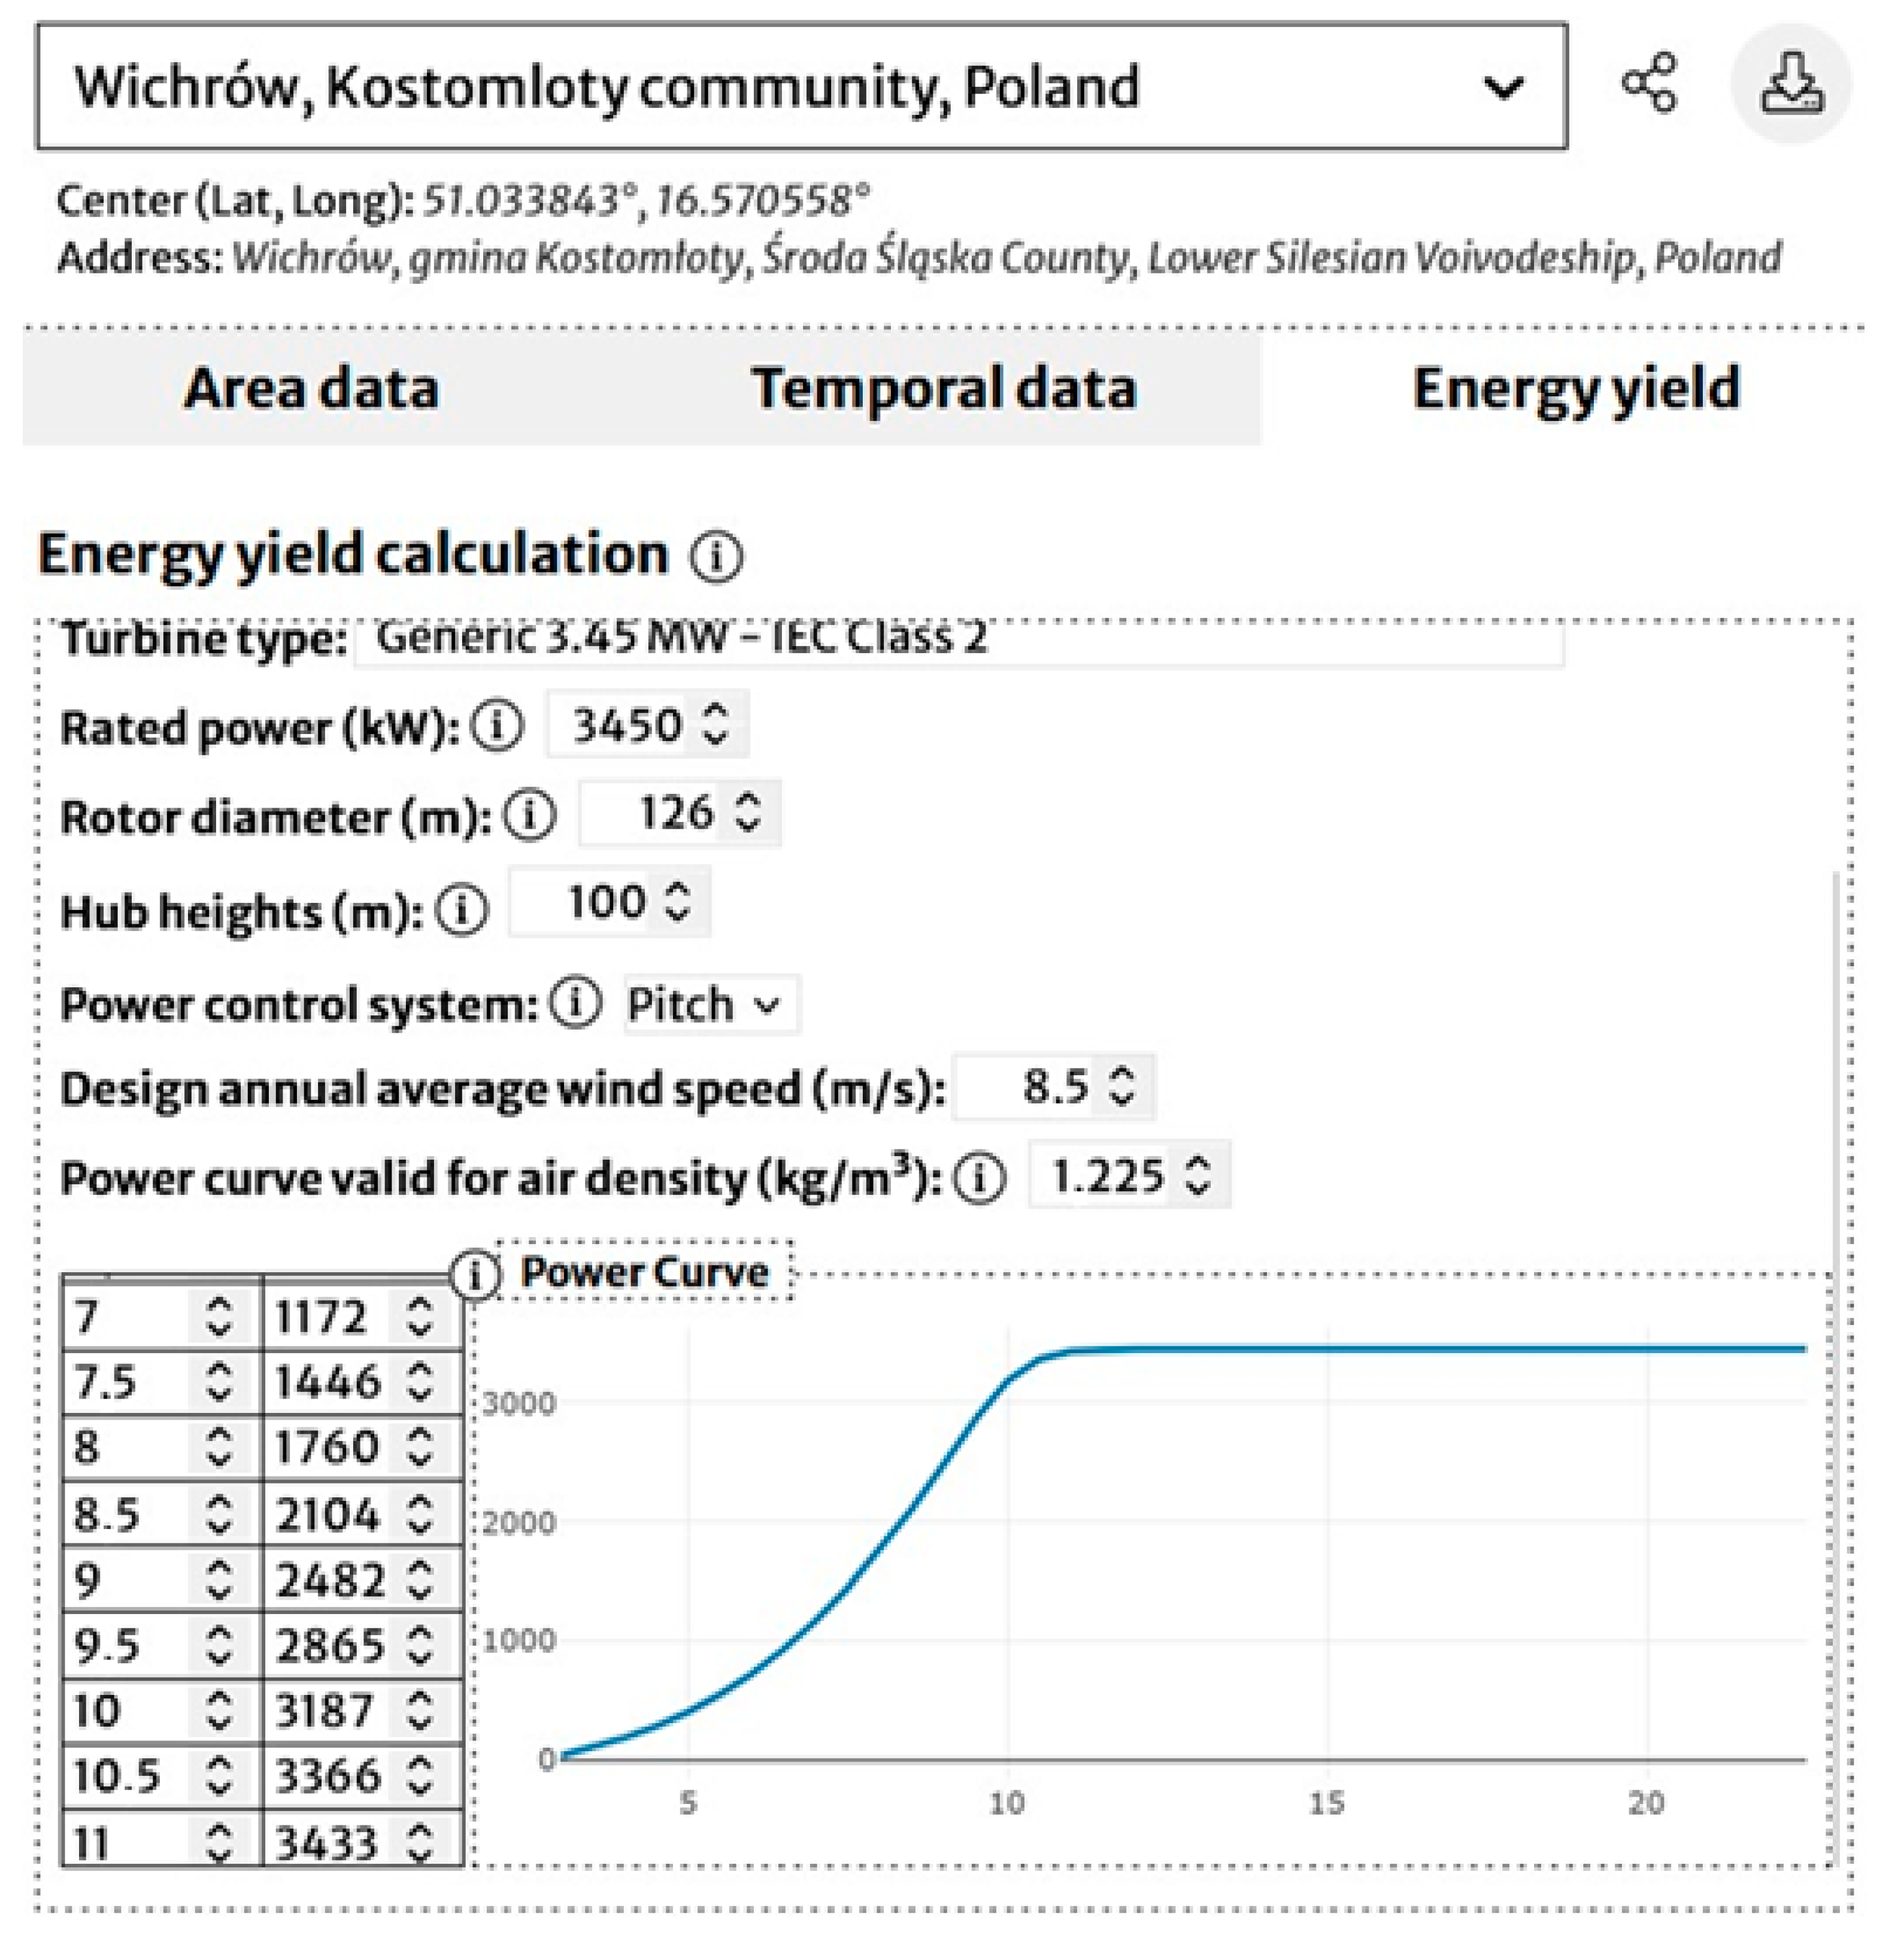
Figure 5 characterizes the performance profile of a specific wind turbine technology. By combining this power curve with the location-specific wind data (like the mean wind speed of 7.3 m/s and the wind frequency distribution from the previous analyses), one can calculate the Annual Energy Production (AEP) and the capacity factor, which are crucial metrics for assessing the economic viability of a wind power project in Wichrów.
4.3.3. Calculation of Energy Demand and Its Generation by Selected RES
The selected location is characterized by average wind and sunshine. The selected rotor is characterized by the possibility of operation even at low wind speed of 3 m/s; however, the optimum wind level for the rotor is the wind speed in the range of 8–12 m/s. In the selected location, the maximum wind speed is 9.5 m/s in the best months, i.e., in winter and autumn. In spring and summer, a PV farm is an effective supplement to wind generation. The PV and WF parameters specified above allow us to generate the amount of energy specified in the
Table 5.
To illustrate the variability of RES operation, tables showing the amount of energy obtained at a given time of operation, compared with the demand of the vehicle charging station on a daily basis in a given month, were presented.
Table 6 shows electric energy generation by wind turbines.
Table 7 shows the surplus or demand for elecrticity of the charging station after the use of wind turbines.
Table 8 shows the elecrticity generation by PV farm.
Table 9 shows the surplus or demand for elecrticity of the charging station after the use of wind turbines and PV.
The above tables show the synergy of WF operation with PV; however, due to the instability of wind energy and the lack of sufficient energy generation in the morning and evening hours from the photovoltaic farm, it is necessary to operate an energy storage that, supplied with energy from WF, balances the demand in critical periods. The energy storage must have a large capacity and power to charge electric vehicles in the absence of sufficient generation of electricity from RES.
Table 10 shows the main parameters of the selected BAT energy storage.
5. Results and Discussion
The simulation results provide detailed information on the operation of the proposed model of an electric vehicle charging station powered by renewable energy sources with an energy storage. The station is designed to support significant EV traffic (20 DC chargers, each with a capacity of 150 kW) and is located in a location with favorable renewable energy potential. The design parameters of the charging station indicate a maximum power demand of 3 MW and an annual energy demand of 16.17 GWh. The annual energy balance reveals a significant surplus of locally generated renewable energy compared to the total demand of the station. The simulation performed indicates an annual electricity consumption of the charging station of about 16.17 GWh. In turn, the total energy production from the planned wind farm and photovoltaic system is 35.9 GWh per year, including 6.7 GWh from PV and 29.2 GWh from WF. This significant oversizing of generating capacity (generated approximately 2.2 times greater than demand) is a deliberate design choice to provide a high level of energy self-sufficiency and operational resilience, particularly during periods of low or intermittent renewable generation. A characterization of weather conditions for the selected site, based on Global Solar Atlas and Global Wind Atlas data, shows the variability of available wind and solar resources throughout the year and day. Hourly wind and PV generation data illustrate seasonal and diurnal variations in wind and solar output, which are then overlaid on a table showing the hourly energy demand of the EV charging station for each month.
The projected energy demand for the charging station shows significant diurnal and seasonal variations, reflecting traffic load data from the existing gas station. The simulation clearly demonstrates the critical role of the battery storage system in the operation of the station. The battery energy storage acts as a key buffer, storing the surplus energy generated by the wind turbines and solar panels during periods when generation exceeds the immediate charging demand. This stored energy is then discharged to meet the station load during periods of insufficient RES generation. The use of the energy storage effectively mitigates the variability of renewable energy generation on the one hand and the variability of energy demand from the customers of the EV charging station on the other. This dynamic management of the energy flow between generation, storage, and demand is the basis for achieving high operational autonomy.
A key indicator resulting from the simulation is the excess electricity factor (ExEi), which measures the amount of RES energy that cannot be used in the charging station or stored in the battery. The calculated ExEi for the simulated year of operation of the EV station is 54.9%. This high percentage indicates that more than half of the generated renewable energy is potentially not used by the station in its current configuration. This may happen because the battery is full and the generation still exceeds the demand, or simply because the generation significantly exceeds the demand even when the battery is operating.
The simulation results based on the assumptions made regarding the generation and consumption profiles and the size of the energy storage allow us to conclude that the designed system allows the station to operate autonomously without the need to import energy from the external power grid.
Table 9 shows the energy deficit that occurs when the instantaneous RES generation falls below the station demand; however, according to the model parameters, this deficit is fully covered by the energy discharged from the battery storage system, as shown in
Table 11. Thus, for the simulated period and conditions, the dependence on the grid is effectively eliminated, confirming the high level of independence that can be achieved with the proposed hybrid system. The results are inherently sensitive to the input data, in particular the assumed traffic profiles from the existing station in
Table 1 and the weather conditions presented in the wind and solar resource data
Figure 3,
Figure 4 and
Figure 5,
Table 4. Changes to these factors can alter the balance between demand and generation, affecting both the required dispatch of the energy storage and the resulting ExEi value. Further analysis investigating the sensitivity to different traffic scenarios or taking into account weather variability throughout the year could provide a more robust understanding of the system’s performance range.
Table 11 shows stored elecricity of the charging station after using WF, PV, and BAT energy storage.
An increase in demand by 10% causes the station’s own energy shortage only in August between 17:00 and 23:00, and by 20% causes the station’s operation to need to be supported from the grid in July and August. Shortages occur mainly between 16 and 24 h. A 10% drop in the wind power utilization factor causes small energy shortages in August between 17 and 20 h, amounting to a maximum of 1.6 MWh. This would reduce the possibility of charging vehicles at that time by 22% or force the station to be supplied from the grid. Further work will develop methods to enhance the stability of the proposed solution.
In summary, the simulation confirms the technical feasibility of operating a high-power electric vehicle charging station, operating mainly on the basis of local RES and energy storage. The obtained results indicate the possibility of operating autonomous hybrid systems, which can have a significant contribution to the development of renewable energy sources and electromobility. The challenge of managing significant energy surpluses is also significant, which is an area of potential future optimization of the management of produced and consumed energy.
6. Conclusions
The development of autonomous charging stations for electric vehicles powered by renewable energy sources is a promising solution for the future of electromobility. The AFIR Regulation in the European Union emphasizes the need to build charging infrastructure and provide sufficient power for it. The simulation carried out showed the possibility of operating a large vehicle charging station based on renewable energy sources of production and storage. The proposed energy sources compensated for their generation in both the daily and monthly cycles. The small negative values of energy demand obtained in certain periods indicate the need to supplement energy shortages occurring mainly in the summer, when the wind is weaker and the solar panels overheat and do not work at full power. The BAT storage, charged during periods of excess generated energy, prevents further oversizing of energy generators and provides a buffer, securing the operation of the charging station.
The presented model of the autonomous vehicle charging station operation was based on simple solutions enabling calculations in a spreadsheet using parameters obtained from the Global Solar Atlas and Global Wind Atlas. The constructed model is characterized by a high value of the ExEi coefficient, indicating how much generated energy was not used by the vehicle charging station. In the analyzed case, the ExEi coefficient was 54.9%. This is a value characteristic of projects operating based on RES, where the main determinant is ensuring continuity of operation [
28]. The simulation results show that thanks to the use of a combination of wind farms, photovoltaic systems, and an energy storage, charging stations can operate autonomously regardless of the power grid failure and reduce its load. The discussed solution allows for reducing expenditure on network infrastructure and directly affects the reduction in greenhouse gas emissions and other air pollutants. The next step should be further optimization of energy generators, energy storage facilities and considering the possibility of greater load diversity of charging stations, taking into account a possible barrier or price promotion forcing demand for the service at a specific RES energy generation.
Further optimization of energy sources and energy storage devices should be carried out, and the possibility of greater load diversification for charging stations should be considered, including potential price barriers or promotions influencing demand for the service at a specific renewable energy generation. Sensitivity analysis demonstrated that worsening wind conditions or increased demand does not cause a collapse in charging supply. Only in critical months (summer) might there be a temporary limitation of supply. It is worth considering potential price barriers if the station’s power supply is limited due to economic or technical reasons.
Author Contributions
Conceptualization, R.K. and D.S.; Methodology, R.K., W.A. and D.S.; Software, R.K.; Validation, R.K. and D.S.; Formal analysis, R.K. and D.S.; Investigation, R.K. and W.A.; Resources, R.K. and D.S.; Data curation, R.K.; Writing–original draft, R.K.; Writing—review & editing, W.A. and D.S.; Visualization, R.K. and W.A.; Supervision, D.S. All authors have read and agreed to the published version of the manuscript.
Funding
This research received no external funding.
Data Availability Statement
The original contributions presented in this study are included in the article. Further inquiries can be directed to the corresponding authors.
Conflicts of Interest
The authors declare no conflict of interest.
References
- Iliana, I.; Bremdal, B. Flexibility-enhancing charging station to support the integration of electric vehicles. World Electr. Veh. J. 2021, 12, 53. [Google Scholar] [CrossRef]
- Vilathgamuwa, M.; Mishra, Y.; Yigitcanlar, T.; Bhaskar, A.; Wilson, C. Mobile-Energy-as-a-Service (MEaaS): Sustainable Electromobility via integrated Energy–Transport–urban infrastructure. Sustainability 2022, 14, 2796. [Google Scholar] [CrossRef]
- Das, H.S.; Rahman, M.M.; Li, S.; Tan, C.W. Electric vehicles standards, charging infrastructure, and impact on grid integration: A technological review. Renew. Sustain. Energy Rev. 2020, 120, 109618. [Google Scholar] [CrossRef]
- Al-Shetwi, A.Q. Sustainable development of renewable energy integrated power sector: Trends, environmental impacts, and recent challenges. Sci. Total Environ. 2022, 822, 153645. [Google Scholar] [CrossRef]
- Judge, M.A.; Khan, A.; Manzoor, A.; Khattak, H.A. Overview of smart grid implementation: Frameworks, impact, performance and challenges. J. Energy Storage 2022, 49, 104056. [Google Scholar] [CrossRef]
- Dziennik Urzędowy. C 58/2021—EUR-Lex. Available online: https://eur-lex.europa.eu/legal-content/PL/TXT/HTML/?uri=OJ:C:2021:058:FULL (accessed on 20 April 2024).
- Rozporządzenie Parlamentu Europejskiego i Rady (UE) 2023/1804 z Dnia 13 Września 2023 r. w Sprawie Rozwoju Infrastruktury Paliw Alternatywnych i Uchylenia Dyrektywy 2014/94/UE. Available online: https://eur-lex.europa.eu/legal-content/PL/ALL/?uri=CELEX:32023R1804 (accessed on 18 April 2025).
- EV Global Data Explorer. Explore Historical and Projected Data on Electric Vehicles Sales, Stock, Charging Infrastructure and Oil Displacement. Available online: https://www.iea.org/data-and-statistics/data-tools/global-ev-data-explorer (accessed on 10 June 2025).
- Licznik AFIR: Polska Spełnia Wymogi Dotyczące Mocy, Ale z Rozbudową Ładowarek Przy Sieci TEN-T Jest Znacznie Gorzej—PSNM—Polskie Stowarzyszenie Nowej Mobilności. Available online: https://psnm.org/licznik-afir-polska-spelnia-wymogi-dotyczace-mocy-ale-z-rozbudowa-ladowarek-przy-sieci-ten-t-jest-znacznie-gorzej/ (accessed on 18 April 2025).
- Bordoff, J.; O’Sullivan, M. The Age of Energy Insecurity. How the Fight for Resources is Upending Geopolitics. Foreign Aff. 2023, 102, 104. [Google Scholar]
- Bouckaert, S.; Pales, A.F.; McGlade, C.; Remme, U.; Wanner, B.; Varro, L.; D’Ambrosio, D.; Spencer, T. Net Zero by 2050. A Roadmap for the Global Energy Sector; International Energy Agency: Paris, France, 2021. [Google Scholar]
- Eid, A.; Mohammed, O.; El-Kishky, H. Efficient operation of battery energy storage systems, electric-vehicle charging stations and renewable energy sources linked to distribution systems. J. Energy Storage 2022, 55, 105644. [Google Scholar] [CrossRef]
- Singh, S.; Jagota, S.; Singh, M. Energy management and voltage stabilization in an islanded microgrid through an electric vehicle charging station. Sustain. Cities Soc. 2018, 41, 679–694. [Google Scholar] [CrossRef]
- Wang, D.; Locment, F.; Sechilariu, M. Modeling, simulation, and management strategy of an electric vehicle charging station based on a DC microgrid. Appl. Sci. 2020, 10, 2053. [Google Scholar] [CrossRef]
- Sayed, K.; Abo-Khalil, A.; Alghamdi, A. Optimum resilient operation and control DC microgrid based electric vehicles charging station powered by renewable energy sources. Energies 2019, 12, 4240. [Google Scholar] [CrossRef]
- Hussain, A.; Bui, V.-H.; Baek, J.-W.; Kim, H.-M. Stationary energy storage system for fast EV charging stations: Optimality analysis and results validation. Energies 2020, 13, 230. [Google Scholar] [CrossRef]
- Das, B.K.; Nemani, S.; Singh, V.; Kumar, N.M.; Al-Ansari, T.; Lee, M. Techno-economic feasibility analysis of stand-alone and grid-connected PV/Wind/Diesel/Batt hybrid energy system: A case study. Energy Strategy Rev. 2021, 37, 100673. [Google Scholar] [CrossRef]
- Singh, A.; Baredar, P.; Gupta, B. Techno-economic feasibility analysis of hydrogen fuel cell and solar photovoltaic hybrid renewable energy system for academic research building. Energy Convers. Manag. 2017, 145, 398–414. [Google Scholar] [CrossRef]
- Amrouche, S.O.; Rekioua, D.; Rekioua, T.; Bacha, S. Overview of energy storage in renewable energy systems. Energy 2016, 41, 20914–20927. [Google Scholar] [CrossRef]
- Möller, M.; Krauter, S. Hybrid Energy System Model in Matlab/Simulink Based on Solar Energy, Lithium-Ion Battery and Hydrogen. Energies 2022, 15, 2201. [Google Scholar] [CrossRef]
- Global Solar Atlas. Available online: https://globalsolaratlas.info/support/about (accessed on 20 April 2023).
- Global Wind Atlas. The Current Version of the Global Wind Atlas (GWA 3.3) Is the Product of a Partnership Between the Department of Wind Energy at the Technical University of Denmark (DTU Wind Energy) and the World Bank Group (Consisting of The World Bank and the International Finance Corporation.). Available online: https://globalwindatlas.info (accessed on 20 April 2023).
- Cambini, C.; Congiu, R.; Soroush, G. Regulation, innovation, and systems integration: Evidence from the EU. Energies 2020, 13, 1670. [Google Scholar] [CrossRef]
- Boateng, N.S.; Liscio, M.C.; Sospiro, P.; Talluri, G. Economic Cost–Benefit Analysis on Smart Grid Implementation in China. Sustainability 2025, 17, 2946. [Google Scholar] [CrossRef]
- Czarnecki, M.; Magulski, M. Flexibility of the Polish Power System. Diagnosis, Potential, Solutions; Forum Energii: Warsaw, Poland, 2019. [Google Scholar]
- Simla, T.; Stanek, W. Reducing the impact of wind farms on the electric power system by the use of energy storage. Renew. Energy 2020, 145, 772–782. [Google Scholar] [CrossRef]
- Szumska, E. Electric Vehicle Charging Infrastructure along Highways in the EU. Energies 2023, 16, 895. [Google Scholar] [CrossRef]
- Zebra, E.I.C.; van der Windt, H.J.; Olubayo, B.; Nhumaio, G.; Faaij, A.P. Scaling up the electricity access and addressing best strategies for a sustainable operation of an existing solar PV mini-grid: A case study of Mavumira village in Mozambique. Energy Sustain. Dev. 2023, 72, 58–82. [Google Scholar] [CrossRef]
| Disclaimer/Publisher’s Note: The statements, opinions and data contained in all publications are solely those of the individual author(s) and contributor(s) and not of MDPI and/or the editor(s). MDPI and/or the editor(s) disclaim responsibility for any injury to people or property resulting from any ideas, methods, instructions or products referred to in the content. |
© 2025 by the authors. Licensee MDPI, Basel, Switzerland. This article is an open access article distributed under the terms and conditions of the Creative Commons Attribution (CC BY) license (https://creativecommons.org/licenses/by/4.0/).


