Article

Reinjection of Produced Water into Formations in Unconventional Gas Reservoirs

National Key Laboratory of Oil and Gas Reservoir Geology and Exploitation, Southwest Petroleum University, Chengdu 610500, China
*
Author to whom correspondence should be addressed.
Energies 2025, 18(12), 3149; https://doi.org/10.3390/en18123149
Submission received: 10 May 2025 / Revised: 6 June 2025 / Accepted: 12 June 2025 / Published: 16 June 2025

Abstract

This paper provides a comprehensive analysis of gas field produced water from four perspectives: water sources, chemical composition, treatment methods, and application scenarios. It identifies critical challenges in current formation reinjection practices, including poor containment performance for injection layers, difficulties in optimal layer selection, and uncertainties in injection volume determination. To address these issues, systematic selection criteria for reinjection layers were established. Taking a depleted gas reservoir in the Ordos Basin as a case study, we conducted a geological analysis of candidate formations based on previous research findings. We set up three groups of schemes regarding injection wells, injection rate, and permeability inhomogeneity and studied reservoir reinjection water volume, reinjection formation pressure, reinjection waves and range, and reinjection safety using three-dimensional numerical simulation technology. Finally, we selected the preferred scheme of reinjection well location in consideration of permeability inhomogeneity, with a cumulative reinjection volume of 1554.3 × 104 m3 and a change in reinjection formation pressure of 0~20 MPa. The pressure change in the upper overburden of the reinjection layer was kept within 3 MPa, a value consistent with actual historical reinjection data, confirming again the accuracy of this layer selection strategy and the aforementioned layer selection analysis and providing a basis for layer selection and reinjection safety for the assessment of recovered water reinjection in other unconventional gas reservoirs.

1. Introduction

With the continuous development of science and technology, the demand for energy is rising sharply. From the perspective of national strategic development, the demand for natural gas has increased substantially in order to cope with climate change and accelerate the low-carbon transformation of the energy sector. The statistics on the world’s explored oil and gas reserves reveal that conventional and unconventional oil and gas account for 20% and 80% of the total oil and gas resources, respectively [1]. By the end of 2023, China had accumulated more than 1.8 trillion cubic meters of verified unconventional oil and gas reserves, accounting for 47% of the total reserves of all oil and gas. Although China’s unconventional natural gas resources are widely distributed and the total quantity of recoverable resources is vast, problems such as the scattered distribution of oil and gas resources in the subsurface, the difficulty of extraction, and high water consumption remain [2]. In the middle and late stages of the development of unconventional gas fields, often due to the decline in formation pressure leading increased water content in gas wells, gas wells are subject to production reduction or flood with water, which are processes often used as measures to drain water in order to maintain the normal production of the gas wells, but for many gas wells, there is no clear method for properly dealing with the extracted water, presenting a difficult problem that cannot be avoided [3].
To solve the problems hampering gas field produced water treatment, scholars at home and abroad have conducted a great deal of research, which can broadly be divided into four main topics: produced water treatment process and application [4,5]; physical and chemical reactions between produced water and formations [6,7,8]; the corrosive effect of produced-water reinjection on wellbores and pipelines [9,10]; and produced-water reinjection capacity [11,12,13]. Bao et al. [14] and others have proposed process design optimization measures for the practical application of extracted-water treatment technology and problems in its implementation. Huang et al. [15] and others revealed the effect of water–rock interactions occurring during reinjection on the porosity of a reservoir through experimental and numerical modeling methods. Su et al. [16] and others have explored the influence of microbes on corrosion and the corresponding mechanisms in the course of the reinjection of water through physical experiments. Yu et al. [17] proposed a new method for enhancing reinjection efficiency by using radial well technology, which can alleviate near-borehole blockages and significantly improve the reinjection capacity of sandstone reservoirs.
There is an ever-increasing volume of research on the scale of gas field produced-water reinjection and the safety of reinjection, but there is a lack of more detailed discussions on the safety of gas field produced-water reinjection strata and the amount of water reinjected. Thus, in this paper, we provide an overview of gas field produced water, take the principle of stratum selection as a benchmark, select the preferred reinjection stratum according to geological and logging data, and identify the cumulative amount of water to be reinjected and the change in formation pressure when water is reinjected into strata, as derived using a numerical simulation method. A numerical simulation was used to uncover the cumulative reinjection volume and change in formation pressure when a formation is reinjected with water, and the simulation results were verified in accordance with an actual reinjection scenario.

2. Overview of Produced-Water Treatment in Gas Fields

2.1. Produced Water in Gas Fields

In relation to gas fields, produced water generally refers to groundwater brought to the surface during normal production operations in various types of gas reservoirs. It typically contains soluble salts, toxic metal minerals, oil contaminants, harmful gases, suspended solids, microorganisms, and bacteria [18]. Influenced by factors such as reservoir properties, fracturing fluid composition, and development strategies, produced water exhibits diverse characteristics, including different emulsification types, water quality profiles, chemical compositions, salinity levels, and suspended solids content values. Notably, unconventional gas fields are characterized by high salinity (elevated salt ion concentrations), significant fluctuations in chemical oxygen demand (COD), pronounced water quality variability [19], complex compositional matrices, and elevated levels of suspended solids (SS) and COD. The direct discharge of such wastewater can cause severe environmental damage, endangering industrial activities and public health [20].

2.2. Methods for Treating Produced Water in Gas Fields

Studies indicate that the current produced-water treatment methods used in gas fields, both domestically and internationally, can be categorized into three primary approaches: reinjection into formations, compliant discharge after meeting regulatory standards, and resource utilization [21,22].

2.2.1. Reinjection into Formations

Formation reinjection is the practice of injecting treated produced water from gas fields back into geological formations after it meets required water reinjection standards. This method offers advantages, including relatively low investment costs, simplified treatment processes, and the capacity to compensate for subsurface voids created during reservoir development. However, it poses inherent long-term environmental risks: if the target injection zone exhibits inadequate confinement, reinjected wastewater may migrate and contaminate groundwater resources, consequently posing threats to local ecological systems.

2.2.2. Compliant Discharge After Meeting Regulatory Standards

Compliance discharge is the practice of releasing produced water from gas fields into designated offshore deepwater zones or desert areas after removing contaminants through single or multi-stage treatment processes. It is employed when there is a reduced demand for water allocation and reinjection is prohibited, necessitating disposal. This method is employed only when the treated effluent meets applicable discharge standards. Its advantages include its capacity to localize and mitigate the scope of environmental threats through controlled discharge at specified sites. However, significant drawbacks remain: China currently lacks nationally standardized discharge criteria for gas field produced water, resulting in stringent regional restrictions on implementation. Additionally, the transportation costs for conveying compliance-treated produced water to remote discharge locations remain a substantial operational burden.

2.2.3. Resource Utilization

Comprehensive utilization primarily encompasses three approaches: internal reuse, external reuse, and resource recovery of valuable components.
1.
Internal reuse
Internal reuse involves treating gas field produced water to a certain standard, blending it with conventional water resources, and using it again for drilling, fracturing, and other construction activities within the gas field. This practice saves water resources and reduces costs. However, the process of treating the extracted water to meet different construction requirements is more demanding and costly.
2.
External reuse
External reuse refers to the standardized treatment of extracted water to meet certain usage standards. This water is used for purposes other than oil-and-gas-field production and development, including firefighting, agriculture, and industry. The advantage of this practice is that the high content of inorganic salts in the treated water promotes plant growth for agricultural irrigation. The disadvantage is that the secondary use of the extracted water is subject to different treatment standards, which are also affected by cost and efficiency.
3.
Recycling of Valuable Components
The resourceful recycling of valuable components involves extracting high-value substances from gas field produced water and recycling them to save resources such as metal ions, rare-earth elements, and organic minerals. The advantage of this practice is that the extracted valuable substances can subsidize part of the treatment cost and, at the same time, reduce the burden on subsequent treatment processes as a preliminary treatment. The disadvantage is that the process is currently at the laboratory stage; industrial processes still require improvements to the extraction process and means as well as unified norms [23,24].

2.3. Applications of Produced-Water Reinjection in Gas Fields

Drawn from the domestic and international literature and related information, some cases of extracted-water reinjection practices used in oil and gas fields worldwide are shown in Table 1. The United States was the first to propose and use reinjection technology. Initially employed to save on the cost of disposal of waste materials, they proposed burying the contaminated materials in the deep stratum of a closed space in order to isolate the pollutants and avoid harming the ecological environment. Subsequently, as technological advancements and operational expertise accumulated, the technical feasibility and operational efficiency of reinjection were systematically validated. This progress gave rise to derivative applications, including CO2 sequestration for environmental protection, acid gas burial (generated during gas reservoir development) to minimize environmental contamination, and underground natural gas storage for strategic reserves.
According to statistical data, the United States operates over 760,000 reinjection wells nationwide, with approximately 190,000 of them dedicated to reinjecting treated oil-and-gas-field produced fluids, accounting for one-quarter of the total. Notably, over 90% of the produced water from gas reservoirs has been reinjected into geological formations in recent years, underscoring the dominant role of reinjection technology in produced fluid management [25]. In China, reinjection practices have been used in major gas fields in the Sichuan and Ordos Basins for decades. A dual-mode system combining reinjection with comprehensive utilization is currently employed in the Sichuan Basin, while single-mode reinjection is the predominant method used in the Ordos Basin. Despite widespread adoption, practical challenges persist. For example, fluid channeling occurs due to inadequate formation confinement or poor fluid–rock compatibility between reinjected water and reservoir lithology; there are uncertain injectivity limits of target formations, complicating injection volume optimization; and there are technical and economic constraints of reinjection well siting, including high operational costs and geological complexity.

3. Research on the Reinjection of Produced Water into Formations in Gas Fields

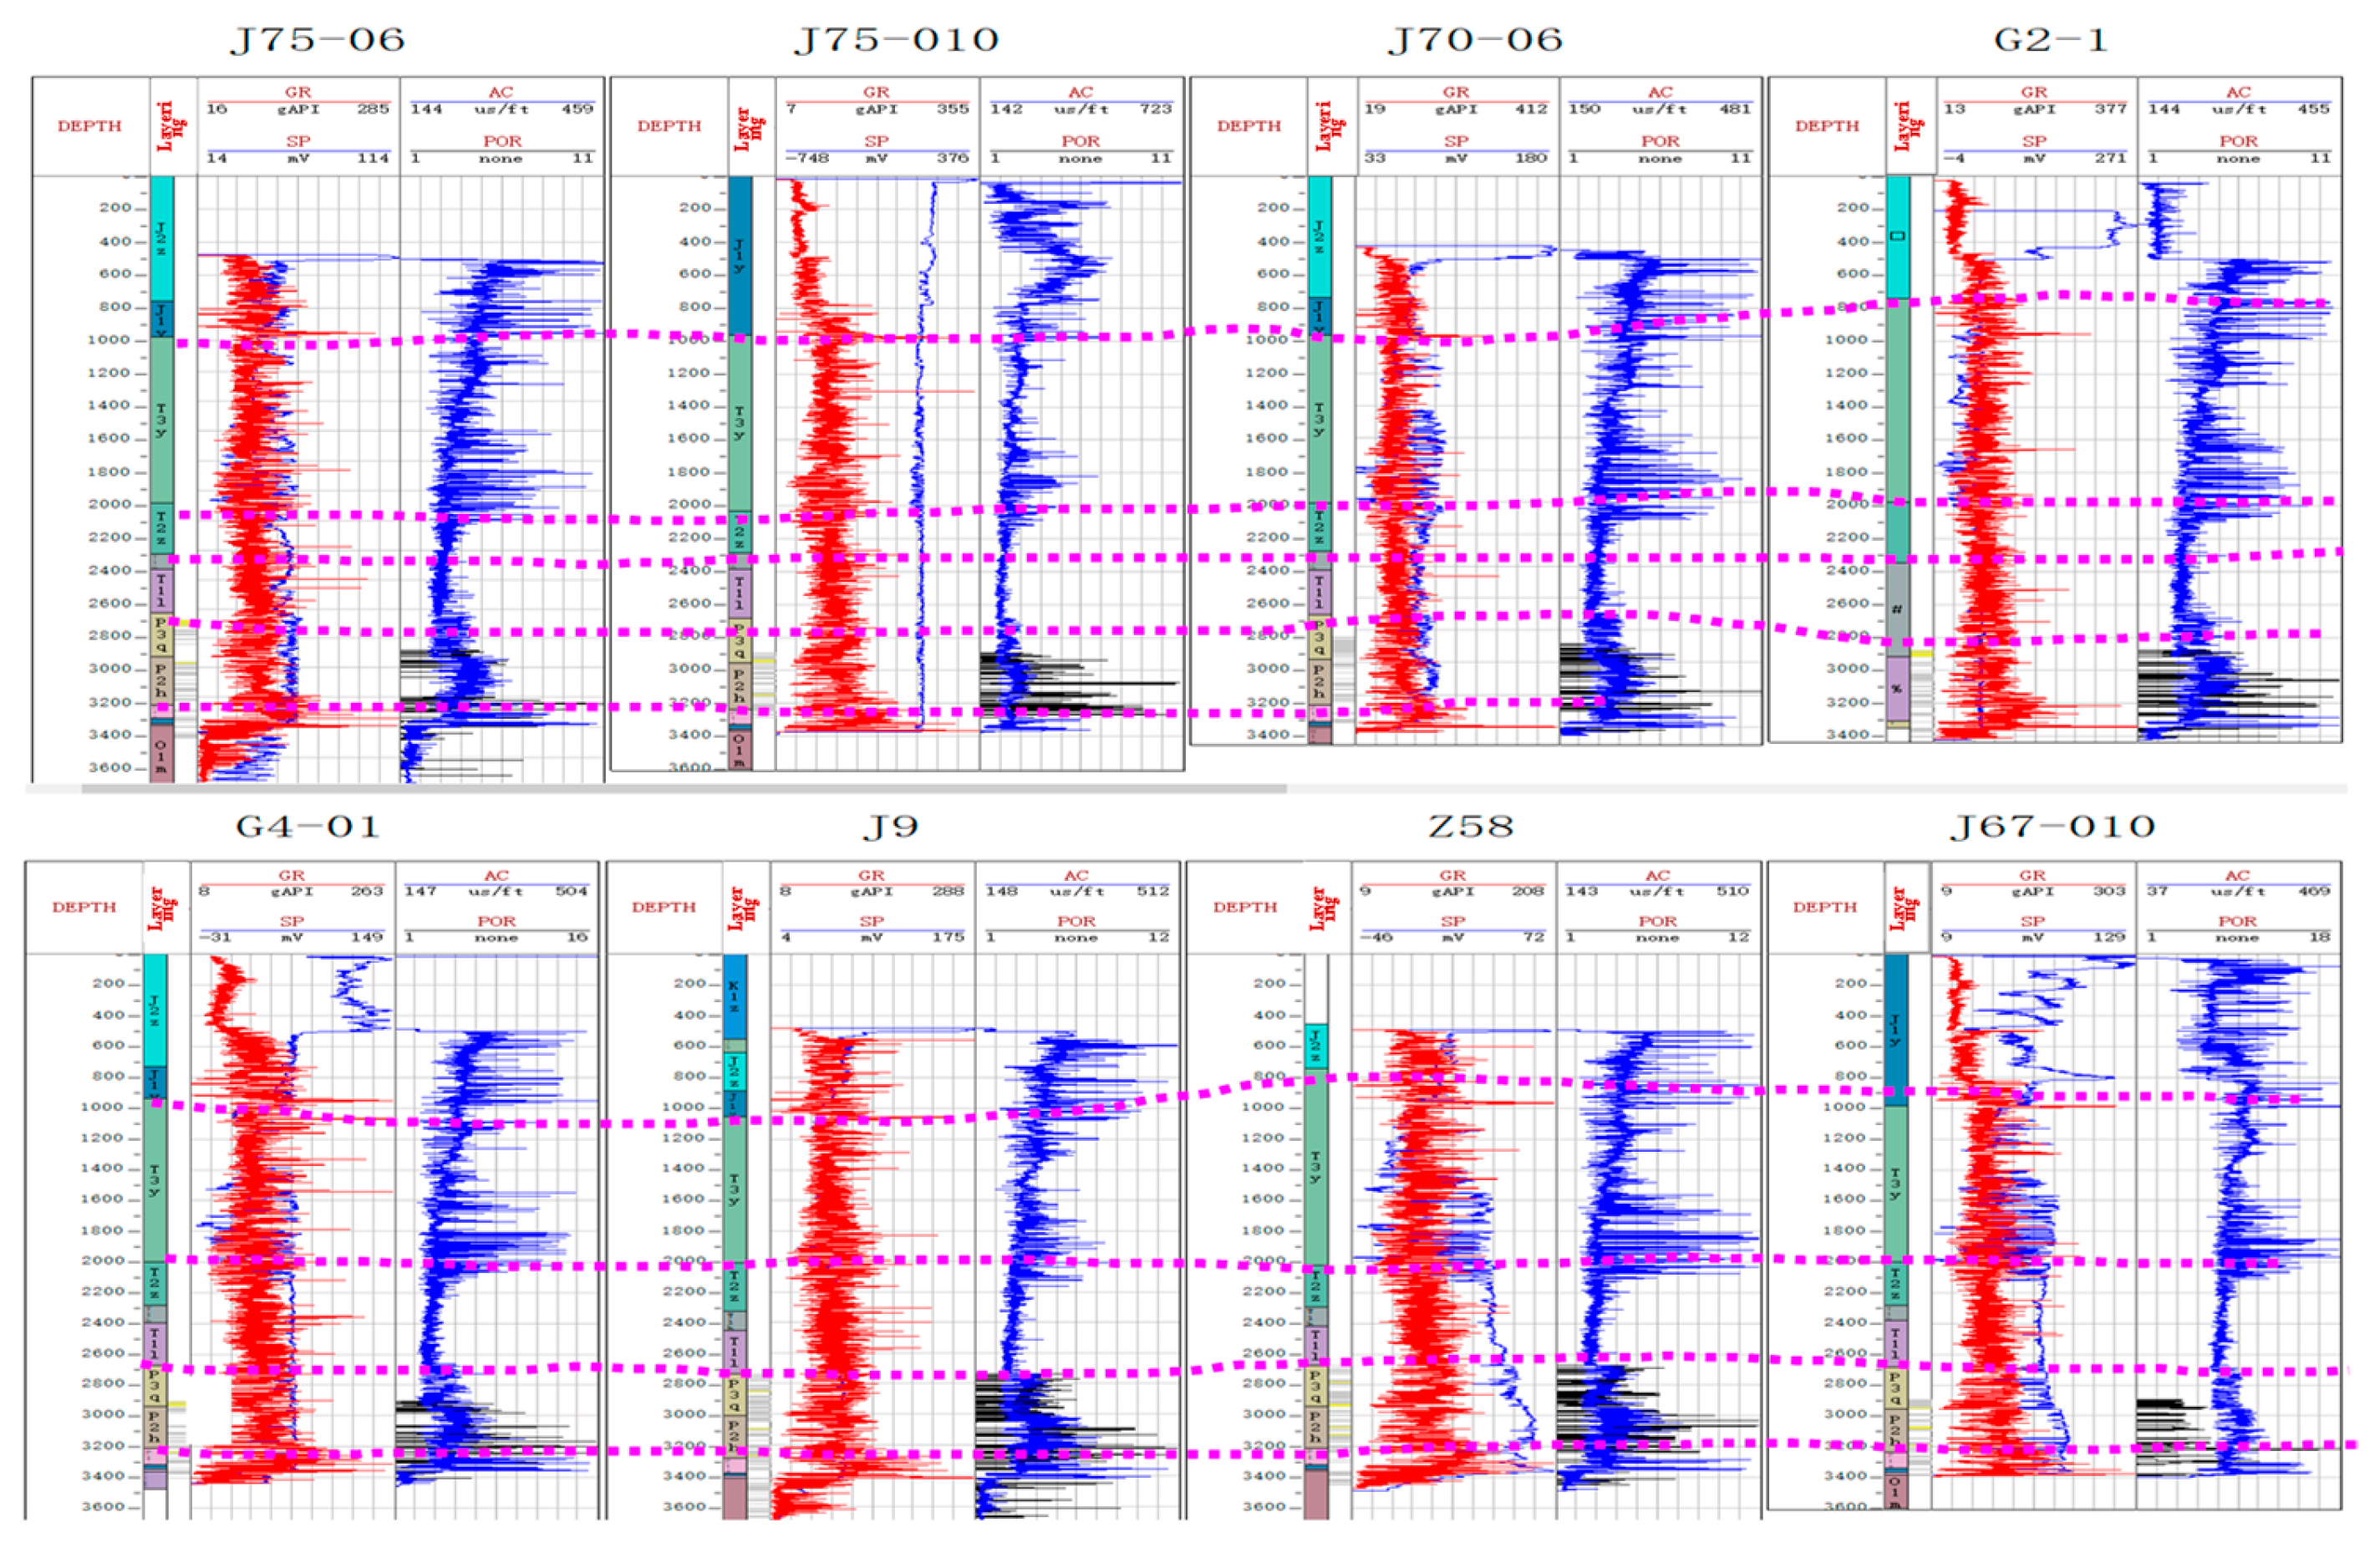
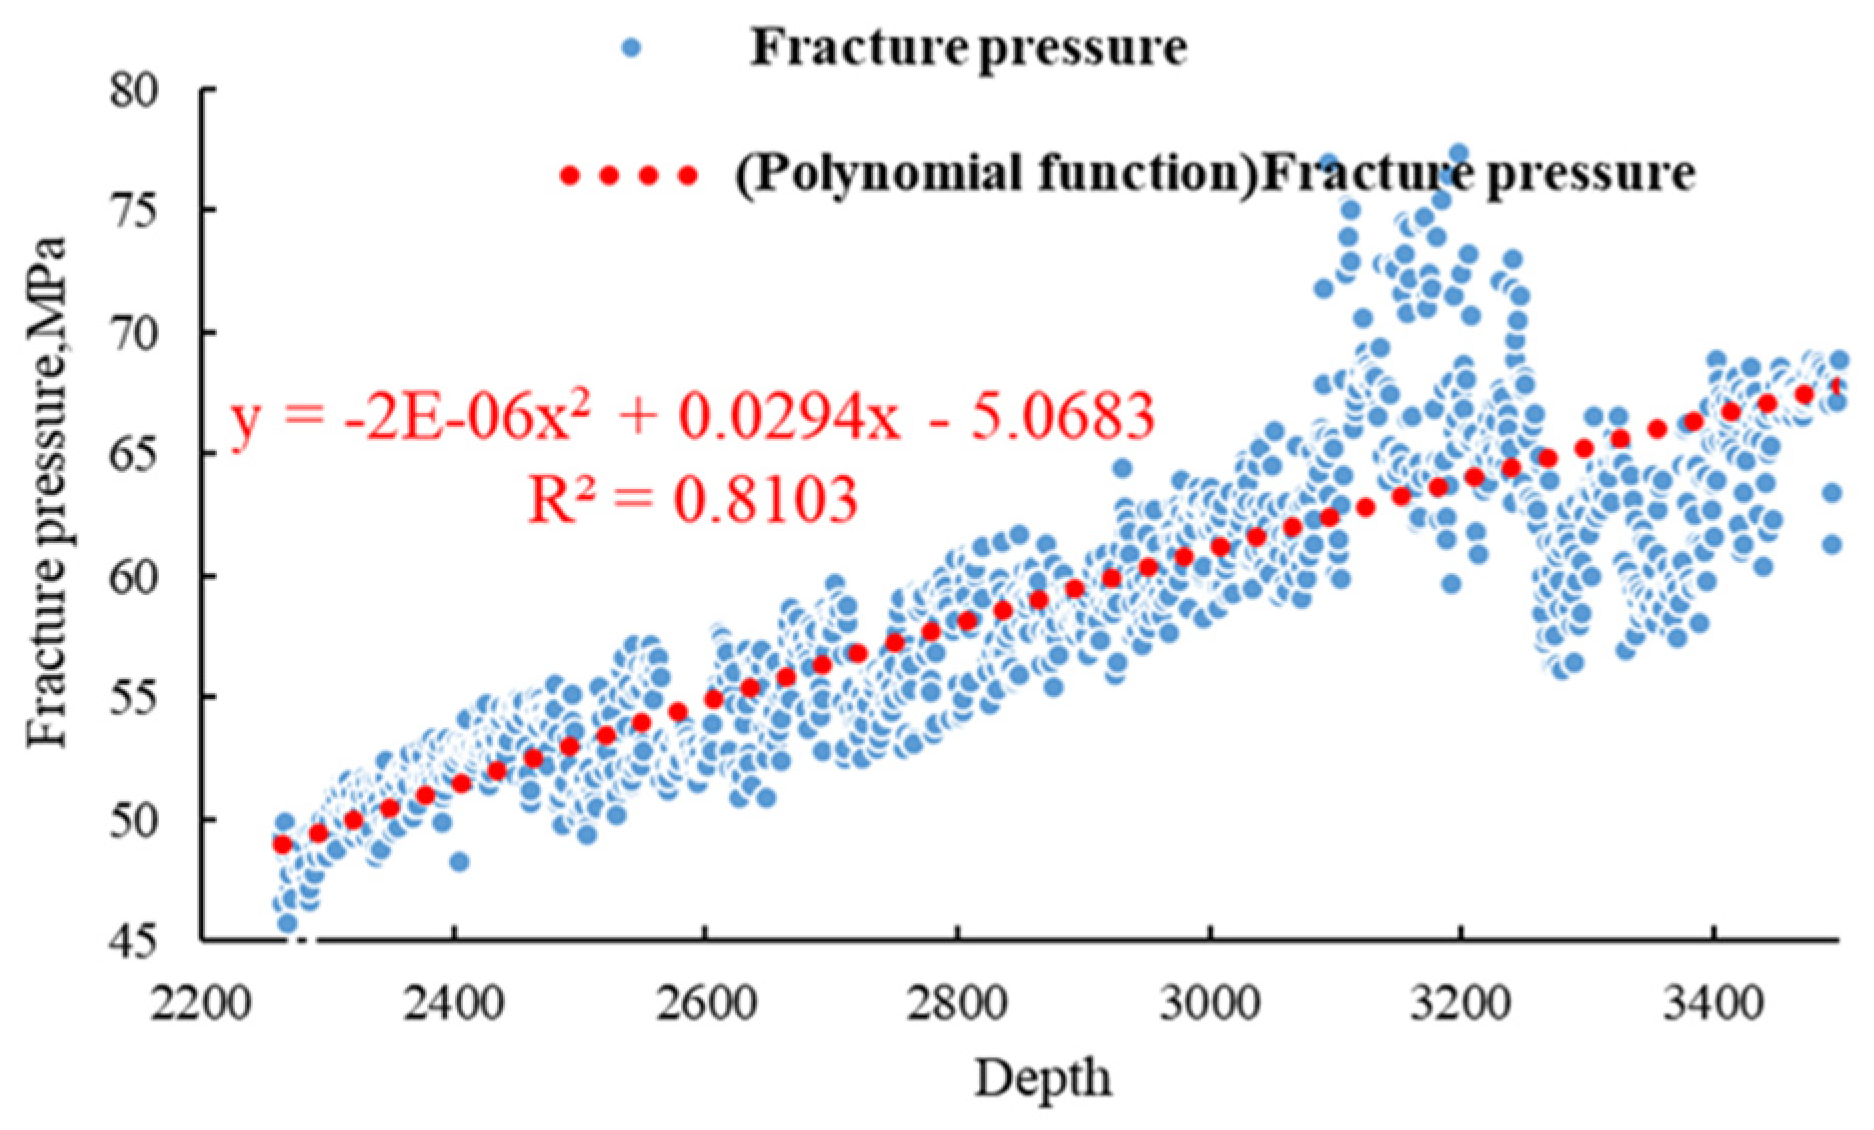
3.1. Criteria for Reinjection Layer Selection

Based on extensive academic research and lessons learned from field applications, it has been concluded that the preferred zones for the reinjection of produced water from gas fields are depleted reservoirs, abandoned layers, and low-production and inefficient areas. The formation selection principles for water reinjection in gas fields primarily revolve around three key criteria: “Injection, Capacity, and Containment,” as detailed below.
Injection: The imbibition capacity of the target formation must be evaluated. Greater imbibition capacity in the target formation enhances injection well performance and allows injection pressure requirements to be appropriately reduced. Imbibition capacity is primarily determined by the petrophysical properties of the target formation, including porosity and permeability characteristics, as well as reservoir thickness.
Capacity: The target formation must possess adequate burial depth and storage volume, which serve as essential prerequisites for produced-water reinjection operations in gas fields.
Containment: The selected formation must meet specific physical property requirements. The sealing layers of the injection zone must demonstrate strong containment capabilities, and the injection pressure must not exceed the fracture pressure of these sealing layers. This precaution prevents the reinjected formation water from channeling into groundwater aquifers or production layers, which could lead to severe consequences.
Prior to reinjection, water compatibility must also be considered. The reinjection formation should exhibit good lithological compatibility with the formation water to prevent precipitation and formation blockage. Additionally, the physicochemical properties of the injected water must align with those of the formation water as well as inhibit bacterial growth, as failure to meet these requirements could significantly reduce reinjection efficiency.

3.2. Formation Selection Analysis for Produced-Water Reinjection

This study focuses on a depleted gas reservoir in the Ordos Basin. Based on existing geological data and formation selection principles, we analyzed compliant reinjection zones for produced water from gas fields. The stratigraphic sequence in the study area, from top to bottom, includes the Luohuo, Anding, Zhiluo, Yan’an, Yanchang, Zhifang, Heshanggou, Liujiagou, and Shiqianfeng Formations.
The Luohuo Formation above the Cretaceous system has a shallow burial depth and serves as the primary production-water extraction layer. Its use for reinjection poses significant environmental risks, as reinjected water could contaminate high-quality groundwater resources.
The Anding Formation functions as a regional groundwater aquitard. The Zhiluo Formation, with its shallow burial depth, is unsuitable for reinjection due to risks of surface water contamination or interaction with groundwater sources. The lower section of the Yan’an Formation represents a major coal-mining stratum and cannot serve as a reinjection zone.
The sedimentary system of the Yanchang Formation in the study area is mainly fluvial-phase sandy mudstone deposition. The main reservoir sandstones are Chang 2 and Chang 3 sandstones, with a stable sand distribution, a porosity distribution range of 0–29%, a main porosity of 9.5–13.5%, a permeability range of 0–20 mD, a main permeability of 1.5–10 mD, favorable petrophysical properties, and thicknesses of 300–400 m, making them ideal reinjection targets. Seismic profiles reveal no significant faults in this formation. The presence of thick sealing layers above and below this interval minimizes the risk of fluid channeling, and the lateral sandbody connectivity is excellent.
The Zhifang Formation, dominated by mudstone with a high clay content, presents poor reinjection conditions but effectively serves as a sealing layer.
The Heshanggou Formation is unsuitable for reinjection due to its thin strata, underdeveloped sandbodies, and unfavorable petrophysical characteristics.
The upper section of the Liujiagou Formation contains tight thin sandstone layers with poor porosity and permeability. The unconfirmed fracture distribution further disqualifies it as a reinjection candidate.
The sandstone of Shiqianfeng Formation is thicker overall, with greater storage space, a porosity distribution range of 0–18%, a main body porosity of 8–12%, a permeability range of 0–1 mD, and a main body of 0.15–0.25 mD. Additionally, the physical conditions of the formation are better, and it meets the conditions of reinjection to a certain extent. However, this layer is deeper and has higher requirements for reinjection pressure, so it can be used as a backup option for the reinjection layer.
Conclusions: Comprehensive analysis of the drilled formations identified the Yanchang Formation as the optimal reinjection zone. Its key advantages include its well-developed reservoir architecture without hydrocarbon shows, substantial sandbody thickness (300–400 m) with excellent lateral connectivity, strong imbibition capacity and sufficient storage space, effective upper and lower sealing layers that protect freshwater aquifers and overlying coal seams, the absence of faults and surface outcrops in the study area, and good compatibility between reinjected water and formation lithology/formation water, ensuring sustained injectivity. This integrated evaluation confirms the Yanchang Formation’s suitability as the preferred reinjection target.

4. Numerical Simulation of Produced-Water Reinjection in Gas Fields

Building upon a previous stratigraphic optimization analysis that identified the Yanchang Formation as the prime reinjection target through integrated geological analysis, we employ 3D coupled geological–numerical modeling to quantitatively assess the formation’s injectivity performance. The key evaluation metrics employed include volumetric injectivity thresholds, spatial sweep efficiency, intra-formational pressure dynamics, and overburden integrity under sustained injection operations.

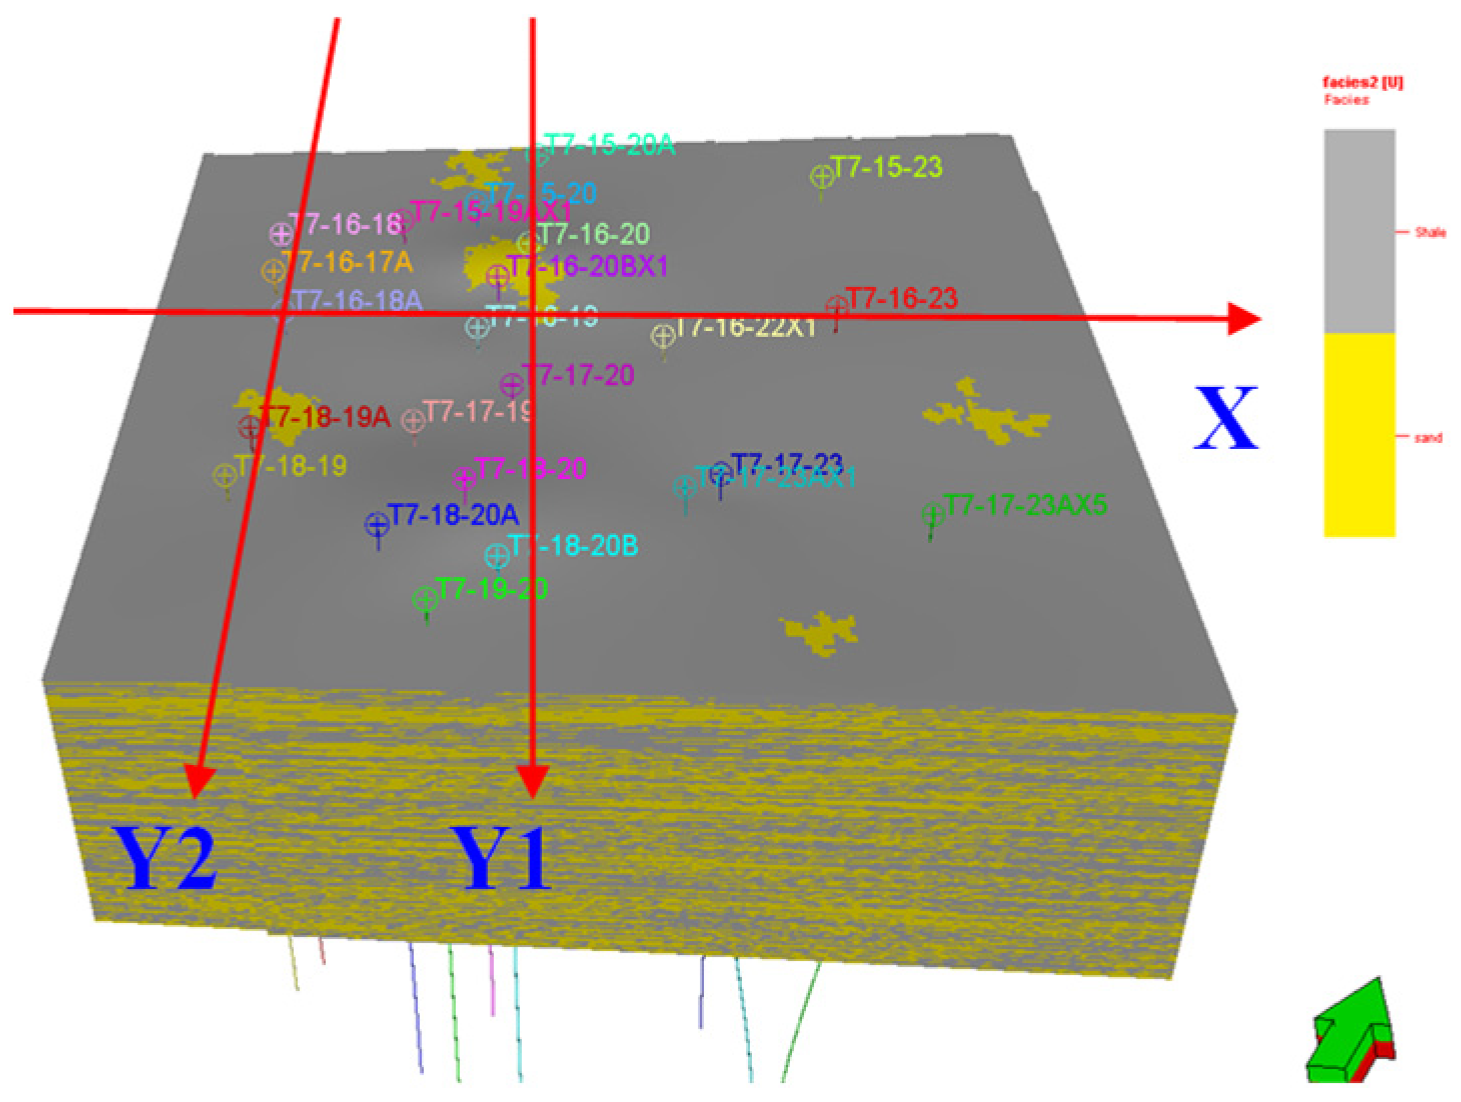
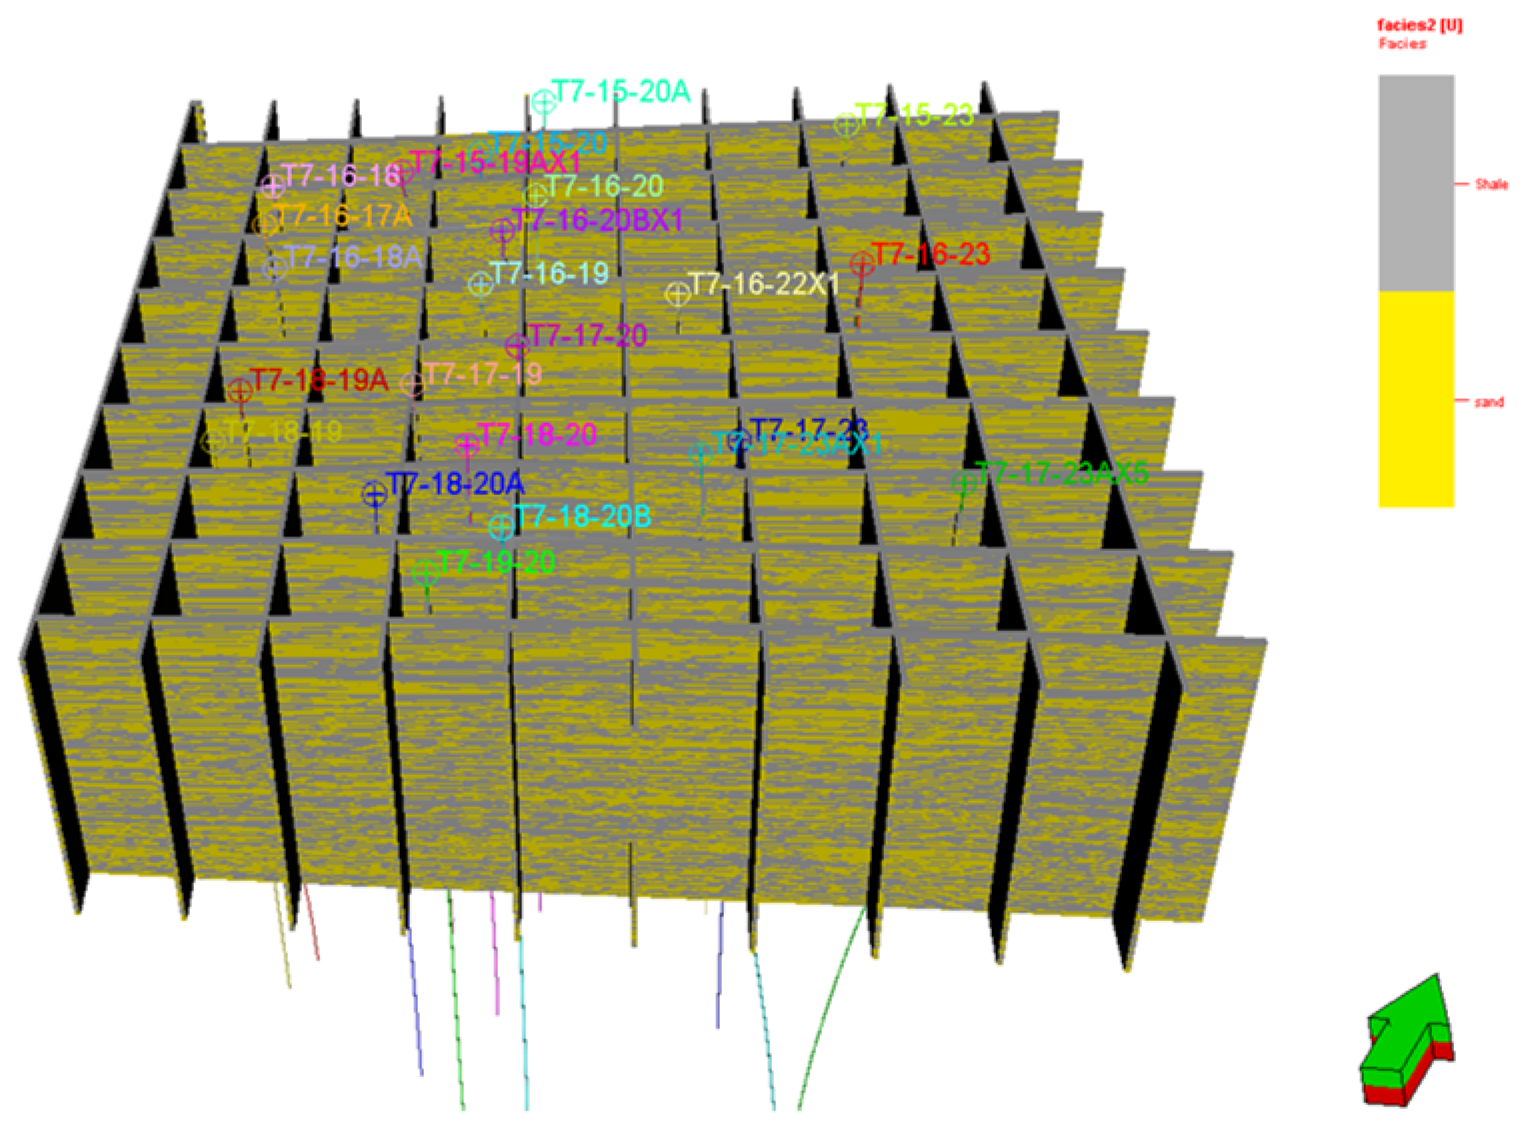
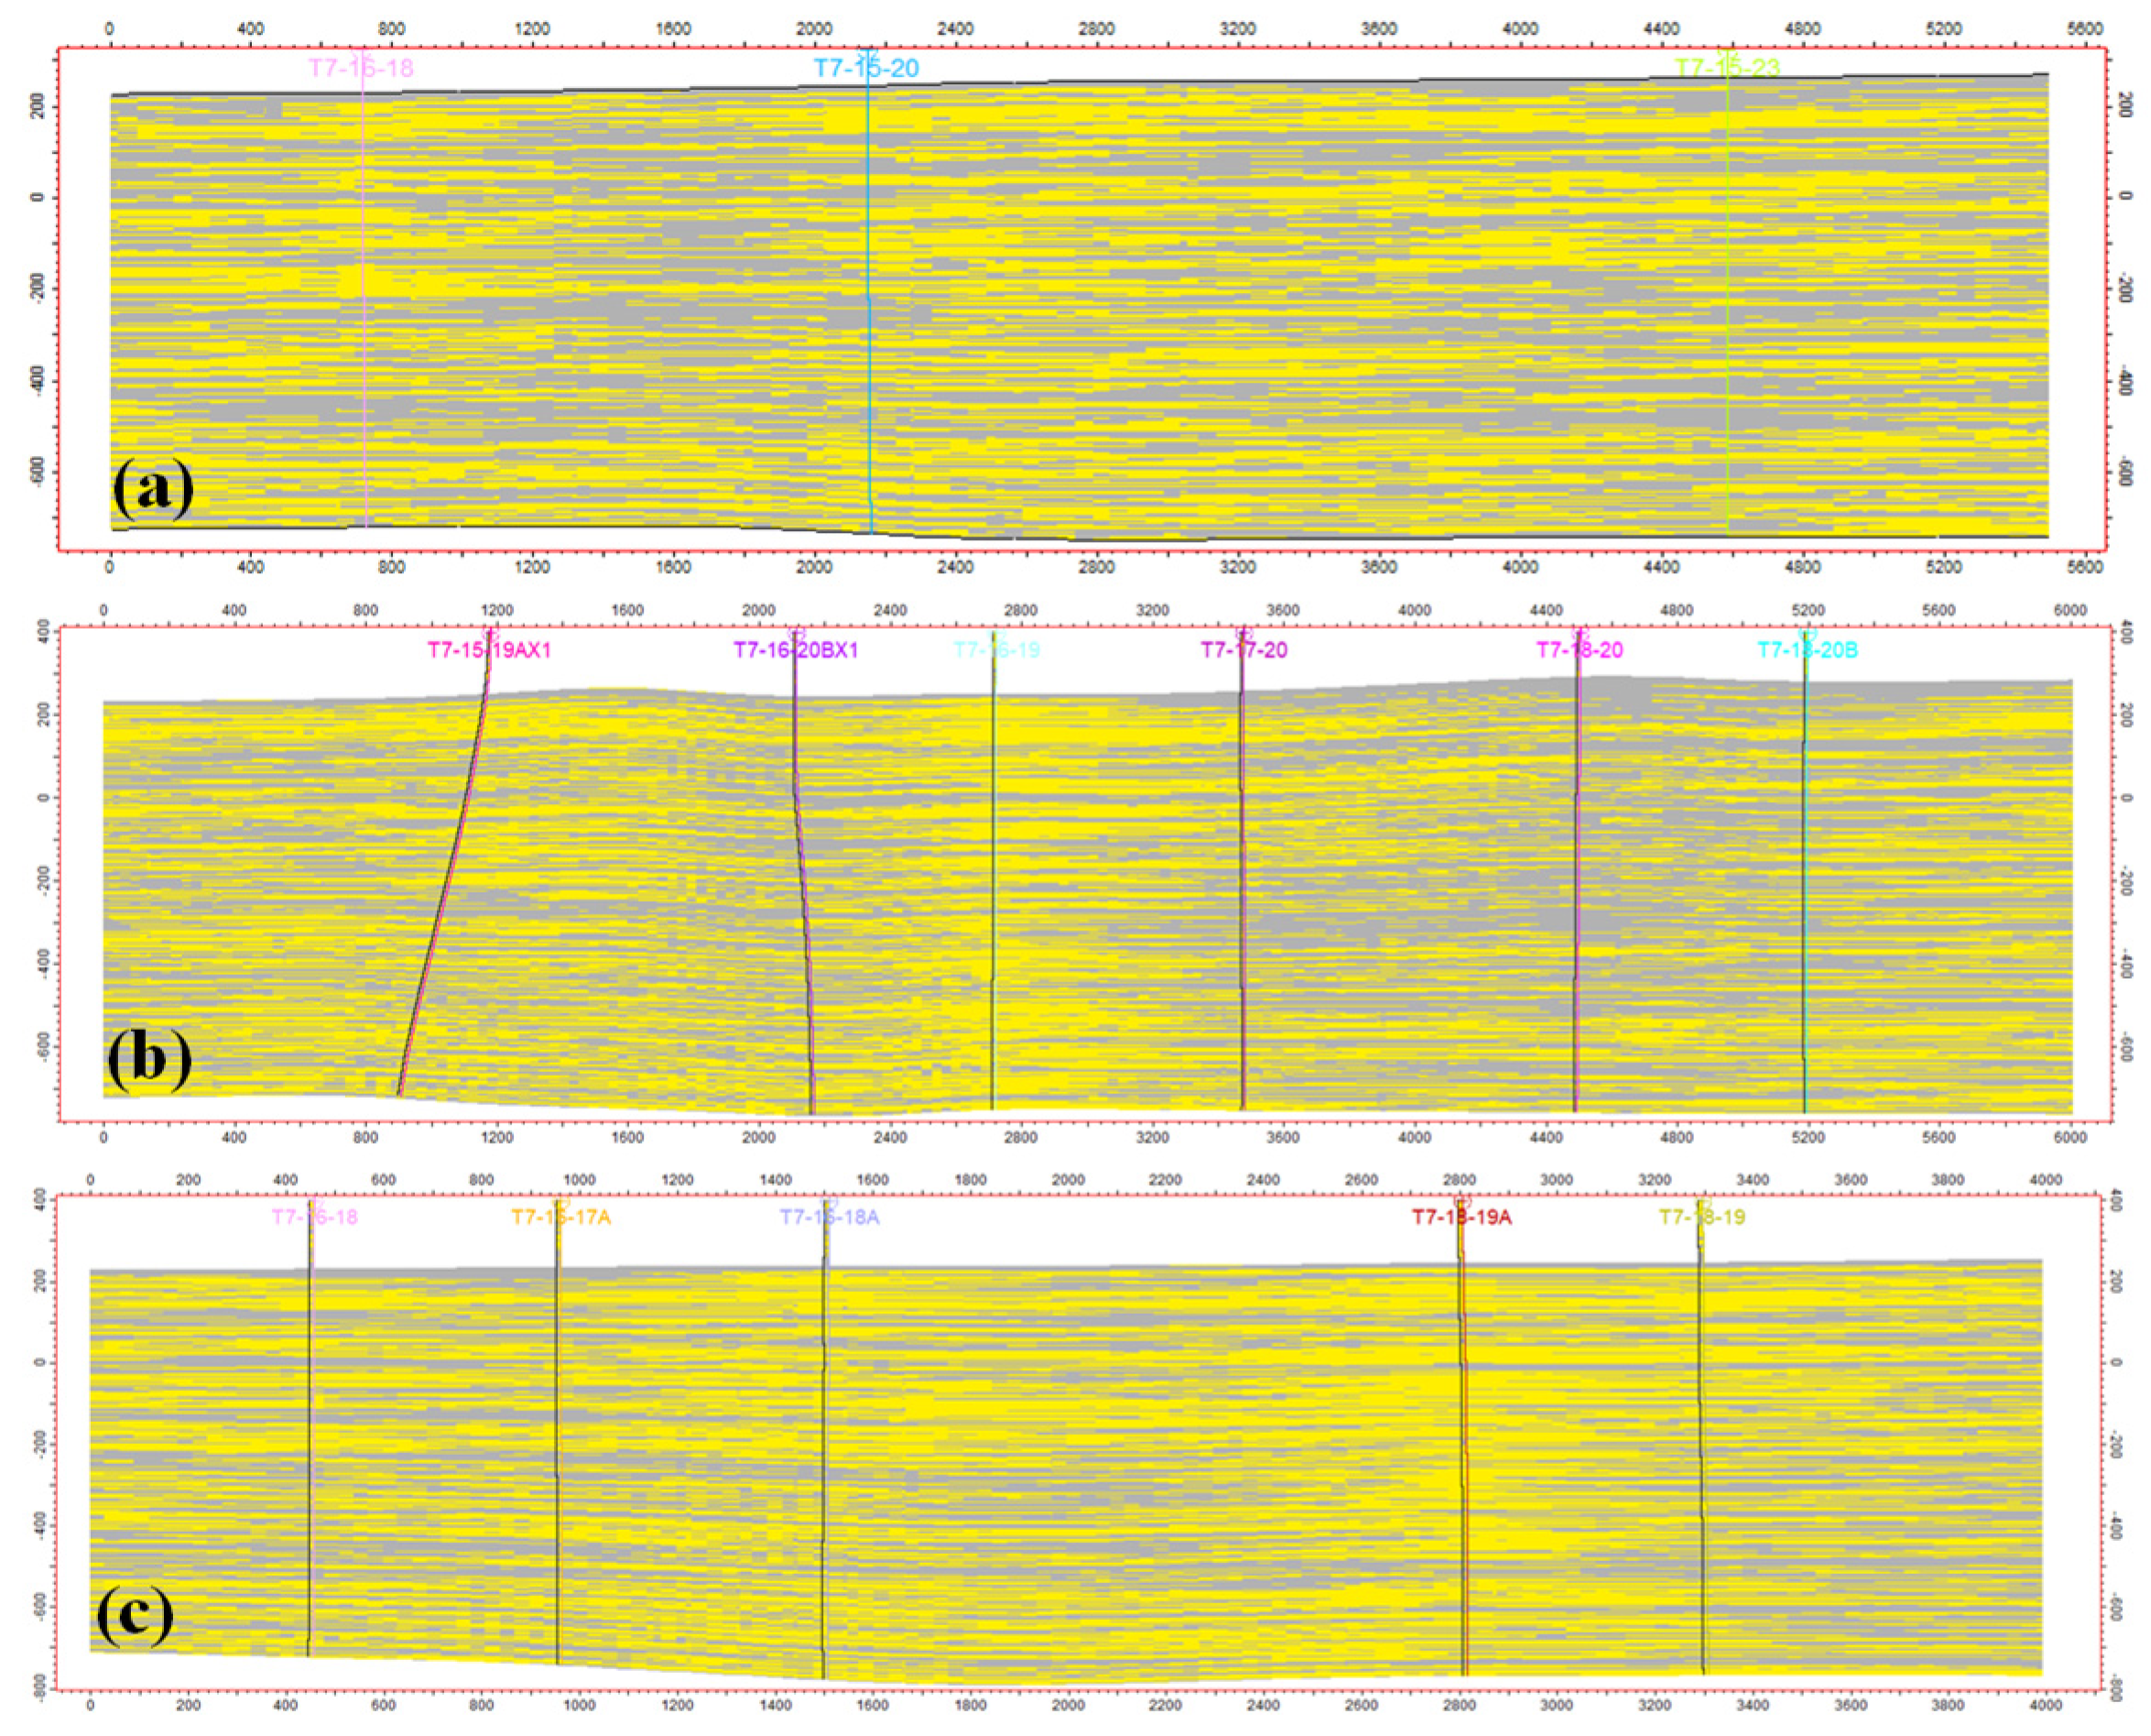
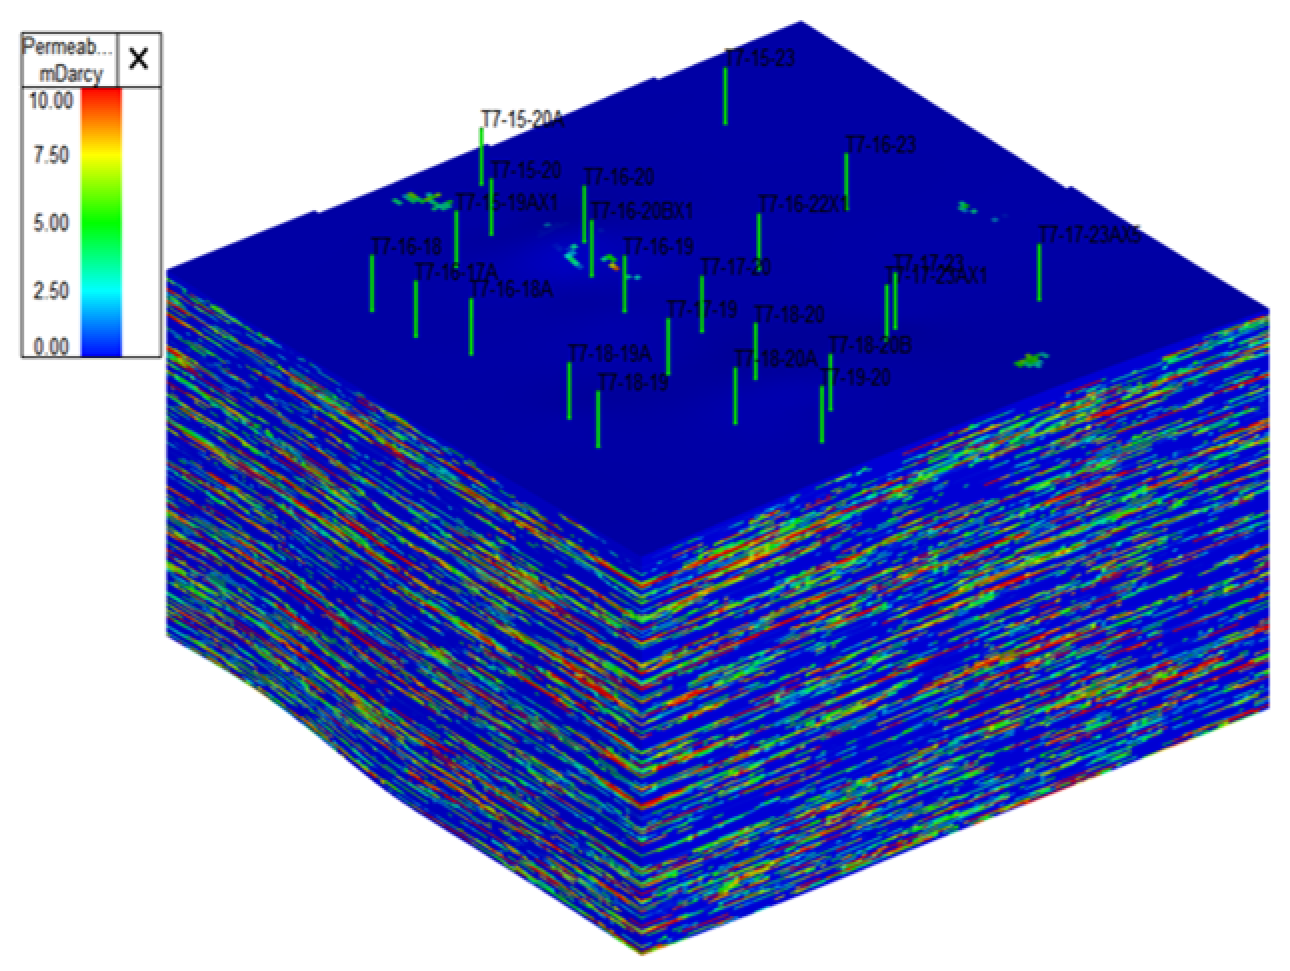
4.1. Three-Dimensional Geological Model

The geomodeling workflow integrates three critical data domains: (1) well-centric datasets (spatial coordinates, trajectory geometry, elevation benchmarks, lithological logs, and core characterization); (2) seismically derived structural constraints; and (3) preconditioned geological knowledge (reservoir geometry, petrophysical parameter fields, electrofacies classifications, and multiscale stratigraphic frameworks).
Based on the sublayer correlation results shown in Figure 1, a structural model was developed, with geological layer calibration and validation of log interpretation reliability. Discrete lithofacies data from individual wells (Figure 2) were integrated to analyze planar and vertical distribution patterns, identify sediment provenance directions, and determine lithofacies extension distances. A depositional facies model was constructed using Sequential Indicator Kriging (SIK). As illustrated in Figure 3, Figure 4, Figure 5 and Figure 6, this facies model enabled a detailed characterization of the Yanchang Formation sandbody’s geometry in both vertical and lateral dimensions. A pixel-based Truncated Gaussian Simulation (TGS) method was employed to construct the lithofacies model. Sequential Gaussian Simulation (SGS) was then applied under lithofacies and porosity constraints to generate porosity and permeability models. A Net-to-Gross (NTG) model was established using effective thickness criteria, and a water saturation model was developed through facies-controlled SGS with porosity constraints. The high-resolution modeling domain for the Yanchang Formation covers 36 km2, with grid dimensions of 30 m × 30 m horizontally and 1.55 m vertically.

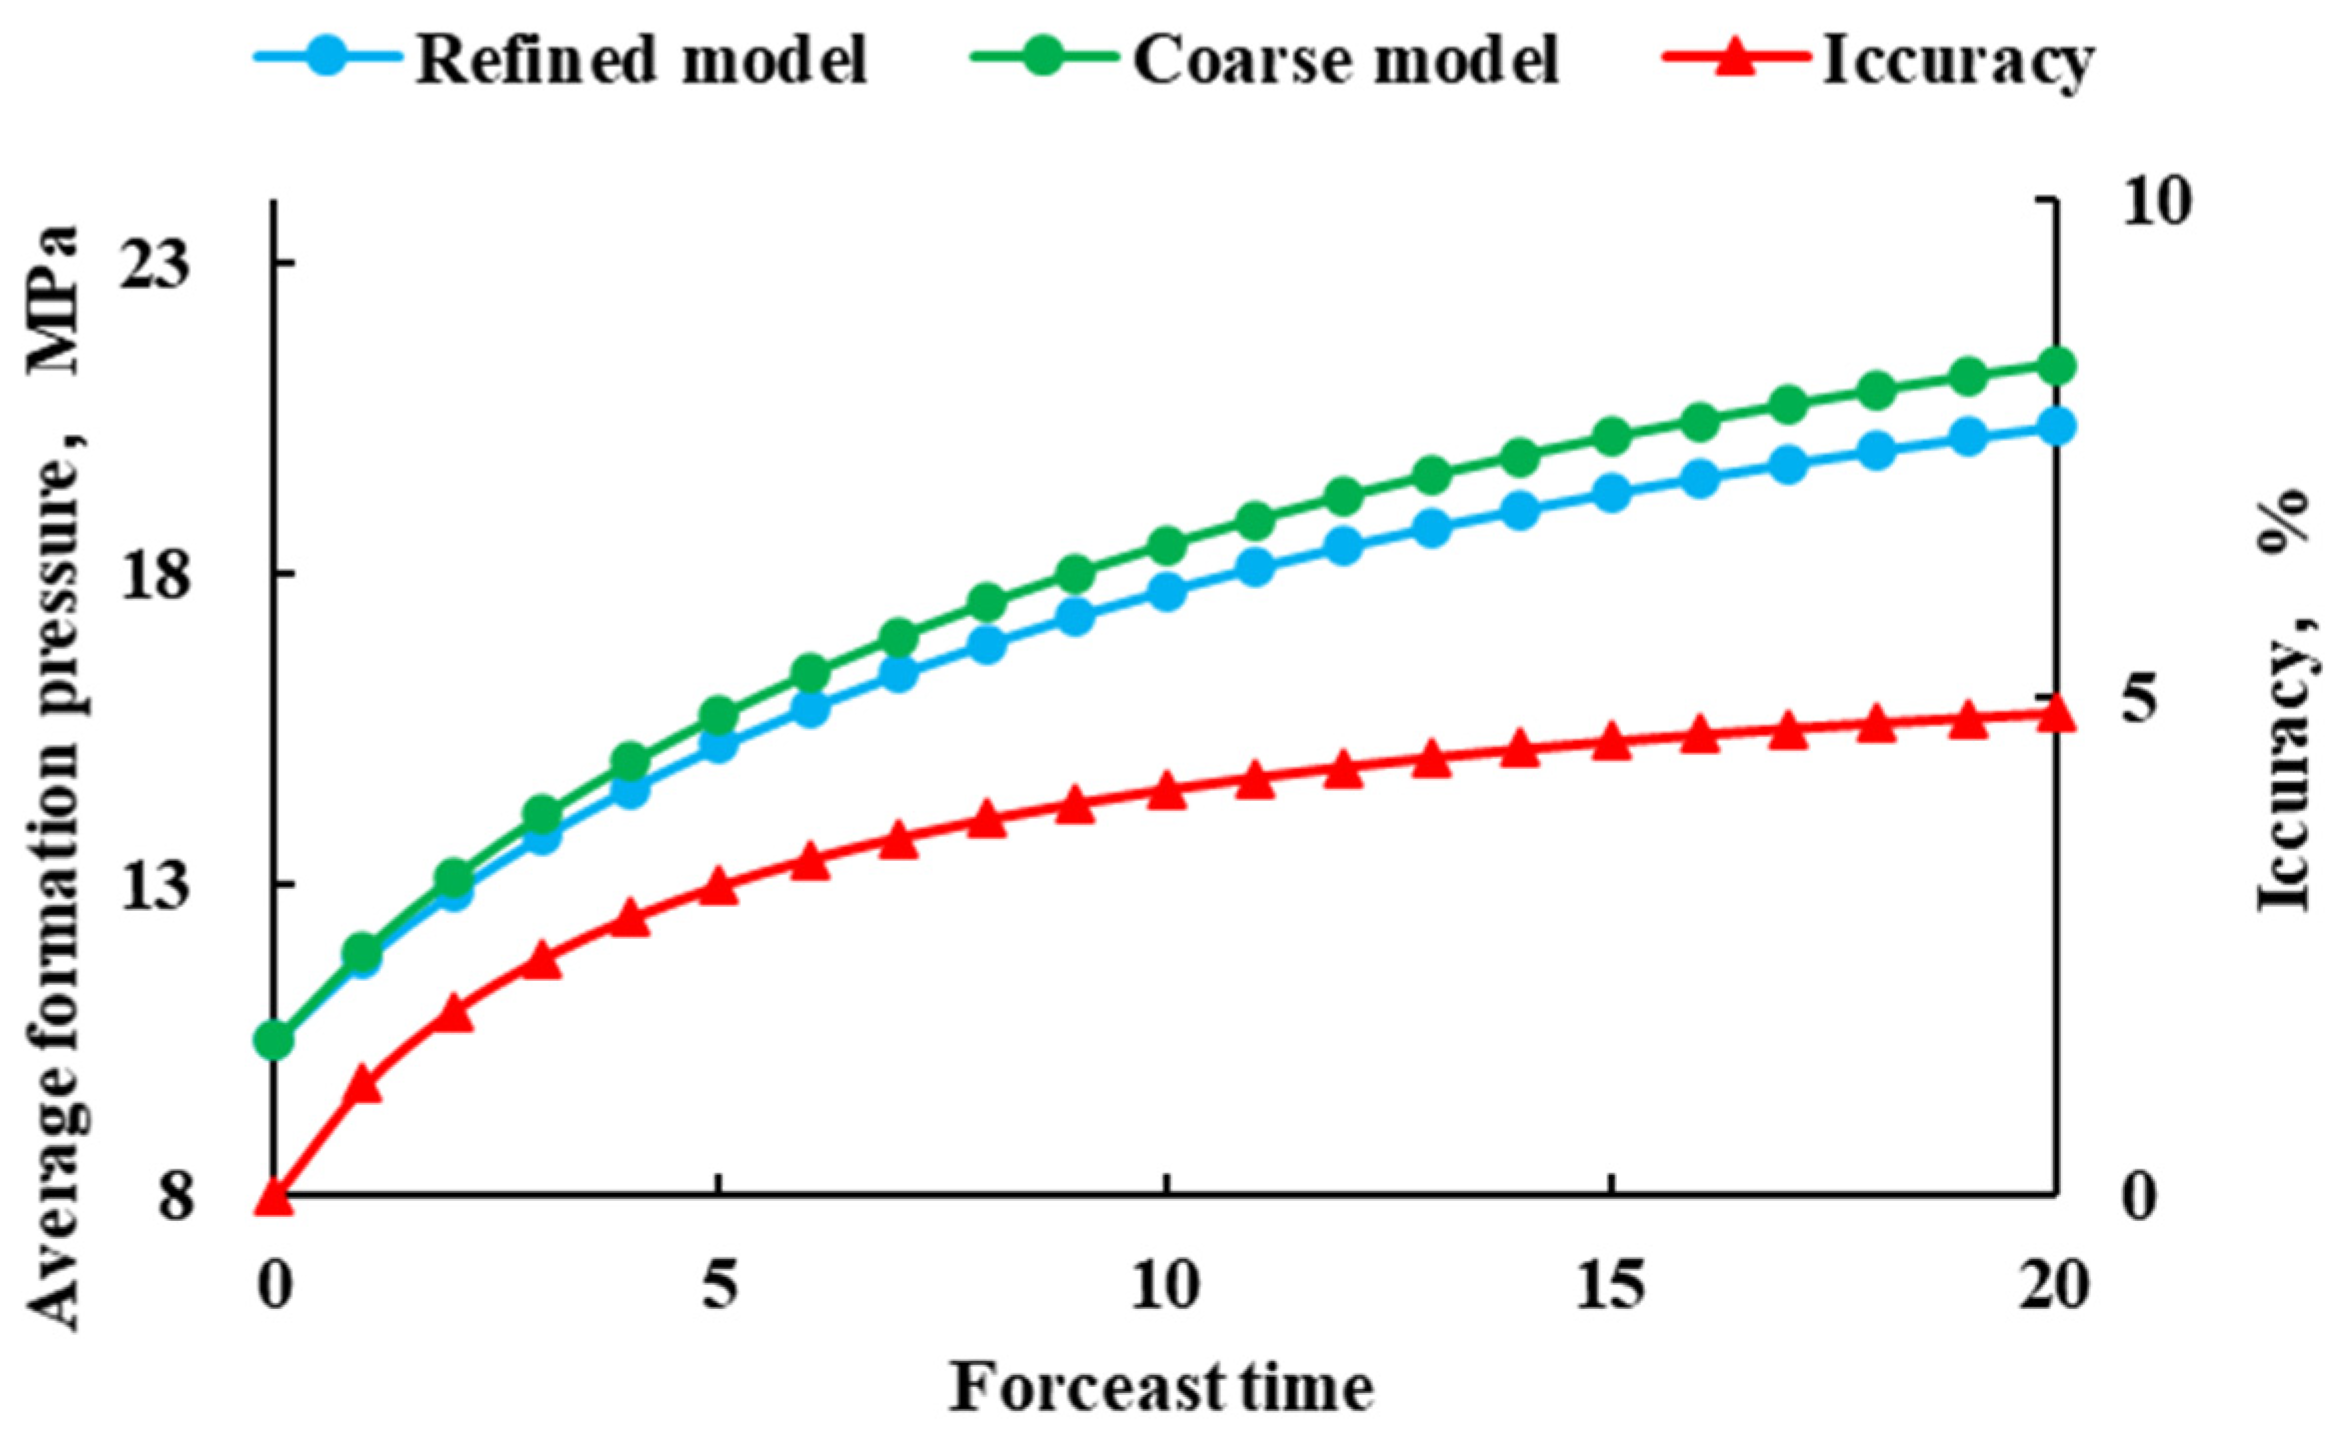
4.2. Three-Dimensional Numerical Modeling

For the 3D geological model established as noted in the previous subsection, to guarantee the model had high calculation speed and could accurately describe stratigraphic features, model mesh coarsening and constructive coarsening were carried out by setting the planar mesh and vertical mesh step sizes; usually, the smaller the coarsening mesh step size, the smaller the error, and vice versa. According to research, the error is smaller when the planar grid coarsening step size is 30–50 m, and the coarsening is more reasonable. When the attributes are coarsened, the parameter characteristics of the original model can be well maintained by adopting the arithmetic average method with volume weighting and thickness weighting for the scalar parameters, such as porosity, saturation, and the net-to-gross ratio. For permeability with anisotropy, the average error of numerical simulations using the arithmetically adjusted average method and flow method is below 10%, and its results are the closest to those of the fine model, the fine model after coarsening, and many other arithmetic methods [26,27,28,29]. By comparing the base number modeling scheme when the fine and coarsened models are set up to inject 250 m3/d, respectively, the relative error in the average stratigraphic pressure curve at the reinjection level is found to be 4.85%, which is within a reasonable margin of inaccuracy (Figure 7).
The parameters of the extended set of 3D numerical models imported into the numerical simulation software after coarsening are shown in Table 2, and the porosity and permeability field plots of the 3D numerical models are shown in Figure 8 and Figure 9.
The fracture pressure profile was derived through polynomial regression analysis of field-measured pressure data, establishing depth-dependent fracture pressure gradients, as shown in Figure 10. The high predictive accuracy of the fitted polynomial equation enables reliable extrapolation of fracture pressures for the Yanchang Formation, a particularly critical feature owing to the absence of direct pressure measurements in this interval. The modeled Yanchang Formation (depth range: 900–2060 m) exhibits fracture pressures between 17 and 47 MPa. To ensure operational safety, the maximum allowable bottomhole injection pressure was set to 0.85× fracture pressure, providing a conservative safety threshold against formation integrity failure.

4.3. Extracted Water Reinjection Simulation Program

A network of 20 reinjection wells was systematically distributed across the study area based on the petrophysical quality distribution within the Yanchang Formation. A 20-year numerical simulation was conducted under constant bottomhole pressure (BHP) constraints, revealing three distinct imbibition regimes within the target zone, as categorized in Figure 11.
Of the three imbibition regimes, over one-third of the reinjection wells exhibited top-dominant imbibition patterns, confirming the critical influence of Chang 2 and Chang 3 members on overall injectivity. An integrated analysis of sandbody architecture and well log data further verified their superior storage capacity (1070–1350 m burial depth) and favorable petrophysical properties (initial formation pressure: 9.58 MPa; fracture pressure: 22.92 MPa), solidifying their suitability as reinjection targets.
The Chang 2 and Chang 3 members of the Yanchang Formation, with a burial depth of 1070–1350 m, exhibited an initial formation pressure of 9.58 MPa and a formation fracture pressure of 22.92 MPa. Based on the results of the simulation study given above, 8, 10, and 12 reinjection wells at different locations were selected for designs A1, A2, and A3 of Group A, according to the physical properties of the formation and the degree of sand enrichment. Group B was designed to inject 200, 250, and 300 m3 per day, while Group C was designed to adjust the wells for designs C1, C2, and C3, based on the non-homogeneous nature of the formation.

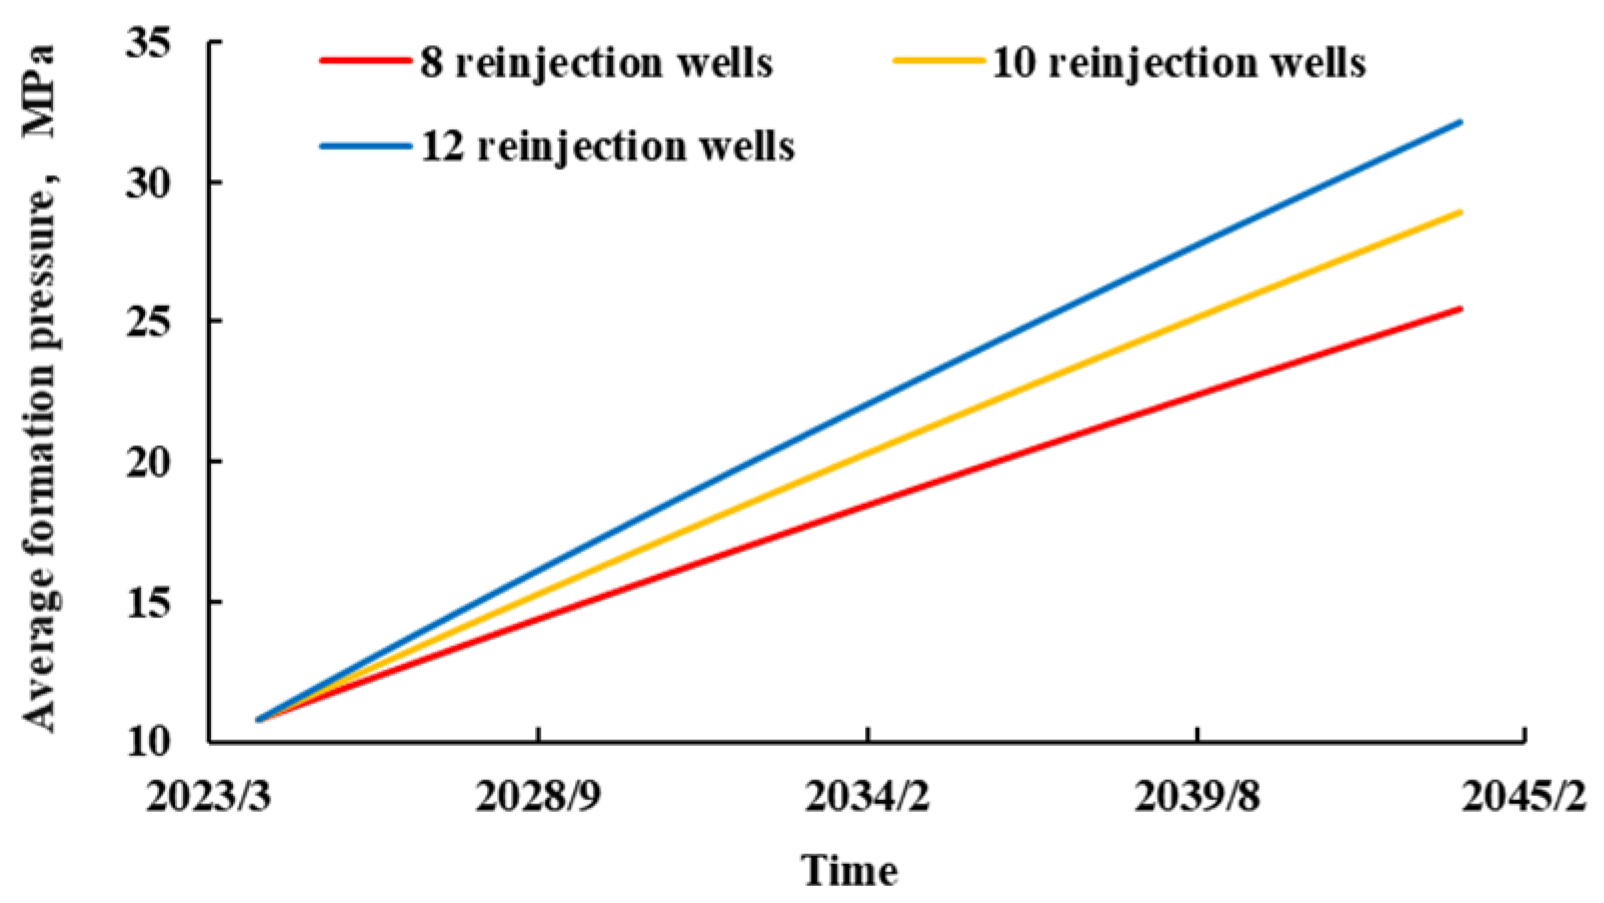
4.3.1. Preferred Number of Wells in Group A

With the injection rate, injection pressure, and other parameters maintained at a certain level, 8, 10, and 12 reinjection wells were set up for scenario simulation to select the number of reinjection wells suitable for the study area.
Figure 12 and Figure 13 show that using 12 reinjection wells leads to the fastest increase in formation pressure. The formation pressure at the end of the simulation period far exceeded the safe upper limit of formation rupture pressure. With 10 reinjection wells, the formation pressure slightly exceeds the safe upper limit of rupture pressure. Based on considerations regarding safety and the cost of drilling, this scheme can guarantee a higher daily reinjection volume to some extent. Therefore, in terms of both the safety of reinjection and the cost of drilling reinjection wells, the establishment of 10 wells is considered to be the most suitable option.

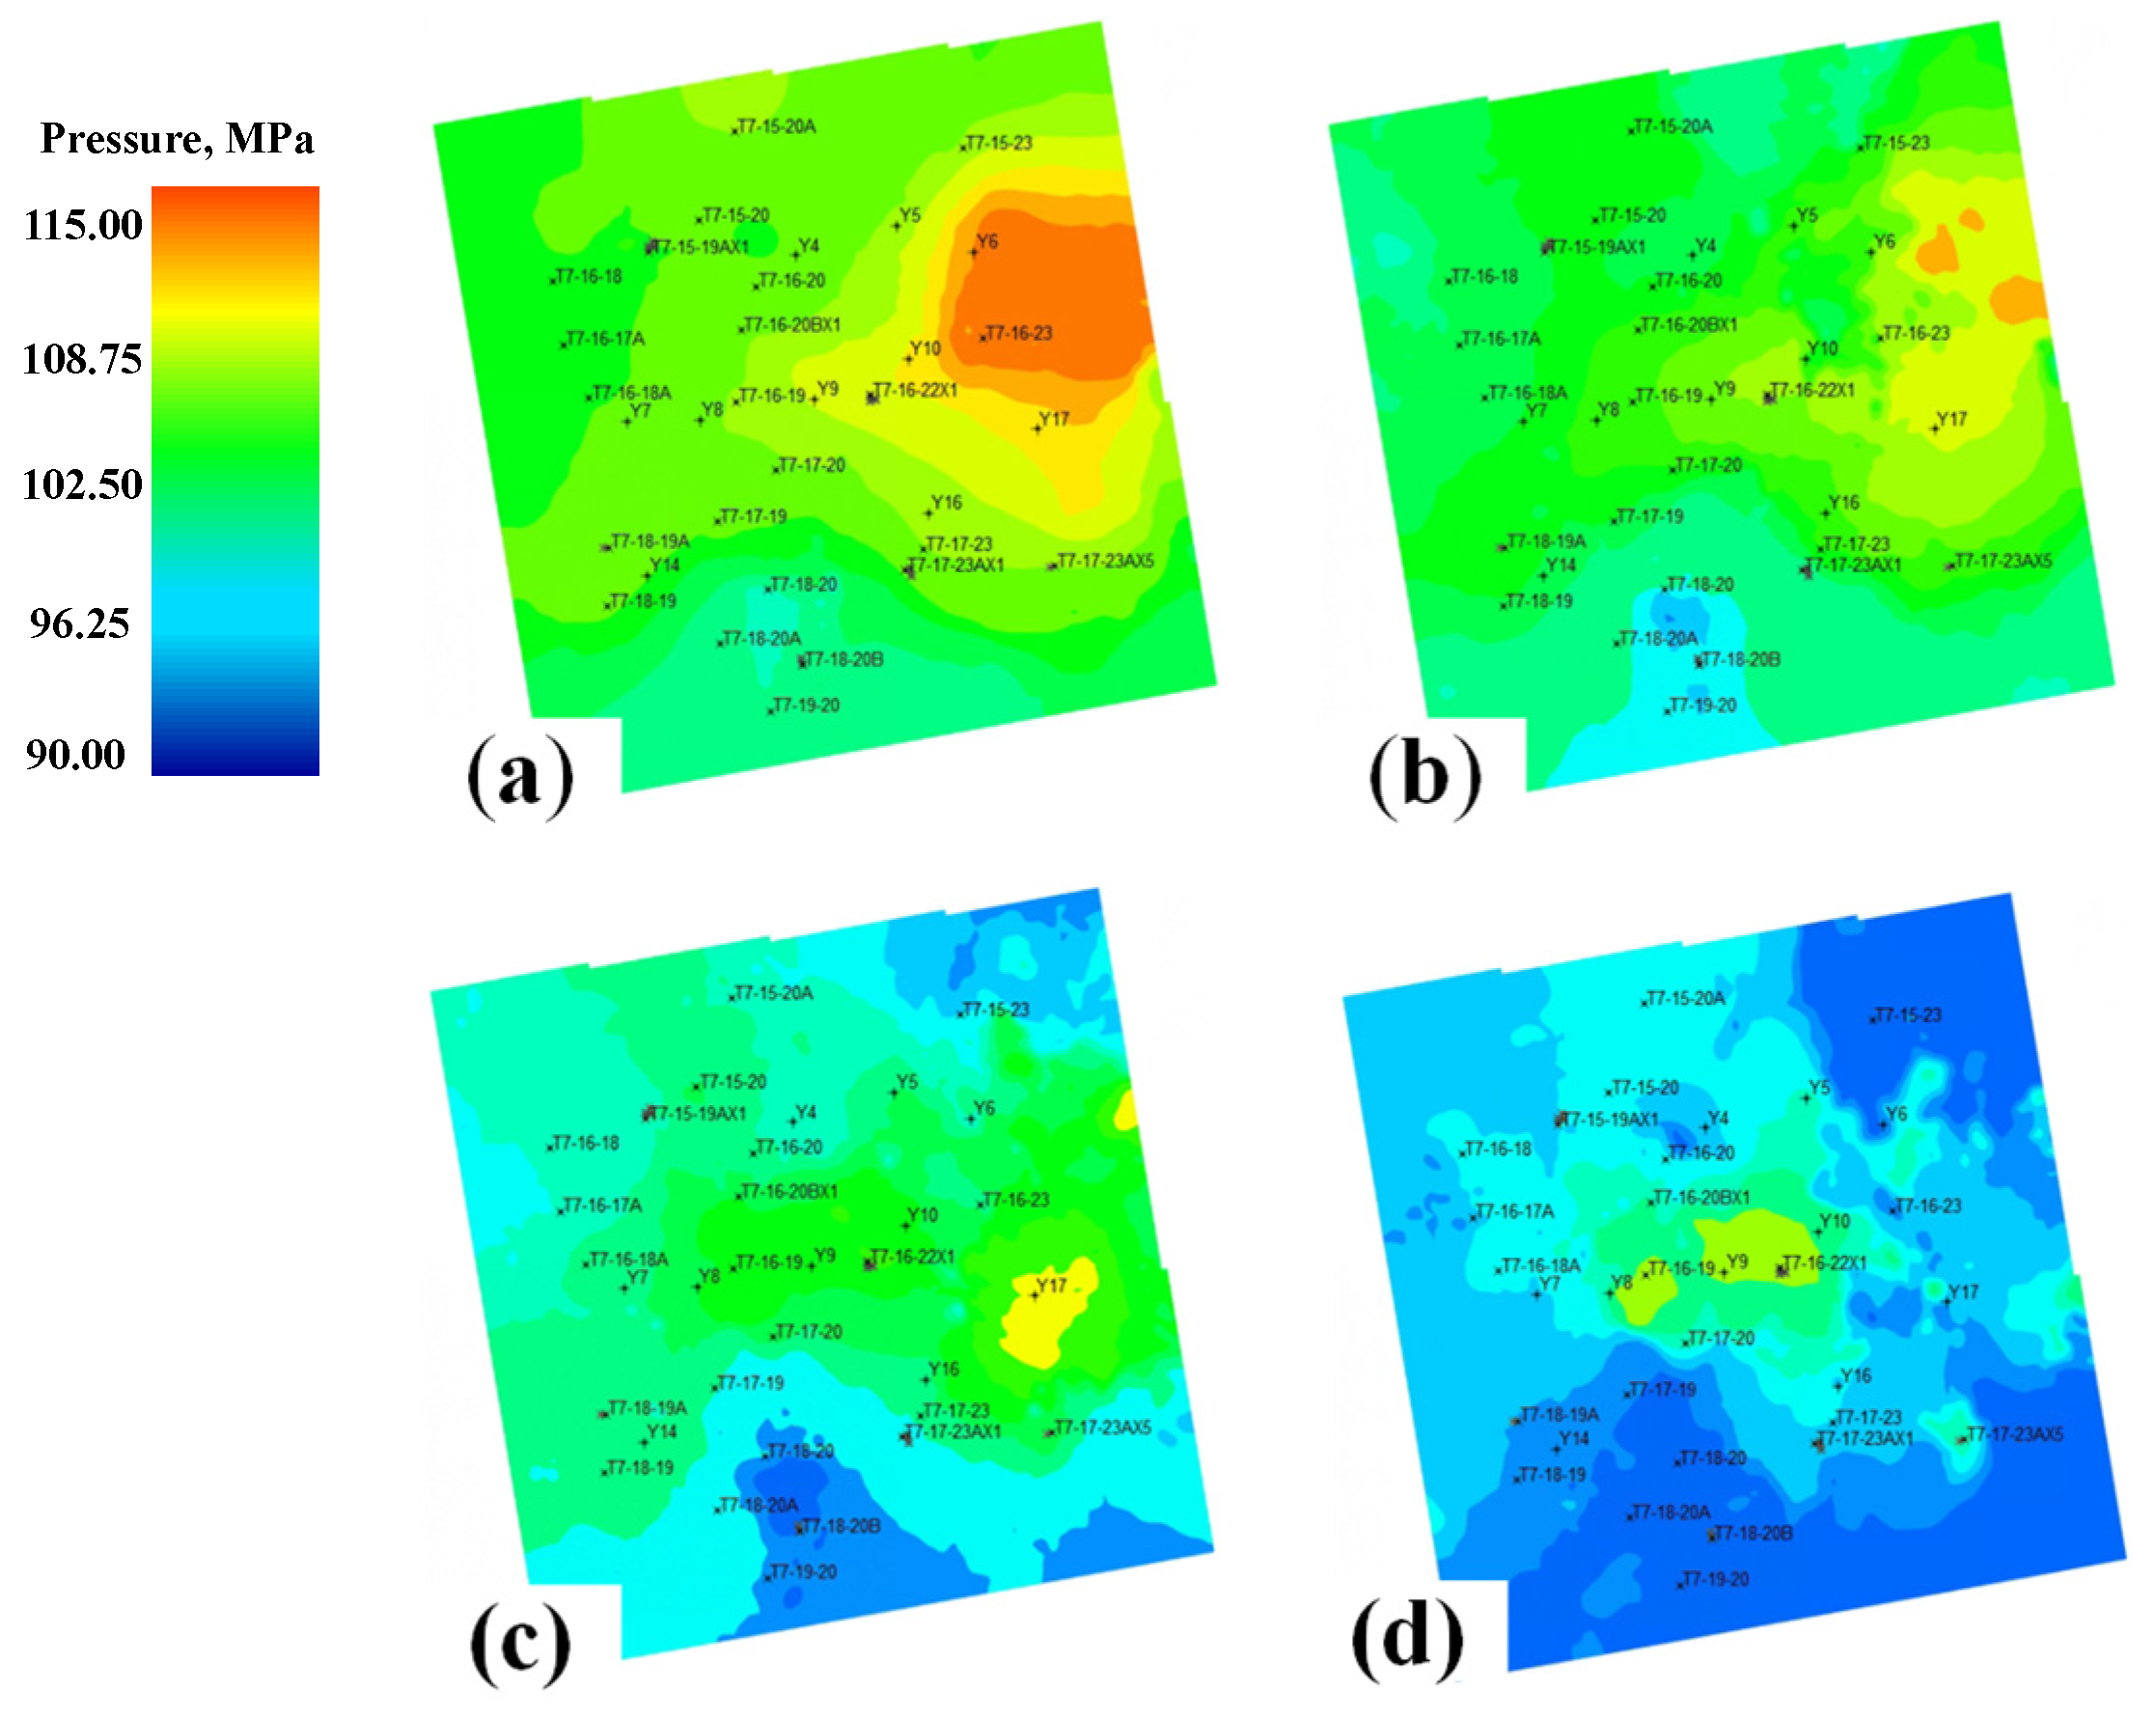
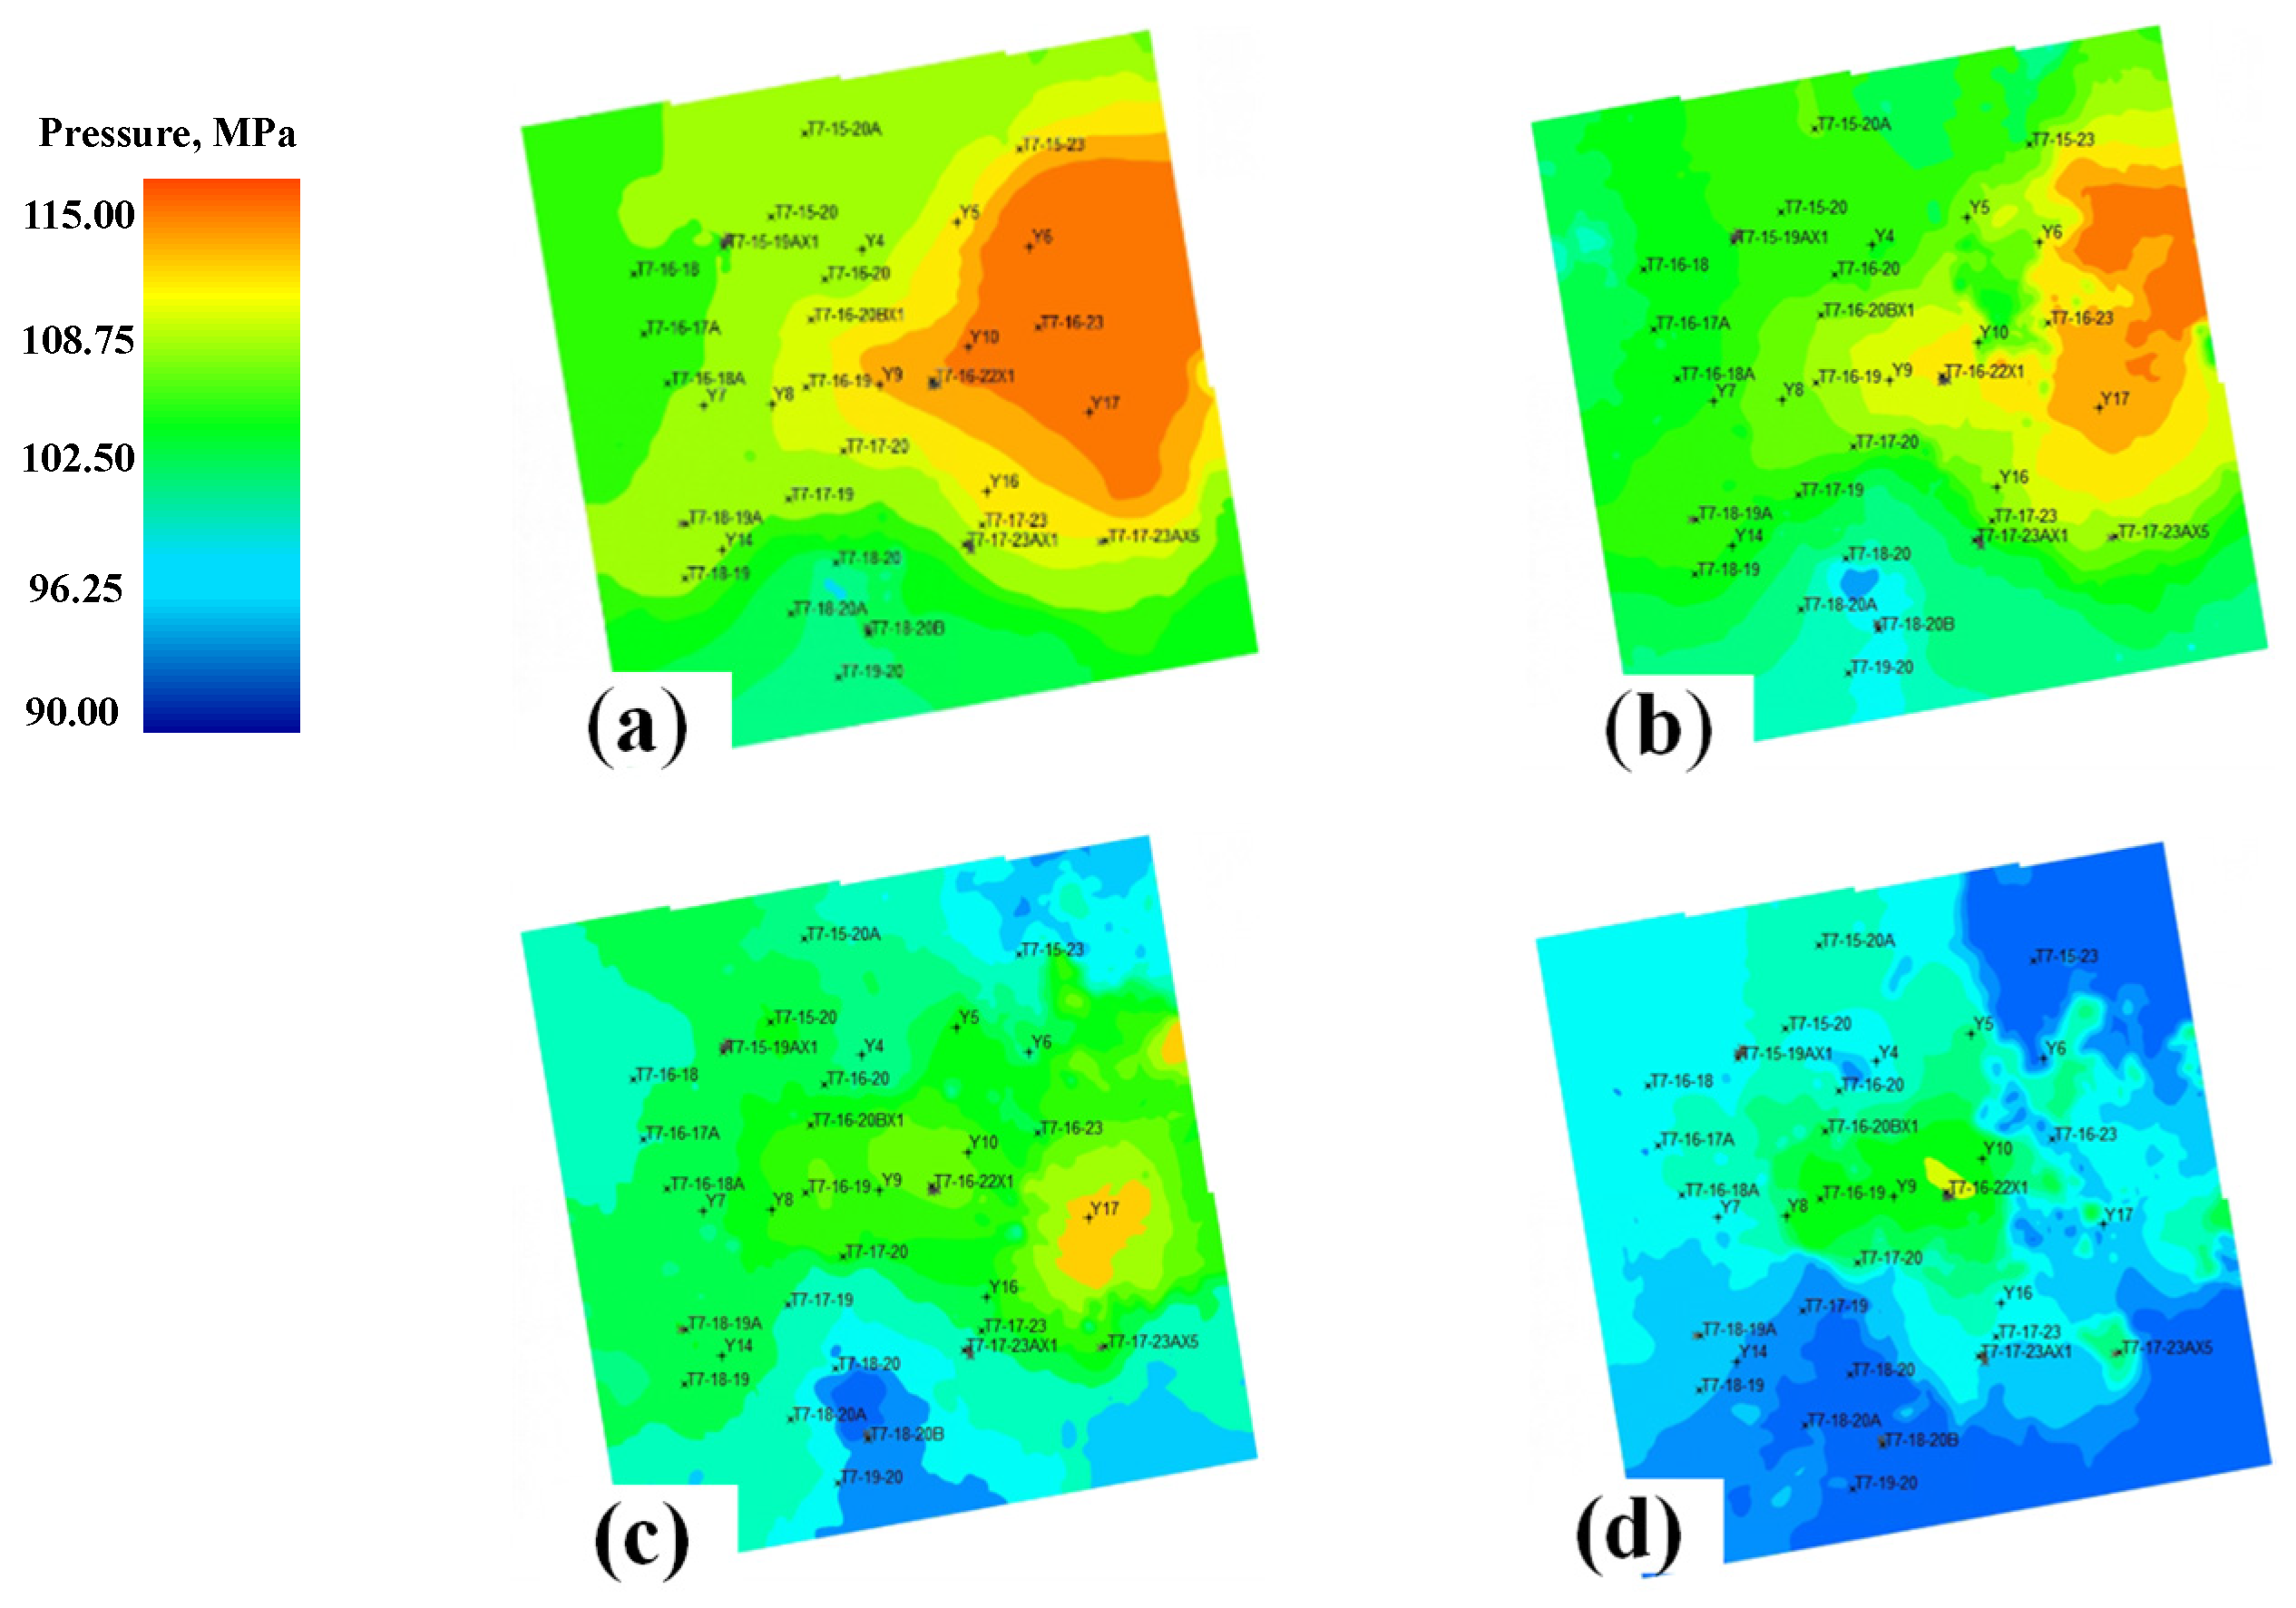
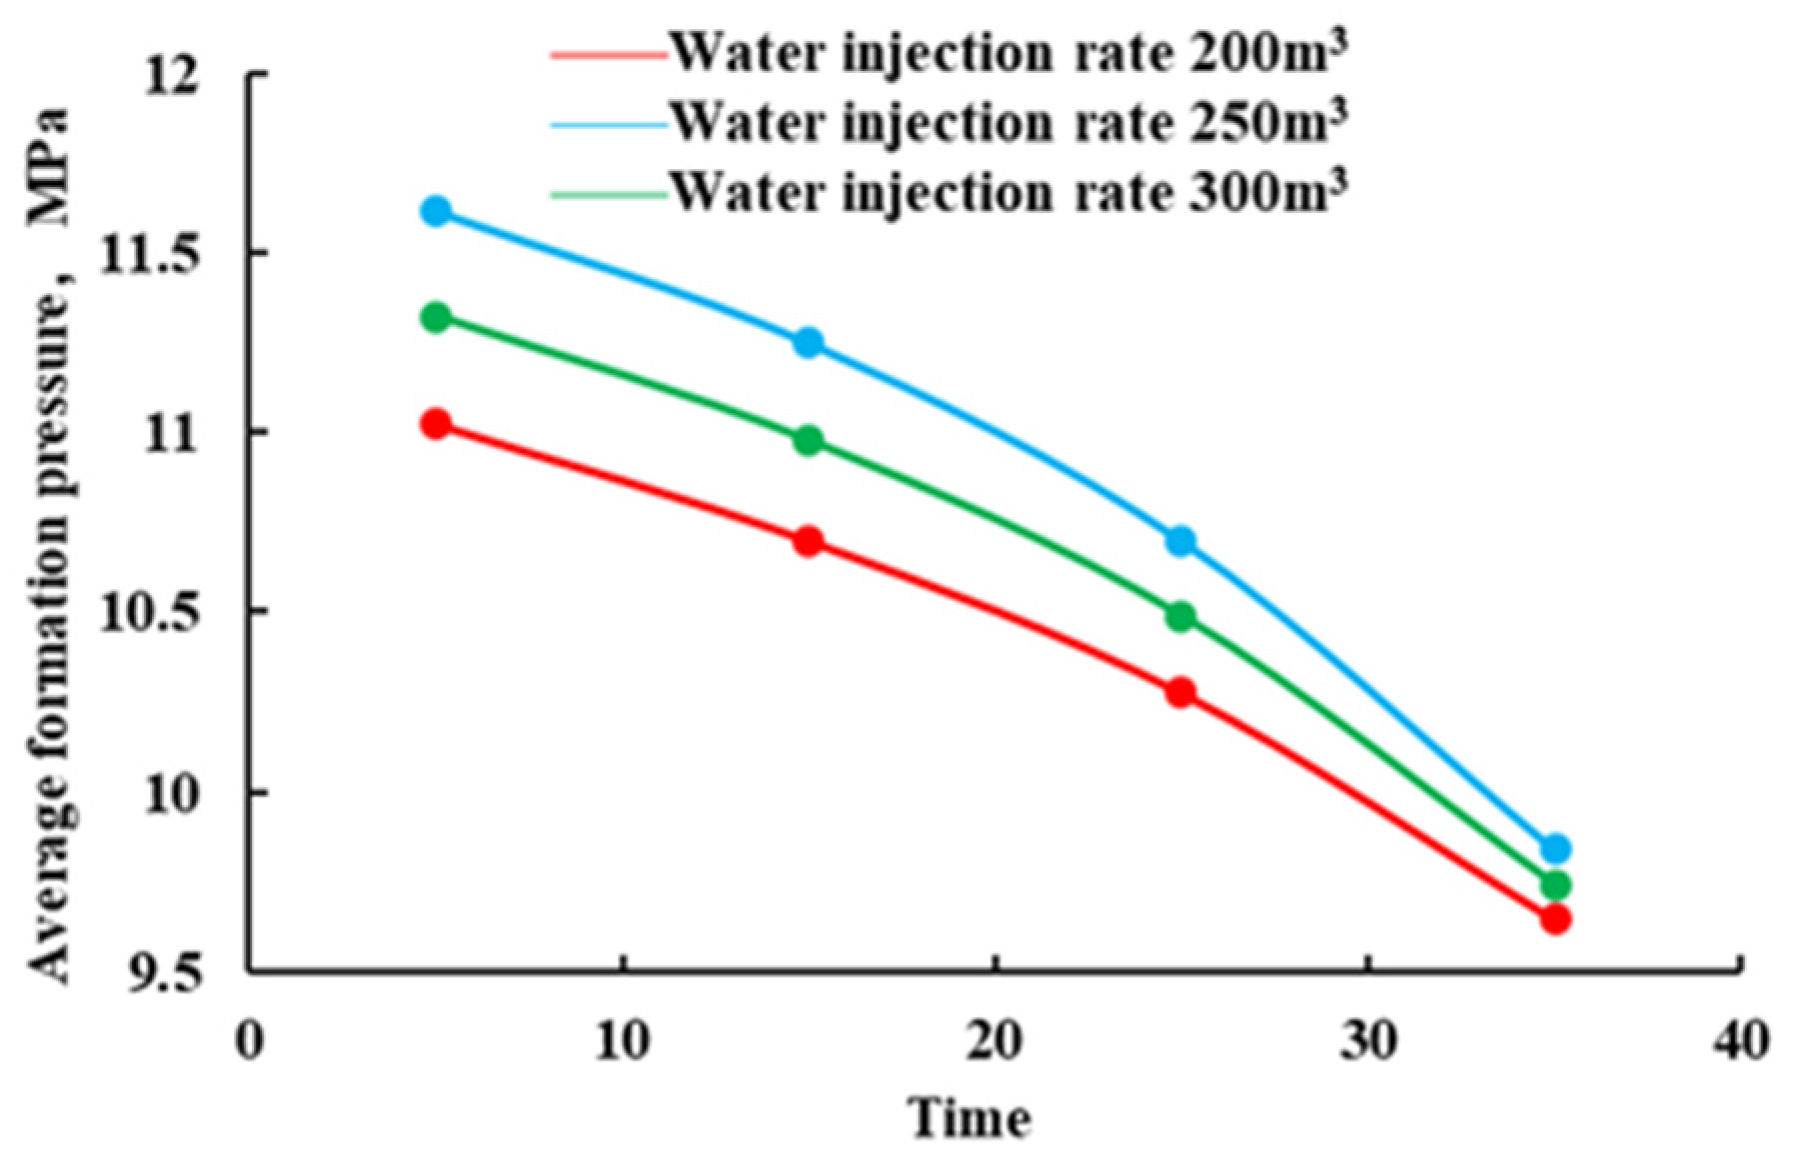
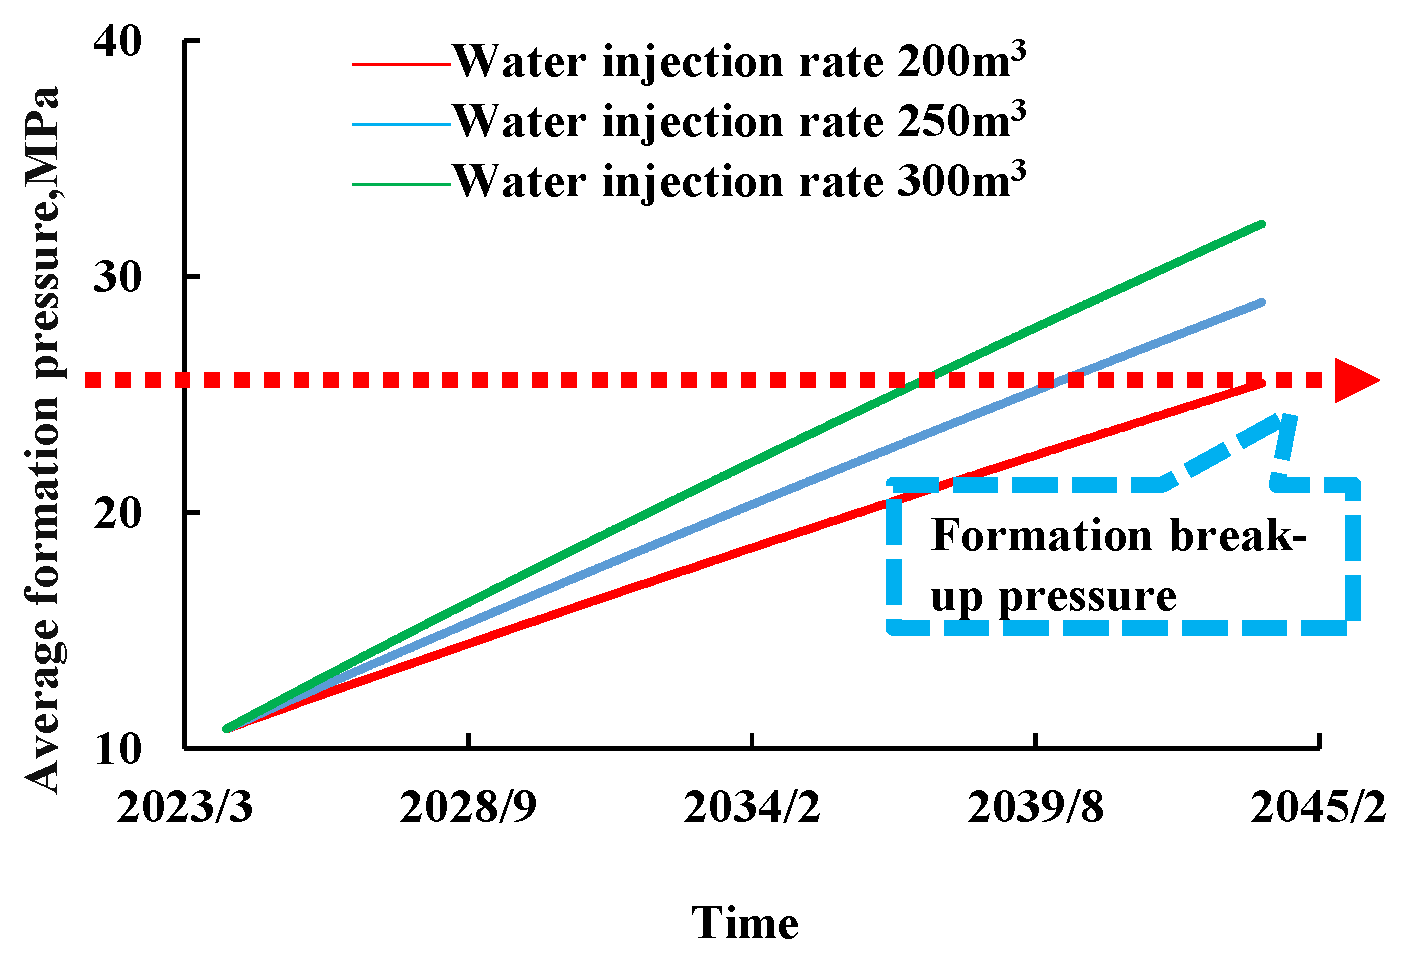
4.3.2. Group B Daily Injection Volume Preference

According to the preferred scenario consisting of ten reinjection wells, the injection volume was set to 200 m3, 250 m3, and 300 m3. The optimal daily reinjection volume for the numerical model was determined through a three-dimensional numerical simulation study of the reinjection water volume, ripple range, and pressure transfer. The simulation results for different daily injection volume scenarios are shown below.
  • Pressure distribution in the overlying strata
To study the closure and safety of the reinjection reservoir, the average formation pressure field map and the average formation pressure curve of the overburden on the injection reservoir were visualized according to the numerical simulation results (see, for example, Figure 14, Figure 15, Figure 16 and Figure 17). These results were analyzed and discussed in terms of the range of the injection pressure wave and the change in formation pressure.
According to the fitting equation for formation rupture pressure, the rupture pressure of the upper overburden layer of the two long layers of the Yanchang Formation was calculated to be 26 MPa. By integrating the information in Figure 14, Figure 15, Figure 16 and Figure 17, it can be gleaned that the average formation pressure of the upper overburden layer after 20 years of water injection is a maximum of 11.6 MPa, and the more backward the overlying rock layer, the greater the extent to which the wave of the water injection pressure is hindered, and the further away it is from reaching the rupture pressure.
As shown in Figure 18, the larger the daily injection volume, the greater the average cap layer pressure. However, as the thickness of the upper overburden layer increases, the stratigraphic pressure on the cap layer decreases, and the effect of injection volume on pressure becomes smaller. This is reflected in Figure 18, which shows that the end pressures of the 30–40 m cap layer are almost identical at different injection volumes.
2.
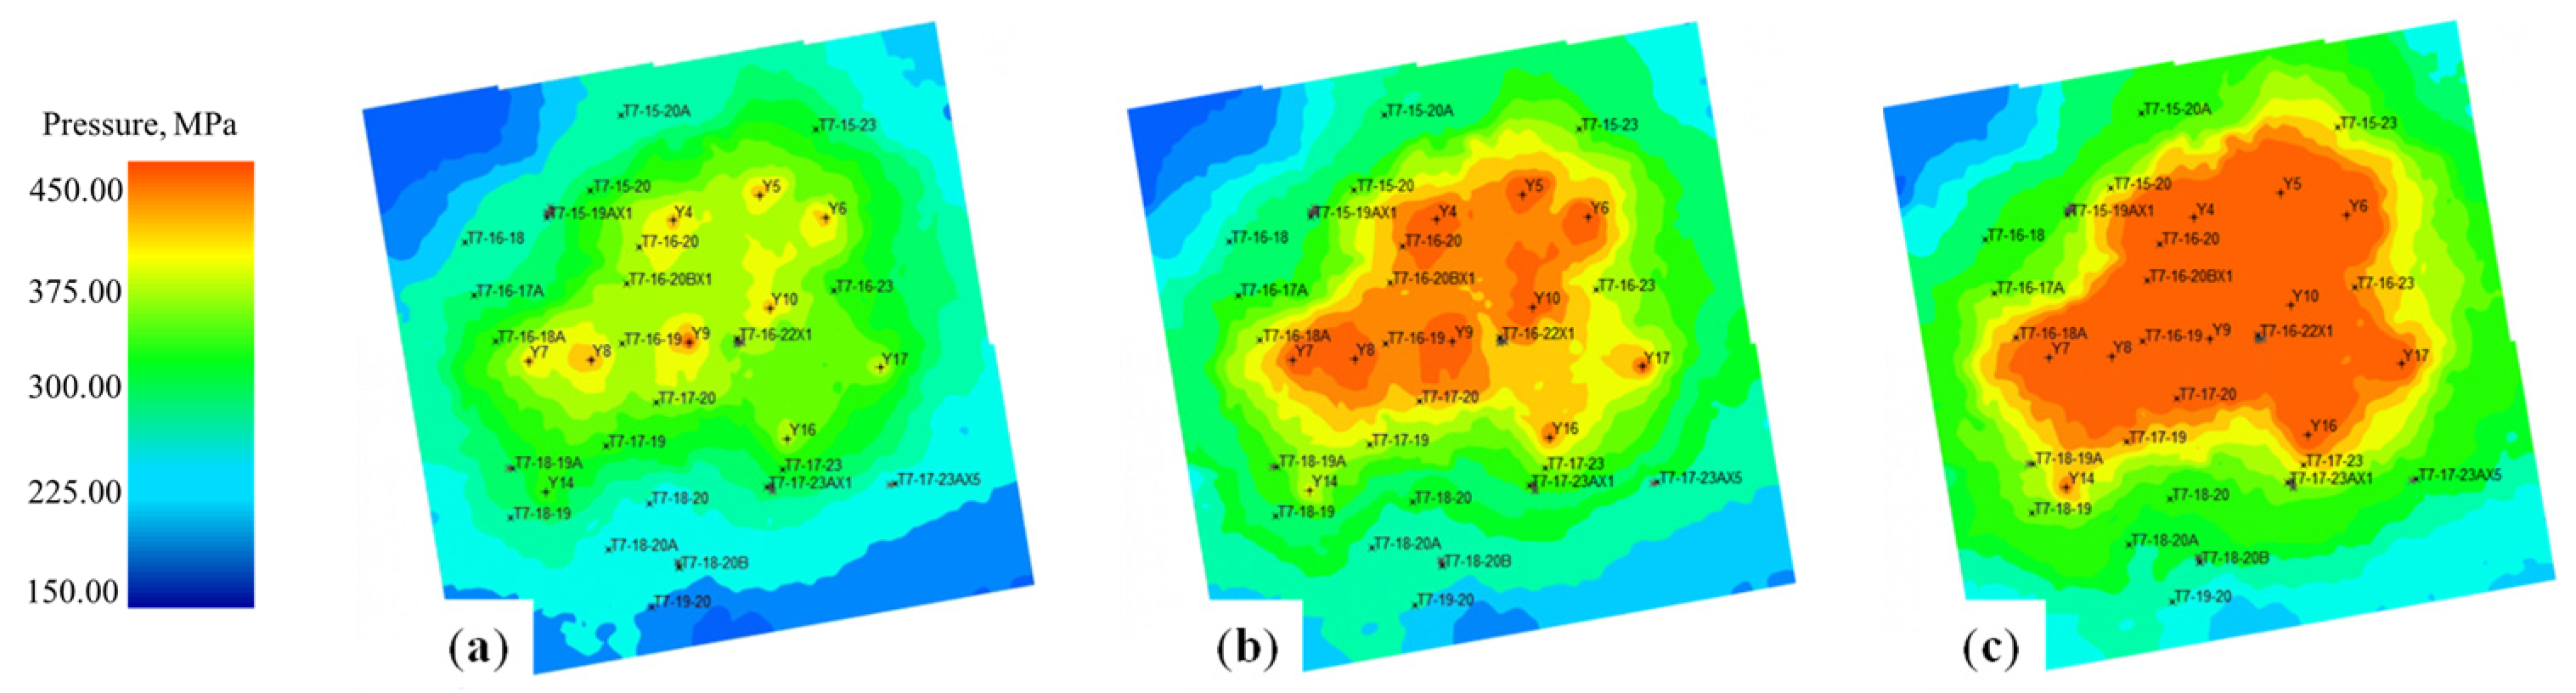
Stratigraphic Pressure Distribution in the Reinjection Layer
The normal operating range of wellhead pressure is 7–15 MPa. According to the fitting equation for rupture pressure, the safe upper limit of formation rupture pressure is 26 MPa. Figure 19 and Figure 20 show that when a single well injects 200 m3 per day, the safe upper limit of rupture pressure will be reached after 20 years (in the simulation). When a single well injects 250 m3 per day, the formation pressure reaches the safe upper limit of rupture pressure in August 2040, after 13 years of reinjection. When a single well injects 300 m3 per day, the formation pressure reaches the safe upper limit of rupture pressure in November 2037, after 16 years of reinjection, at which point 25 × 104 m3 will have been injected. When a single well injects 300 m3 per day, the formation pressure reaches the upper limit in November 2037, at which point 1515.9 × 104 m3 will have been injected over 13 years.
3.
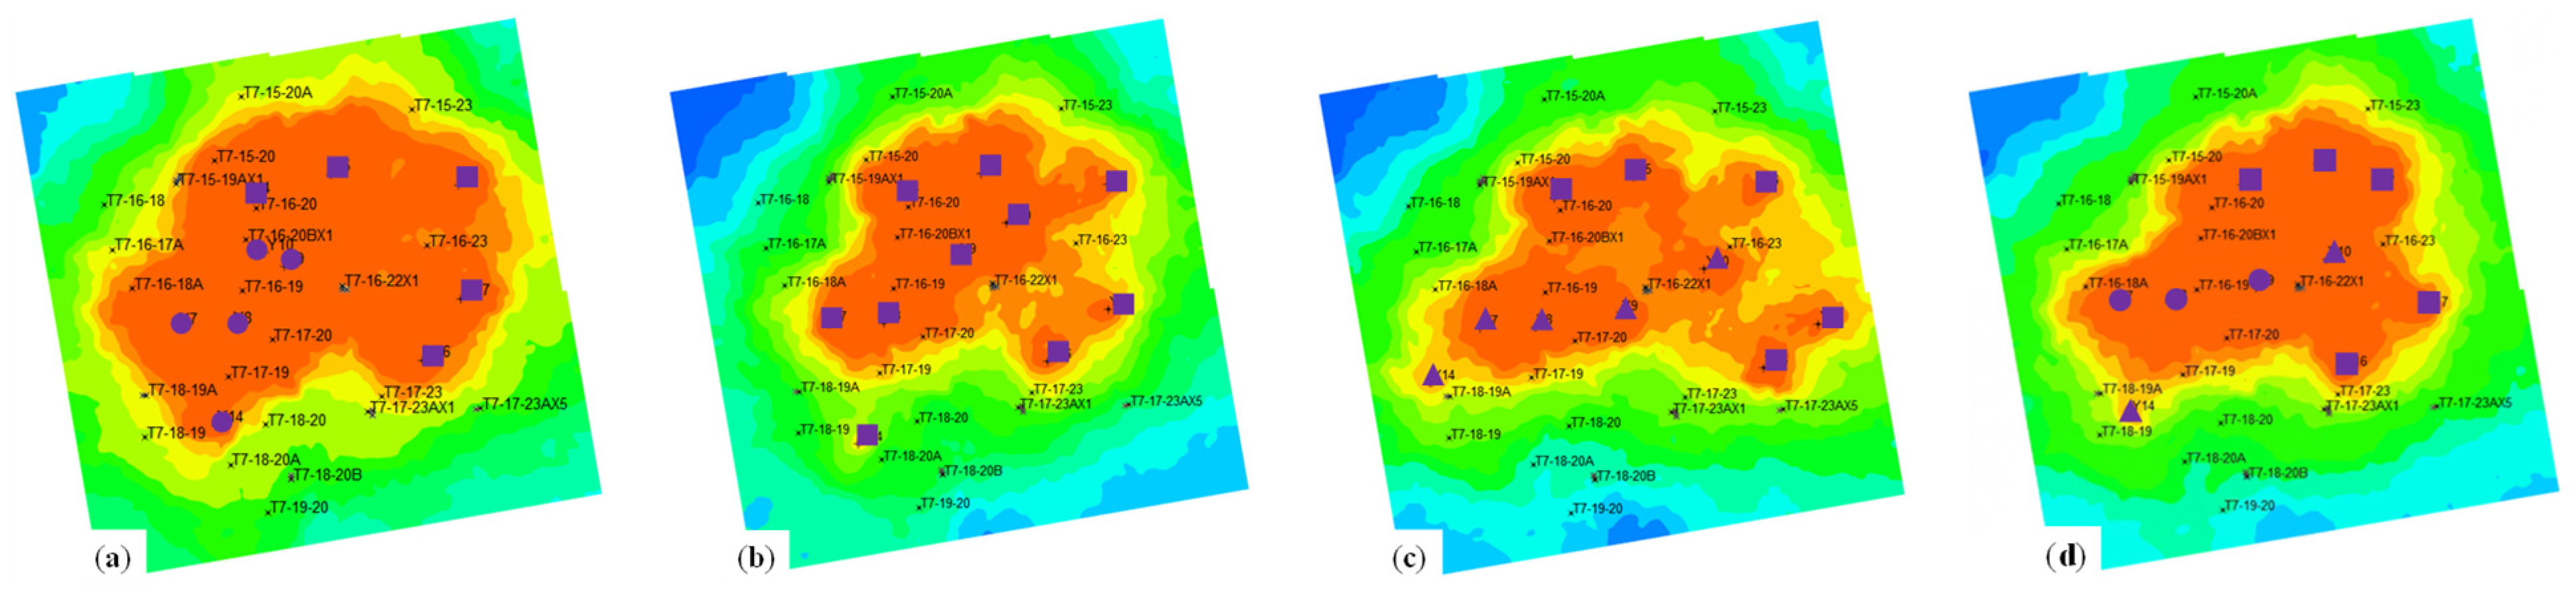
Reinjection water extent
In the three-dimensional numerical simulation software employed, the tracer-tracking technology can show the fluid flow pattern and intuitively present the range of reinjection water flow, as shown in Figure 21. According to the simulation results, the maximum range of the plane injection water under three different daily water injection volumes is not more than 2200 m, and the range of the reinjection water in the vertical direction does not break through the top surface of Chang 2.
A comprehensive numerical simulation of the above studies on the amount of water reinjected, the formation pressure of the reinjection, the reinjection water, and the range of the study was conducted according to the Yanchang Formation of physical properties and the degree of collective enrichment of the reservoir. Ten reinjection wells were selected to realize the Yanchang Formation of physical properties and the degree of enrichment of the reservoir, in accordance with the corresponding amount of reinjection. This is also in line with the security norms for injection, as the sealing of the injection layer is better and will not exceed the upper limit of rupture pressure of the overlying strata, ensuring the safety of reinjecting water in accordance with the corresponding injection principle of the selected layer. This corresponds to the principle of selecting layers for reinjection. The preferred daily reinjection volume is 300 m3, the pressure rise of the overlying layer is less than 1.0 MPa, and the cumulative reinjection water volume is 1515.9 × 104 m3.

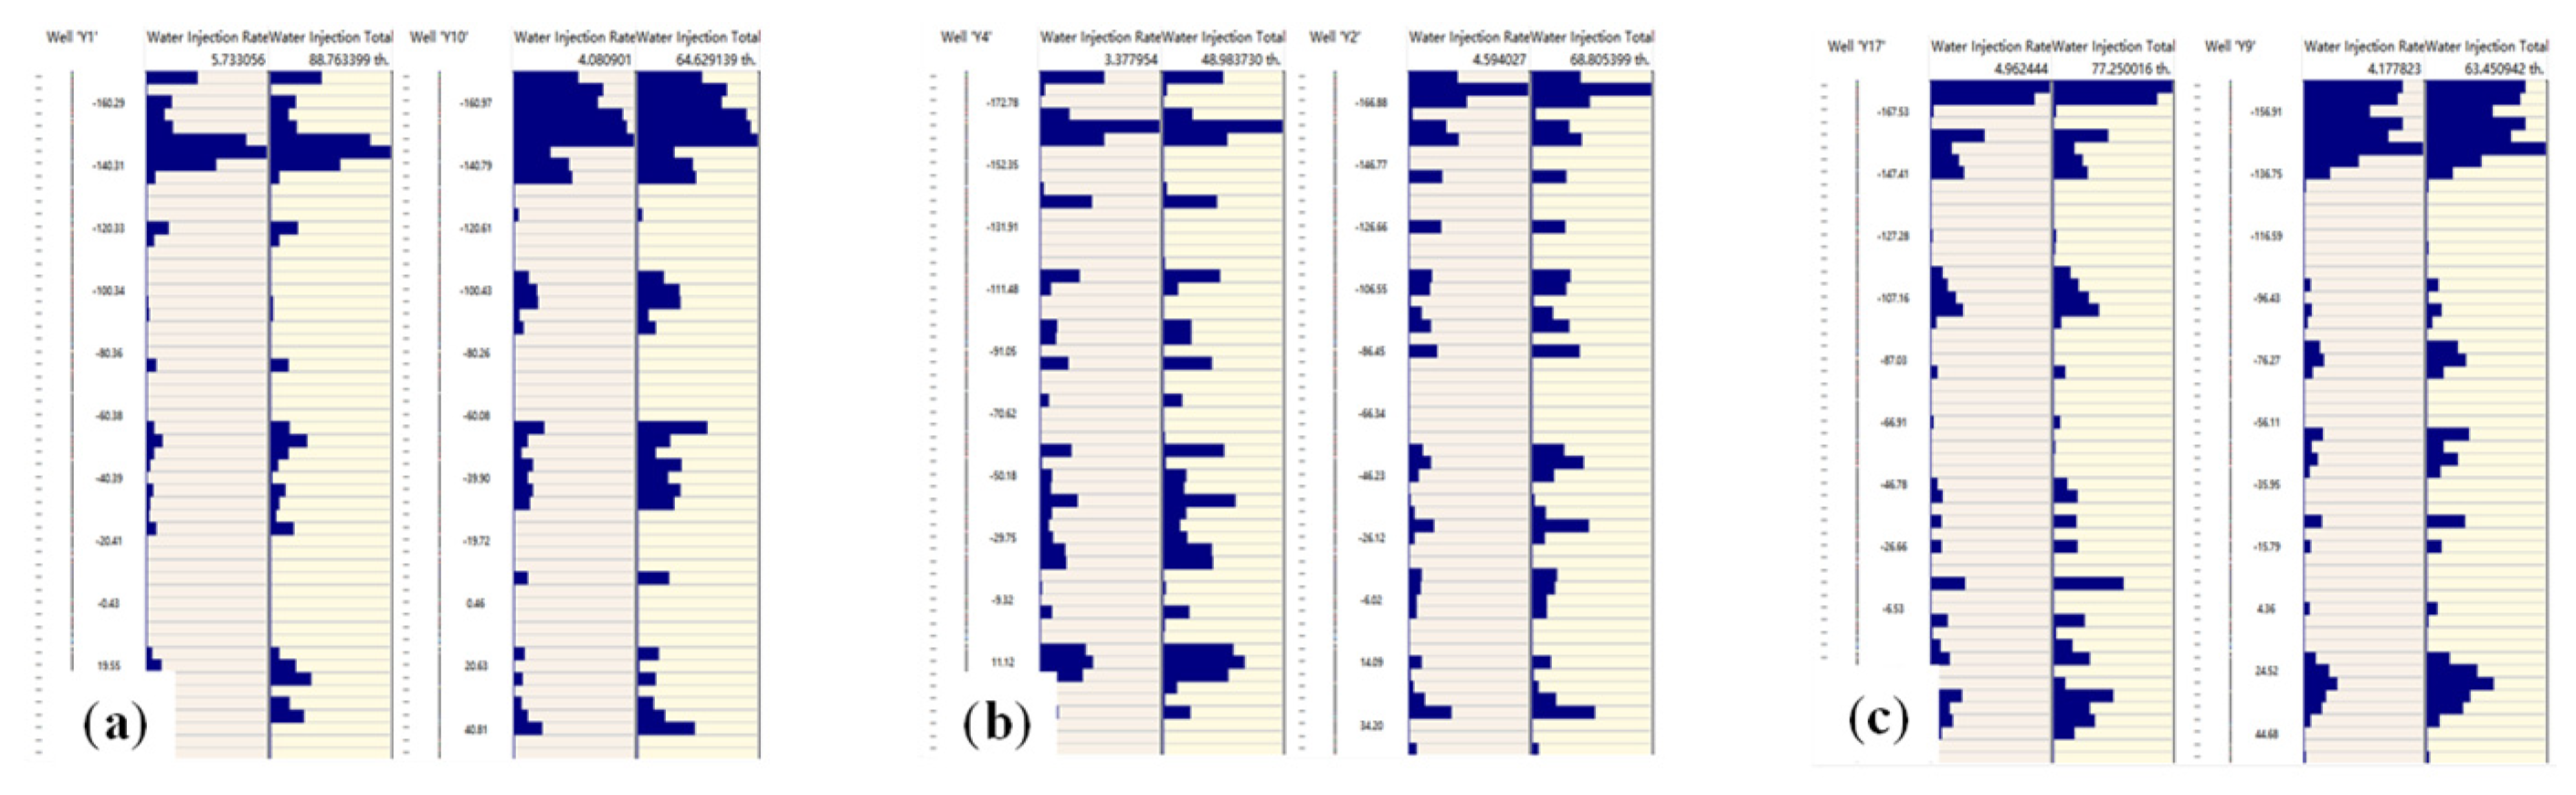
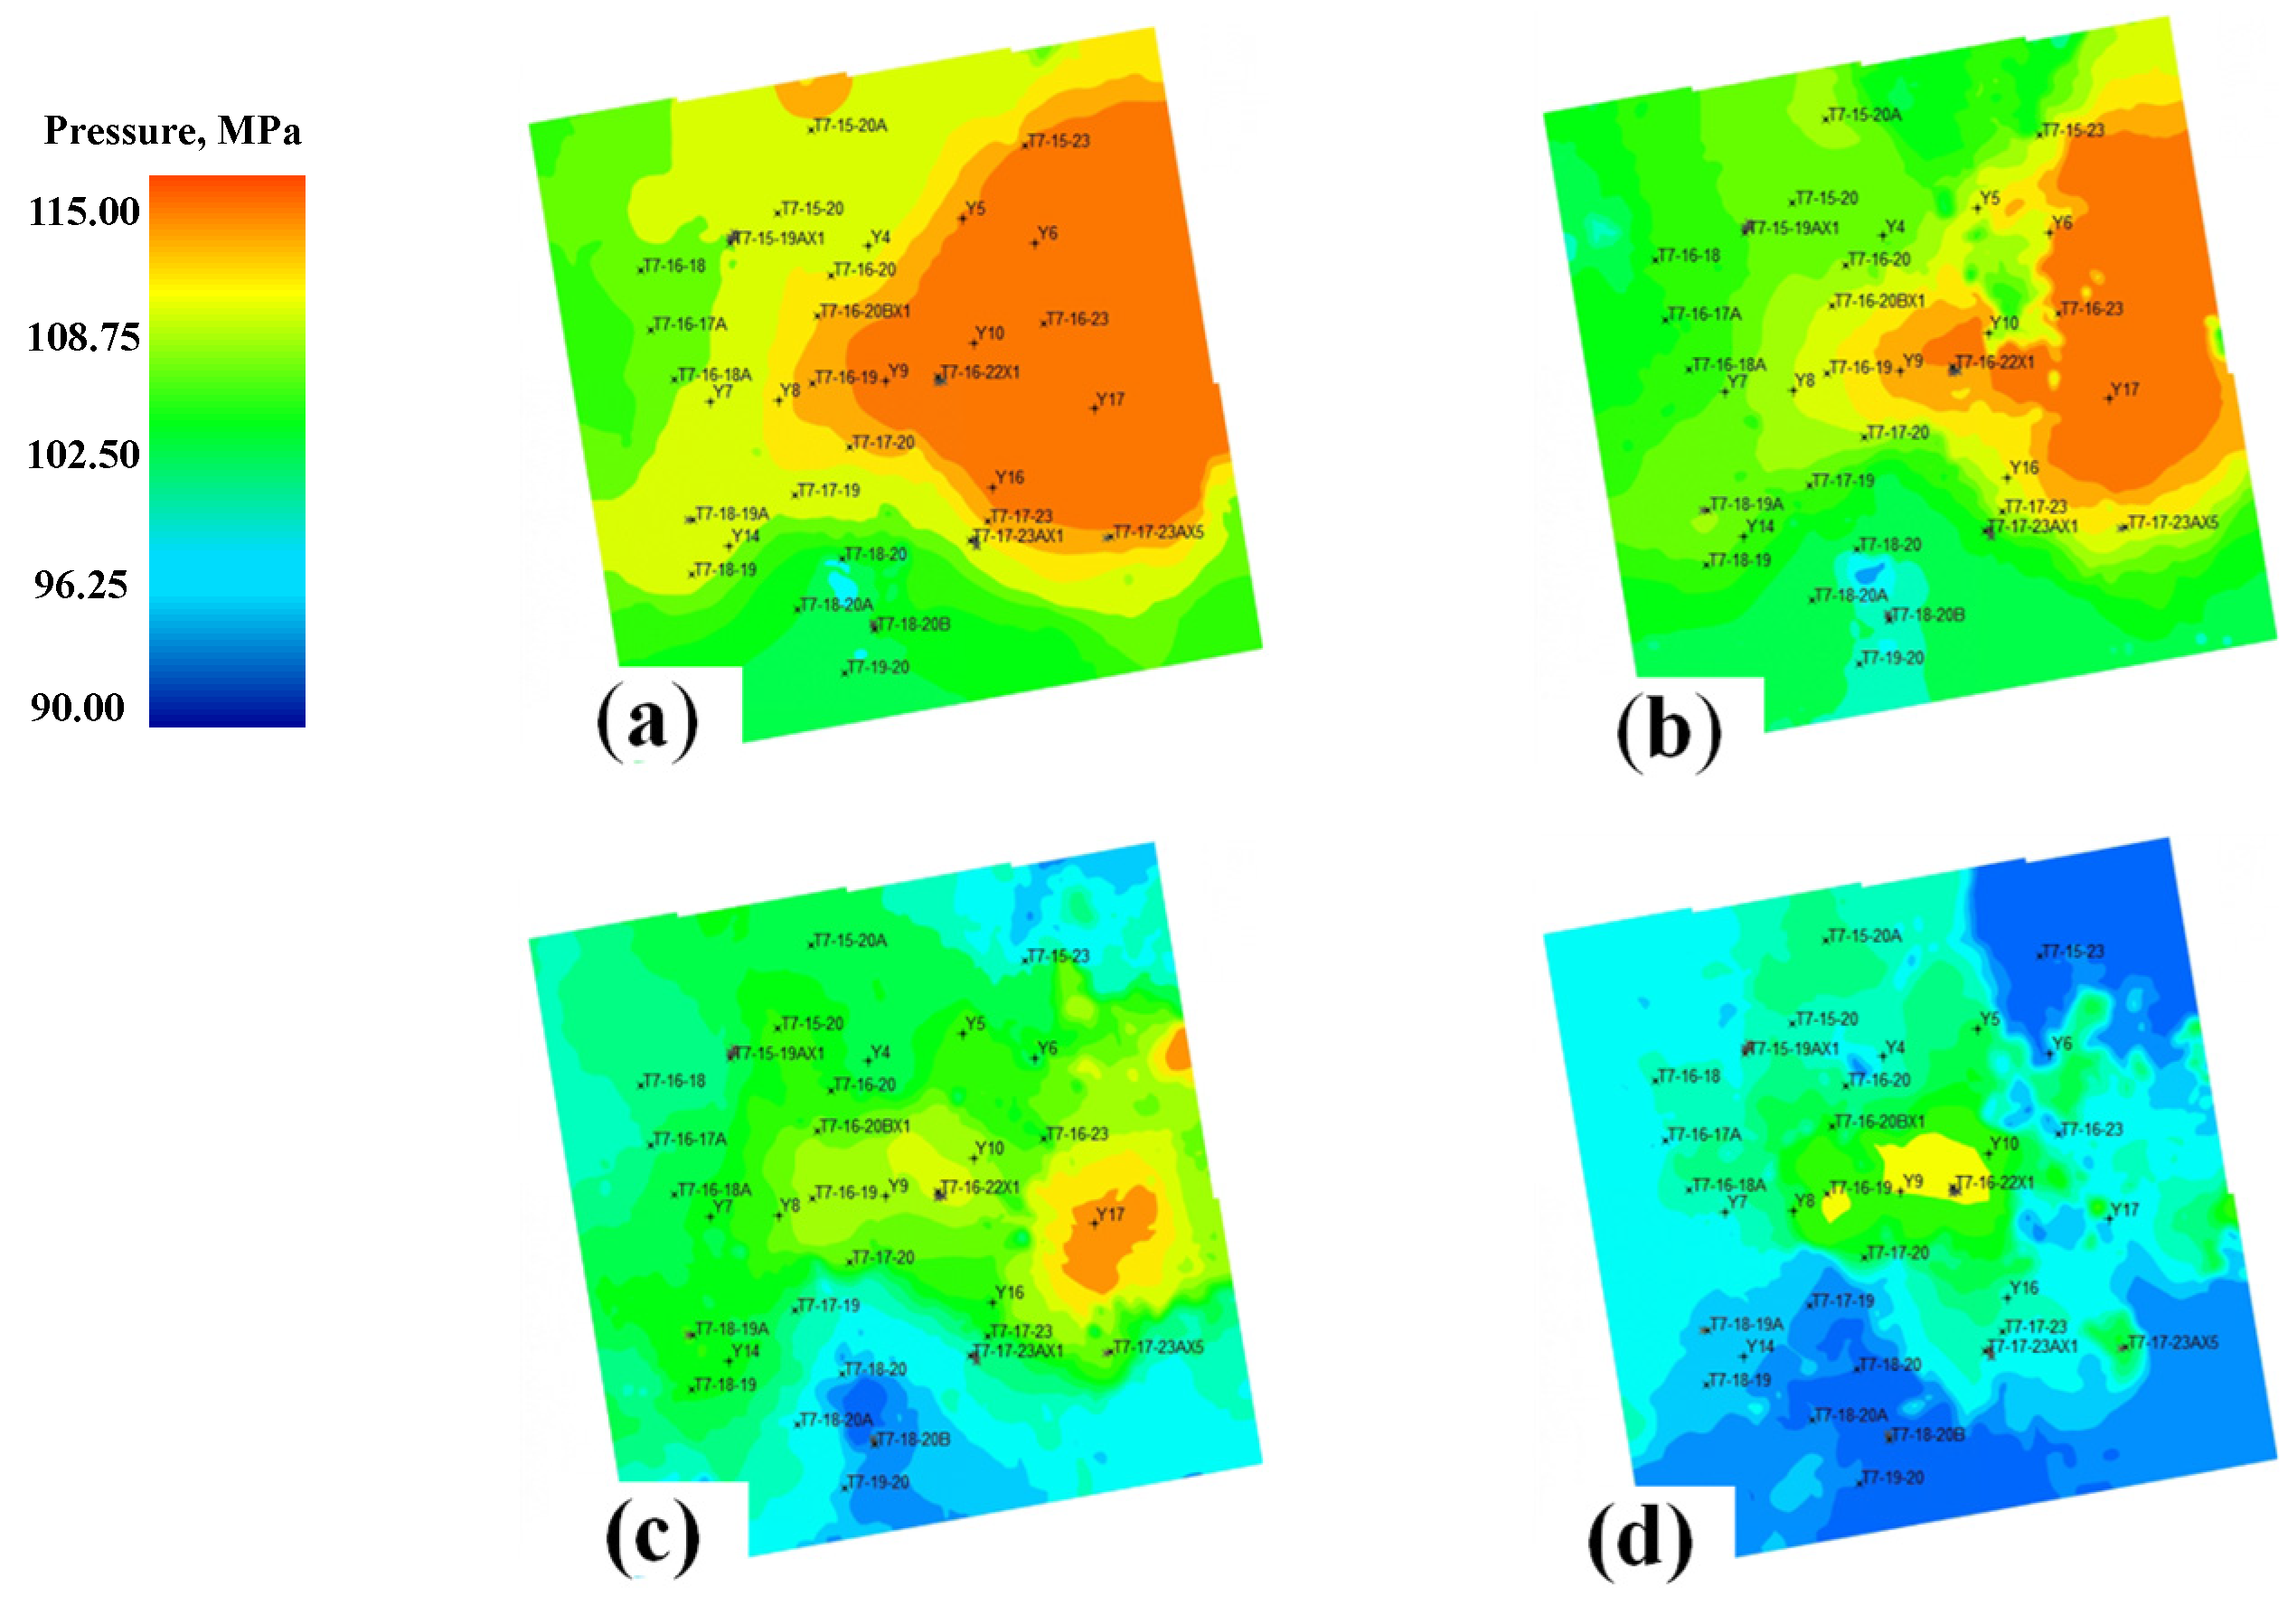
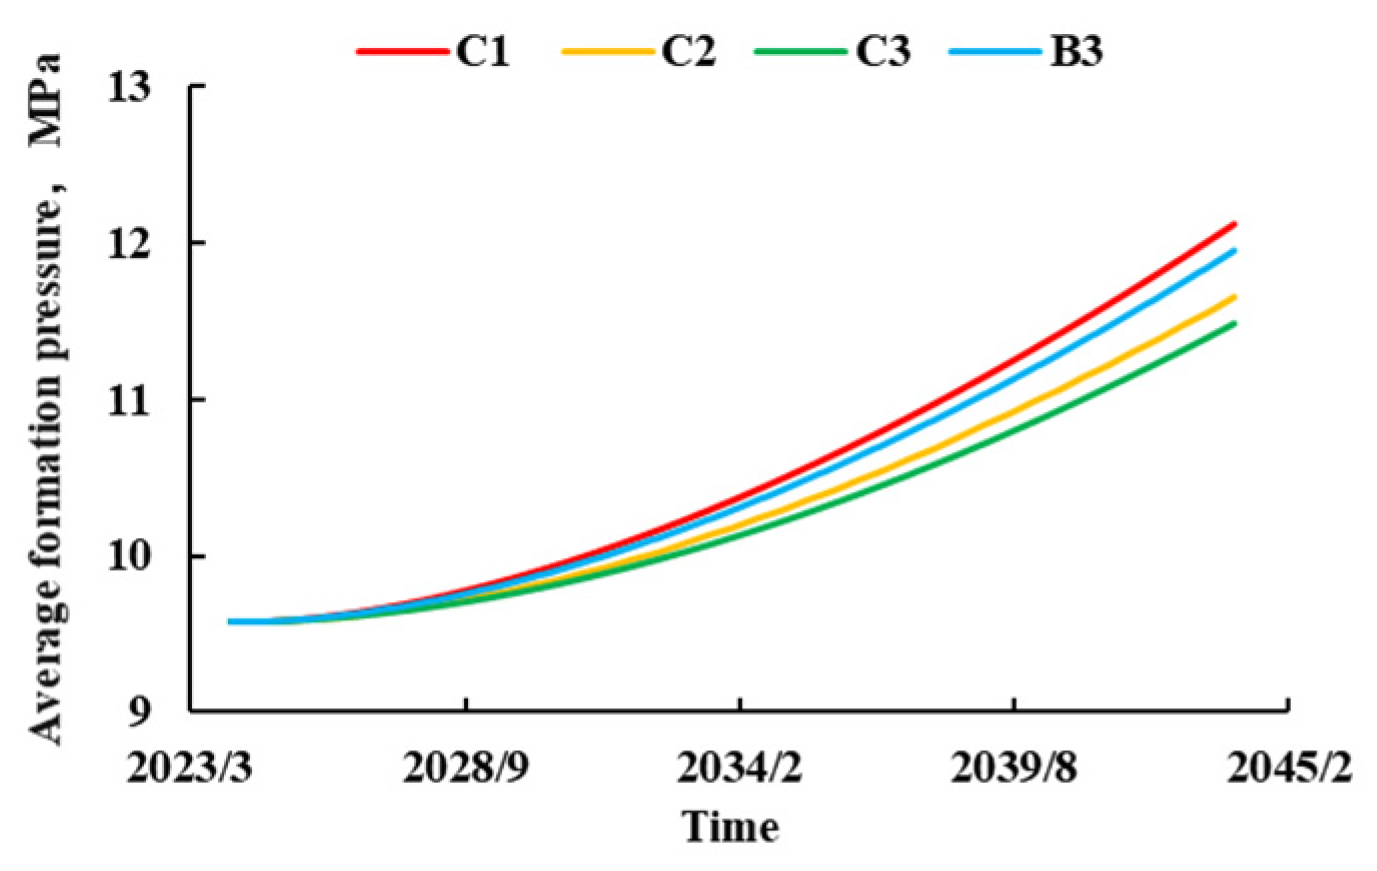
4.3.3. Group C Stratigraphic Inhomogeneity Study

According to relevant data from prior research, reservoir non-homogeneity affects the injection effect [30,31]. Therefore, the permeability coefficient of variation was used to calculate the extent of non-homogeneity in the different regions of the well in the numerical model. Three groups of schemes were designed in order to optimize the non-homogeneity of the injection wells, as shown in Table 3. The distribution of wells for the three group scenarios and the B3 scenario is shown in Figure 22.
As Figure 23 and Figure 24 show, the greater the heterogeneity of the formation, the higher the average reinjection and cover layer pressures, and the lower the formation injection capacity. C1 has a formation pressure of 5 MPa, which is higher than that of C3. The difference in the average formation pressure between C2 and C3 is 1.6 MPa. C1 has an upper cover-layer pressure that is 0.47 MPa higher than that of C3, whereas the difference in the average upper cover-layer pressure between C2 and C3 is only 0.7 MPa.
Figure 25 shows the actual injection-capping pressure changes in the reinjection wells around the study area. In real-life reinjection, the amount of water reinjected is often subject to factors such as on-site process treatment, geological conditions, and construction arrangements, and the amount of water reinjected is not constant, leading to fluctuations in the changes in capping pressure. Comparing Figure 24 with Figure 25 reveals that the model simulation results basically coincide with the real-life situation.
Finally, comparing and analyzing permeability non-homogeneity schemes A3 and B3 revealed that the optimal reinjection scheme is C3 when considering formation permeability non-homogeneity. The maximum cumulative reinjection volume of the formation is 1554.3 × 104 m3 when the formation pressure is less than the safe upper limit of formation rupture pressure. This value is slightly higher than the maximum cumulative reinjection volume achieved using scenario B3.
Problems such as mineral precipitation, rock dissolution, microbial growth, and clay swelling will occur when injection water is reinjected into a formation, impacting subsequent reinjection. For example, after the ions in the reinjection water react with the rocks in the formation, the resulting precipitates will accumulate in the rock pores or throats, increasing reinjection pressure. The acidic reinjection water will react with carbonate rocks, dissolving the rock structure and increasing porosity in the short term. In the long term, this may lead to the instability of the well wall. The study shows that, due to differences in the formation of lithology and the quality of reinjection water in the various blocks of the Ordos Basin, the rules governing the change in porosity and permeability under the influence of the water-rock reaction are highly complex. It is therefore inaccurate to consider the situation in the surrounding area. Currently, there is a lack of relevant data in this study area, making it impossible to consider the water–rock effect in detail. Therefore, future studies will need to conduct experiments such as water quality assays, lithological tests and sensitivity tests in the study area, in order to further consider and quantify the impacts caused by water-rock interaction on the reinjection of extracted water.
The safe upper limit of rupture pressure described in this paper allows for a certain margin of change in formation pressure. If the subsequent pressure change in the layer is still within this margin, because of the actual rupture pressure, the formation rock will not rupture, resulting in water being injected back into the reservoir to a certain extent, ensuring the closure of the water injection layer. At the same time, analyzing the GR and AC curves of the exploratory wells in the study area (see Figure 1) reveals that the mud in the upper part of the Yanchang Formation is well developed, with a thickness of more than 400 m. The mudstone in the Chang 4 + 5 and Chang 7 layers of the Yanchang Formation is also well developed and acts as an effective spacer layer, preventing the downward movement of water. The Yanchang Formation is more than 1000 m deep and has no faults or surface outcrops. In summary, the long-term storage safety of reinjected water in this formation after the simulation period was found to be sufficient.

5. Conclusions

This paper discusses the three main ways of treating extracted water from gas fields. The reinjection of underground water needs to be studied and formulated in a more detailed manner, specifying the principles of layer selection and the reinjection capacity of the layer, closure, and other conditions. There is still a lack of uniform regulatory standards for unconventional gas fields regarding the external discharge of treated water. Comprehensive reuse needs to be considered in terms of both cost and efficiency and actively applied in practice. The importance of valuable components of resource recovery and utilization must be emphasized. For different types of value extraction, corresponding process provisions should be formulated to ensure environmental safety in order to leverage these components industrially and develop uniform norms in a timely manner. The valuable components of resource recovery and utilization must be strengthened. External reuse needs to be actively applied in practice while considering cost and efficiency, and unified specifications must be developed. The importance of the recycling of valuable components needs to be emphasized, and corresponding process regulations should be formulated for the extraction of different types of valuable materials, which should be introduced into industrialization and extensively developed under the premise of guaranteeing environmental safety so as to form a resource recycling chain.
According to the layer selection principle and existing geological results, we analyzed the produced-water reinjection layer in a gas field, finding that it met the specifications. We verified the accuracy of our approach by using three-dimensional geological modeling and three-dimensional numerical simulation technology. Through actual simulations, we determined that the optimal reinjection layer had a cumulative injection amount equal to 1554.3 × 104 m3. The pressure change in the reinjection layer is in the range of 0–20 MPa, and the pressure change in the upper covering layer can be kept within 3 MPa. Additionally, the change in pressure in the overburden of the reinjection layer can be kept within 3 MPa. These findings are consistent with the actual reinjection data and prove the long-term safety of the closure of the reinjection layer.

Author Contributions

Data curation, visualization, and writing—original draft preparation, H.X.; conceptualization, writing-review and editing, P.Z.; data curation and visualization, P.Y.; conceptualization and methodology, Y.M. All authors have read and agreed to the published version of the manuscript.

Funding

This research was funded by the Sichuan Provincial Science and Technology Department (No. 2024NSFSC2012).

Data Availability Statement

The original contributions presented in this study are included in the article. Further inquiries can be directed to the corresponding author.

Acknowledgments

The authors are grateful to the anonymous reviewers whose valuable suggestions helped to improve the quality of this manuscript.

Conflicts of Interest

All authors declare that this research was conducted in the absence of any commercial or financial relationships that could be construed as a potential conflict of interest.

References

  1. Chen, C.; Xiu, C.; Guo, D.; Song, Q.; Wu, B.; Zhang, K. Research progresses on environmental risk in reinjection of unconventional gas produced water. Environ. Prot. Chem. Ind. 2020, 40, 15–20. [Google Scholar]
  2. Jia, C.; Hu, J.; Sepehrnoori, K. Numerical studies of unstable fingering flow in a water-oil system. In Proceedings of the SPE Improved Oil Recovery Conference, Tulsa, OK, USA, 22–25 April 2024. [Google Scholar]
  3. Yang, S.; Wang, Q.; Zhang, K.; Chen, H.; Liu, S.; Cai, M.; Wang, Y. Key challenges and countermeasures for treatment and disposal of gas field produced water in China. Ind. Water Treat. 2024, 44, 13–20. [Google Scholar]
  4. Lin, J.; Li, S.; Jiang, C.; Xu, G.; Wu, L.; Wang, N.; Yang, H.; Wang, J. Research on key technologies for treating produced water of gas field. Petrochem. Ind. Appl. 2024, 43, 49–53. [Google Scholar]
  5. Liu, J.; Che, J.; Du, K.; Zhang, Q.; Meng, H.; Guo, X.; Luo, H.; Wu, H. Optimization and application of sewage treatment agents in gas field. Chem. Eng. 2024, 52, 29–33. [Google Scholar]
  6. Liu, D.; Cai, Y.; Feng, Z.; Zhang, Q.; Hu, L.; Li, S. Feasibility study on geothermal dolomite reservoir reinjection with surface water in Tianjin, China. Water 2024, 16, 3144. [Google Scholar] [CrossRef]
  7. Alrekabi, A.; Adhab, S.A.; Aljubouri, H.; Saad, H.F.A. Formation damage modeling for unfiltered produced water reinjection in north-rumaila oil field. Pet. Chem. 2024, 64, 875–882. [Google Scholar] [CrossRef]
  8. Xia, T.; Feng, Q.; Wang, A.; Shu, Q.; Zhang, Y.; Sun, Y. A numerical study of particle migration in porous media during produced water reinjection. ASME. J. Energy Resour. Technol. 2022, 144, 073002. [Google Scholar] [CrossRef]
  9. Wang, J. Corrosion mechanism and prevention technology of water injection pipeline column in puguang gas field. China Pet. Chem. Stand. Qual. 2022, 42, 38–39+42. [Google Scholar]
  10. Zhang, D. Causes and countermeasures of wellbore corrosion in gas field sewage reinjection wells. China Pet. Chem. Stand. Qual. 2020, 40, 41–42. [Google Scholar]
  11. Wang, R.; Chen, Z.; Zhao, F.; You, J.; Jiang, F.; Bai, H.; Zhang, R. Prediction of limit water injection capacity of sewage injection wells in Yulin gas field. Environ. Prot. Oil Gas Fields 2023, 33, 20–26. [Google Scholar]
  12. He, K.; Weng, B.; Jiao, Y.; Wu, X.; Lin, Q.; Hu, X. Application of Hall plot in environmental risk prevention and control of gas field water reinjection. Chem. Eng. Oil Gas 2023, 52, 122–125+129. [Google Scholar]
  13. Liu, Q.; Lu, K.; Wu, R. Evaluation and Index Prediction of sewage reinjection capability in water drive gas reservoir. Environ. Prot. Oil Gas Fields 2022, 32, 33–37. [Google Scholar]
  14. Bao, B.; Wang, W. Process design and efficiency enhancement of natural gas produced water treatment technologies. China Pet. Chem. Stand. Qual. 2025, 45, 184–186. [Google Scholar]
  15. Huang, Y.; Lei, H.; Na, J.; Yuan, Y.; Tian, H. Investigations of the impact of geothermal water reinjection on water-rock interaction through laboratory experiments and numerical simulations. Appl. Geochem. 2024, 175, 106180. [Google Scholar] [CrossRef]
  16. Su, Y.; Zhang, H.; Lv, G.; Wu, F.; Xiao, P.; Zhu, M.; Zhao, C.; Liu, Q. Synergistic effects of mixed microorganisms on the corrosion of X65 carbon steel in actual reinjection water. J. Environ. Chem. Eng. 2024, 12, 114015. [Google Scholar] [CrossRef]
  17. Yu, C.; Cheng, K.; Huang, Z.; Huang, Z.; Li, J.; Hu, J.; Yang, D.; Li, R. Experimental study on reinjection enhancement of sandstone with radial wells. Geothermics 2024, 120, 102972. [Google Scholar] [CrossRef]
  18. Guo, X.; Yang, C.; Chen, W.; Li, X.; Liu, K. Research progress on inverse demulsifiers and flocculants for oil-bearing produced water from unconventional gas fields. Environ. Prot. Chem. Ind. 2023, 43, 304–313. [Google Scholar]
  19. Hu, Z.; Liu, C.; Li, X.; Liu, K.; Chen, W. Status of disposal methods and treatment technology of produced water from unconventional gas fields in China. Environ. Prot. Chem. Ind. 2024, 44, 11–20. [Google Scholar]
  20. Silva, T.L.S.; Morales-Torres, S.; Castro-Silva, S.; Figueiredo, J.L.; Silva, A.M.T. An overview on exploration and environmental impact of unconventional gas sources and treatment options for produced water. J. Environ. Manag. 2017, 200, 511–529. [Google Scholar] [CrossRef]
  21. Si, L. Study on selecting layers for reinjection of highly saline produced water from unconventional gas fields. Sci. Technol. Innov. 2025, 5, 113–116. [Google Scholar]
  22. Abdelhamid, C.; Latrach, A.; Rabiei, M.; Venugopal, K. Produced water treatment technologies: A review. Energies 2025, 18, 63. [Google Scholar] [CrossRef]
  23. Gangwar, A.; Rawat, S.; Rautela, A.; Yadav, I.; Singh, A.; Kumar, S. Current advances in produced water treatment technologies: A perspective of techno-economic analysis and life cycle assessment. Environ. Dev. Sustain. 2024, prepublish. [Google Scholar] [CrossRef]
  24. Sanchez-Rosario, R.; Hildenbrand, Z.L. Produced water treatment and valorization: A techno-economical review. Energies 2022, 15, 4619. [Google Scholar] [CrossRef]
  25. Ma, M.; Zhang, X.; Chen, Z. Research progress on treatment technologies of gas field produced water. Environ. Prot. Chem. Ind. 2023, 43, 285–291. [Google Scholar]
  26. Guo, F.; Wang, Y.; Shang, F.; Fang, L.; Zhang, X. Comparison and optimization of the permeability upscaling methods: A case study on Libra Oilfield in Brazil. Petroleum Geol. Oilfield Dev. Daqing 2019, 38, 58–66. [Google Scholar]
  27. Zhao, B. Discussion on the influence of grid coarsening on reservoir numerical simulation. In Proceedings of the 2017 International Conference on Oil and Gas Field Exploration and Development (IFEDC 2017), Chengdu, China, 21–22 September 2017; Daqing Oil Production Plant Fourth Geological Brigade: Daqing, China, 2017; pp. 990–995. [Google Scholar]
  28. Liu, Z. Influence of mesh coarsening on results of reservoir numerical simulation. Petrochem. Ind. Technol. 2017, 24, 149. [Google Scholar]
  29. Liu, Z.; Gu, J. Analysis of the effect of mesh coarsening on the results of numerical simulation calculations. J. Oil Gas Technol. 2015, 37, 44–46. [Google Scholar]
  30. Miao, W.; Gu, J.; Wu, G.; Lv, N.; Yu, B. Study on the Heterogeneity of the Reservoir in Block B, HUAQING Oilfield and Its Water-injecting Opening Effects. Inn. Mong. Petrochem. Ind. 2020, 46, 102–104. [Google Scholar]
  31. Dong, L.; Zhong, P.; Zhang, Q.; Wang, M.; Dong, W.; Wang, Y.; Yang, C. Experimental Investigation on Layer Subdivision Water Injection in Multilayer Heterogeneous Reservoirs. ACS Omega 2023, 8, 43546–43555. [Google Scholar] [CrossRef]
Figure 1. Logging curves and stratification.
Energies 18 03149 g001
Figure 2. Single-well petrography.
Energies 18 03149 g002
Figure 3. Petrographic model.
Energies 18 03149 g003
Figure 4. Petrographic model raster.
Energies 18 03149 g004
Figure 5. Planar sandbody distribution in the Yanchang Formation: (a) surface sandbody distribution of the Chang 1 member; (b) surface sandbody distribution of the Chang 2 member; (c) surface sandbody distribution of the Chang 3 member.
Energies 18 03149 g005
Figure 6. Sandbody distribution in vertical well cross-sections of the Yanchang Formation: (a) X-directional lithofacies cross-section through the wellbore; (b) Y1-directional lithofacies cross-section through the wellbore; (c) Y2-directional lithofacies cross-section through the wellbore.
Energies 18 03149 g006
Figure 7. Mean formation pressure and inaccuracy curves for the refined and coarsened models.
Energies 18 03149 g007
Figure 8. Three-dimensional porosity modeling.
Energies 18 03149 g008
Figure 9. Three-dimensional penetration modeling.
Energies 18 03149 g009
Figure 10. Stratigraphic rock fracture pressure curves.
Energies 18 03149 g010
Figure 11. Three different seepage patterns in the Yanchang Formation stratigraphy: (a) top-absorbing type; (b) uniformly absorbent; (c) water-absorbing type at both ends.
Energies 18 03149 g011
Figure 12. Average pressure curve of the reinjection layer.
Energies 18 03149 g012
Figure 13. Average pressure curve of the capping layer.
Energies 18 03149 g013
Figure 14. The average formation pressure of the cap layer at different thicknesses in the upper part of the reinjection layer for a single well with a daily injection rate of 200 m3 of water: (a) average stratigraphic pressure field in the 0–10 m-thick cap layer above the top of the injection layer; (b) average stratigraphic pressure field in the 10–20 m-thick cap layer above the top of the injection layer; (c) average stratigraphic pressure field in the 20–30 m-thick cap layer above the top of the injection layer; (d) average stratigraphic pressure field in the 10–40 m-thick cap layer above the top of the injection layer.
Energies 18 03149 g014
Figure 15. The average formation pressure of the cap layer at different thicknesses in the upper part of the reinjection layer for a single well with a daily injection rate of 250 m3 of water: (a) average stratigraphic pressure field in the 0–10 m-thick cap layer above the top of the injection layer; (b) average stratigraphic pressure field in the 10–20 m-thick cap layer above the top of the injection layer; (c) average stratigraphic pressure field in the 20–30 m-thick cap layer above the top of the injection layer; (d) average stratigraphic pressure field in the 10–40 m-thick cap layer above the top of the injection layer.
Energies 18 03149 g015
Figure 16. The average formation pressure of the cap layer at different thicknesses in the upper part of the reinjection layer for a single well with a daily injection rate of 300 m3 of water: (a) average stratigraphic pressure field in the 0–10 m-thick cap layer above the top of the injection layer; (b) average stratigraphic pressure field in the 10–20 m-thick cap layer above the top of the injection layer; (c) average stratigraphic pressure field in the 20–30 m-thick cap layer above the top of the injection layer; (d) average stratigraphic pressure field in the 10–40 m-thick cap layer above the top of the injection layer.
Energies 18 03149 g016
Figure 17. The average stratum pressure curves of the cap layer at different depths in the upper part of the reinjected water layer for three different daily water injection scenarios: (a) average stratigraphic pressure curves for the 0–10 m-thick cap layer above the injection layer; (b) average stratigraphic pressure curves for the 10–20 m-thick cap layer above the injection layer; (c) average stratigraphic pressure curves for the 20–30 m-thick cap layer above the injection layer; (d) average stratigraphic pressure curves for the 30–40 m-thick cap layer above the injection layer.
Energies 18 03149 g017
Figure 18. Mean formation pressure profiles for different injection volumes and capping thicknesses at the end of the simulation period.
Energies 18 03149 g018
Figure 19. Mean stratigraphic pressure field at the reinjection level of the Yanchang Formation: (a) distribution of formation-averaged pressure fields for a single-well injection rate of 200 m3/d; (b) distribution of formation-averaged pressure fields for a single-well injection rate of 250 m3/d; (c) distribution of formation-averaged pressure fields for a single-well injection rate of 300 m3/d.
Energies 18 03149 g019
Figure 20. A plot of the average formation pressure in the reinjected-water formation, where the red dashed line with an arrow intersecting the X-axis denotes the safe upper limit of the formation rupture pressure.
Energies 18 03149 g020
Figure 21. Yangchang Formation back-injection water wave range and pressure wave intersection map: (a) the intersection of the injection and pressure waves for an injection volume of 200 m3/d; (b) the intersection of the injection and pressure waves for an injection volume of 250 m3/d; (c) the intersection of the injection and pressure waves for an injection volume of 300 m3/d.
Energies 18 03149 g021
Figure 22. Plots of the average formation pressure field for different well location distributions. In the four plots above (ad), circles indicate well locations with extensive non-homogeneity, squares indicate well locations with moderate non-homogeneity, and triangles indicate well locations with low non-homogeneity: (a) the average formation pressure field for scenario C1; (b) the average formation pressure field for scenario C2; (c) the average formation pressure field for scenario C3; (d) the average formation pressure field for scenario B3.
Energies 18 03149 g022
Figure 23. Average pressure curve of the reinjection layer.
Energies 18 03149 g023
Figure 24. Average pressure curve of the capping layer.
Energies 18 03149 g024
Figure 25. Actual reinjection formation cap pressure.
Energies 18 03149 g025
Table 1. Domestic and international practice cases of water reinjection.
NationsOil and Gas FieldsWater Reinjection Technology/ProcessesKey Challenges
ChinaChangqing OilfieldHierarchical treatment process, digital monitoring, layered reinjectionComplex water quality, low permeability of reservoirs, high inhomogeneity
Daqing OilfieldPretreatment and advanced treatment technology, downhole oil–water cyclone separation, same-well injection and production, skid-mounted chemical equipmentSerious equipment corrosion, high viscosity of produced water, the difficulty of separating oil and water.
Xinjiang OilfieldGraded treatment, in situ separation and reinjection technology, CO2 synergistic sequestrationComplex water quality, limited processing capacity of existing reinjection systems, harsh reinjection conditions
United StatesPermian BasinGraded physical separation, great-depth-boron treatment, deep geological sequestration, CO2 collaborative storageThe large volume of fracture recharge water, complex geological structures, regulations and public pressure
United KingdomClair RidgeLow mineralization water drive technology, sand control and microseismic monitoring technology, deep geological storage technologyFracture development in reservoirs, engineering risks, the greater energy consumption of reverse osmosis systems
CanadaSurmontEvaporation pond and advanced oxidation technology, coupled bio-membrane treatment technology, steam-assisted gravity drainage reinjection technologyThe difficulty of treating high levels of salt and organic matter, cold-climate influence, low reservoir permeability, the demand for high-pressure injection
Saudi ArabiaShaybahHigh-temperature membrane separation and air floatation-coupling technology, deep saltwater layer reinjection technology, CO2 synergistic storageProcesses are affected by high temperatures in the summer; there is a risk of high salt and high silicon scaling
Table 2. Three-dimensional numerical model parameters.
Modeling ParametersUnitNumerical Value
Number of gridsnumber123 × 120 × 250
Grid size in the x-directionm50
Grid size in the x-directionm4
Porosityf0–0.29
PermeabilitymD0–30
Area of study areakm236
Ground pressure coefficientMPa/m8.95 × 10−3
Rock compression factorMPa−14 × 10−4
Viscosity of watermPa·s0.6
Density of waterg/cm31.0203
Compression factor of waterMPa−15 × 10−5
Volume factor of water/1.007
Table 3. Non-homogeneous program settings.
Program NumberNumber of Wells Injected
Er > 0.70.5 > Er > 0.7Er < 0.5
C1550
C20100
C30505
Disclaimer/Publisher’s Note: The statements, opinions and data contained in all publications are solely those of the individual author(s) and contributor(s) and not of MDPI and/or the editor(s). MDPI and/or the editor(s) disclaim responsibility for any injury to people or property resulting from any ideas, methods, instructions or products referred to in the content.

