Article

Thermal Conductivity of Sustainable Earthen Materials Stabilized by Natural and Bio-Based Polymers: An Experimental and Statistical Analysis

1
Dipartimento di Ingegneria Meccanica, Chimica e dei Materiali, Università degli Studi di Cagliari, Via Marengo 2, 09123 Cagliari, Italy
2
Research and Development Laboratory for Aerospace Materials, Rzeszow University of Technology, Powstancow Warszawy 12, 35-959 Rzeszow, Poland
3
Dipartimento di Ingegneria Civile, Ambientale e Architettura, Università degli Studi di Cagliari, Via Marengo 2, 09123 Cagliari, Italy
*
Author to whom correspondence should be addressed.
Energies 2025, 18(12), 3144; https://doi.org/10.3390/en18123144
Submission received: 14 May 2025 / Revised: 9 June 2025 / Accepted: 11 June 2025 / Published: 15 June 2025

Abstract

:
The natural and sustainable ability of earthen building materials makes them highly valuable. Bio-stabilization involves using biological materials or processes in earthen construction to enhance the performance and characteristics of earthen materials. The main objective of bio-stabilization is to substitute high-energy-intensive building materials with more green, thermally efficient substitutions, ultimately reducing indirect emissions. The large-scale use of earth presents a viable alternative due to its extensive availability and, more importantly, its low embodied energy. The aim of this work is to investigate the thermal conductivity of earth stabilized with Opuntia Ficus-Indica (OFI), a natural biopolymer, and to assess how these properties vary based on mix design. A comparative analysis is performed to evaluate the thermal performance of bio-based polymer-stabilized earthen materials (S-30, S-40, D-30, and D-40) alongside natural biopolymer-stabilized earth (OFI-30 and OFI-40) under dry conditions, employing an experimental method. A scanning electron microscope was employed to examine the microstructure of bio-stabilized earthen materials from the samples. Statistical analysis was conducted on the collected data using ANOVA with a significance level of 0.05. The Tukey test was applied to identify specific mean pairings that demonstrate significant differences in the characteristics of the mixtures at each replacement level, maintaining a confidence interval of 95%. The experimental and statistical findings reveal that the OFI-30, D-40, and S-40 mixtures exhibit strong bonding with earthen materials and high thermal performance compared to all other mix designs in environmental samples. Additionally, these mix designs show further improvement in thermal performance in the dry conditions.

1. Introduction

Drawing inspiration from nature, humans have depended on earth as a building material for thousands of years. From ancient civilizations to current times, it is commonly utilized across the world. Modern technological advancements have improved society, but they have a seriously harmful impact on the environment, making it challenging for nature to repair itself [1]. Modern goods, services, and infrastructure developed and executed using cutting-edge engineering and scientific understanding, are all considered high-tech. One of the primary causes of many environmental issues is the use of cutting-edge technology in the manufacturing of current building materials for indoor comfort and modern lifestyle. Hi-tech building materials have an environmental impact that lasts throughout their use, not only during manufacturing [2]. For this reason, it is necessary to take precautions for the health of the planet. Materials whose production requires low energy consumption have become more and more in demand as environmental protection has grown. Moreover, materials that optimize energy efficiency in the building industry are becoming increasingly valuable worldwide. According to life cycle studies, earthen buildings have a promising impact on the environment through their eco-friendly structures and sustainable approach. The significance of carbon-neutral building materials is rising in response to the increasing demand for sustainable development [3,4].
The prioritization of conventional building materials, such as earth-based construction, is essential compared to modern materials that pose environmental damage. Therefore, interest in earthen construction materials has significantly increased in the last 20 years due to their inherent environmental benefits [5]. Energy-intensive stabilizers, such as cement, are employed to enhance the engineering properties of building materials; however, this practice raises serious sustainability concerns [6]. The carbon footprint linked to soil stabilizing procedures is significantly increased by cement, which contributes significantly to 7% of worldwide greenhouse gases emissions and 4% in the EU region [7]. Ordinary cements make the soil biologically inactive and reduce the ability to reuse the soil mixture [8]. Furthermore, the calcination process is a major source of pollution, generating 50–60% of the CO2 during the heating and breakdown of limestone in cement manufacturing [9,10]. Approximately 40% of carbon dioxide emissions result from burning fossil fuels to operate the kilns, while an additional 10% arises from the energy consumption associated with raw materials grinding and cement [11,12]. The cement sector must cut its carbon footprint by around 30% until 2030 to fulfil the EU’s climate goals, whose objectives are to achieve carbon neutrality before 2050 [13]. As EU facilities are operating at nearly maximum efficiency, the industrial sector is placing greater emphasis on carbon capture, storage, and utilization technologies. At the same time, research is being conducted on alternative materials to further reduce emissions [7,12].
In these circumstances, adopting sustainable building methods is essential. This involves using energy-efficient thermal materials that maintain indoor comfort while minimizing energy consumption for heating and cooling, as well as sustainable materials that produce low emissions during their production and lifecycle.
This circumstance has led many researchers around the world to search for eco-friendly alternatives to cement for soil stabilization. Significant efforts are underway to identify sustainable binders, including those made from geopolymers [14,15]. Massive shrinkage, increased brittleness, high cost, and mechanical characteristics that deteriorate with time are potential disadvantages for geopolymers. On the other hand, earthen materials with natural binders are a great alternative for many applications, including residential buildings and interior finishes [16,17,18]. The substance in question, which has been in use since the beginning of time, has very low embodied energy > 0.5 MJ/kg [19,20,21,22]. Even though earth is not classified as one of insulating materials, their thermal conductivity depends on their mineralogical composition, with values ranging between 0.17 and 1.1 W/m·K. This range is comparable to that of other commonly used construction materials, such as lime (0.30–0.80 W/m·K) and cement (0.60–1.40 W/m·K). However, unlike the latter, earthen materials do not require energy-intensive manufacturing processes, such as firing, making them a more environmentally sustainable option [23,24,25,26,27].
Furthermore, earthen constructions exhibit good thermal performance, particularly in regions with notable day-to-night temperature fluctuations [28,29]. Owing to their high thermal inertia, earth materials can be effectively employed in cold climates by incorporating a mass wall within an insulating framework. This design enables the wall to absorb, store, and gradually release heat into the structure, maintaining warmth during colder periods [30,31,32]. There could potentially be several advantages to attempting to reduce indirect emissions from the building industry.
From a materials science perspective, it is essential to consider the material’s inherent heterogeneity and variability, along with its marked sensitivity to water [33,34]. These factors can significantly influence its performance and pose a risk to its long-term durability. Both mechanical and thermal characteristics can be significantly impacted by moisture. Research indicates that the presence of moisture can increase thermal conductivity while reducing compressive strength [35,36,37].
The application of stabilizers derived from plants and animals has been used in various countries from the beginning, depending on local availability and construction customs [38,39,40,41]. The most common methods for achieving stabilization today include the use of lime, synthetic polymers and cement [40,41,42,43,44]. The mechanical performance of earthen materials is markedly improved with the incorporation of Portland cement. Un-stabilized earth exhibits a Global Warming Potential (GWP) of 23 g, while stabilization with cement raises the GWP to 64.0–106.0 g. By comparison, conventional concrete material has a 130.0 g GWP approximately [40].
Studies on synthetic polymers have mainly concentrated on soil stabilization in civil engineering, with applications extending to earth construction. Resins produced through polycondensation have typically been preferred due to their cost-effectiveness and feasibility. Common types of these resins include resorcinol–formaldehyde, phenolic, furan, polyacrylate, and polyurethane resins [42,45,46]. However, because they are the least expensive, urea–formaldehyde resins are the most commonly used. The slow onset of brittleness due to resin ageing, however, is a significant disadvantage of this stabilizing technique. Other issues include concerns about toxicity and the fossil fuel origins of these chemicals [47,48,49,50]. In addition to these methods, recent studies have explored thermal treatments at temperatures below those required for ceramic firing, reporting improvements in surface durability and water erosion resistance [51,52,53].
As a result, the quest for sustainable, environmentally friendly, and efficient methods to improve the properties of earth materials continues to pose a considerable challenge for both manufacturers and researchers. One of the most recent and environmentally friendly stabilization methods currently under investigation is biostabilization [54]. Employing biopolymers is an effective approach to enhancing the durability and properties of earth materials. Biopolymers are polymers produced by biological processes and consist of a network of monomers. The presence of hydroxyl (OH) groups in biopolymers enables them to react rapidly with water during hydration, while drying results in a glassy texture. By forming hydrogen bonds with the structure’s hydroxyl groups, they provide molecular-level stabilization [55,56]. Moreover, when biopolymers interact with water, they form polymer networks that effectively bind soil particles. The characteristics of these networks are influenced by the specific type of biopolymer employed [55,57]. Within the biopolymer classification, two principal macro-categories can be distinguished: bio-based polymers, which are deliberately synthesized from renewable natural resources, and natural polymers, which occur spontaneously in nature without human intervention [58]. Material performance in biopolymer stabilization is profoundly affected by changes in both density and porosity. During stabilization, density significantly influences thermal behaviour and mechanical strength. Porosity, in turn, enhances mechanical performance, hydrothermal characteristics, and durability, while the capillary action of the system improves water resistance [34,59,60]. Moreover, the comprehensive characterization of natural polymers remains a challenge for the construction industry [61,62]. This is attributed to the diverse production techniques, variability in testing protocols, and the limited availability of certain natural polymers, which hinder the development of stable, standardized, and readily accessible products [34,59,63].
Bio-based polymers represent an intermediate category between natural and synthetic polymers. This particular class of biopolymers is derived from renewable resources and serves specialized roles as binders in the construction materials industry. Integrating stabilizers with the granular components of soil is a complex process [64,65,66,67]. The final product’s properties, especially thermal conductivity, are affected by various quantitative and polymerization parameters [58,66]. A range of statistical analytical techniques exists in the literature to deepen our understanding of the thermal behaviour of these materials [68].
The study presented in this paper aims to evaluate thermal properties enhancement of earthen building materials stabilized by using mucilage of Opuntia Ficus-Indica (OFI) and bio-based polymers. A comparative analysis of the thermal conductivity of samples was performed under both environmental and dry conditions, utilizing experimental and statistical methods. In particular, the statistical approach could highlight the thermal behaviour–mix-design–microstructure relationship.

2. Materials and Methods

The clay used in this study was purchased from Lozzolo, Vercelli, in northern Italy, and white sand comes from Abbazia di Fossanova, in Latina, Italy. The mineralogical composition of the clay reveals a high content of minerals from the illitic–kaolinitic group (42%), along with 38% quartz, 6% potassium feldspar, and 5% sodium feldspar. The sand is predominantly composed of quartz (94%).
To extract mucilage from Opuntia Ficus-Indica (OFI), fresh cactus pads abundantly available across the island of Sardegna were collected from a rural area near Cagliari, Italy. The species is well adapted to semi-arid and Mediterranean climates, growing on marginal soils without requiring irrigation or chemical inputs [41]. The pads were carefully rinsed with distilled water to eliminate surface dirt and debris. The spines were meticulously removed using a pen knife, and the pads were subsequently cut into small pieces. The skin was peeled off to expose the inner tissue. The prepared cactus pieces were immersed in a container filled with distilled water, ensuring complete submersion. To avoid contamination, the container was sealed and stored in a cool, dark environment with a temperature range of 23 ± 2 °C, protecting the mucilage from potential light-induced degradation. The cactus pieces were left to soak for 7 days, with the mixture gently stirred once daily. After the soaking period, the mixture was filtered through a fine mesh strainer. The cactus pieces were gently pressed to extract the maximum amount of mucilage. The extracted mucilage was then transferred into sterilized glass bottles for further use. Figure 1 illustrates various stages in the processing of Opuntia Ficus-Indica (OFI) mucilage.
The specimens were prepared by combining 64% sand and 34% clay, similar to bio-based polymers samples S-30, S-40, D-30, and D-40 [12] with OFI mucilage. The granulometric composition of the mixture shows coarse (0.023%), medium (2.45%), fine (52.39%), and very fine (10.82%) sand fractions, corresponding to particle sizes retained on sieves with mesh openings of 0.5 mm, 0.25 mm, 0.125 mm, and 0.0625 mm, respectively. Finally, silt and clay make up 34.3% of the mixture. The dry mixture of sand and clay was first prepared, and the samples were categorized into two different groups. For each group, OFI mucilage was added in liquid form at concentrations of 30% and 40%, creating slurries. These mixtures were then poured into 105 × 105 × 20 mm moulds. For each mix formulation, nine samples were created, yielding a total of 18 specimens. After 96 h, the moulds were removed, and the specimens were air-dried for 28 days in a controlled laboratory environment at room temperature (23 ± 2 °C).
The thermal conductivity of the samples was measured using the TCA 300 TAURUS instrument, equipped with a touch screen interface and high-resolution capabilities, which operate with Lambda Basic 2016 PC software (version 1.13.14.0). The high-speed measurement process utilized two precision heat flow plates, arranged symmetrically as hot and cold plates, following the ISO 8301 standard [69]. Each specimen was tested at least three times, with the hot plate set to temperatures (15 °C, 20 °C and 25 °C) and the cold plate set to the corresponding temperatures (−5 °C, 0 °C, and 5 °C). A constant temperature difference of 20 °C between the plates was maintained throughout all experiments. The samples were tested both in environmental conditions (23 ± 2 °C, 60 ± 5% R.U. with the measurement obtained by a psychrometer with condenser transducer) and dry (23 ± 2 °C, 0 ± 0.001% R.U., determined by mass difference between wet and dry states), following the UNI EN 1015-18 standard for plasters. To assess their thermal properties in dry conditions, each sample was oven-dried at 105 °C for 24 h before thermal analysis.
Part of the data used for the statistical analysis and for comparison with the samples made with OFI comes from Cappai et al. [12]. The samples—R30, R40, S30, S40, D30, and D40—share the same mix of clay and sand but differ in the type and amount of resin used. Specifically, the S samples were made with an oily bio-based alkyd emulsion, which contains long alkyd chains and 35% oil content in water, with a solids content of 50% and a bio-based content of >95%. The D samples were prepared using alkyd dispersion binder, composed of 42% solid content in water, exhibits an ionic nature, and a bio-based fraction of >43%. Finally, the R samples were produced using only water, serving as the control group. The thermal conductivity data reported in the study [12], which refers to the samples under environmental conditions. In this study, the experimental data was supplemented by additional measurements conducted in dry conditions. All data were then subjected to statistical analysis for both ambient and dry conditions, enabling a comprehensive comparison of the effects of different pre-treatments.
Statistical analysis of the data was conducted using the ANOVA method. ANOVA is a method of statistics used to compare several datasets’ mean values, functioning like a t-test extension, which is restricted to comparing only two groups.
ANOVA aims to determine whether significant differences exist among the means of several groups by examining the variability both within and between the groups. The core hypothesis in ANOVA involves comparing two distinct estimates of population variance to assess whether the observed differences in group means are statistically significant [65]. The detailed methodology for the ANOVA analysis is presented in Appendix A.
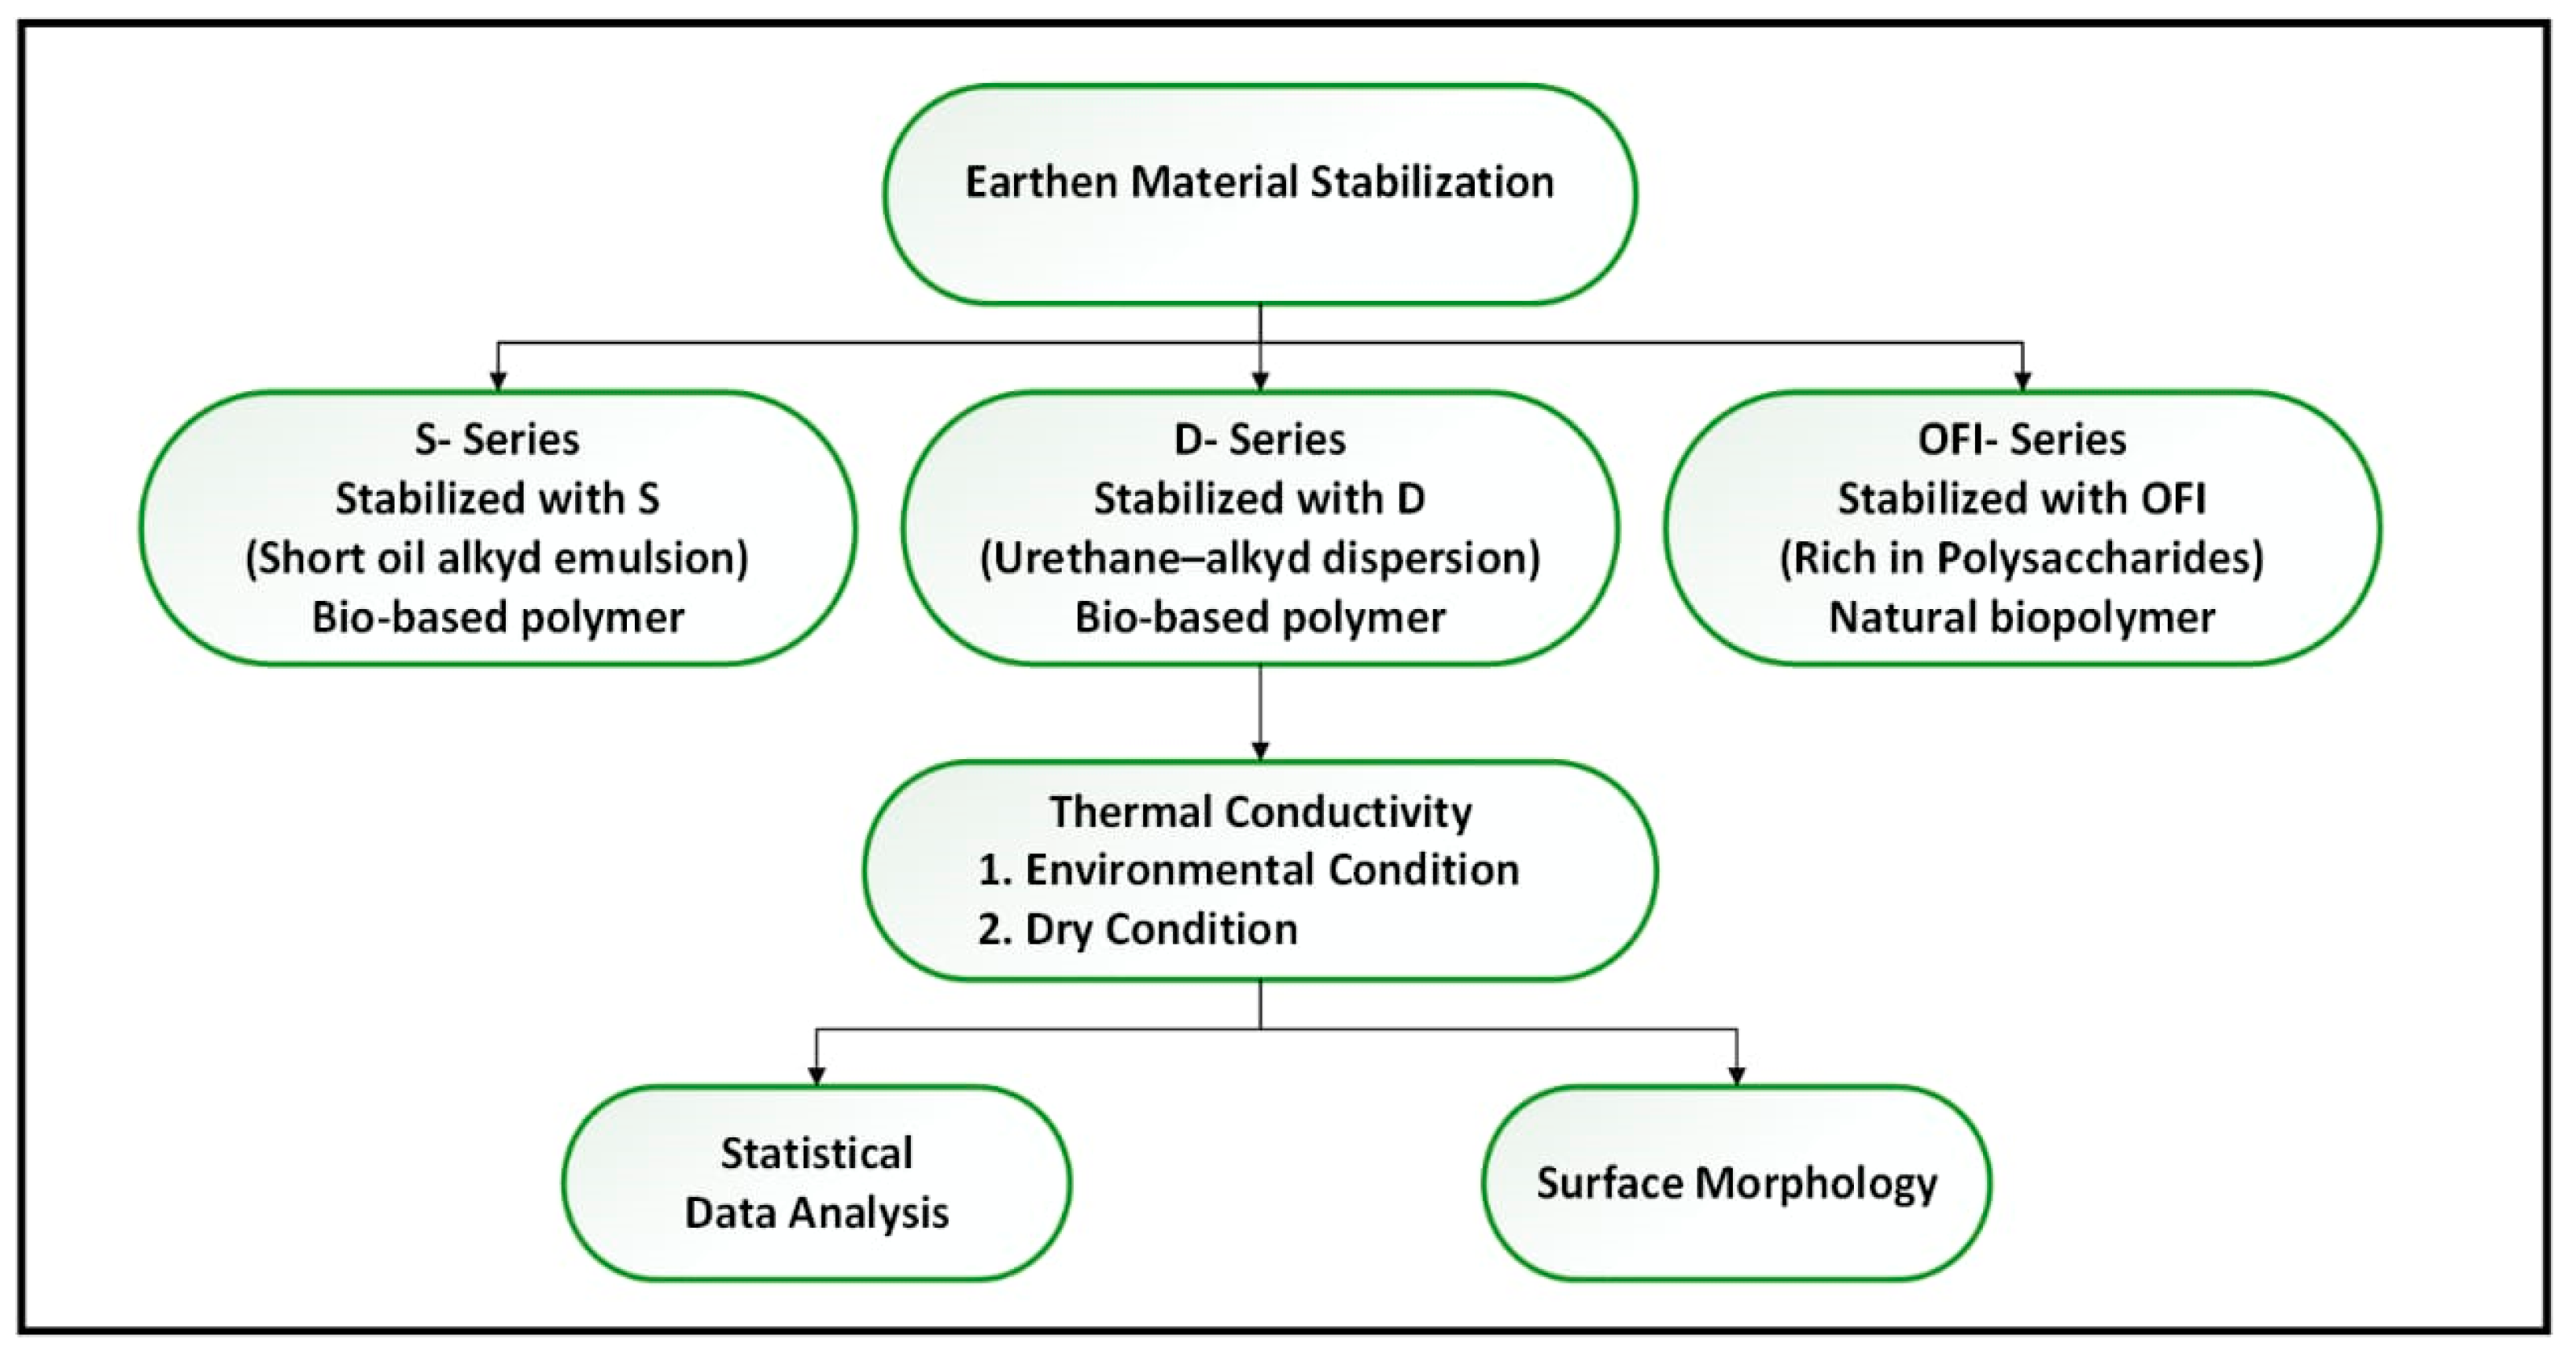
Finally, the microstructural characterization of earthen plaster modified with bio-based polymers was performed using a Phenom XL Scanning Electron Microscope (Thermo Fisher Scientific, Waltham, MA, USA) to analyze the morphology of composite particles. The analysis was conducted with an electron beam accelerating voltage of 15 kV, employing backscattered electron (BSE) imaging mode. To improve conductivity, the samples being observed were sputter-coated with gold prior to examination. Figure 2 illustrates the stabilization and analysis process of earthen materials series (S, D, OFI), followed by thermal conductivity testing, statistical data analysis, and SEM for surface morphology.

3. Results and Discussion

The results in Table 1 provide a detailed comparison of the thermal conductivity Kav of various samples under environmental and dry conditions, emphasizing the influence of moisture content on thermal conductivity. The findings indicate that thermal conductivity is consistently higher in environmental conditions due to the presence of moisture, which enhances heat transfer since water has a higher thermal conductivity than air or dry materials.
Porosity values range from 33.4% ± 1.1% to 43.1% ± 1.0%, with the lowest observed in sample D-30 and the highest in R-40. Across all bio-based polymer types, an increase in polymer concentration from 30% to 40% is generally associated with a rise in porosity (the data have been presented in a previous study [12]).
For all samples, thermal conductivity decreases when transitioning from environmental conditions to dry conditions: R-30: Kav decreases from 0.267 W/m·K (environmental) to 0.252 W/m·K (dry), indicating a reduction of 5.6%. R-40: Kav decreases from 0.239 W/m·K (environmental) to 0.225 W/m·K (dry), reflecting a 5.9% drop. S-30 exhibits the highest thermal conductivity among all samples, decreasing from 0.451 W/m·K (environmental) to 0.418 W/m·K (dry), a reduction of 7.3%. S-40: Kav decreases from 0.266 W/m·K (environmental) to 0.260 W/m·K (dry), showing a smaller reduction of 2.3%. D-30: Kav decreases from 0.347 W/m·K (environmental) to 0.327 W/m·K (dry), a 5.8% reduction. D-40: Kav drops from 0.322 W/m·K (environmental) to 0.302 W/m·K (dry), indicating a 6.2% decrease. OFI-30: Kav decreases from 0.271 W/m·K (environmental) to 0.259 W/m·K (dry), a 4.4% drop. OFI-40: Kav decreases from 0.365 W/m·K (environmental) to 0.353 W/m·K (dry), a 3.3% reduction. Thermal conductivity decreases when transitioning from environmental to dry conditions, with reductions ranging from 2.3% to 7.3% across samples. The S-series exhibits the highest Kav values, while the R-series shows the lowest, indicating that material composition and bonding with bio-based polymer significantly influences thermal behaviour. In comparison to that of other commonly used construction materials, such as lime (0.30–0.80 W/m·K) and cement (0.60–1.40 W/m·K), earthen materials do not require energy-intensive manufacturing processes, making them a more environmentally sustainable option [23,24,25,26,27].
Under ambient conditions, moisture inside the pores helps increase heat transfer by allowing conduction through the liquid phase, in addition to the solid and gas pathways. In dry conditions, heat mainly travels through the solid material and the air in the pores. Thus, the 7.3% higher thermal conductivity observed in ambient samples is partly due to the added heat conduction through the moisture in the pores.
The numerical analysis was performed using R 4.3.3 Ink statistics software to examine the difference in mean levels of thermal conductivity of different plaster samples with respect to mix designs, natural and bio-based polymers, and temperatures variation [70]. One-way ANOVA was applied, as it is a statistical method commonly employed to assess the influence of individual factors on experimental outcomes [71]. The influence of a factor was considered statistically significant at the threshold levels: “p ‘***’ 0.001 ‘**’ 0.01 ‘*’ 0.05 or 0” [72,73]. In this study, one-way ANOVA was used to analyze heat flow responses in plaster samples based on different mix designs and polymer types (natural or bio-based) under varying temperature conditions (10.0 °C, 20.0 °C, and 30.0 °C) and across two conditions: (1) environmental conditions and (2) dry conditions. The analysis was complemented with Tukey HSD post hoc tests at a 95% family-wise confidence level to evaluate pairwise differences in thermal conductivity. It should be noted, however, that the relatively small sample size (n = 9 per mix-design) may reduce the robustness and generalizability of the statistical conclusions. Specifically, with n < 30, the approximation to normality guaranteed by the central limit theorem is less reliable, and the estimation of within-group variance becomes more susceptible to random fluctuations [74]. As a result, confidence intervals obtained from Tukey HSD tests are wider, and the statistical power to detect true differences is lower. Nonetheless, assumptions of normality and homogeneity of variances were tested and not violated, supporting the validity of the parametric approach [75]. The results should be interpreted with caution, and future studies with larger samples are encouraged to validate the observed trends. Below, the experimental conclusions that can be drawn. The ANOVA one-way study findings effect if all parameters were statistically impacted by natural and bio-based polymers which are given in Table 2 for environmental condition and Table 3 for dry condition.
The ANOVA study is used here to determine whether the mean thermal conductivity values of different mix designs (with natural and bio-based polymers) differ significantly under two conditions:
The null hypothesis (H0) states that there is no significant difference in the mean thermal conductivity values between the different mix designs of natural and bio-based polymer samples. The alternative hypothesis (H1) states that at least one mix design has a significantly different mean thermal conductivity value compared to others. The high F-values (73.83 and 82.25) indicate that the differences in thermal conductivity among the mix designs are statistically significant. The small p-value (~0), well below the 0.05 threshold, confirms the rejection of the null hypothesis, demonstrating that at least one mix design significantly influences the thermal conductivity under both environmental and dry conditions. Since the p-values in both tables are essentially zero (p < 0.05) and the F-values are large, we reject the null hypothesis. This means the following:
H0. 
There is no statistically significant difference in the thermal conductivity values among the different mix designs of natural and bio-based polymer samples.
H1. 
There is a statistically significant difference in the thermal conductivity values among the different mix designs of natural and bio-based polymer samples. The mix design significantly influences the thermal conductivity in both environmental and dry conditions.
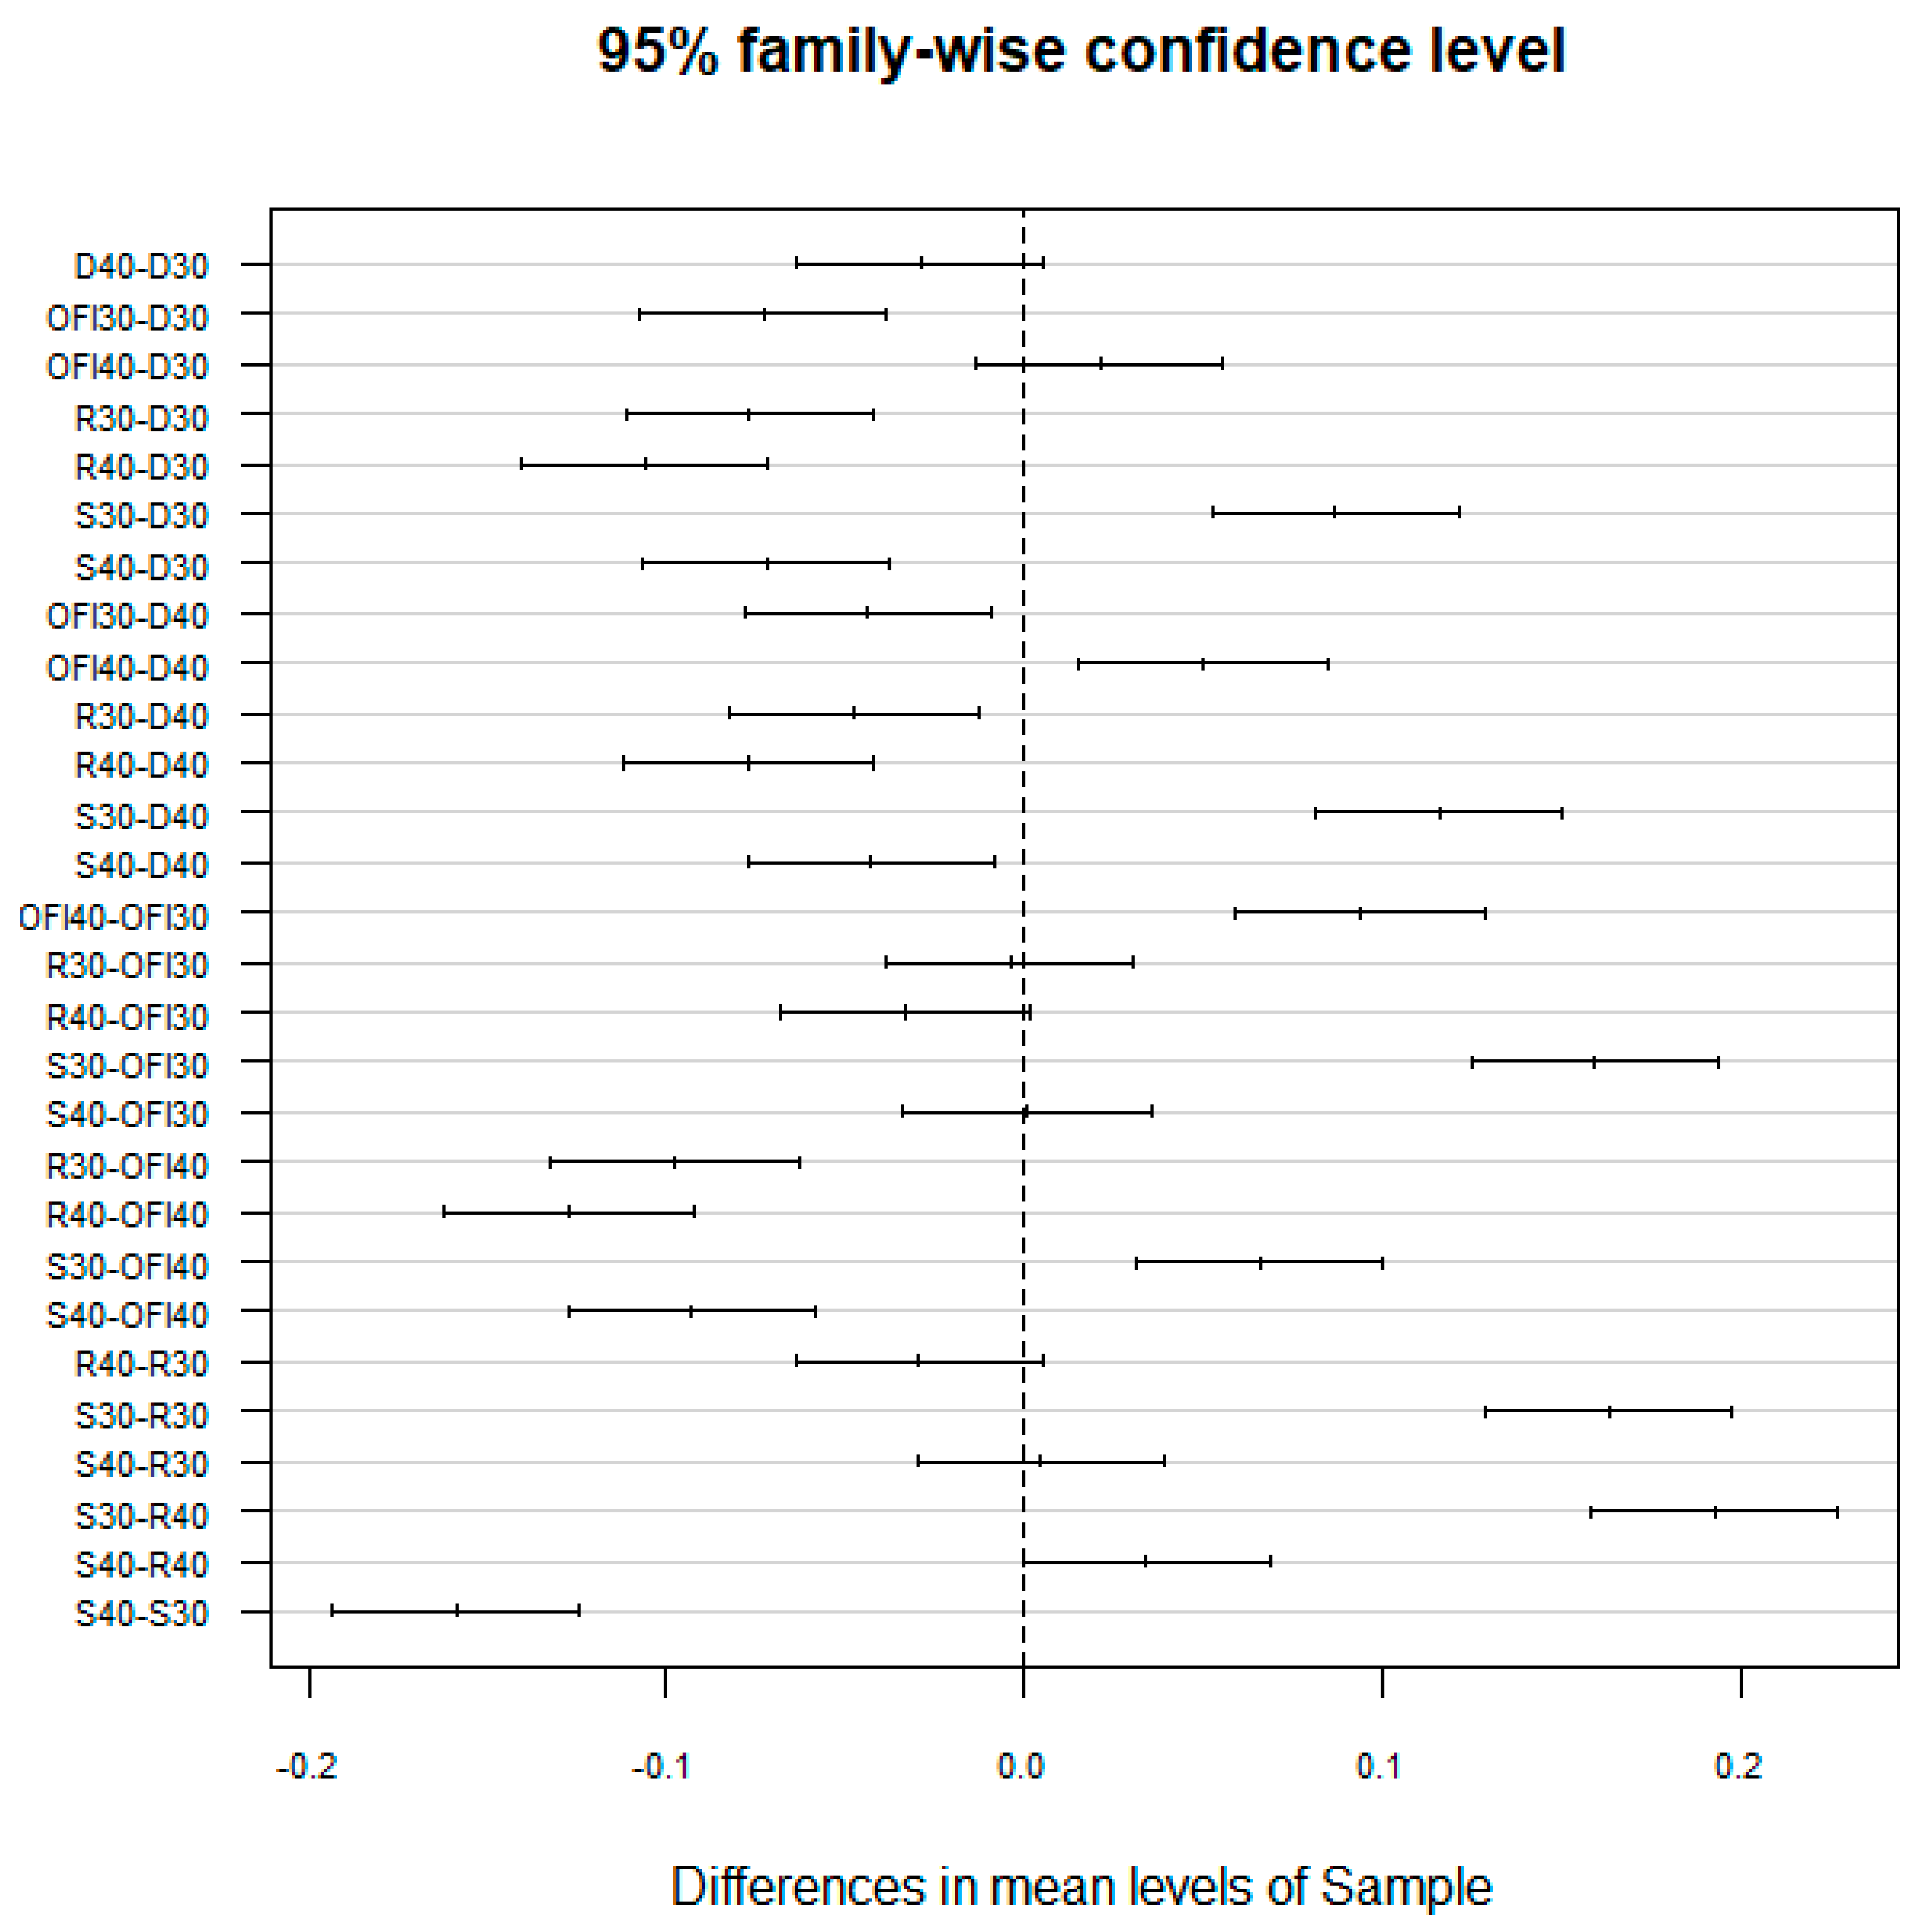
To identify the statistically significant pairs of means among different mix design samples, the Tukey test was performed [76]. This test assists in identifying the precise mean pairings that differ from one another in a significant manner. The test signifies a statistically significant variation in the mixture’s mean characteristics at each replacement level, with 95.0% confidence presented in Figure 3 and Figure 4.
Significant behavioural variations were observed when comparing thermal conductivity analyses of mixes with different incorporation percentages of natural and bio-based polymers. Figure 3 presents all possible significant pairs of means. Post hoc Tukey tests showed that sample S-30 exhibited significantly higher thermal conductivity compared to D-30 (p < 0.001), D-40 (p < 0.001), S-40 (p < 0.001), OFI-30 (p < 0.001), and OFI-40 (p < 0.001). Statistical analysis revealed pronounced differences across several sample comparisons, reflecting substantial variability within the dataset. Significant divergence was observed in the pairs OFI-30–D-30, S-30–D-30, and S-40–D-30, indicating clear distinctions in group behaviour. Similarly, the comparisons R-40–D-30 and OFI-30–D-40 exhibited notable disparities, further affirming intergroup heterogeneity. These findings were reinforced by additional contrasts, such as S-30–OFI-30 and R-40–D-40, underscoring the distinct compositional and performance characteristics among the sample.
The D alkyd dispersion binder, composed of 42% solid content in water, exhibits an ionic nature that enables stronger bonding with clay and sand, enhancing its overall binding efficiency and polymerization. D-40 and S-40 mix design exhibit improved thermal conductivity due to the interaction of biopolymers with significant amounts of water, which results in the formation of extensive polymer networks that effectively bind soil particles. These polymer networks are more developed and efficient in S-40 compared to D-40, leading to enhanced thermal performance. In contrast, the highest value of thermal conductivity of S-30 sample is attributed to the composition of the S oily bio-based alkyd emulsion, which contains long alkyd chains and 35% oil content. The high oil fraction reduces the interaction between oil and the mineral components, such as clay and sand, thereby limiting interfacial bonding. This weakened adhesion likely facilitates heat transfer, resulting in increased thermal conductivity.
Opuntia mucilage, a complex carbohydrate, is ecofriendly and energy-saving and contributes excellent water-binding and ionic properties due to its polysaccharide structure, which contains multiple functional groups such as carboxyl (–COOH), hydroxyl (–OH), and O-acetyl groups. These functional groups provide multiple bonding sites, facilitating stronger interactions with the clay and sand mixture. The significant difference in thermal performance between D-30 and OFI-30 is a result of the stronger bonding capacity provided by these binders, whereas D-30 and D-40 exhibit no significant difference, demonstrating similar thermal behaviour due to their homogeneous binding composition. The reference samples, R-30 (p < 0.001) and R-40 (p < 0.001), which were prepared using water only, showed lower thermal conductivity compared to S-30. This difference is likely due to stronger hydrogen bonding (water molecules adhere to the surface and between the layers of clay) and development of a more densely packed and cohesive structure due to filling of void spaces by fine clay particles in R-30 and R-40, which allows for reduced heat transfer relative to S-30.
S-40 showed the lowest thermal conductivity among all tested biopolymer compositions, making it less effective at heat transfer but ideal for insulation. ANOVA confirmed these differences as statistically significant, supporting S-40’s suitability for enhancing indoor thermal comfort.
Figure 4 represents all possible significant pairs of means of thermal conductivity analyses of mixes with different incorporation percentages of natural and bio-based polymers in dry conditions. The thermal performance of the S-30 sample in dry conditions was improved as compared to environmental condition sample. The D alkyd dispersion binder forms stronger hydrogen bonds with earthen material. As a result, the oven-dried D-30, D-40, OFI-30, OFI-40, R-30, and R-40 samples exhibit improved thermal performance compared to the environmentally conditioned samples. The ionic nature of the binder ensures strong and stable bonds even when dried in the oven, maintaining the material’s structural integrity while reducing moisture retention. In contrast, in environmental conditions, residual moisture within the OFI-mucilage samples contribute to higher thermal conductivity.
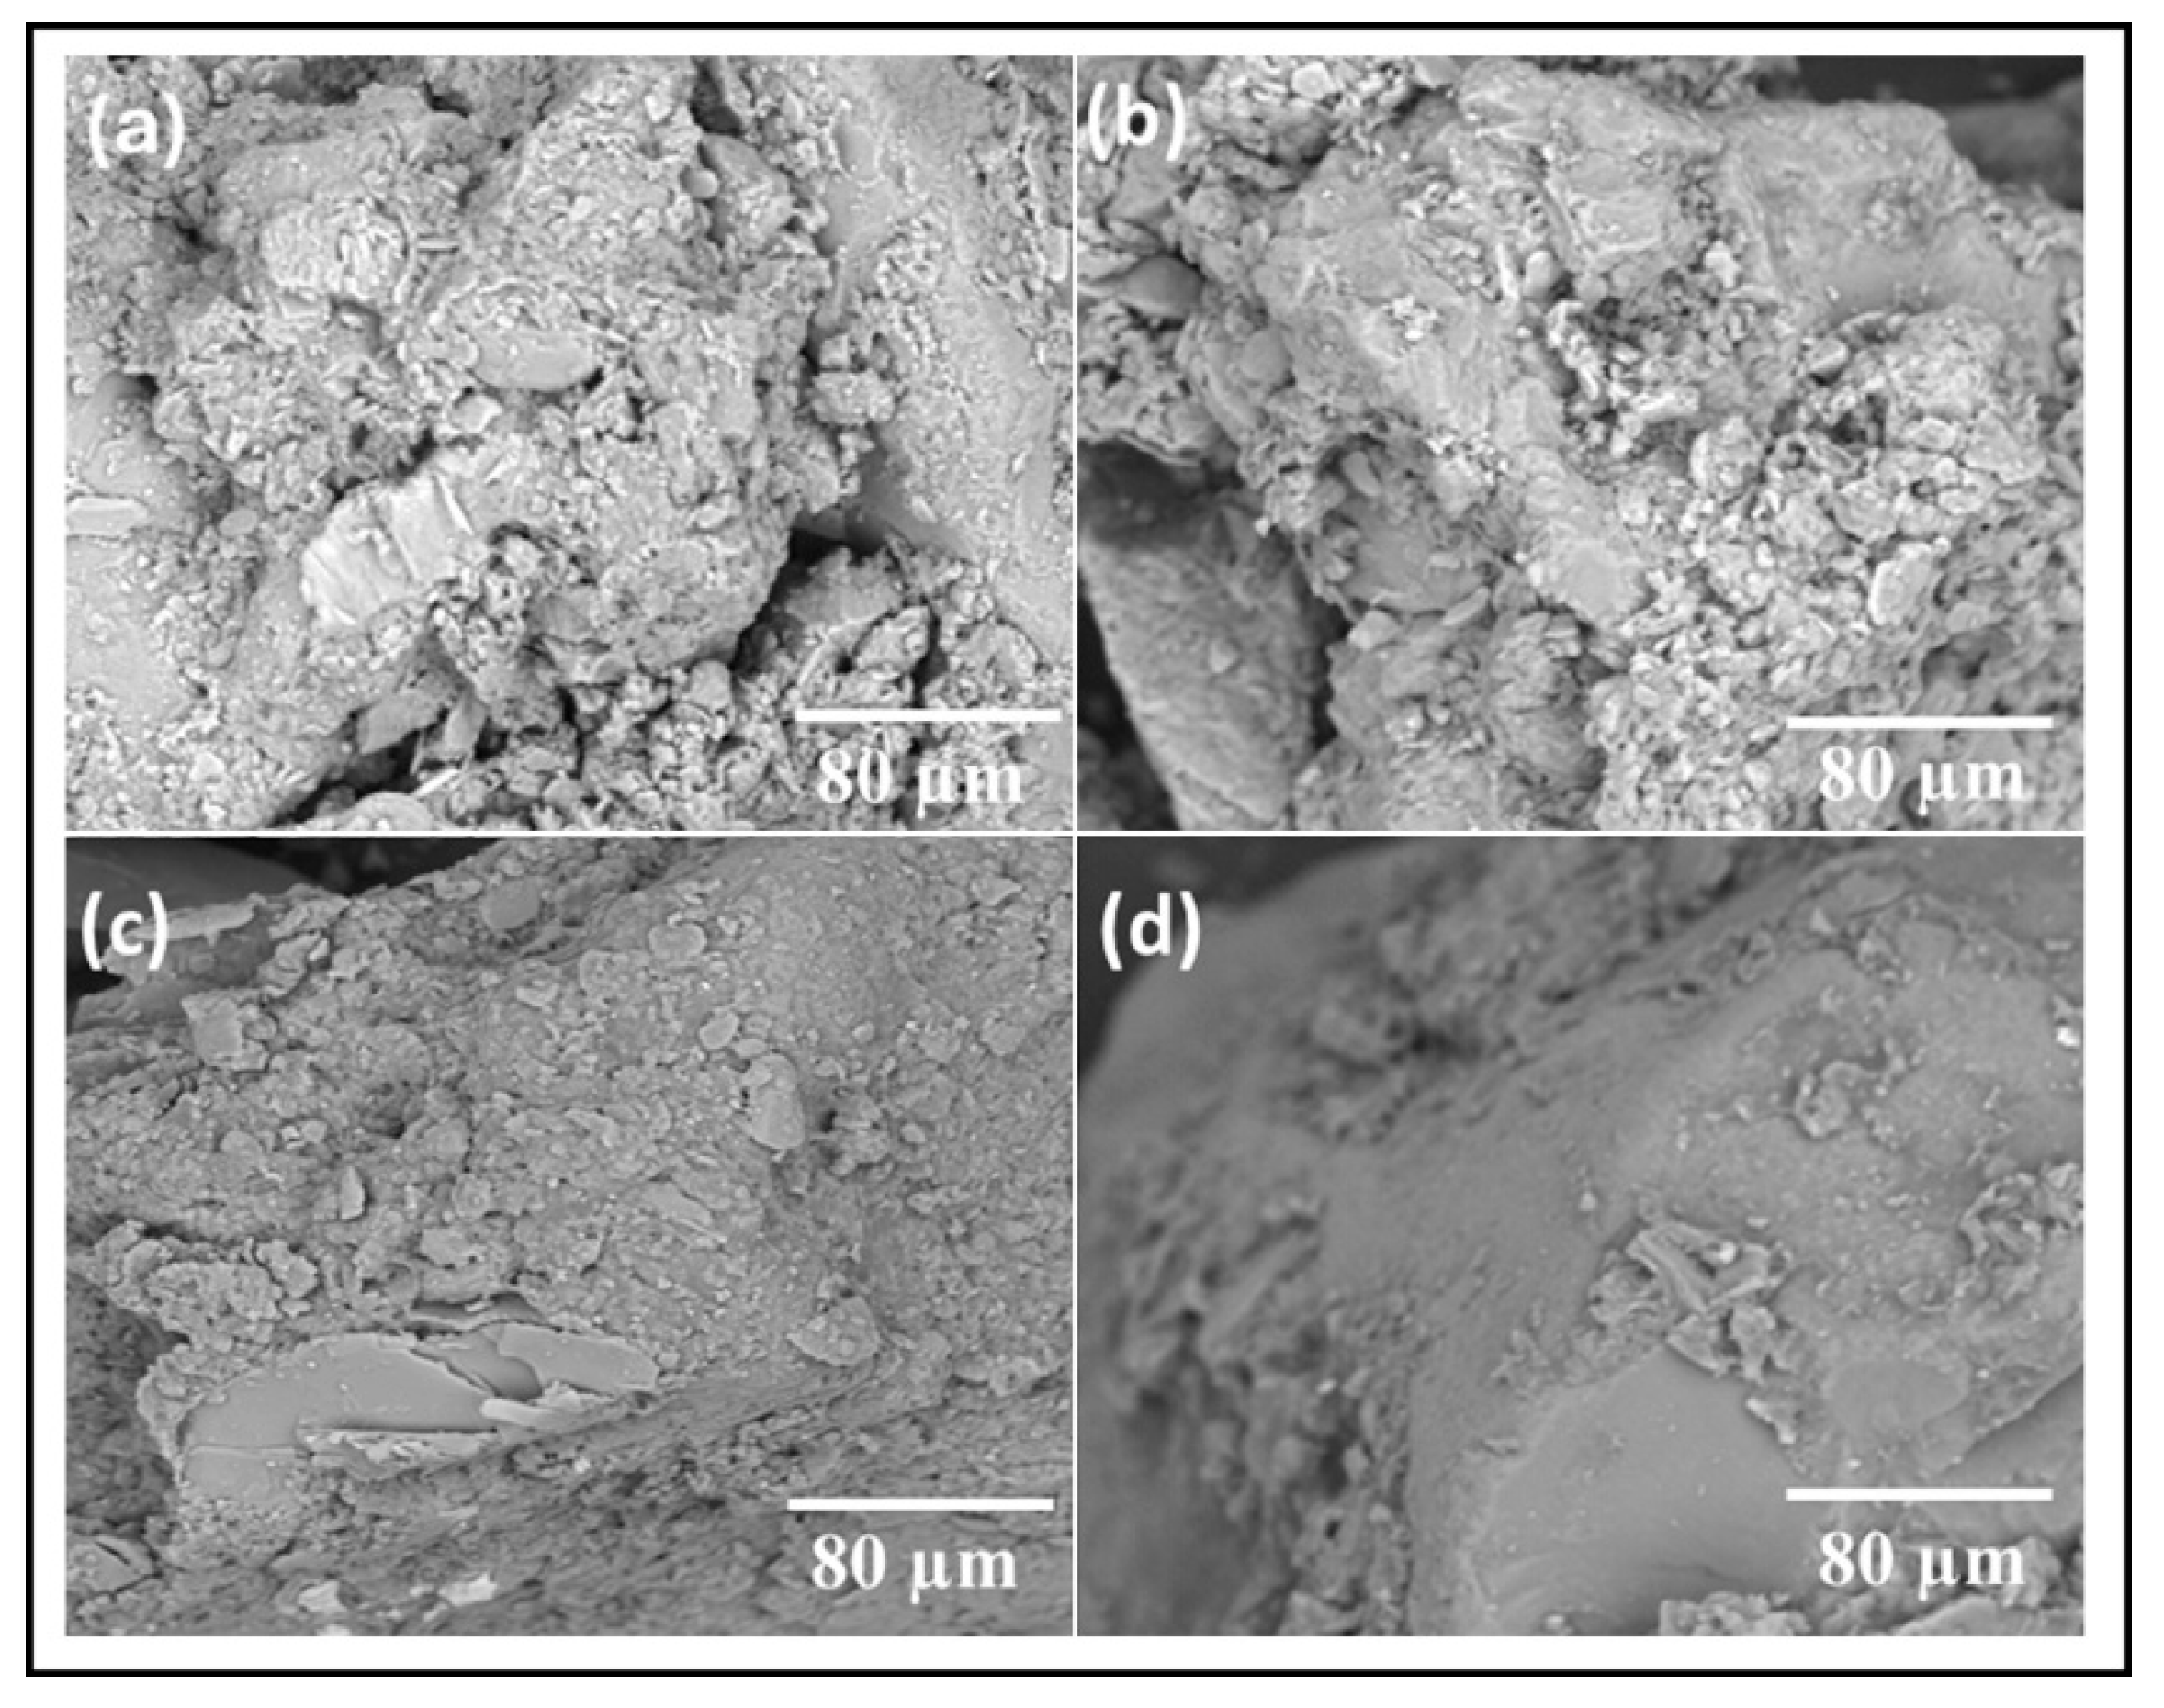
The surface morphology of the R-30 and R-40 reference samples, along with the natural biopolymer-based samples (S-30, S-40, D-30, D-40, OFI-30, and OFI-40), was analyzed using scanning electron microscopy (SEM), as shown in Figure 5 and Figure 6. Figure 5a,b represent reference samples R-30 and R-40 prepared with 30% and 40% water content, respectively. Both figures show no visible voids, which can be attributed to the strong electrostatic attraction between particles and the overall structural stability of the samples. Figure 5c shows the surface of the OFI-30 sample with minor surface cracks, likely caused by a reduced concentration of OFI mucilage. The lower mucilage content may result in less predictable swelling behaviour, leading to cracking and instability in the soil. In contrast, Figure 5d depicts the OFI-40 sample, which has high concentration of OFI mucilage significantly enhances the structural integrity due to its extensive biopolymeric network. This network forms a denser matrix and reducing void spaces. However, the hydrophilic nature of OFI and higher organic content (mainly polysaccharides and pectins) and gel-like consistency contribute to greater moisture retention which in turn diminish thermal insulation properties by facilitating more heat transfer. R-30 and R-40 display moderate porosity [12] and maintain consistent structural integrity, indicating balanced thermal conductivity.
Figure 6a reveals that the S-30 sample exhibits voids and gaps, attributed to the presence of oil content (35%) in the S binder, which weakens its interaction with the bio-based polymer. In contrast, Figure 6b shows fewer and smaller voids in the S-40 sample, likely due to the addition of 10% more water, which improves bonding within the earthen material. The sample S-40 have high porosity [12], less thermal conductivity and better surface as compared to S-30. Figure 6c demonstrate strong interfacial adhesion between the base soil and the bio-based polymer in the D-30 sample, attributed to the pure ionic nature of D, which enhances bonding strength. Figure 6d shows further improvement in surface adhesion in the D-40 sample, likely due to the addition of an ionic solvent (10% water), which promotes stronger bonding interactions as compared to D-30. Similarly to S-series, D-40 have high porosity [12], less thermal conductivity, and better surface as compared to D-30.
The SEM images demonstrate that bio-based polymer composite samples, derived from various renewable resources, exhibit surface morphologies that are dependent on the specific components used. In general, biopolymer composites with purely ionic characteristics show strong interfacial adhesion and minimal voids or cracks and optimum temperature. This structural integrity suggests that such composites are likely to possess favourable thermal properties.

4. Conclusions

This study examines the thermal behaviour of earth-based materials stabilized with the natural biopolymer OFI, specifically in the mix designs OFI-30 and OFI-40, which incorporate 30% and 40% OFI mucilage, respectively. The thermal performance of eight different mix designs-R-30 (30% water content), R-40 (40% water content), S-30 (5% S with 25% water), S-40 (5% S with 35% water), D-30 (20% D with 10% water), D-40 (20% D with 20% water), OFI-30, and OFI-40 was evaluated under both environmental and dry conditions (after drying at 105 °C for 24 h). Statistical evaluation was performed using ANOVA and Tukey’s test (α = 0.05) to assess differences in thermal conductivity among the mix designs. The following is a summary of the most valuable results from the present research:
Thermal conductivity decreases when transitioning from environmental to dry conditions, with reductions ranging from 2.3% to 7.3% across samples. The S-series exhibits the highest Kav values, while the R-series shows the lowest, indicating that material composition and bonding with bio-based polymer significantly influences thermal behaviour. The binder composition is directly linked to the binding strength and thermal performance within earthen material. S-30 showed higher thermal conductivity due to its 35% oil content, reducing electrostatic interactions between earthen material particles. In contrast, S-40, with 10% more water, exhibited improved thermal performance through a stronger polymer network that enhanced soil binding and stabilization. Similarly, in the R, D, and OFI series, R-40 and D-40 (purely ionic) demonstrated improved thermal properties by forming hydrogen bonds with the structure’s hydroxyl (OH) groups, aided by the additional 10% water content compared to R-30 and D-30. In OFI-30, the presence of carboxyl and acetyl groups further contributed to stabilizing the soil particles within the polymer network. The SEM analysis of the mix designs demonstrates that stable bonding mechanisms effectively mitigate voids and cracking, whereas weak electrostatic interactions facilitate crack formation. All mix designs exhibited stable bonding, even after oven drying, thereby preserving the structural integrity of the material. This process not only reduced moisture retention but also enhanced thermal performance when compared to the environmental samples. ANOVA analysis confirms significant differences in thermal conductivity among mix designs, rejecting the null hypothesis. The Tukey test further identifies specific mix designs with notable variations, highlighting the impact of material composition on thermal performance.
The results of this study provide a basis for the development of sustainable earthen materials stabilized with natural and bio-based polymers, with a particular focus on the use of Opuntia Ficus-Indica mucilage. Earthen materials stabilized with OFI have shown encouraging thermal behaviour, particularly under dry conditions, offering a balanced compromise between thermal performance, ease of processing, and environmental sustainability.
While the current number of samples (nine samples per mix design) enabled an effective preliminary statistical evaluation, future studies will benefit from larger datasets to increase the robustness and generalizability of the statistical analysis, particularly in relation to performance variability under real-world conditions. Future research will aim to assess the long-term durability of these materials under variable environmental conditions, and to explore the effects of ageing on thermal and mechanical properties. In parallel, life cycle assessment, techno and economic analyses, and logistical studies will be essential to evaluate the scalability of OFI-based stabilization systems. Due to its widespread availability, minimal cultivation requirements, and renewable natural origin, OFI emerges as a viable and sustainable candidate for integration into low-impact construction systems.

Author Contributions

Conceptualization, G.P., L.P., R.S. and M.C.; methodology, G.P., M.C. and R.S.; validation, G.P., L.P., R.S. and M.C.; formal analysis, G.P., L.P., R.R., Ł.K., T.K., R.S. and M.C.; investigation, R.S., R.R. and T.K.; resources, G.P. and L.P.; data curation, R.S., G.P. and M.C.; writing—original draft preparation, R.S.; writing—review and editing, G.P., L.P. and M.C.; visualization, Ł.K., R.R. and T.K.; supervision, G.P. and L.P.; project administration, G.P. and L.P.; funding acquisition, G.P. and L.P. All authors have read and agreed to the published version of the manuscript.

Funding

This research was funded by GreenPlaster4Earth. FSE/REACT-EU, MUR, PON.

Data Availability Statement

The original contributions presented in the study are included in the article, further inquiries can be directed to the corresponding author.

Acknowledgments

The authors gratefully acknowledge the Università degli Studi di Cagliari. R.S. performed his activity in the framework of the International Ph.D. in Innovation Sciences and Technologies at the University of Cagliari.

Conflicts of Interest

The authors declare no conflicts of interest.

Appendix A

When performing an analysis of variance process, it is necessary to make the statements that follow:
  • The findings are not correlated.
  • The findings within each category are derived from a normal distribution.
  • Population variations within each category are equal.
  • ANOVA is a widely used advanced analytical technique in both academic research and financial studies, frequently cited for its ability to assess differences across multiple groups or categories.
This approach is highly advantageous in generating essential data, particularly in interpreting experimental findings and understanding how specific variables influence various processing factors.
The renowned statistician Sir Ronald A. Fisher (1890) developed the foundational concepts of Analysis of Variance (ANOVA) in his 1925 publication, Statistical Methods for Research Workers [77]. Most earlier studies in this domain focused primarily on agricultural trials [65].

ANOVA Methodology

The one-way ANOVA represents the most basic setup. ANOVA is performed when datasets are divided into classes based on a single factor.
Suppose that a sample of data with values x 11 , x 12 , x 13 , , x 1 n 1 are drawn from first population. The data samples values from second population are x 21 , x 22 , x 23 , , x 2 n 2 and the data samples values from kth population are x k 1 , x k 2 , x k 3 , , x k n k . Statistics collected from the ith and jth subgroup are indicated by the notation xij. The individual standard random variable values are Xi,j, I = 1, 2, …, k and j = 1, 2, …, n, where σ (constant standard deviation) and µi (mean), with a relation Xi,j ~ N(σ, µi). In contrast, for all Xi,j = µi + Ԑij where Ԑij ~ N(0, σ) which represents the random error separately distributed. Suppose N = n1 + n2 + n3 + …+ nk is sum of findings, from ith class the value is ni. The model variables are sigma (standard deviation) and mean population µ1, µ2, µ3, …, µk. Let ni correspond to the model size for the ith group in N = n1 + n2 +…+ nk denote cumulative unit of observations across all units (overall population value). The model’s variables include the means population µ1, µ2, µ3, …, µk and standard deviations σ.
It is not an effective approach to evaluate several sets of by applying multiple independent two-sample t-tests because confidence level or p-value is not provided for the entire combined set of observations.
Evaluating the null hypothesis shall be very important to us:
H 0 = μ 1 = μ 2 = μ 3 = μ 4 = μ 5 = μ k
contrast to alternate hypothesis.
  H 1 : 1 , l k : μ i μ k
The means of a minimum a single set are not identical.
Here x ¯ stand for the mean of sampling i (where i ranges from 1 to k).
  x ¯ i = 1 n i j = 1 n i x i j
The grand mean, which is the mean across all data stages, is represented by x ¯ .
x ¯ = 1 N l = 1 k j = 1 n i x i j
s i 2 signifies the variance in data samples.
s i 2 = 1 n i 1 j = 1 n i x i j x ¯ i 2
In this context, S2 = MSE represents an approximate of the variance σ2, which is assumed to be joint across all k groups.
s 2 = 1 N k i = 1 k n i 1 2 . s i 2
The main principle behind an ANOVA aims to analyze with help of variance analysis the differences amongst samples and the variability within groups,
S S T = l = 1 k j = 1 n i x i j x ¯ 2
S S E = i = 1 k j = 1 n i x i j ¨ x ¯ i 2 = i = 1 k n i 1 2 . s i 2
S S C = i = 1 k j = 1 n i x ¯ i x ¯ 2 = i = i 1 n i . x ¯ i x ¯ 2
Think about the subsequent representation of the deviation between a statistic to the entire mean.
χ i j x ¯ = x i j x ¯ i + x ¯ i x ¯
It is evident that of SST is on the left, while the corresponding components of SSE are on the right with SSC. The development proceeds as follows:
S S T = S S E + S S C
M S T = S S T d f S S T = S S T N 1
M S E = S S E d f S S E = S S E N K
M S C = S S C d f S S C = S S C K 1
Considering that the examination parameters are meet, ANOVA employs subsequent assessment statistics.
F = M S C M S E
In H0 for k − 1 as well as Nk degrees of freedom, this statistic is distributed according to Fisher’s F-distribution. Provided that the test conditions are meet:
F > F 1 α , k 1 , N k
H0, the null hypothesis, is rejected at the significance level of α. If this condition is met, (1 − α) quantile F-distribution including k − 1 plus Nk are freedom degrees in F 1 α ,   k 1 , N k [68,75].
A table displaying the outcome of calculations resulting in the F-statistic is illustrates in Table A1 the basic structure of a table used for ANOVA.
Table A1. Fundamental ANOVA table with one way analysis.
Origin of VarianceSum of Squares (SS)Freedom Degrees (Df)Mean Square (MS)F-StatisticsAbove F Tail Area
Between groupsSSCK-1MSCMSC/MSEp-Value
Within groupsSSEN-kMSE
TotalSSTN-1
In software for statistical computation, a value for p is commonly located in the corresponding section. The possibility that the null hypothesis will be rejected in the case that is true indicated by the p-values. When p < α, H0 is rejected with a confidence level exceeding (1 − α), where α represents the chosen significance threshold.
The Tukey test is a post hoc analysis depends on the studentized ranging distribution. It is referred to as Tukey test (HSD). Although ANOVA can show if the overall results are significant, it cannot identify the specific differences between groups. Once an ANOVA has been performed and significant findings have been obtained, Tukey test may perform to see which particular groups have different means when compared to one another. Every potential pair of mean is compared in this examination.
The procedure is divided into several steps.
Step 1. Run an ANOVA analysis, Post hoc testing is possible if the F value become significant.
Step 2. Select two means based on the results generated by the ANOVA. Note the contents of the following information:
  • Means,
  • Degrees of freedom (df) Within.
  • Mean Square (MS) Within,
  • Number per treatment/group
Step 3. Identify the key number from the Q matrix. The total amount of group sets or procedures (treatments) as well as degrees of freedoms with error term, K are required for this procedure
Step 4. Use the formula to figure out HSD statistics for Tukey test.
T = q M S E n
Step 5. In Step 4, compare the summarized results with the number calculated in Step 3. The value determined in the third step shows a substantial difference across the two means when it exceeds the threshold of significance derived from the Q matrix [78].

References

  1. Bui, Q.-B.; Morel, J.-C.; Hans, S.; Walker, P. Effect of Moisture Content on the Mechanical Characteristics of Rammed Earth. Constr. Build. Mater. 2014, 54, 163–169. [Google Scholar] [CrossRef]
  2. Ilman, B.; Balkis, A.P. Sustainable Biopolymer Stabilized Earthen: Utilization of Chitosan Biopolymer on Mechanical, Durability, and Microstructural Properties. J. Build. Eng. 2023, 76, 107220. [Google Scholar] [CrossRef]
  3. Gallipoli, D.; Bruno, A.W.; Perlot, C.; Mendes, J. A Geotechnical Perspective of Raw Earth Building. Acta Geotech. 2017, 12, 463–478. [Google Scholar] [CrossRef]
  4. Fitzmaurice, R. Manual on Stabilized Soil Construction for Housing; United Nations, Technical Assistance Programme: New York, NY, USA, 1958. [Google Scholar]
  5. Lax, C. Life Cycle Assessment of Rammed Earth; Univeristy of Bath: Bath, UK, 2010. [Google Scholar]
  6. Gong, N.; Zhu, M.; Zhang, Y.; Su, P.; Zhong, M.; Mu, C. The Content Optimization of Supplementary Cementitious Materials in Coral Sand-Seawater Cement Mortar: A Focus on Mechanical Properties and Transportation Costs. Constr. Build. Mater. 2024, 432, 136022. [Google Scholar] [CrossRef]
  7. Marmier, A. Decarbonisation Options for the Cement Industry; IGEM: Derby, UK, 2023. [Google Scholar]
  8. Jittin, V.; Bahurudeen, A. Production of Cleaner Binders by Reusing Agricultural By-Products: An Approach towards Zero Cement Concrete for Sustainable Future Infrastructure. J. Clean. Prod. 2024, 451, 141990. [Google Scholar] [CrossRef]
  9. Wojtacha-Rychter, K.; Kucharski, P.; Smolinski, A. Conventional and Alternative Sources of Thermal Energy in the Production of Cement—An Impact on CO2 Emission. Energies 2021, 14, 1539. [Google Scholar] [CrossRef]
  10. Mokhtar, A.; Nasooti, M. A Decision Support Tool for Cement Industry to Select Energy Efficiency Measures. Energy Strategy Rev. 2020, 28, 100458. [Google Scholar] [CrossRef]
  11. Habert, G. Assessing the Environmental Impact of Conventional and ‘Green’ Cement Production. In Eco-Efficient Construction and Building Materials; Elsevier: Amsterdam, Netherlands, 2014; pp. 199–238. [Google Scholar]
  12. Cappai, M.; Shoukat, R.; Pilia, L.; Ricciu, R.; Lai, D.; Marongiu, G.; Pia, G. Thermal Properties of Eco-Friendly Earthen Materials Stabilized with Bio-Based Polymers: Experimental Data and Modeling Procedure for Improving Mix-Design. Materials 2024, 17, 1035. [Google Scholar] [CrossRef]
  13. Association, C.T.E.C. Cementing the European Green Deal, Reaching Climate Neutrality along the Cement and Concrete Value Chain by 2050; The European Cement Association: Brussels, Belgium, 2020. [Google Scholar]
  14. Jwaida, Z.; Dulaimi, A.; Mashaan, N.; Mydin, M.A.O. Geopolymers: The Green Alternative to Traditional Materials for Engineering Applications. Infrastructures 2023, 8, 98. [Google Scholar] [CrossRef]
  15. Coppola, L.; Bellezze, T.; Belli, A.; Bignozzi, M.C.; Bolzoni, F.; Brenna, A.; Cabrini, M.; Candamano, S.; Cappai, M.; Caputo, D.; et al. Binders Alternative to Portland Cement and Waste Management for Sustainable Construction—Part 1. J. Appl. Biomater. Funct. Mater. 2018, 16, 186–202. [Google Scholar] [CrossRef]
  16. Madirisha, M.M.; Dada, O.R.; Ikotun, B.D. Chemical Fundamentals of Geopolymers in Sustainable Construction. Mater. Today Sustain. 2024, 27, 100842. [Google Scholar] [CrossRef]
  17. Coppola, L.; Bellezze, T.; Belli, A.; Bignozzi, M.C.; Bolzoni, F.; Brenna, A.; Cabrini, M.; Candamano, S.; Cappai, M.; Caputo, D.; et al. Binders Alternative to Portland Cement and Waste Management for Sustainable Construction—Part 2. J. Appl. Biomater. Funct. Mater. 2018, 16, 207–221. [Google Scholar] [CrossRef] [PubMed]
  18. Bumanis, G.; Vitola, L.; Pundiene, I.; Sinka, M.; Bajare, D. Gypsum, Geopolymers, and Starch—Alternative Binders for Bio-Based Building Materials: A Review and Life-Cycle Assessment. Sustainability 2020, 12, 5666. [Google Scholar] [CrossRef]
  19. Ben-Alon, L.; Loftness, V.; Harries, K.A.; Cochran Hameen, E. Life Cycle Assessment (LCA) of Natural vs Conventional Building Assemblies. Renew. Sustain. Energy Rev. 2021, 144, 110951. [Google Scholar] [CrossRef]
  20. Cabeza, L.F.; Barreneche, C.; Miró, L.; Morera, J.M.; Bartolí, E.; Inés Fernández, A. Low Carbon and Low Embodied Energy Materials in Buildings: A Review. Renew. Sustain. Energy Rev. 2013, 23, 536–542. [Google Scholar] [CrossRef]
  21. Alcorn, A. Embodied Energy and CO Coefficients for NZ Building Materials; The Centre for Building Performance Research: Wellington, New Zealand, 2003. [Google Scholar]
  22. Asdrubali, F.; Grazieschi, G.; Roncone, M.; Thiebat, F.; Carbonaro, C. Sustainability of Building Materials: Embodied Energy and Embodied Carbon of Masonry. Energies 2023, 16, 1846. [Google Scholar] [CrossRef]
  23. Röhlen, U.; Ziegert, C. Earth Building Practice: Planning-Design-Building; Beuth Verlag: Berlin, Deutschland, 2011; ISBN 3410217371. [Google Scholar]
  24. Petcu, C.; Dobrescu, C.F.; Dragomir, C.S.; Ciobanu, A.A.; Lăzărescu, A.V.; Hegyi, A. Thermophysical Characteristics of Clay for Efficient Rammed Earth Wall Construction. Materials 2023, 16, 6015. [Google Scholar] [CrossRef]
  25. Wolterbeek, T.K.T.; Hangx, S.J.T. The Thermal Properties of Set Portland Cements—A Literature Review in the Context of CO2 Injection Well Integrity. Int. J. Greenh. Gas Control. 2023, 126, 103909. [Google Scholar] [CrossRef]
  26. Al-Radhi, Y.; Roy, K.; Liang, H.; Ghosh, K.; Clifton, G.C.; Lim, J.B.P. Thermal Performance of Different Construction Materials Used in New Zealand Dwellings Comparatively to International Practice—A Systematic Literature Review. J. Build. Eng. 2023, 72, 106346. [Google Scholar] [CrossRef]
  27. Kubiś, M.; Pietrak, K.; Cieślikiewicz, Ł.; Furmański, P.; Wasik, M.; Seredyński, M.; Wiśniewski, T.S.; Łapka, P. On the Anisotropy of Thermal Conductivity in Ceramic Bricks. J. Build. Eng. 2020, 31, 101418. [Google Scholar] [CrossRef]
  28. Ben-Alon, L.; Loftness, V.; Harries, K.A.; Hameen, E.C. Integrating Earthen Building Materials and Methods into Mainstream Construction Using Environmental Performance Assessment and Building Policy. IOP Conf. Ser. Earth Environ. Sci. 2019, 323, 12139. [Google Scholar] [CrossRef]
  29. Costa-Carrapiço, I.; González, J.N.; Raslan, R.; Sánchez-Guevara, C.; Redondas Marrero, M.D. Understanding Thermal Comfort in Vernacular Dwellings in Alentejo, Portugal: A Mixed-Methods Adaptive Comfort Approach. Build. Environ. 2022, 217, 109084. [Google Scholar] [CrossRef]
  30. Ben-Alon, L.; Rempel, A.R. Thermal Comfort and Passive Survivability in Earthen Buildings. Build. Environ. 2023, 238, 110339. [Google Scholar] [CrossRef]
  31. Tushar, Q.; Zhang, G.; Bhuiyan, M.A.; Navaratnam, S.; Giustozzi, F.; Hou, L. Retrofit of Building Façade Using Precast Sandwich Panel: An Integrated Thermal and Environmental Assessment on BIM-Based LCA. Buildings 2022, 12, 2098. [Google Scholar] [CrossRef]
  32. Rempel, A.R.; Rempel, A.W. Intrinsic Evaporative Cooling by Hygroscopic Earth Materials. Geosciences 2016, 6, 38. [Google Scholar] [CrossRef]
  33. Cappai, M.; Delogu, F.; Pozzi-Escot, D.; Pacheco Neyra, G.; Meloni, P.; Pia, G. Degradation Phenomena of Templo Pintado Painted Plasters. Constr. Build. Mater. 2023, 392, 131839. [Google Scholar] [CrossRef]
  34. Cappai, M.; Casnedi, L.; Carcangiu, G.; Delogu, F.; Pozzi-Escot, D.; Pacheco Neyra, G.; Pia, G.; Meloni, P. Weathering of Earth-Painted Surfaces: Environmental Monitoring and Artificial Aging. Constr. Build. Mater. 2022, 344, 128193. [Google Scholar] [CrossRef]
  35. Jiang, M.; Jiang, B.; Lu, R.; Chun, L.; Xu, H.; Yi, G. Thermal and Humidity Performance Test of Rammed-Earth Dwellings in Northwest Sichuan during Summer and Winter. Materials 2023, 16, 6283. [Google Scholar] [CrossRef]
  36. Wiehle, P.; Simon, S.; Baier, J.; Dennin, L. Influence of Relative Humidity on the Strength and Stiffness of Unstabilised Earth Blocks and Earth Masonry Mortar. Constr. Build. Mater. 2022, 342, 128026. [Google Scholar] [CrossRef]
  37. Beckett, C.T.S.; Jaquin, P.A.; Morel, J.-C. Weathering the Storm: A Framework to Assess the Resistance of Earthen Structures to Water Damage. Constr. Build. Mater. 2020, 242, 118098. [Google Scholar] [CrossRef]
  38. Nakamatsu, J.; Kim, S.; Ayarza, J.; Ramírez, E.; Elgegren, M.; Aguilar, R. Eco-Friendly Modification of Earthen Construction with Carrageenan: Water Durability and Mechanical Assessment. Constr. Build. Mater. 2017, 139, 193–202. [Google Scholar] [CrossRef]
  39. Alhaik, G.; Ferreira, M.; Dubois, V.; Wirquin, E.; Tilloy, S.; Monflier, E.; Aouad, G. Enhance the Rheological and Mechanical Properties of Clayey Materials by Adding Starches. Constr. Build. Mater. 2017, 139, 602–610. [Google Scholar] [CrossRef]
  40. van Damme, H.; Houben, H. Should Raw Earth Be Improved? An Environmental Assessment. In Proceedings of the Terra, Lyon, France, 11–14 July 2016; CRAterre: Lyon, France, 2016; pp. 180–182. [Google Scholar]
  41. Shoukat, R.; Cappai, M.; Pia, G.; Pilia, L. An Updated Review: Opuntia Ficus Indica (OFI) Chemistry and Its Diverse Applictions. Appl. Sci. 2023, 13, 7724. [Google Scholar] [CrossRef]
  42. Park, S.-S.; Lee, J.-S.; Yoon, K.-B.; Woo, S.-W.; Lee, D.-E. Application of an Acrylic Polymer and Epoxy Emulsion to Red Clay and Sand. Polymers 2021, 13, 3410. [Google Scholar] [CrossRef]
  43. Nima, L.; Suksun, H.; Meehan, C.L.; Zaimi, A.M.M.; Tahir, M.M.; Tonnizam, M.E. Improvement of Problematic Soils with Biopolymer—An Environmentally Friendly Soil Stabilizer. J. Mater. Civ. Eng. 2017, 29, 04016204. [Google Scholar] [CrossRef]
  44. Kulkarni Vishakha, S.; Butte Kishor, D.; Rathod Sudha, S. Natural Polymers–A Comprehensive Review. Int. J. Res. Pharm. Biomed. Sci. 2012, 3, 1597–1613. [Google Scholar]
  45. Lahalih, S.M.; Ahmed, N. Effect of New Soil Stabilizers on the Compressive Strength of Dune Sand. Constr. Build. Mater. 1998, 12, 321–328. [Google Scholar] [CrossRef]
  46. Striani, R.; Cappai, M.; Casnedi, L.; Esposito Corcione, C.; Pia, G. Coating’s Influence on Wind Erosion of Porous Stones Used in the Cultural Heritage of Southern Italy: Surface Characterisation and Resistance. Case Stud. Constr. Mater. 2022, 17, e01501. [Google Scholar] [CrossRef]
  47. Majumder, A.; Losito, M.; Paramasivam, S.; Kumar, A.; Gatto, G. Buoys for marine weather data monitoring and LoRaWAN communication. Ocean. Eng. 2024, 313, 119521. [Google Scholar] [CrossRef]
  48. Soldo, A.; Miletic, M. Durability against Wetting-Drying Cycles of Sustainable Biopolymer-Treated Soil. Polymers 2022, 14, 4247. [Google Scholar] [CrossRef]
  49. Tourtelot, J.; Bourgès, A.; Keita, E. Influence of Biopolymers on the Mechanical Behavior of Earth-Based Building Materials. Recent. Prog. Mater. 2021, 3, 031. [Google Scholar] [CrossRef]
  50. Kariyawasam, K.K.G.K.D.; Jayasinghe, C. Cement Stabilized Rammed Earth as a Sustainable Construction Material. Constr. Build. Mater. 2016, 105, 519–527. [Google Scholar] [CrossRef]
  51. Cappai, M.; Pia, G. Sustainable earthen plasters: Surface resistance enhancement via thermal treatments. J. Build. Eng. 2025, 108, 112867. [Google Scholar] [CrossRef]
  52. Rieppi Godoy, A.S.; Peisino, L.E.; Rolón, G.; Raggiotti, B.B. Firing the wall: A novel way to protect earth buildings. Constr. Build. Mater. 2024, 445, 137878. [Google Scholar] [CrossRef]
  53. Stochino, F.; Majumder, A.; Frattolillo, A.; Valdes, M.; Martinelli, E. Jute fiber reinforcement for masonry walls: Integrating structural strength and thermal insulation in sustainable upgrades. J. Build. Eng. 2025, 104, 112210. [Google Scholar] [CrossRef]
  54. Taib, M.N.A.M.; Antov, P.; Savov, V.; Fatriasari, W.; Madyaratri, E.W.; Wirawan, R.; Osvaldová, L.M.; Hua, L.S.; Ghani, M.A.A.; Al Edrus, S.S.A.O.; et al. Current Progress of Biopolymer-Based Flame Retardant. Polym. Degrad. Stab. 2022, 205, 110153. [Google Scholar] [CrossRef]
  55. Getahun, M.J.; Kassie, B.B.; Alemu, T.S. Recent Advances in Biopolymer Synthesis, Properties, & Commercial Applications: A Review. Process Biochem. 2024, 145, 261–287. [Google Scholar] [CrossRef]
  56. Patel, D.K.; Jung, E.; Priya, S.; Won, S.-Y.; Han, S.S. Recent Advances in Biopolymer-Based Hydrogels and Their Potential Biomedical Applications. Carbohydr. Polym. 2024, 323, 121408. [Google Scholar] [CrossRef]
  57. Shoukat, R.; Cappai, M.; Pia, G.; Pilia, L. Rice Starch Chemistry, Functional Properties, and Industrial Applications: A Review. Polymers 2025, 17, 110. [Google Scholar] [CrossRef]
  58. Caillol, S. Special Issue “Natural Polymers and Biopolymers II”. Molecules 2021, 26, 112. [Google Scholar] [CrossRef]
  59. Losini, A.E.; Grillet, A.C.; Bellotto, M.; Woloszyn, M.; Dotelli, G. Natural Additives and Biopolymers for Raw Earth Construction Stabilization—A Review. Constr. Build. Mater. 2021, 304, 124507. [Google Scholar] [CrossRef]
  60. Muguda, S.; Lucas, G.; Hughes, P.N.; Augarde, C.E.; Perlot, C.; Bruno, A.W.; Gallipoli, D. Durability and Hygroscopic Behaviour of Biopolymer Stabilised Earthen Construction Materials. Constr. Build. Mater. 2020, 259, 119725. [Google Scholar] [CrossRef]
  61. de Souza, J.M.; Ramos Filho, R.E.B.; Duarte, J.B.; da Silva, V.M.; do Rêgo, S.R.; de Figueiredo Lopes Lucena, L.; Acchar, W. Mechanical and Durability Properties of Compressed Stabilized Earth Brick Produced with Cassava Wastewater. J. Build. Eng. 2021, 44, 103290. [Google Scholar] [CrossRef]
  62. Muguda, S.; Booth, S.J.; Hughes, P.N.; Augarde, C.E.; Perlot, C.; Bruno, A.W.; Gallipoli, D. Preliminary Study on Use of Biopolymers in Earthen Construction. In Proceedings of the 7th International conference on unsaturated SoilsAt: The Hong Kong University of Science and Technology, Hong Kong, China, 3–8 August 2018; Volume 8, pp. 1–2. [Google Scholar]
  63. Chang, I.; Im, J.; Prasidhi, A.K.; Cho, G.-C. Effects of Xanthan Gum Biopolymer on Soil Strengthening. Constr. Build. Mater. 2015, 74, 65–72. [Google Scholar] [CrossRef]
  64. Karak, N. Biopolymers for Paints and Surface Coatings. In Biopolymers and Biotech Admixtures for Eco-Efficient Construction Materials; Elsevier: Amsterdam, The Netherlands, 2016; pp. 333–368. [Google Scholar]
  65. Sandak, A.; Sandak, J.; Brzezicki, M.; Kutnar, A. Bio-Based Building Skin; Springer Nature: Berlin, Germany, 2019; ISBN 9811337470. [Google Scholar]
  66. Noreen, A.; Zia, K.M.; Zuber, M.; Tabasum, S.; Zahoor, A.F. Bio-Based Polyurethane: An Efficient and Environment Friendly Coating Systems: A Review. Prog. Org. Coat. 2016, 91, 25–32. [Google Scholar] [CrossRef]
  67. Ren, X.; Meng, L.; Soucek, M. Environmentally Friendly Coatings. In Biobased and Environmental Benign Coatings; John Wiley & Sons, Ltd.: Oxford, UK, 2016; pp. 183–223. ISBN 9781119185055. [Google Scholar]
  68. Montgomery, D.C.; Runger, G.C. Applied Statistics and Probability for Engineers; John Wiley & Sons: Hoboken, NJ, USA, 2010; ISBN 0470053046. [Google Scholar]
  69. ISO 8301:1991; Thermal Insulation—Determination of Steady-State Thermal Resistance and Related Properties—Heat Flow Meter Apparatus. ISO: Geneva, Switzerland, 1991.
  70. Venables, W.N.; Smith, D.M. An Introduction to R: Notes on R: A Programming Environment for Data Analysis and Graphics, version 4.4.2. 2024. Available online: https://cran.r-project.org/doc/manuals/R-intro.pdf (accessed on 31 October 2024).
  71. Záleská, M.; Pavlíková, A.; Pivák, A.; Lauermannová, A.-M.; Jankovský, O.; Pavlík, Z. Lightweight Vapor-Permeable Plasters for Building Repair Detailed Experimental Analysis of the Functional Properties. Materials 2021, 14, 2613. [Google Scholar] [CrossRef]
  72. Aleksandrova, O.; Zhmykhova, T.; Värnik, R.; Viira, A.-H. The One-Way Analysis of Variance of Heat-Storage Materials Used in Building of Poultry Houses. Processes 2023, 11, 104. [Google Scholar] [CrossRef]
  73. Choungara, T.; Ghrieb, A.; Abadou, Y.; Bustamante, R. A Statistical Approach for Green Conversion of the Amorphous E-Waste into Glassy Refractory Mortar Subjected to High Temperature. Int. J. Thermophys. 2023, 44, 44. [Google Scholar] [CrossRef]
  74. Montgomery, D.C. Design and Analysis of Experiments, 8th ed.; John Wiley & Sons, Incorporated: Hoboken, NJ, USA, 2012; ISBN 9781118214718. [Google Scholar]
  75. Field, A. Discovering Statistics Using IBM SPSS Statistics; Sage Publications limited: Thousand Oaks, CA, USA, 2024; ISBN 1529668700. [Google Scholar]
  76. Aczel, A.D. Complete Business Statistics; Irwin. Inc.: Boston, MA, USA, 1989. [Google Scholar]
  77. Fisher, R.A. Statistical Methods for Research Workers, 4th ed.; revised and enlarged; Oliver and Boyd: Edinburgh, UK; London, UK, 1932; pp. xiv + 307. [Google Scholar]
  78. Rafter, J.A.; Abell, M.L.; Braselton, J.P. Multiple Comparison Methods for Means. Siam Rev. 2002, 44, 259–278. [Google Scholar] [CrossRef]
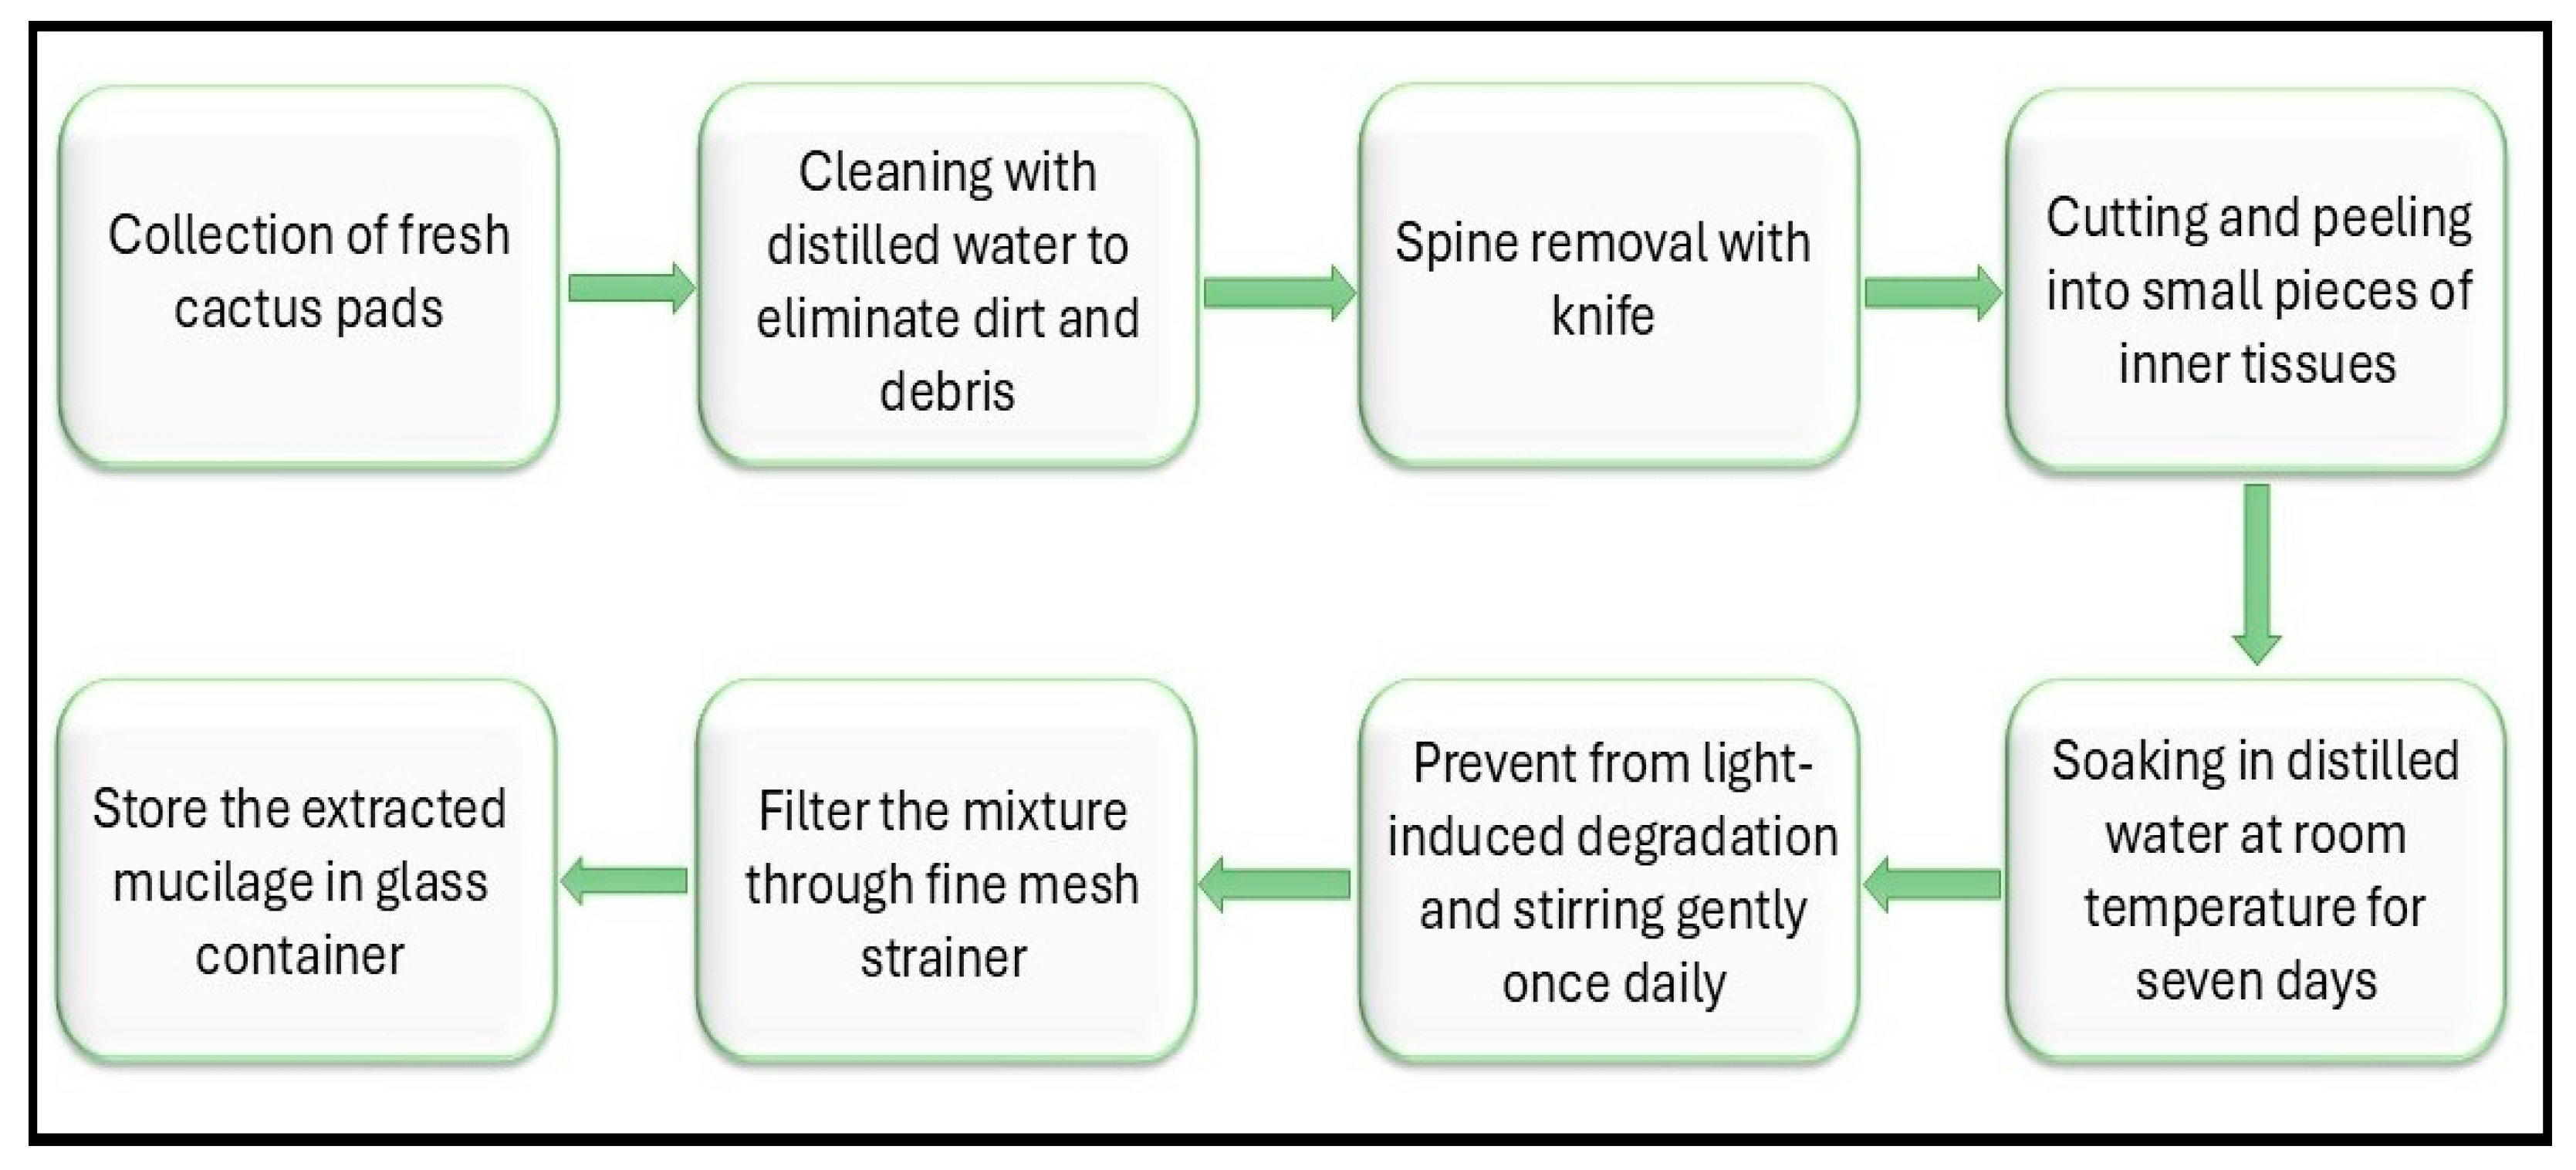
Figure 1. Schematic representation of the OFI mucilage extraction process from OFI cactus pads.
Energies 18 03144 g001
Figure 2. Schematic representation of the stabilization and analysis process of earthen materials.
Energies 18 03144 g002
Figure 3. Graphical representation of the ANOVA analysis of experimental thermal conductivity data for environmental samples, showing a 95% family-wise confidence level with respect to the mean level differences.
Energies 18 03144 g003
Figure 4. Graphical representation of the ANOVA analysis of experimental thermal conductivity data for dry samples, showing a 95% family-wise confidence level with respect to the mean level differences.
Energies 18 03144 g004
Figure 5. SEM images (magnification 1000×) of water and OFI mucilage-based composites showing surface morphology (a) R-30 water based reference sample (b) R-40 water based reference sample (c) OFI-30 biopolymer sample (d) OFI-40 biopolymer sample.
Energies 18 03144 g005
Figure 6. SEM images (1000×) of bio-based polymer samples showing surface morphology. (a) S-30 bio-based polymer sample. (b) S-40 bio-based polymer sample. (c) D-30 bio-based polymer sample. (d) D-40 bio-based polymer sample.
Energies 18 03144 g006
Table 1. The thermal conductivity of samples under environmental and dry conditions.
SamplesKav(W/m·K)
(Environmental Condition)
Kav(W/m·K)
(Dry Condition)
R-300.267 ± 0.024[12]0.252 ± 0.011
R-400.239 ± 0.015[12]0.225 ± 0.011
S-300.451 ± 0.034[12]0.418 ± 0.013
S-400.266 ± 0.014[12]0.260 ± 0.011
D-300.347 ± 0.021[12]0.327 ± 0.016
D-400.322 ± 0.025[12]0.302 ± 0.014
OFI-300.271 ± 0.0130.259 ± 0.012
OFI-400.365 ± 0.0160.353 ± 0.013
Table 2. ANOVA numerical analysis of experimental thermal conductivity data for environmental samples with a 95% family-wise confidence level.
Origin of VarianceSSdfMSFp-Value
Between groups0.1263770.01805373.830
Within groups0.00391160.000245
Total0.13028230.018298
Table 3. ANOVA numerical analysis of experimental thermal conductivity data for dry samples with a 95% family-wise confidence level.
Origin of VarianceSSdfMSFp-Value
Between groups0.0861570.0123182.250
Within groups0.00239160.00015
Total0.08854230.01246
Disclaimer/Publisher’s Note: The statements, opinions and data contained in all publications are solely those of the individual author(s) and contributor(s) and not of MDPI and/or the editor(s). MDPI and/or the editor(s) disclaim responsibility for any injury to people or property resulting from any ideas, methods, instructions or products referred to in the content.