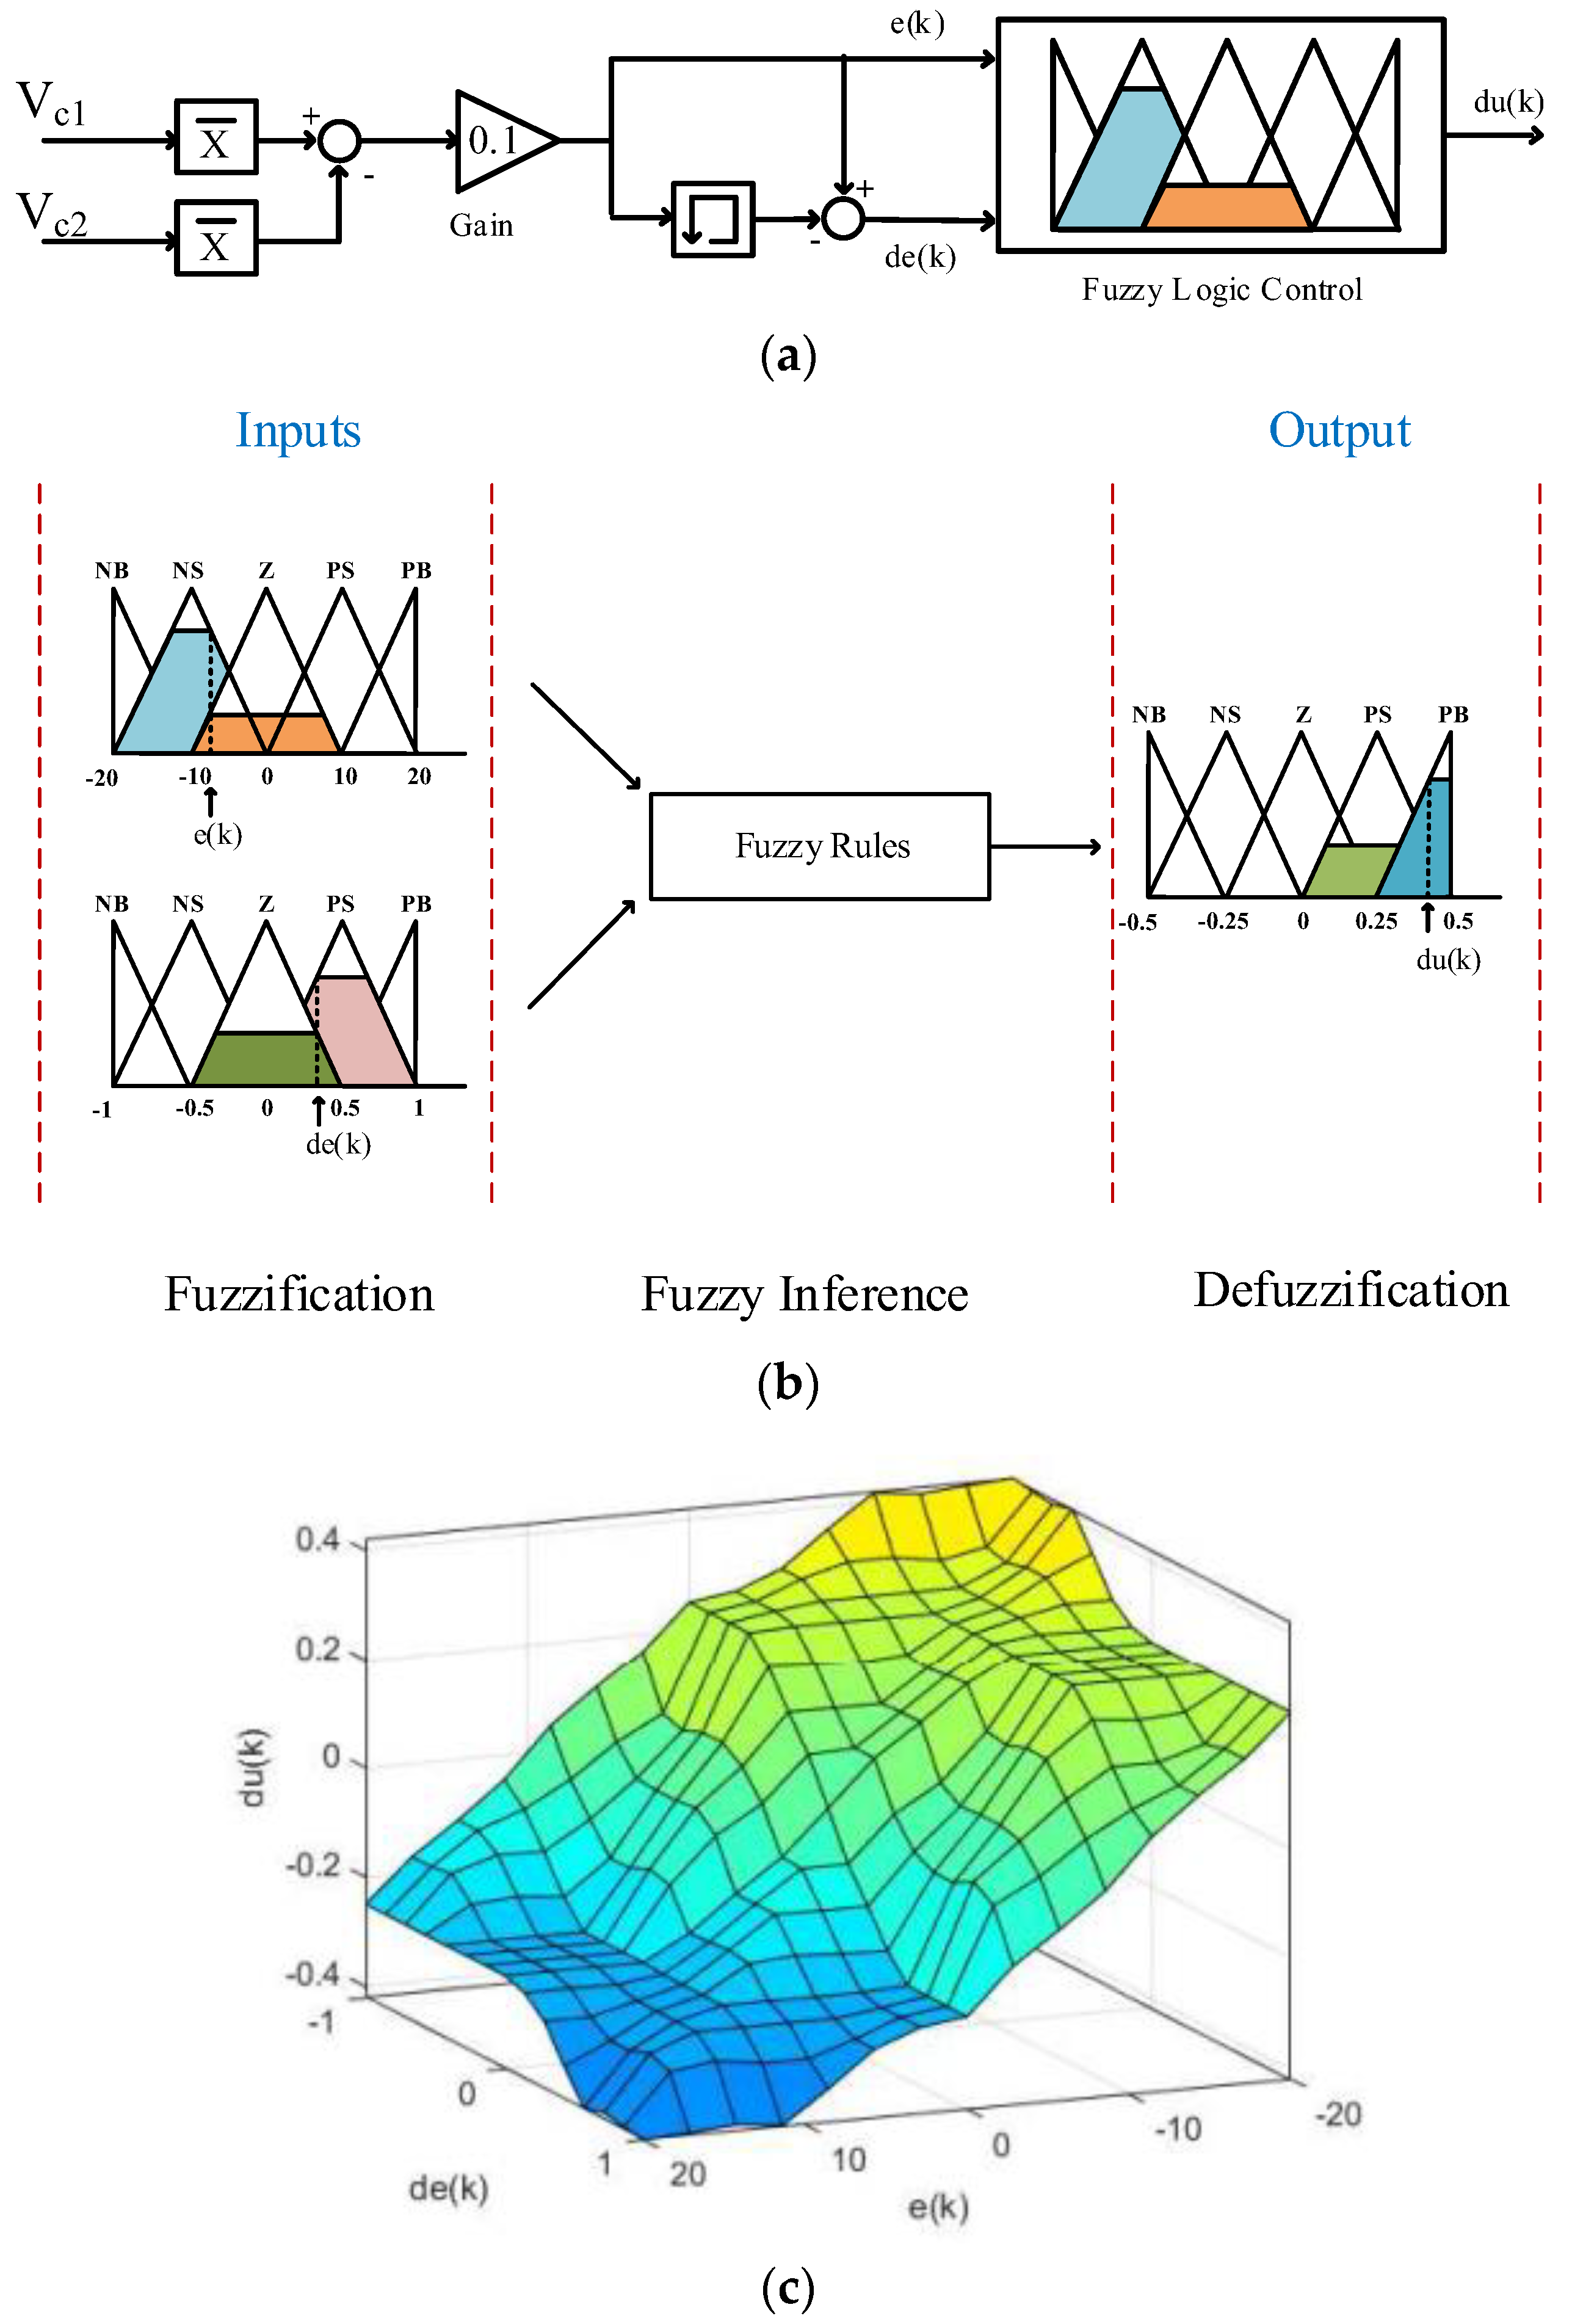
To thoroughly investigate the fluctuations in the DC bus capacitors, comprehensive simulation and experimental studies were conducted. The simulation analyses were performed using MATLAB/Simulink 2021a, while a laboratory-scale prototype test setup was developed to validate the findings experimentally.
3.1. Simulation Results
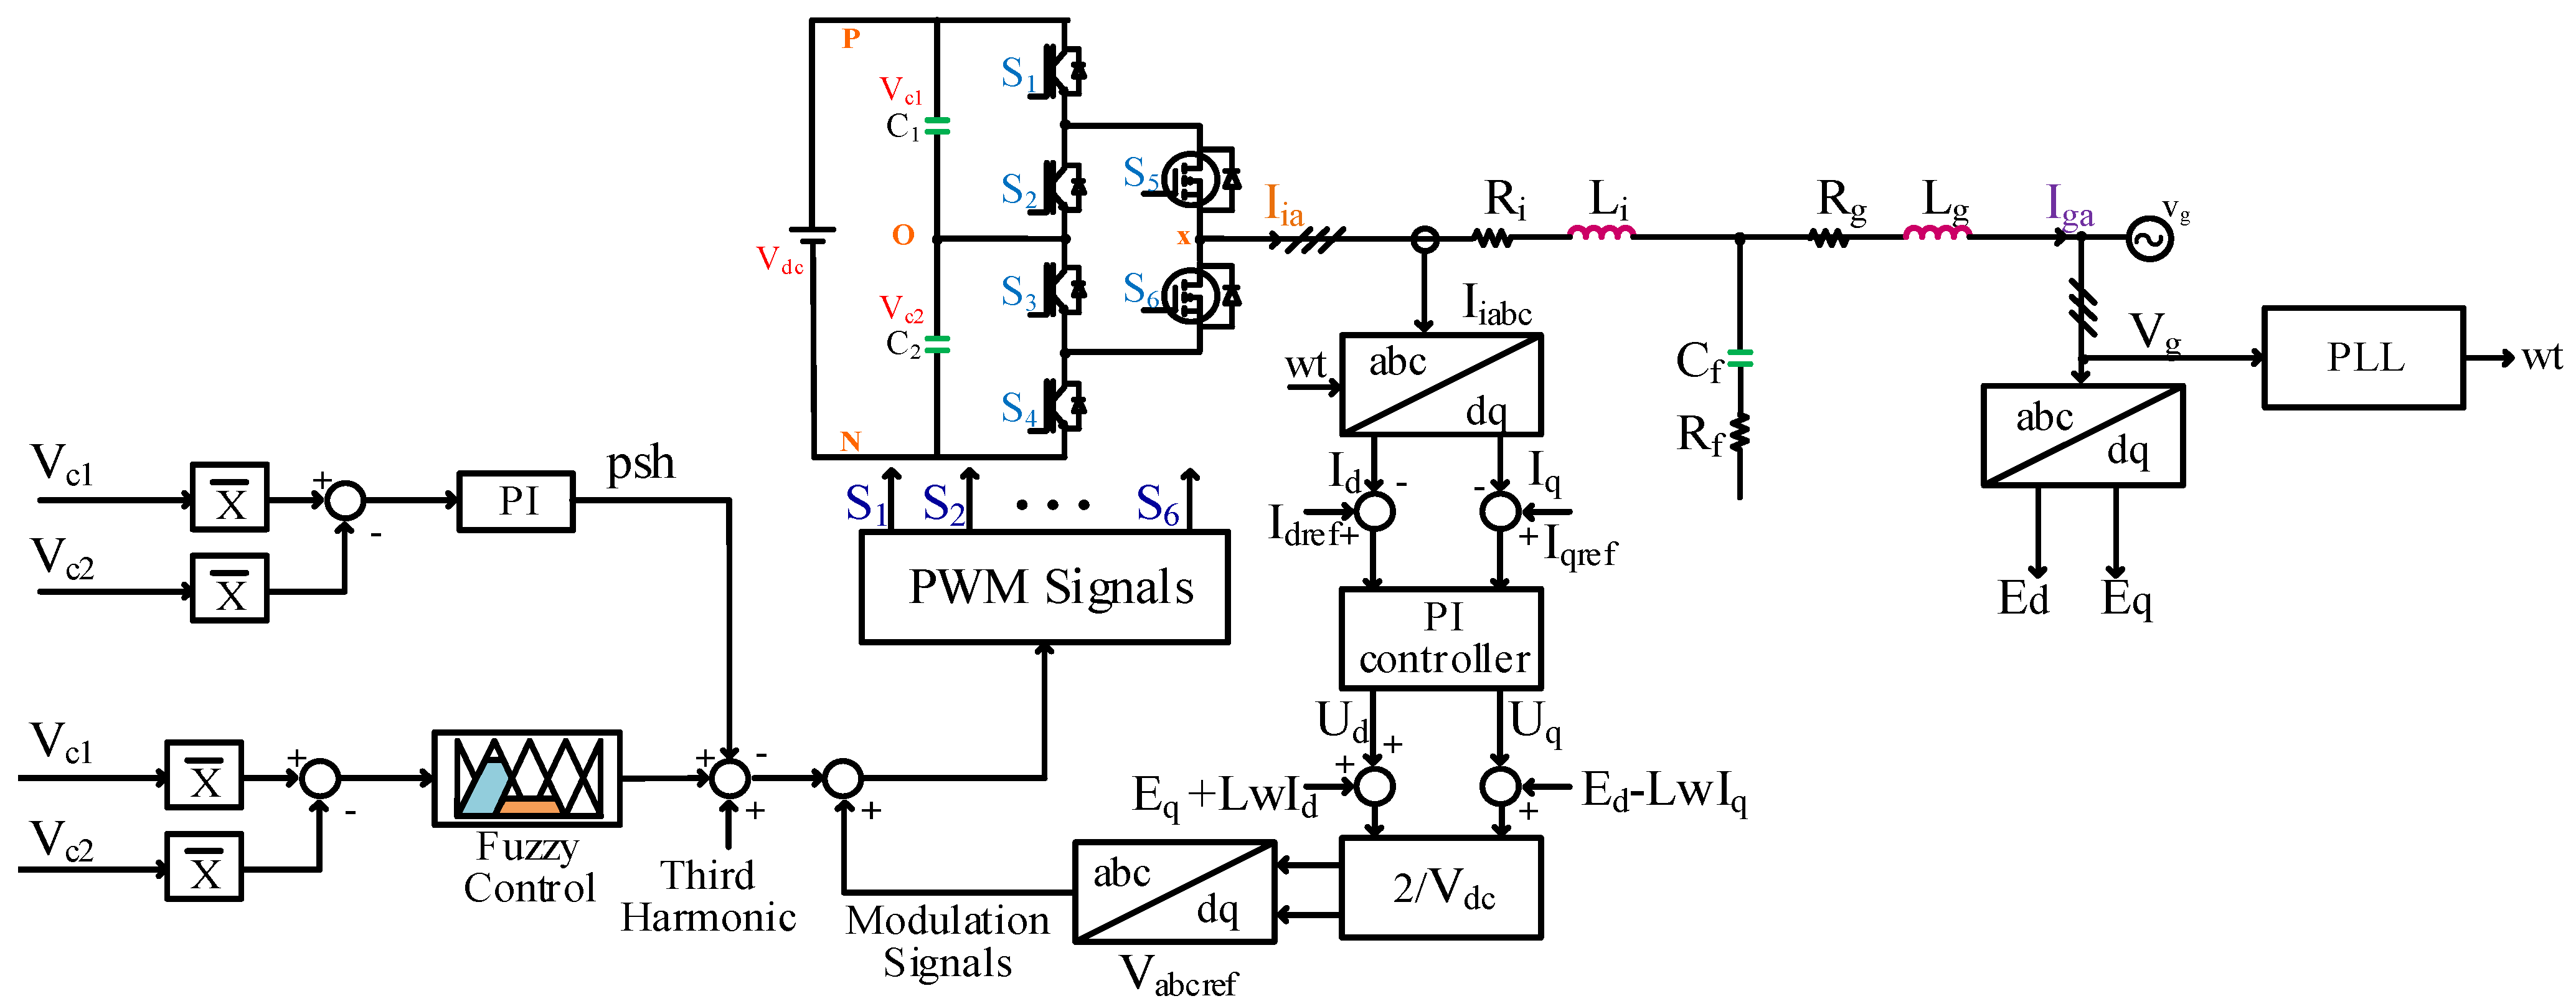
Comprehensive investigations were meticulously conducted to evaluate the various operating conditions of the three-phase grid-connected hybrid ANPC inverter system. The detailed parameters and specifications of this sophisticated system are thoroughly documented in
Table 3, while the extensive scenarios examined throughout this research investigation are systematically presented in
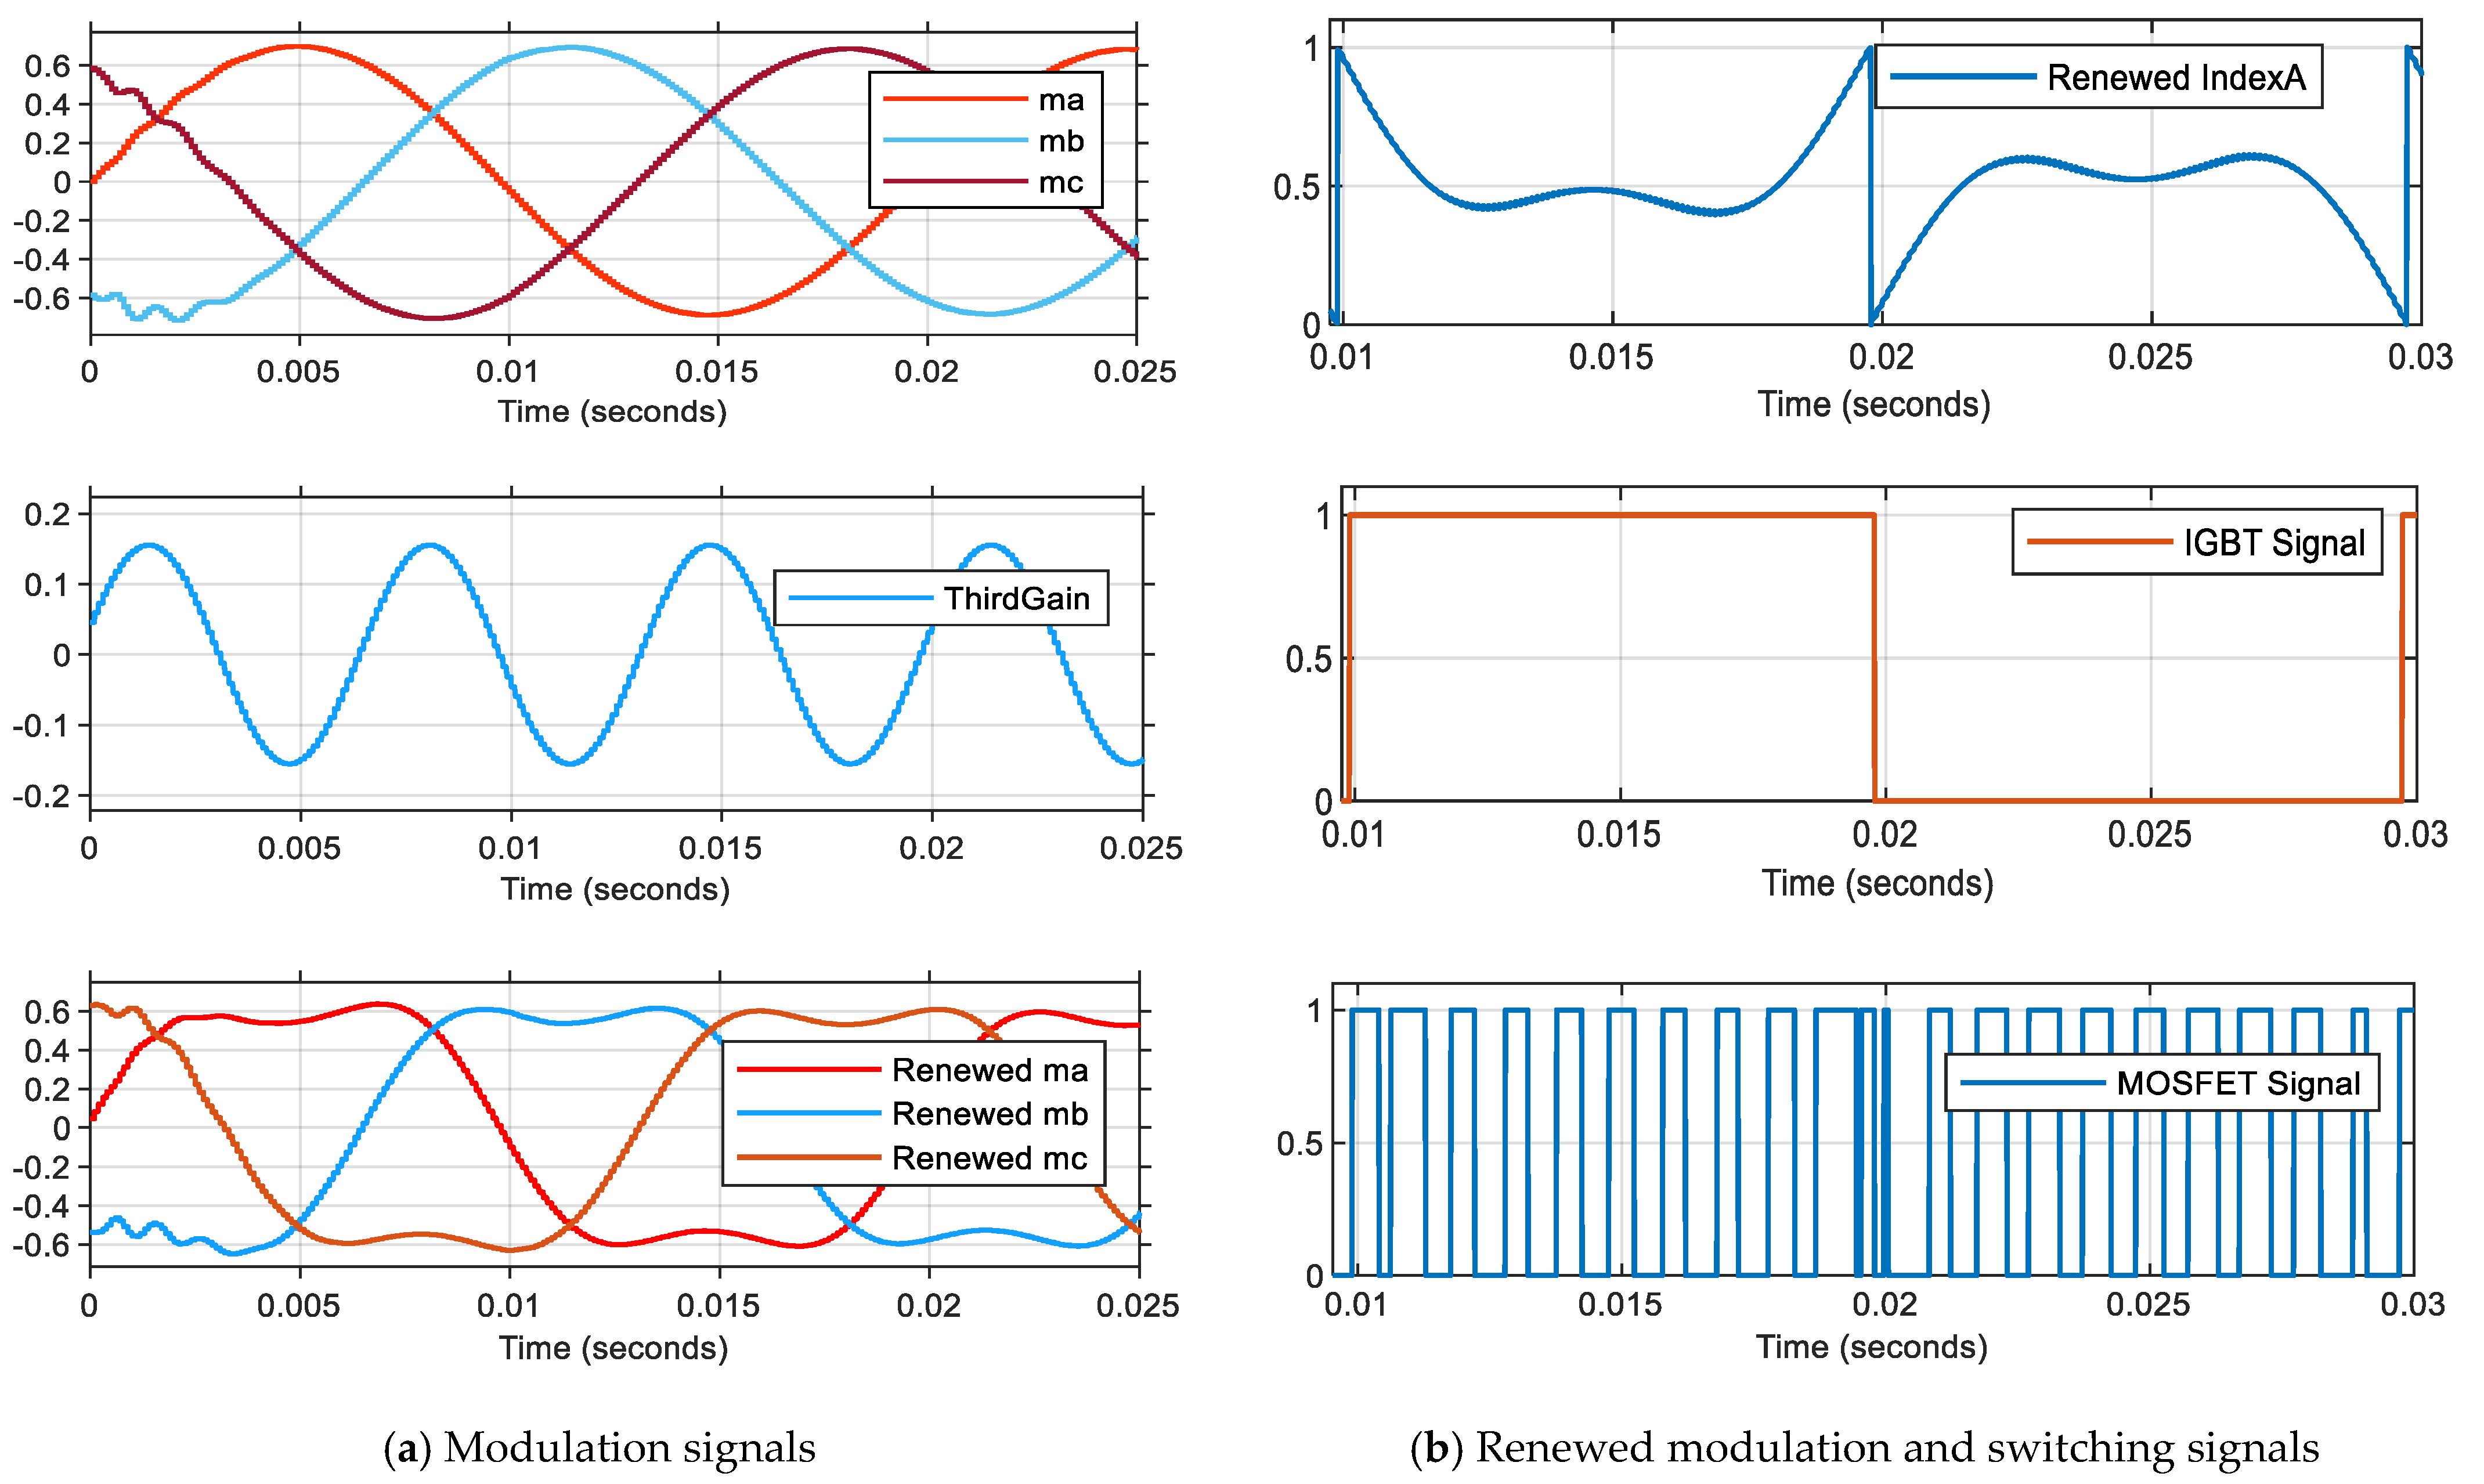
Table 4. To analyze the control of the 150 Hz fluctuation in the dc-link capacitor voltage, three different simulation studies were conducted. In the first scenario, no control was applied to this fluctuation. In the second scenario, an open-loop controller was designed using the THIPWM method. In the third scenario, the FLC was activated at a specific time interval in the simulation environment, and the system’s response both at the moment of the controller’s engagement and in subsequent instances was observed. For this comprehensive analysis, the system’s performance characteristics have been methodically evaluated through four distinct operational scenarios. During the initial phase of testing, specifically in the first scenarios (designated as Scenario-1), the SPWM technique was implemented as the primary modulation strategy, with the voltage fluctuation controller deliberately maintained in an inactive state. These conditions revealed notable voltage differentials between the initial capacitor voltages
and
, with measurements documented at 450 V–650 V, demonstrating significant variations in voltage distribution.
Progressing to Scenario-2 and Scenario-3, the research methodology incorporated a transition to the THIPWM technique, accompanied by the implementation of an open-loop control system architecture. Following these systematic modifications to the control strategy, the initial capacitor voltages and were carefully calibrated and maintained at a consistent level of 550 V.
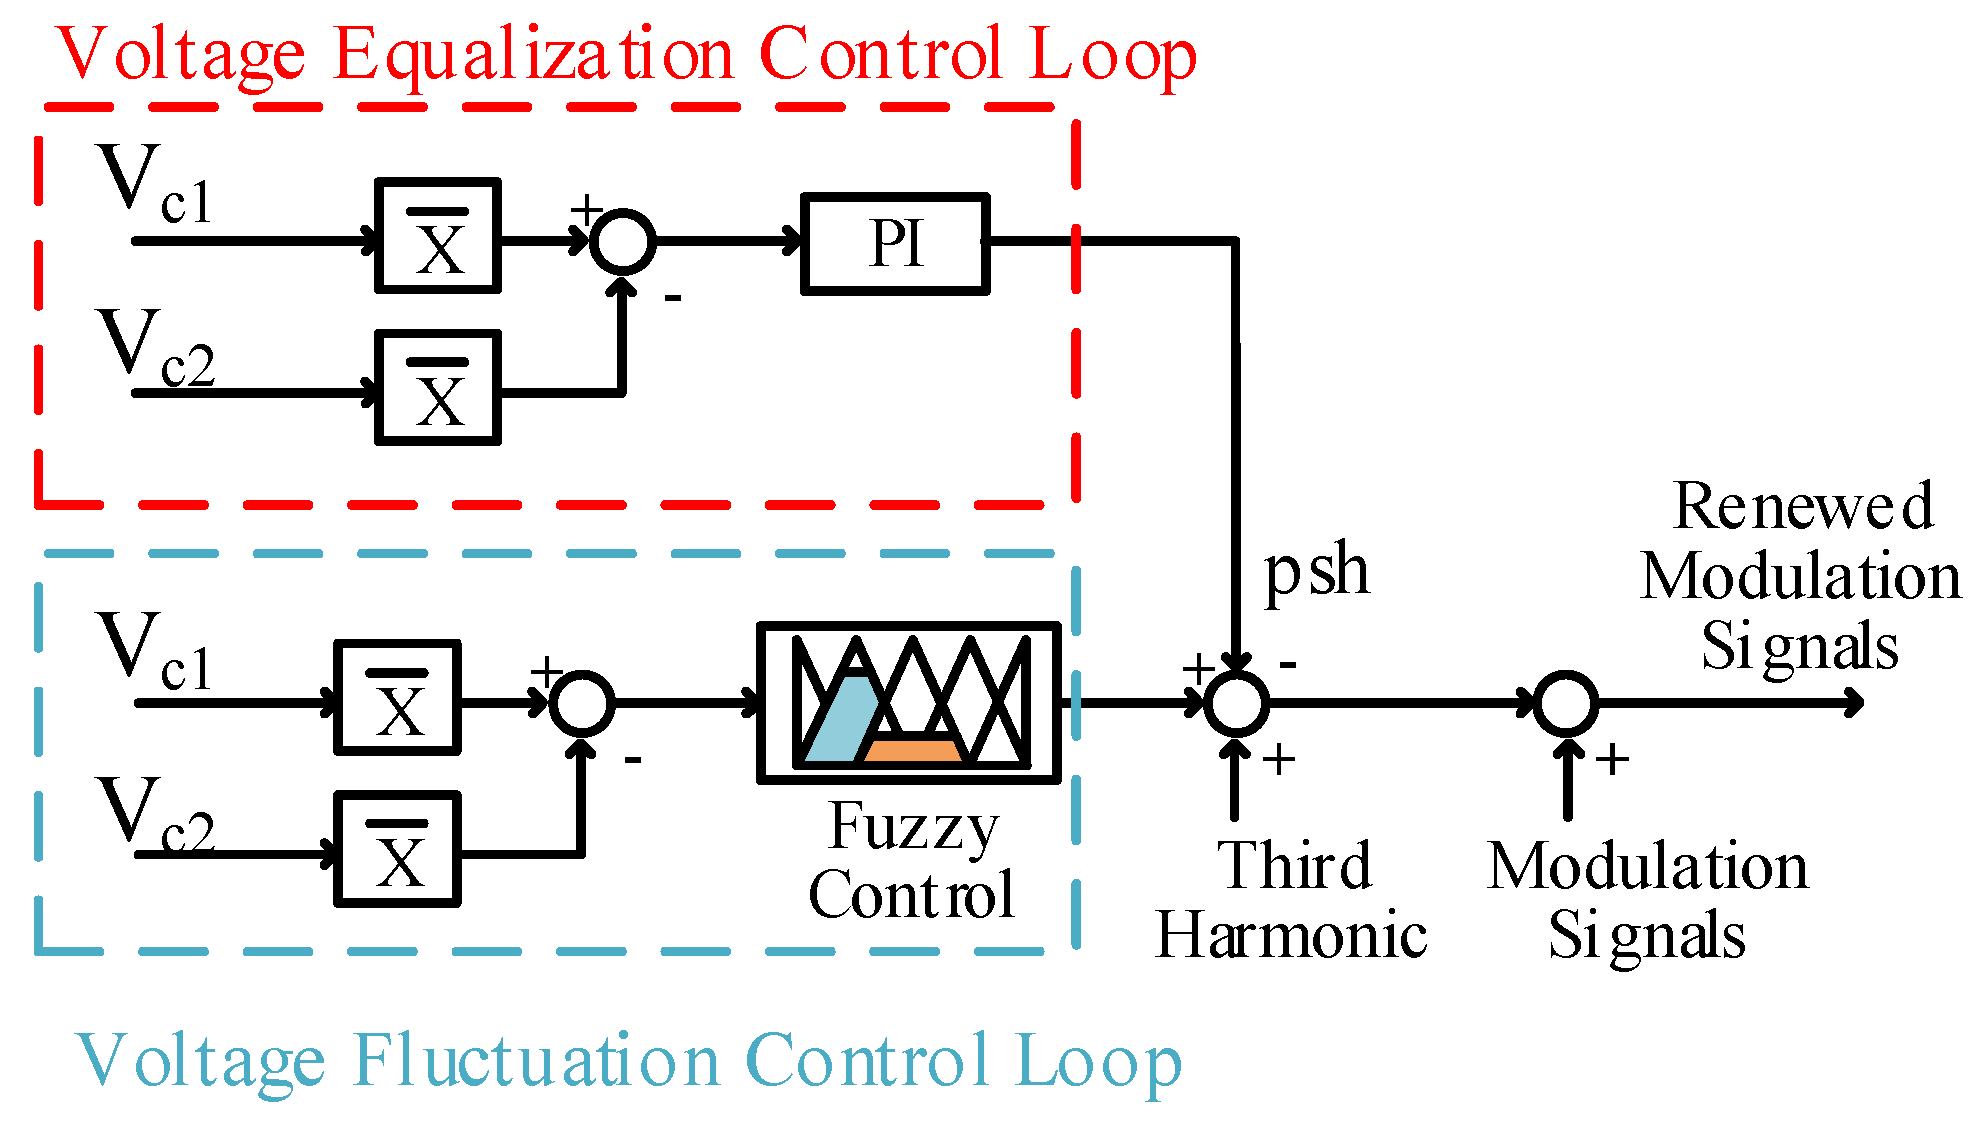
The final phase of simulation, embodied in Scenario-4, introduced an enhanced control mechanism through the integration of a sophisticated fuzzy logic controller. This advanced configuration was subjected to an extended testing duration of 0.08 s to ensure comprehensive performance evaluation under sustained operational conditions. Throughout all scenarios, the PI controller remained consistently implemented within the voltage balancing loop, while the voltage fluctuation loop exhibited varying degrees of control sophistication across different scenarios—ranging from uncontrolled operation to open-loop configuration and ultimately culminating in the implementation of fuzzy logic control strategies.
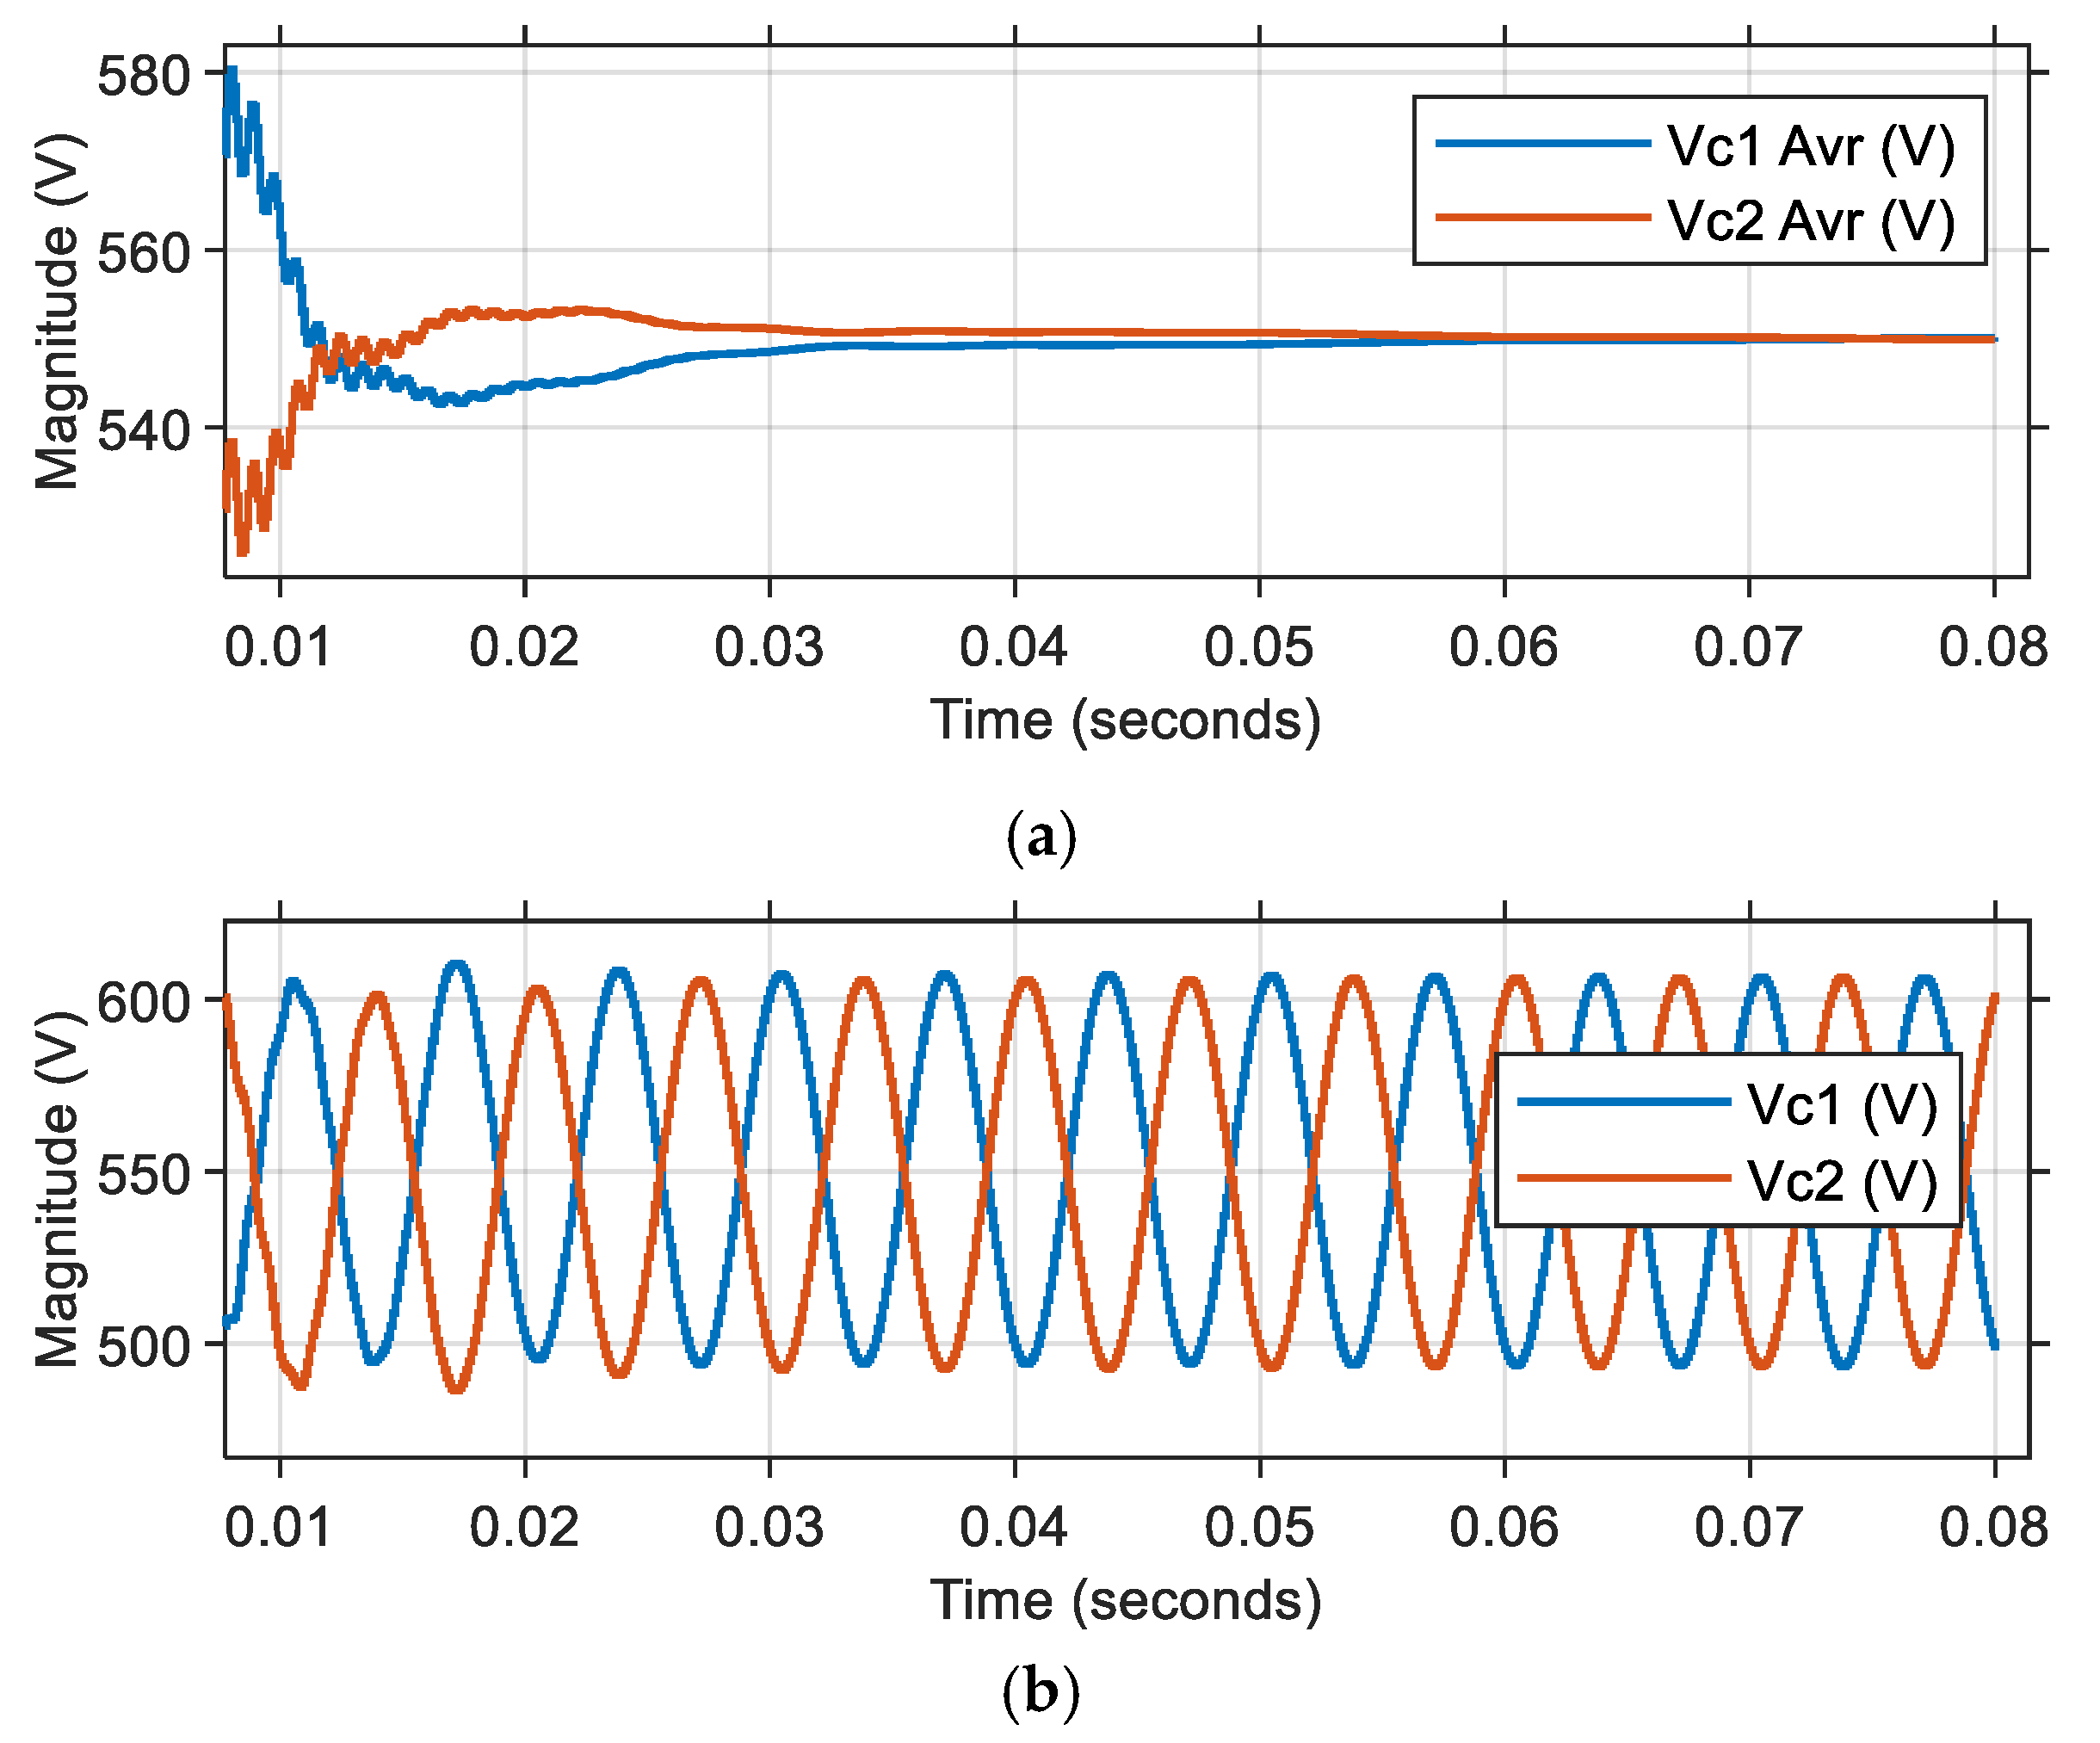
In Scenario-1, a comprehensive test was conducted within the specified time frame of 0 to 0.08 s to evaluate system performance under more challenging conditions. The initial capacitor voltage difference was deliberately increased to create a more demanding test environment. The initial voltage conditions were carefully configured, with
set to 450 V and
established at 650 V, creating a substantial initial voltage differential. The detailed simulation results and corresponding analysis for this scenario are thoroughly documented and presented in
Figure 6.
In analyzing the results of Scenario-1, the careful examination of
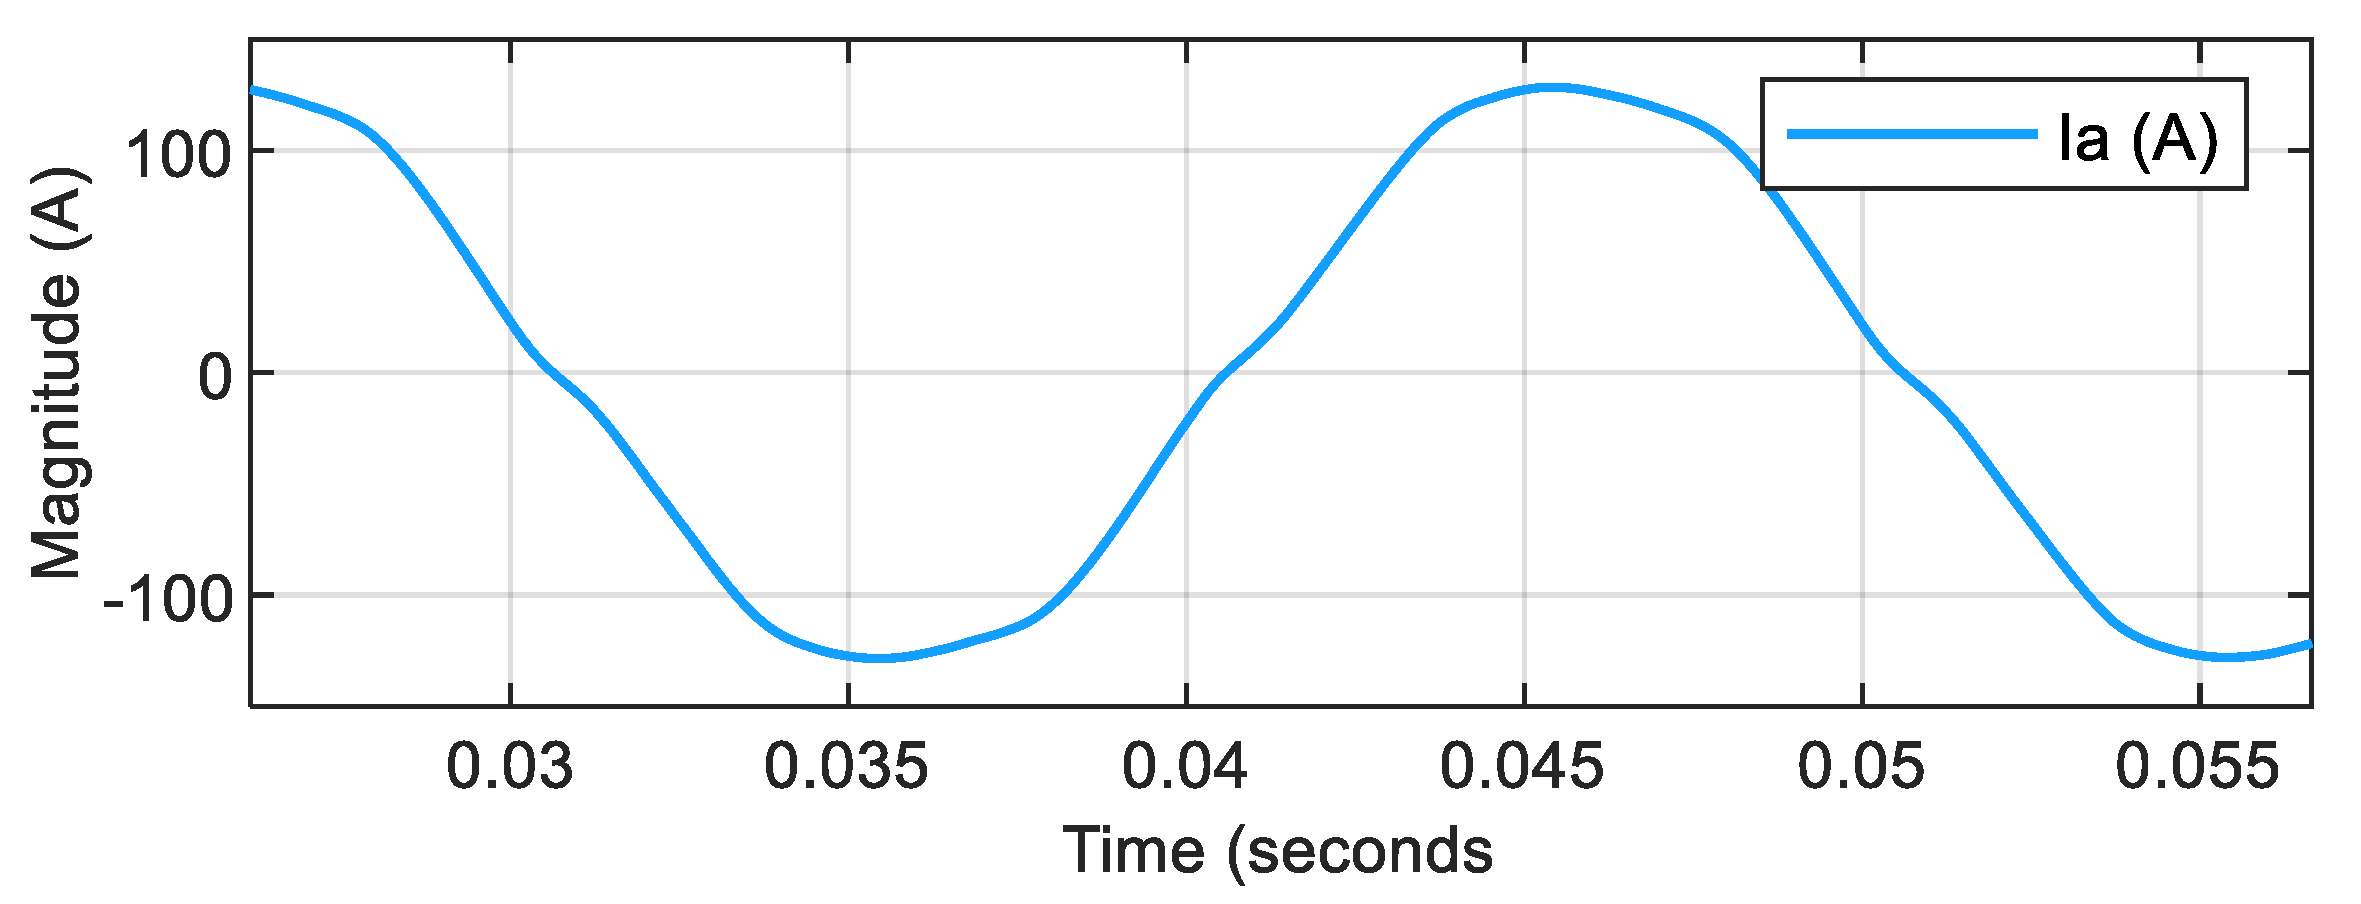
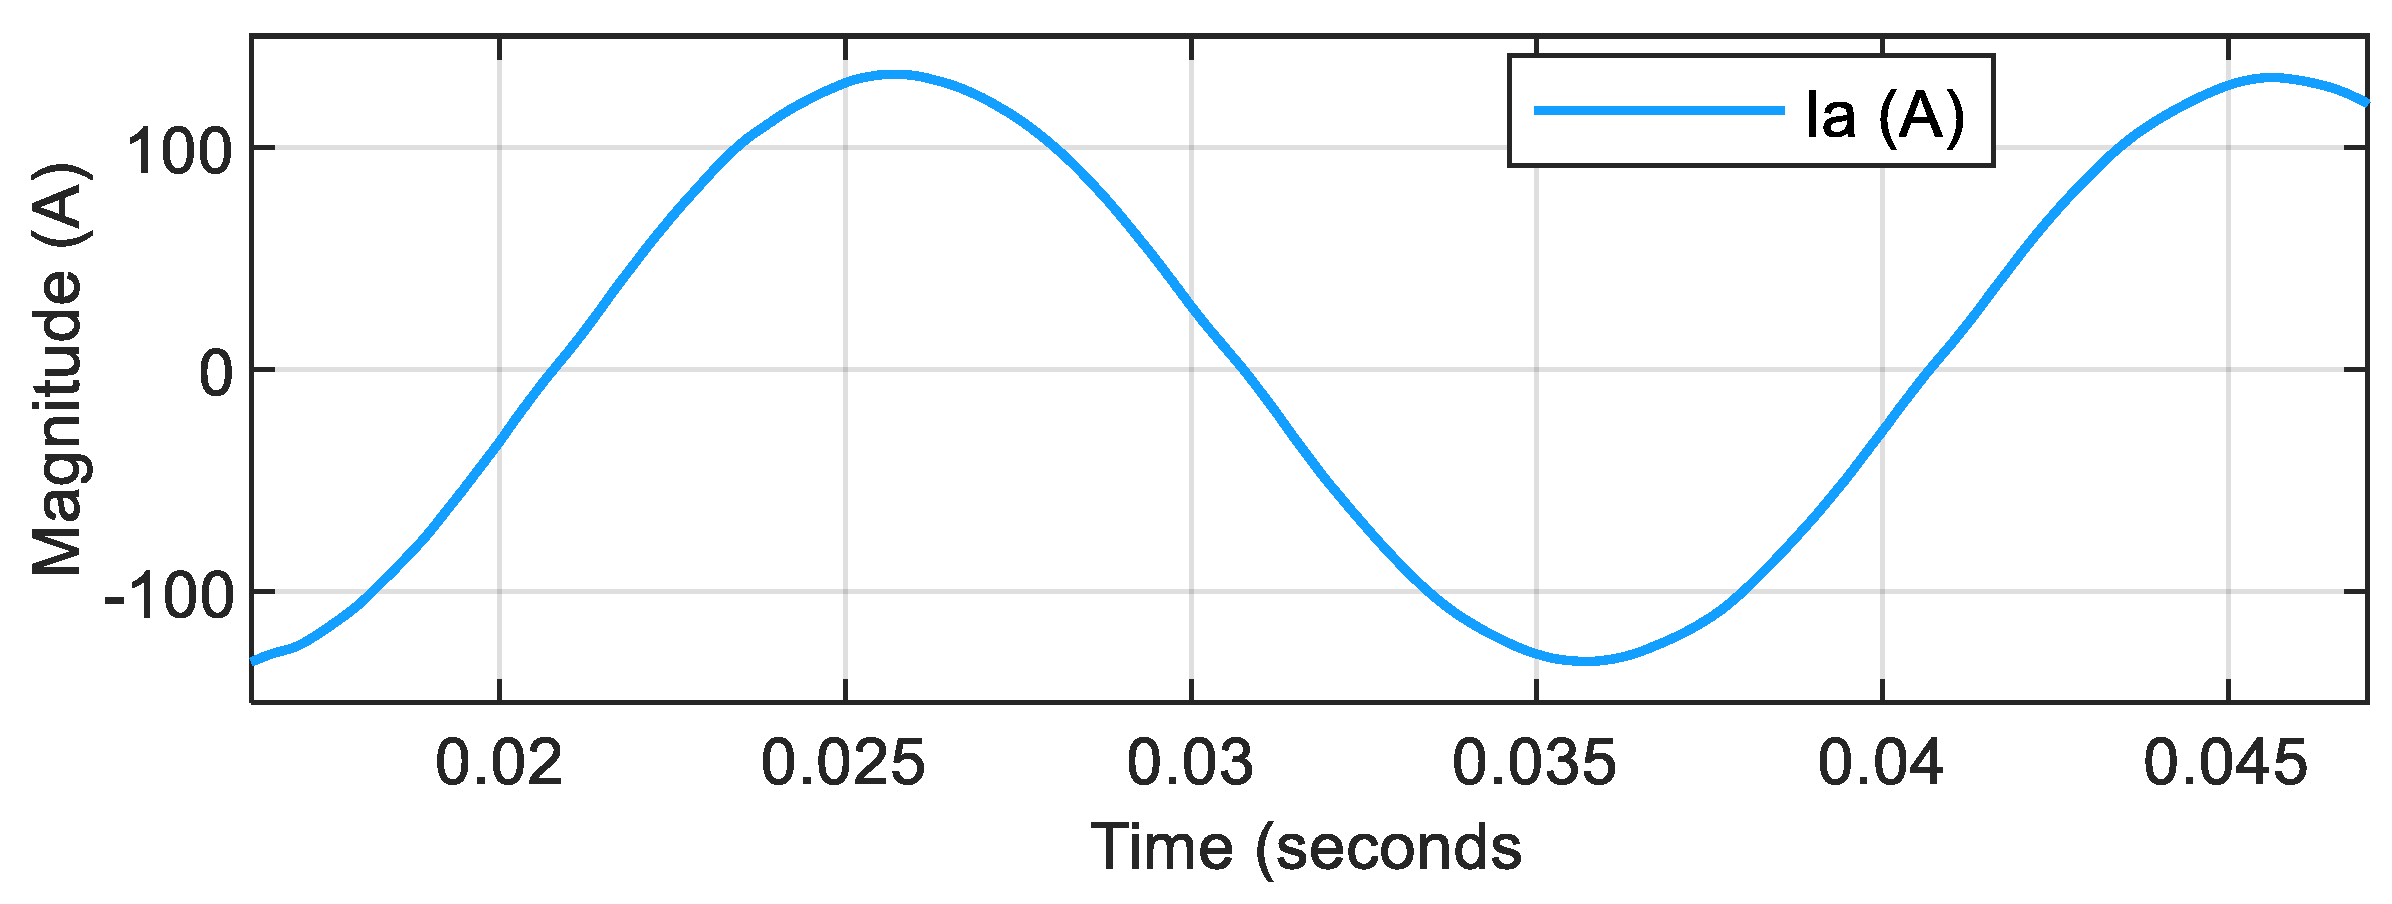
Figure 6 revealed that the process of equalizing the capacitor voltage values required a notably longer duration. Through precise measurements, the voltage settling time was determined to be 0.075 s, after which the steady-state average capacitor voltages stabilized at a measured value of 550 V. The further analysis of the voltage characteristics showed that the peak-to-peak voltage fluctuation maintained a consistent value of 120 V, while operating at a characteristic fluctuation frequency of 150 Hz. The current waveform of phase A injected into the grid is illustrated in
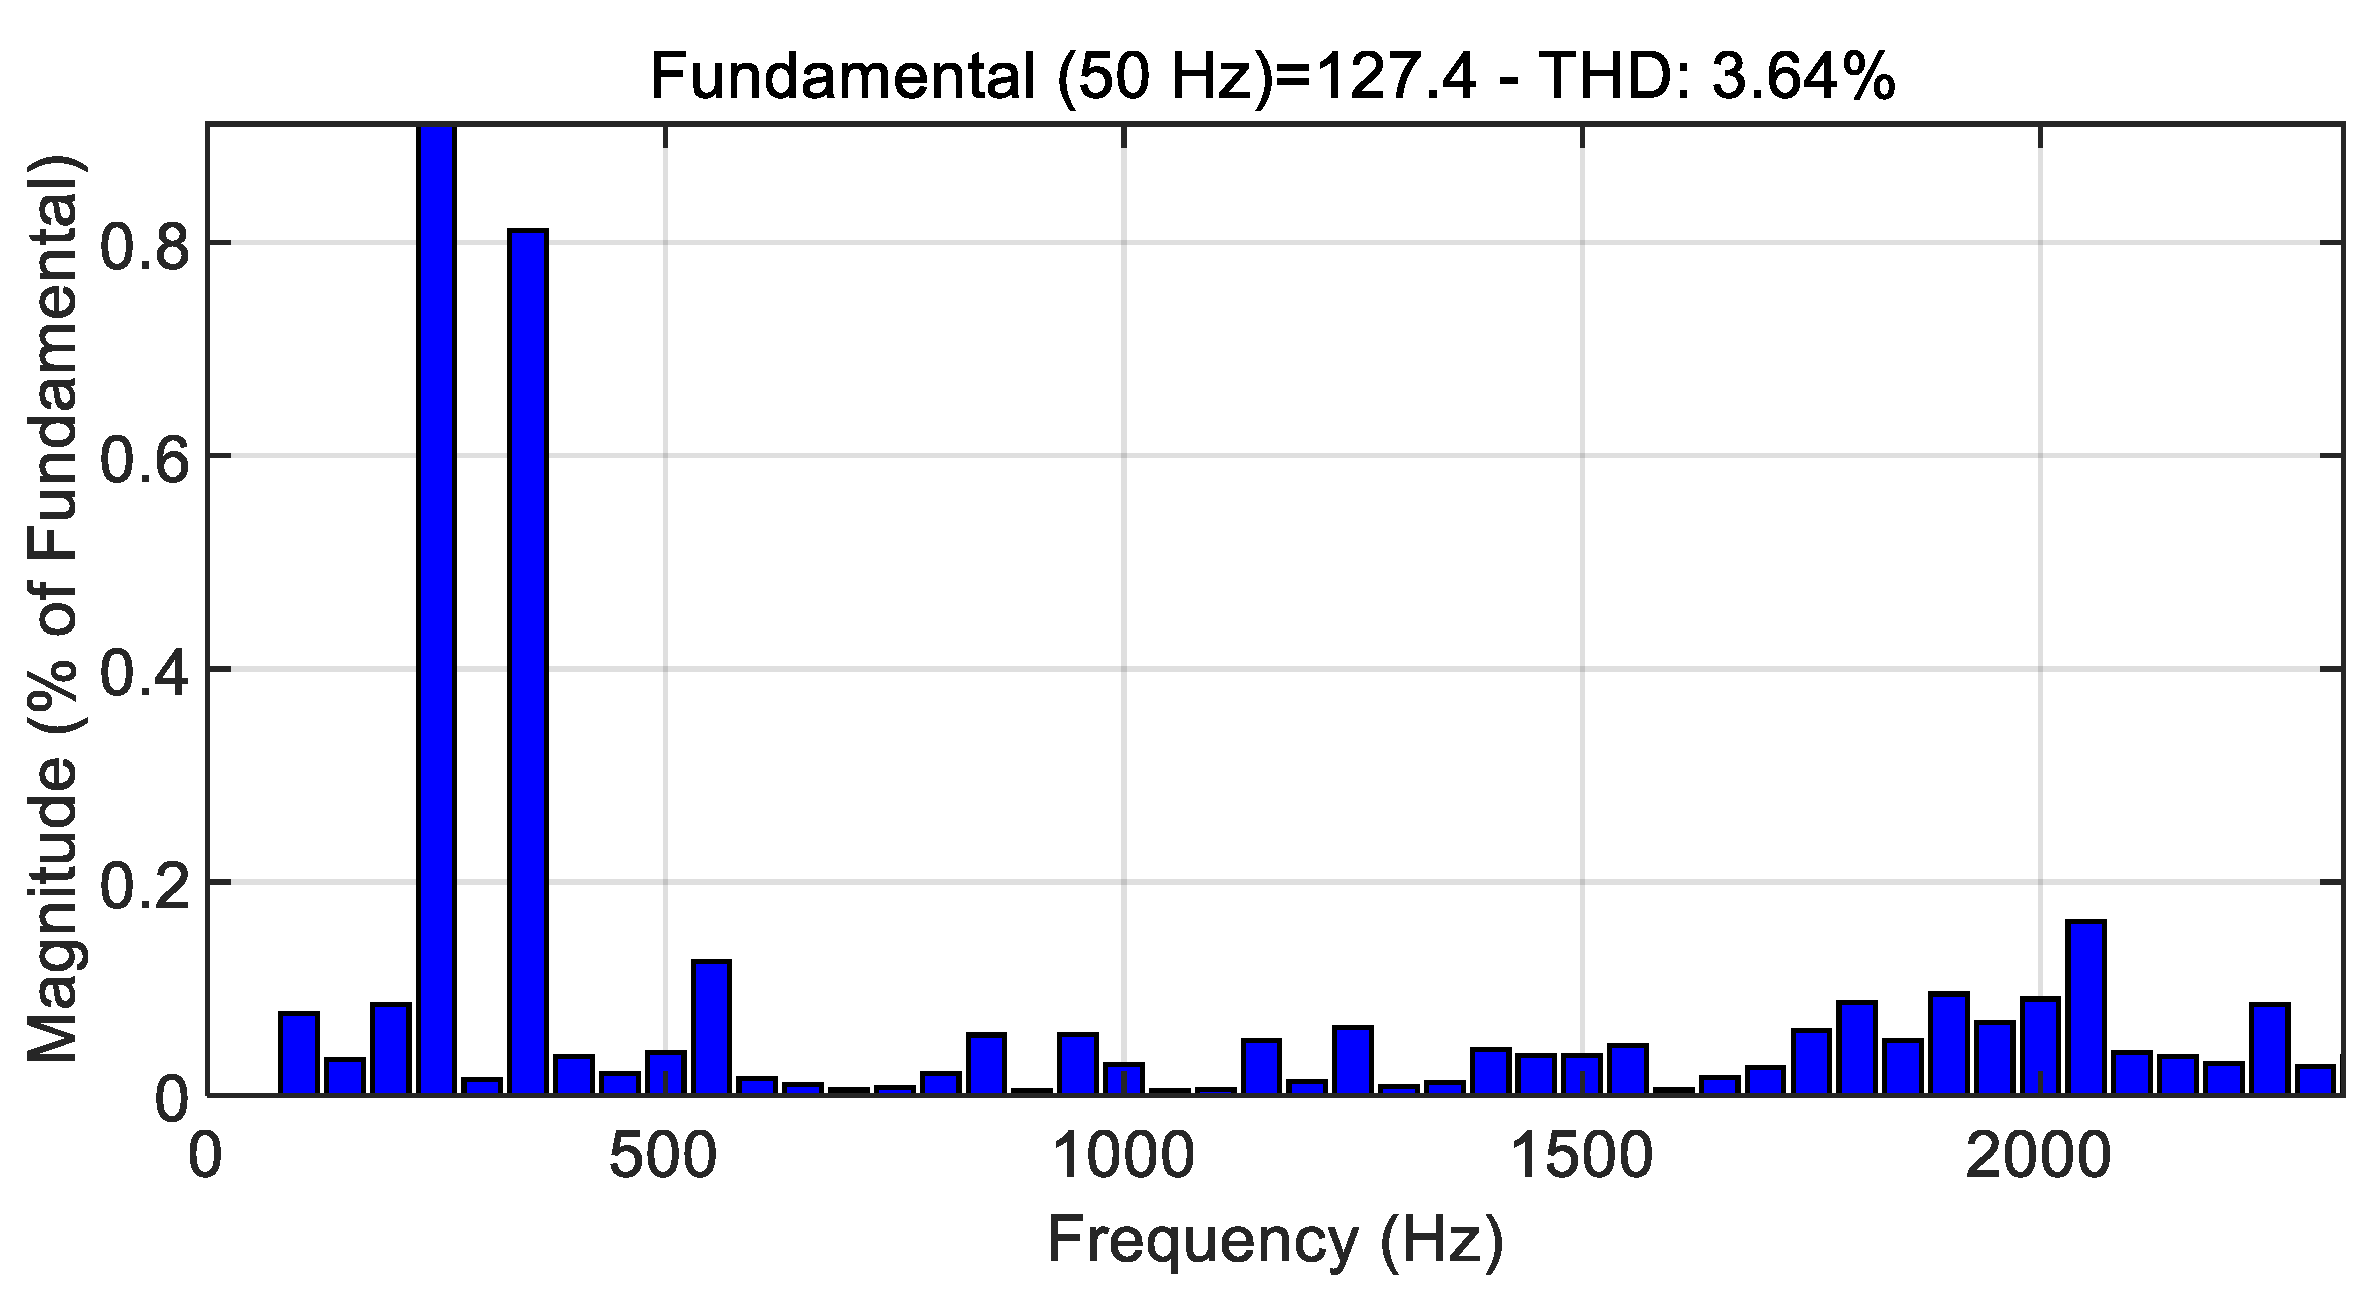
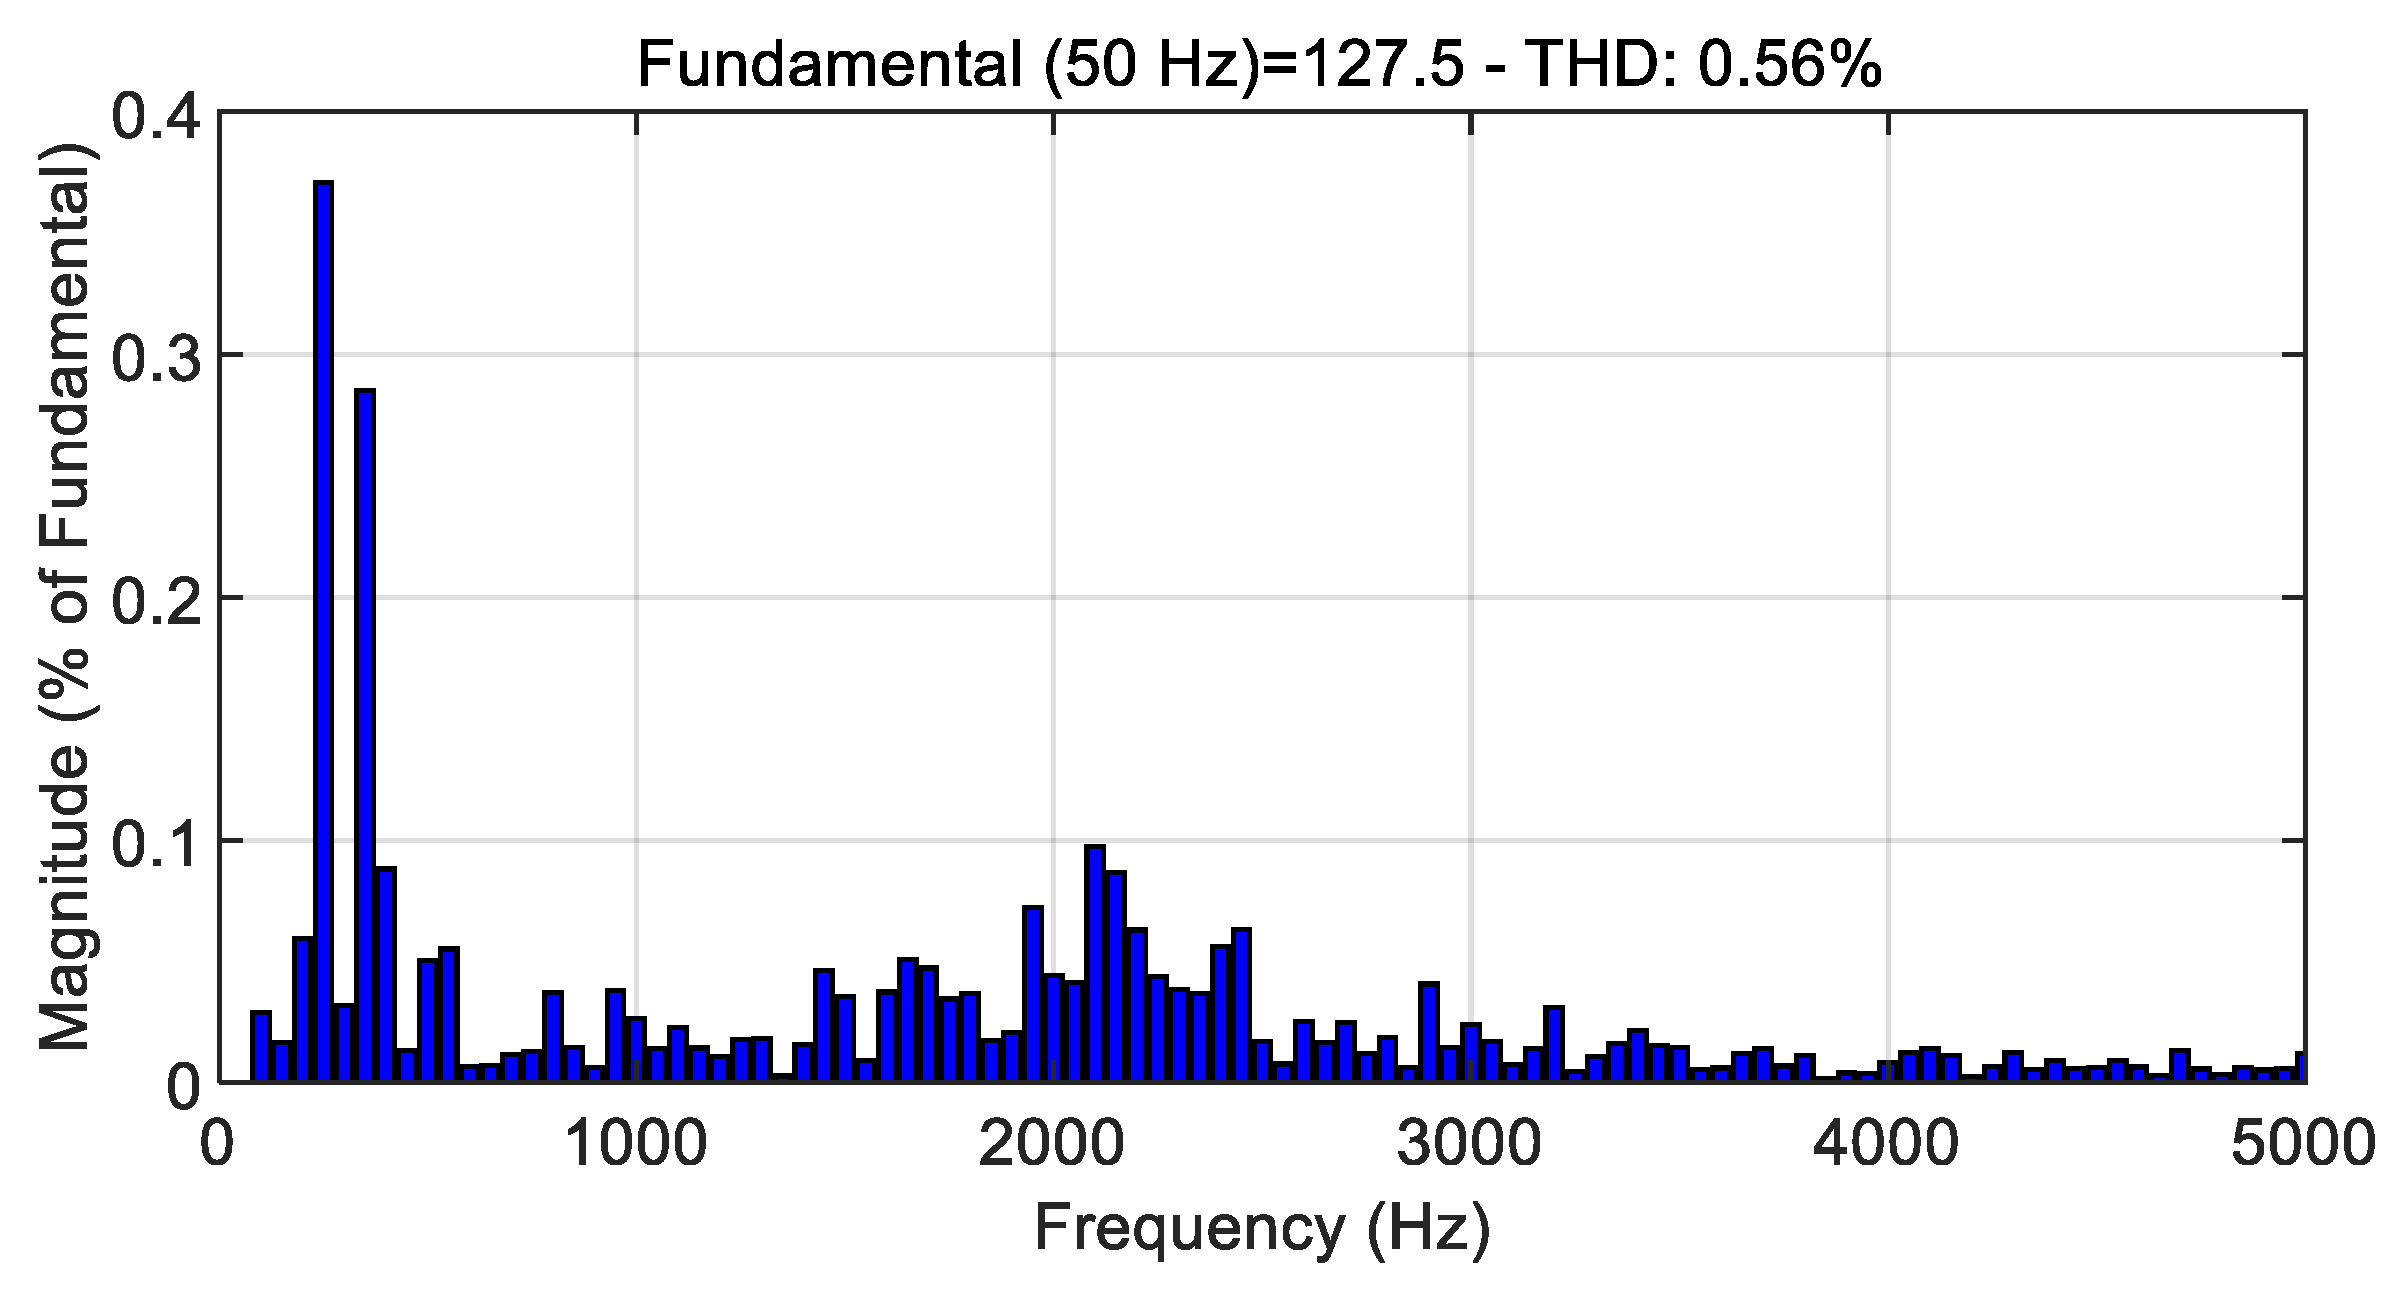
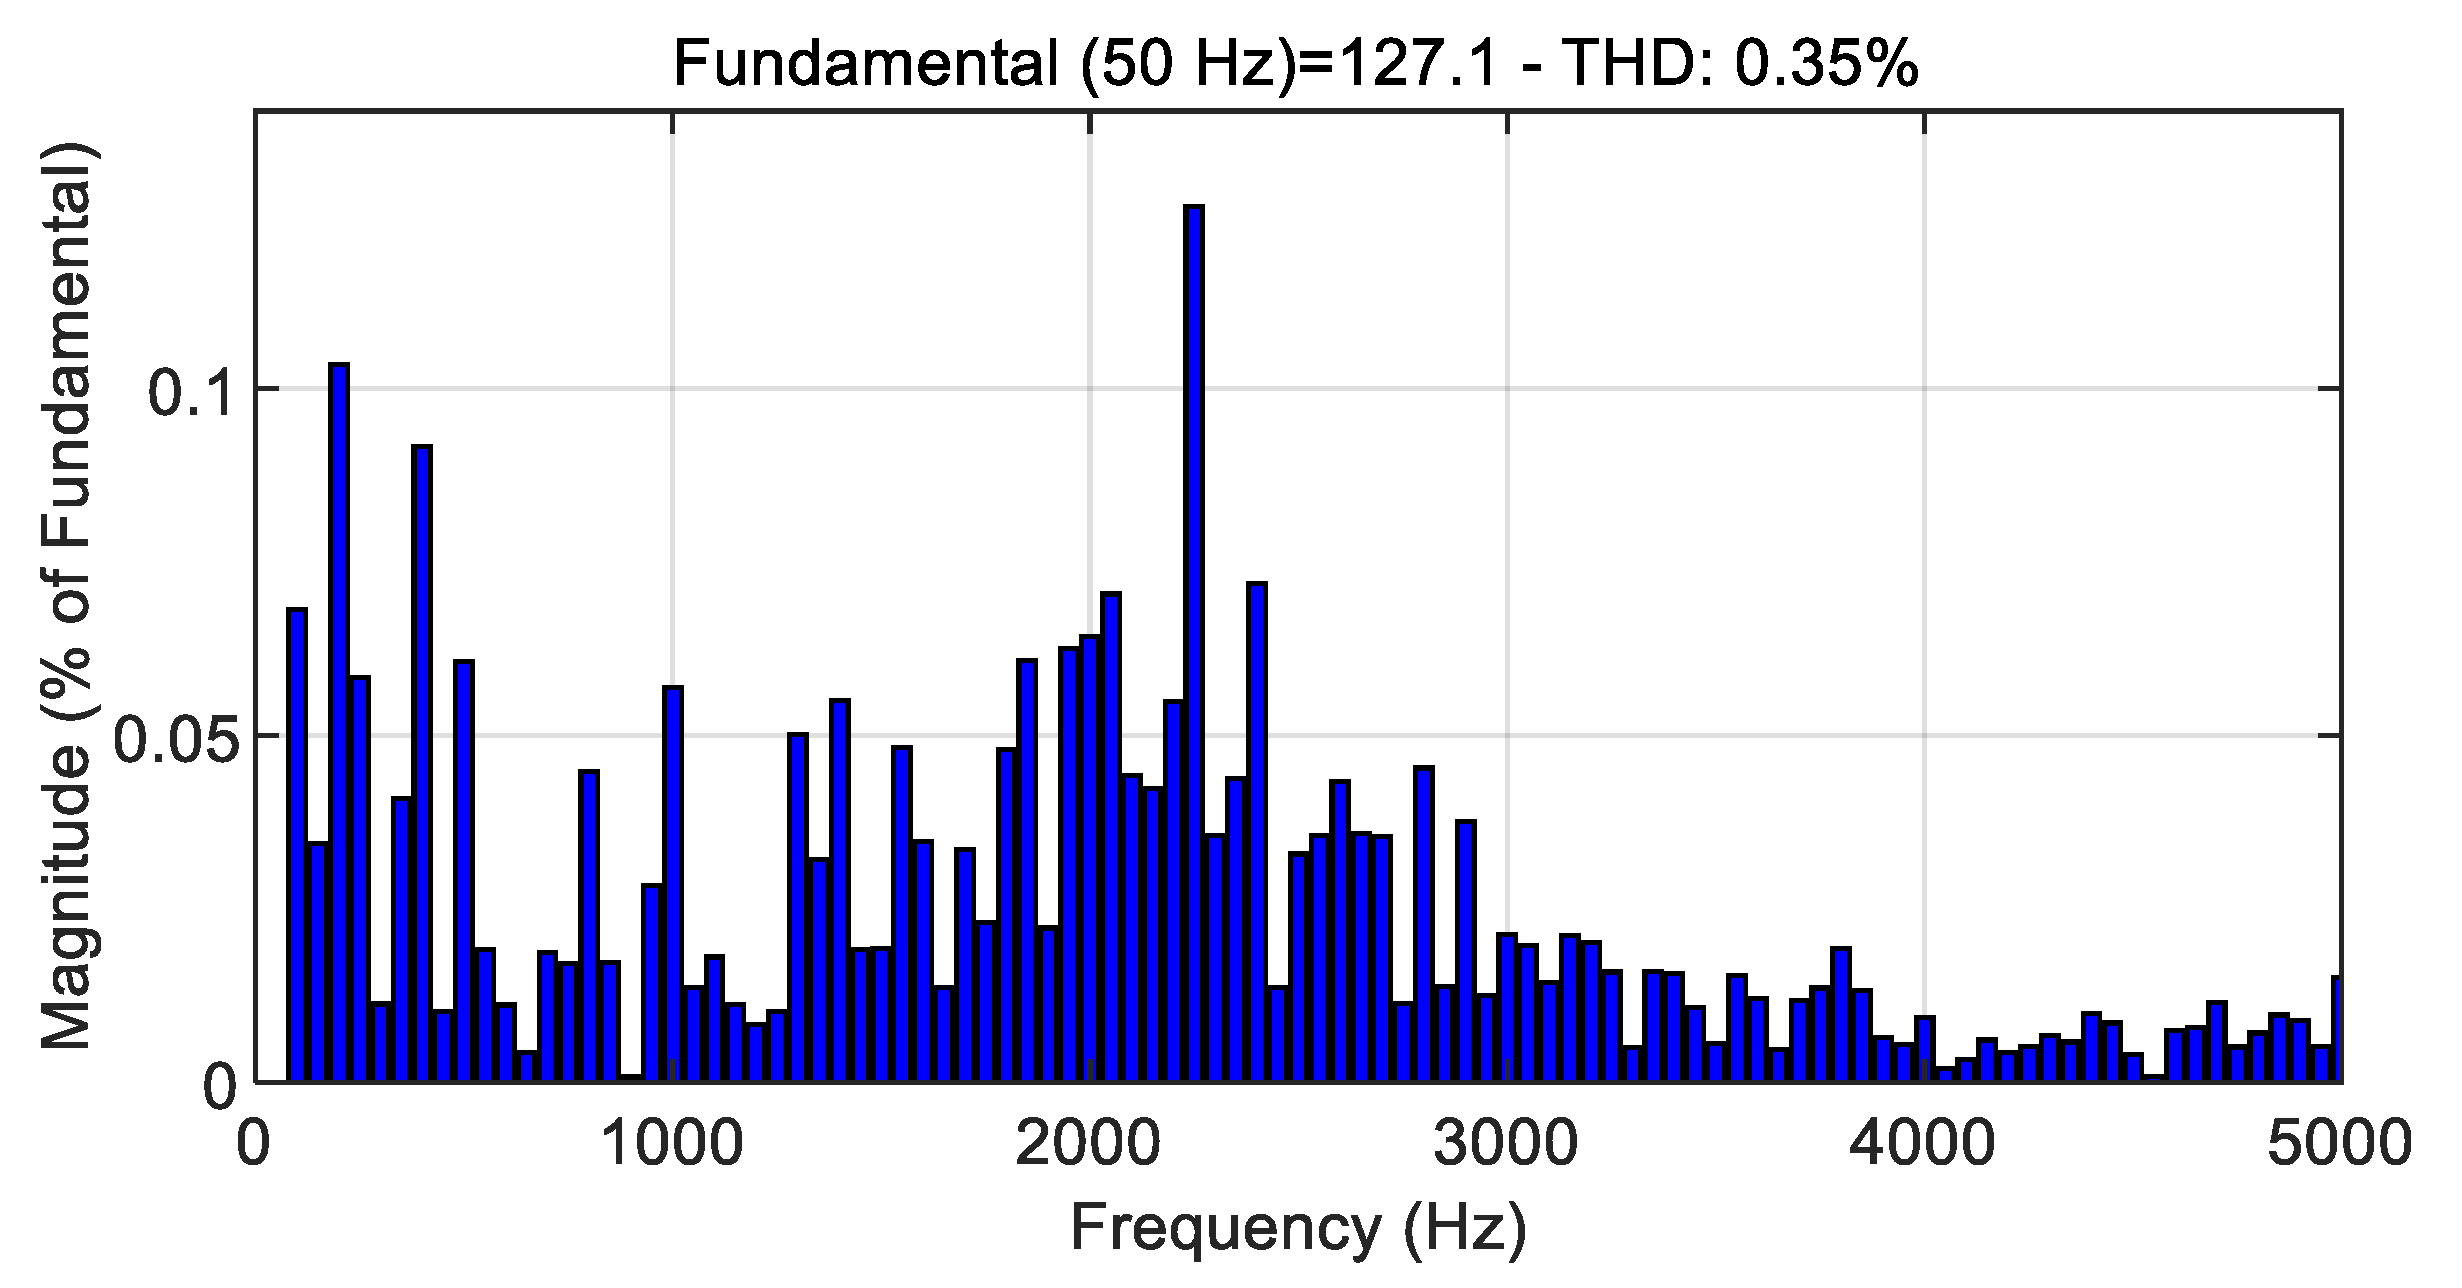
Figure 7. A comprehensive analysis of the power quality metrics was conducted, focusing on the THD distribution of the phase current in this sophisticated three-phase grid-connected hybrid ANPC inverter system. The detailed THD analysis, including the zoomed-in THD visualization, is comprehensively presented in
Figure 8. Through careful measurement and analysis, the THD value of the phase current was precisely determined to be 3.64%, indicating excellent power quality characteristics.
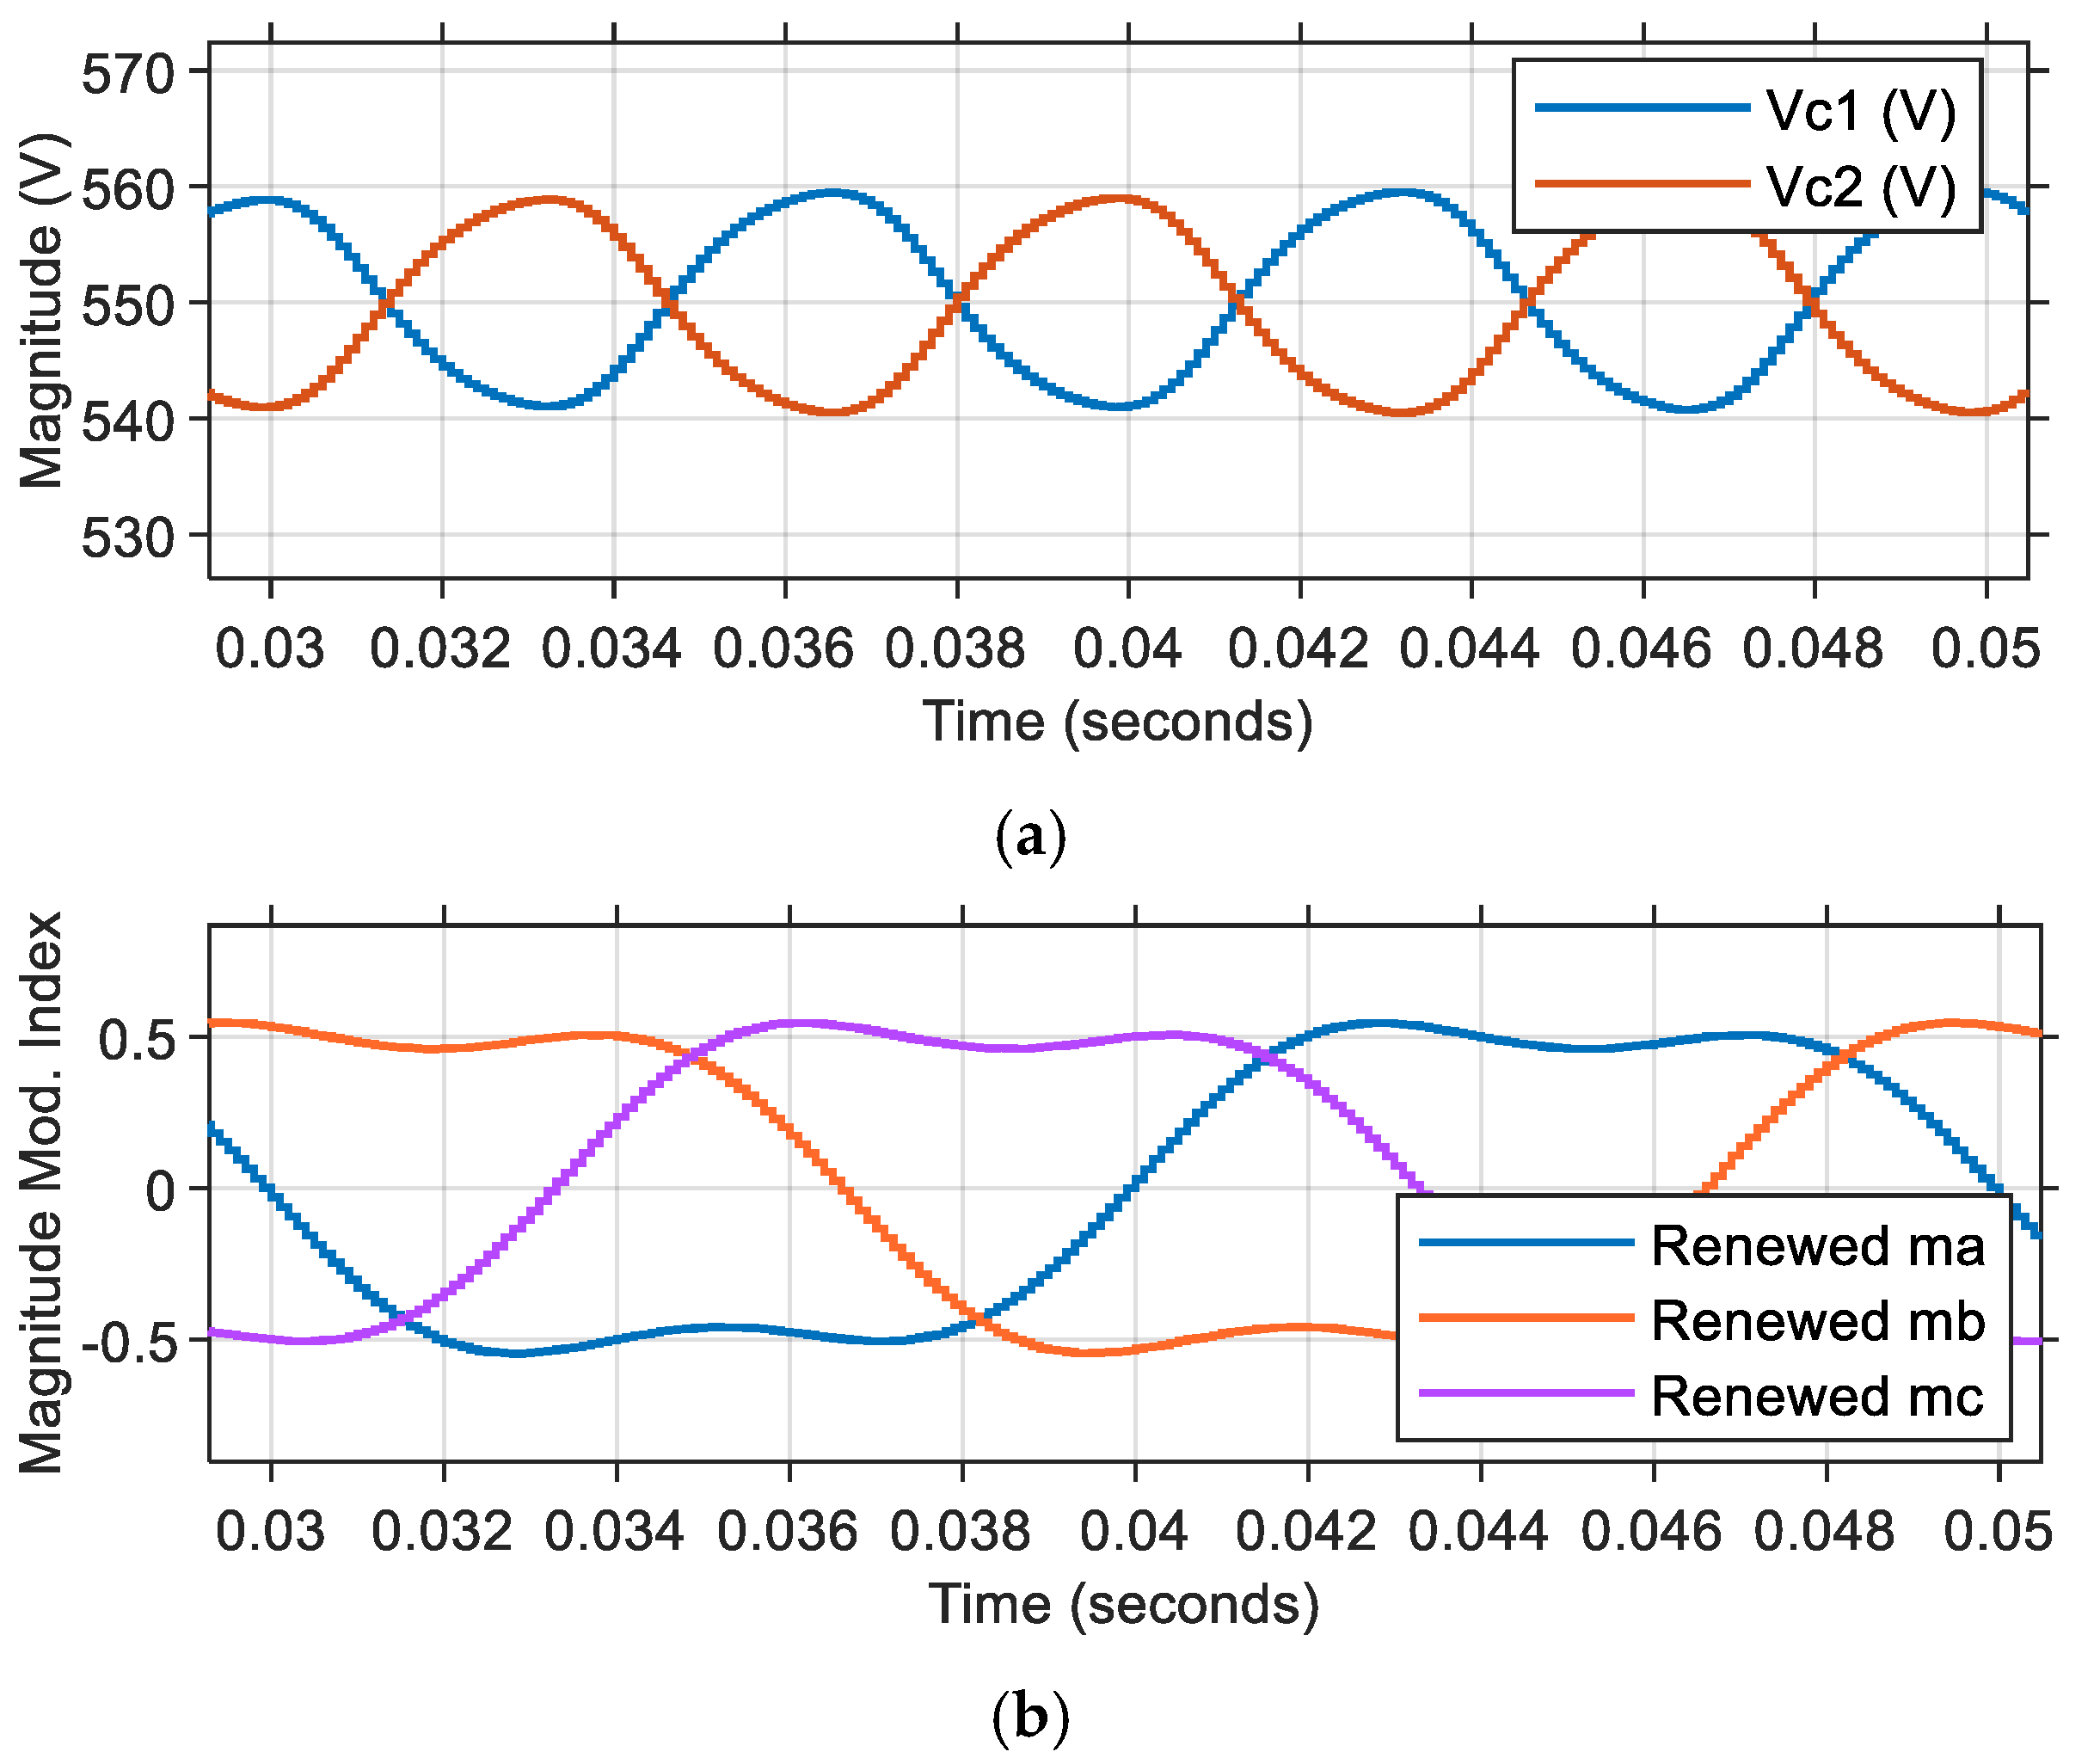
In Scenario-2, a comprehensive test was conducted within a carefully controlled time interval spanning from 0 to 0.05 s. For this particular scenario, the system configuration utilized a PI controller specifically implemented as the voltage equalizing loop controller, while the voltage fluctuation loop controller was deliberately maintained in open-loop configuration. The third-harmonic injection pulse-width modulation (THIPW) technique was selected as the preferred modulation method for this setup, and both capacitors in the system (designated as
and
) were initialized with identical voltage values of 550 V. The detailed simulation results obtained from this system configuration are thoroughly documented and presented in
Figure 9,
Figure 10 and
Figure 11. During the execution of Scenario-2, several significant performance metrics were carefully monitored and analyzed. The capacitor voltage demonstrated a settling time of precisely 0.045 s, after which the steady-state average capacitor voltage consistently maintained its initial value of 550 V throughout the test duration. A further analysis revealed that the voltage fluctuation characteristics exhibited a peak-to-peak magnitude of 18 V, occurring at a consistent frequency of 150 Hz. The comprehensive analysis of the system’s power quality metrics, particularly focusing on the THD distribution of the phase current in this hybrid ANPC inverter system, is extensively documented in
Figure 11. The measurements indicate an exceptionally low THD value for the phase current, specifically calculated to be 0.56%, demonstrating the high quality of the power output.
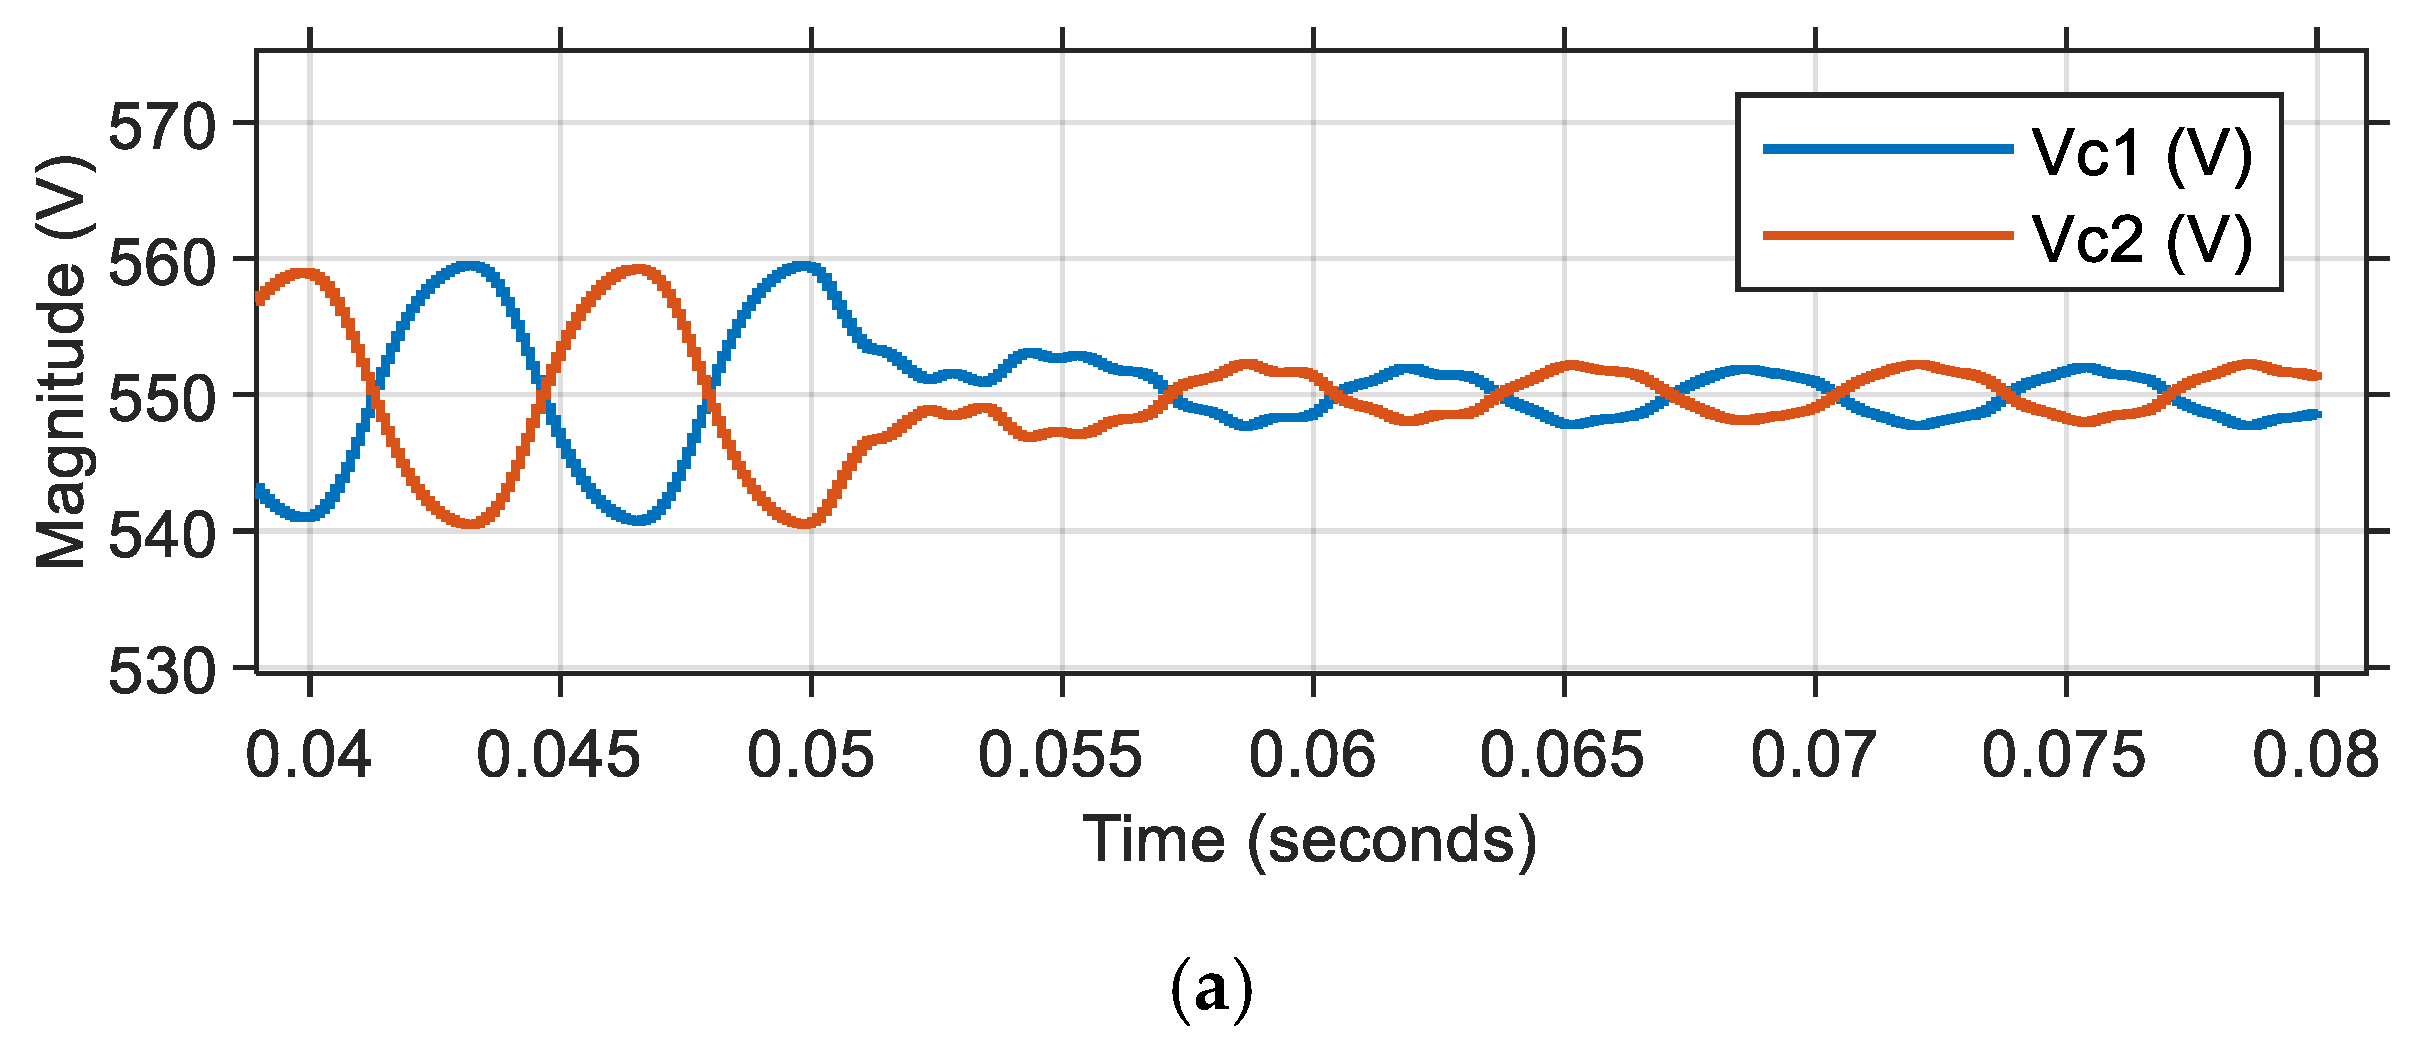
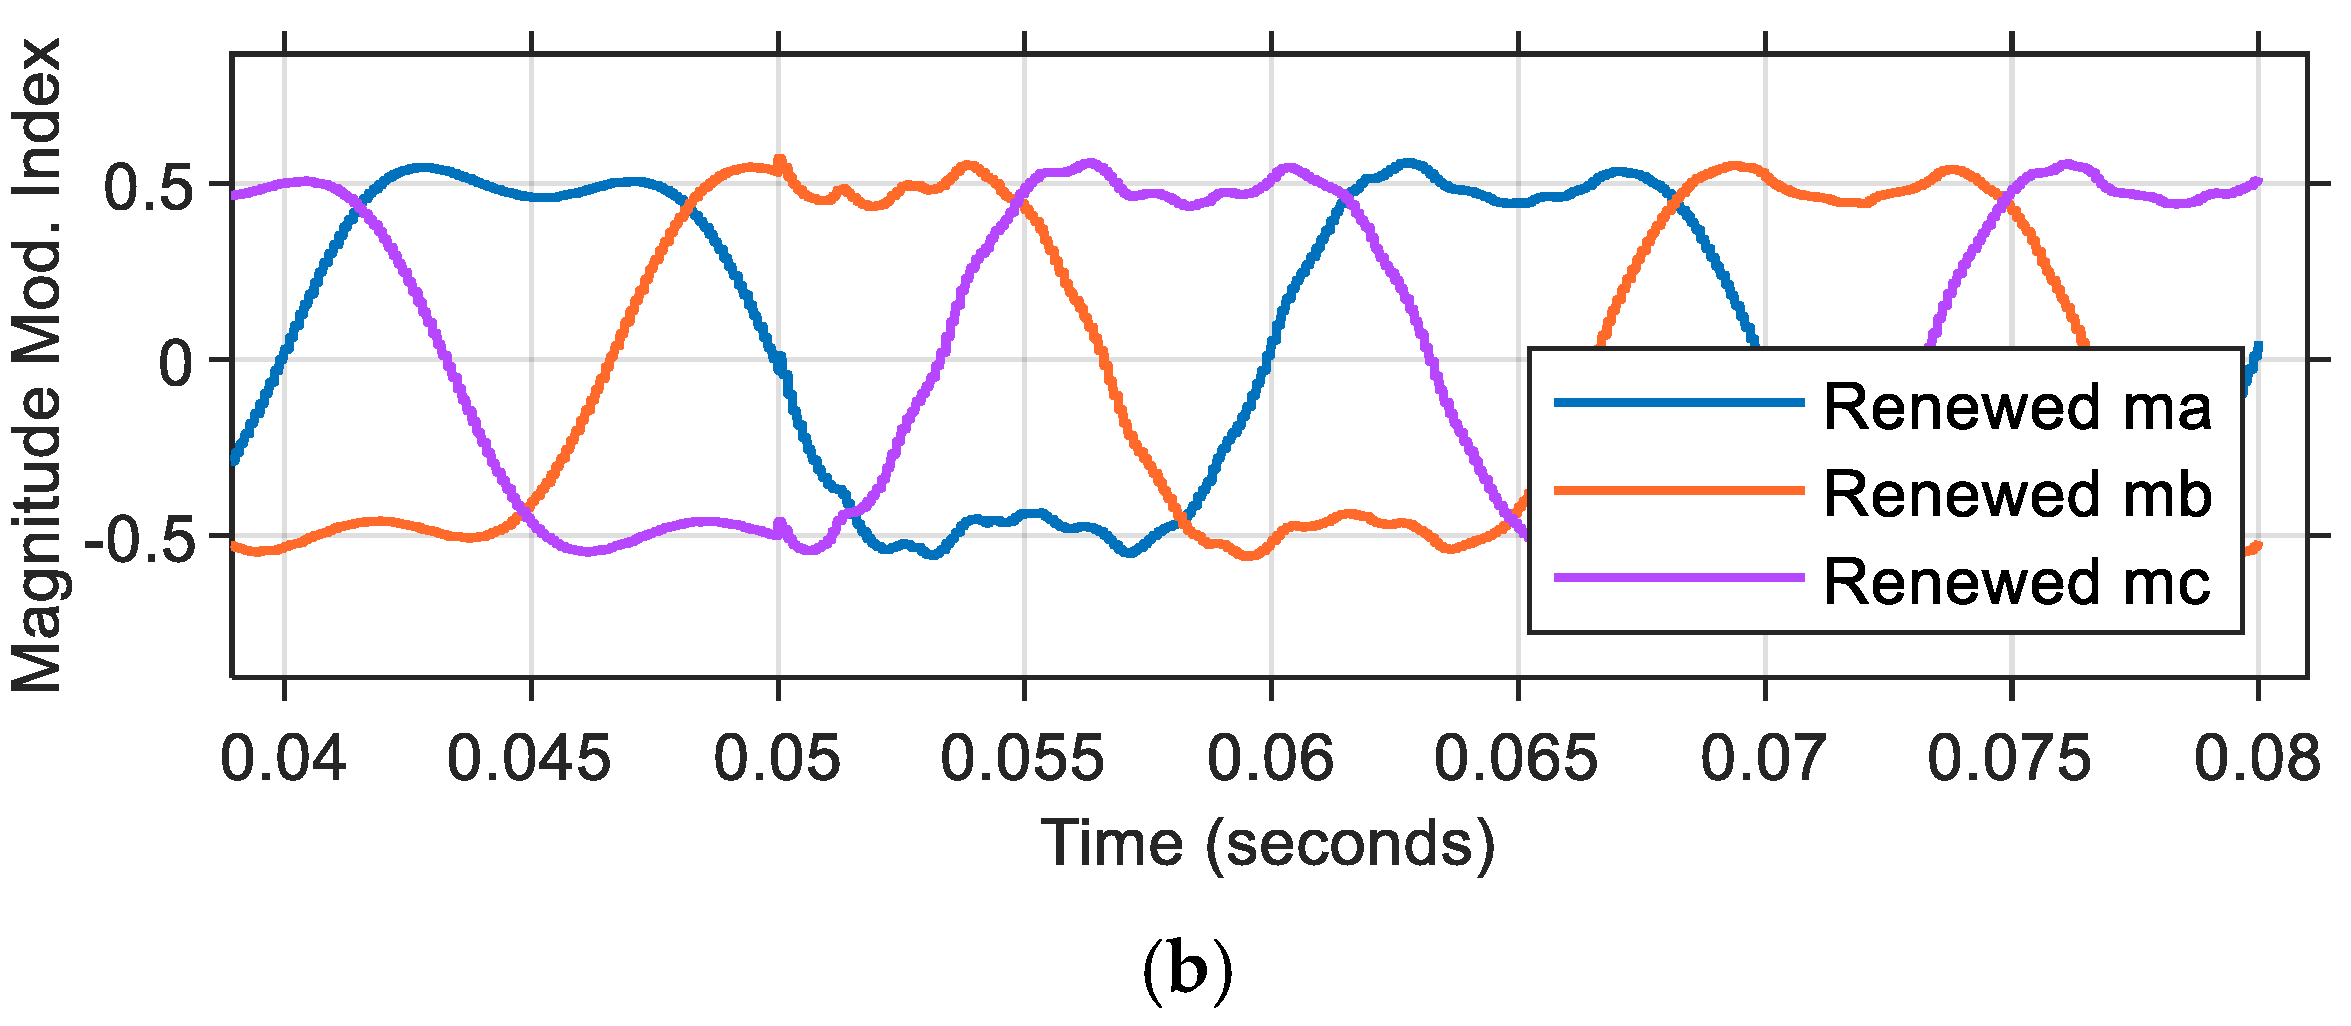
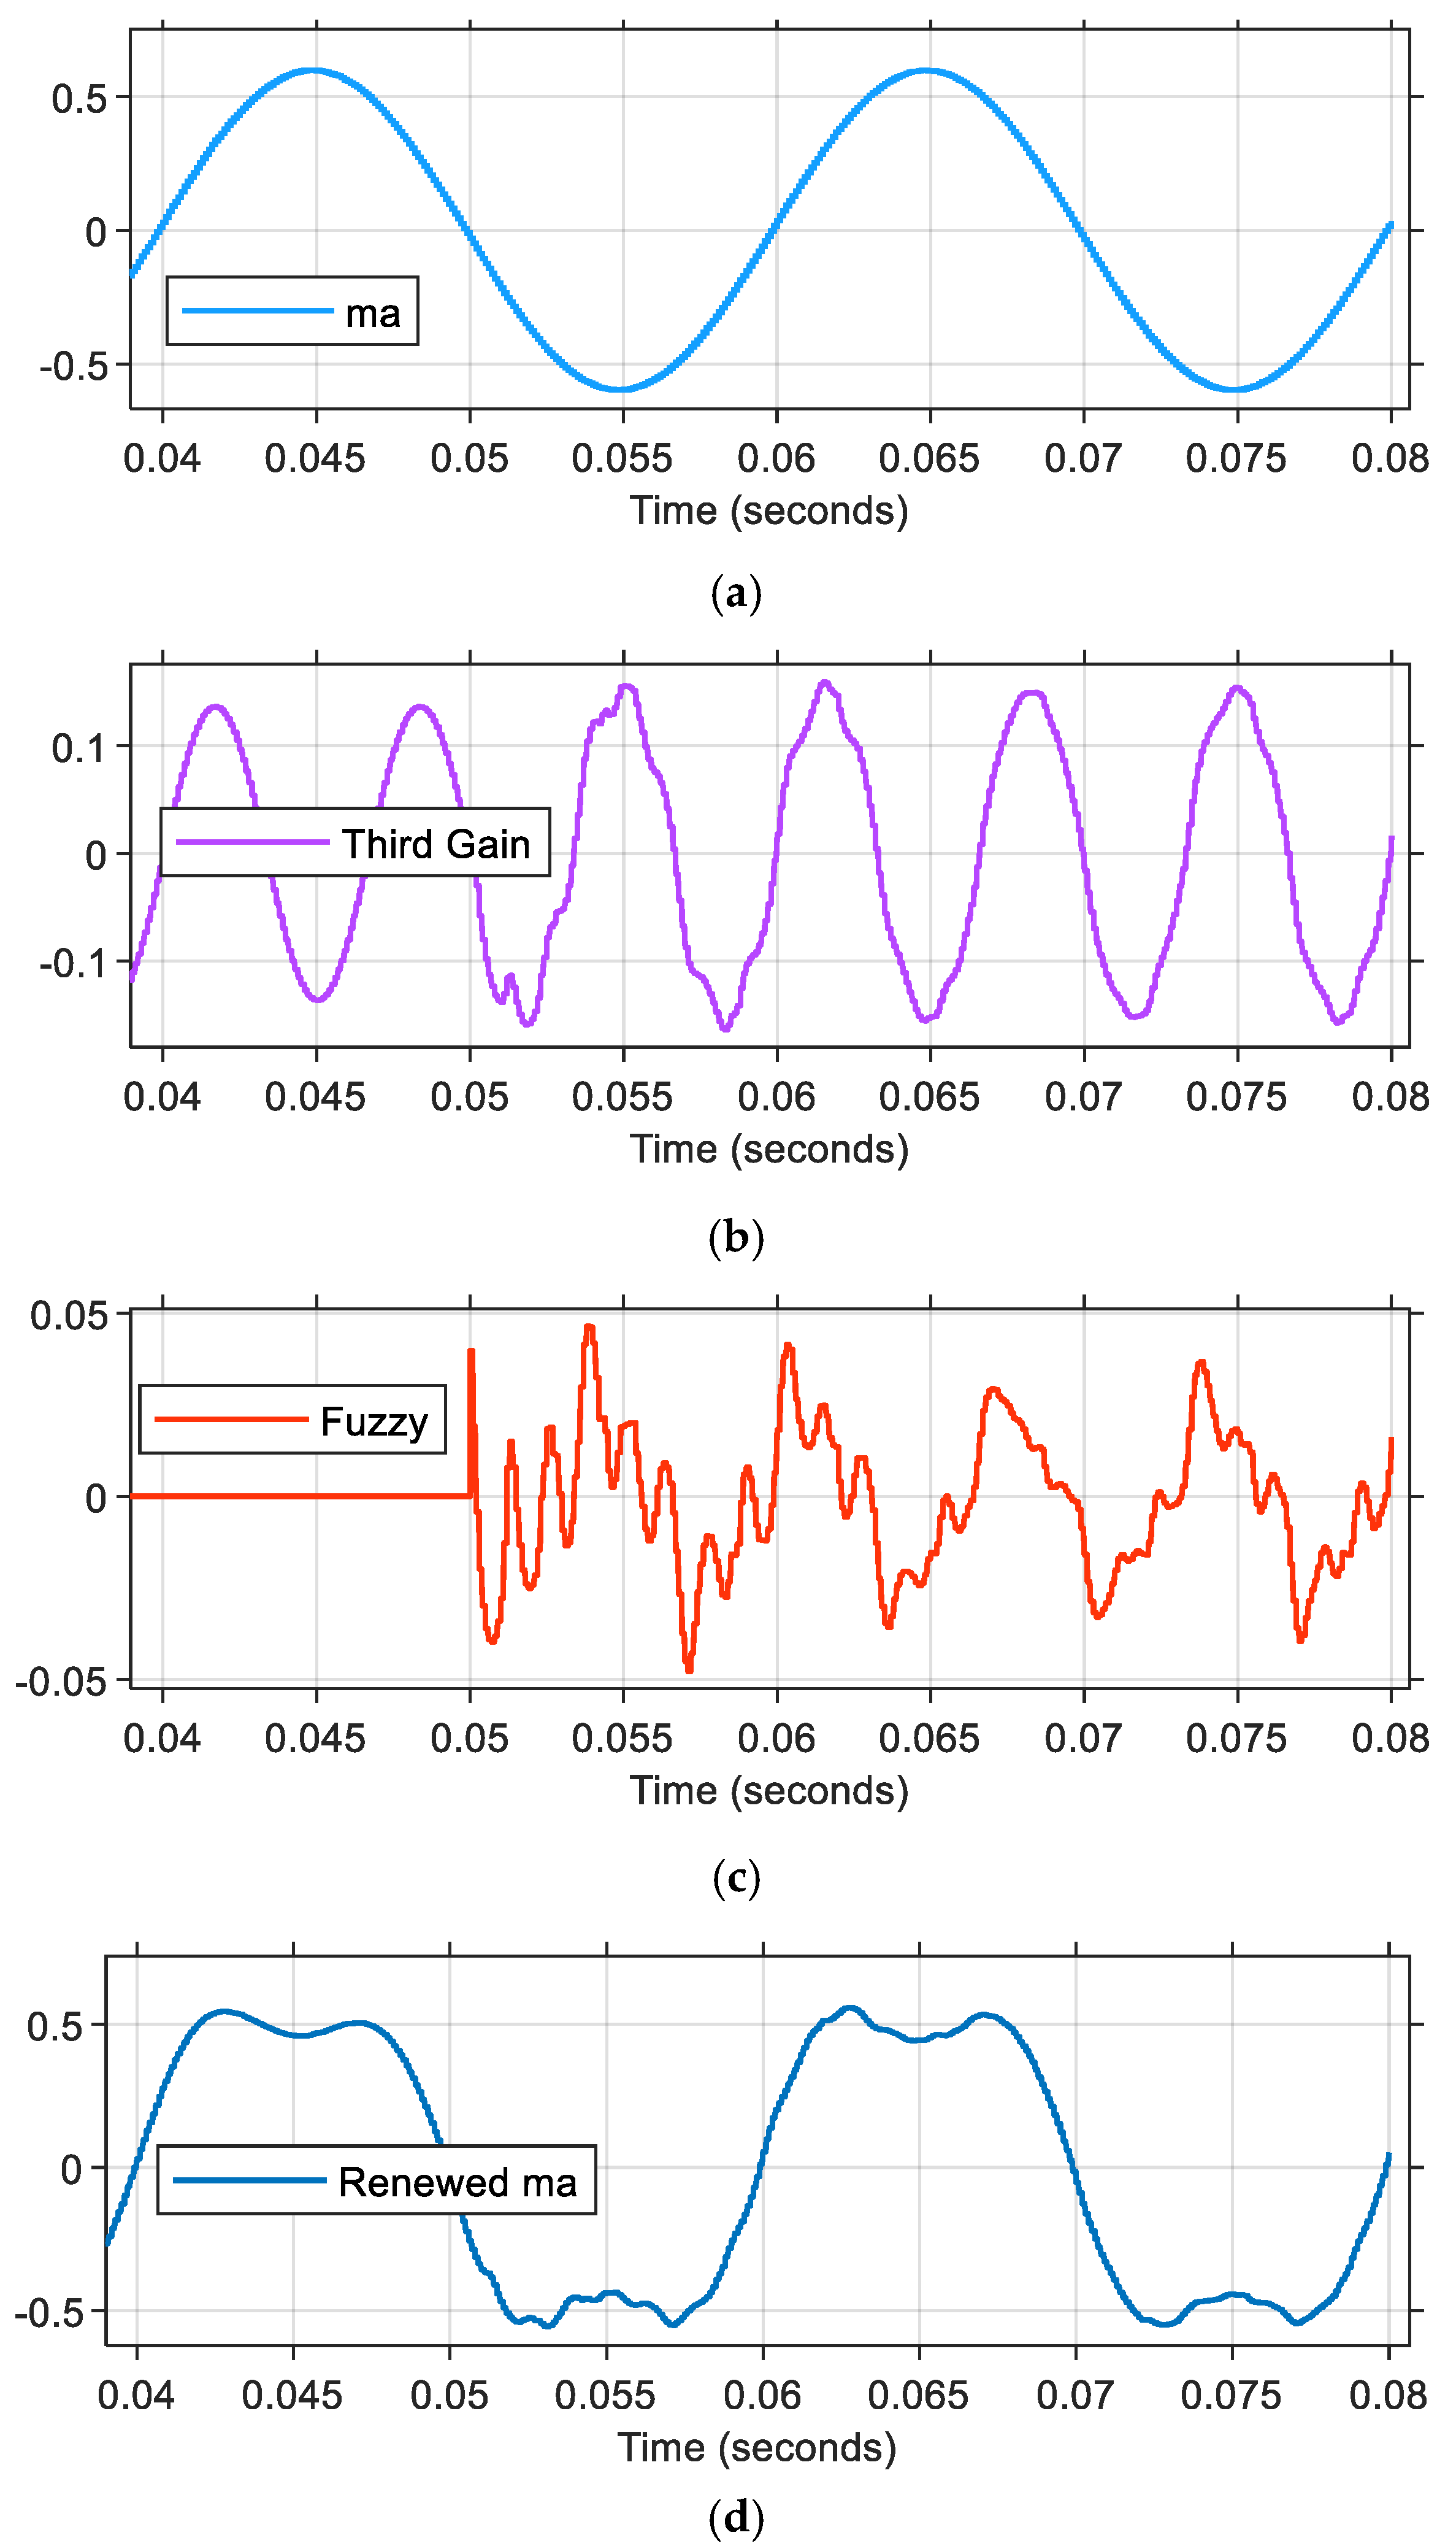
In Scenario-3, a comprehensive test was conducted within a precisely defined time interval spanning from 0 to 0.08 s. The simulation was strategically divided into two distinct phases of operation. During the initial phase, which encompassed the time interval from t = 0 to 0.05 s, the voltage fluctuation loop controller was configured to operate in open-loop mode. This was followed by a transition to the second phase, occurring in the interval from t = 0.05 to 0.08 s, during which a sophisticated fuzzy logic controller was implemented for managing voltage fluctuation control. Throughout the entire testing period, several key parameters were maintained to be constant to ensure simulation consistency. Specifically, the voltage equalization loop controller settings, the employed modulation technique, and the initial voltage values assigned to both capacitors (designated as
and
) were kept identical to those utilized in Scenario-3. The comprehensive simulation results obtained from this simulation configuration were thoroughly documented and are presented in detail through
Figure 12,
Figure 13 and
Figure 14. Some numerical results obtained from the conducted studies are presented in
Table 5.
3.2. Experimental Results
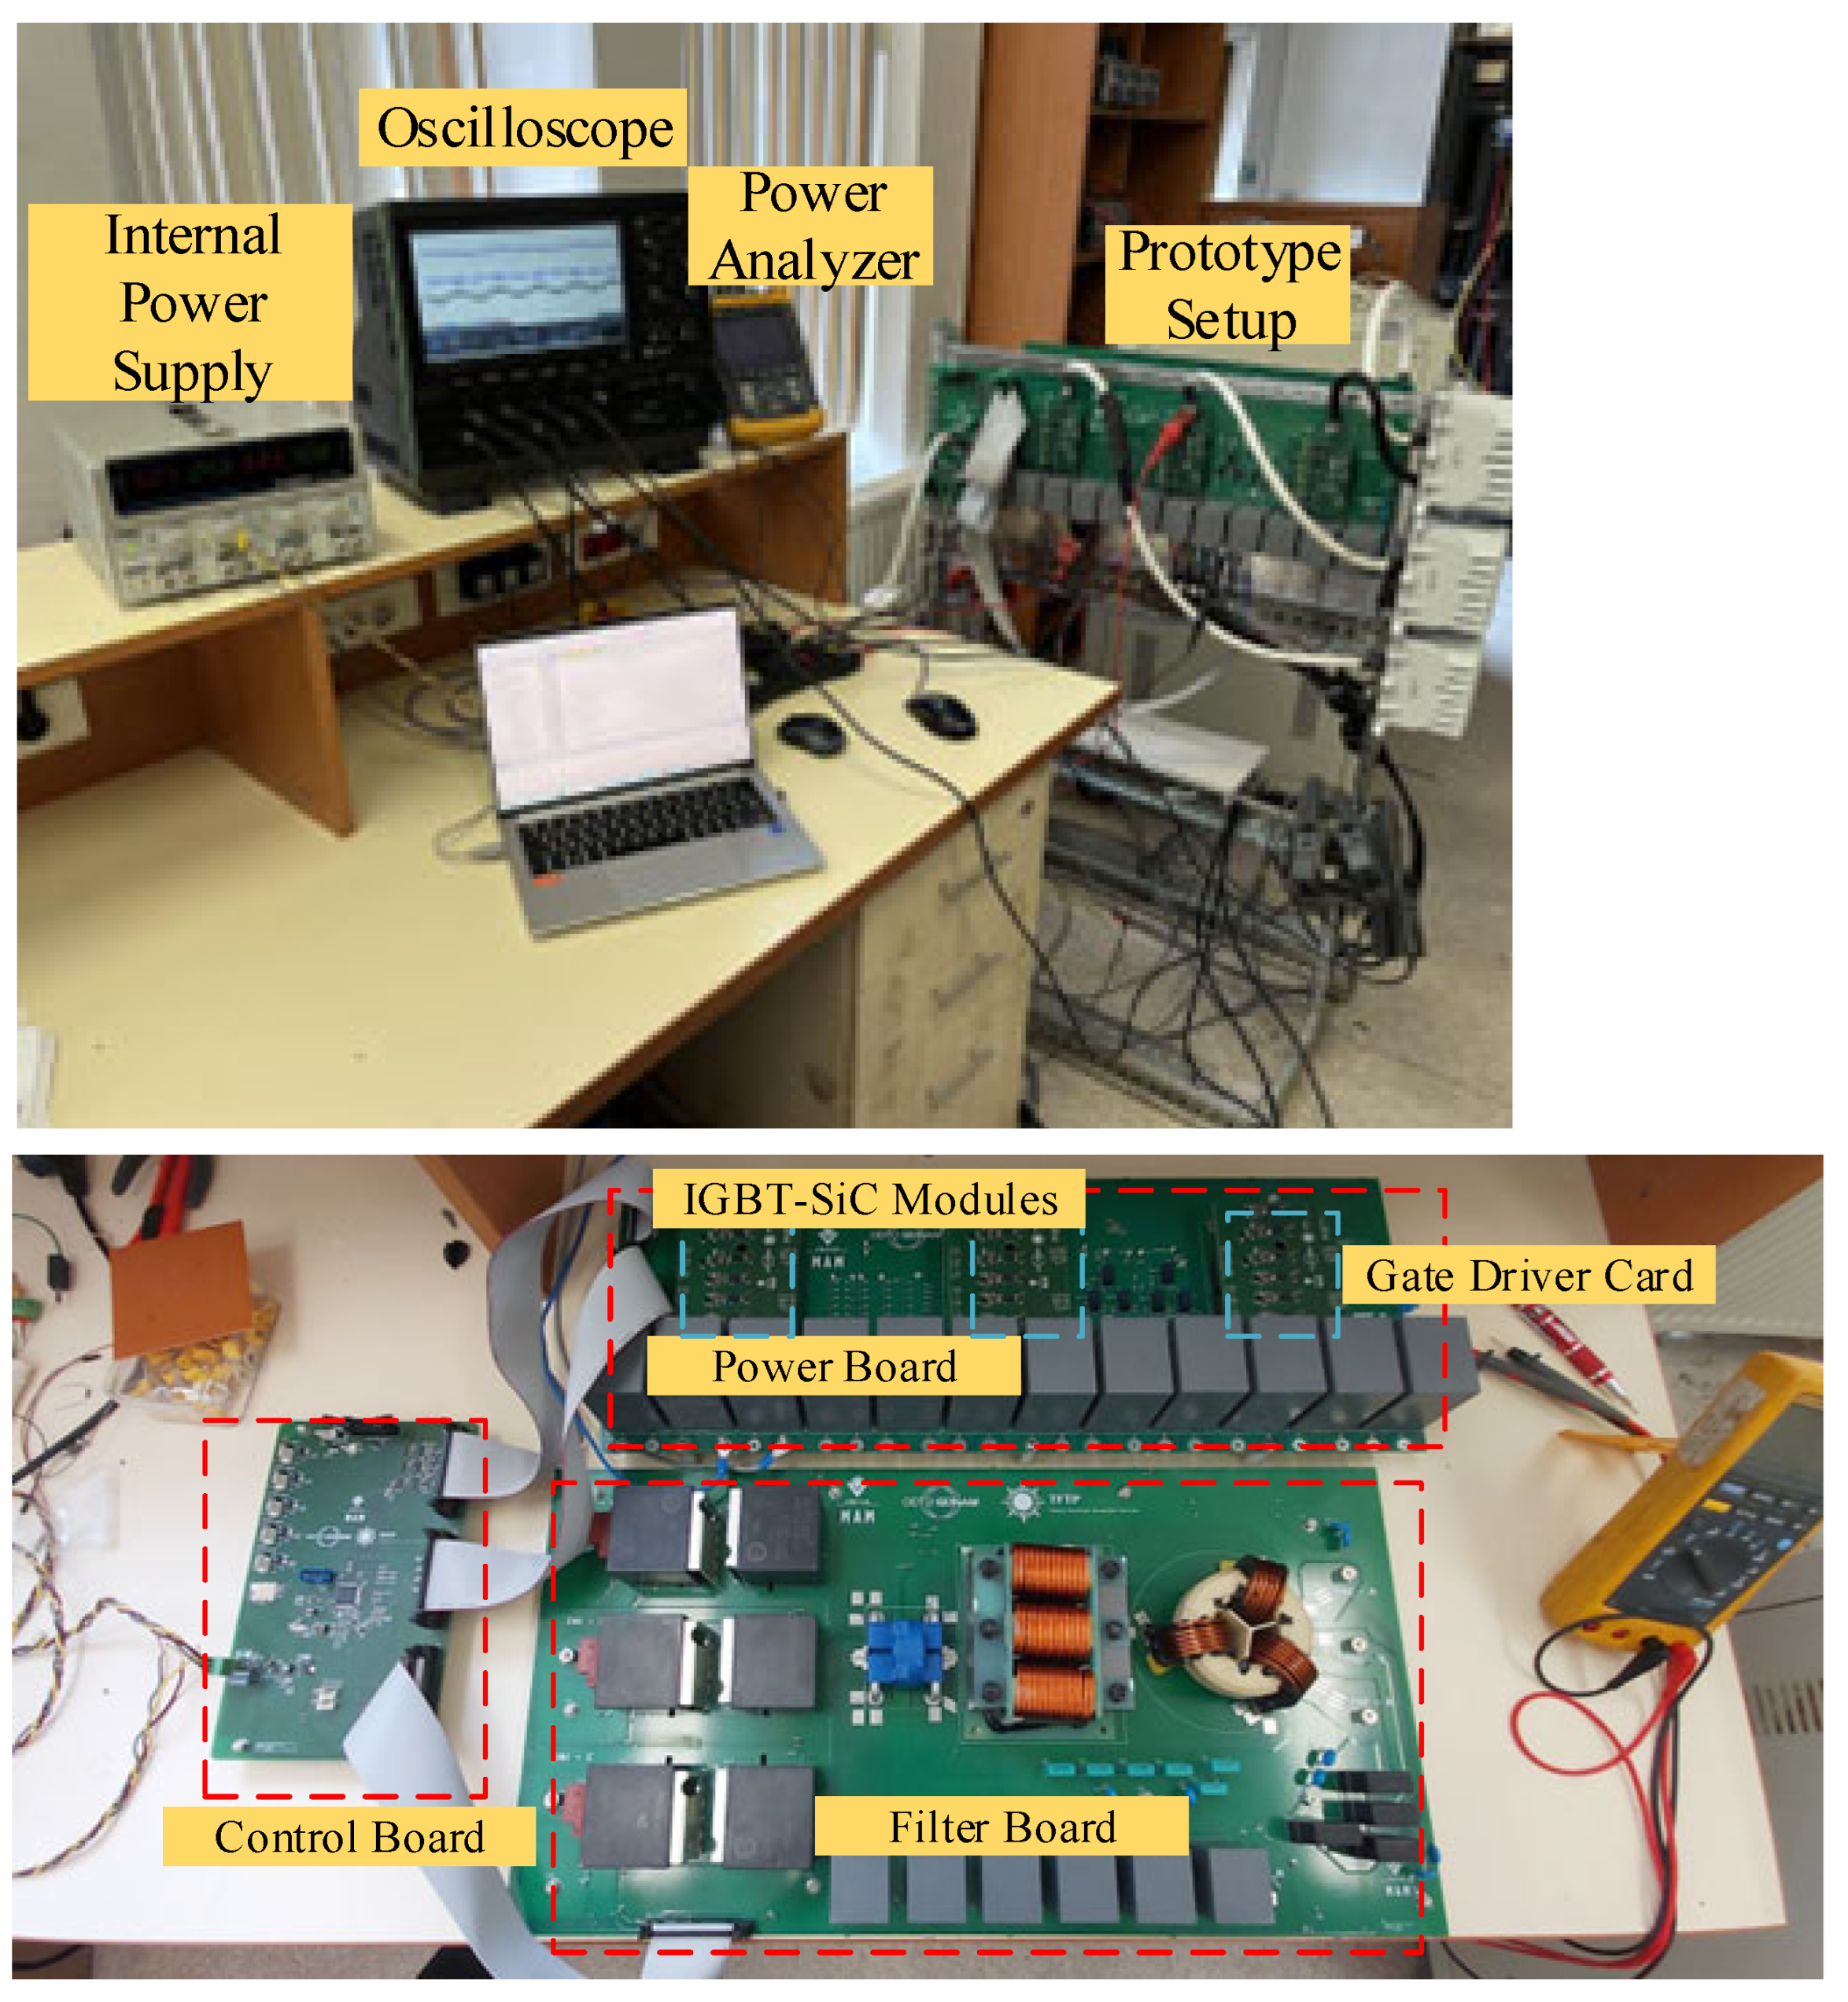
To validate the proposed advanced control technique, a laboratory prototype with a rated power of 62.5 kW was developed, mirroring the simulation setup. The parameters used for both simulation and experimental studies are presented in
Table 3. Experimental conditions were replicated in the simulation environment as closely as possible; however, due to the grid-connected nature of the experimental tests, an exact real-time grid model could not be implemented in simulations. As a result, low-order voltage harmonics present in the actual grid led to slight discrepancies in THD measurements between the simulation and experimental results. Nevertheless, DC-link voltage ripple characteristics exhibited strong agreement between the two approaches.
The laboratory prototype used in the experimental study is illustrated in
Figure 15, comprising the following
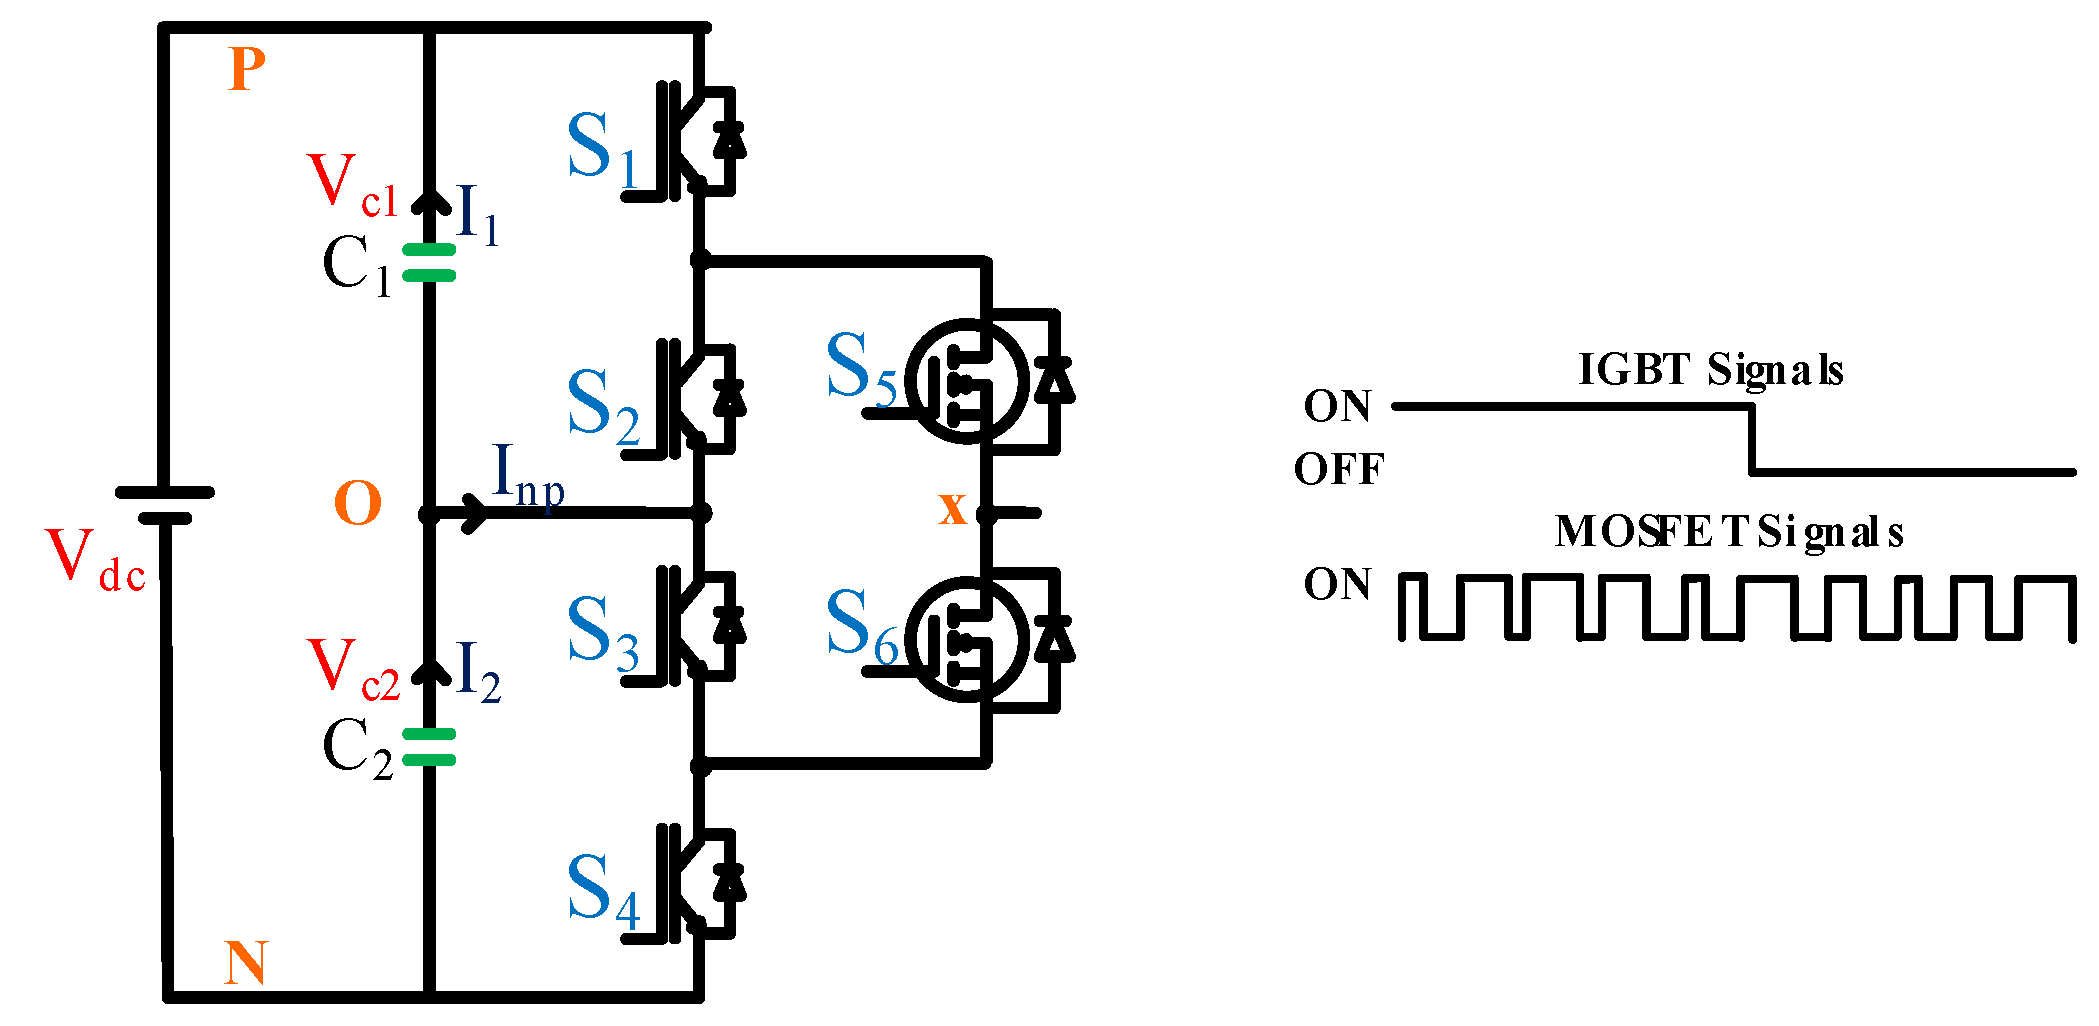
Power board: Features three “Vincotech B0-SP12NAA008ME01-LR88F78T” hybrid ANPC modules for the proposed topology, DC bus voltage measurement, and phase current routing.
Control board: Hosts an STM32H723 550 MHz microcontroller for PWM signal generation, closed-loop control, cooling fan management, and analog measurements. Two DAC outputs enable real-time algorithm monitoring via an oscilloscope. The modulation index signals visible in the screen captures are acquired from the digital signal processor’s (DSP) digital-to-analog converter (DAC) output. These reference signals, which inherently vary between +1 and −1 in their normalized form, have been strategically scaled to a 0–3 V range through a linear transformation process. This scaling ensures optimal signal representation, with the zero-crossing point (x-axis) precisely aligned at the 1.5 V level, corresponding to the midpoint of the output range.
Driver board: Amplifies gate signals to drive the ANPC module’s IGBTs and SiC MOSFETs.
Filter board: Attenuates high-frequency switching noise and provides overcurrent protection.
A Fluke power analyzer is used to measure the THD of the phase current.
Three distinct experimental scenarios were designed and implemented to validate the theoretical framework. These scenarios are systematically presented in
Table 6.
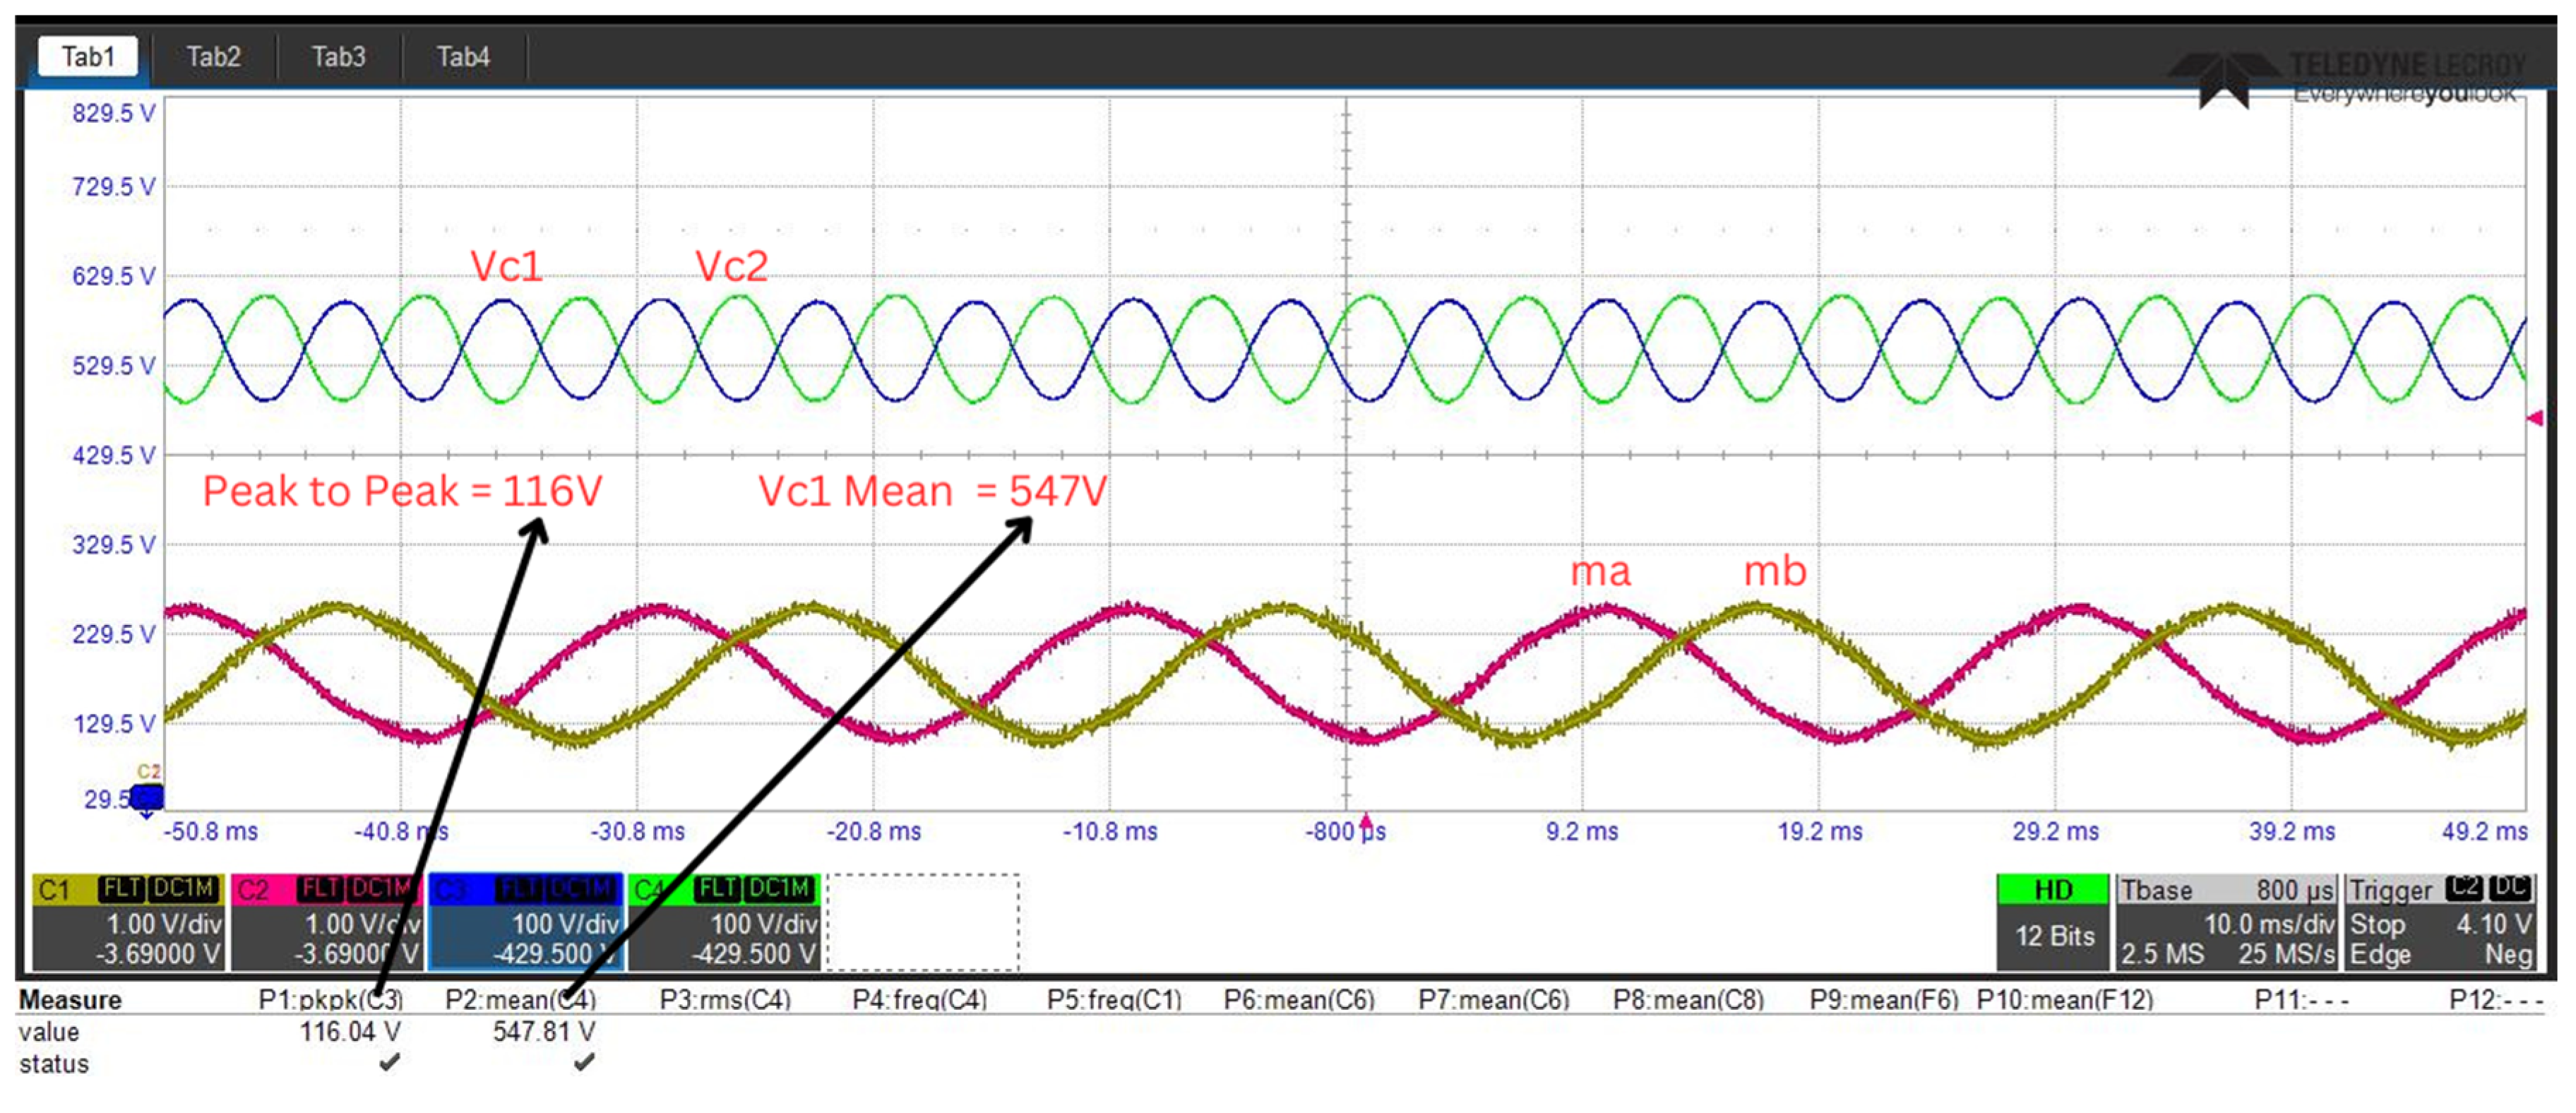
To analyze the control of the 150 Hz fluctuation in the dc-link capacitor voltage, three different experimental studies were conducted. In the first scenario, no control was applied for this oscillation. In the second scenario, an open-loop controller was designed using the THIPWM method. Finally, in the third scenario, a closed-loop FLC was designed. Under the first experimental configuration (Scenario 1), the voltage equalization control loop was maintained in an active operational state, while the voltage fluctuation suppression loop was deliberately deactivated for the duration of the testing period. The voltage balancing mechanism was governed exclusively by a PI control architecture to ensure precise voltage regulation across the capacitive elements.
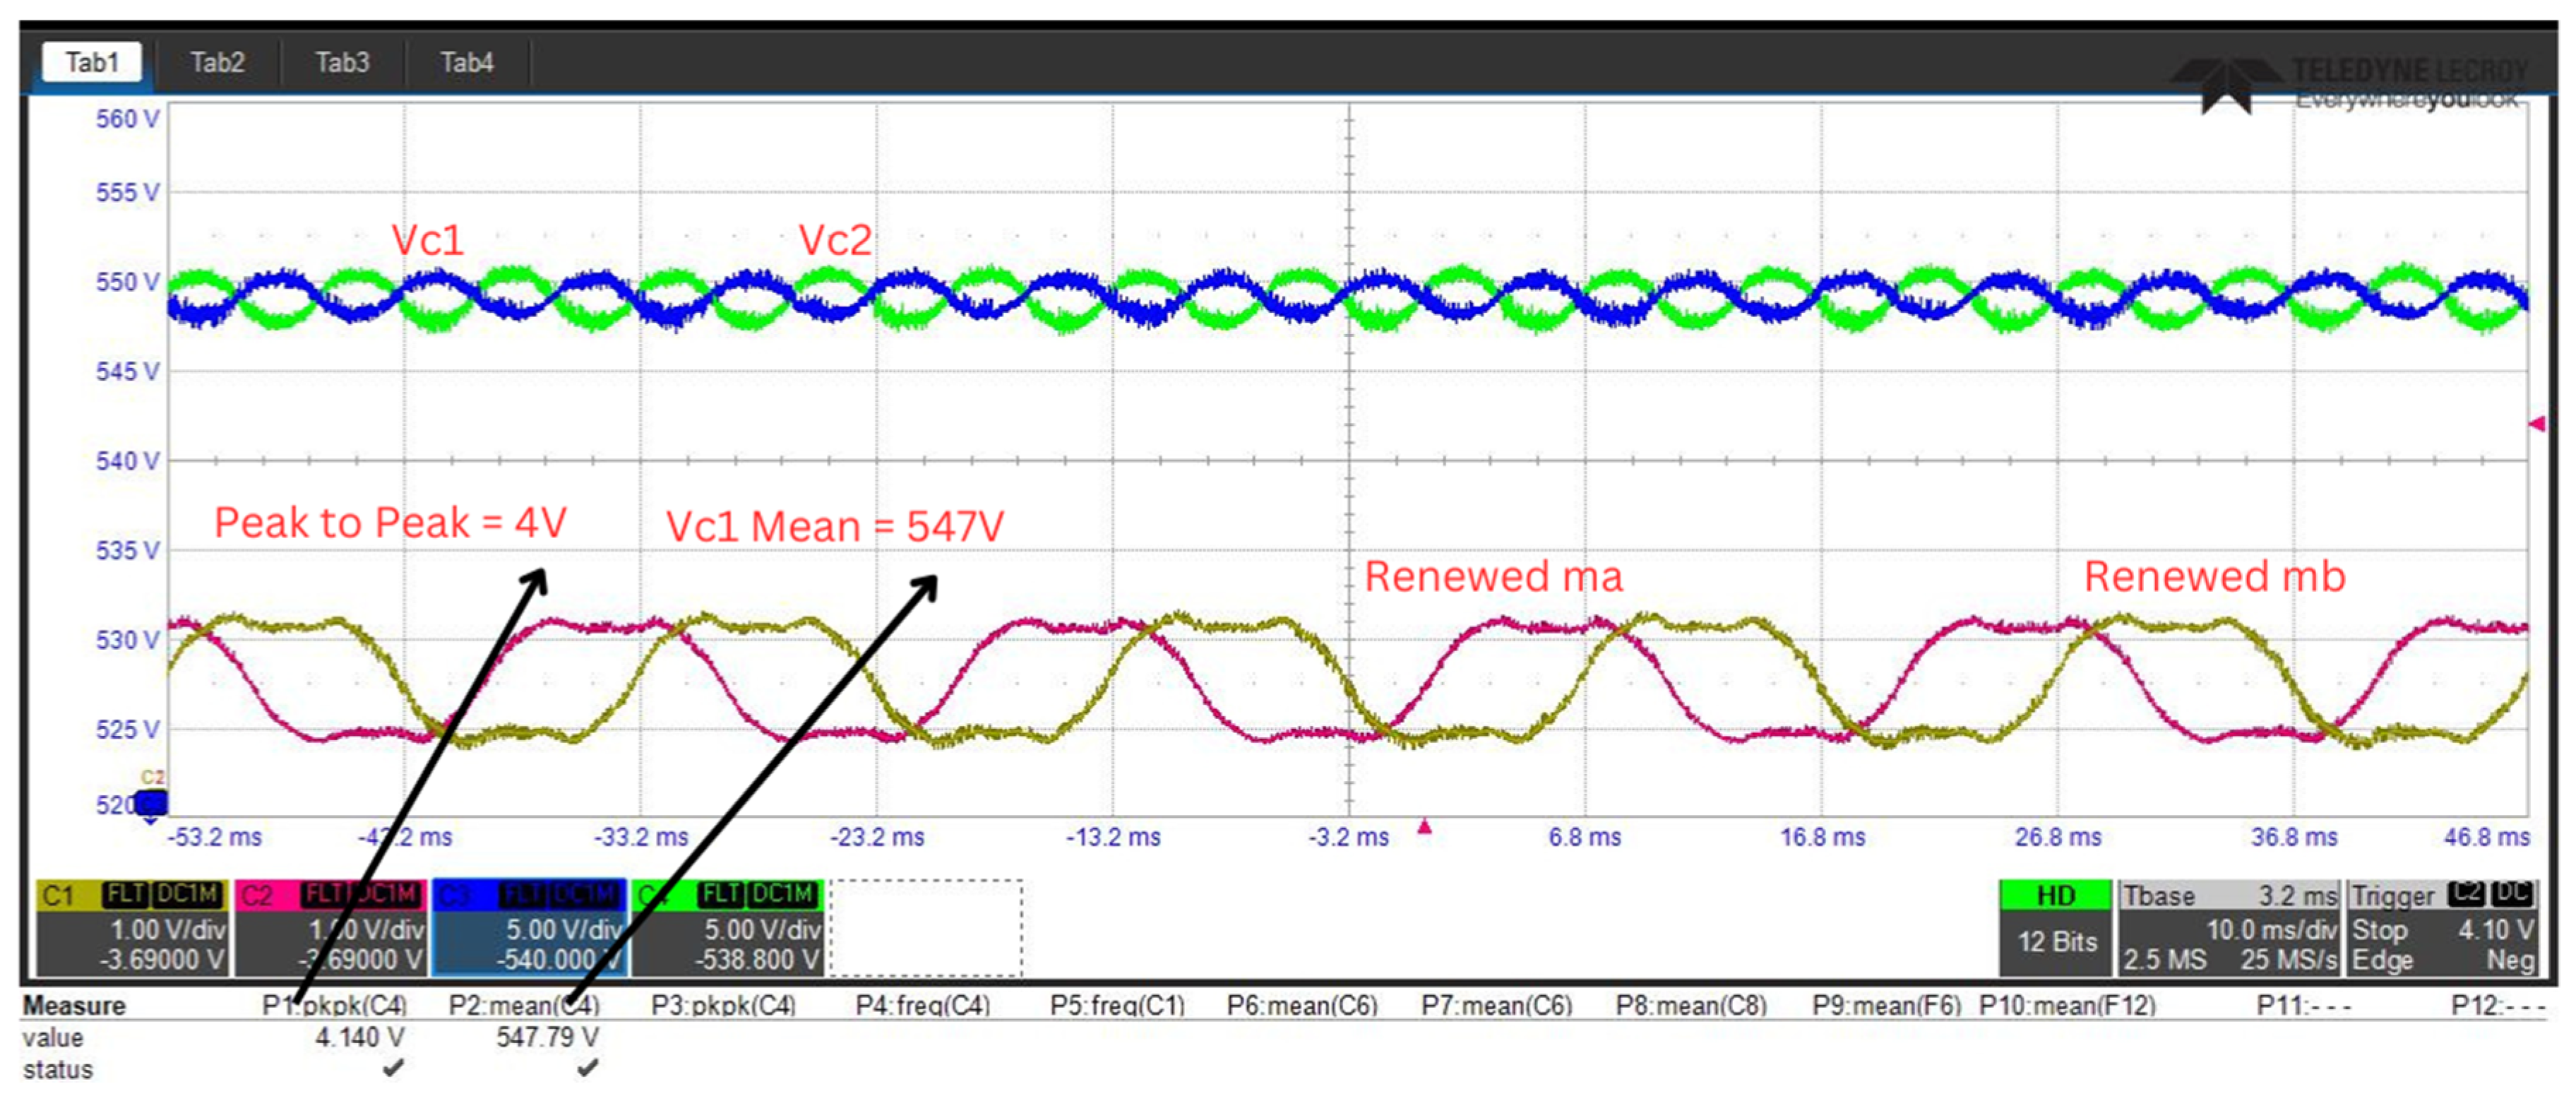
For this particular system configuration, SPWM was employed as the modulation strategy due to its well-documented advantages in harmonic suppression and implementation stability. The initial potential difference across the capacitive elements, denoted as ( and ), was carefully calibrated to an identical value of 547 V to establish uniform initial conditions.
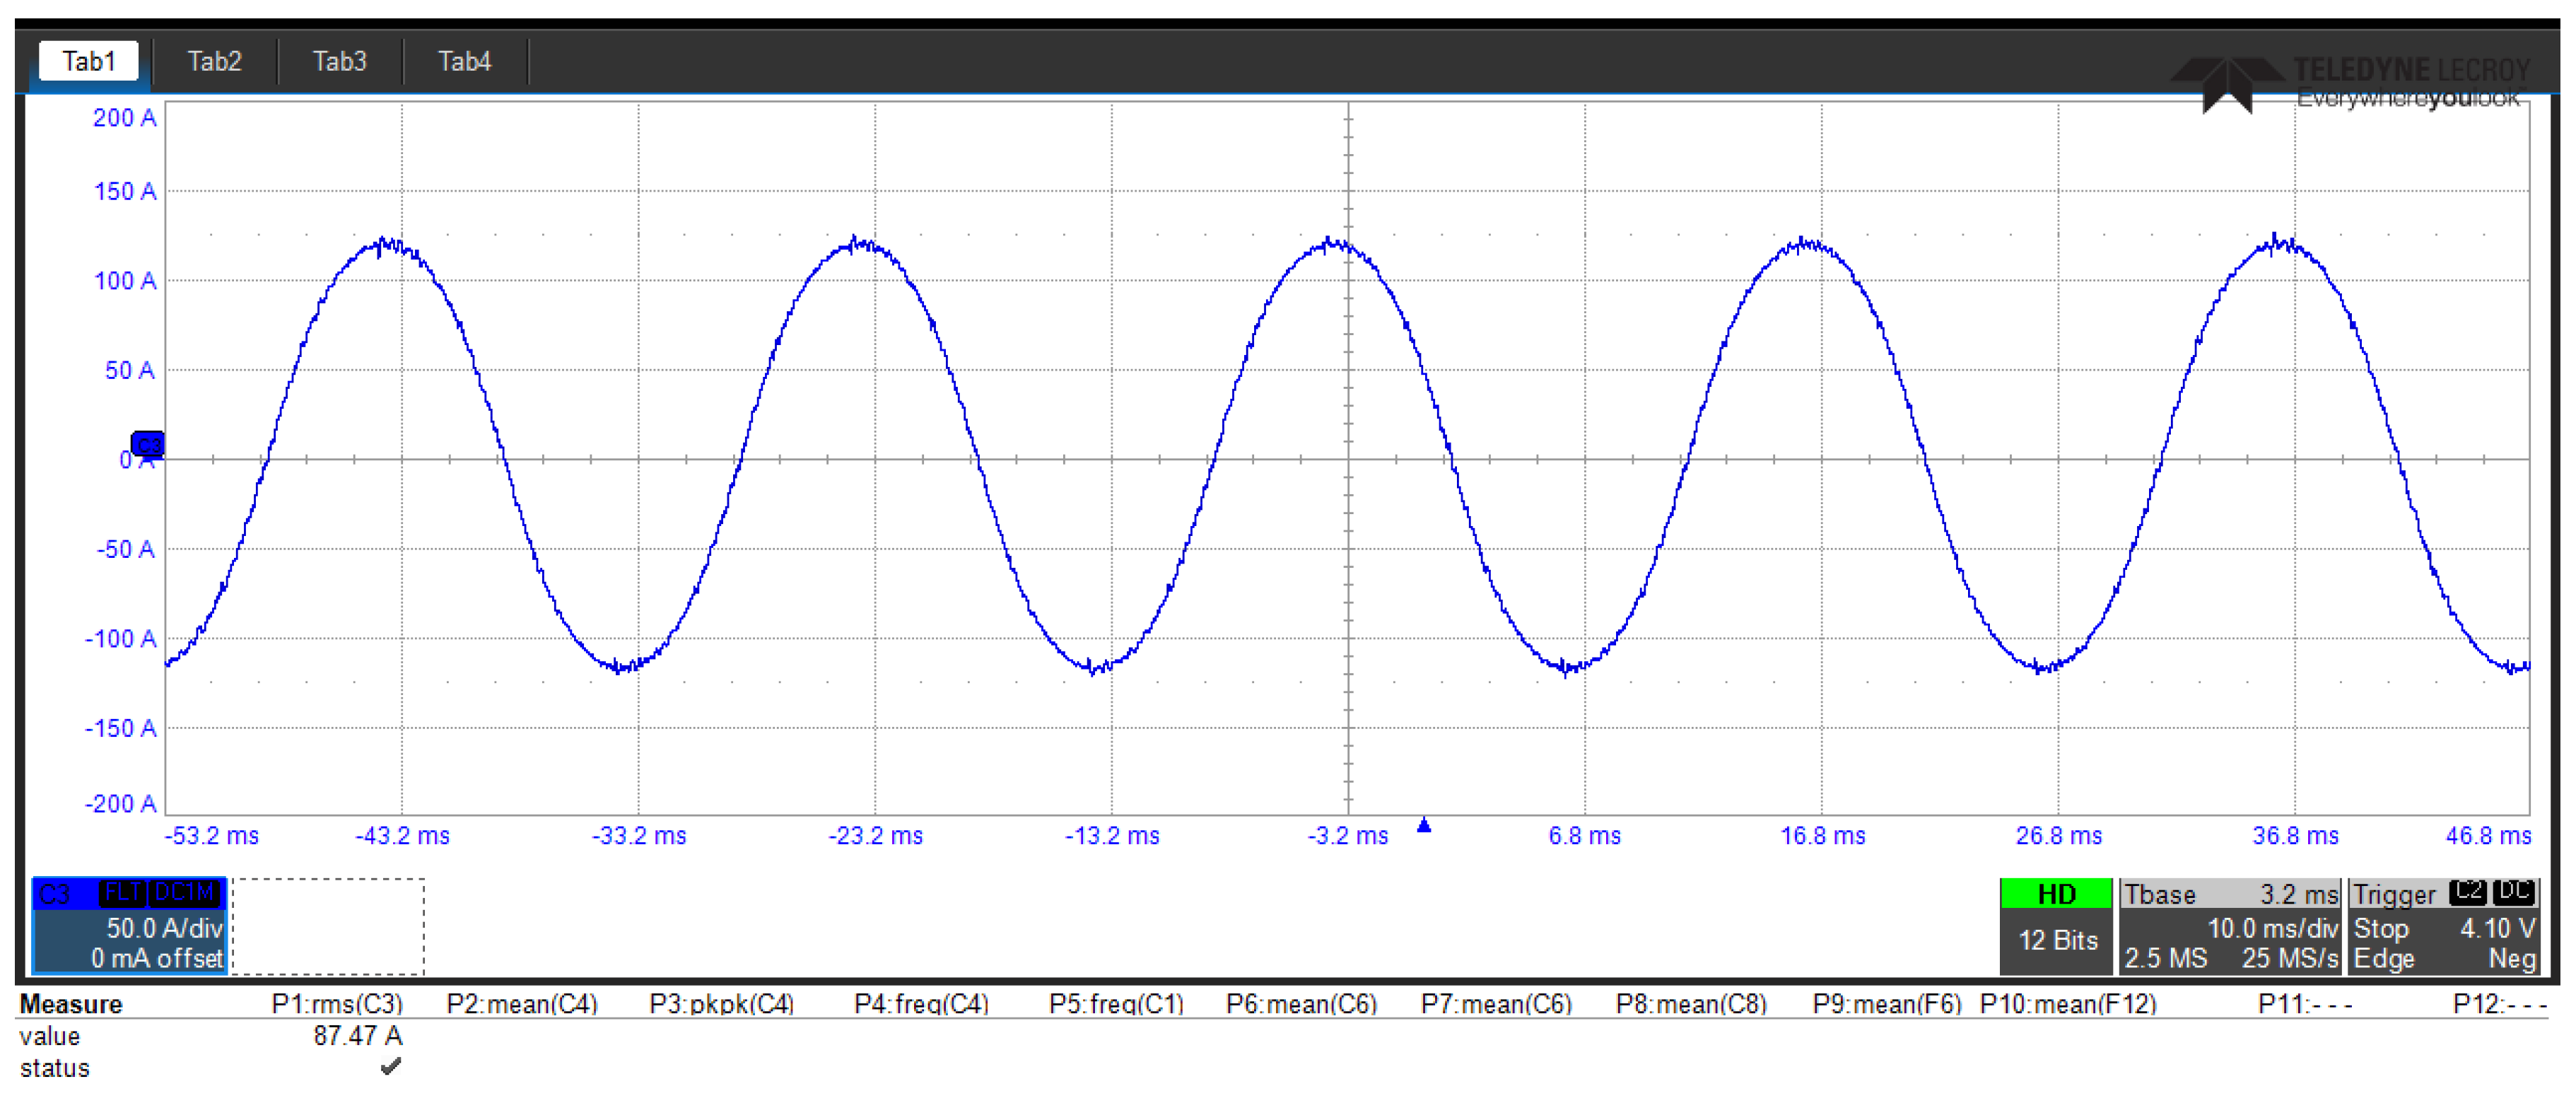
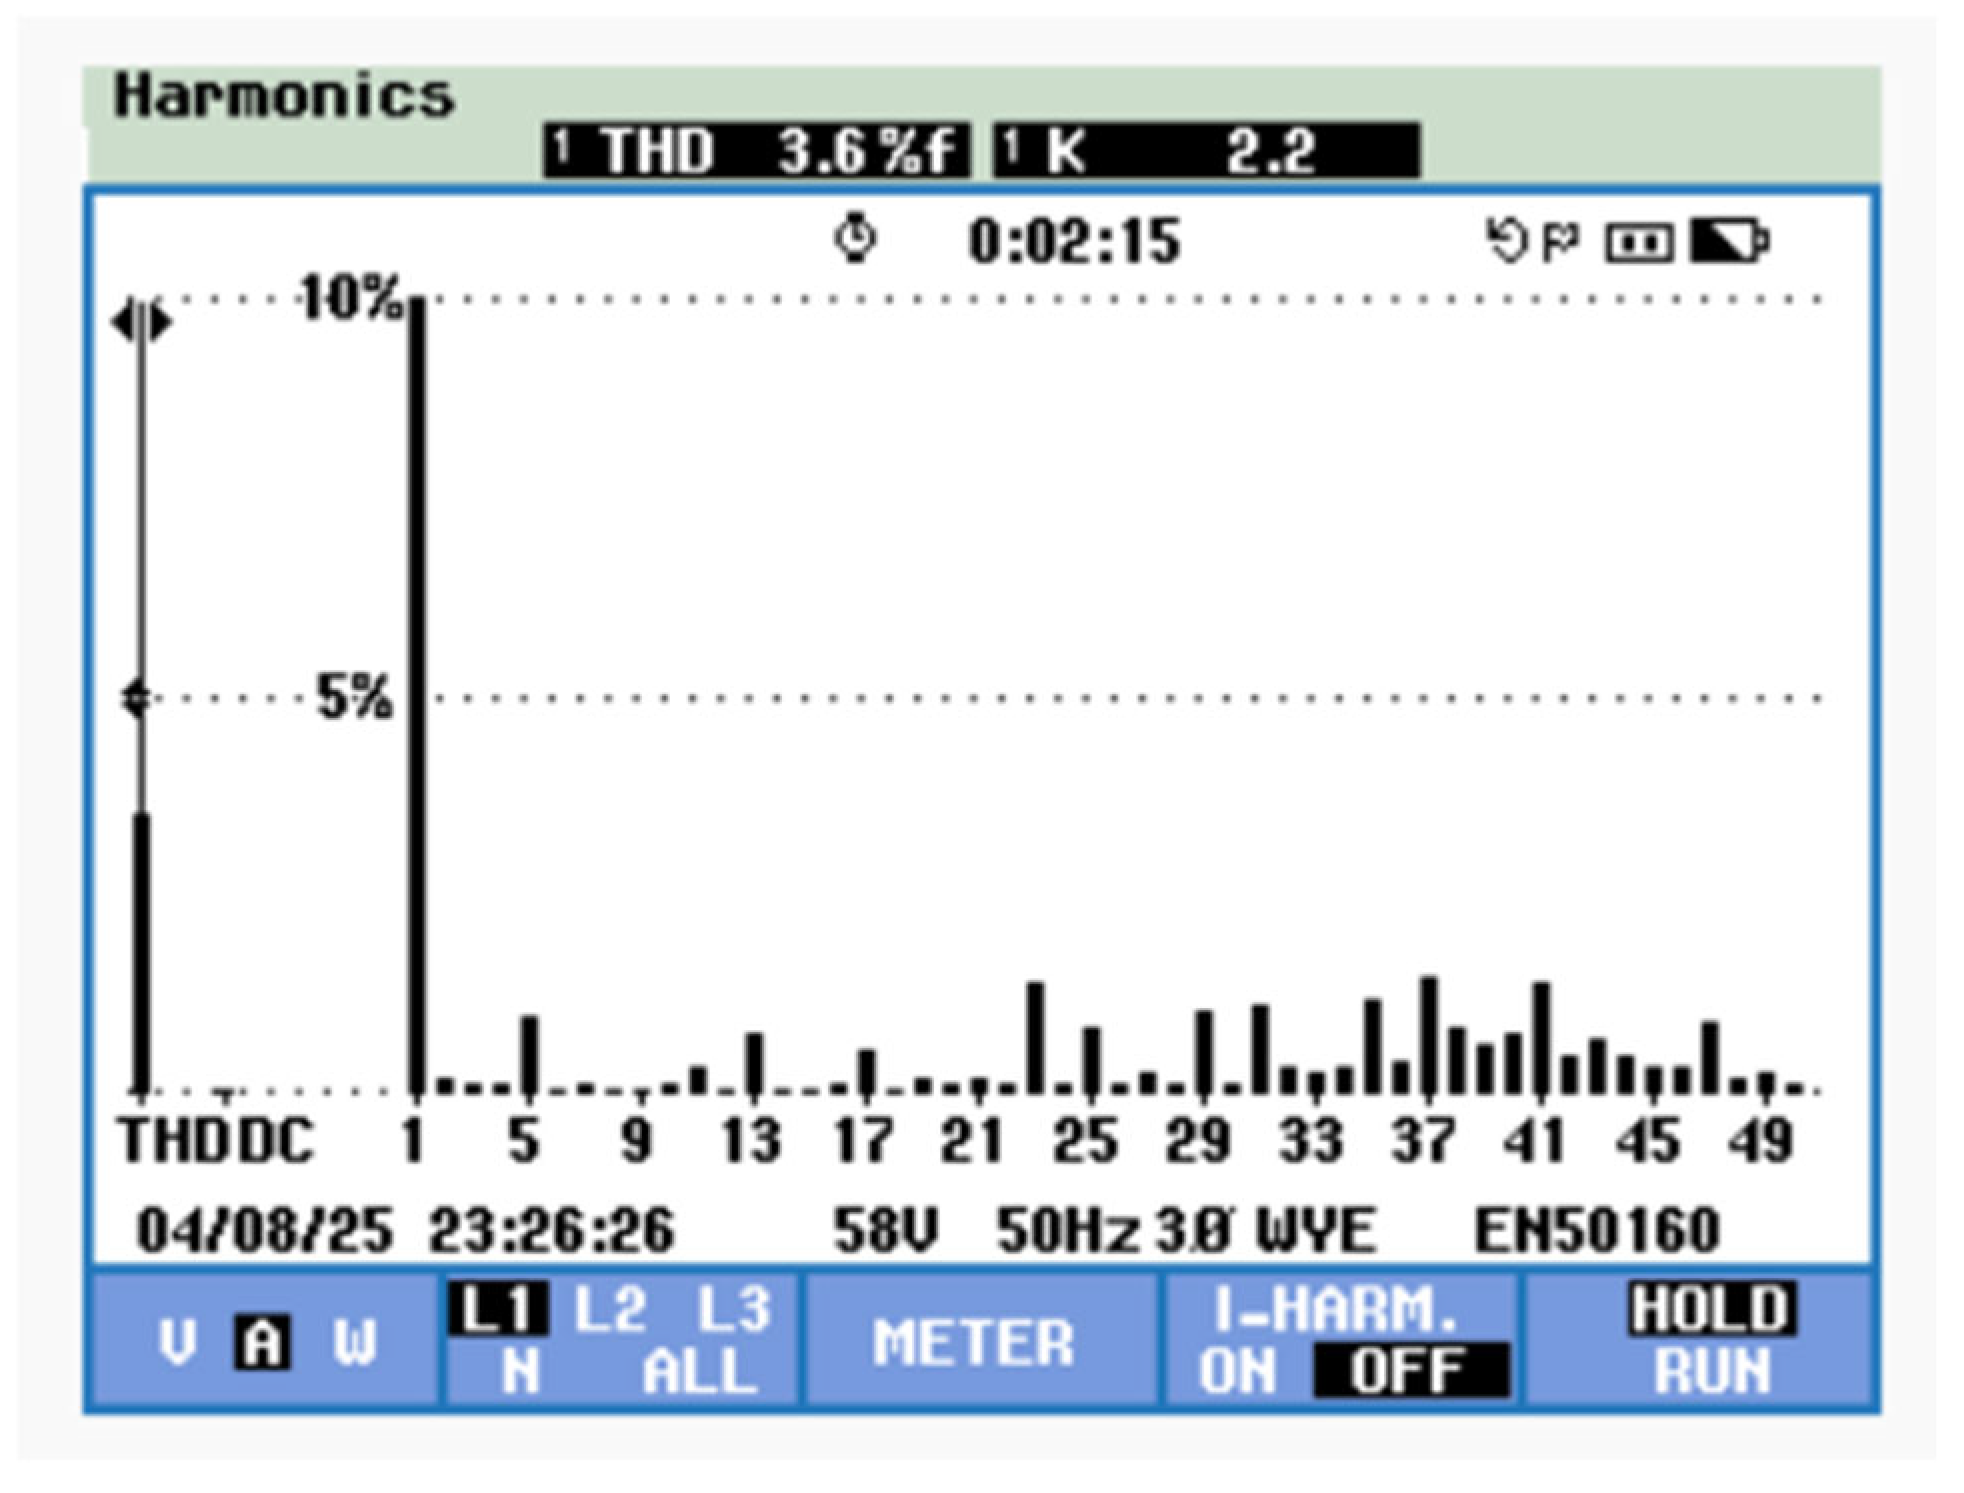
The empirical results derived from this experimental configuration, which demonstrate the dynamic behavior and performance characteristics of the system under investigation, are comprehensively illustrated in
Figure 16,
Figure 17 and
Figure 18. These graphical representations provide critical insights into the system’s operational efficacy under the specified control paradigm.
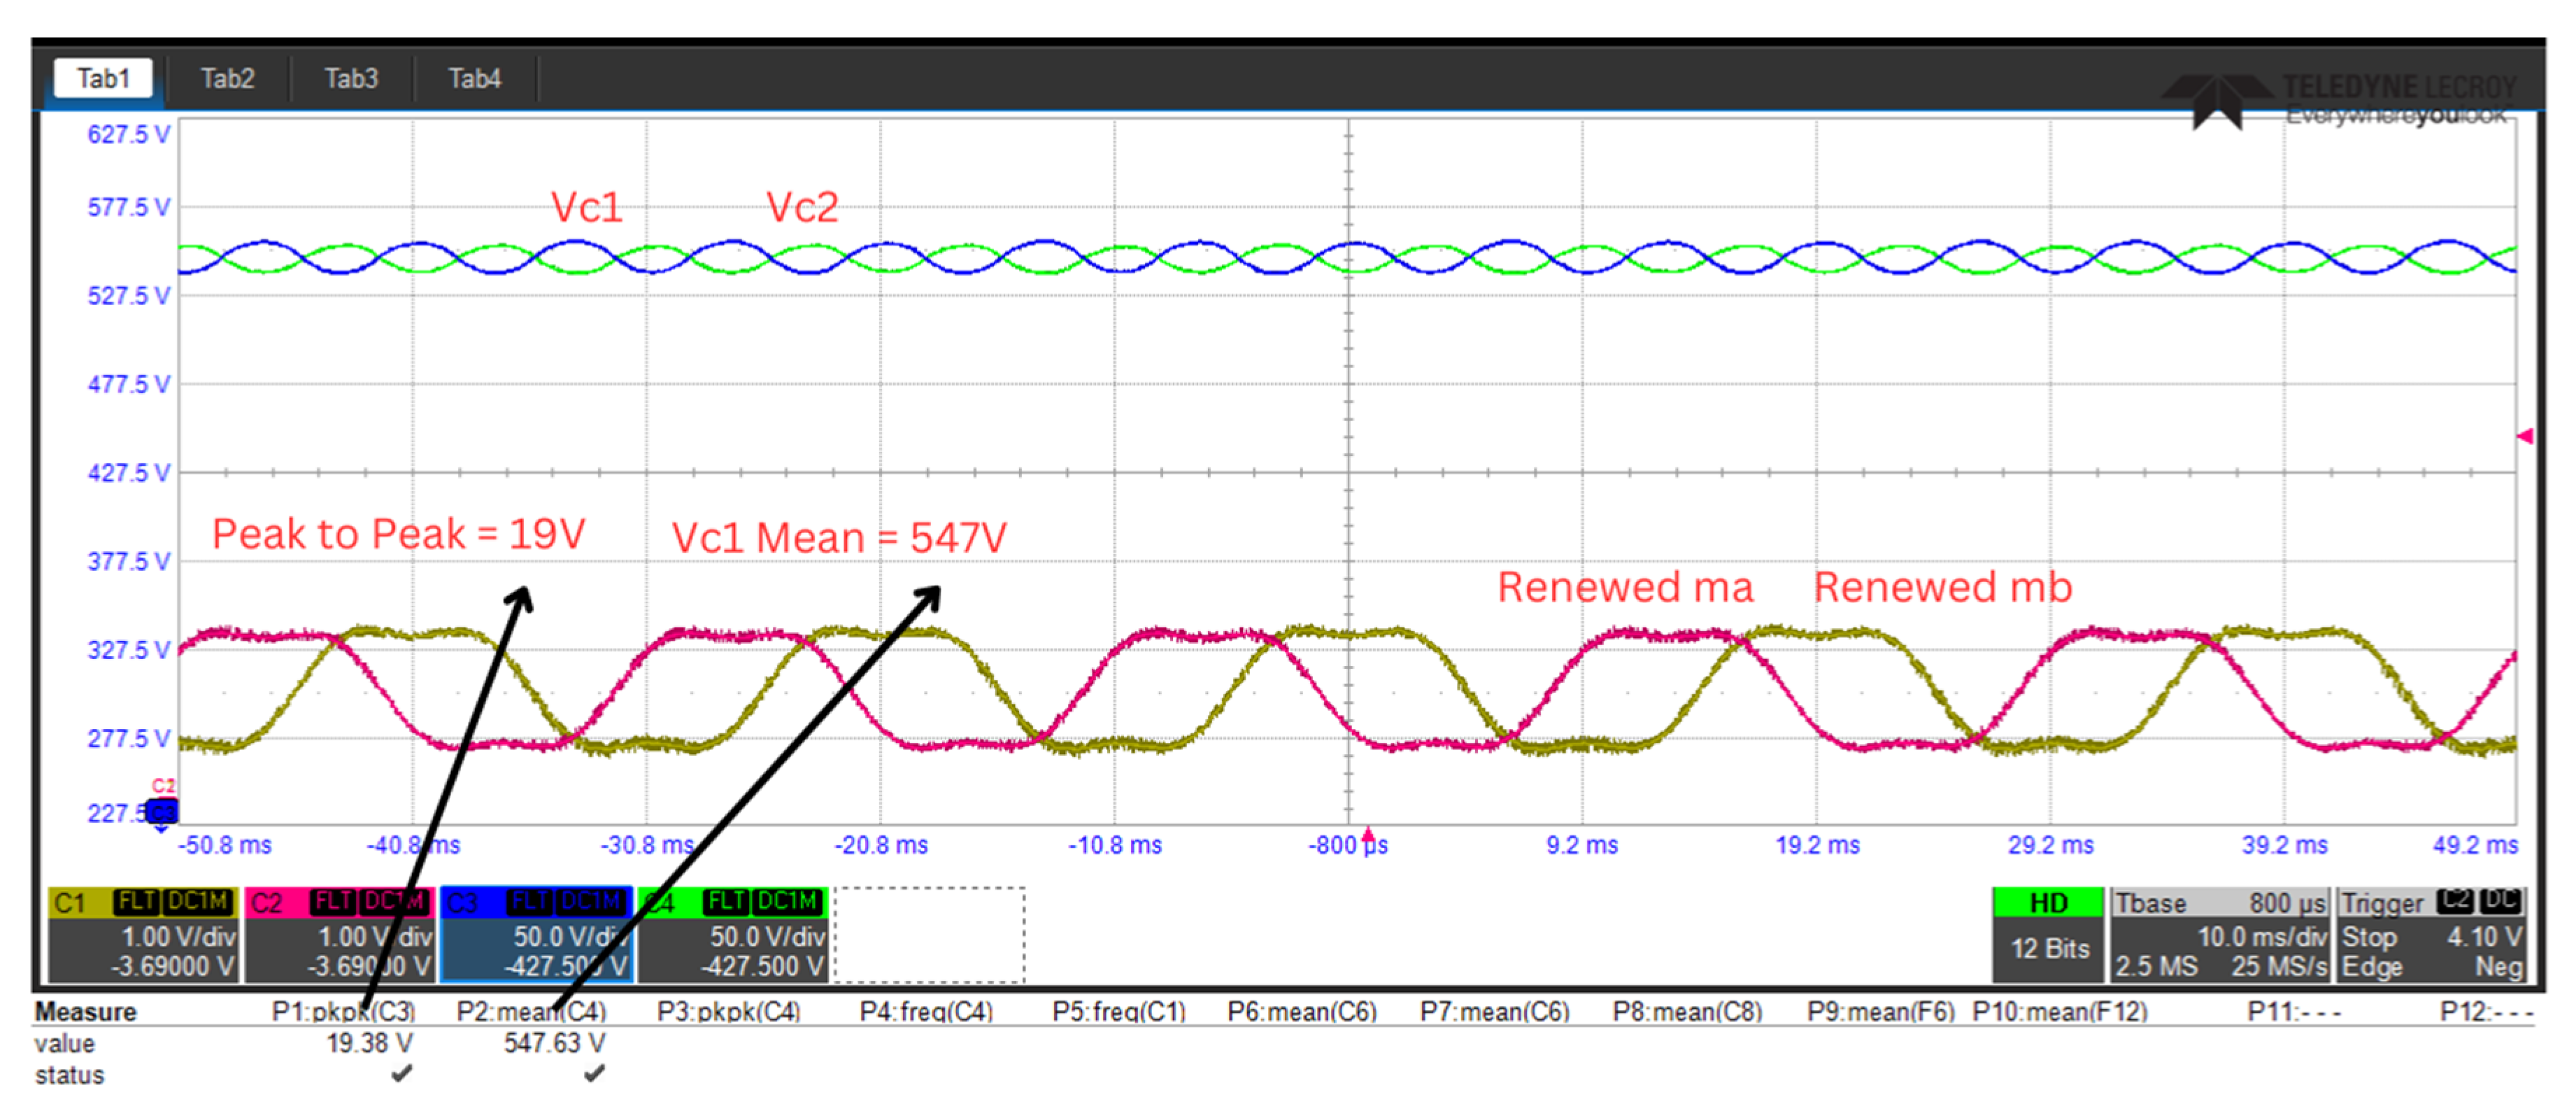
The second experimental scenario (Scenario-2) was precisely defined. In this configuration, the voltage equalization control loop was regulated by a PI control architecture, while the voltage fluctuation control loop system was intentionally maintained in an open-loop operational mode to isolate its effects. For the power conversion stage, the THIPWM technique was implemented as the modulation strategy, selected for its demonstrated efficacy in harmonic reduction and voltage utilization optimization. The initial charge distribution across both DC-link capacitors ( and ) was carefully balanced at 547 V to establish consistent initial operating conditions.
The experimental outcomes of this configuration, which reveal critical insights into the system’s dynamic response characteristics under these specific control parameters, are presented with analytical rigor in
Figure 19 and
Figure 20. These graphical representations comprehensively illustrate the temporal evolution of the key electrical parameters throughout the investigation period.
The third experimental scenario (Scenario 3) incorporated a hybrid control architecture to evaluate comparative performance metrics. The voltage equalization loop continued to employ a PI control scheme, while the voltage fluctuation mitigation system was upgraded to utilize an FLC in conjunction with THIPWM. This advanced configuration was designed to investigate potential synergistic effects between intelligent control algorithms and optimized modulation techniques.
Consistent with previous experimental protocols, the initial potential difference across both capacitive elements (
and
) was precisely initialized at 547 V to maintain methodological continuity. The comprehensive experimental results, which demonstrate the enhanced performance characteristics achieved through this sophisticated control strategy, are systematically presented in
Figure 21,
Figure 22 and
Figure 23 These visual representations provide compelling evidence of the system’s improved stability and dynamic response when employing the proposed control paradigm.
A rigorous examination of the Scenario-1 experimental results revealed several critical performance characteristics of the hybrid ANPC inverter system. The detailed analysis of the voltage waveform characteristics demonstrated that the peak-to-peak voltage fluctuation exhibited remarkable stability, maintaining a consistent amplitude of 116 V throughout operation. This fluctuation occurred at a well-defined characteristic frequency of 150 Hz, reflecting the system’s inherent dynamic behavior under the specified control configuration.
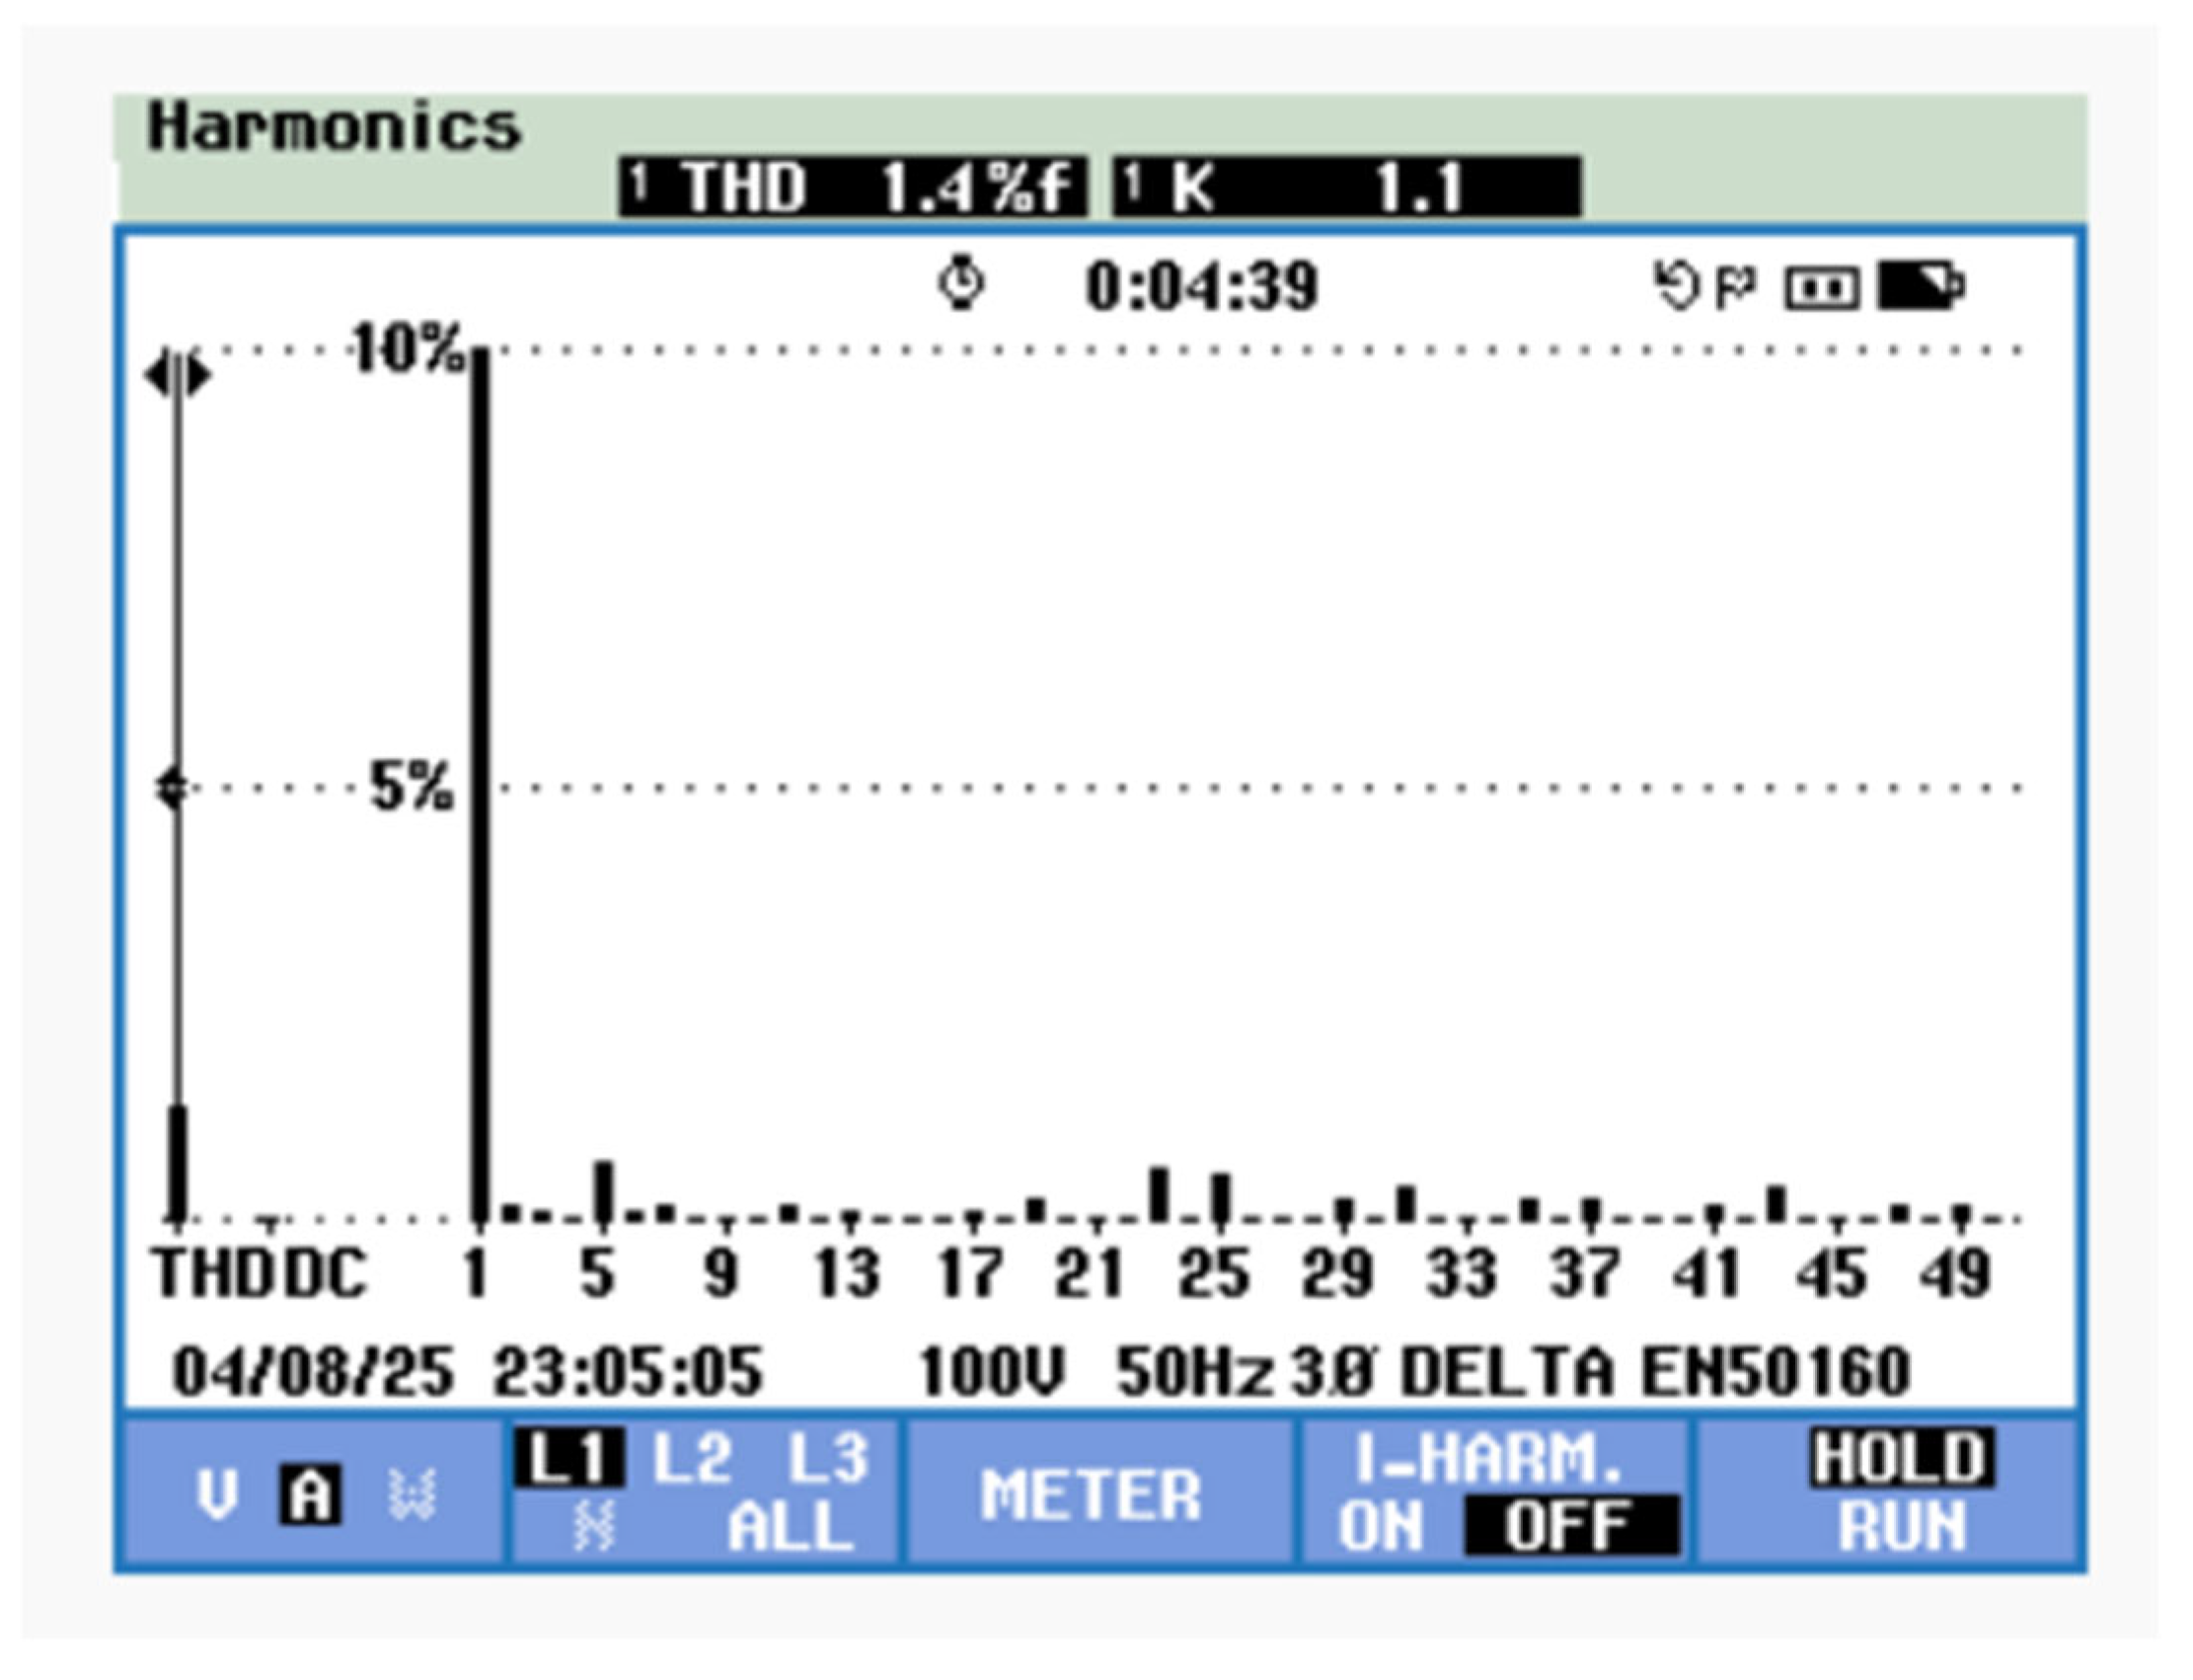
The investigation extended to a thorough evaluation of power quality metrics, with a particular emphasis on THD characteristics in this advanced three-phase grid-connected configuration. As systematically presented in
Figure 18, the spectral analysis of phase current distortion reveals excellent harmonic performance characteristics. Precision measurements conducted under controlled laboratory conditions yielded a phase current THD of precisely 3.6%, a value that confirms exceptional power quality compliance with international standards for grid-connected power electronic systems.
Complementing these findings,
Figure 17 presents an oscilloscope capture of the actual phase current waveform during system operation. This visual representation provides crucial empirical evidence of the current waveform, serving to validate the quantitative THD measurements through direct observation.
The combined analytical results from both quantitative THD assessment and qualitative waveform examination collectively demonstrate that the implemented control strategy successfully achieves power quality while maintaining stable voltage characteristics under the specified operating conditions. These findings establish a strong foundation for comparative performance evaluation with the subsequent experimental scenarios.
The second experimental scenario (Scenario-2) was systematically executed to evaluate the system’s performance under modified control conditions. In this configuration, the voltage equalization mechanism was regulated by a PI control architecture, while the voltage fluctuation control loop system was intentionally maintained in an open-loop configuration to isolate its effects on system dynamics.
The power conversion stage employed THIPWM as the modulation strategy, selected for its superior harmonic suppression capabilities in three-phase systems. Conditions were carefully established with both DC-link capacitors ( and ) precisely balanced at 547 V. During steady-state operation, the capacitor voltages demonstrated exceptional stability, maintaining an average value of 547 V with minimal deviation.
The detailed analysis of voltage characteristics revealed a well-regulated peak-to-peak voltage fluctuation amplitude of 19 V, oscillating at a characteristic frequency of 150 Hz. This represents a significant reduction in the voltage ripple compared to previous configurations, highlighting the effectiveness of the implemented control strategy.
Comprehensive power quality assessment, as illustrated in
Figure 20, demonstrates outstanding current harmonic performance. The spectral analysis of the phase current yielded a remarkably low THD of just 1.4%, establishing new benchmarks for power quality in grid-connected hybrid ANPC inverter systems. This exceptional performance represents an approximately 61% improvement in THD compared to the Scenario-1 results.
The experimental outcomes, systematically presented in
Figure 19 and
Figure 20, provide compelling evidence of the system’s enhanced performance characteristics.
Figure 19 presents detailed oscillography measurements of the key operational parameters, while
Figure 20 offers a comprehensive spectral analysis of the current waveforms. Together, these results validate the superior harmonic suppression capabilities achieved by THIPWM in this configuration.
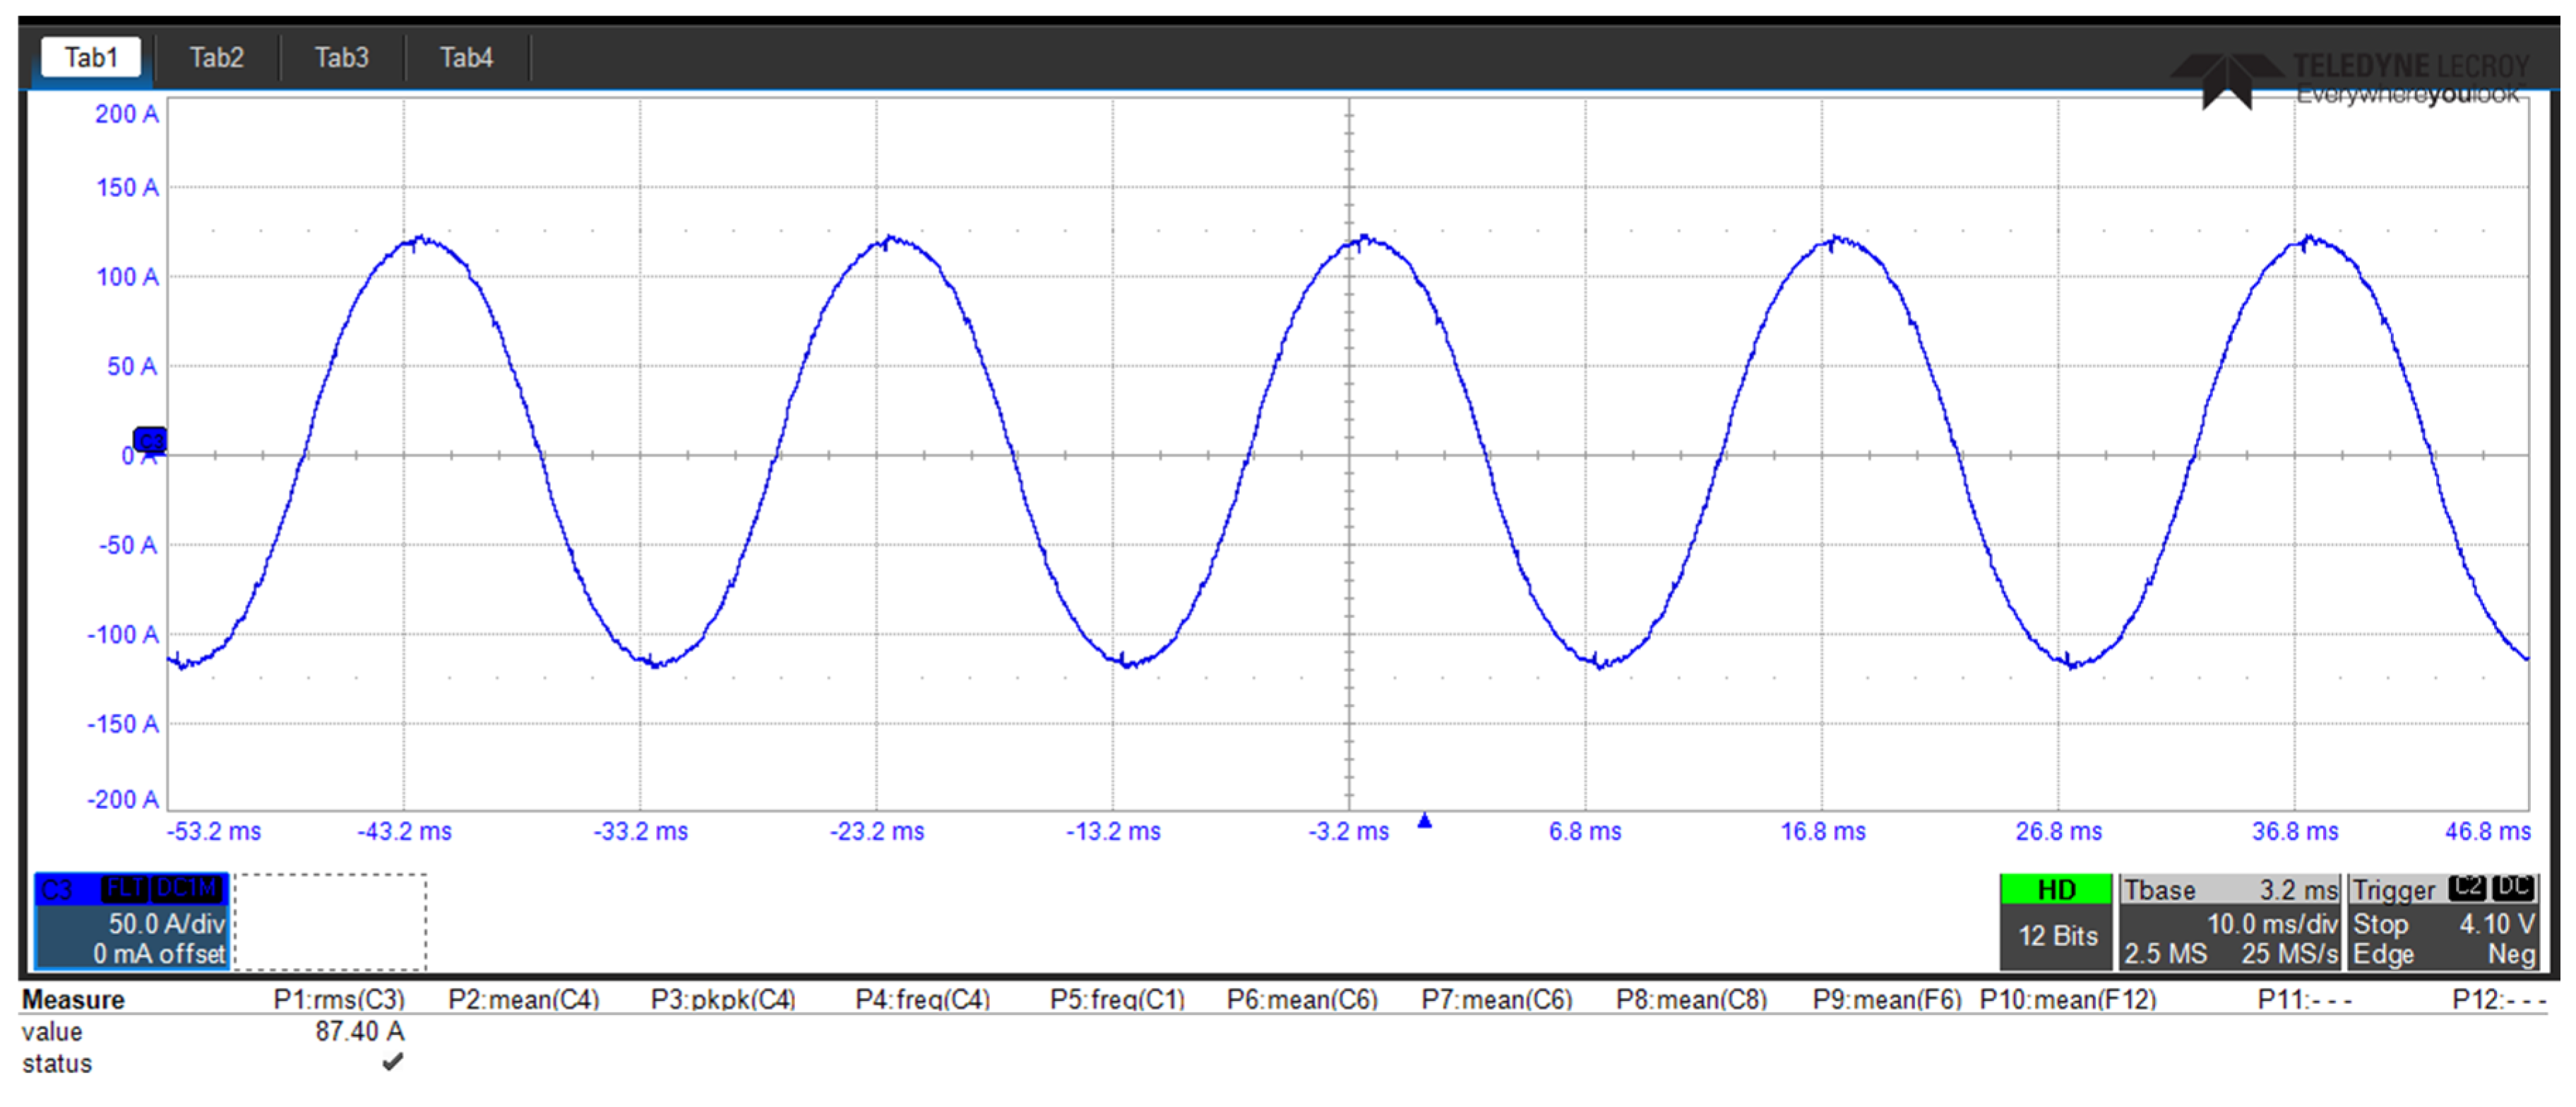
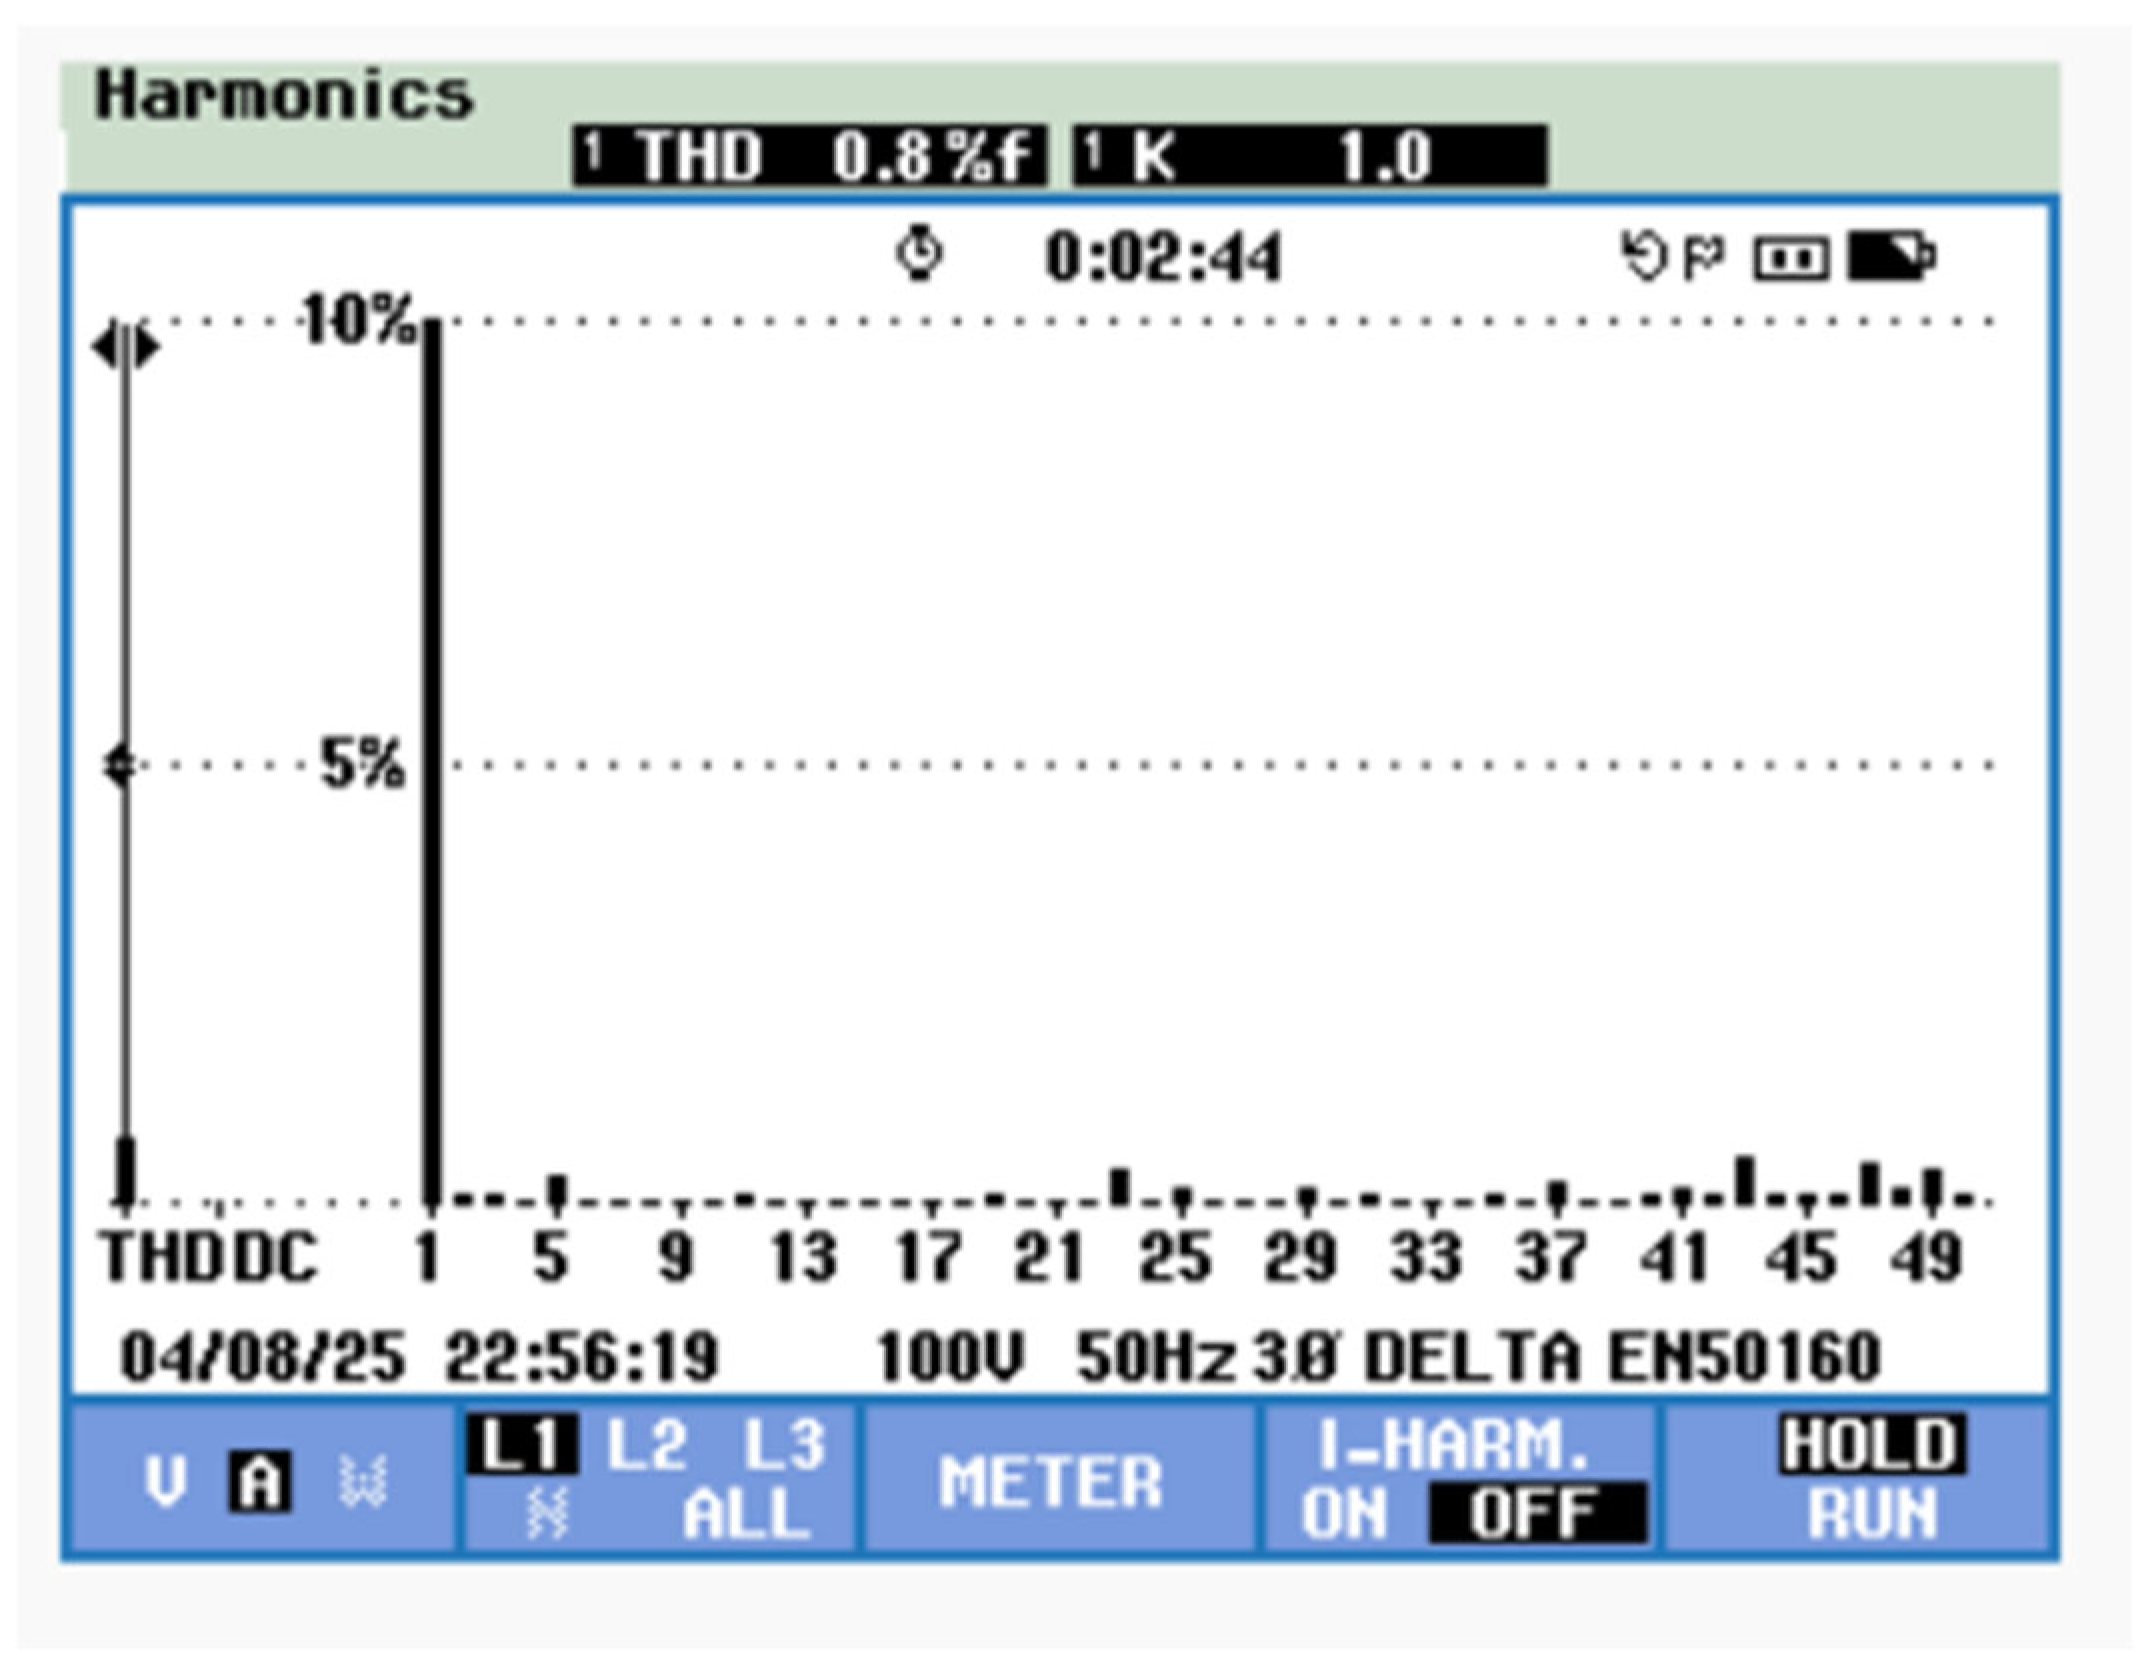
The final experimental scenario (Scenario-3) was conducted to assess the system’s performance under an advanced control architecture. This configuration employed a PI controller for the voltage equalization loop while implementing a fuzzy logic controller for voltage fluctuation suppression, combined with THIPWM. The mean capacitor voltages ( and ) were carefully balanced at 547 V to maintain consistent experimental conditions.
System performance metrics demonstrated exceptional results in this configuration. The steady-state average capacitor voltages remained precisely at 547 V, showing perfect voltage balancing capability. Voltage fluctuation analysis revealed a remarkably low peak-to-peak variation of just 4 V at the characteristic 150 Hz frequency, representing a significant improvement over the previous scenario. This minimal fluctuation amplitude underscores the effectiveness of the FLC and THIPWM approach in suppressing voltage fluctuations.
The comprehensive experimental results, presented in
Figure 21,
Figure 22 and
Figure 23, provide a complete characterization of the system’s behavior under this optimal control configuration.
Figure 22 displays the system’s dynamic response and voltage regulation performance, while
Figure 22 presents the exceptionally clean sinusoidal waveform of the phase current, demonstrating the system’s ability to produce low-harmonic output with negligible distortion.
Figure 23 complements this with a detailed spectral analysis of the output current waveform, quantitatively confirming the outstanding 0.80% THD performance. Together, these results validate the advanced control architecture as an optimal solution for achieving both excellent voltage stability and superior power quality in three-phase grid-connected ANPC inverter systems. The progressive improvement observed across all three scenarios clearly demonstrates the effectiveness of the implemented control strategies, with Scenario-3 establishing new performance benchmarks for such power electronic systems. The waveform purity visible in
Figure 22, combined with the spectral evidence in
Figure 23, provides irrefutable proof of the system’s ability to meet the most stringent power quality requirements while maintaining robust voltage regulation. Some numerical results obtained from the conducted studies are presented in
Table 7.


