
Correlation Effects, Driving Forces and Evolutionary Paths of Cross-Industry Transfer of Energy Consumption in China: A New Analytical Framework


Abstract
1. Introduction
2. Literature Review
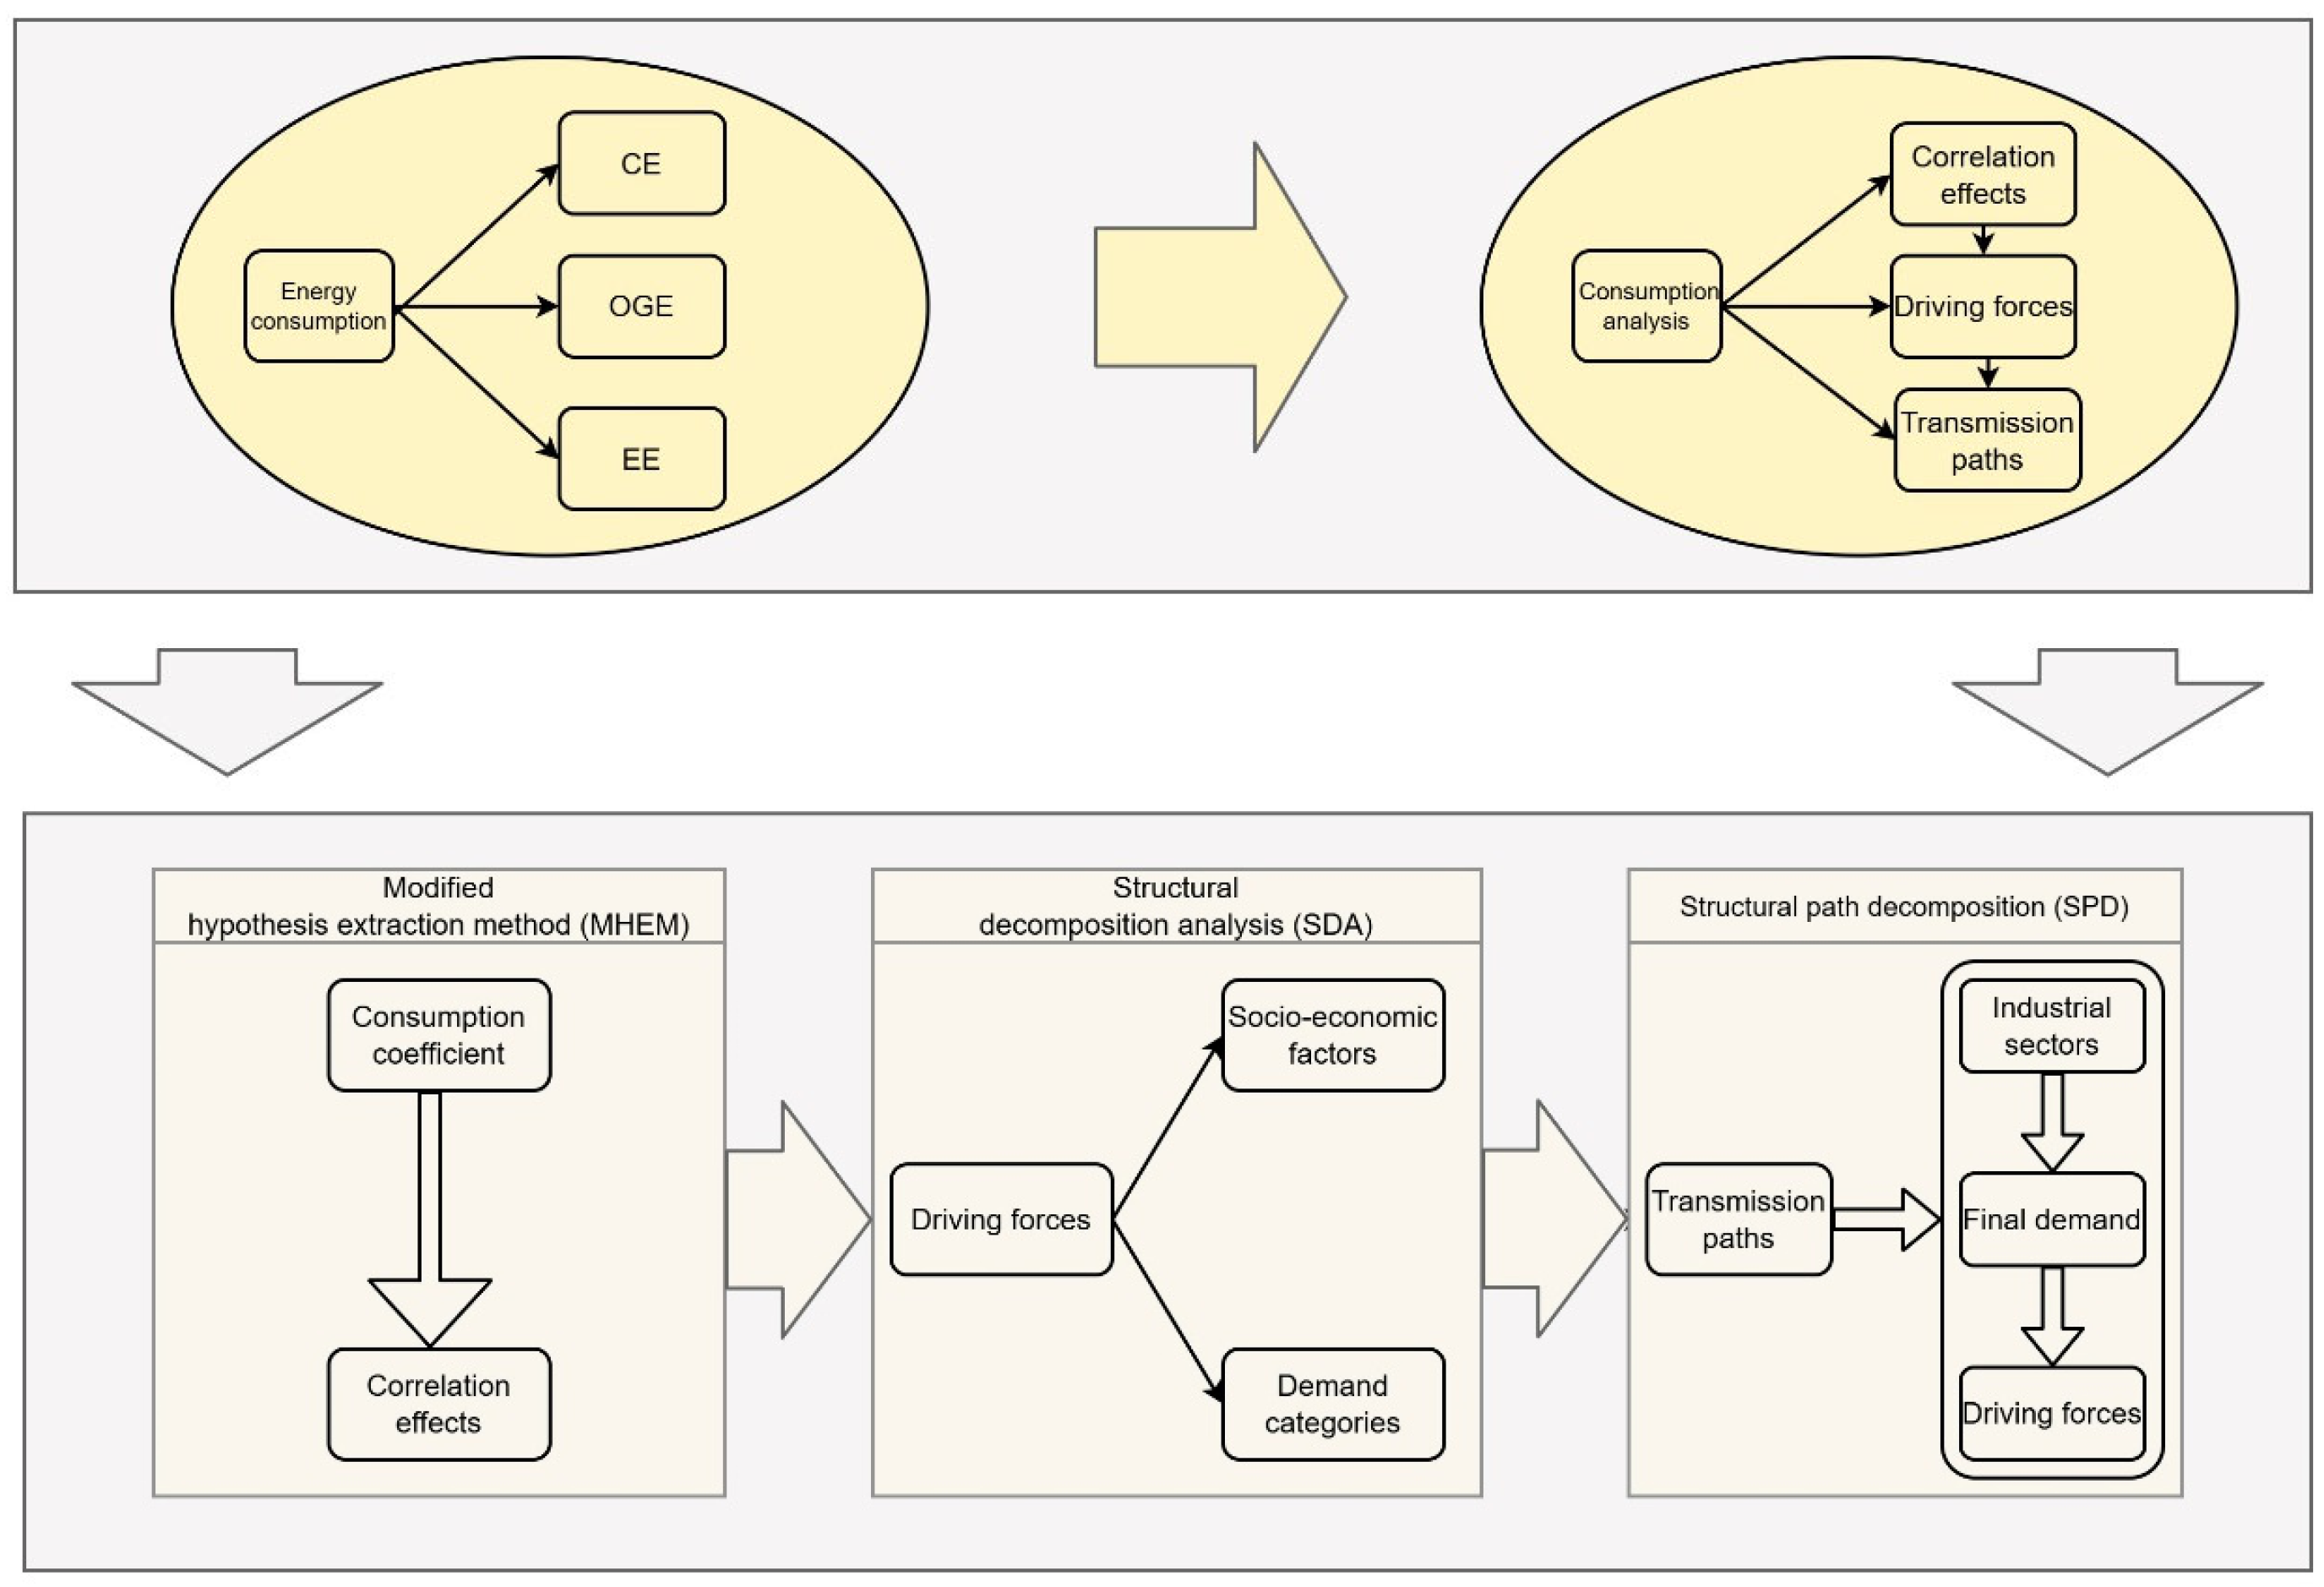
3. Methodology and Data
3.1. Modified Hypothetical Extraction Method
3.2. Structural Decomposition Analysis
3.3. Structural Path Decomposition
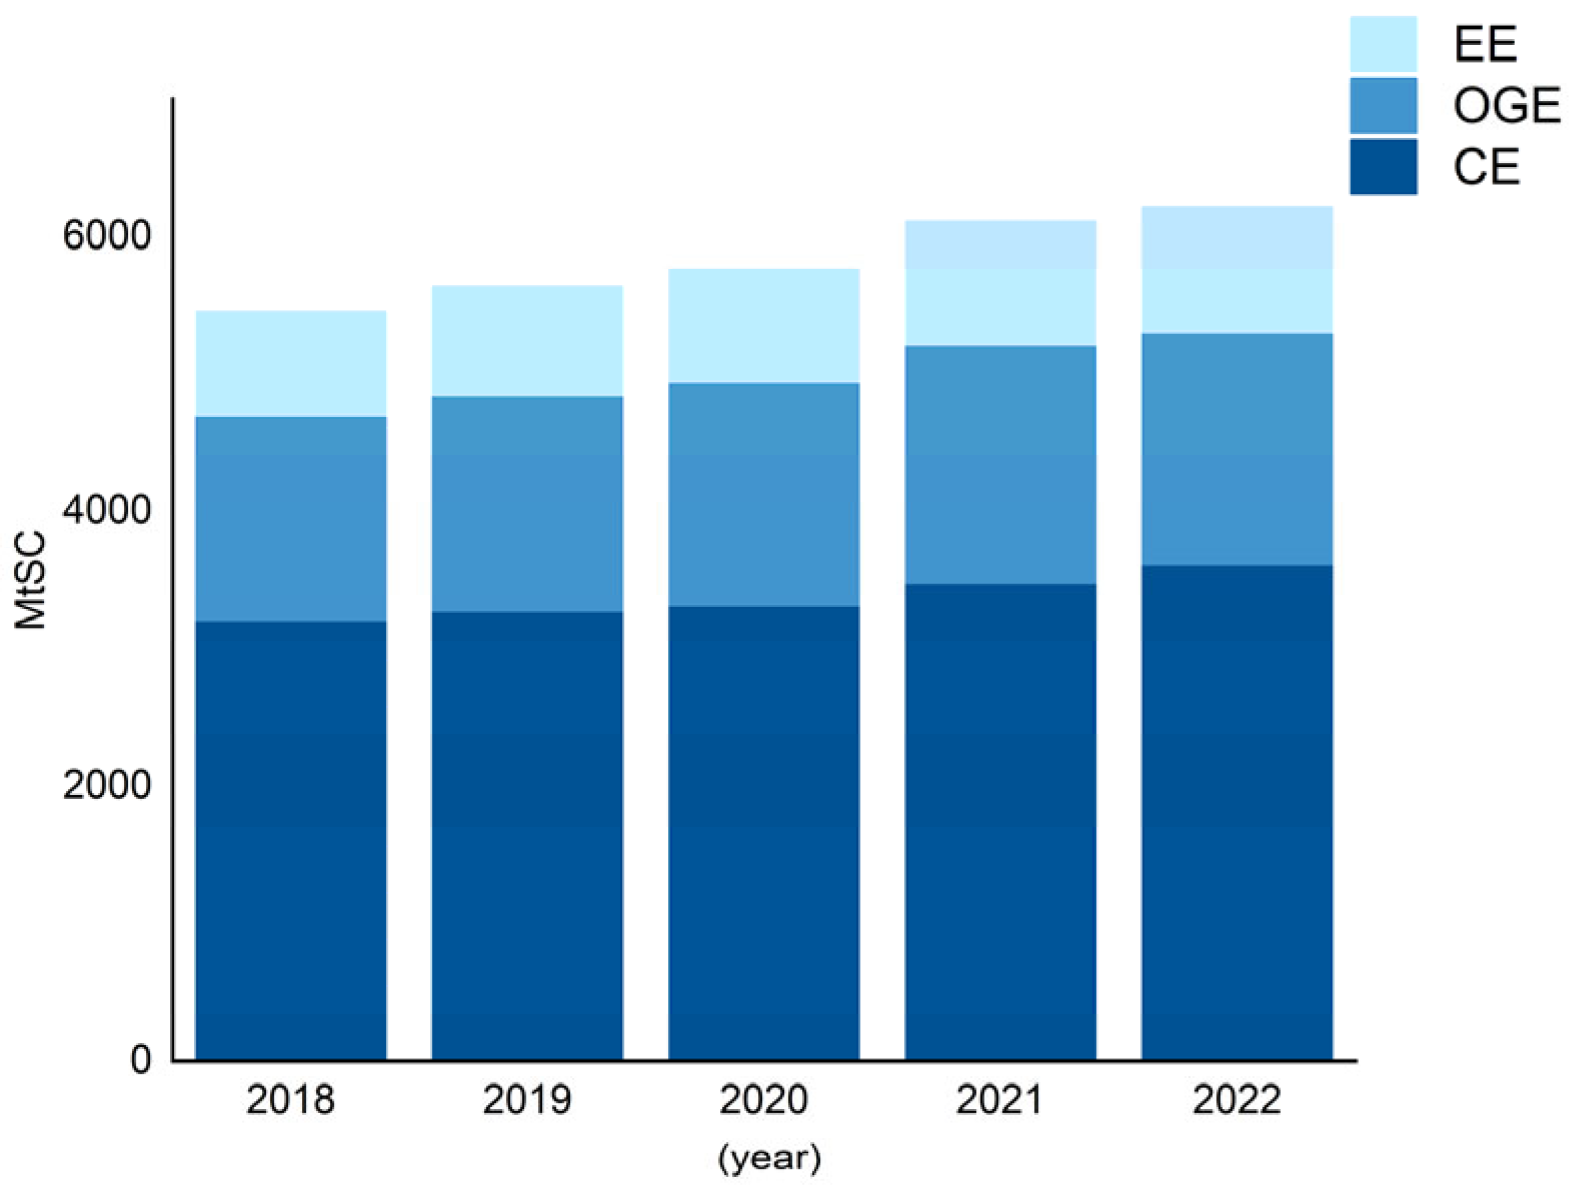
3.4. Data
4. Empirical Analysis
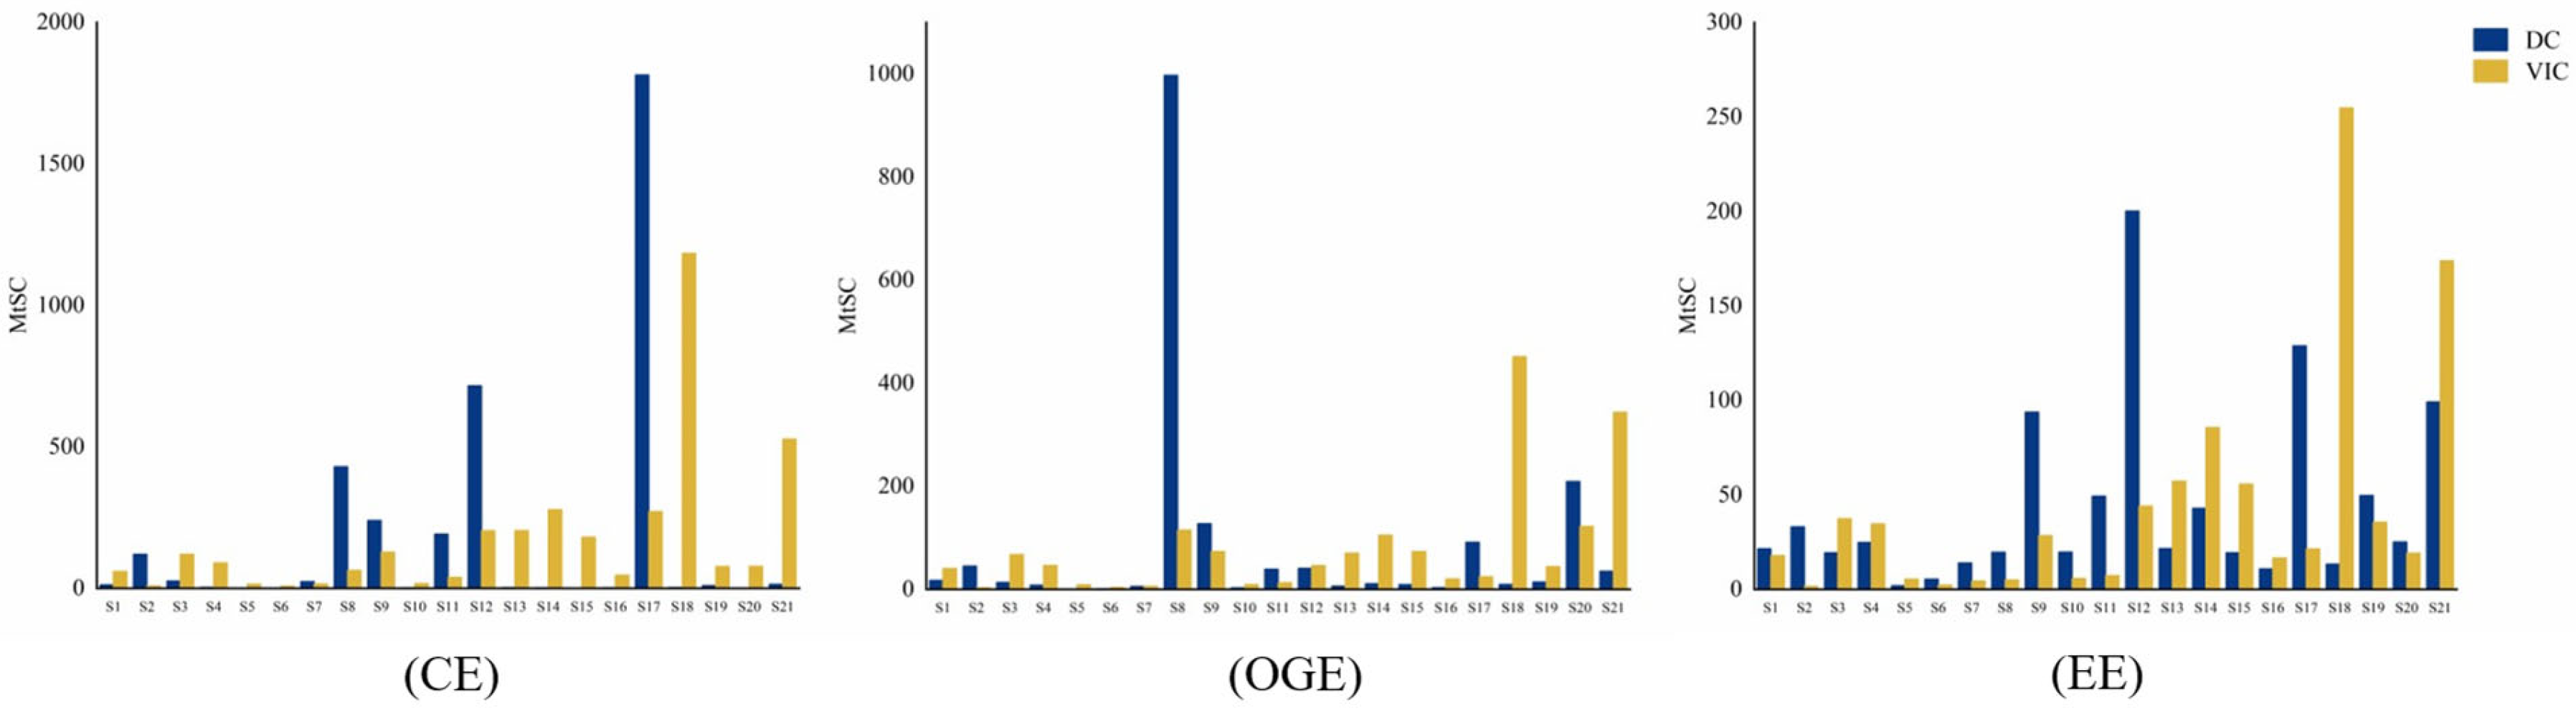
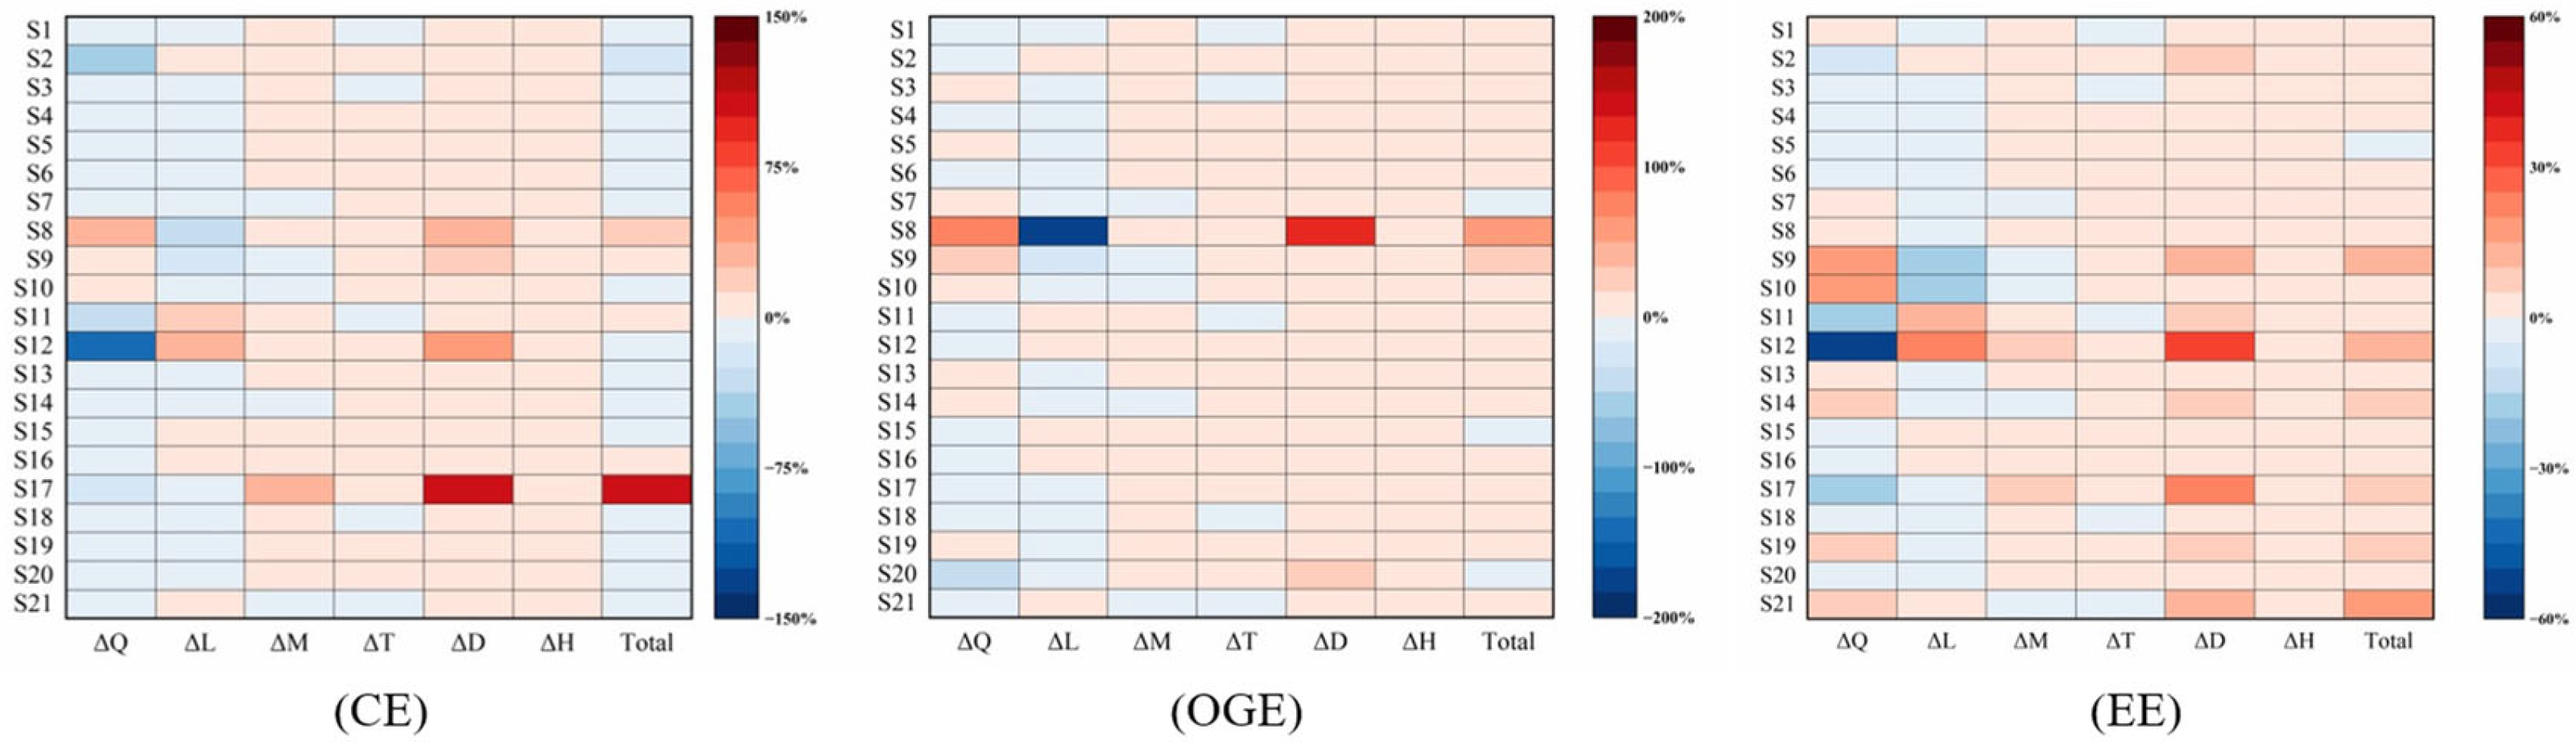
4.1. Sectoral Correlation of Energy Consumption
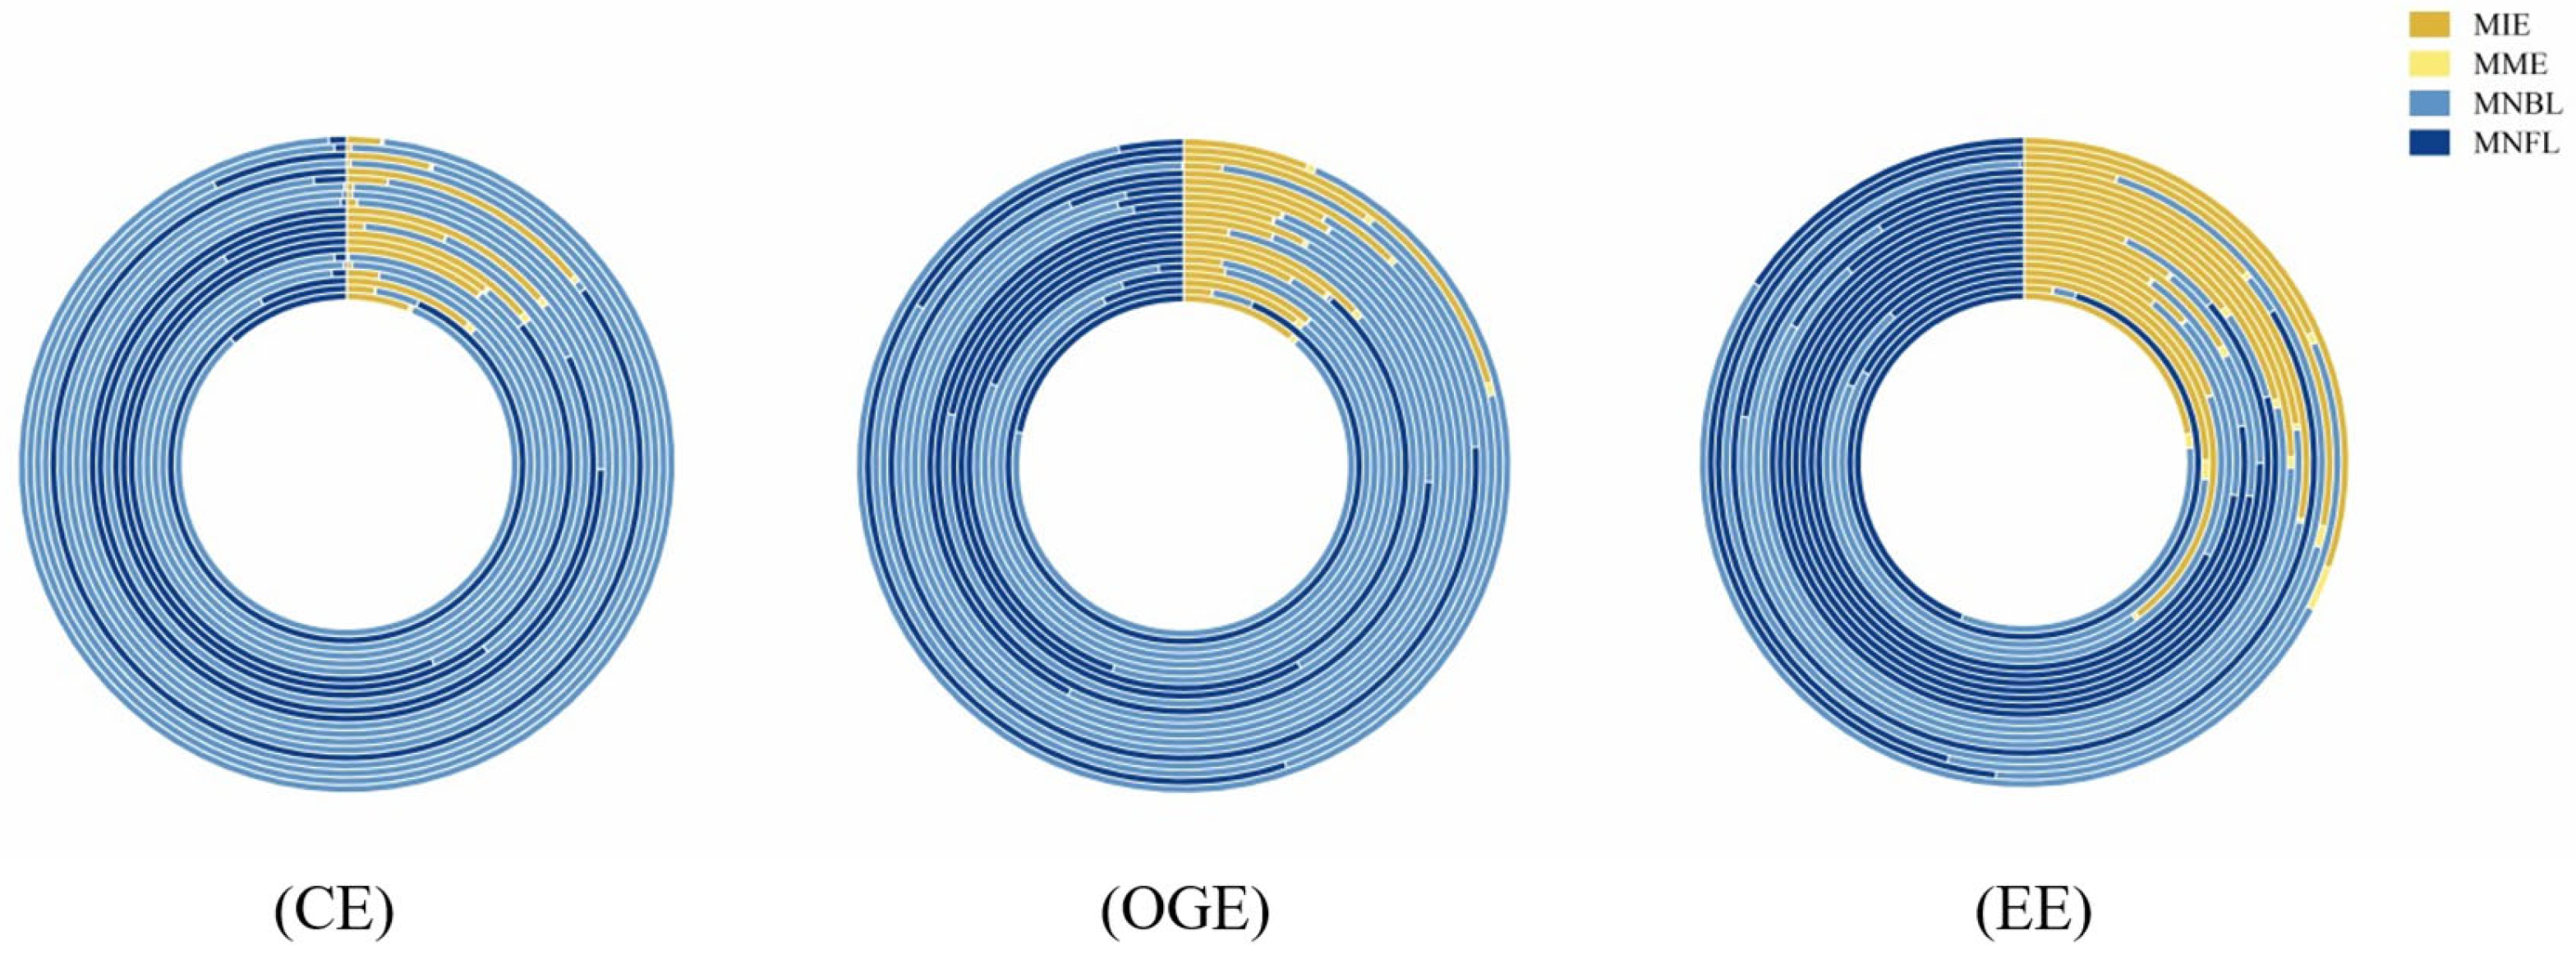
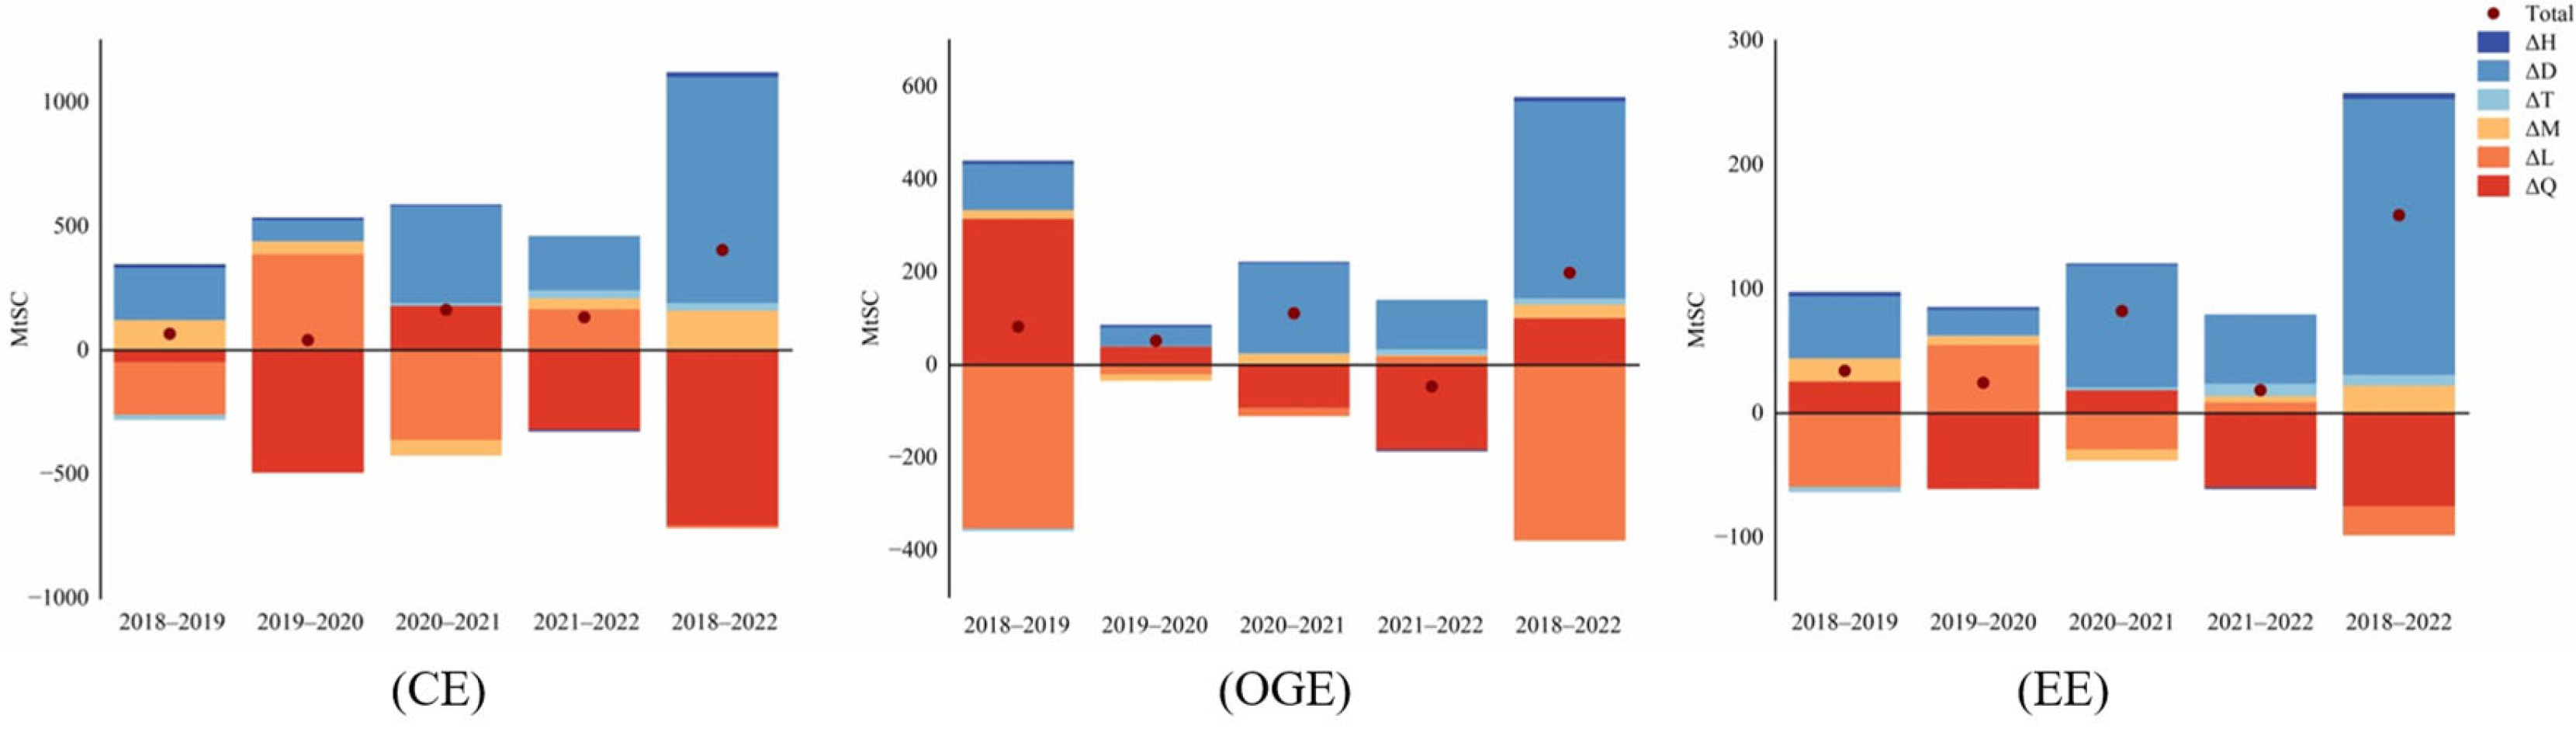
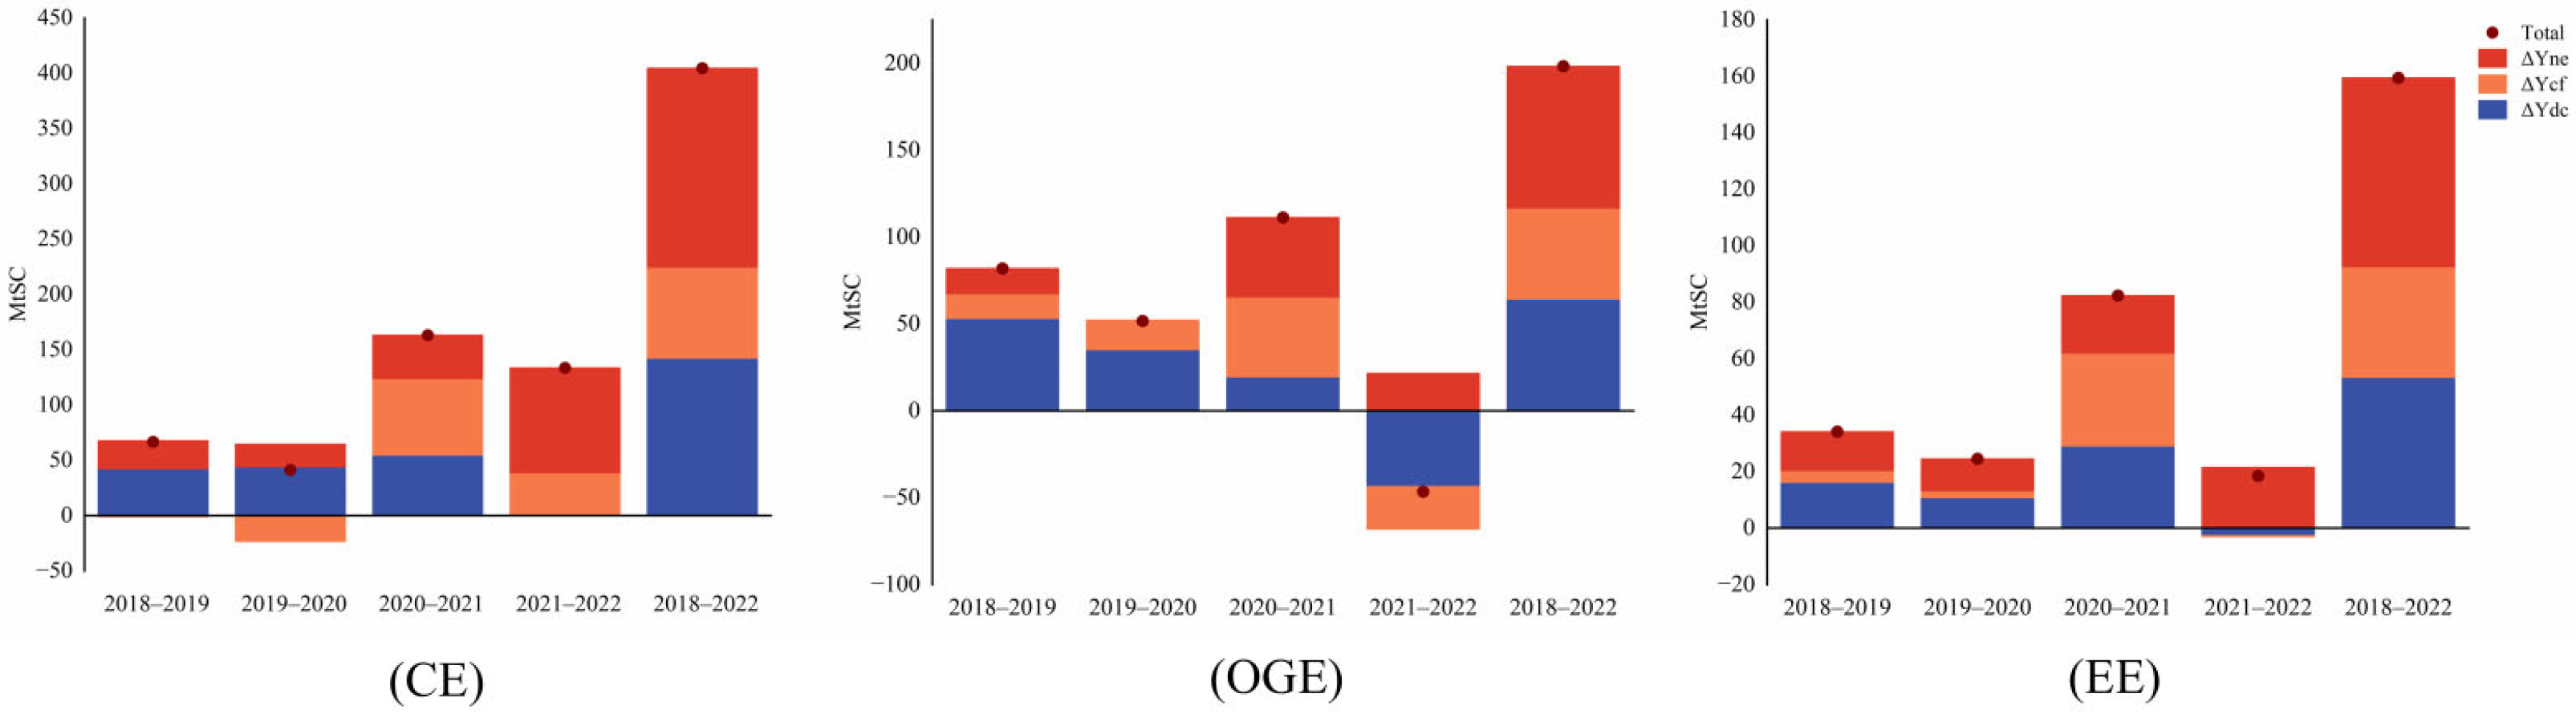
4.2. Analysis of Driving Forces of Energy Consumption
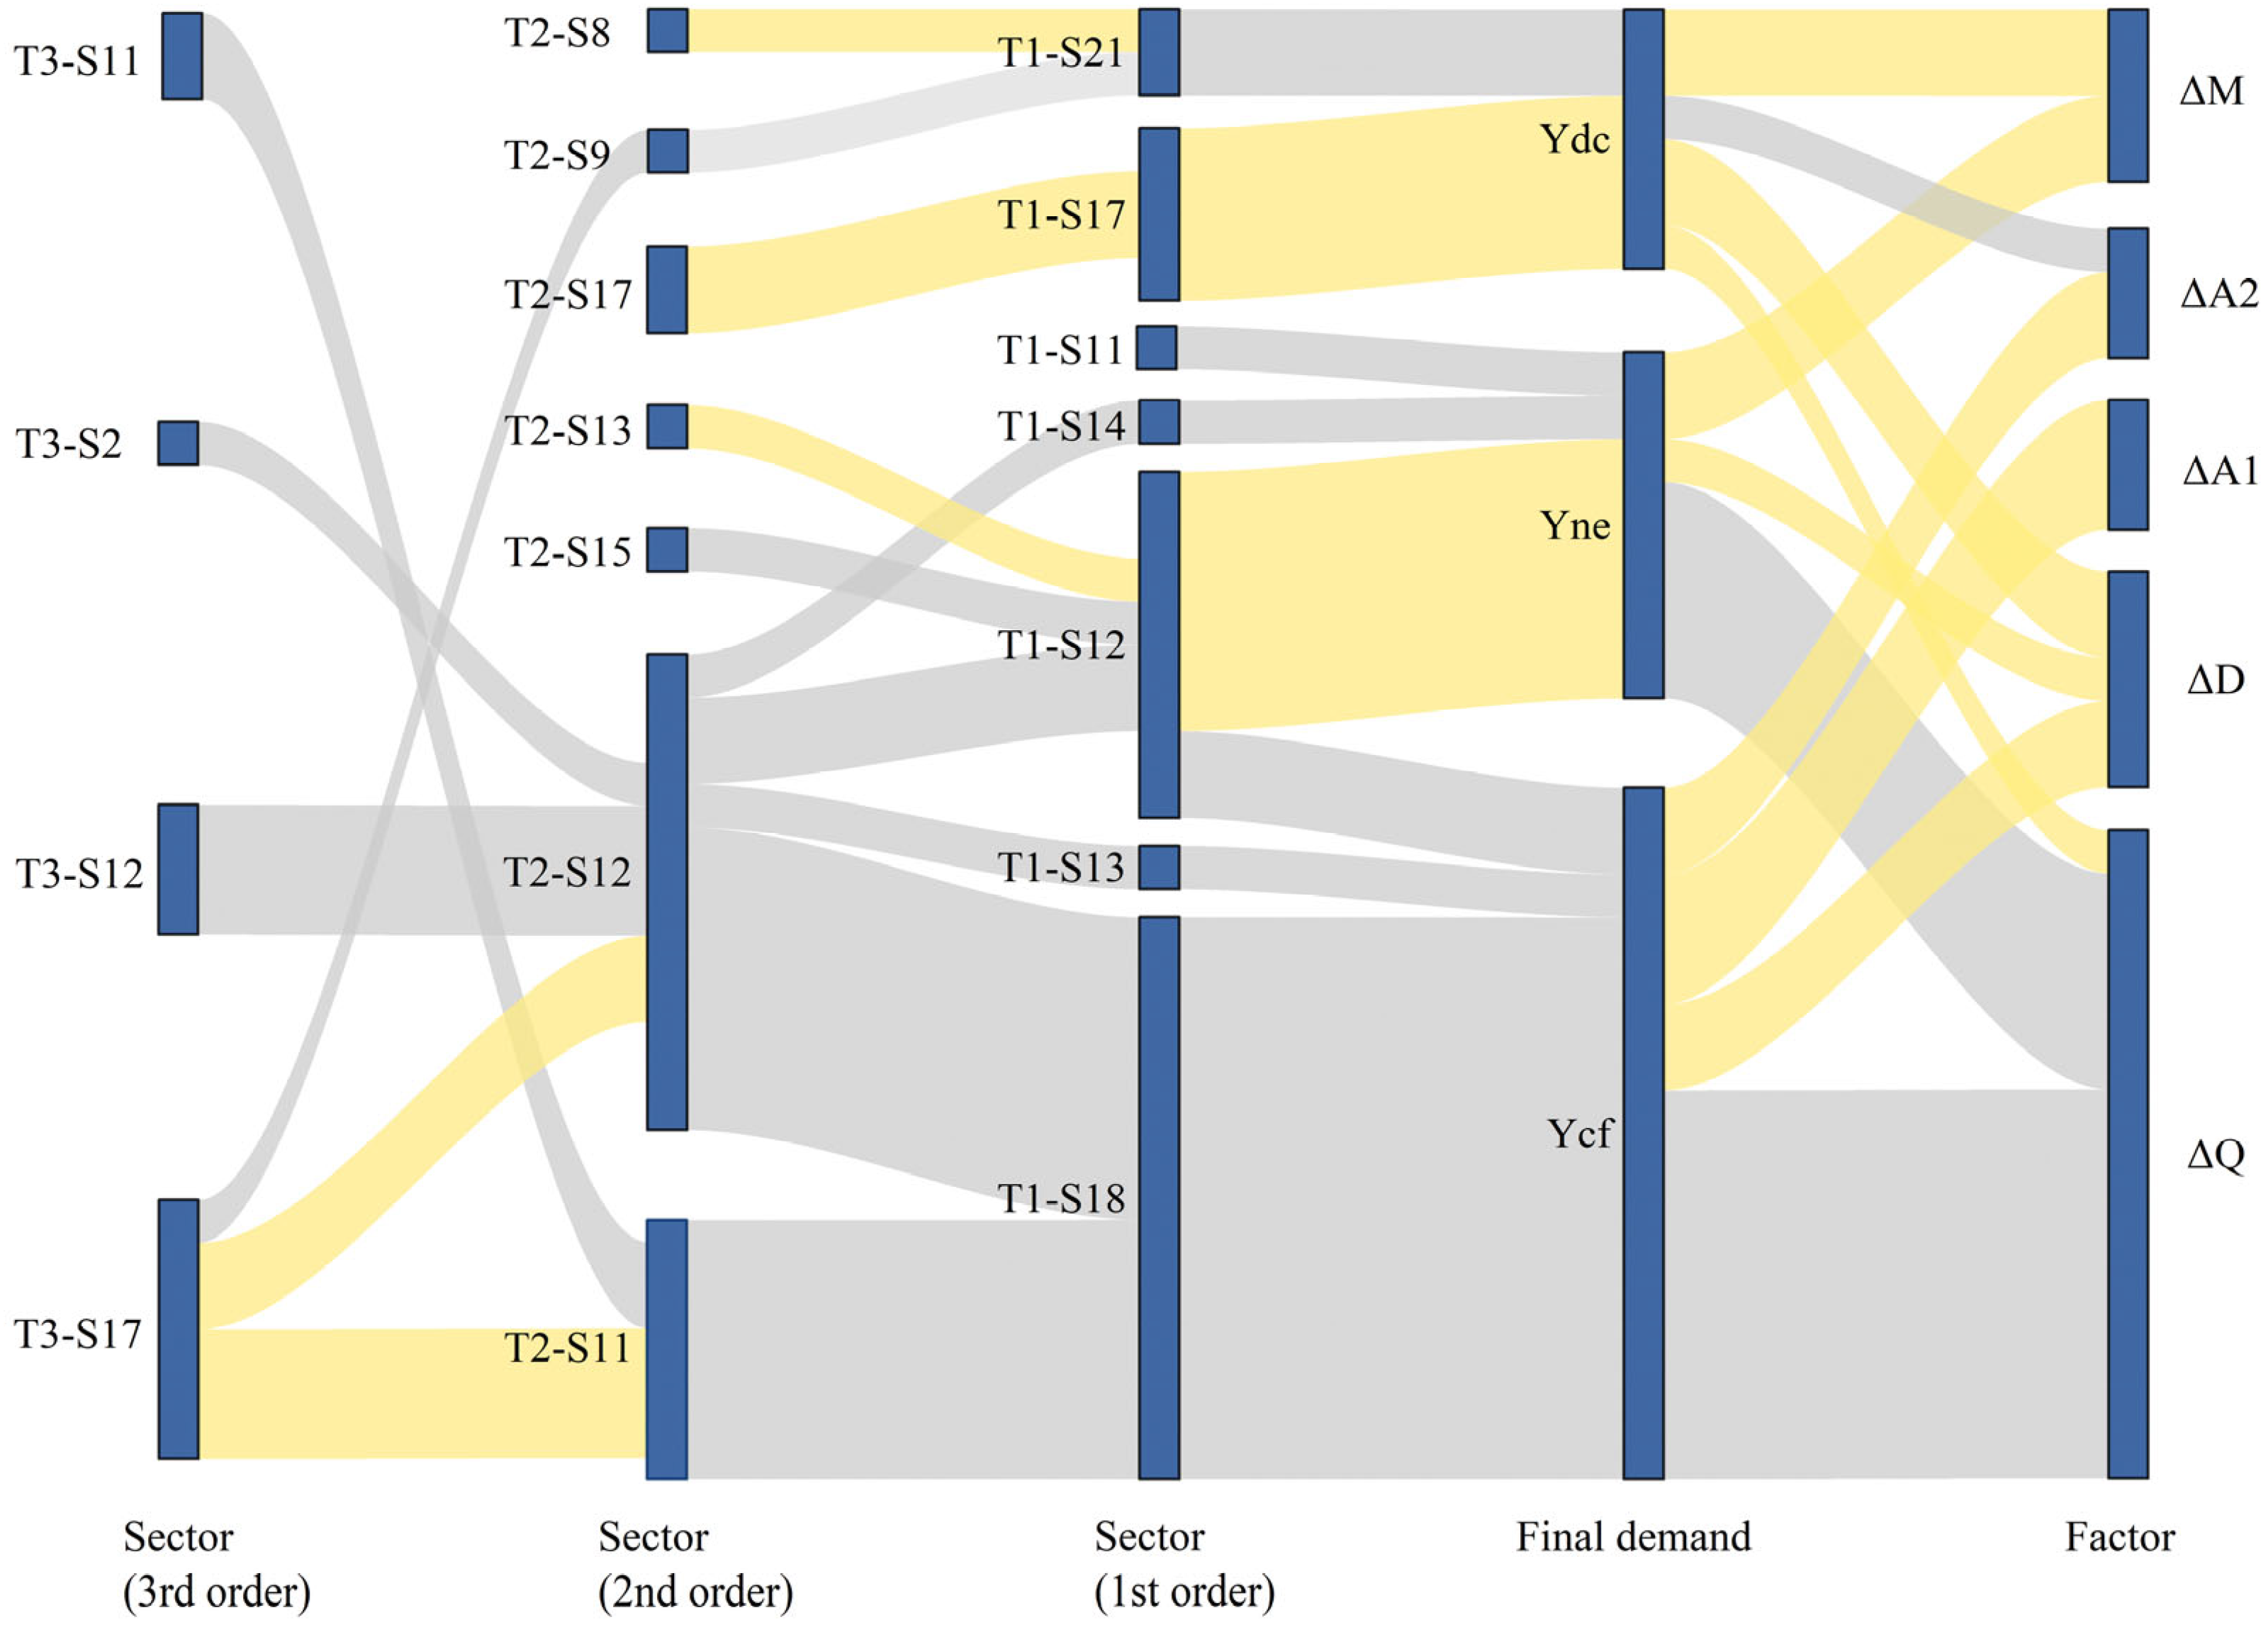
4.3. Critical Path Analysis of Energy Consumption
5. Conclusions
- (1)
- Promote the structural transformation of energy consumption and increase the proportion of clean energy. Statistical data clearly show that China’s reliance on traditional energy sources continues to grow, despite its limited domestic energy reserves. To address this, the government should optimize the shift towards clean energy sources such as hydroelectric, wind, and solar power. This transition could be achieved by offering subsidies to clean energy enterprises, investing in the progress of clean energy infrastructure, and incentivizing households to adopt cleaner energy solutions. Supporting the scaling up of these renewable sources would help reduce China’s dependence on traditional energy and promote more sustainable energy consumption.
- (2)
- Improve energy efficiency in energy-intensive industries and maximize energy utilization. Energy-efficient production is a key strategy actively adopted by industrialized nations to optimize energy utilization. The empirical results indicate that both the construction and manufacturing sectors exhibit substantial energy consumption. To further enhance energy efficiency in China, high-energy-consuming sectors such as industry and construction should prioritize the utilization of energy-saving technologies and practices. For example, promoting the development of energy-efficient industrial equipment and advancing green building technologies can significantly decrease energy consumption in these sectors. In addition, the transportation sector should focus on expanding the application of new energy vehicles and developing electrified rail systems, which would help to decrease energy waste and facilitate overall energy efficiency.
- (3)
- Strengthen government regulation and policy support. Given the growing energy consumption, achieving sustainable energy-saving development is a pressing challenge for the Chinese government. To address this, the government can establish stringent energy-efficiency standards and set entry thresholds for energy-intensive industries, thereby phasing out outdated production capacities and optimizing the allocation of energy resources. Additionally, policy support can play a critical role in incentivizing energy-saving practices. The government can offer subsidies or tax incentives to encourage enterprises to apply low-energy-consumption technologies and practices, facilitating the transition to more energy-efficient production methods and promoting long-term sustainability.
Author Contributions
Funding
Data Availability Statement
Acknowledgments
Conflicts of Interest
Appendix A

| Serial Number | Industry Title |
|---|---|
| S1 | Agriculture, hunting, forestry, and fishing |
| S2 | Mining and quarrying |
| S3 | Food, beverages, and tobacco |
| S4 | Textiles and textile products |
| S5 | Leather, leather products, and footwear |
| S6 | Wood and products of wood and cork |
| S7 | Pulp, paper, paper products, printing, and publishing |
| S8 | Coke, refined petroleum, and nuclear fuel |
| S9 | Chemicals and chemical products |
| S10 | Rubber and plastics |
| S11 | Other nonmetallic minerals |
| S12 | Basic metals and fabricated metal |
| S13 | Machinery, nec |
| S14 | Electrical and optical equipment |
| S15 | Transport equipment |
| S16 | Manufacturing, nec, recycling |
| S17 | Electricity, gas, and water supply |
| S18 | Construction |
| S19 | Retail, hotels and restaurants |
| S20 | Transportation and post and telecommunications |
| S21 | Comprehensive service industry |
| Rank | Sector (3rd Order) | Sector (2nd Order) | Sector (1st Order) | Final Demand | Factor | Order | CE (MtSC) |
|---|---|---|---|---|---|---|---|
| 1 | T2-S12 | T1-S18 | ΔQ | 2 | −90.47 | ||
| 2 | T2-S11 | T1-S18 | ΔQ | 2 | −77.74 | ||
| 3 | T1-S17 | ΔM | 1 | 66.01 | |||
| 4 | T1-S17 | ΔD | 1 | 32.22 | |||
| 5 | T1-S12 | ΔQ | 1 | −30.31 | |||
| 6 | T3-S12 | T2-S12 | T1-S18 | ΔQ | 3 | −27.58 | |
| 7 | T1-S12 | ΔM | 1 | 21.36 | |||
| 8 | T2-S17 | T1-S17 | ΔM | 2 | 18.65 | ||
| 9 | T2-S12 | T1-S14 | ΔQ | 2 | −14.20 | ||
| 10 | T1-S12 | ΔD | 1 | 13.26 | |||
| 11 | T3-S17 | T2-S11 | T1-S18 | ΔA2 | 3 | 13.17 | |
| 12 | T3-S12 | T2-S12 | T1-S18 | ΔD | 3 | 13.00 | |
| 13 | T3-S17 | T2-S9 | T1-S21 | ΔA2 | 3 | −12.40 | |
| 14 | T3-S11 | T2-S11 | T1-S18 | ΔQ | 3 | −11.60 | |
| 15 | T3-S11 | T2-S11 | T1-S18 | ΔA1 | 3 | 11.23 | |
| 16 | T2-S12 | T1-S13 | ΔQ | 2 | −11.08 | ||
| 17 | T3-S17 | T2-S11 | T1-S18 | ΔD | 3 | 10.92 | |
| 18 | T3-S17 | T2-S11 | T1-S18 | ΔA1 | 3 | 10.82 | |
| 19 | T1-S12 | ΔQ | 1 | −10.47 | |||
| 20 | T3-S17 | T2-S12 | T1-S18 | ΔQ | 3 | 10.29 | |
| 21 | T2-S12 | T1-S12 | ΔQ | 2 | −9.24 | ||
| 22 | T2-S17 | T1-S17 | ΔD | 2 | 9.18 | ||
| 23 | T3-S17 | T2-S12 | T1-S18 | ΔA1 | 3 | −8.16 | |
| 24 | T2-S15 | T1-S12 | ΔQ | 2 | −8.08 | ||
| 25 | T3-S2 | T2-S12 | T1-S18 | ΔQ | 3 | −8.04 | |
| 26 | T3-S12 | T2-S12 | T1-S18 | ΔA2 | 3 | 7.89 | |
| 27 | T2-S13 | T1-S12 | ΔQ | 2 | 7.20 | ||
| 28 | T2-S8 | T1-S21 | ΔQ | 2 | 6.63 | ||
| 29 | T1-S11 | ΔQ | 1 | −6.57 | |||
| 30 | T2-S12 | T1-S12 | ΔM | 2 | 6.52 |
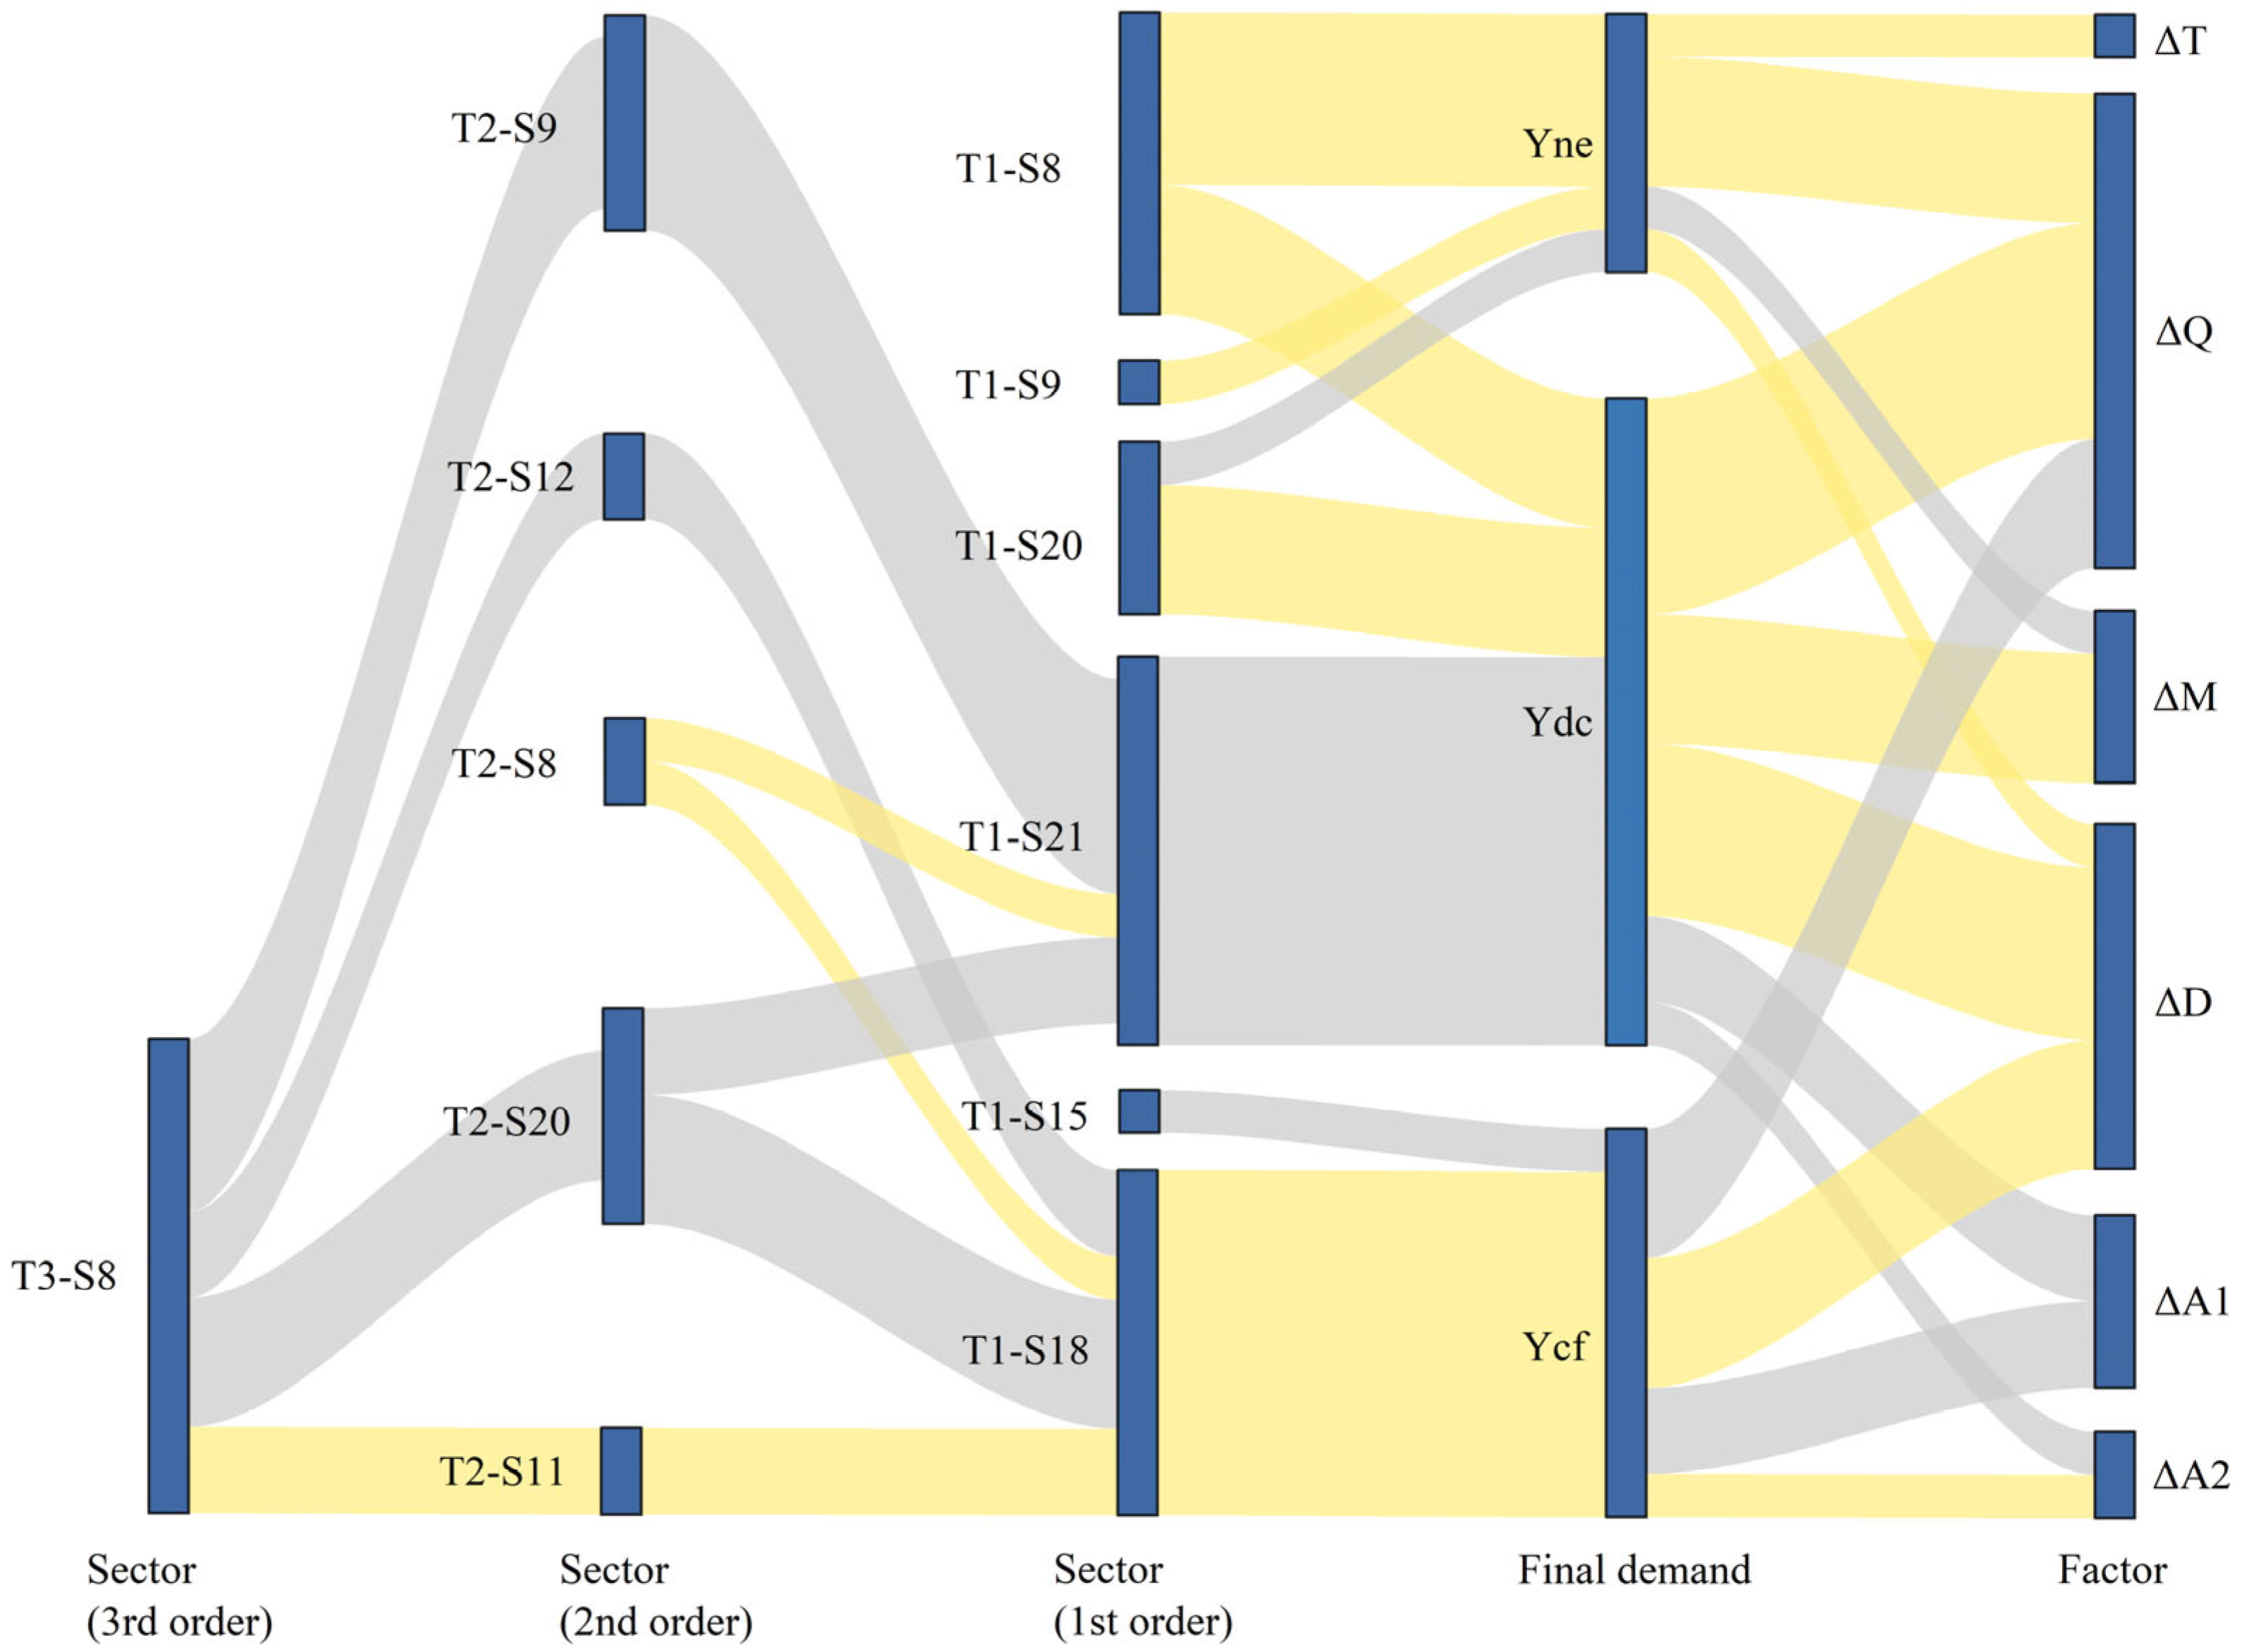
| Rank | Sector (3rd Order) | Sector (2nd Order) | Sector (1st Order) | Final Demand | Factor | Order | OGE (MtSC) |
|---|---|---|---|---|---|---|---|
| 1 | T1-S20 | ΔM | 1 | 14.99 | |||
| 2 | T3-S8 | T2-S9 | T1-S21 | ΔA2 | 3 | −14.09 | |
| 3 | T1-S8 | ΔD | 1 | 11.74 | |||
| 4 | T3-S8 | T2-S12 | T1-S18 | ΔA1 | 3 | −11.07 | |
| 5 | T2-S8 | T1-S21 | ΔQ | 2 | 10.03 | ||
| 6 | T1-S20 | ΔQ | 1 | −8.94 | |||
| 7 | T1-S8 | ΔD | 1 | 8.76 | |||
| 8 | T2-S8 | T1-S18 | ΔQ | 2 | 8.20 | ||
| 9 | T1-S8 | ΔQ | 1 | 7.59 | |||
| 10 | T1-S8 | ΔM | 1 | 7.43 | |||
| 11 | T1-S20 | ΔD | 1 | 7.10 | |||
| 12 | T2-S20 | T1-S18 | ΔQ | 2 | −6.25 | ||
| 13 | T3-S8 | T2-S11 | T1-S18 | ΔA2 | 3 | 5.90 | |
| 14 | T2-S20 | T1-S21 | ΔQ | 2 | −5.75 | ||
| 15 | T1-S8 | ΔQ | 1 | 5.69 | |||
| 16 | T3-S8 | T2-S9 | T1-S21 | ΔA1 | 3 | −5.61 | |
| 17 | T3-S8 | T2-S12 | T1-S18 | ΔD | 3 | 5.55 | |
| 18 | T3-S8 | T2-S9 | T1-S21 | ΔD | 3 | 5.51 | |
| 19 | T1-S8 | ΔT | 1 | 5.47 | |||
| 20 | T1-S8 | ΔM | 1 | −5.18 | |||
| 21 | T2-S9 | T1-S21 | ΔQ | 2 | 5.05 | ||
| 22 | T3-S8 | T2-S11 | T1-S18 | ΔD | 3 | 4.82 | |
| 23 | T1-S15 | ΔQ | 1 | −4.37 | |||
| 24 | T1-S21 | ΔD | 1 | 4.26 | |||
| 25 | T3-S8 | T2-S20 | T1-S18 | ΔA1 | 3 | −3.90 | |
| 26 | T3-S8 | T2-S9 | T1-S21 | ΔM | 3 | −3.86 | |
| 27 | T3-S8 | T2-S20 | T1-S18 | ΔD | 3 | 3.83 | |
| 28 | T1-S20 | ΔQ | 1 | −3.82 | |||
| 29 | T1-S9 | ΔQ | 1 | 3.71 | |||
| 30 | T3-S8 | T2-S20 | T1-S21 | ΔA1 | 3 | −3.60 |
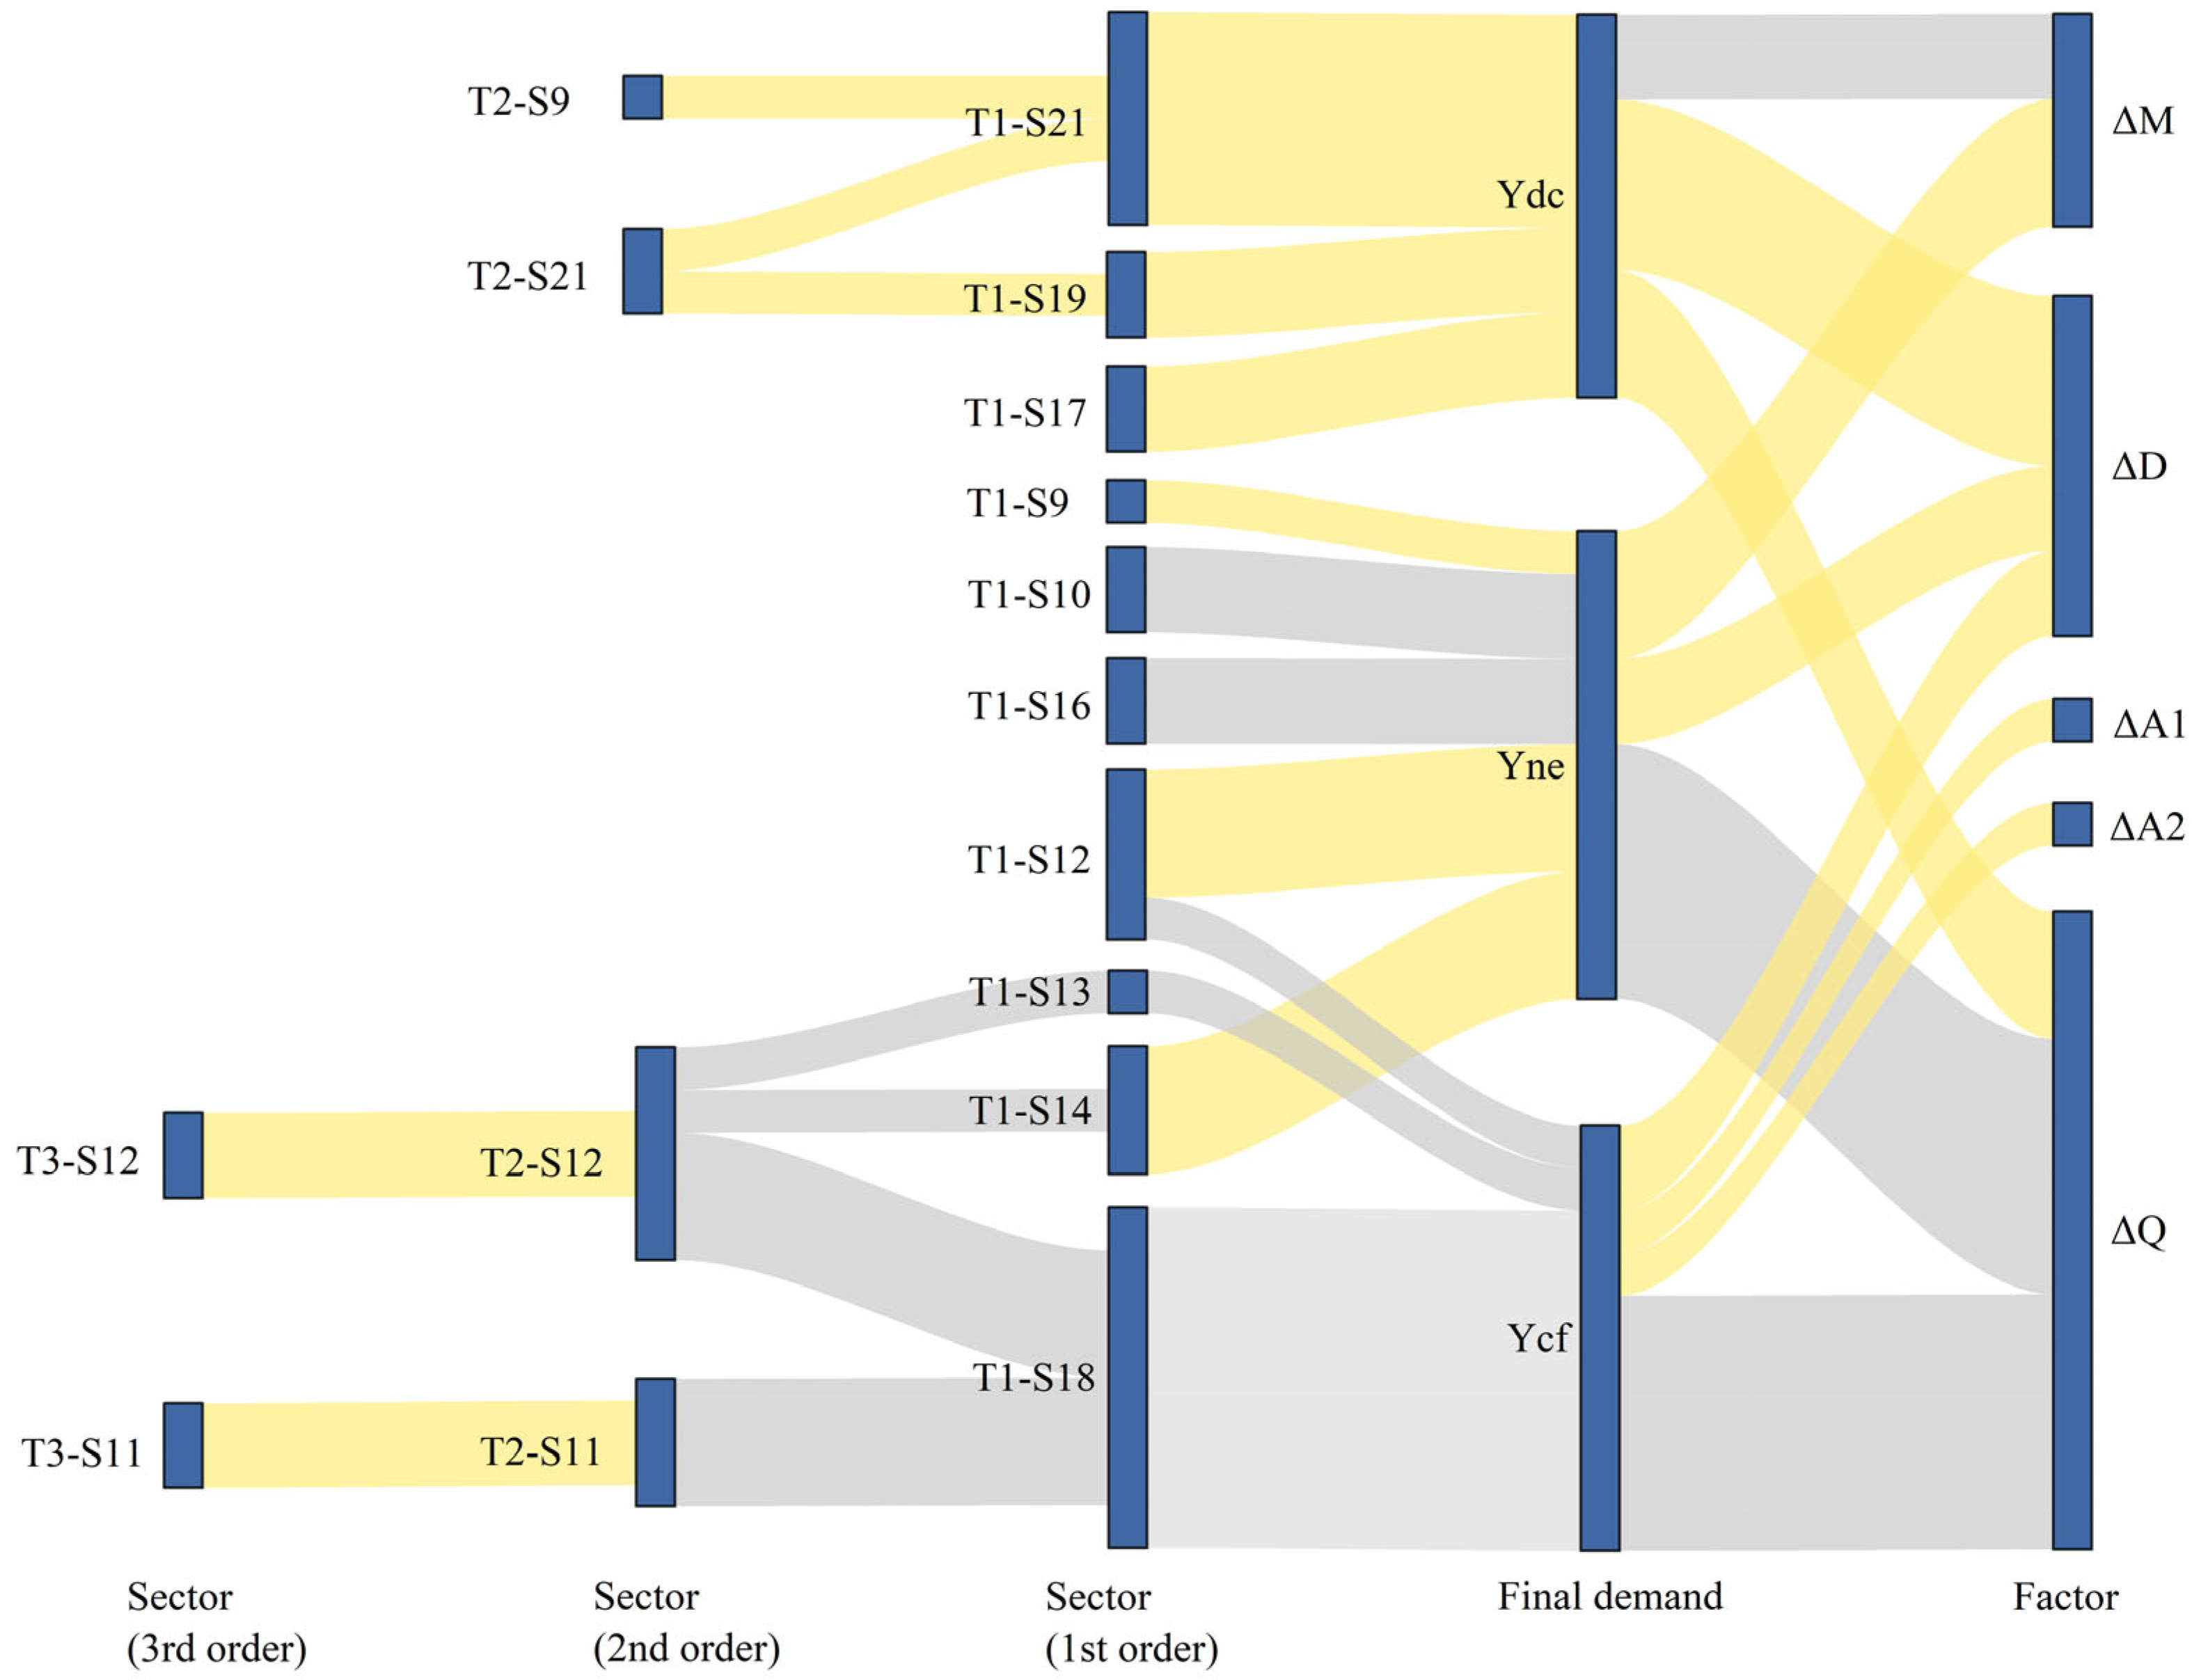
| Rank | Sector (3rd Order) | Sector (2nd Order) | Sector (1st Order) | Final Demand | Factor | Order | EE (MtSC) |
|---|---|---|---|---|---|---|---|
| 1 | T2-S12 | T1-S18 | ΔQ | 2 | −17.17 | ||
| 2 | T2-S11 | T1-S18 | ΔQ | 2 | −16.46 | ||
| 3 | T1-S21 | ΔD | 1 | 10.08 | |||
| 4 | T1-S21 | ΔM | 1 | −7.06 | |||
| 5 | T1-S21 | ΔQ | 1 | 5.81 | |||
| 6 | T1-S12 | ΔQ | 1 | −5.75 | |||
| 7 | T1-S12 | ΔM | 1 | 5.38 | |||
| 8 | T3-S12 | T2-S12 | T1-S18 | ΔQ | 3 | −5.24 | |
| 9 | T1-S17 | ΔM | 1 | 5.22 | |||
| 10 | T1-S14 | ΔQ | 1 | 3.64 | |||
| 11 | T1-S12 | ΔD | 1 | 3.44 | |||
| 12 | T3-S12 | T2-S12 | T1-S18 | ΔD | 3 | 3.33 | |
| 13 | T1-S16 | ΔQ | 1 | −3.00 | |||
| 14 | T1-S10 | ΔM | 1 | −2.95 | |||
| 15 | T1-S18 | ΔD | 1 | 2.94 | |||
| 16 | T3-S11 | T2-S11 | T1-S18 | ΔA1 | 3 | 2.70 | |
| 17 | T2-S12 | T1-S14 | ΔQ | 2 | −2.69 | ||
| 18 | T2-S9 | T1-S21 | ΔQ | 2 | 2.67 | ||
| 19 | T1-S14 | ΔD | 1 | 2.55 | |||
| 20 | T3-S11 | T2-S11 | T1-S18 | ΔQ | 3 | −2.46 | |
| 21 | T1-S16 | ΔM | 1 | 2.44 | |||
| 22 | T1-S10 | ΔQ | 1 | 2.37 | |||
| 23 | T1-S19 | ΔD | 1 | 2.29 | |||
| 24 | T1-S17 | ΔQ | 1 | −2.26 | |||
| 25 | T2-S21 | T1-S19 | ΔD | 2 | 2.15 | ||
| 26 | T2-S12 | T1-S13 | ΔQ | 2 | −2.10 | ||
| 27 | T2-S21 | T1-S21 | ΔD | 2 | 2.08 | ||
| 28 | T3-S12 | T2-S12 | T1-S18 | ΔA2 | 3 | 1.99 | |
| 29 | T1-S12 | ΔQ | 1 | −1.99 | |||
| 30 | T1-S9 | ΔQ | 1 | 1.96 |
References
- Zheng, J.; Dang, Y.; Assad, U. Household energy consumption, energy efficiency, and household income–Evidence from China. Appl. Energy 2024, 353, 122074. [Google Scholar] [CrossRef]
- Huang, W.; Das, G.; Dilanchiev, A.; Giyasova, Z.; Gu, M. Role of multiple energy sources under carbon neturality goals, income and energy consumption in transition economies: A joint case study between China and Uzbekistan. Energy 2024, 309, 132803. [Google Scholar] [CrossRef]
- Shinwari, R.; Wang, Y.; Gozgor, G.; Mousavi, M. Does FDI affect energy consumption in the belt and road initiative economies? The role of green technologies. Energy Econ. 2024, 132, 107409. [Google Scholar] [CrossRef]
- Brodny, J.; Tutak, M. Analysis of the efficiency and structure of energy consumption in the industrial sector in the European Union countries between 1995 and 2019. Sci. Total Environ. 2022, 808, 152052. [Google Scholar] [CrossRef]
- Wang, Y.; Sun, L.; Yang, R.; He, W.; Tang, Y.; Zhang, Z.; Wang, Y.; Sapnken, F.E. A novel structure adaptive fractional derivative grey model and its application in energy consumption prediction. Energy 2023, 282, 128380. [Google Scholar] [CrossRef]
- Shen, J.; Zhang, Y.; Chen, X. Environmental regulation and energy consumption transition of rural residents: A case of China. Energy 2024, 310, 133195. [Google Scholar] [CrossRef]
- Zhang, D.; Zhao, M.; Wang, Y.; Vigne, S.A.; Benkraiem, R. Technological innovation and its influence on energy risk management: Unpacking China’s energy consumption structure optimisation amidst climate change. Energy Econ. 2024, 131, 107321. [Google Scholar] [CrossRef]
- Wu, L.; Xu, C.; Zhu, Q.; Zhou, D. Multiple energy price distortions and improvement of potential energy consumption structure in the energy transition. Appl. Energy 2024, 362, 122992. [Google Scholar] [CrossRef]
- Zeng, S.; Su, B.; Zhang, M.; Gao, Y.; Liu, J.; Luo, S.; Tao, Q. Analysis and forecast of China’s energy consumption structure. Energy Policy 2021, 159, 112630. [Google Scholar] [CrossRef]
- Hjelkrem, O.A.; Lervåg, K.Y.; Babri, S.; Lu, C.; Södersten, C.J. A battery electric bus energy consumption model for strategic purposes: Validation of a proposed model structure with data from bus fleets in China and Norway. Transp. Res. Part D Transp. Environ. 2021, 94, 102804. [Google Scholar] [CrossRef]
- Yasmeen, R.; Tao, R.; Jie, W.; Padda, I.U.H.; Shah, W.U.H. The repercussions of business cycles on renewable & non-renewable energy consumption structure: Evidence from OECD countries. Renew. Energy 2022, 190, 572–583. [Google Scholar] [CrossRef]
- Gasparotto, J.; Martinello, K.D.B. Coal as an energy source and its impacts on human health. Energy Geosci. 2021, 2, 113–120. [Google Scholar] [CrossRef]
- Gyamfi, B.A.; Adedoyin, F.F.; Bein, M.A.; Bekun, F.V.; Agozie, D.Q. The anthropogenic consequences of energy consumption in E7 economies: Juxtaposing roles of renewable, coal, nuclear, oil and gas energy: Evidence from panel quantile method. J. Clean. Prod. 2021, 295, 126373. [Google Scholar] [CrossRef]
- Samour, A.; Adebayo, T.S.; Agyekum, E.B.; Khan, B.; Kamel, S. Insights from BRICS-T economies on the impact of human capital and renewable electricity consumption on environmental quality. Sci. Rep. 2023, 13, 5245. [Google Scholar] [CrossRef]
- Xu, G.; Schwarz, P.; Yang, H. Adjusting energy consumption structure to achieve China’s CO2 emissions peak. Renew. Sustain. Energy Rev. 2020, 122, 109737. [Google Scholar] [CrossRef]
- Azam, M.; Liu, L.; Ahmad, N. Impact of institutional quality on environment and energy consumption: Evidence from developing world. Environ. Dev. Sustain. 2021, 23, 1646–1667. [Google Scholar] [CrossRef]
- Zha, J.; Shao, Y.; Li, Z. Linkage analysis of tourism-related sectors in China: An assessment based on network analysis technique. Int. J. Tour. Res. 2019, 21, 531–543. [Google Scholar] [CrossRef]
- Li, X.; Song, Y. A novel assessment framework for colored-water footprint inequality in China. Ecol. Indic. 2025, 173, 113350. [Google Scholar] [CrossRef]
- Fu, R.; Jin, G.; Chen, J.; Ye, Y. The effects of poverty alleviation investment on carbon emissions in China based on the multiregional input–output model. Technol. Forecast. Soc. Change 2021, 162, 120344. [Google Scholar] [CrossRef]
- Chai, L.; Han, A.; Yan, X.; Ma, S. Employing input-output model to assess the water footprint of energy system. In Water Footprint. Environmental Footprints and Eco-Design of Products and Processes; Springer: Singapore, 2021; pp. 157–185. [Google Scholar] [CrossRef]
- Jander, W. An extended hybrid input-output model applied to fossil-and bio-based plastics. MethodsX 2021, 8, 101525. [Google Scholar] [CrossRef]
- Chen, L.; Huang, G.; Luo, B.; Liu, L. Unveiling environmental implications of Canadian electricity system’s low-carbon transitions: A multi-regional stochastic optimization-driven input-output model. J. Clean. Prod. 2023, 420, 138363. [Google Scholar] [CrossRef]
- Liu, E.; Tsyvinski, A. A Dynamic Model of Input–Output Networks. Rev. Econ. Stud. 2024, 91, 3608–3644. [Google Scholar] [CrossRef]
- Liang, S.; Wang, C.; Zhang, T. An improved input–output model for energy analysis: A case study of Suzhou. Ecol. Econ. 2010, 69, 1805–1813. [Google Scholar] [CrossRef]
- Guevara, Z.; Domingos, T. The multi-factor energy input–output model. Energy Econ. 2017, 61, 261–269. [Google Scholar] [CrossRef]
- Lee, I.; Jang, S.; Chung, Y.; Seo, H. Economic spillover from renewable energy industries: An input-output analysis. Int. J. Green Energy 2022, 19, 809–817. [Google Scholar] [CrossRef]
- Zhu, W.; Duan, C.; Chen, B. Energy efficiency assessment of wastewater treatment plants in China based on multiregional input–output analysis and data envelopment analysis. Appl. Energy 2024, 356, 122462. [Google Scholar] [CrossRef]
- Li, Z.; Lin, Y.Y.; Song, Y.; Li, Z. Linkages and flow paths of energy consumption: Evidence from China’s sectors. Energy Rep. 2023, 9, 4594–4603. [Google Scholar] [CrossRef]
- Zhang, H.; Li, R.; Chen, B.; Lin, H.; Zhang, Q.; Liu, M.; Chen, L.; Wang, X. Evolution of the life cycle primary PM2.5 emissions in globalized production systems. Environ. Int. 2019, 131, 104996. [Google Scholar] [CrossRef]
- Liao, H.; Andrade, C.; Lumbreras, J.; Tian, J. CO2 emissions in Beijing: Sectoral linkages and demand drivers. J. Clean. Prod. 2017, 166, 395–407. [Google Scholar] [CrossRef]
- Bai, H.; Feng, X.; Hou, H.; He, G.; Dong, Y.; Xu, H. Mapping inter-industrial CO2 flows within China. Renew. Sustain. Energy Rev. 2018, 93, 400–408. [Google Scholar] [CrossRef]
- Liu, Y.; Song, Y. Does artificial ecosystem recharge make sense? based on the coupled water orbit research framework. Ecol. Indic. 2024, 166, 112496. [Google Scholar] [CrossRef]
- Lan, J.; Malik, A.; Lenzen, M.; McBain, D.; Kanemoto, K. A structural decomposition analysis of global energy footprints. Appl. Energy 2016, 163, 436–451. [Google Scholar] [CrossRef]
- Su, B.; Ang, B.W. Structural decomposition analysis applied to energy and emissions: Some methodological developments. Energy Econ. 2012, 34, 177–188. [Google Scholar] [CrossRef]
- Zhang, X.; Zhou, M.; Li, J.; Wei, L.; Dong, Y.; Hou, H.; Chen, C.; Wang, Z. Analysis of driving factors on China’s industrial solid waste generation: Insights from critical supply chains. Sci. Total Environ. 2021, 775, 145185. [Google Scholar] [CrossRef] [PubMed]
- Xu, S.C.; Zhang, L.; Liu, Y.T.; Zhang, W.W.; He, Z.X.; Long, R.Y.; Chen, H. Determination of the factors that influence increments in CO2 emissions in Jiangsu, China using the SDA method. J. Clean. Prod. 2017, 142, 3061–3074. [Google Scholar] [CrossRef]
- Wood, R.; Lenzen, M. Structural path decomposition. Energy Econ. 2009, 31, 335–341. [Google Scholar] [CrossRef]
- Owen, A.; Wood, R.; Barrett, J.; Evans, A. Explaining value chain differences in MRIO databases through structural path decomposition. Econ. Syst. Res. 2016, 28, 243–272. [Google Scholar] [CrossRef]
- Guo, S.; Zheng, S.; Hu, Y.; Hong, J.; Wu, X.; Tang, M. Embodied energy use in the global construction industry. Appl. Energy 2019, 256, 113838. [Google Scholar] [CrossRef]
- Gui, S.; Mu, H.; Li, N. Analysis of impact factors on China’s CO2 emissions from the view of supply chain paths. Energy 2014, 74, 405–416. [Google Scholar] [CrossRef]
- Oteng-Abayie, E.F.; Mensah, G. The impact of urbanization and industrial structure upgrading on energy intensities in Sub-Saharan Africa. Environ. Dev. Sustain. 2024, 26, 1–23. [Google Scholar] [CrossRef]
- Chen, C.; Liu, G.; Meng, F.; Hao, Y.; Zhang, Y.; Casazza, M. Energy consumption and carbon footprint accounting of urban and rural residents in Beijing through Consumer Lifestyle Approach. Ecol. Indic. 2019, 98, 575–586. [Google Scholar] [CrossRef]
- Wang, C.; Wang, F.; Zhang, X.; Wang, Y.; Su, Y.; Ye, Y.; Wu, Q.; Zhang, H.O. Dynamic features and driving mechanism of coal consumption for Guangdong province in China. J. Geogr. Sci. 2022, 32, 401–420. [Google Scholar] [CrossRef]
- Zhang, J.; Wang, H.; Ma, L.; Wang, J.; Wang, J.; Wang, Z.; Yue, Q. Structural path decomposition analysis of resource utilization in China, 1997–2017. J. Clean. Prod. 2021, 322, 129006. [Google Scholar] [CrossRef]
- Tian, Y.; Xiong, S.; Ma, X.; Ji, J. Structural path decomposition of carbon emission: A study of China’s manufacturing industry. J. Clean. Prod. 2018, 193, 563–574. [Google Scholar] [CrossRef]
- Liu, X.; Zhou, D.; Zhou, P.; Wang, Q. Factors driving energy consumption in China: A joint decomposition approach. J. Clean. Prod. 2018, 172, 724–734. [Google Scholar] [CrossRef]
Disclaimer/Publisher’s Note: The statements, opinions and data contained in all publications are solely those of the individual author(s) and contributor(s) and not of MDPI and/or the editor(s). MDPI and/or the editor(s) disclaim responsibility for any injury to people or property resulting from any ideas, methods, instructions or products referred to in the content. |
© 2025 by the authors. Licensee MDPI, Basel, Switzerland. This article is an open access article distributed under the terms and conditions of the Creative Commons Attribution (CC BY) license (https://creativecommons.org/licenses/by/4.0/).
Share and Cite
Liang, Y.; Song, Y.; Chen, Z. Correlation Effects, Driving Forces and Evolutionary Paths of Cross-Industry Transfer of Energy Consumption in China: A New Analytical Framework. Energies 2025, 18, 3128. https://doi.org/10.3390/en18123128
Liang Y, Song Y, Chen Z. Correlation Effects, Driving Forces and Evolutionary Paths of Cross-Industry Transfer of Energy Consumption in China: A New Analytical Framework. Energies. 2025; 18(12):3128. https://doi.org/10.3390/en18123128
Chicago/Turabian StyleLiang, Yufan, Yu Song, and Zuxu Chen. 2025. "Correlation Effects, Driving Forces and Evolutionary Paths of Cross-Industry Transfer of Energy Consumption in China: A New Analytical Framework" Energies 18, no. 12: 3128. https://doi.org/10.3390/en18123128
APA StyleLiang, Y., Song, Y., & Chen, Z. (2025). Correlation Effects, Driving Forces and Evolutionary Paths of Cross-Industry Transfer of Energy Consumption in China: A New Analytical Framework. Energies, 18(12), 3128. https://doi.org/10.3390/en18123128