Article

Sensitivity Analysis of a Hybrid PV-WT Hydrogen Production System via an Electrolyzer and Fuel Cell Using TRNSYS in Coastal Regions: A Case Study in Perth, Australia

Department of Mechanical Engineering, Faculty of Engineering, Tafila Technical University, Tafila 66110, Jordan
Energies 2025, 18(12), 3108; https://doi.org/10.3390/en18123108
Submission received: 15 April 2025 / Revised: 21 May 2025 / Accepted: 29 May 2025 / Published: 12 June 2025
(This article belongs to the Special Issue Research on Integration and Storage Technology of Hydrogen Energy)

Abstract

:
This article presents a modeling and analysis approach for a hybrid photovoltaic wind turbine (PV-WT) hydrogen production system. This study uses the TRNSYS simulation platform to evaluate the system under coastal climate conditions in Perth, Australia. The system encapsulates an advanced alkaline electrolyzer (ELE) and an alkaline fuel cell (AFC). A comprehensive 4E (energy, exergy, economic, and environmental) assessment is conducted. The analysis is based on hourly dynamic simulations over a full year. Key performance metrics include hydrogen production, energy and exergy efficiencies, carbon emission reduction, levelized cost of energy (LCOE), and levelized cost of hydrogen (LCOH). The TRNSYS model is validated against the existing literature data. The results show that the system performance is highly sensitive to ambient conditions. A sensitivity analysis reveals an energy efficiency of 7.3% and an exergy efficiency of 5.2%. The system has an entropy generation of 6.22 kW/K and a sustainability index of 1.055. The hybrid PV-WT system generates 1898.426 MWh of renewable electricity annually. This quantity corresponds to 252.7 metric tons of hydrogen production per year. The validated model shows a stable LCOE of 0.102 USD/kWh, an LCOH of 4.94 USD/kg, an energy payback time (EPBT) of 5.61 years, and cut CO2 emissions of 55,777.13 tons. This research provides a thorough analysis for developing green hydrogen systems using hybrid renewables. This study also offers a robust prediction model, enabling further enhancements in hybrid renewable hydrogen production.

1. Introduction

Generating electricity from fossil fuels, along with the associated environmental crisis, poses one of the most significant global challenges. Such an issue is considered a substantial reason to seek alternative global trends toward future green energy with net-zero emissions [1,2,3]. Nowadays, researchers are increasingly interested in solar and wind energy due to their environmental benefits. These renewable energy resources offer numerous advantages, including abundant availability, enhanced safety, decreased greenhouse gas emissions, increased energy security, and lower contributions to global warming [4,5,6].
The topic of hydrogen energy is rapidly developing and focuses on using hydrogen as a sustainable, clean energy source [7,8,9]. Using hydrogen as a fuel is a very appealing alternative for combating climate change and reducing dependency on fossil fuels. Prominent renewable resources like solar, wind, and geothermal power can produce hydrogen energy. This may offer a sustainable alternative to meet growing global energy demands while addressing environmental concerns. It was anticipated that the amount of hydrogen demanded worldwide would rise from 70 to 120 million tons for the period from 2019 to 2024 [10,11].
Hydrogen boasts a high energy density of 120–142 MJ/kg, nearly three times that of crude oil [12,13]. While it is flammable, this drawback is minor compared to its advantages. Unlike fossil fuels, hydrogen can be produced anywhere using electricity. It relies on unlimited, clean sources like solar and wind energy, making it a sustainable fuel for the future. The renewable electricity generated can then power the electrolyzer (ELE), which breaks down water into hydrogen and oxygen [11]. This approach enables the development of standalone, eco-friendly hydrogen generation systems, further supporting a sustainable energy future [13,14]. Water electrolysis can safely, cleanly, and effectively produce hydrogen, especially when combined with a renewable energy source like solar or wind power [15]. As a result, there are no emissions because water electrolysis only produces hydrogen and oxygen, and hydrogen is used as fuel to reproduce the water. From the perspective of thermodynamics, hydrogen has three times the energy content of fossil fuels [16]. Hydrogen, a sustainable energy source, could eventually replace fossil fuels and ensure a clean and green environment [17,18]. Furthermore, using solar and wind energy to generate hydrogen with an ELE has resulted in considerable cost savings [19].
Recent studies in the open literature have extensively explored hydrogen production systems powered by renewable energy sources, particularly solar and wind, either individually or in combination. Investments in wind turbines (WTs) and solar photovoltaic (PV) panels for such systems have seen significant growth recently. Researchers have conducted numerous investigations on hydrogen production systems based on solar PV panels. For instance, Chen et al. [20] used the Transient System Simulation Program (TRNSYS) to develop a transient study of a solar PV-powered hydrogen generation system. Researchers found that the volume of the hydrogen storage tank and the rate of hydrogen discharge significantly influence hydrogen production. This impact was particularly significant during the summer. According to the results, over 9600 m3 of hydrogen was produced annually using the 46.67 MW of electricity generated by solar PV panels. Karacavus and Aydın [21] analyzed the performance of a hydrogen generation system powered by solar PV using the TRNSYS program. The electrical power produced by solar PV panels was used to electrolyze water to produce green hydrogen. Topriska et al. [22] conducted a quantitative and experimental study on a solar–hydrogen production system for use in cooking under Jamaican conditions. Further studies on solar–hydrogen systems are available elsewhere [23,24,25,26]. Several studies emphasized the prospect of using wind energy to drive hydrogen production systems. For instance, Mostafaeipour et al. [27] conducted a statistical analysis of the performance of a wind–hydrogen production system across different locations. Their results indicated that using a small wind–hydrogen production system would fuel 22 cars per week. Honnery and Moriarty [28] investigated a wind-powered hydrogen generation system to provide both hydrogen and electrical power. Further studies on wind–hydrogen systems are available elsewhere [29,30,31,32].
Further studies explored the potential benefits of utilizing hybrid PV-WT energy to drive hydrogen production systems. Sopian et al. [14] experimentally investigated a 2 kW hybrid hydrogen production system based on PV-WT energy. The findings showed that the system generated up to 140 mL/min of hydrogen when solar radiation was between 200 and 800 W/m2 and wind speed was between 2 and 5 m/s. Akyuz et al. [33] numerically analyzed the performance of an 11 kW PV-WT hydrogen production system utilizing MATLAB-Simulink. The facility’s average daily energy consumption was 20.33 kWh, with an average peak demand of 2.4 kW. The results showed that, due to the high wind speed and solar radiation in July, 14.4 kg of hydrogen was produced by additional electricity. The overall energy efficiency of wind-ELE systems ranged from 5% to 14%, while the energy efficiency of PV-ELE systems ranged from 7.9% to 8.5%. Many studies have looked into how well combined PV-WT systems perform in terms of energy and exergy for producing hydrogen. These analyses also explored irreversibility and entropy generation to understand system efficiency and performance. For instance, Kalinci et al. [34] optimized the performance of a hybrid PV-WT hydrogen system using the program HOMER. According to the findings, the daily average energy and exergy efficiencies are 13.31% and 14.26% for the PV array, 46% and 50.12% for the WT, and 59.68% and 60.26% for the ELE. Another group of researchers [13] used MATLAB/Simulink software to study the energy and exergy of a hybrid PV-WT hydrogen production system. The results showed that this system could potentially produce 1912 kg of hydrogen annually. Ultimately, the hydrogen system’s energy and exergy were 16.42% and 12.76%, respectively. Further studies are available elsewhere [35,36,37,38]. A recent study by Benghanem et al. [39] found that a hybrid PV-WT system could provide a cost-effective and sustainable approach for continuous hydrogen production. Moreover, compared to other renewable energy sources, PV-WT systems are more economically viable, making them a particularly attractive option [40].
Hydrogen systems have been evaluated both economically and environmentally through various parametric indicators. These parametric indicators are levelized cost of energy (LCOE), energy payback time (EPBT), levelized cost of hydrogen (LCOH), carbon credit gained, and carbon dioxide (CO2) emission reduction. A hybrid PV-WT hydrogen production system was the subject of a techno-economic evaluation conducted by Okonkwo et al. [41]. The results revealed that the LCOH and LCOE are USD/kg 0.401 and USD/kWh 0.0158, respectively. Nasser et al. [13] studied a hybrid PV-WT hydrogen production system, paying attention to costs and environmental impact while using MATLAB/Simulink software. According to this research, EPBT is 10.43 years, LCOH is 4.193 USD/kg, and LCOE is 0.178 USD/kWh overall. The technology reduces CO2 emissions by 689.4 tons throughout its lifespan. Further details on energy, exergy, economic, and environmental analyses for hybrid PV-WT hydrogen production systems can be found in Refs. [13,37,41,42,43,44]. According to the results of these investigations, the system’s energy efficiency ranged from 3.48% to 17.45%, while its exergy efficiency ranged from 3.74% to 16.95%. Accordingly, the ranges for the LCOE and LCOH were 0.0158 USD/kWh to 0.178 USD/kWh and 0.401 USD/kg to 6.01 USD/kg, respectively.
The above research literature revealed that solar PV–hydrogen production systems often have low performance. Such results could be explained by the solar PV panels’ low energy efficiency, which also contributes to their low exergy efficiency. The majority of the literature has focused on hydrogen production systems that are powered by a single renewable energy source, disregarding the benefits of integrating combined renewable energy sources to enhance system resilience. The previous findings highlight the strong potential of investing in hybrid PV-WT power to develop efficient hydrogen production systems. Furthermore, modeling hybrid PV-WT hydrogen production systems via both an ELE and AFC has received limited attention, particularly in coastal climate conditions. The significance of studying a mathematical model based on advanced thermal analysis extends beyond economic and environmental assessments. It is essential for the successful design and practical implementation of such projects in real-world applications.
Hence, the achievements, targets, and contributions of this research can be summarized as follows:
  • Developing a TRNSYS model for hybrid PV-WT hydrogen production in the coastal climate conditions of Perth, Australia;
  • Conducting dynamic hourly simulations for a full-year 4E performance analysis;
  • Evaluating monthly electricity/hydrogen potential and system efficiency;
  • Providing practical insights to guide future system designs.
This article is organized as follows: Section 2 provides an overview of the research methodology, environmental conditions, system description, and TRNSYS modeling. Section 3 outlines the mathematical model and a 4E performance analysis. Section 4 discusses the research results, validation, and implications. Section 5 details limitations and future research directions. Finally, the key conclusions are summarized in Section 6.

2. Methodology and System Design

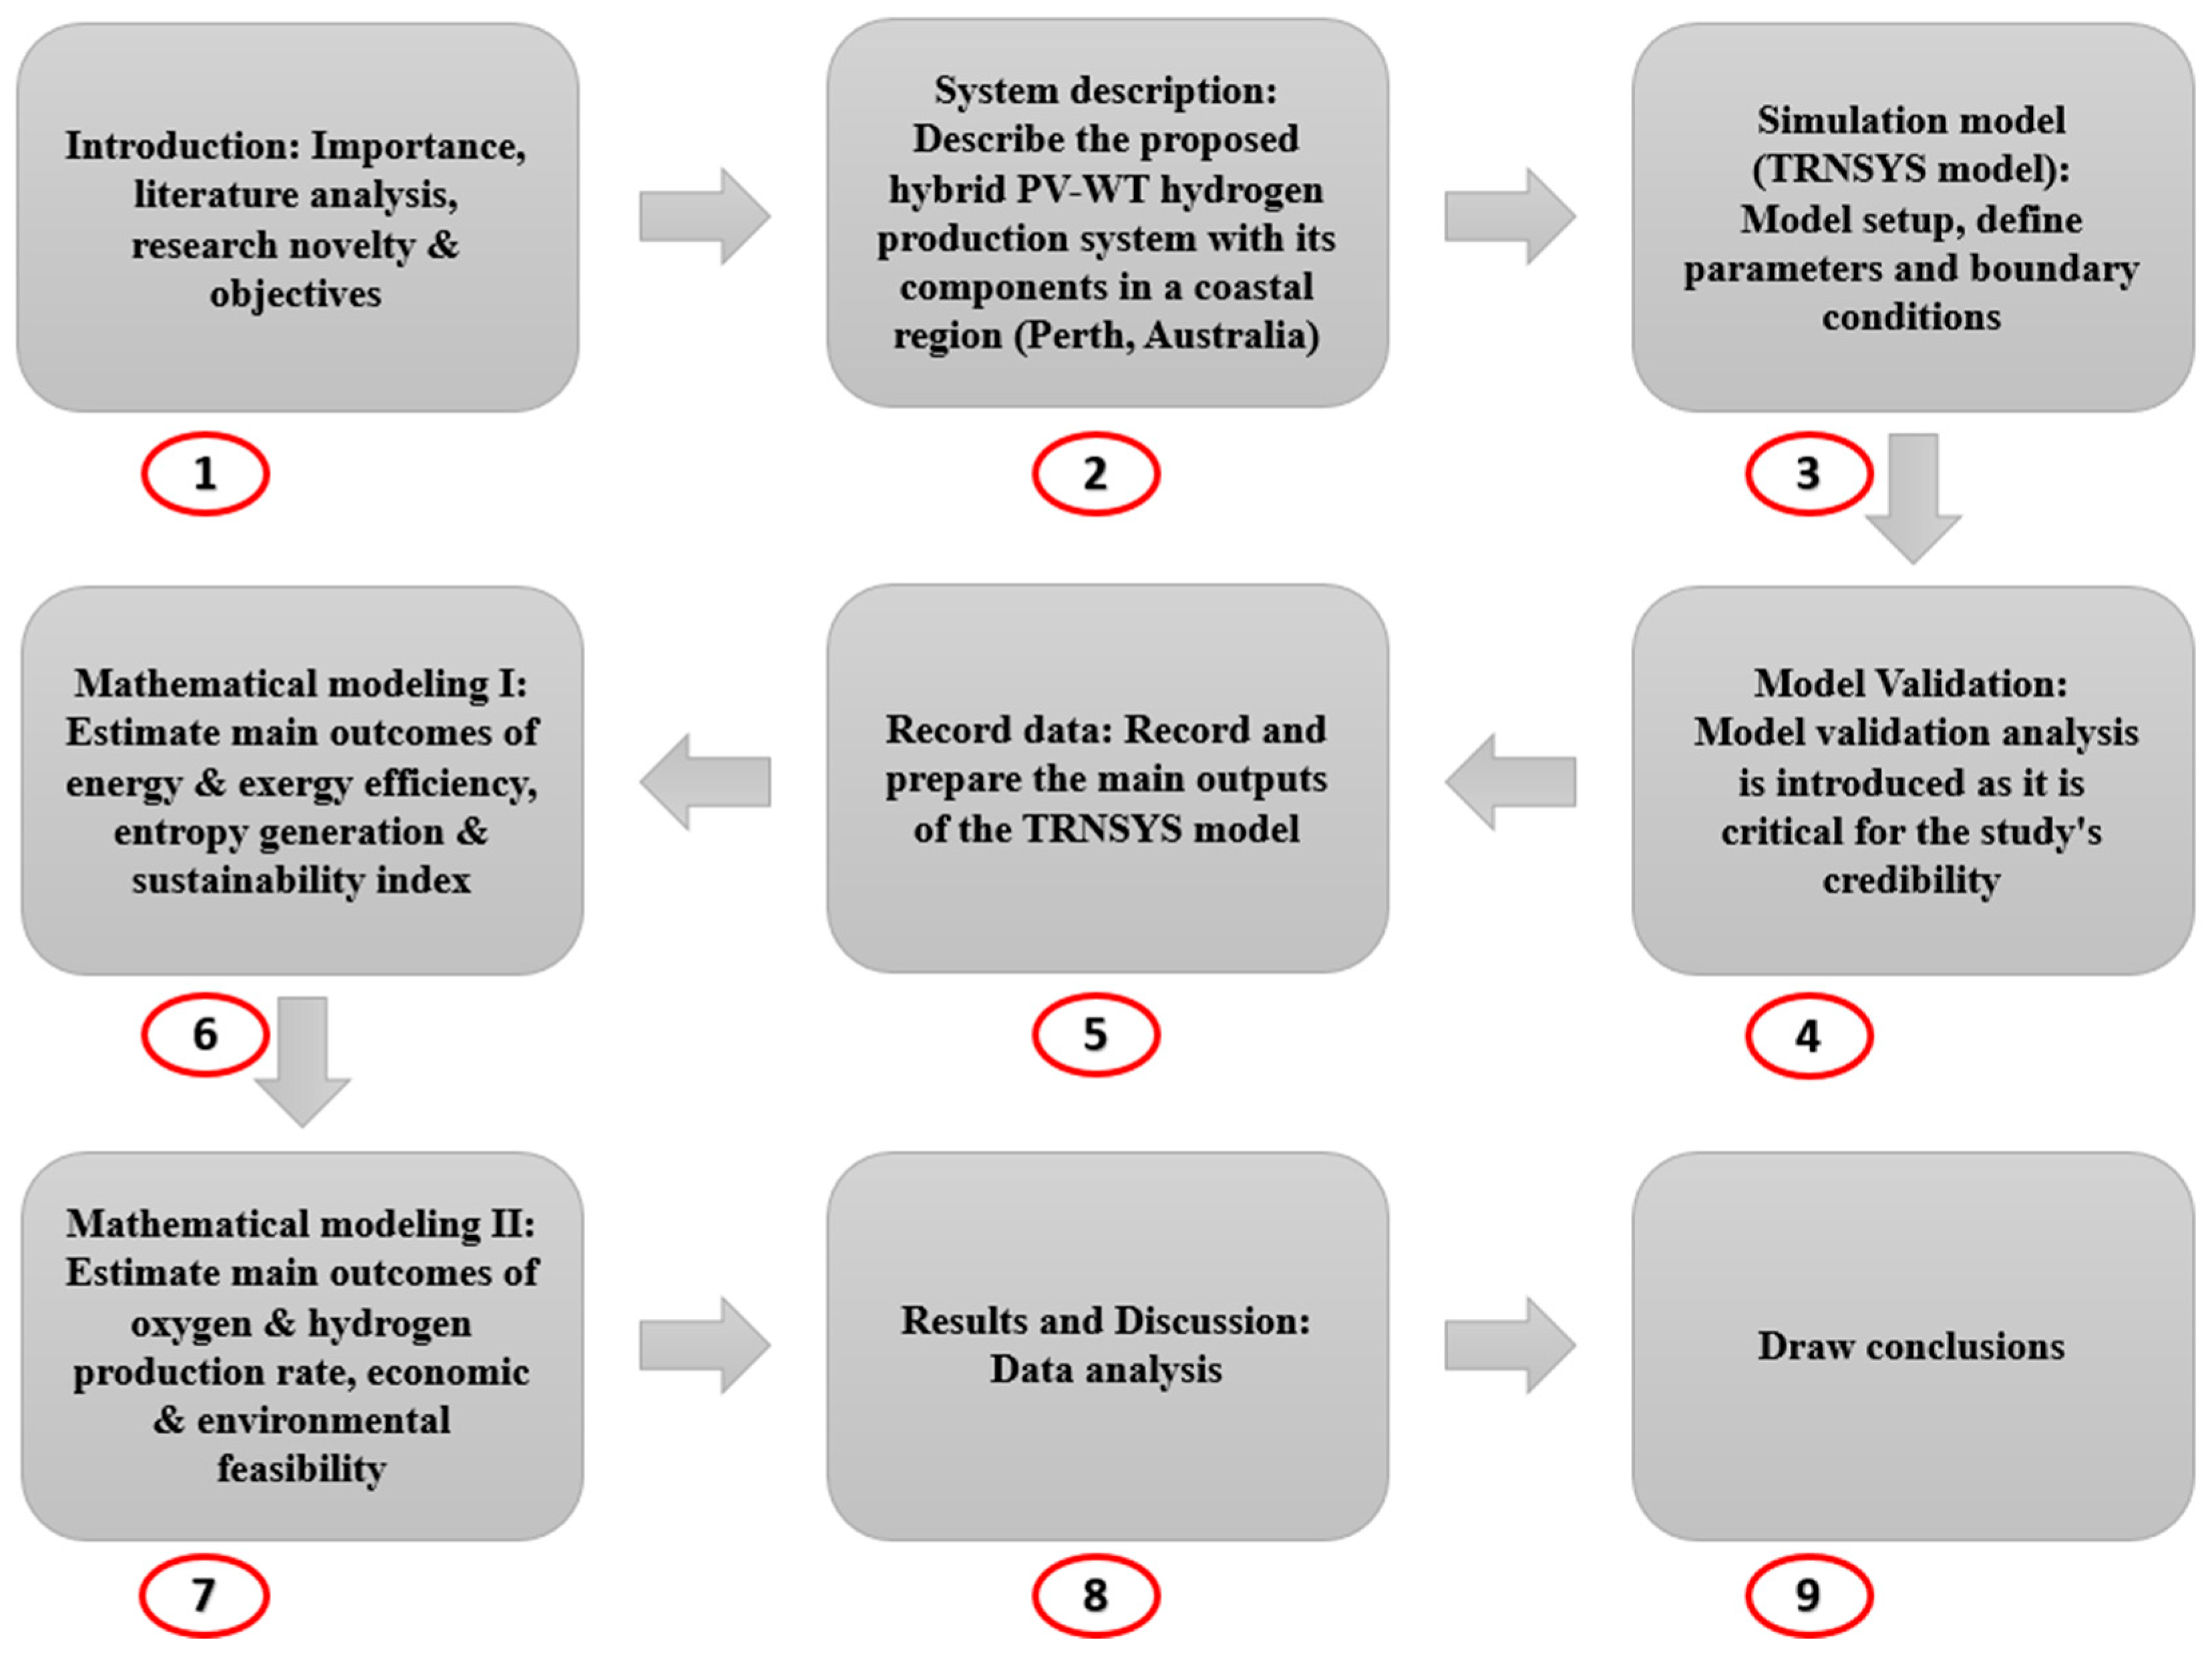
2.1. Research Methodology

This study develops an analytical prediction model for a hybrid PV-WT hydrogen production system with a 1 MW nominal capacity. The model is designed to assess performance under coastal climate conditions. Specifically, it focuses on the weather patterns in Perth, Australia. The goal is to optimize hydrogen production using hybrid renewable energy sources. The analytical approach ensures accurate and reliable predictions. Coastal climates pose unique challenges due to variable wind and solar resources. Perth’s conditions are ideal for testing the model’s effectiveness. The implementation aims to enhance renewable energy integration. This study provides insights into sustainable hydrogen production.
The research follows a structured methodology framework, as shown in Figure 1. The process includes nine key steps. First, this study introduces its importance, reviews the literature, and states its objectives (1). Next, it describes the hybrid system’s components and location (2). The TRNSYS simulation model is then set up with defined parameters and boundary conditions (3). Model validation ensures credibility (4). Data from TRNSYS are recorded and prepared for analysis (5). Mathematical modeling I estimates energy outcomes, efficiency, entropy generation, and sustainability (6). Mathematical modeling II assesses oxygen/hydrogen production rates and economic-environmental feasibility (7). The results are analyzed and discussed (8). Finally, conclusions are drawn (9). This step-by-step approach ensures a thorough evaluation of the system’s technical, economic, and environmental performance.
It should be noted that the main inputs for the TRNSYS model are meteorological data from Perth, Australia, along with the specifications and operational parameters of the system’s subcomponents. The TRNSYS simulation employs an hourly dynamic analysis conducted over a complete year to evaluate the overall performance of the system. The TRNSYS model results provide information on electricity generation, oxygen and hydrogen production, and the energy details of system subcomponents. The TRNSYS simulation results provide essential inputs for the mathematical equations in this study. These inputs ensure the analysis remains consistent with the research’s underlying assumptions. By developing a comprehensive mathematical framework, this work enables a detailed 4E analysis. This evaluation analyzes key performance metrics, including energy–exergy efficiency, entropy generation, and the sustainability index. Additionally, economic and environmental evaluations are conducted to analyze key performance indicators, such as hydrogen production, carbon emission reduction, LCOE, and LCOH. Model validation is conducted to determine the reliability of this study. The research findings are thoroughly documented; this is followed by a detailed discussion of the results, data analysis, and conclusions.

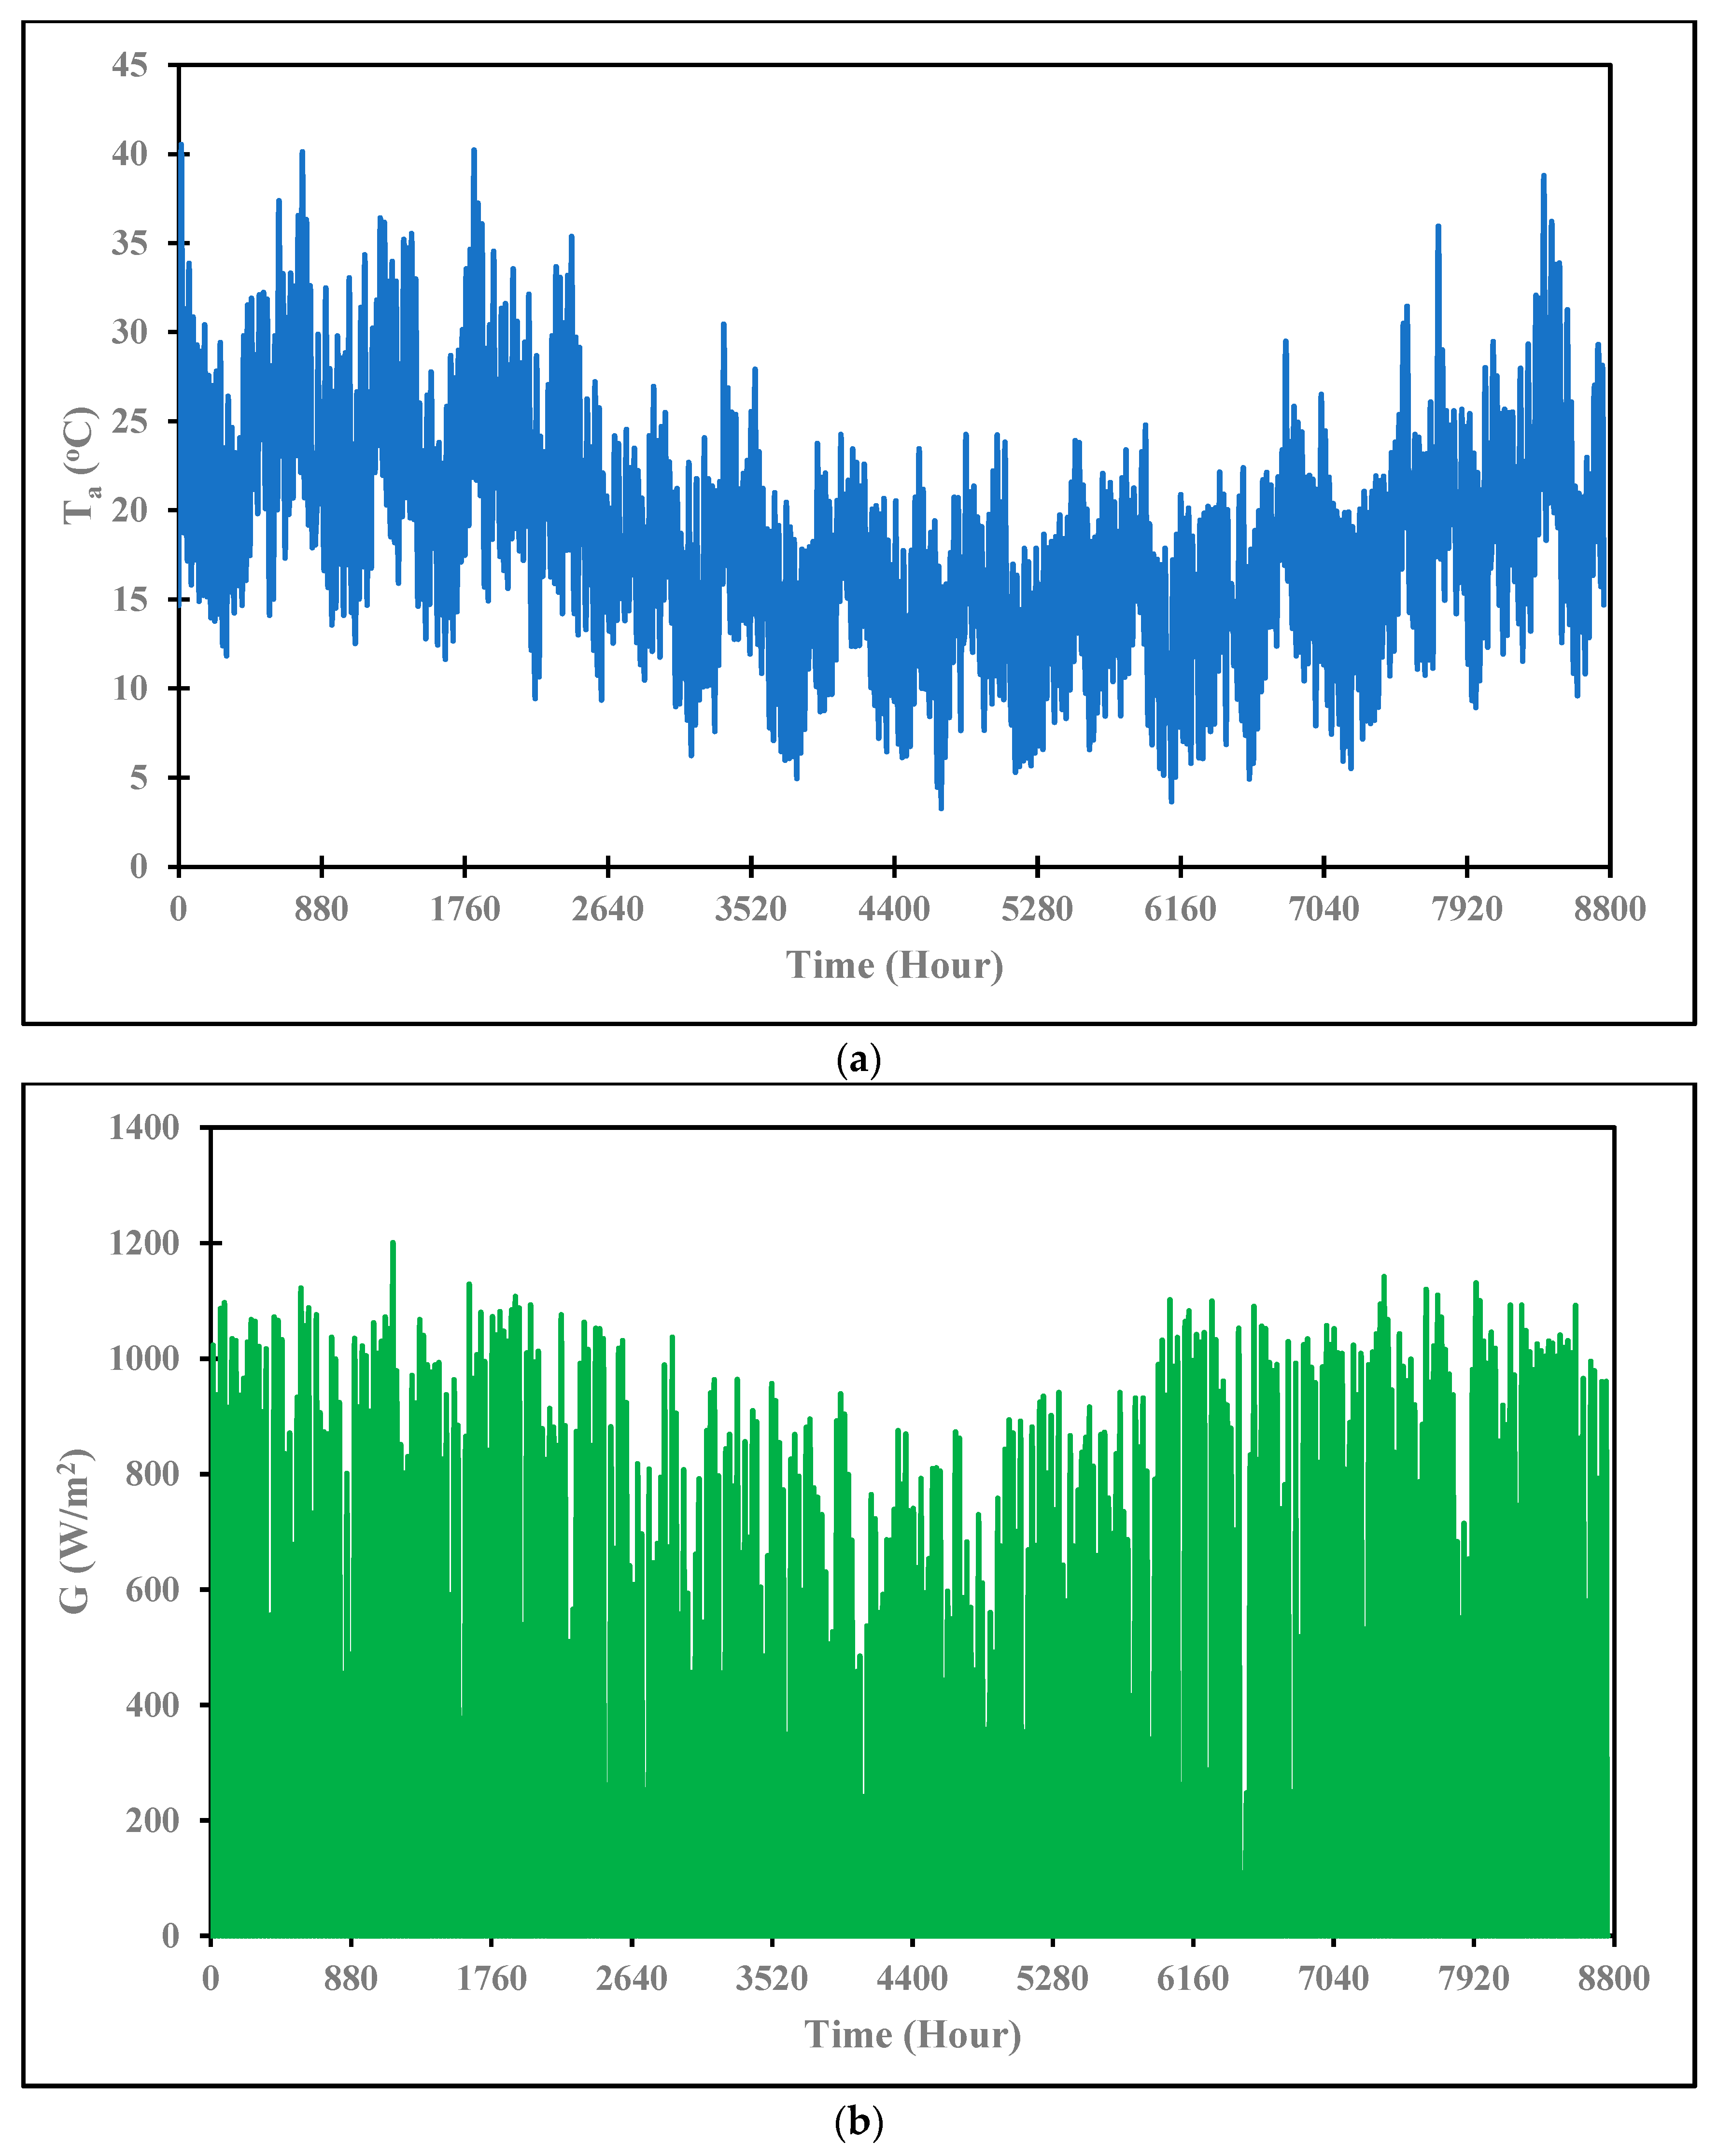
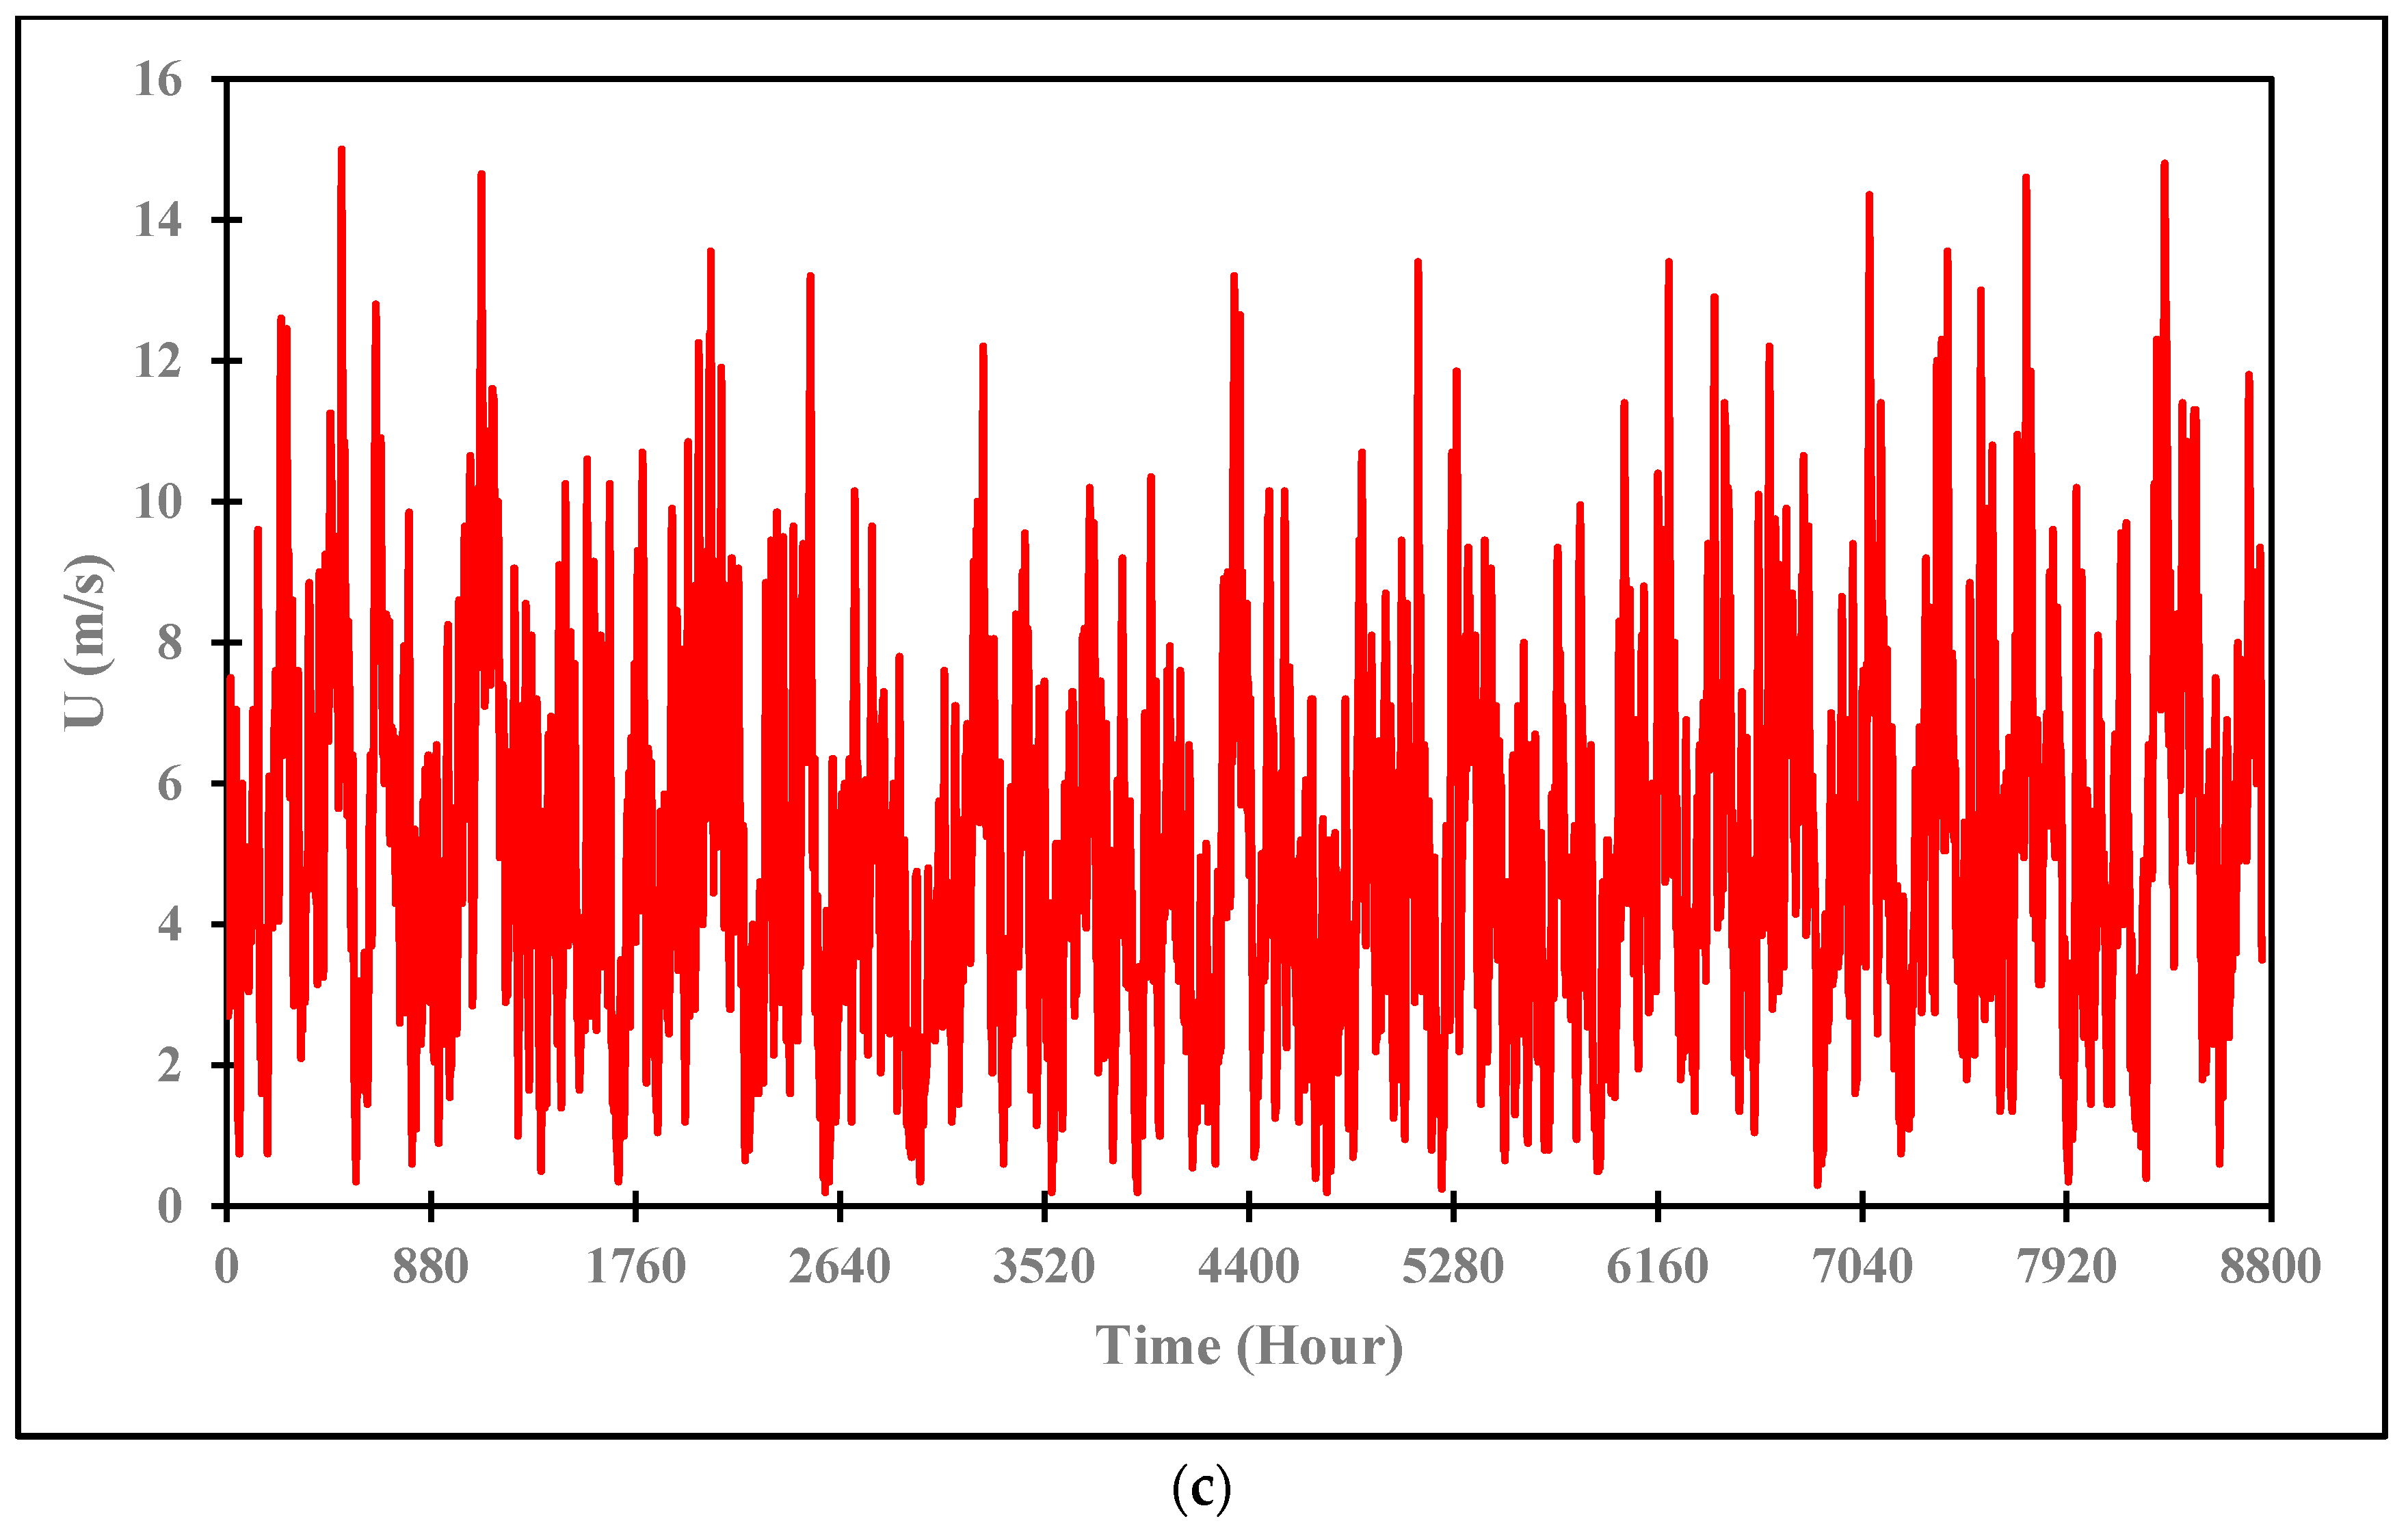
2.2. The Environmental Conditions of the Study Area

Figure 2 shows a map of Australia, highlighting the Perth region. Perth is located in Western Australia at −32° N latitude and 115.8° E longitude, with an elevation of 0.0 m above sea level. The region has strong potential for solar and wind energy. At a 10 m height, the wind speed averages 5.1 m/s. The average annual global solar radiation is 6.1 kWh/m2/day.
The environmental conditions of the study area (Perth, Australia) demonstrate a remarkable potential for utilizing renewable electricity resources generated by solar PV and wind energy to produce green hydrogen. Figure 3 displays the annual hourly variation in ambient temperature (Ta), global radiation (G), and wind speed (U) for Perth, Australia. The program Meteonorm version 7.0 is used to generate weather data for Perth, Australia. The peak of Ta, G, and U can reach more than 30 °C, 900 W/m2, and 10 m/s, respectively. This finding confirms that the currently accessible environmental conditions offer significant potential for renewable electricity resources generated by solar PV and wind energy.

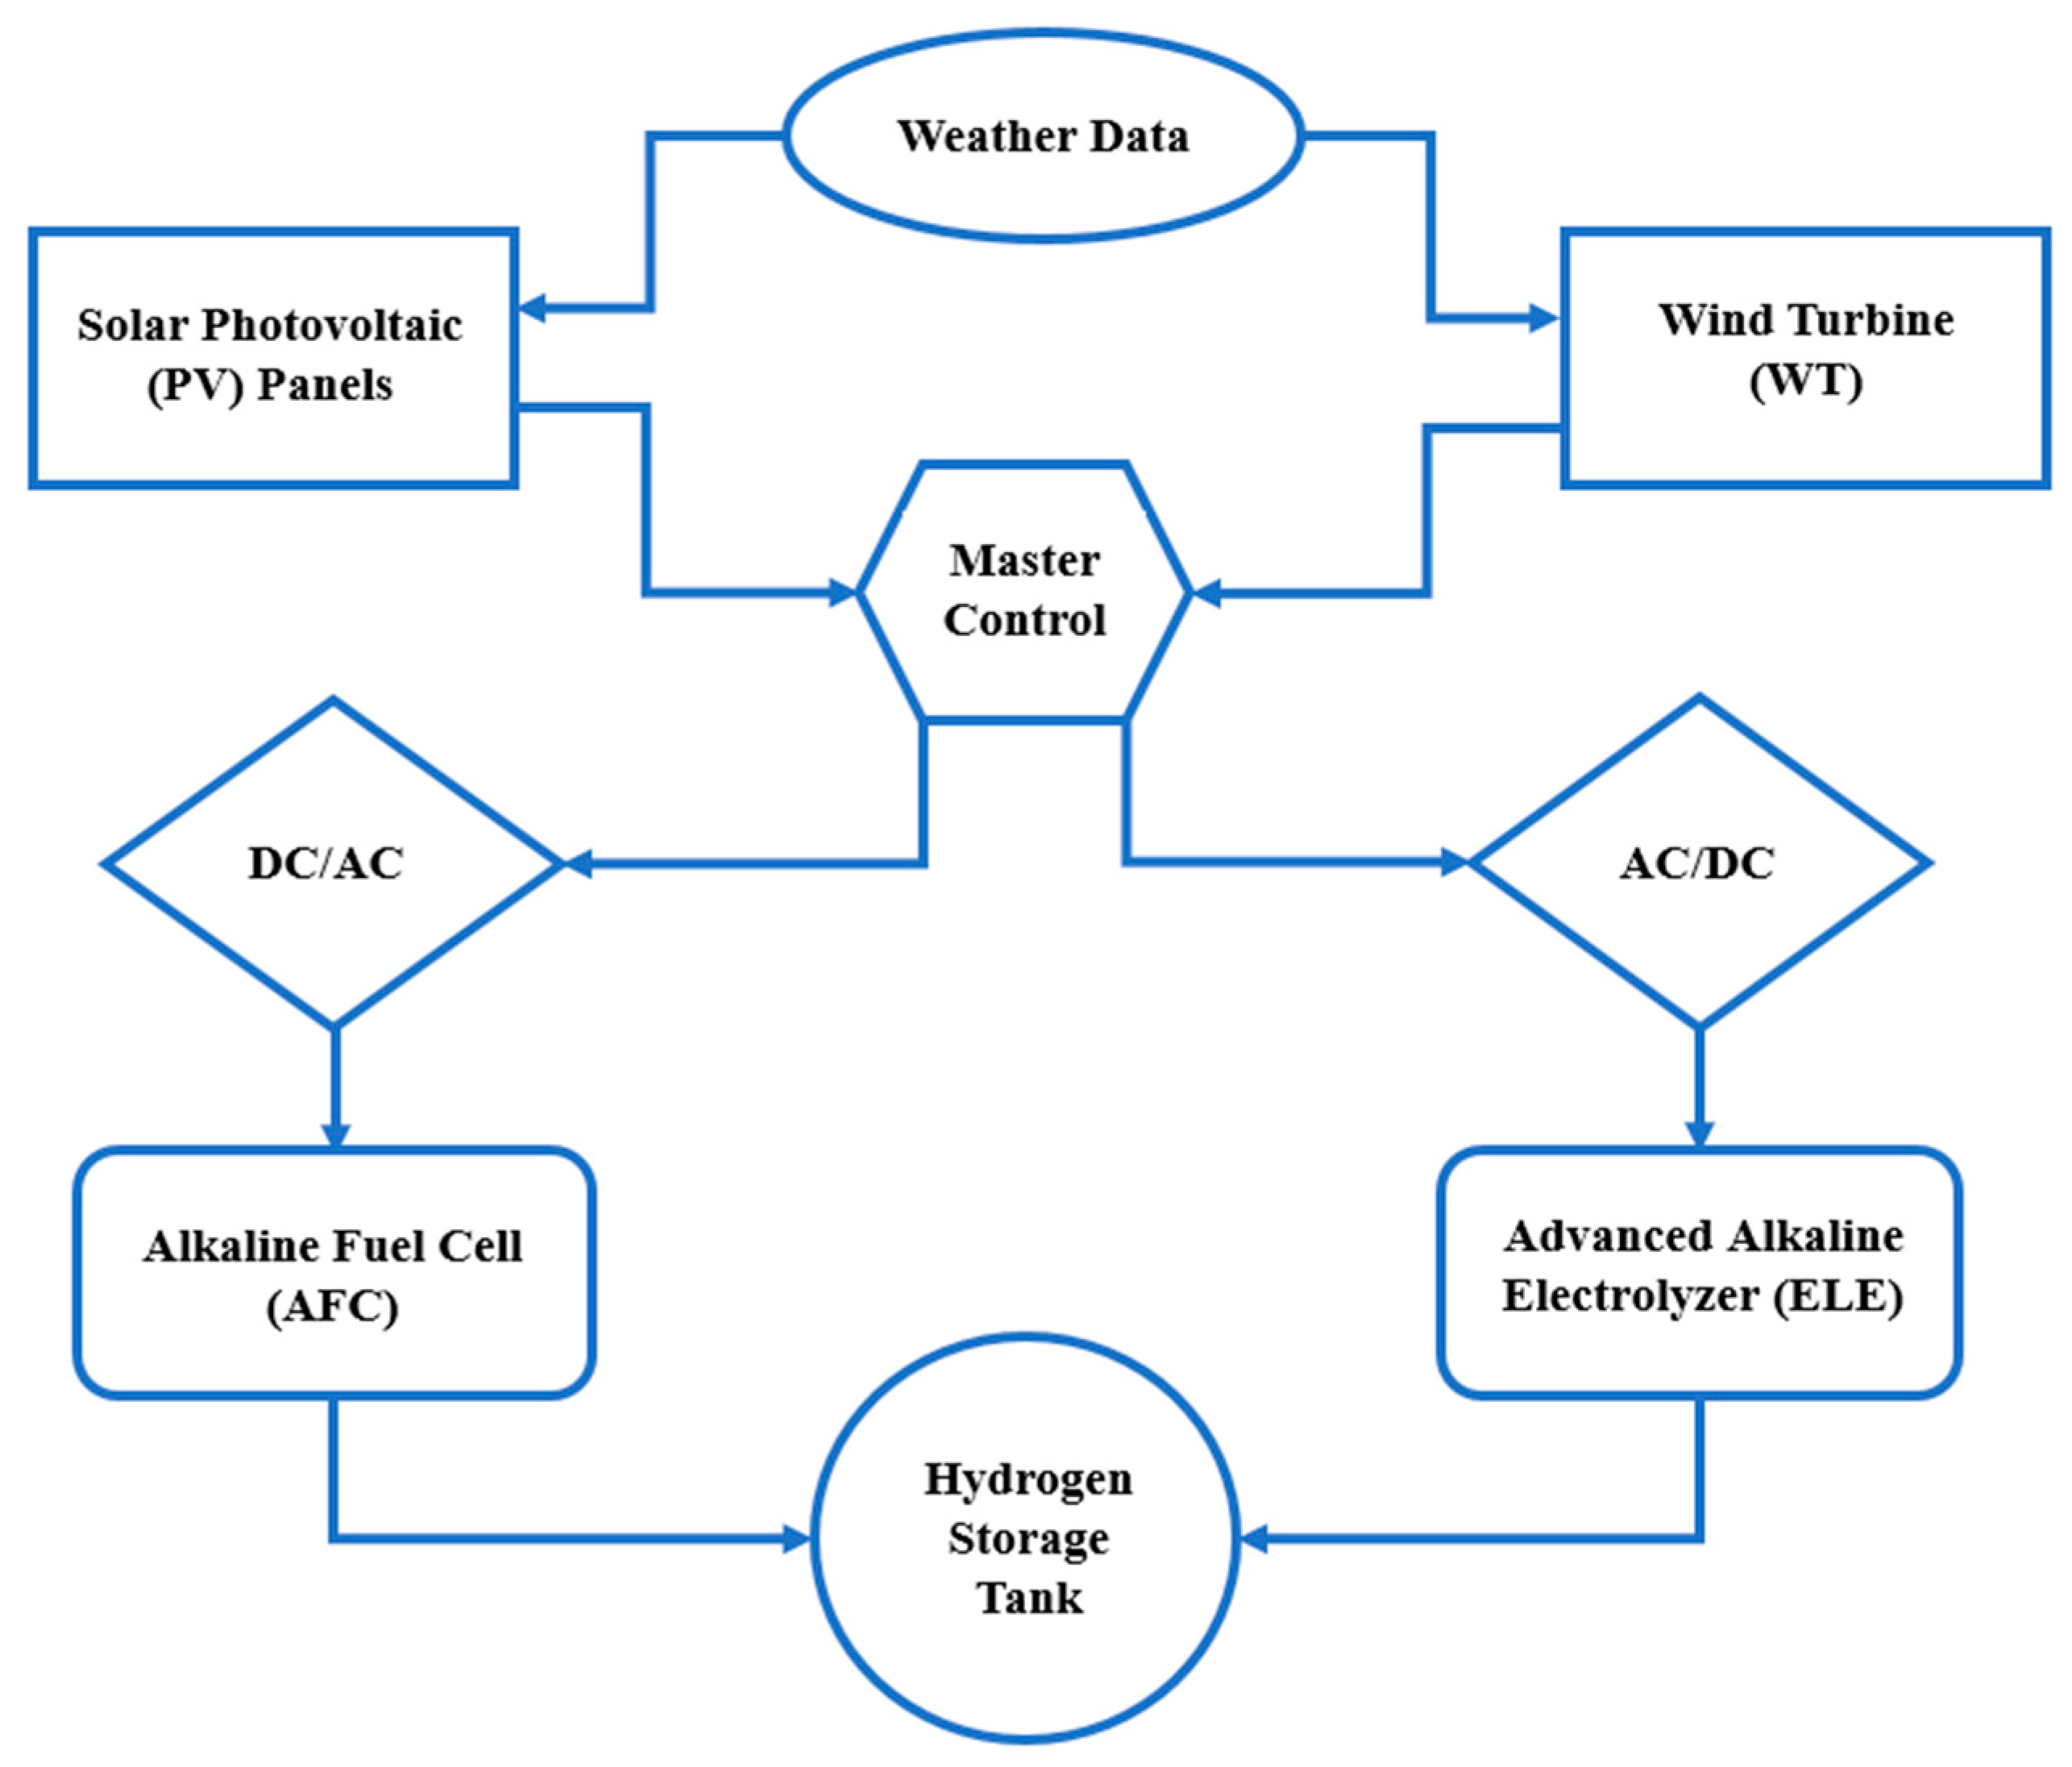
2.3. System Description

Figure 4 shows a schematic drawing of the proposed hydrogen production system powered with off-grid solar PV and wind energy as renewable electricity resources to produce green hydrogen. The system mainly consists of PV panels (0.5 MW), a WT (0.5 MW), an ELE, an AFC, a master control, converters, a hydrogen storage tank, and a weather database. The hybrid PV-WT hydrogen production system is modeled in TRNSYS (16.01.0000) simulation software. The dispatch strategy serves as the system’s control metrics.
According to the strategy, the environmental conditions of the study area (Perth, Australia) demonstrate a remarkable potential for utilizing renewable electricity resources generated by solar PV and wind energy to produce green hydrogen. The current prediction model feeds weather data to the solar PV panels and WT, enabling them to produce electricity. To capture more solar radiation, the tilt angle of the solar PV panels has been set to 30 degrees. The solar PV panels alongside the WT are responsible for offering the electrical power to run the hybrid PV-WT hydrogen production system. Interestingly, the WT in the proposed system plays a vital role in generating power in case the solar PV panels cannot meet the demand because of inadequate solar radiation.
The operational logic behind utilizing the hybrid integration of PV-WT is to improve the reliability and efficiency of electricity generation. Solar energy generation peaks during daylight hours, while wind power can produce electricity consistently, day or night, particularly in windy regions such as coastal areas. By leveraging their complementary generation patterns, the system reduces intermittency, or weakness, in electricity generation. Such an arrangement could decrease dependence on energy storage and enhance grid stability. Moreover, this hybrid approach offers greater resilience with smooth operation and cost-effectiveness compared to standalone PV or WT systems.
The electrical power generated by the hybrid PV-WT is directed to the converter and the ELE through an AC/DC busbar. It is also delivered to the converter and the AFC via a DC/AC busbar. The ELE utilizes this electricity to produce hydrogen through water electrolysis. Meanwhile, the AFC generates electricity by consuming pure hydrogen and oxygen in an electrochemical reaction. The produced hydrogen fuel is then stored in a dedicated hydrogen storage tank for later use.

2.4. TRNSYS Model

A Transient System Simulation Program (TRNSYS) simulation studio project is applied to theoretically analyze the performance of the proposed hybrid PV-WT hydrogen production system. The model is constructed using a series of components called ‘‘Types”, as illustrated in Figure 5. For this simulation, the timestep is set to one hour. The simulation time encompasses 365 days, from 1 January to 31 December (8760 h). For the weather data, the selected location for this study is Perth, Australia (−32° N latitude, 115.8° E longitude, and 0.0 m elevation). The hourly values of weather information are taken from Meteonorm software version 7. The weather information (such as solar radiation, ambient temperature, wind velocity, relative humidity, pressure, etc.) is employed to run the developed TRNSYS model. It is noteworthy that TRNSYS software has been used in several studies to simulate and predict the dynamic behavior of hydrogen production systems [20,21,45,46].
The system subcomponents have been taken from different packages available in the Simulation Studio, TRNSYS software. Main substantial subcomponents of the proposed system, such as the advanced alkaline electrolyzer (Type 160b), alkaline fuel cell (Type 173a), master control (Type 105a), and hydrogen tank (Type 164b), are taken from the hydrogen systems package. The energy source components, like solar PV panels (Type 94a), the WT (Type 90), and converters or power conditioning (Type 175a), are taken from the electric package. The main input components include weather data (Type 109-TMY2) and forcing function (Type 14h). The weather data (Type 109-TMY2) are taken from the weather data reading and processing package. Meteonorm software version 7 provides the hourly weather information values. These data are uploaded to the weather data component (Type 109-TMY2) and then used as input flow data for the solar PV panels (Type 94a) and WT (Type 90). The forcing function (Type 14h), which incorporates the monthly ratios and daily load profile, is sourced from the utility package. The output components, such as the online plotter (Type 65a) and simulation summary (Type 28a), are taken from the output package. The internal physical equations for these TRNSYS software modules (Types) are available in Ref. [47].
From Figure 5, it can be seen that the weather data (Type 109-TMY2) corresponding to Perth, Australia, are input to the solar PV panels (Type 94a) and WT (Type 90), following the necessary unit conversions (equations). The generated annual hourly electrical energy is transferred to the ELE (Type 160b) and AFC (Type 173a) via the master control (Type 105a) and power conditioning (Type 175a). The hydrogen production quantity is estimated by converting the annual hourly electrical energy into green hydrogen using the ELE (Type 160b) system. The obtained hydrogen fuel is therefore stored in the hydrogen tank (Type 164b). The actual volume of the hydrogen tank is 50 m3, and the maximum allowable pressure is 200 bar. Notably, the hydrogen tank volume is considered constant at 50 m3, since the effect of tank volume scalability is not taken into account in this research. The hybrid PV-WT hydrogen production system is evaluated through comprehensive energy, exergy, environmental, and economic analyses, utilizing a set of key equations for each perspective. It should be noted that the TRNSYS components do not take zero values as input (for instance, no solar radiation at night, and wind speed can occasionally be lower than the cut-in speed, etc.). Therefore, a value of 10−6 was added to these zeroth values to prevent errors in the developed TRNSYS model. A power-to-current converter is placed before the TRNSYS input for each ELE and AFC, as these components require current inputs. The operating voltage of the ELE and AFC is determined at each timestep to convert electrical power into current. This allows the system’s hourly hydrogen production to be accurately calculated and reported.
The technical features of the solar PV panels and WT considered in this research are detailed in Table 1. Meanwhile, Table 2 outlines the key features and settings of the AFC and ELE. Additionally, the parameters and design specifications of the hydrogen storage tank used in this research are provided in Table 3.

3. Performance Analysis

The proposed PV-WT hydrogen production system via both an ELE and AFC is analyzed using a developed TRNSYS model. This model conducts a 4E analysis under varying operational and environmental conditions. The performance of the proposed system was assessed using thermodynamic analysis investigations according to different parametric factors involving energy ( E ˙ ), exergy ( X ˙ ), entropy-generating (EG) balances, and sustainability index (SI). In addition, this research scrutinized economic and environmental assessments based on different parametric factors involving the levelized cost of energy (LCOE), energy payback time (EPBT), levelized cost of hydrogen (LCOH), CO2 emissions, net CO2 mitigation, and carbon credit gained for the assessed hybrid PV-WT hydrogen production system. This section also discusses the model assumptions.

3.1. Thermodynamic Analysis

The hybrid PV-WT hydrogen production system is thermodynamically analyzed under dynamic operational and environmental conditions, based on hourly distributions. The assessed system subcomponents are subjected to the same unit characteristic features and environmental circumstances. The methods used in this work are based on those described in Refs. [13,34,48].
The energy ( E ˙ ) and exergy ( X ˙ )   rates of the proposed hydrogen system are calculated according to Equations (1) and (2), respectively. The energy efficiency ( η ) and exergy efficiency ( φ ) of the proposed hydrogen system can be calculated according to Equations (3) and (4), respectively [34].
E ˙ i n = E ˙ l o s s + E ˙ o u t
X ˙ i n = X ˙ l o s s + X ˙ o u t
η = E ˙ o u t E ˙ i n
φ = X ˙ o u t X ˙ i n
The entropy generation rate (EG) for both individual components and the whole system can be estimated as stated in Equation (5) [49], which is sensitive to the ambient temperature (Ta). The system’s sustainability index (SI) and overall exergy efficiency are closely correlated with improved process/unit sustainability. Equation (6) can be used to identify the SI [48].
E G =   X ˙ l o s s T a
S I =   1 1 φ  
The performance analysis for the key subcomponents of the proposed system (solar PV panels, WT, ELE, and AFC), as well as the whole system, is described in this section.

3.1.1. Photovoltaic (PV) Panel Performance

The energy rate and efficiency of the solar PV panels can be calculated using Equations (7)–(9) [34]. The efficiency of solar PV panels can be defined as the ratio of the electric energy produced ( E ˙ o u t ,   P V )   to the solar energy received by solar PV panels ( E ˙ i n ,   P V ) . The power generated ( P P V ) by the solar PV panels can be computed from their output current ( I P V ) and the voltage ( V P V ), representing the output power generated ( E ˙ o u t ,   P V ) from solar PV panels.
E ˙ o u t ,   P V = P P V = I P V V P V
E ˙ i n ,   P V = G A P V
η P V = E ˙ o u t ,   P V E ˙ i n ,   P V
where APV refers to the total solar PV panel area in m2.
The exergy rate and efficiency of the solar PV panels can be calculated using Equations (10)–(12) [13,34,50]. Exergy analysis draws attention to the irreversibilities in the system that usually result from multiple scenarios, for instance, heat transfer from solar PV panels brought on by a temperature differential between the panels and the environment. The potential, kinetic, and chemical exergy contributions are neglected in the overall exergy analysis.
X ˙ o u t ,   P V = E ˙ o u t ,   P V
X ˙ i n ,   P V = G A P V 1 4   3 T a T s + 1 3 T a T s 4
φ P V = X ˙ o u t ,   P V X ˙ i n ,   P V
where Ts is the Sun’s temperature (Ts ≅ 6000 K).

3.1.2. Wind Turbine (WT) Performance

The energy rate and efficiency of the WT can be determined using Equations (13)–(16), as detailed in Refs. [13,34,42]. The power produced by a wind turbine initially begins at the cut-in speed and increases as the wind speed increases to the rated speed. Power generation pauses when the cut-out speed is reached, in which case the wind turbine’s output power remains constant.
P W T     = 0 ,   f o r   U < U c u t , i n   a n d   U > U c u t , o u t       = P r a t e d ,   f o r   U r a t e d < U   U c u t , o u t = P r a t e d   U 3 U c u t , i n 3 U r a t e d 3 U c u t , i n 3 ,   f o r   U c u t , i n U   U r a t e d
E ˙ o u t ,   W T = P W T
E ˙ i n ,   W T = 1 2 ρ a A W T U 3
η W T = E ˙ o u t ,   W T E ˙ i n ,   W T
where PWT is the wind turbine power, Prated is the turbine rated power, Urated is the rated speed, Ucut,in is the cut-in speed, Ucut,out is the cut-out speed, ρ a is the air density, and AWT is the wind turbine area.
The exergy rate and efficiency of the WT can be determined using Equations (17)–(24) [13,34,51]. While the potential exergy of the WT is disregarded, the kinetic, physical, and chemical exergy terms are taken into account for the overall exergy.
X ˙ o u t ,   W T = E ˙ o u t ,   W T
X ˙ i n , W T = m ˙ a ( x P + x K + x P H + x C H )
where
m ˙ a = 2 3 ρ a A W T U
x K = 1 2 U 2 1 18 U 2  
x P H = C p , a + ω C p , v T o T T o 1 l n T T o + 1 + 1.6078 ω R T o l n P P o
P = P o + 1 2 U 2
x C H = R T o 1 + 1.6078 ω l n 1 + 1.6078 ω o 1 + 1.6078 ω + 1 + 1.6078 ω l n ω ω o
φ W T = X ˙ o u t ,   W T X ˙ i n ,   W T
where x P ,   x K ,   x P H ,   a n d   x C H are the change in specific potential, specific kinetic, specific physical, and specific chemical exergies. Also, m ˙ a states the air mass flow rate. To refers to standard temperature (To = 288.15 K) and Po refers to atmospheric pressure (Po = 1 bar). C p ,   a indicates the constant pressure specific heat of air, C p ,   v indicates the constant pressure specific heat of water vapor, and R   indicates the gas constant. In addition, ω   a n d   ω o are the humidity ratio and standard humidity ratio.

3.1.3. Electrolyzer (ELE) Performance

The energy and exergy analysis of the ELE are obtained using Equations (25)–(32) [13,34,52,53]. The energy rate and efficiency of the ELE can be determined using Equations (25)–(27). The power input ( E ˙ i n , E L E ) to the ELE is identified from its input current ( I E L E ) and the voltage ( V E L E ).
E ˙ o u t , E L E = m ˙ E L E , H 2 H H V H 2
E ˙ i n , E L E = I E L E V E L E
η E L E = E ˙ o u t , E L E E ˙ i n , E L E
The exergy rate and efficiency of the ELE can be calculated using Equations (28)–(32). The physical and chemical exergy terms of the ELE are considered for the overall exergy, but the potential and kinetic exergy terms are neglected.
X ˙ o u t , E L E = m ˙ E L E , H 2 ( x P H + x C H )
x P H = C p , H 2 T o T T o 1 l n T T o + l n P H 2 P o γ γ 1
x C H = x n e n C H + R H 2 T o x n l n x n
X ˙ i n ,   E L E = E ˙ i n ,   E L E
φ E L E = X ˙ o u t ,   E L E X ˙ i n ,   E L E
where m ˙ E L E , H 2   a n d   H H V H 2 are the hydrogen mass flow rate and hydrogen higher heating value. x P H   a n d   x C H are the physical and chemical exergy terms. C p , H 2   indicates the constant pressure heat capacity of the hydrogen gas ( C p , H 2     = 14.890 kJ/kg.K). γ indicates the adiabatic exponent ( γ = 1.4). P H 2 indicates the hydrogen pressure at the ELE outlet. R H 2 indicates the gas constant ( R H 2 = 4.124 kJ/kg.K). x n indicates the mole fraction of an individual chemical species. e n C H indicates the specific chemical exergy ( e n C H = 117,113 kJ/kg) [34,54,55].

3.1.4. Alkaline Fuel Cell (AFC) Performance

Equations (33)–(40) provide the energy and exergy analysis of the AFC [53,54,55]. The energy rate and efficiency of the AFC can be determined using Equations (33)–(35). The AFC identifies its power output ( E ˙ o u t ,   A F C ) from its input current ( I A F C ) and voltage ( V A F C ). The power input ( E ˙ i n ,   A F C ) to the AFC is expressed based on the hydrogen mass flow rate ( m ˙ A F C , H 2 ) and the hydrogen higher heating value ( H H V H 2 ).
E ˙ o u t ,   A F C = I A F C V A F C
E ˙ i n ,   A F C = m ˙ A F C , H 2 H H V H 2
η A F C = E ˙ o u t ,   A F C E ˙ i n ,   A F C
Equations (36)–(40) can calculate the exergy rate and efficiency of the AFC. Like in the ELE exergy analysis, the AFC’s overall exergy includes the physical and chemical exergy terms, but it ignores the potential and kinetic exergy terms.
X ˙ o u t ,   A F C = E ˙ o u t ,   A F C
X ˙ i n ,   A F C = m ˙ A F C , H 2 ( x P H + x C H )
x P H = C p , H 2 T o T T o 1 l n T T o + l n P H 2 P o γ γ 1
x C H = x n e n C H + R H 2 T o x n l n x n
φ A F C = X ˙ o u t ,     A F C X ˙ i n ,     A F C

3.1.5. Overall Efficiency

The overall performance analysis of the hybrid PV-WT hydrogen production system is calculated using Equations (41)–(45), as stated in Ref. [48]. The overall energy efficiency ( η o v e r a l l ) of the hybrid PV-WT hydrogen production system is determined using Equation (41), and the total energy efficiency from renewable energy sources ( η R E N ) is defined in Equation (42).
η o v e r a l l = η R E N η E L E η A F C
η R E N = E ˙ o u t , P V + E ˙ o u t , W T E ˙ i n , P V + E ˙ i n , W T
The overall exergy efficiency ( φ o v e r a l l ) of the proposed system is calculated similarly to the overall energy efficiency as stated in Equation (43). Meanwhile, the total exergy efficiency of the renewable resources ( φ R E N ) is estimated similarly to the overall exergy efficiency as stated in Equation (44).
φ o v e r a l l = φ R E N φ E L E φ A F C
φ R E N = X ˙ o u t , P V + X ˙ o u t , W T X ˙ i n , P V + X ˙ i n , W T
Equation (45) calculates the overall entropy generation ( E G o v e r a l l ) of the proposed hydrogen system.
E G o v e r a l l = E G P V + E G W T + E G E L E + E G A F C

3.2. Economic and Environmental Analysis

3.2.1. Economic Analysis

From the standpoint of cost analysis, the energy cost of the evaluated system was estimated using the levelized cost of energy (LCOE) technique. Additionally, the time needed to recover the energy consumed in a system, known as the energy payback time (EPBT), was computed. Equations (46)–(51) are used to calculate the LCOE [13,37,42].
K o m =   1 + R 1 + i
C R F =   i   ( 1 + i ) n 1 + i ) n 1
C E L F = C R F 1 K o m n 1 K o m   K o m
L C i n v = C i n v   C R F
L C o m = C o m   C E L F
L C O E = L C i n v + L C o m + L C f u e l E ˙ a n n u a l  
where CRF is the capital recovery factor, CELF is the constant escalation levelized factor, L C i n v is the investment levelized cost, C i n v is the total investment cost, L C o m is the operation and maintenance levelized cost, C o m is the annual operation and maintenance cost, and E ˙ a n n u a l is the overall annual energy for 365 days. It is worth noting that n indicates the lifetime (n = 20 years), i   indicates the discount rate ( i = 8.75%) [42], and R indicates the nominal escalation rate ( R = 1%) [49,56]. L C f u e l   indicates the fuel cost ( L C f u e l = 0.0), since the evaluated hybrid PV-WT hydrogen production system is powered by solar and wind renewable sources. Notably, the operation and maintenance costs for all system subcomponents are considered to be 2% of the capital cost [42].
The entire embodied energy ( E ˙ e m b o d i e d ) divided by the annual output energy ( E ˙ a n n u a l ) is the EPBT [13,49]. The EPBT is calculated using Equation (52), whereas the E ˙ e m b o d i e d is calculated using Equation (53).
E P B T = E ˙ e m b o d i e d E ˙ a n n u a l  
E ˙ e m b o d i e d = C i n v 0.14  
Further, the levelized cost of hydrogen (LCOH) is employed to calculate the production cost of 1 kg of hydrogen and can be calculated as stated in Equation (54) [42,57]:
L C O H = C i n v + t = 1 n   C o m t ( 1 + i ) t t = 1 n M t  
where t is time in the year, and Mt is the annual quantity of hydrogen produced in kilograms.

3.2.2. Environmental Assessment

From the standpoint of environmental aspects, the key environmental performance metrics, including CO2 emissions, net CO2 mitigation, and carbon credit gained for the evaluated hybrid PV-WT hydrogen generation system, are computed analytically using Equations (55)–(57) [49,58]. Globally, reducing each metric ton of CO2 is projected to cost USD 14.5 [58].
C O 2   e m i s s i o n   p e r   y e a r = 2.042   E ˙ e m b o d i e d n  
N e t   C O 2   m i t i g a t i o n = 2.042 ( n E ˙ a n n u a l E ˙ e m b o d i e d )
C a r b o n   c r e d i t   g a i n e d = N e t   C O 2   m i t i g a t i o n × C o s t   p e r   t o n s   o f   C O 2   m i t i g a t i o n

3.3. Model Assumptions

The TRNSYS model of the hybrid PV-WT hydrogen production system is based on several well-established assumptions. These simplifications facilitate the solution of the governing mathematical equations, reduce model complexity by minimizing variables, and streamline the numerical simulation process. Such assumptions are widely accepted and commonly employed in the field.
  • The system operates under transient conditions, with hourly simulations conducted over a year using TRNSYS. Subsystems respond to dynamic operational and environmental changes based on hourly data [19].
  • Although the quantity of hydrogen and oxygen generated was determined, the economic analysis was only conducted on the amount of hydrogen produced [46].
  • The project lifetime is considered to be 20 years [36].
  • A standard atmospheric pressure of 1 bar and a reference ambient temperature of 25 °C were considered [12].
  • Water exergy is not included in the electrolyzer’s exergy analysis, and oxygen exergy is disregarded [33].
  • Hydrogen is considered an ideal gas [33].
  • The energy efficiency and exergy efficiency of the converters are expected to remain constant at 95%, since electrical energy is regarded as entirely useful potential work [13,41,52].
  • The parametric cost assessment excludes the financial considerations of hydrogen storage and transportation.
  • Physical and chemical exergy analyses of the WT, ELE, and AFC are considered.
  • There are no losses or leaks from the hydrogen storage tank [33].
  • The hydrogen tank volume is considered constant at 50 m3, since the effect of tank volume scalability is not taken into account in this research.

4. Results and Discussion

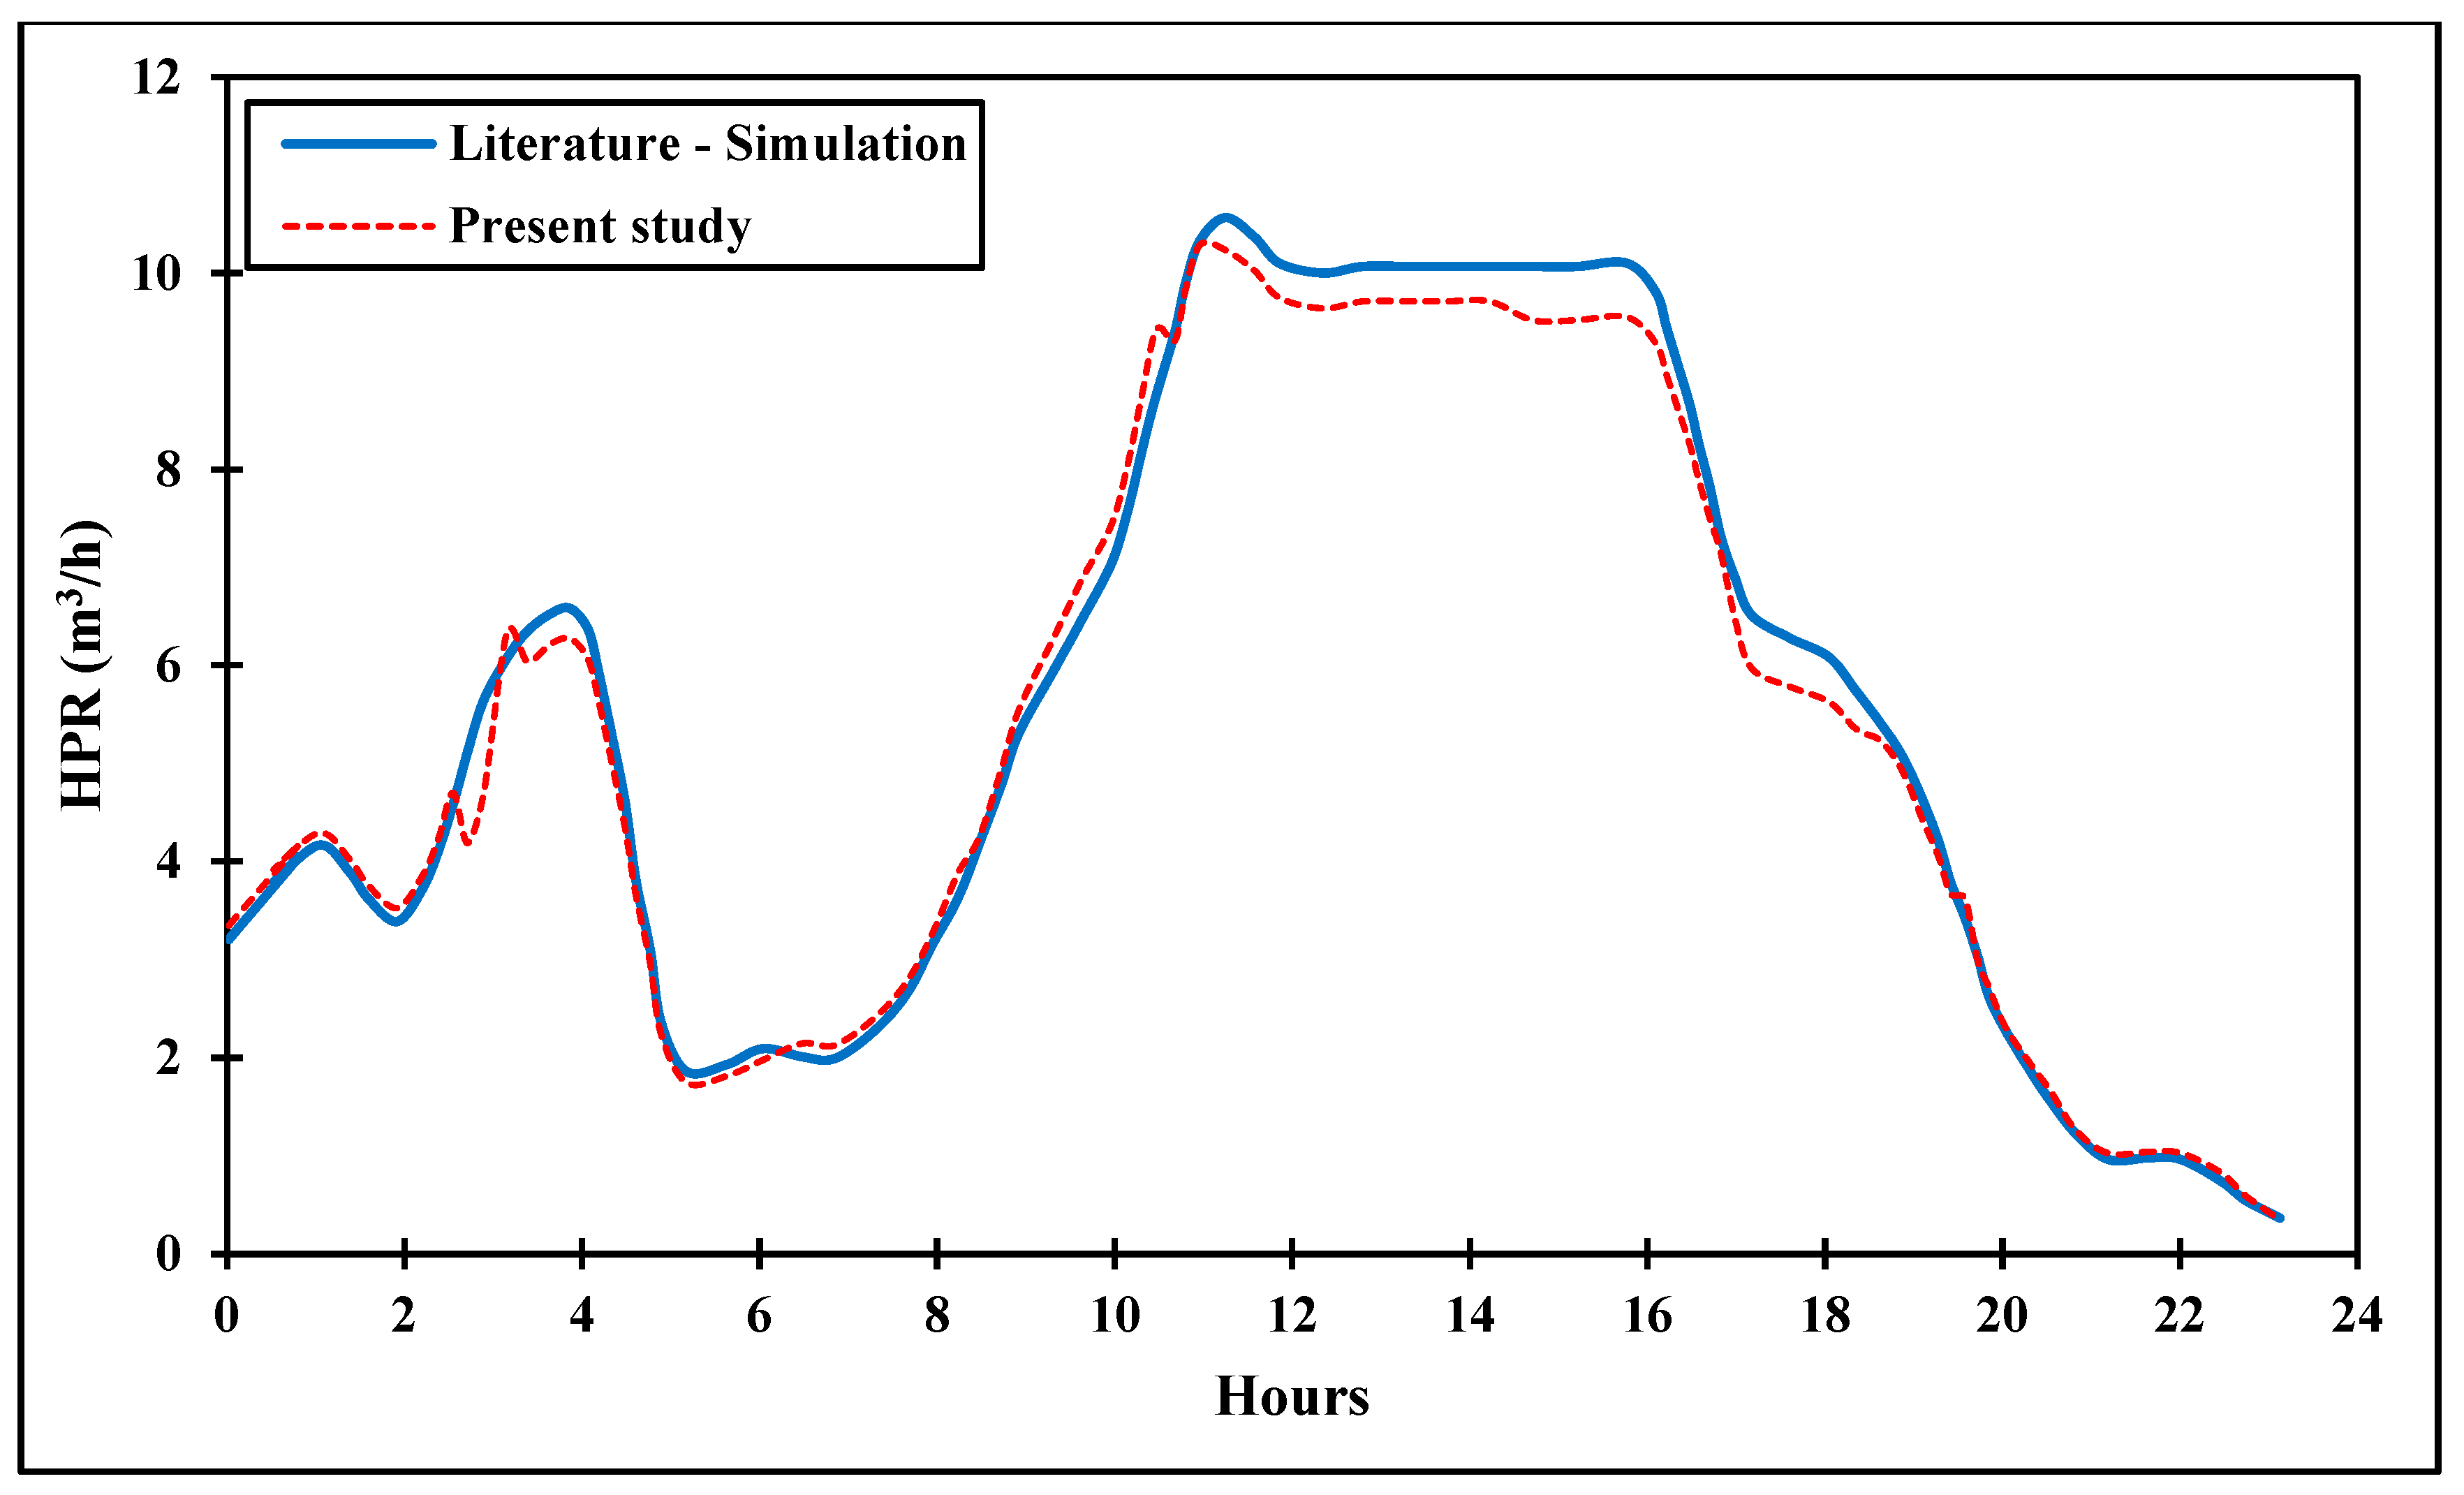
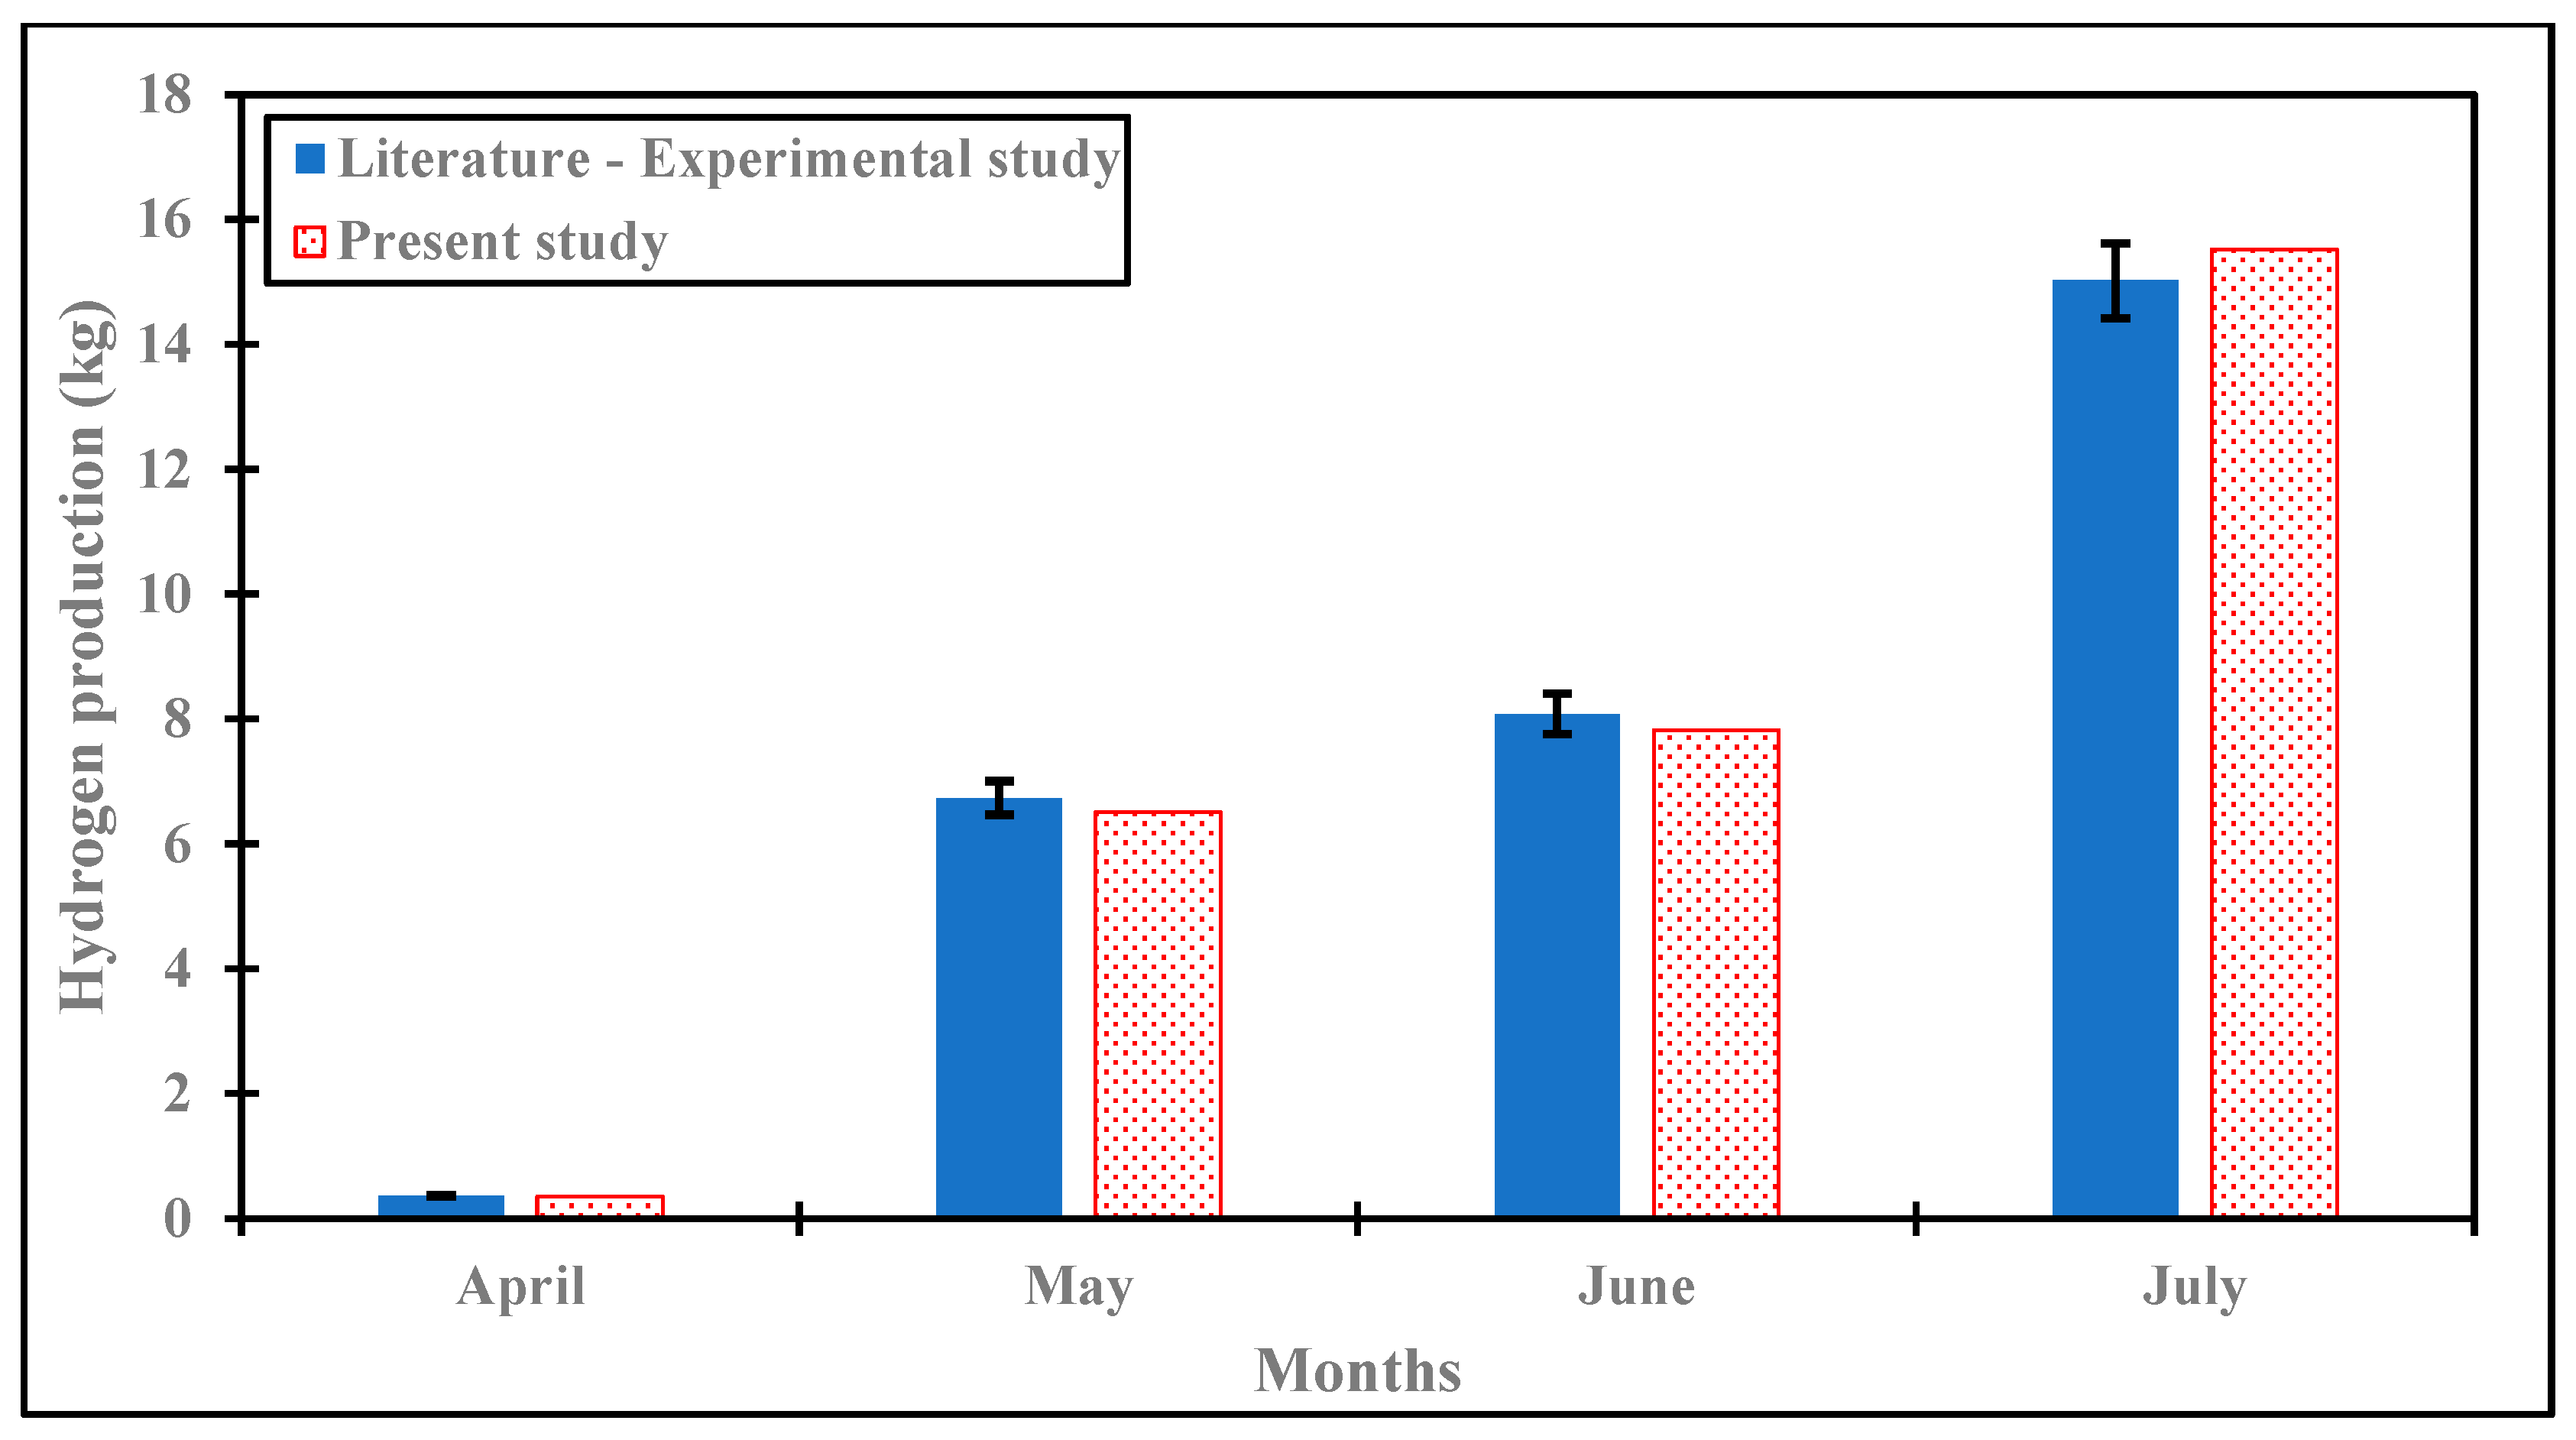
4.1. Validation Model

The comparison of current findings with recent relevant studies not only validates the results but also enhances credibility and enriches the discussion. This validation is critical for ensuring the reliability of the current TRNSYS model for the assessed hybrid PV-WT hydrogen production system. The current TRNSYS model was validated using earlier findings from a hybrid PV-WT hydrogen production system under Egypt’s climatic conditions, as reported by Nasser et al. [13]. The validation outcomes are shown in Table 4. The findings indicated that the current TRNSYS model and the associated parameter values of Nasser et al. [13] are evidently in significant agreement. The validation results showed that the overall discrepancy between the current TRNSYS model and the corresponding parameter values is less than 2%. This finding affirms the accuracy and reliability of the present TRNSYS model.
To further strengthen confidence in the transient modeling approach, the hourly hydrogen production rate was validated against literature data [13], as illustrated in Figure 6. The model was meticulously calibrated, minimizing errors associated with numerical approximations. The results show that the current TRNSYS model closely matches the reference study [13], with an overall difference of less than 5%, which confirms that the model is accurate. However, minor deviations were observed, likely attributable to differences in initial condition assumptions employed in the transient simulations. To further check the model’s accuracy, Figure 7 compares the hydrogen production results from the current TRNSYS model with the experimental results from reference [32]. The results show strong alignment, with deviations remaining below 3.5%, thereby confirming the model’s accuracy. Overall, despite these minor discrepancies, the validation confirms that the current TRNSYS model is reliable, demonstrating its capability to accurately predict hydrogen production under dynamic conditions.

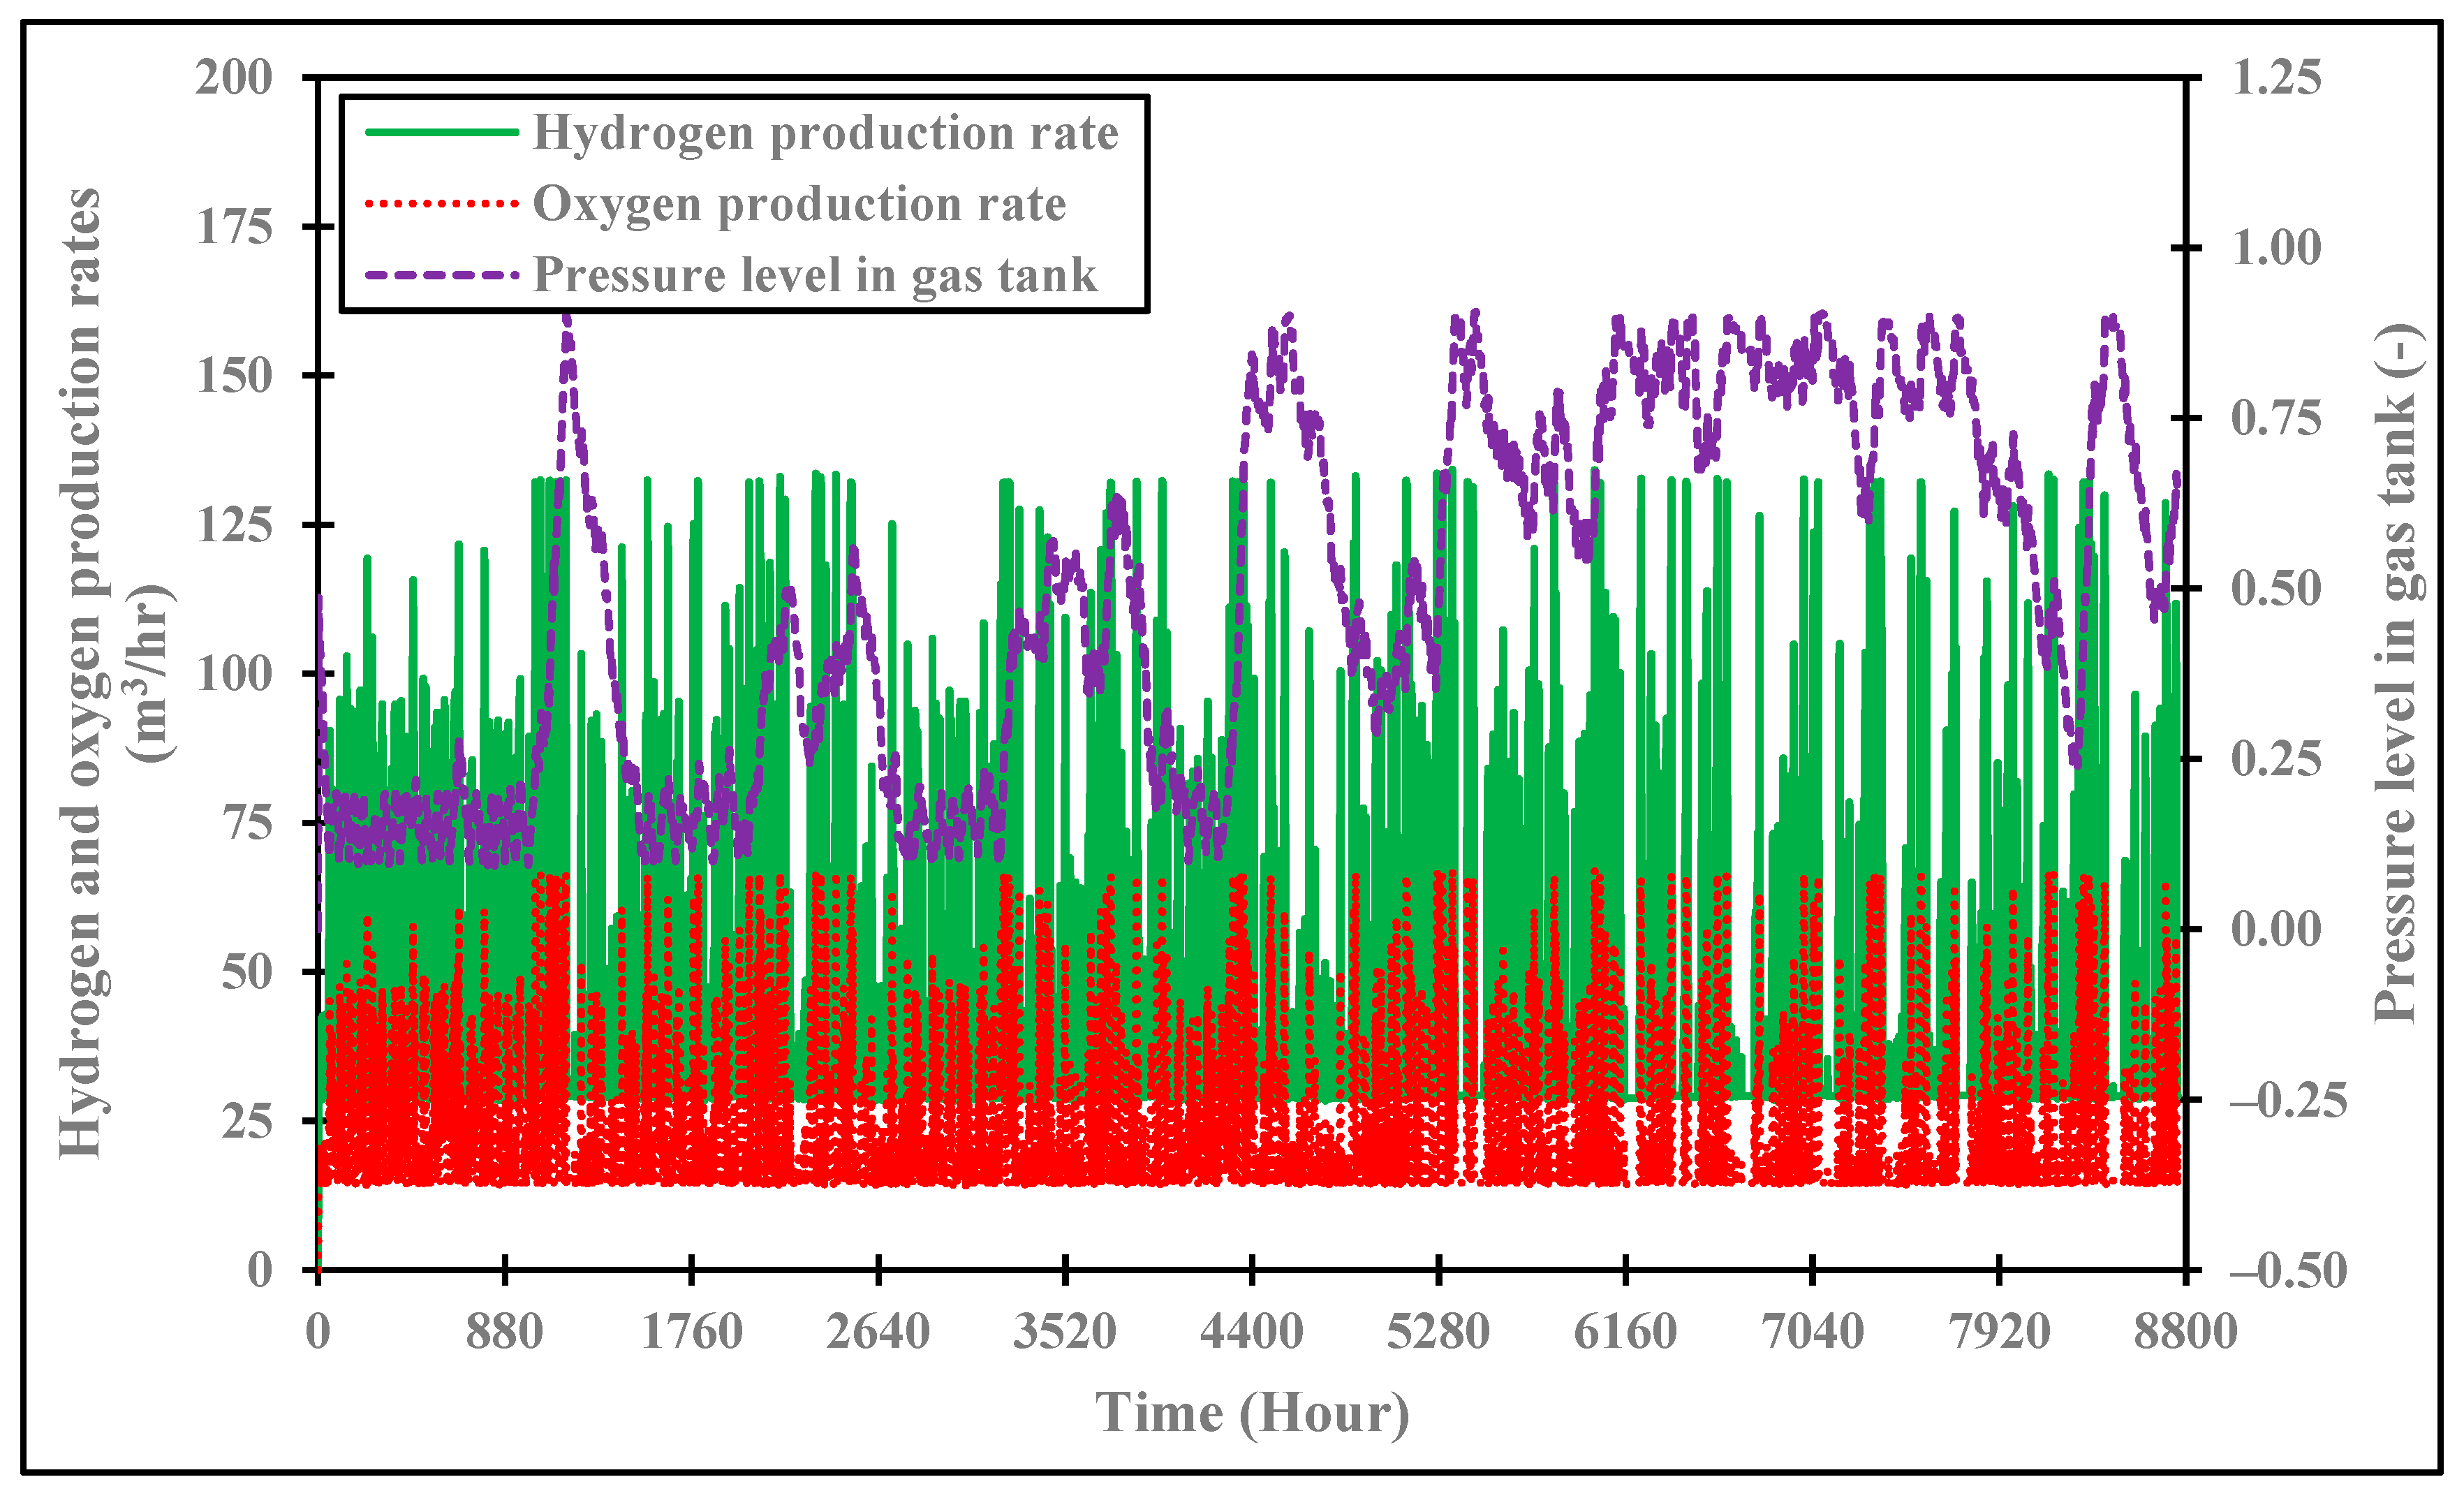
4.2. Hydrogen Production

Figure 8 illustrates the annual variation in volume and pressure of the hydrogen gas stored in the tank. As previously mentioned, the initial pressure level was 0.5 [19], and the maximum allowable pressure was 200 bar. Notably, the hydrogen tank volume is considered constant at 50 m3, since the effect of tank volume scalability is not taken into account in this research. Weather conditions greatly influence the power output of hybrid PV-WT systems due to varying solar radiation and wind speed, leading to fluctuations in hydrogen production. This causes dynamic changes in the volume and pressure of the hydrogen storage tank, emphasizing the need for adaptive control strategies to ensure stable storage and supply. Moreover, the volume and pressure of a hydrogen tank are influenced by multiple factors, including tank dimensions and temperature fluctuations. Additionally, the physical state of the hydrogen, whether stored as a compressed gas or in liquid form, also plays a significant role.
Figure 9 illustrates the annual variation in hydrogen and oxygen production rates, along with the pressure level (state of charge) in the hydrogen gas tank. The results show that fluctuations in solar radiation directly influence the pressure level trends. During winter, lower solar radiation reduces the hydrogen production below the discharge rate, depleting the tank. In contrast, summer’s increased solar radiation boosts hydrogen production, raising the pressure level and improving the tank’s charge state. Despite peak solar radiation in summer, hydrogen production varies within a limited range. The control unit deactivates the electrolyzer’s power supply when the pressure level exceeds 0.80, leaving it operating only at idle power. Once the pressure drops to around 0.60, the controller reactivates the electrolyzer, utilizing PV-WT electricity to resume hydrogen production. This cyclical process occurs throughout summer, while the pressure level gradually declines in autumn and winter as solar radiation diminishes. The descriptions of these parameters in Figure 8 and Figure 9 are compatible, with additional details available in Refs. [20,21,45].

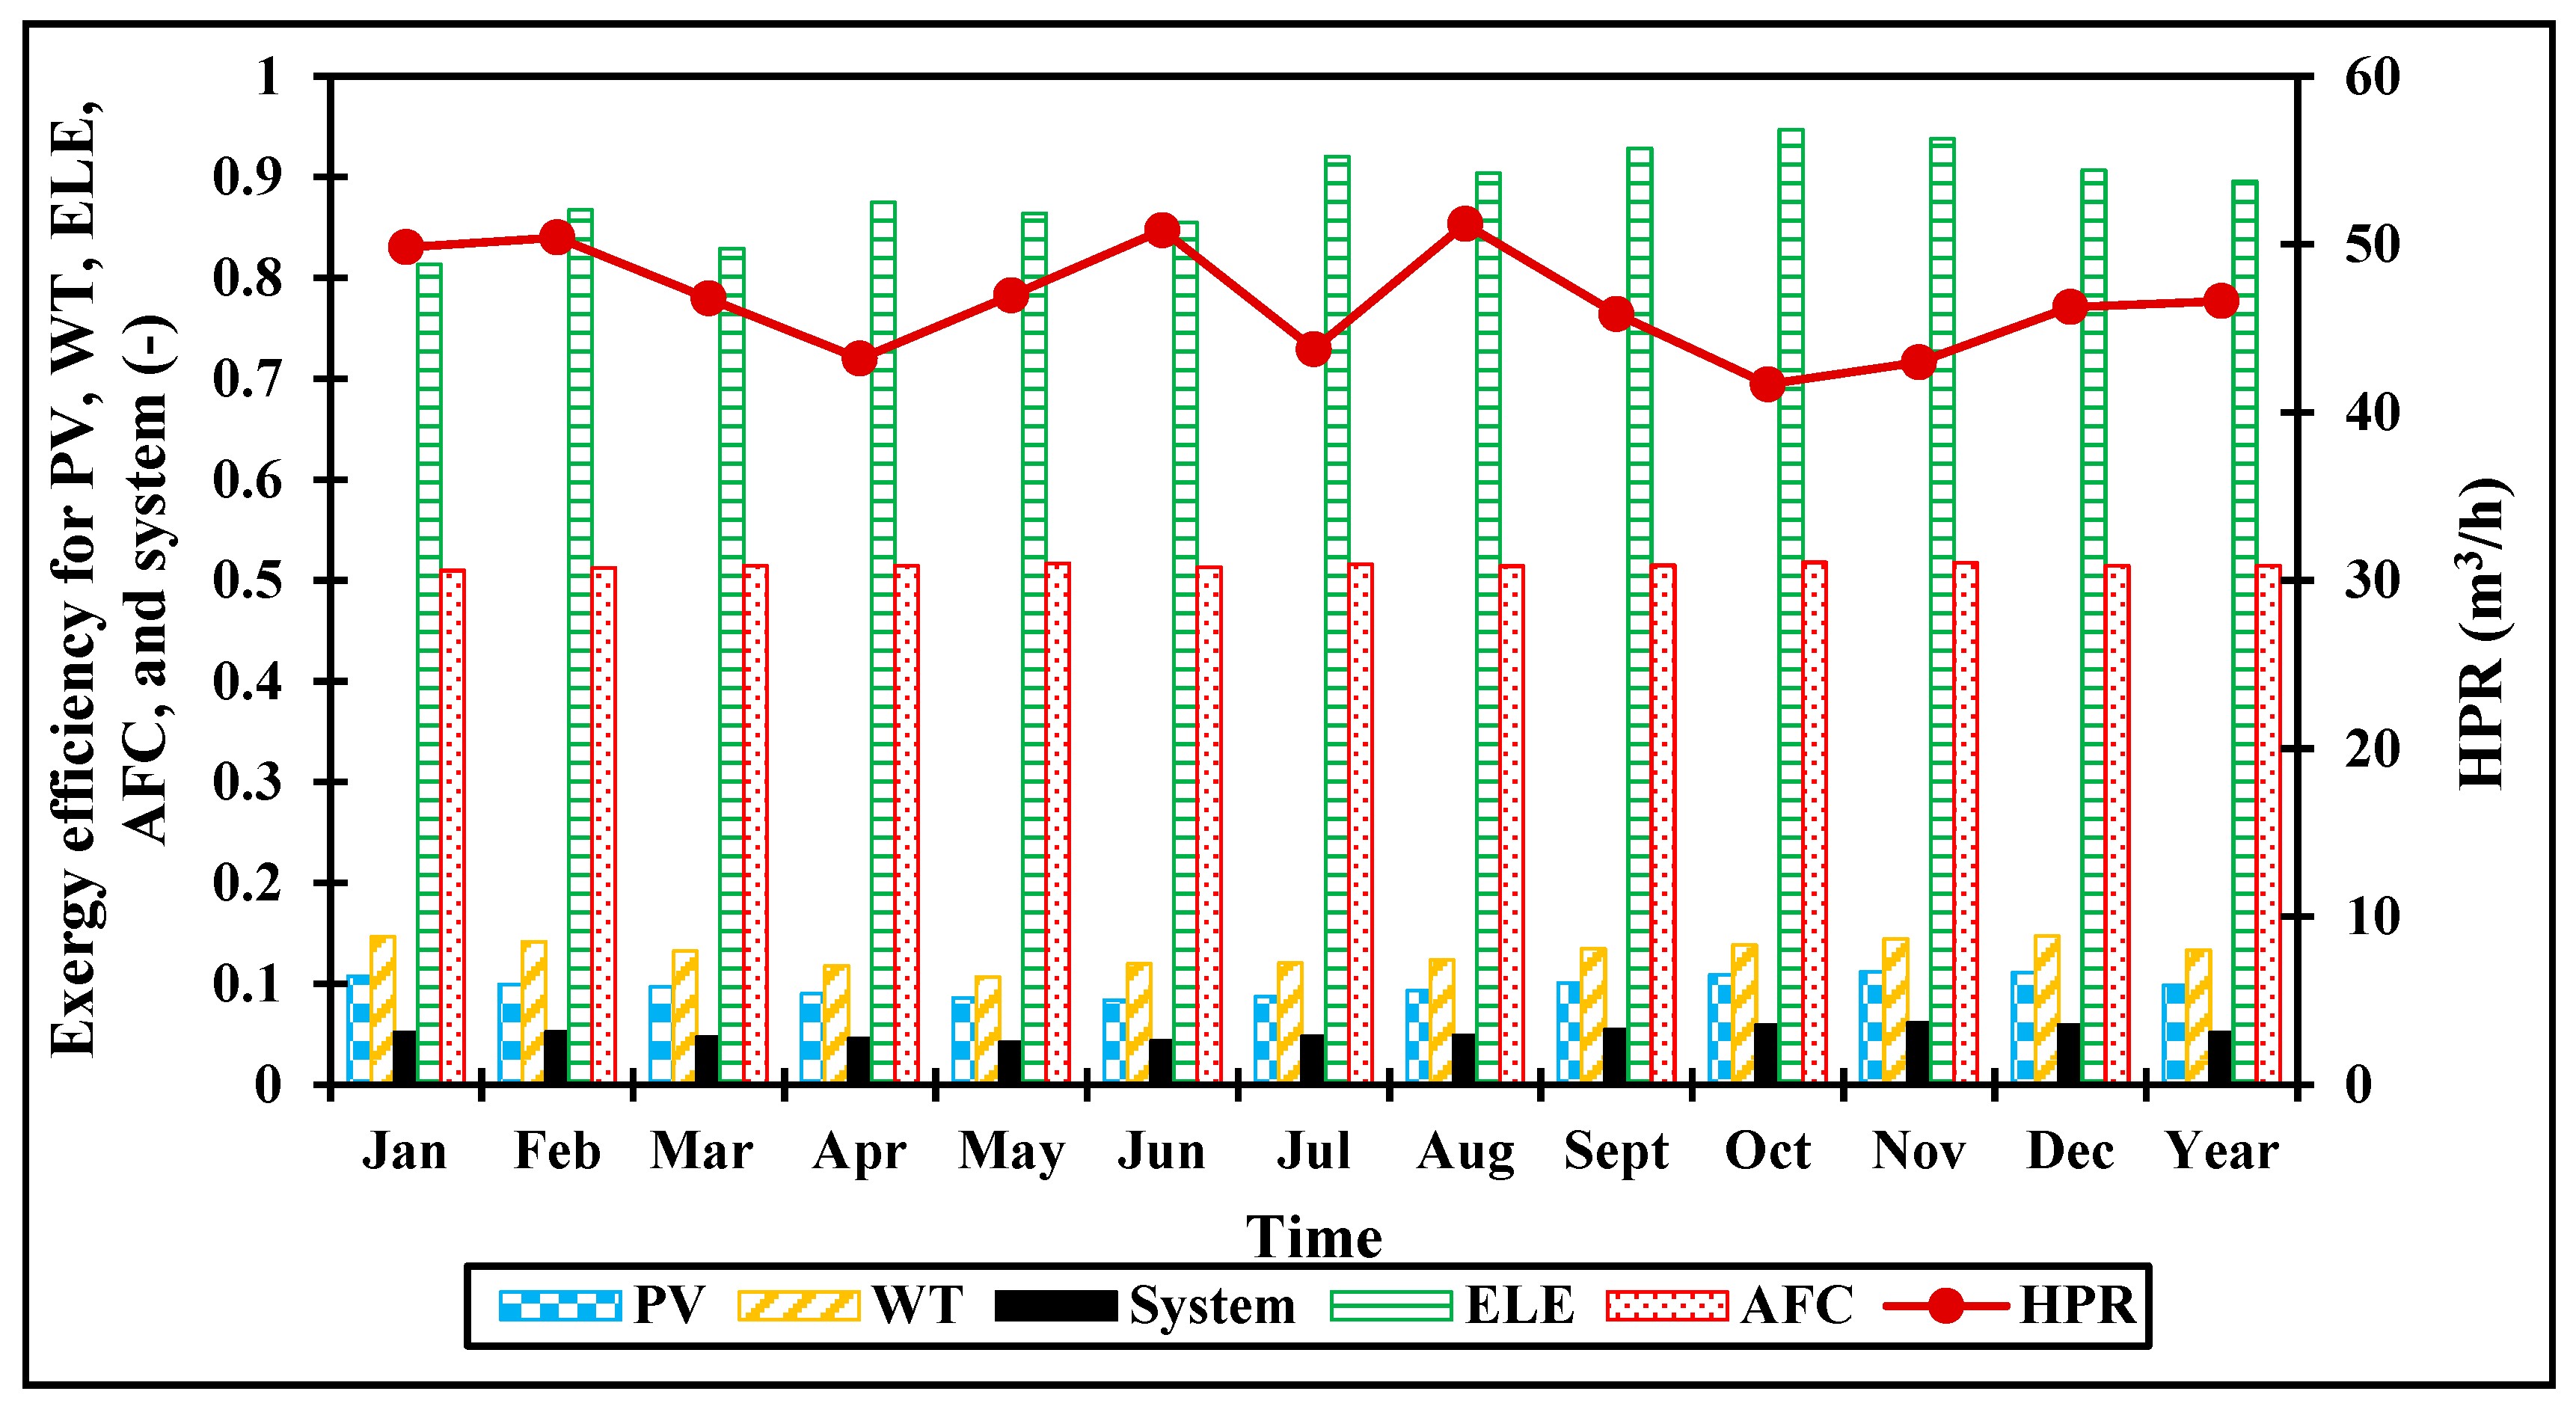
4.3. Energy and Exergy Efficiencies

Figure 10 displays the monthly average energy efficiency for the main system subcomponents and the average overall system energy efficiency. This figure presents the average energy efficiency for the system’s main subcomponents, i.e., the solar PV panels, WT, ELE, and AFC, and the average overall system energy efficiency. As expected, the ELE has the highest energy efficiency among the key system subcomponents, followed by the AFC and then the WT. Meanwhile, the PV showed the lowest energy efficiency. The energy efficiency for each system subcomponent over the months is not uniform. This variation could be because the power inputs to these subcomponents are not only dependent on solar radiation but also affected by wind speed. The average energy efficiency for the ELE, AFC, WT, PV, and whole hybrid PV-WT hydrogen production system is 87.2%, 56.6%, 41.2%, 9.2%, and 7.3%, respectively. Conversely, the corresponding hydrogen production rate (HPR) for the assessed system is between 41.68 and 51.22 m3/h.
Figure 11 displays the monthly average exergy efficiency for the main system subcomponents and the average overall system exergy efficiency. This figure presents the average exergy efficiency for the system’s main subcomponents, i.e., solar PV panels, the WT, the ELE, and the AFC, and the average overall system exergy efficiency. As expected, the ELE has the highest exergy efficiency among the key system subcomponents, followed by the AFC and then the WT. Conversely, the PV showed the lowest exergy efficiency. The exergy efficiency for each system subcomponent over the months is not uniform. This variation could be because the power inputs to these subcomponents are not only dependent on solar radiation but also affected by wind speed. The average exergy efficiency for the ELE, AFC, WT, PV, and whole hybrid PV-WT hydrogen production system is 89.6%, 51.5%, 13.3%, 9.8%, and 5.2%, respectively. Meanwhile, the corresponding HPR for the assessed system is between 41.68 and 51.22 m3/h.
Solar and wind renewable energy resources can be used to produce hydrogen fuel, besides producing electricity in residential or commercial buildings in the climate conditions of Perth, Australia. The significance of studying a mathematical model based on advanced thermal analysis extends beyond economic and environmental assessments. It is essential for the successful design and practical implementation of such projects in real-world applications. The efficiency of the utilized solar PV panels and WT is an important parameter to identify the hydrogen system performance. The analysis indicates that the energy and exergy efficiency on a daily average basis are 9.2% and 9.8% for solar PV panels and 41.2% and 13.3% for the WT, respectively.
Table 5 presents the performance metrics of the solar PV panels in the hybrid PV-WT hydrogen production system. The key characteristics evaluated include the short-circuit current (SCI), open-circuit voltage (OCV) at reference conditions, output voltage (V), and output current (I), all obtained from TRNSYS model simulations. Using the relevant mathematical equations, the monthly average energy and exergy efficiency values of the PV panels are calculated and analyzed. Particularly, in the assessed system, exergy efficiency over months is roughly similar to energy efficiency. This could be because both energy and exergy efficiencies are directly proportional to solar radiation, which emphasizes their link. The analysis indicates that the overall output of electrical power generation from solar PV panels on a daily average basis is 110.761 kW over a year.
Table 6 presents the performance metrics of the WT in the hybrid PV-WT hydrogen production system. The monthly average energy and exergy efficiencies of the WT are calculated and analyzed. Both physical exergy and chemical exergy analyses for the WT are assessed. Particularly, chemical exergy significantly outweighs the physical exergy over months within the assessed system. This variation could be a result of the direct proportionality between exergy efficiency and wind speed, which emphasizes their interdependence. The analysis indicates that the overall output of electrical power generation from the WT on a daily average basis is 105.954 kW over a year.
Table 7 shows an overview of the overall performance results of the whole hybrid PV-WT hydrogen production system. Advanced energy–exergy analysis involving various performance indicators is outlined. The system evaluates its overall performance using these parametric factors. The integration of solar PV panels and a WT to maximize electricity generation and high-quality green hydrogen represents an innovative strategy to achieve sustainable energy solutions. The analysis indicates that the overall output of electrical power generation from the combined PV-WT on a daily average basis is 216.715 kW compared to 110.761 kW for the solar PV panels and 105.954 kW for the WT over a year. This finding confirms that utilizing hybrid resources (solar and wind) significantly improves efficiency compared to using a single renewable energy resource. According to the analysis, the overall daily average basis over a year is 7.3% for energy efficiency, 5.2% for exergy efficiency, 6.22 kW/K for entropy generation, and 1.055 for sustainability index. The studied hybrid PV-WT hydrogen production system annually generates 1898.426 MWh of renewable electricity, corresponding to 252.7 metric tons of hydrogen under Perth’s conditions. Hydrogen production peaks in October at 413.787 tons, a sharp contrast to January’s output, which drops to just 93.544 tons.

4.4. Entropy Generation and Sustainability Index

Figure 12 shows the average monthly entropy generation for the key components of the system (solar PV panels, WT, ELE, and AFC) and the whole hybrid PV-WT hydrogen production system. The analysis indicates that the overall entropy generation daily average basis over a year is 6.22 kW/K for the whole system. Significantly, solar PV panels contribute most to entropy generation, in agreement with the findings of Ref. [48]. This is because, out of all the system’s subcomponents, solar PV panels exhibit the lowest energy efficiency. The results indicate that entropy generation is at its lowest in winter months due to the weakness of solar radiation, while summer months provide maximum entropy generation. The minimum monthly entropy generated is 5.325 kW/K in July, whereas the maximum monthly entropy generated is 6.809 kW/K in January.
Figure 13 illustrates the non-dimensional entropy generation (%) of the key system subcomponents. The solar PV panels account for approximately 56.14% of the total entropy generation. Examining the entropy generation for each subcomponent of the proposed system, it becomes evident that the solar PV panels exhibit the highest entropy generation, amounting to approximately 3.49 kW/K. Following this, the WT plays a significant role in entropy generation, accounting for approximately 37.95% of the total equivalent, at about 2.36 kW/K. The remaining key subcomponents, which are the ELE and AFC, exhibit significantly lower entropy generation compared to the solar PV panels and WT. The ELE and AFC are responsible for roughly 1.25% and 4.65% of the total entropy generation, respectively. Consequently, the entropy generation attributed to the solar PV panels and WT constitutes a substantial portion of the total entropy generation. This finding matches the results in Ref. [48]. Therefore, enhancing the efficiency of renewable energy resources (solar PV panels and WT) should be prioritized to minimize the system’s overall entropy generation.
The sustainability index (SI) can be defined as a metric used to evaluate the sustainability performance of the hybrid PV-WT hydrogen production system. Figure 14 shows the non-dimensional SI (%) of the key system subcomponents. Exergy efficiency can be enhanced and losses minimized by reducing environmental impacts. Exergy efficiency is directly linked to the system’s sustainability, where exergy efficiency increases when the system’s sustainability increases [13]. This study found that the annual daily average SI breakdown is 69% for the ELE, 15% for the AFC, 8% for solar PV panels, and 8% for the WT. The results indicate that, when the system’s exergy efficiency reaches 5.2%, the SI reaches 1.055. Additionally, both sustainability and environmental performance improve as exergy efficiency increases.

4.5. Economic and Environmental Results

4.5.1. Economic Results

Table 8 presents cost details associated with each system subcomponent in this research. Figure 15 shows the non-dimensional initial cost (%) of each subcomponent in the hybrid PV-WT hydrogen production system. Notably, the parametric cost assessment excludes the financial considerations of hydrogen storage and transportation. Cost analysis revealed that the non-dimensional initial cost is 33% for the WT, 30% for solar PV panels, 22% for the ELE, 8% for the converter, 5% for the AFC, and 2% for the hydrogen tank. The WT and solar PV panels contribute significantly to the initial cost, with a value of approximately 33% and 30% of the total initial cost, respectively. Following this, the ELE accounts for approximately 22% of the total initial cost. The remaining subcomponents involving the converter, AFC, and hydrogen tank exhibit a relatively low initial cost. They are responsible for roughly 8%, 5%, and 2% of the total initial cost, respectively.
Table 9 displays the calculated economic performance metrics for the assessed hybrid PV-WT hydrogen generation system. According to the analysis, the E ˙ a n n u a l , LCOE, EPBT, and LCOH are 1,898,426.11 kWh, 0.102 USD/kWh, 5.61 years, and 4.94 USD/kg for the assessed system. Similar observations can be found in Refs. [13,37,41,42]. The current findings demonstrate the economic benefits of installing this hybrid hydrogen production system in Perth, Australia, and other locations with similar climates, particularly those with comparatively high wind energy alongside solar energy.
Table 10 shows a comparison of the present hybrid PV-WT hydrogen production system with earlier studies. The focus is on economic indicators under different climatic conditions in various countries. The presented results highlight significant regional variations in key economic indicators for hydrogen production via renewable energy systems. This research affirms that direct comparison is difficult due to differences in input parameters, operating conditions, ambient environments, and subsystem configurations. Despite these variations, the current study performs better. Notably, the system yields a hydrogen production of 7.51 kg/kWh, remarkably surpassing previous values. This result indicates that there must be deeper research on hydrogen production systems. Optimizing performance requires considering multiple technical and environmental factors.

4.5.2. Environmental Assessment Results

Table 11 shows the estimated environmental performance metrics for the assessed hybrid PV-WT hydrogen production system with a 20-year operating lifespan. Notably, the current analysis of CO2 reduction is limited to operational phases. It does not include impacts from manufacturing or decommissioning in the proposed environmental assessment. Globally, reducing each metric ton of CO2 is projected to cost USD 14.5 [58]. The assessed system demonstrates superior performance in terms of CO2 emissions, net CO2 mitigation, and the consequent carbon credit gained. The results indicate that the annual CO2 emissions, net CO2 mitigation, and carbon credit gained are 1087.73 tons/year, 55,777.13 tons, and USD 808,768.4, respectively.

5. Limitations and Future Research Directions

Despite conducting a comprehensive analysis for the proposed hybrid PV-WT hydrogen production system, it is crucial to acknowledge the limitations of this study. This study’s conclusions are contingent upon the state of the market, the availability of local resources, and the state of technology at current times, all of which are subject to change over time. The economic viability and practical application of hybrid systems in Perth, Australia, may be impacted by variables like policy changes, economic volatility, and the unpredictability of renewable energy production. The main challenges of this research can be summarized as intermittency, cost efficiency, and scalability. Intermittency requires the use of batteries or super-capacitors to ensure stable ELE operation. Cost efficiency involves focusing on more affordable ELE technologies (such as alkaline/AEM) and improving renewable energy sources. Scalability depends on strong policy support, as pilot projects have shown feasibility, but large-scale adoption remains a hurdle.
Future research should focus on the following areas to enhance the profitability and effectiveness of hydrogen systems powered by renewable resources in Perth, Australia, and similar locations:
  • Investigate developments in energy storage, the technique of electrolysis, and smart grid integration to improve system dependability and efficiency.
  • The design and functioning of the system could be optimized by carrying out comprehensive assessments of other renewable resources that are accessible, such as solar, wind, tidal, and geothermal.
  • Researchers are developing sophisticated economic models and scenario studies to assess the prospective cost sustainability of producing hydrogen from renewable sources.
  • Assessing hybrid renewable-based hydrogen production integration with battery capacity and hydrogen storage sizing through parametric analysis is recommended.
  • Incorporating the costs associated with hydrogen storage and transportation is recommended.
  • The current analysis of CO2 reduction is limited to operational phases. The environmental assessment should be enhanced by incorporating the impacts associated with manufacturing and decommissioning processes.
  • Some performance indicators of the AFC and ELE, such as current density, temperature, and pressure, can be thoroughly examined.
  • The AFC’s efficiency is highly sensitive to temperature, load changes, and hydrogen supply. To maintain stability and performance under dynamic conditions, robust control strategies, real-time monitoring, and adaptive parameter adjustments are essential.
  • It is advised to use machine learning and optimization techniques to facilitate renewable resource-powered hydrogen systems.
  • It is advised that the performance of hybrid PV-WT hydrogen production systems be investigated concerning further configurations and design criteria.

6. Conclusions

This study presents a TRNSYS-based 4E (energy, exergy, economic, environmental) analysis for hydrogen fuel applications. The analysis is conducted for an off-grid PV-WT system under the coastal climate conditions of Perth, Australia. The coastal climate proves ideal, with optimized performance metrics confirming the feasibility of hydrogen production and refueling infrastructure. The hybrid PV-WT system outperforms standalone PV or WT systems in hydrogen generation and supports multiple applications, including desalination, electricity, heating, and cooling. The proposed system demonstrates cost efficiency, high energy and exergy performance, and significant green hydrogen output. The results indicate that the hybrid system is both technically viable and economically competitive, offering a sustainable solution for off-grid coastal electrification and future energy demands. The key outcomes of this research are as follows:
  • The findings indicate that the system performance is substantially sensitive to changes in the ambient conditions over a year. The studied hybrid PV-WT hydrogen production system annually generates 1898.426 MWh of renewable electricity, corresponding to 252.7 metric tons of hydrogen under Perth’s conditions.
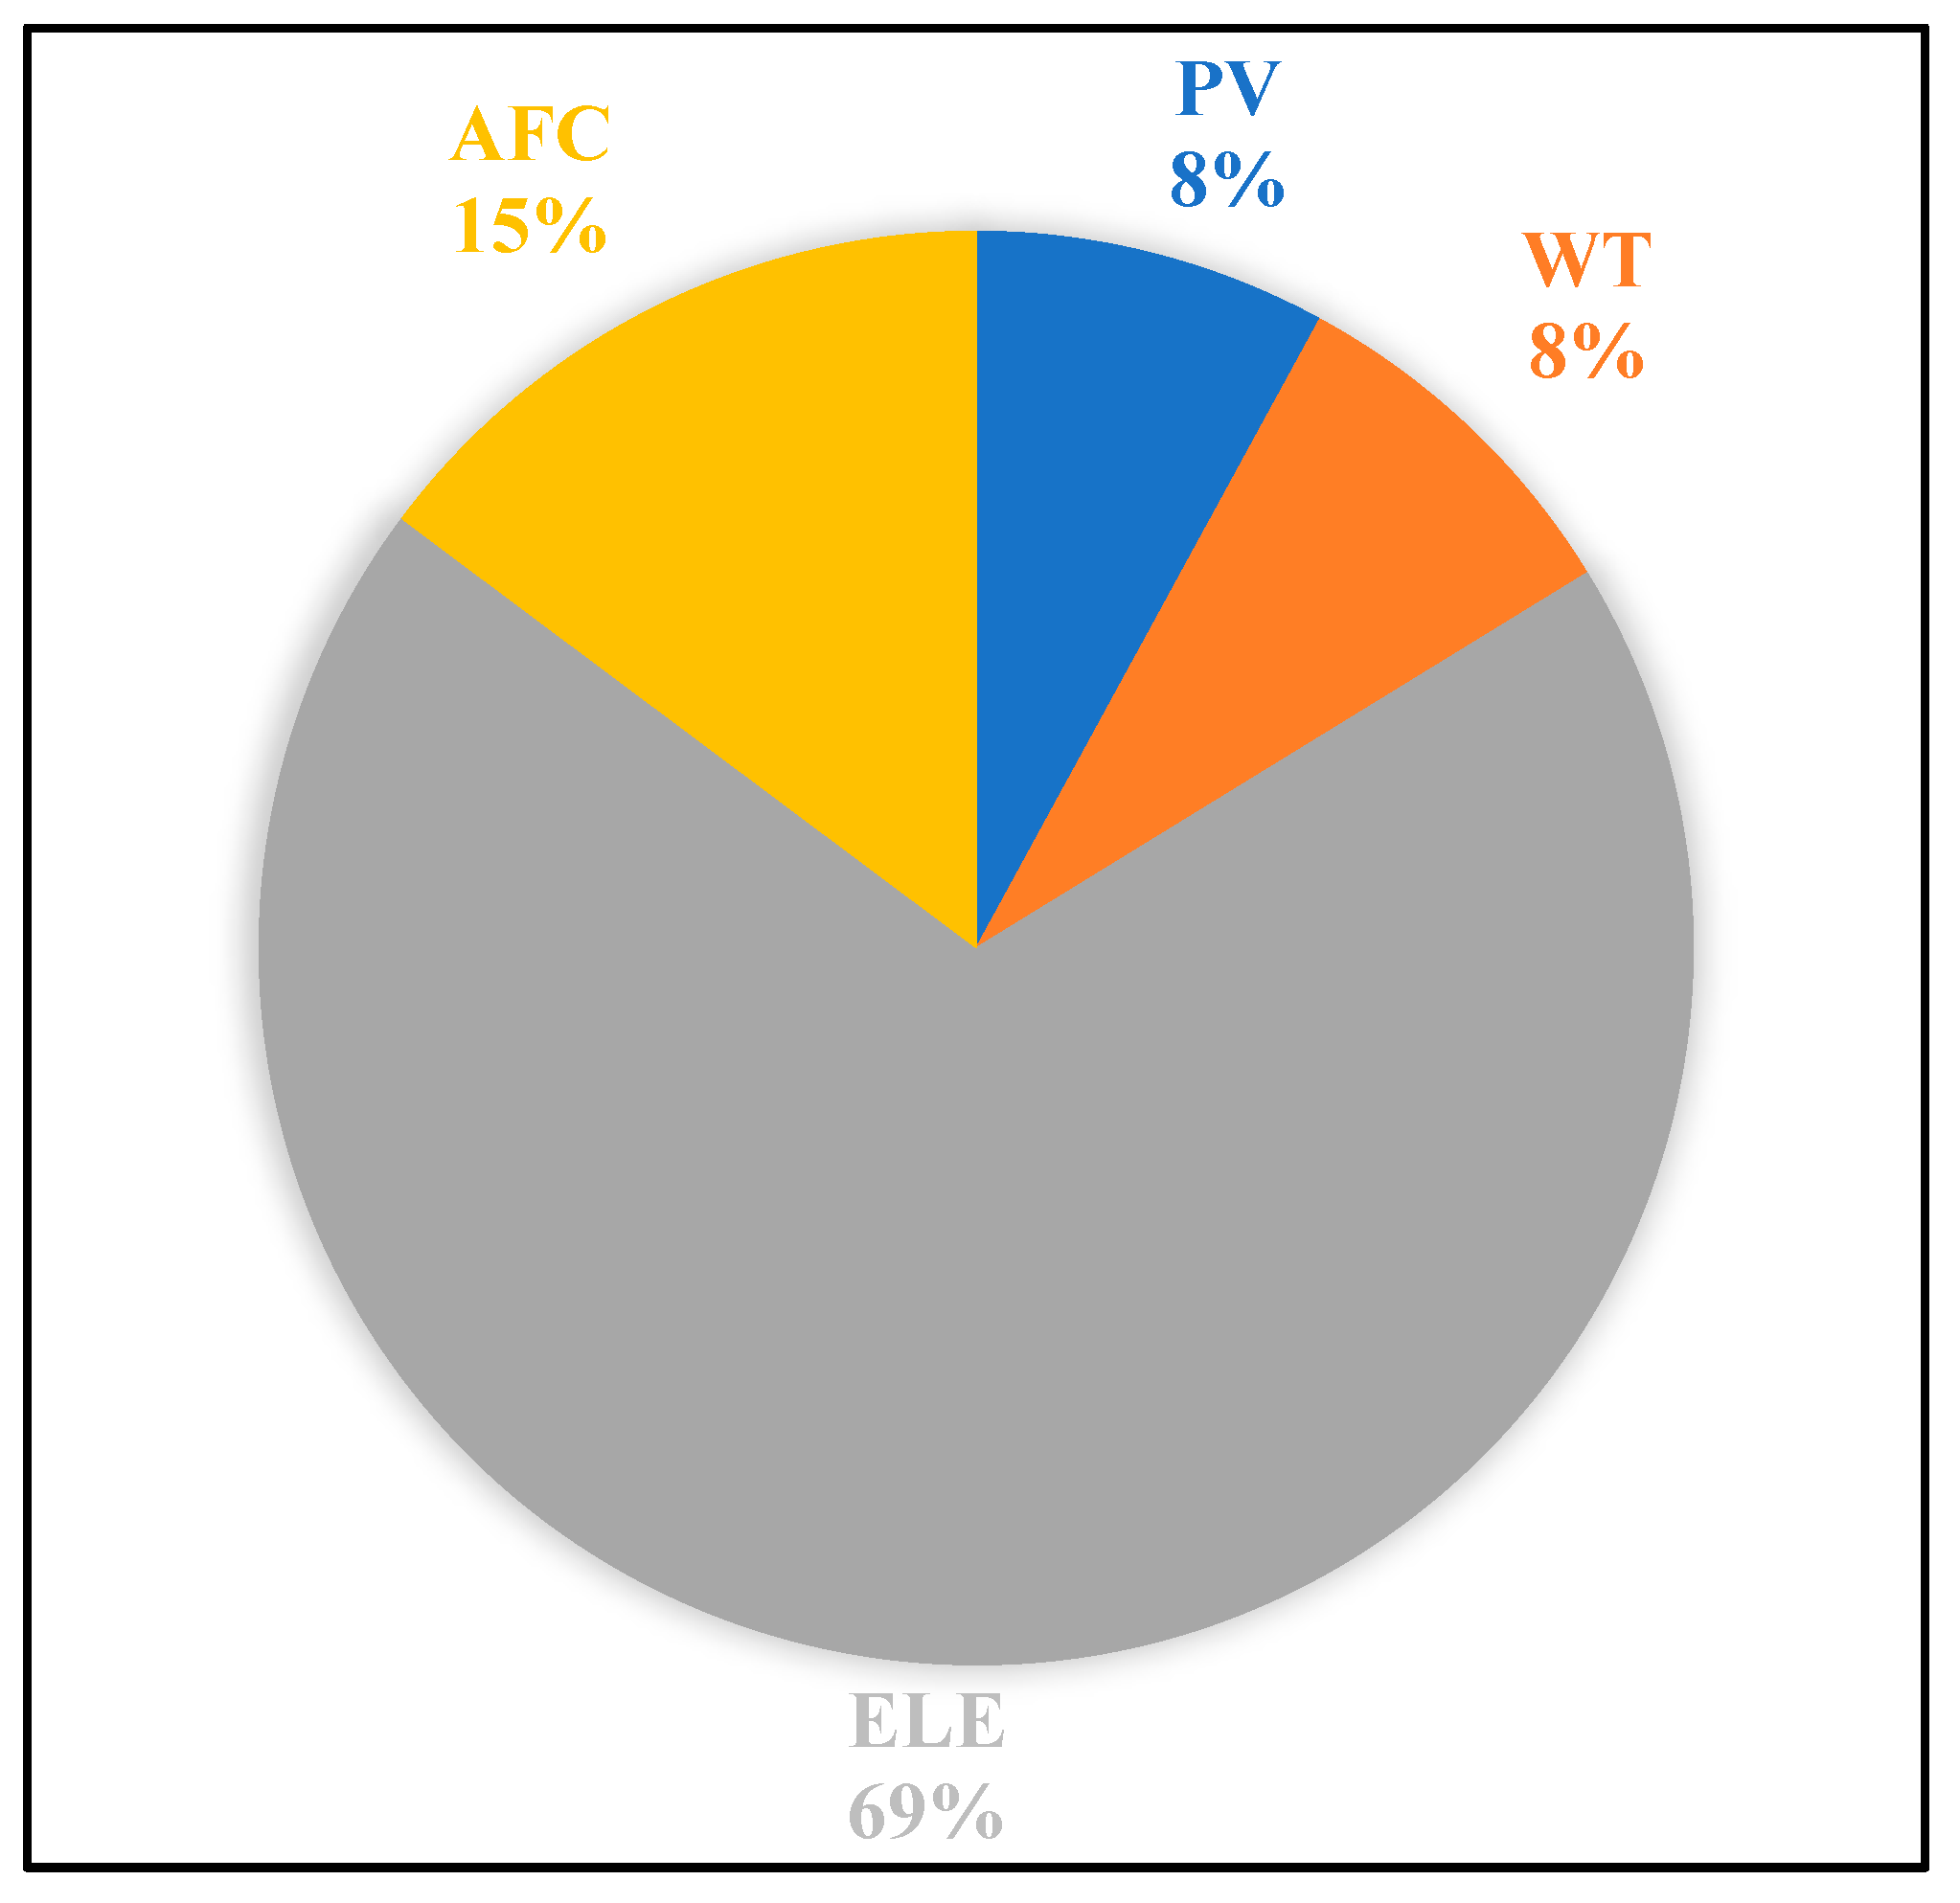
  • As expected, the ELE has the highest exergy efficiency, at 89.6%, and non-dimensional sustainability, at 69%, compared to the other system subcomponents. This emphasizes that exergy efficiency increases when sustainability increases.
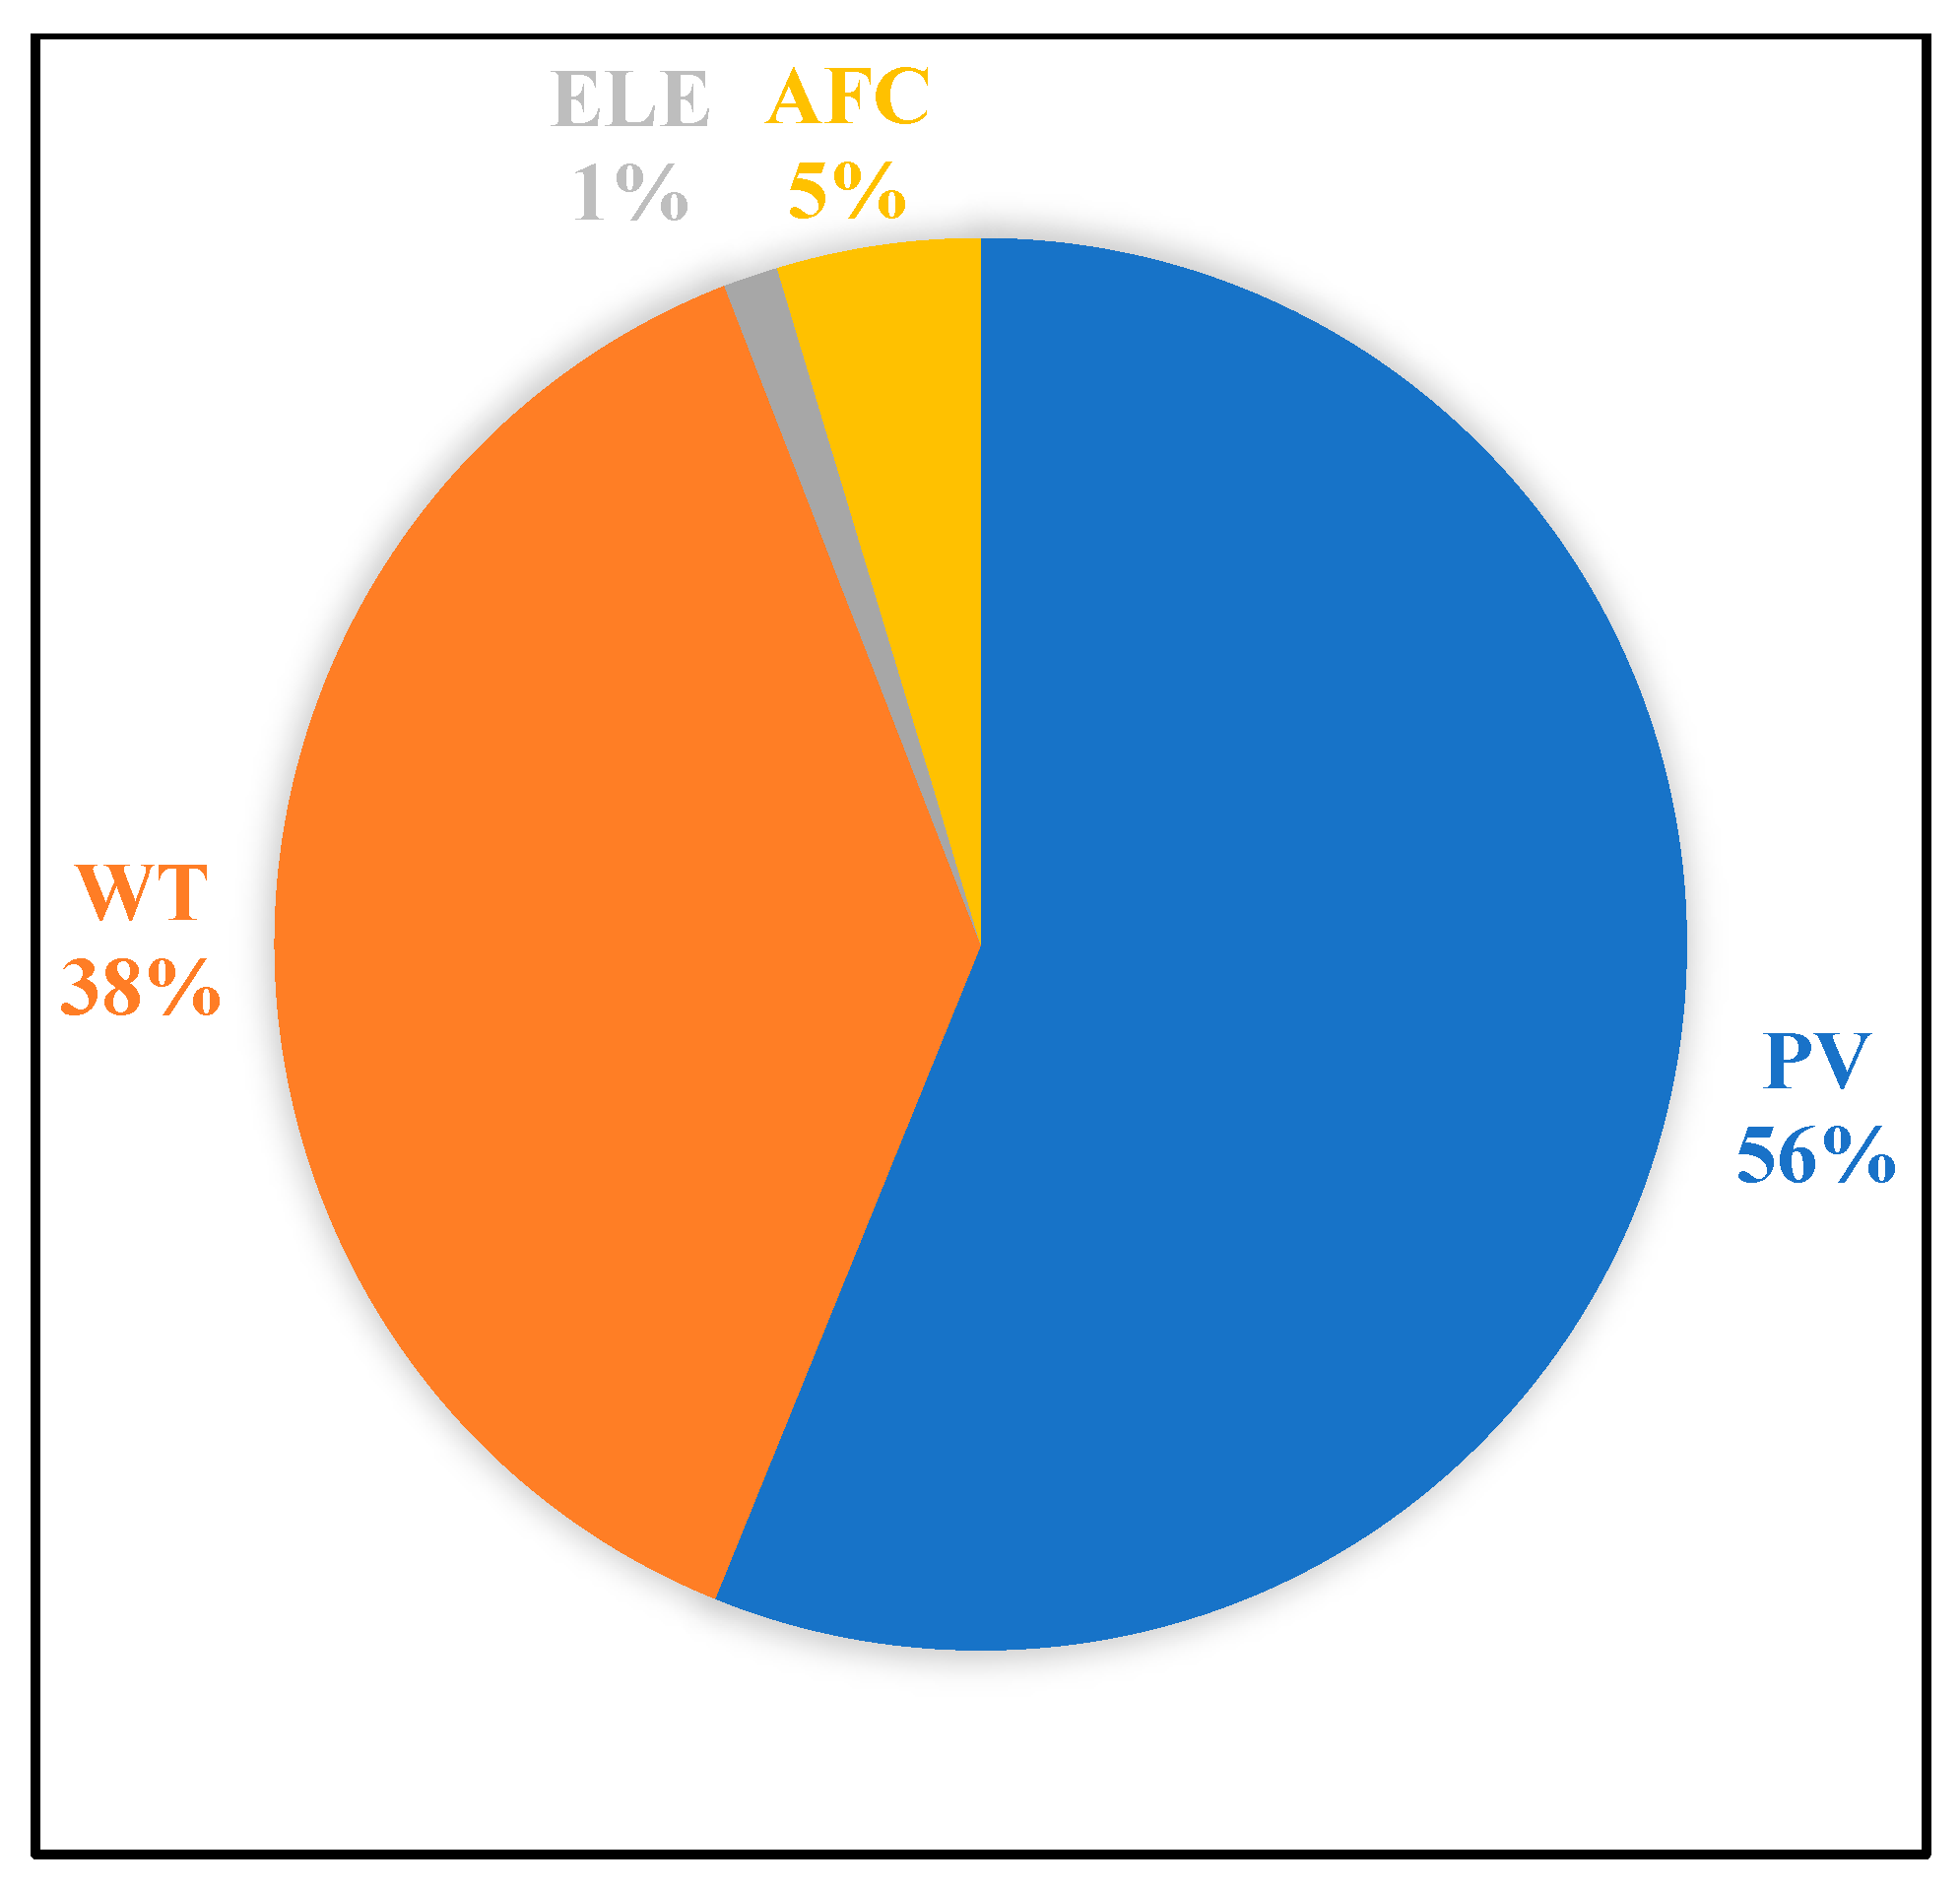
  • Solar PV panels have the highest entropy generation, at 56.14%, compared to the other system subcomponents, amounting to approximately 3.49 kW/K.
  • The overall output of electrical power generation on a daily average basis is 110.761 kW from the solar PV panels and 105.954 kW from the WT. The energy and exergy efficiency on a daily average basis are 9.2% and 9.8% for solar PV panels and 41.2% and 13.3% for the WT, respectively.
  • It has been observed that the overall daily average over a year for the whole system is 7.3% for energy efficiency, 5.2% for exergy efficiency, 6.22 kW/K for entropy generation, and 1.055 for sustainability index.
  • Enhancing the efficiency of renewable energy resources (solar PV panels and WT) should be prioritized to minimize the system’s overall entropy generation.
  • Additionally, this analysis reveals that the average yearly value of the levelized cost of energy (LCOE) is 0.102 USD/kWh, the levelized cost of hydrogen (LCOH) is 4.94 USD/kg, and the energy payback time (EPBT) is 5.61 years.
  • The current findings demonstrate the economic benefits of installing this hybrid hydrogen production system in Perth, Australia, and other locations with similar climates, particularly those with comparatively high wind energy alongside solar energy.
  • The results indicate that the annual CO2 emissions, net CO2 mitigation, and carbon credit gained are 1087.73 tons/year, 55777.13 tons, and USD 808768.4, respectively.
  • Hybrid PV-WT renewable resources improve overall system efficiency and enable uninterrupted, ongoing operation. Such systems are suitable in remote, coastal, and arid areas.

Funding

This research received no external funding.

Data Availability Statement

The original contributions presented in this study are included in the article. Further inquiries can be directed to the corresponding author.

Conflicts of Interest

The author declares no conflicts of interest.

References

  1. Hachim, D.M.; Al-Manea, A.; Al-Rbaihat, R.; Abed, Q.A.; Sadiq, M.; Homod, R.Z.; Alahmer, A. Enhancing the Performance of Photovoltaic Solar Cells Using a Hybrid Cooling Technique of Thermoelectric Generator and Heat Sink. J. Sol. Energy Eng. 2025, 147, 021011. [Google Scholar] [CrossRef]
  2. Alrbai, M.; Al-Dahidi, S.; Alahmer, H.; Al-Ghussain, L.; Al-Rbaihat, R.; Hayajneh, H.; Alahmer, A. Integration and Optimization of a Waste Heat Driven Organic Rankine Cycle for Power Generation in Wastewater Treatment Plants. Energy 2024, 308, 132829. [Google Scholar] [CrossRef]
  3. Jabbar, H.A.; Alwan, K.J.; Hachim, D.M.; Al-Manea, A.; Al-Rbaihat, R.; Alahmer, A. Comparative Assessment of Thermal Oils and Water as Working Fluids in Parabolic Trough Collectors for Enhanced Solar Power Generation. Eng. Res. Express 2024, 6, 035514. [Google Scholar] [CrossRef]
  4. Alahmer, A.; Wang, X.; Al-Rbaihat, R.; Amanul Alam, K.C.; Saha, B.B. Performance Evaluation of a Solar Adsorption Chiller under Different Climatic Conditions. Appl. Energy 2016, 175, 293–304. [Google Scholar] [CrossRef]
  5. Al-Rbaihat, R.; Alahmer, H.; Al-Manea, A.; Altork, Y.; Alrbai, M.; Alahmer, A. Maximizing Efficiency in Solar Ammonia-Water Absorption Refrigeration Cycles: Exergy Analysis, Concentration Impact, and Advanced Optimization with GBRT Machine Learning and FHO Optimizer. Int. J. Refrig. 2024, 161, 31–50. [Google Scholar] [CrossRef]
  6. Alrbai, M.; Alahmer, H.; Alahmer, A.; Al-Rbaihat, R.; Aldalow, A.; Al-Dahidi, S.; Hayajneh, H. Retrofitting Conventional Chilled-Water System to a Solar-Assisted Absorption Cooling System: Modeling, Polynomial Regression, and Grasshopper Optimization. J. Energy Storage 2023, 65, 107276. [Google Scholar] [CrossRef]
  7. Kuterbekov, K.; Kabyshev, A.; Bekmyrza, K.; Kubenova, M. Energy, Exergy and Thermo-Economics Analyses of Hybrid Solar, Steam Turbine and Biomass Gasification System for Hydrogen Production by Polymer Membrane Electrolyzer. Int. J. Thermofluids 2024, 21, 100556. [Google Scholar] [CrossRef]
  8. Ahmed, I.H.; Alakoul, K.A.; Al-Manea, A.; Wetaify, A.R.H.; Saleh, K.; Al-Rbaihat, R.; Alahmer, A. An Overview of Hydrogen Production Techniques: Challenges and Limiting Factors in Achieving Wide-Scale Productivity. AIP Conf. Proc. 2024, 3051, 050003. [Google Scholar]
  9. Wang, M.; Yang, W.; Zhu, W.; Yang, Y.; Meng, P.; Huang, Y.; Lin, W.; Xie, C.; You, L.; Xiong, L. Hysteresis Energy Management and Optimization of Transportation Energy System Considering Dynamic Electricity Price. Energy Convers. Manag. 2025, 327, 119574. [Google Scholar] [CrossRef]
  10. Akpasi, S.O.; Smarte Anekwe, I.M.; Tetteh, E.K.; Amune, U.O.; Mustapha, S.I.; Kiambi, S.L. Hydrogen as a Clean Energy Carrier: Advancements, Challenges, and Its Role in a Sustainable Energy Future. Clean Energy 2025, 9, 52–88. [Google Scholar] [CrossRef]
  11. Osman, A.I.; Mehta, N.; Elgarahy, A.M.; Hefny, M.; Al-Hinai, A.; Al-Muhtaseb, A.H.; Rooney, D.W. Hydrogen Production, Storage, Utilisation and Environmental Impacts: A Review. Environ. Chem. Lett. 2022, 20, 153–188. [Google Scholar] [CrossRef]
  12. Rezaei, M.; Naghdi-Khozani, N.; Jafari, N. Wind Energy Utilization for Hydrogen Production in an Underdeveloped Country: An Economic Investigation. Renew. Energy 2020, 147, 1044–1057. [Google Scholar] [CrossRef]
  13. Nasser, M.; Megahed, T.F.; Ookawara, S.; Hassan, H. Performance Evaluation of PV Panels/Wind Turbines Hybrid System for Green Hydrogen Generation and Storage: Energy, Exergy, Economic, and Enviroeconomic. Energy Convers. Manag. 2022, 267, 115870. [Google Scholar] [CrossRef]
  14. Sopian, K.; Ibrahim, M.Z.; Wan Daud, W.R.; Othman, M.Y.; Yatim, B.; Amin, N. Performance of a PV-Wind Hybrid System for Hydrogen Production. Renew. Energy 2009, 34, 1973–1978. [Google Scholar] [CrossRef]
  15. Abdelkareem, M.A.; Soudan, B.; Mahmoud, M.S.; Sayed, E.T.; AlMallahi, M.N.; Inayat, A.; Al Radi, M.; Olabi, A.G. Progress of Artificial Neural Networks Applications in Hydrogen Production. Chem. Eng. Res. Des. 2022, 182, 66–86. [Google Scholar] [CrossRef]
  16. Wilberforce, T.; Olabi, A.G.; Imran, M.; Sayed, E.T.; Abdelkareem, M.A. System Modelling and Performance Assessment of Green Hydrogen Production by Integrating Proton Exchange Membrane Electrolyser with Wind Turbine. Int. J. Hydrogen Energy 2023, 48, 12089–12111. [Google Scholar] [CrossRef]
  17. Sharma, S.; Agarwal, S.; Jain, A. Significance of Hydrogen as Economic and Environmentally Friendly Fuel. Energies 2021, 14, 7389. [Google Scholar] [CrossRef]
  18. Rezk, H.; Olabi, A.G.; Abdelkareem, M.A.; Alahmer, A.; Sayed, E.T. Maximizing Green Hydrogen Production from Water Electrocatalysis: Modeling and Optimization. J. Mar. Sci. Eng. 2023, 11, 617. [Google Scholar] [CrossRef]
  19. Seck, G.S.; Hache, E.; Sabathier, J.; Guedes, F.; Reigstad, G.A.; Straus, J.; Wolfgang, O.; Ouassou, J.A.; Askeland, M.; Hjorth, I. Hydrogen and the Decarbonization of the Energy System in Europe in 2050: A Detailed Model-Based Analysis. Renew. Sustain. Energy Rev. 2022, 167, 112779. [Google Scholar] [CrossRef]
  20. Chen, Y.; Liu, J.; Feng, L. Transient Analysis of a Green Hydrogen Production and Storage System Using Alkaline Electrolyzer. Fuel 2022, 324, 124752. [Google Scholar] [CrossRef]
  21. Karacavus, B.; Aydın, K. Hydrogen Production and Storage Analysis of a System by Using TRNSYS. Int. J. Hydrogen Energy 2020, 45, 34608–34619. [Google Scholar] [CrossRef]
  22. Topriska, E.; Kolokotroni, M.; Dehouche, Z.; Novieto, D.T.; Wilson, E.A. The Potential to Generate Solar Hydrogen for Cooking Applications: Case Studies of Ghana, Jamaica and Indonesia. Renew. Energy 2016, 95, 495–509. [Google Scholar] [CrossRef]
  23. Pal, P.; Mukherjee, V. Off-Grid Solar Photovoltaic/Hydrogen Fuel Cell System for Renewable Energy Generation: An Investigation Based on Techno-Economic Feasibility Assessment for the Application of End-User Load Demand in North-East India. Renew. Sustain. Energy Rev. 2021, 149, 111421. [Google Scholar] [CrossRef]
  24. Joshi, A.S.; Dincer, I.; Reddy, B. V Solar Hydrogen Production: A Comparative Performance Assessment. Int. J. Hydrogen Energy 2011, 36, 11246–11257. [Google Scholar] [CrossRef]
  25. Dincer, I.; Joshi, A.S. Solar Based Hydrogen Production Systems; Springer: New York, NY, USA, 2013; Volume 553. [Google Scholar]
  26. Ratib, M.K.; Muttaqi, K.M.; Islam, M.R.; Sutanto, D.; Agalgaonkar, A.P. Large-Scale Production of Green Hydrogen from Solar Energy in Australia: Operation and Control of a Multi-Unit PEM Electrolyser System. Int. J. Hydrogen Energy 2025, 98, 873–886. [Google Scholar] [CrossRef]
  27. Mostafaeipour, A.; Khayyami, M.; Sedaghat, A.; Mohammadi, K.; Shamshirband, S.; Sehati, M.-A.; Gorakifard, E. Evaluating the Wind Energy Potential for Hydrogen Production: A Case Study. Int. J. Hydrogen Energy 2016, 41, 6200–6210. [Google Scholar] [CrossRef]
  28. Honnery, D.; Moriarty, P. Estimating Global Hydrogen Production from Wind. Int. J. Hydrogen Energy 2009, 34, 727–736. [Google Scholar] [CrossRef]
  29. Genç, M.S.; Çelik, M.; Karasu, İ. A Review on Wind Energy and Wind–Hydrogen Production in Turkey: A Case Study of Hydrogen Production via Electrolysis System Supplied by Wind Energy Conversion System in Central Anatolian Turkey. Renew. Sustain. Energy Rev. 2012, 16, 6631–6646. [Google Scholar] [CrossRef]
  30. Olateju, B.; Kumar, A.; Secanell, M. A Techno-Economic Assessment of Large Scale Wind-Hydrogen Production with Energy Storage in Western Canada. Int. J. Hydrogen Energy 2016, 41, 8755–8776. [Google Scholar] [CrossRef]
  31. Rezaei-Shouroki, M.; Mostafaeipour, A.; Qolipour, M. Prioritizing of Wind Farm Locations for Hydrogen Production: A Case Study. Int. J. Hydrogen Energy 2017, 42, 9500–9510. [Google Scholar] [CrossRef]
  32. Liponi, A.; Frate, G.F.; Baccioli, A.; Ferrari, L.; Desideri, U. Impact of Wind Speed Distribution and Management Strategy on Hydrogen Production from Wind Energy. Energy 2022, 256, 124636. [Google Scholar] [CrossRef]
  33. Akyuz, E.; Oktay, Z.; Dincer, I. Performance Investigation of Hydrogen Production from a Hybrid Wind-PV System. Int. J. Hydrogen Energy 2012, 37, 16623–16630. [Google Scholar] [CrossRef]
  34. Kalinci, Y.; Dincer, I.; Hepbasli, A. Energy and Exergy Analyses of a Hybrid Hydrogen Energy System: A Case Study for Bozcaada. Int. J. Hydrogen Energy 2017, 42, 2492–2503. [Google Scholar] [CrossRef]
  35. Rezaei, M.; Khalilpour, K.R.; Mohamed, M.A. Co-Production of Electricity and Hydrogen from Wind: A Comprehensive Scenario-Based Techno-Economic Analysis. Int. J. Hydrogen Energy 2021, 46, 18242–18256. [Google Scholar] [CrossRef]
  36. Al-Ghussain, L.; Ahmad, A.D.; Abubaker, A.M.; Hassan, M.A. Exploring the Feasibility of Green Hydrogen Production Using Excess Energy from a Country-Scale 100% Solar-Wind Renewable Energy System. Int. J. Hydrogen Energy 2022, 47, 21613–21633. [Google Scholar] [CrossRef]
  37. Elminshawy, N.A.S.; Diab, S.; Yassen, Y.E.S.; Elbaksawi, O. An Energy-Economic Analysis of a Hybrid PV/Wind/Battery Energy-Driven Hydrogen Generation System in Rural Regions of Egypt. J. Energy Storage 2024, 80, 110256. [Google Scholar] [CrossRef]
  38. Tian, C.; Tan, Q.; Fang, G.; Wen, X. Hydrogen Production to Combat Power Surpluses in Hybrid Hydro–Wind–Photovoltaic Power Systems. Appl. Energy 2024, 371, 123627. [Google Scholar] [CrossRef]
  39. Benghanem, M.; Mellit, A.; Almohamadi, H.; Haddad, S.; Chettibi, N.; Alanazi, A.M.; Dasalla, D.; Alzahrani, A. Hydrogen Production Methods Based on Solar and Wind Energy: A Review. Energies 2023, 16, 757. [Google Scholar] [CrossRef]
  40. Bhandari, B.; Lee, K.-T.; Lee, C.S.; Song, C.-K.; Maskey, R.K.; Ahn, S.-H. A Novel Off-Grid Hybrid Power System Comprised of Solar Photovoltaic, Wind, and Hydro Energy Sources. Appl. Energy 2014, 133, 236–242. [Google Scholar] [CrossRef]
  41. Okonkwo, P.C.; Islam, M.S.; Taura, U.H.; Barhoumi, E.M.; Mansir, I.B.; Das, B.K.; Ali Sulaiman, M.M.B.; Agyekum, E.B.; Bahadur, I. A Techno-Economic Analysis of Renewable Hybrid Energy Systems for Hydrogen Production at Refueling Stations. Int. J. Hydrogen Energy 2024, 78, 68–82. [Google Scholar] [CrossRef]
  42. Nasser, M.; Megahed, T.F.; Ookawara, S.; Hassan, H. Techno-Economic Assessment of Clean Hydrogen Production and Storage Using Hybrid Renewable Energy System of PV/Wind under Different Climatic Conditions. Sustain. Energy Technol. Assess. 2022, 52, 102195. [Google Scholar] [CrossRef]
  43. Ishaq, H.; Dincer, I. Comparative Assessment of Renewable Energy-Based Hydrogen Production Methods. Renew. Sustain. Energy Rev. 2021, 135, 110192. [Google Scholar] [CrossRef]
  44. Al-Mahmodi, M.; Ayadi, O.; Wang, Y.; Al-Halhouli, A. Sensitivity-Based Techno-Economic Assessment Approach for Electrolyzer Integration with Hybrid Photovoltaic-Wind Plants for Green Hydrogen Production. Int. J. Hydrogen Energy 2025, 97, 904–919. [Google Scholar] [CrossRef]
  45. Wei, D.; Zhang, L.; Alotaibi, A.A.; Fang, J.; Alshahri, A.H.; Almitani, K.H. Transient Simulation and Comparative Assessment of a Hydrogen Production and Storage System with Solar and Wind Energy Using TRNSYS. Int. J. Hydrogen Energy 2022, 47, 26646–26653. [Google Scholar] [CrossRef]
  46. Saleem, M.S.; Abas, N.; Kalair, A.R.; Rauf, S.; Haider, A.; Tahir, M.S.; Sagir, M. Design and Optimization of Hybrid Solar-Hydrogen Generation System Using TRNSYS. Int. J. Hydrogen Energy 2020, 45, 15814–15830. [Google Scholar] [CrossRef]
  47. TRNSYS User Manual: TRNSYS 17 a TRaN Sient SYstem Simulation Program. In TRNSYS Laboratory. Volume 4 Mathematical Reference; Solar Energy Laboratory, University of Wisconsin-Madison: Madison, WI, USA, 2009; Volume 4, pp. 1–486.
  48. Caliskan, H.; Dincer, I.; Hepbasli, A. Energy, Exergy and Sustainability Analyses of Hybrid Renewable Energy Based Hydrogen and Electricity Production and Storage Systems: Modeling and Case Study. Appl. Therm. Eng. 2013, 61, 784–798. [Google Scholar] [CrossRef]
  49. Mahdi, Z.M.; Al-Shamani, A.N.; Al-Manea, A.; Al-zurfi, H.A.; Al-Rbaihat, R.; Sopian, K.; Alahmer, A. Enhancing Photovoltaic Thermal (PVT) Performance with Hybrid Solar Collector Using Phase Change Material, Porous Media, and Nanofluid. Sol. Energy 2024, 283, 112983. [Google Scholar] [CrossRef]
  50. Guo, J.; Wu, Z.; Zhang, F.; Yu, H.; Qian, C. Theoretical Studies on a Dual-Function System Integrating Solar Heating and Radiative Cooling for Year-Round Energy Saving. Sol. Energy 2025, 288, 113293. [Google Scholar] [CrossRef]
  51. Ehyaei, M.A.; Ahmadi, A.; Rosen, M.A. Energy, Exergy, Economic and Advanced and Extended Exergy Analyses of a Wind Turbine. Energy Convers. Manag. 2019, 183, 369–381. [Google Scholar] [CrossRef]
  52. Ozden, E.; Tari, I. Energy–Exergy and Economic Analyses of a Hybrid Solar–Hydrogen Renewable Energy System in Ankara, Turkey. Appl. Therm. Eng. 2016, 99, 169–178. [Google Scholar] [CrossRef]
  53. Montazerinejad, H.; Fakhimi, E.; Ghandehariun, S.; Ahmadi, P. Advanced Exergy Analysis of a PEM Fuel Cell with Hydrogen Energy Storage Integrated with Organic Rankine Cycle for Electricity Generation. Sustain. Energy Technol. Assess. 2022, 51, 101885. [Google Scholar] [CrossRef]
  54. Calderón, M.; Calderón, A.J.; Ramiro, A.; González, J.F.; González, I. Evaluation of a Hybrid Photovoltaic-Wind System with Hydrogen Storage Performance Using Exergy Analysis. Int. J. Hydrogen Energy 2011, 36, 5751–5762. [Google Scholar] [CrossRef]
  55. Liu, G.; Qin, Y.; Yin, Y.; Bian, X.; Kuang, C. Thermodynamic Modeling and Exergy Analysis of Proton Exchange Membrane Fuel Cell Power System. Int. J. Hydrogen Energy 2020, 45, 29799–29811. [Google Scholar] [CrossRef]
  56. Praveenkumar, S.; Agyekum, E.B.; Alwan, N.T.; Qasim, M.A.; Velkin, V.I.; Shcheklein, S.E. Experimental Assessment of Thermoelectric Cooling on the Efficiency of PV Module. Int. J. Renew. Energy Res. 2022, 12, 1670–1681. [Google Scholar] [CrossRef]
  57. Bhandari, R.; Shah, R.R. Hydrogen as Energy Carrier: Techno-Economic Assessment of Decentralized Hydrogen Production in Germany. Renew. Energy 2021, 177, 915–931. [Google Scholar] [CrossRef]
  58. Tyagi, P.K.; Kumar, R. Performance Enhancement of Nanofluid-Based Photovoltaic/Thermal System with a Novel Finned Multi-Block Container of Phase Change Material in the Summer Season of Northern India. J. Energy Storage 2024, 90, 111733. [Google Scholar] [CrossRef]
  59. Turkdogan, S. Design and Optimization of a Solely Renewable Based Hybrid Energy System for Residential Electrical Load and Fuel Cell Electric Vehicle. Eng. Sci. Technol. Int. J. 2021, 24, 397–404. [Google Scholar] [CrossRef]
  60. Al-Sharafi, A.; Al-Buraiki, A.S.; Al-Sulaiman, F.; Antar, M.A. Hydrogen Refueling Stations Powered by Hybrid PV/Wind Renewable Energy Systems: Techno-Socio-Economic Assessment. Energy Convers. Manag. X 2024, 22, 100584. [Google Scholar] [CrossRef]
Figure 1. The methodology’s framework employed for this research.
Energies 18 03108 g001
Figure 2. Map of Australia, showing the location of Perth (−32° N latitude, 115.8° E longitude, and 0.0 m elevation).
Energies 18 03108 g002
Figure 3. Annual trends in hourly (a) ambient temperature, (b) global radiation, and (c) wind speed for Perth, Australia.
Energies 18 03108 g003aEnergies 18 03108 g003b
Figure 4. Schematic diagram for the hybrid PV-WT hydrogen production system.
Energies 18 03108 g004
Figure 5. TRNSYS scheme of the hybrid PV-WT hydrogen production system (case study: Perth, Australia). The color-coded lines represent different data flows: green (weather data), black (load profile), pink (power), brown (current/voltage), red (outline plotter and simulation summary), and blue (hydrogen production).
Energies 18 03108 g005
Figure 6. Validation of the present TRNSYS model against the reference study [13] for hourly hydrogen generation rate (HPR).
Energies 18 03108 g006
Figure 7. Validation of the present TRNSYS model against the previous experimental data [32] for hydrogen generation.
Energies 18 03108 g007
Figure 8. Annual variation in volume and pressure of the hydrogen gas stored in the tank.
Energies 18 03108 g008
Figure 9. Annual variation in hydrogen/oxygen production rates and hydrogen tank pressure (state of charge).
Energies 18 03108 g009
Figure 10. Monthly average energy efficiency and the corresponding hydrogen production rate of the system subcomponents and the overall system.
Energies 18 03108 g010
Figure 11. Monthly average exergy efficiency and the corresponding hydrogen production rate of the system subcomponents and the overall system.
Energies 18 03108 g011
Figure 12. Monthly average entropy generation and the corresponding hydrogen production rate of the system subcomponents and the overall system.
Energies 18 03108 g012
Figure 13. Non-dimensional entropy generation (%) of the key system subcomponents.
Energies 18 03108 g013
Figure 14. Non-dimensional sustainability index (%) of the key system subcomponents.
Energies 18 03108 g014
Figure 15. Non-dimensional initial cost (%) of each system subcomponent.
Energies 18 03108 g015
Table 1. Technical features of the solar PV panels and WT.
ParameterValue
Solar PV panels
TypeMono-crystalline (HiKu7 Mono PERC)
PV power 650 W
PV surface area 4.279 m2
Short-circuit current (SCI) at reference conditions17.16 A
Open-circuit voltage (OCV) at reference conditions37.9 V
Temperature coefficient in the short-circuit current0.05 A/°C
Temperature coefficient in the open-circuit voltage −0.26 V/°C
The number of modules in series5
The number of modules in parallel154
Module cells wired in series144
Wind turbine (WT)
TypeRaum Energy 3.5 kW Wind Turbine
Turbine power 3500 W
Energy production (at 5.0 m/s average wind speed)500 kWh/month
Swept area12.6 m2
Blade diameter 4 m
Tower height to nacelle14.5 m
Start-up wind speed 2.8 m/s
Braking wind speed 22 m/s
Rated wind speed 11 m/s
Number of turbines143
Table 2. Features and settings of the advanced ELE and AFC.
ParameterValue
Advanced alkaline electrolyzer (ELE)
Electrode surface area 0.25 m2
Maximum allowable current density per stack680 mA/cm2
Number of cells in series per stack70
Number of stacks in parallel per unit3
Minimum allowable cell voltage1.4 V
Working pressure 7 bars
Working temperature80 °C
Maximum allowable operating temperature85 °C
Alkaline fuel cell (AFC)
Electrode surface area100 cm2
Number of fuel cell modules in series per stack64
Number of stacks in parallel per fuel cell unit12
Working temperature 70 °C
Open-circuit voltage 5.6 V
Minimum cell voltage limit0.4 V
Table 3. Features and settings of the hydrogen storage tank.
ParameterValue
Actual volume of the hydrogen tank50 m3
Maximum allowable pressure 200 bar
Initial pressure level 0.5
Molar weight of gas2.016 g/mol
Critical pressure of gas12.9
Table 4. Validation results comparing the present study with Nasser et al.’s [13].
ParameterPresent Study
[Perth, Australia]
Nasser et al. [13]
[Alexandria, Egypt]
Relative Error (%)
Annual electricity generation (MWh)107.1108.41.20
Overall energy efficiency (%)15.9716.422.74
Overall exergy efficiency (%)12.4912.762.12
Hydrogen production per year (kg)189119121.10
Average LCOE (USD/kWh)0.1720.1783.37
Average LCOH (USD/kg)4.134.191.43
Average EPBT (years)10.1510.432.68
CO2 emission reduction (tons)681.7689.41.12
Table 5. Advanced energy–exergy analysis and performance metrics results for the solar PV panels in the assessed hybrid PV-WT hydrogen production system.
TimeOCV (V)SCI (A)V
(V)
I
(A)
E ˙ o u t , P V
(kW)
E ˙ i n , P V
(kW)
η P V
(-)
X ˙ o u t , P V (kW) X ˙ i n , P V (kW) φ P V
(-)
EGPV
(kW/K)
Jan114.902847.76673.597838.919128.0451273.0100.101128.0451188.5300.1083.574
Feb104.667819.83265.428810.469122.5661319.8650.093122.5661232.0490.0993.732
Mar102.439806.47764.140798.598122.0131344.3550.091122.0131255.1930.0973.825
Apr95.815607.71658.312603.40495.2791130.8130.08495.2791056.7760.0903.286
May91.666544.51354.417541.92088.3171095.7500.08188.3171024.6130.0863.228
Jun89.169490.79551.433489.07781.9221044.2660.07881.922977.0340.0843.111
Jul93.711471.54654.723469.90078.858964.4090.08278.858902.4670.0872.869
Aug98.488597.13655.484595.536101.4691163.4040.087101.4691088.7090.0933.441
Sept106.447693.86960.156692.127118.7011257.3780.094118.7011176.6290.1013.684
Oct115.351751.87067.391749.054125.6231235.4440.102125.6231155.5790.1093.563
Nov118.161831.56270.000827.218134.5861286.7840.105134.5861202.8240.1123.660
Dec117.520851.33571.905844.656132.4951277.8720.104132.4951193.7440.1113.605
Year104.028692.86862.249688.406110.7611207.2950.092110.7611128.5490.0983.493
Table 6. Advanced energy–exergy analysis and performance metrics results for the WT in the assessed hybrid PV-WT hydrogen production system.
TimeU (m/s) E ˙ o u t , W T
(kW)
E ˙ i n , W T
(kW)
η W T
(-)
x P H
(kJ/kg)
x C H
(kJ/kg)
x K
(kJ/kg)
X ˙ o u t , W T (kW) X ˙ i n , W T (kW) φ W T
(-)
EGWT
(kW/K)
Jan5.800140.838354.0940.39815.62783.89914.950140.838960.2370.1472.761
Feb5.598129.193322.6150.40014.80683.92413.926129.193912.0040.1422.633
Mar5.201108.526264.1770.41112.97583.88712.023108.526819.0350.1332.398
Apr4.59080.902192.9540.41910.47383.8469.36480.902688.2730.1182.076
May4.19565.175153.5960.4248.86383.8267.82365.175609.8530.1071.878
Jun4.59282.283193.7190.42510.39483.7709.37282.283687.6030.1202.104
Jul4.61183.401194.7360.42810.46383.7559.45083.401691.3530.1212.118
Aug4.69187.373204.7060.42710.75683.7619.78287.373707.6500.1232.162
Sept5.100107.141252.4190.42412.43383.77411.558107.141794.7960.1352.395
Oct5.294115.989279.8270.41513.23083.78412.457115.989838.1650.1382.498
Nov5.594131.099321.3870.40814.61783.80713.910131.099908.8870.1442.665
Dec5.796141.053353.1470.39915.51883.84114.930141.053958.0090.1472.775
Year5.086105.954256.9320.41212.62883.82611.495105.954793.9750.1332.361
Table 7. Advanced energy–exergy analysis and performance metrics results for the assessed hybrid PV-WT hydrogen production system.
Time E ˙ o u t , P V
(kW)
E ˙ o u t , W T
(kW)
E ˙ o u t , P V & W T
(kW)
η s y s t e m
(-)
φ s y s t e m
(-)
EGsystem
(kW/K)
SIsystem
(-)
HPRsystem (m3/h)HP (ton)
Jan128.045140.838268.8830.0800.0526.8091.05549.82993.544
Feb122.566129.193251.7590.0750.0526.7751.05550.413185.919
Mar122.013108.526230.5390.0710.0476.6331.05046.781108.631
Apr95.27980.902176.1800.0660.0455.7351.04843.194169.841
May88.31765.175153.4920.0610.0425.4831.04446.960172.400
Jun81.92282.283164.2050.0650.0435.6411.04550.840167.542
Jul78.85883.401162.2590.0700.0485.3251.05143.759318.397
Aug101.46987.373188.8430.0680.0495.9831.05151.216339.983
Sept118.701107.141225.8420.0740.0556.4221.05845.859378.862
Oct125.623115.989241.6130.0800.0596.3621.06341.675413.787
Nov134.586131.099265.6850.0820.0616.6321.06542.984381.130
Dec132.495141.053273.5480.0830.0596.7361.06346.262302.400
Year110.761105.954216.7150.0730.0526.2211.05546.627252.703
Table 8. Cost details associated with each system subcomponent in this research [23,37,41,42,57].
Capital CostCost per Unit
PV panels900 USD/kW
Wind turbines (WTs)1000 USD/kW
Converter (CON)600 USD/kW
Advanced alkaline electrolyzer (ELE)930 USD/kW
Alkaline fuel cell (AFC)450 USD/kW
Hydrogen storage tank 570 USD/kg
Table 9. Economic performance metrics for the assessed hybrid PV-WT hydrogen production system.
ParametersOutcome
Lifetime (n)20 years
K o m parameter0.93
Capital recovery factor (CRF)10.76%
Annual operation and maintenance cost ( C o m )USD 29,830
Constant escalation levelized factor ( C E L F ) 1.08%
Operation and maintenance levelized cost ( L C o m ) USD 32,295.12
Total investment cost ( C i n v )USD 1,491,500
Investment levelized cost ( L C i n v ) USD 160,488
Embodied energy ( E ˙ e m b o d i e d ) 10,653,571.43 kWh
Annual energy ( E ˙ a n n u a l ) for 365 days1,898,426.11 kWh
Levelized cost of energy (LCOE) for 365 days0.102 USD/kWh
Energy payback time (EPBT)5.61 year
Levelized cost of hydrogen (LCOH) for 365 days4.94 USD/kg
Table 10. Comparison of the present hybrid PV-WT hydrogen production system against prior studies.
Reference (Year)RegionKey Economic Indicators
Average LCOE (USD/kWh)Average LCOH (USD/kg)Average EPBT (Year)Hydrogen Production (kg/kWh)
S. Turkdogan [59] (2021)Ayvalık, Turkey0.6856.85-46.40
Nasser et al. [13] (2022)Alexandria, Egypt0.1784.1910.4356.69
Elminshawy et al. [37] (2024)Egypt-2.22-15.23
Okonkwo et al. [41] (2024)Muscat, Oman0.01580.401--
Al-Sharafi et al. [60] (2024)Saudi Arabia-9.70--
Al-Mahmodi et al. [44] (2025)Maan, Jordan-3.97--
Present study (2025)Perth, Australia0.1024.945.617.51
Table 11. Environmental analysis of the assessed hybrid PV-WT hydrogen production system.
ParametersOutcome
Embodied energy ( E ˙ e m b o d i e d ) 10,653,571.43 kWh
Annual energy ( E ˙ a n n u a l ) for 365 days1,898,426.11 kWh
CO2 emission 1087.73 tons/year
Net CO2 mitigation 55,777.13 tons
Carbon credit gained USD 808,768.4
Disclaimer/Publisher’s Note: The statements, opinions and data contained in all publications are solely those of the individual author(s) and contributor(s) and not of MDPI and/or the editor(s). MDPI and/or the editor(s) disclaim responsibility for any injury to people or property resulting from any ideas, methods, instructions or products referred to in the content.

