1. Background
The transition to sustainable energy systems has become a central focus of the European Union’s climate and development agenda, particularly in the context of achieving climate neutrality by 2050. This shift requires coordinated action across sectors and policy domains, with emissions reductions playing a pivotal role in aligning energy and climate goals with broader development outcomes.
Existing research has extensively examined sectoral emissions, resource footprints (including carbon, water, and land), and selected Sustainable Development Goals (SDGs), providing valuable—but often fragmented—insights. Studies typically focus on individual indicators, single sectors, or national case studies. While methods such as structural equation modelling (SEM) and panel regressions (GMM) help identify statistical relationships, they remain limited in capturing complex, multidimensional dependencies across systems.
This paper addresses a crucial gap: the absence of an integrated, data-driven analysis that connects sector-specific CO2 emissions to the entire range of SDG outcomes through a comprehensive probabilistic framework. Most prior work has not identified which emissions pathways most significantly influence sustainability outcomes across various dimensions, such as climate, equity, and economy.
To address this, we apply a Bayesian network (BN) approach, which models probabilistic dependencies among multiple variables simultaneously. Unlike traditional regression or SEM, BNs allow (1) the identification of both direct and indirect (mediated) effects across sectors and goals; (2) the handling of non-linear, non-recursive relationships; and (3) scenario-based inference, revealing leverage points that maximise policy impact across the SDG network.
By mapping interdependencies between sectoral emissions (e.g., energy, industry, agriculture, and land use) and SDG progress, the Bayesian network framework provides novel insights into where emission reductions yield the most significant systemic benefits. For example, it reveals how industrial decarbonisation may indirectly impact Goals 8 (Economic Growth) and 12 (Responsible Consumption) through pathways not visible to linear models.
The structure of this article includes (1) a literature review summarising recent advances in sustainability assessment; (2) a methodology section detailing the construction of the Bayesian network and data sources; (3) empirical results analysing trends and sectoral contributions to emissions; (4) a discussion linking network findings to SDG outcomes and policy leverage points; and (5) conclusions offering strategic recommendations for integrated decarbonisation policies.
This study aims to contribute both theoretically and methodologically by combining systems-level sustainability thinking with advanced probabilistic modelling. Our findings support policymakers in identifying high-impact interventions for emissions reduction that also accelerate SDG progress across the European Union.
2. Introduction
The concept of the energy footprint has emerged as a key metric in assessing sustainable development within the European Union (EU), encapsulating the environmental, economic, and social dimensions of energy production and consumption. With the EU’s commitment to climate neutrality by 2050, emissions from energy-related activities are crucial to evaluating policy effectiveness and long-term sustainability planning [
1,
2,
3].
In this study, the term
energy footprint is understood as the aggregate of sectoral CO
2 emissions generated by core production-oriented branches of the economy, including energy generation, industrial processes, agriculture, and land use. Rather than referring to the consumption-based footprint commonly used by Eurostat, which accounts for embedded energy in goods, this approach adopts a territorial, production-based perspective. In this context, sectoral energy use serves as a proxy for the economic structure of EU member states, capturing the extent to which different sectors contribute to environmental pressures. This framing enables a multidimensional analysis of how sectoral emissions interact with sustainability outcomes, offering insight into their probabilistic relationships with the Sustainable Development Goals (SDGs) [
4,
5].
Recent literature on EU climate and energy policy increasingly emphasises the role of targeted CO
2 emission reductions in advancing sustainable development. Transitioning from fossil fuels to renewable energy has contributed to emission mitigation, particularly in the energy sector, supported by policy instruments such as the Kyoto Protocol and the European Green Deal [
6,
7]. However, evidence shows persistent disparities among member states, both in the uptake of renewables and the scale of CO
2 reductions achieved. Parallel efforts to improve energy efficiency have yielded quantifiable emission benefits and are recognised as a cost-effective mitigation strategy [
8,
9,
10]. Statistical analyses confirm that both increased efficiency and renewable energy penetration are associated with significant reductions in CO
2 emissions, though the latter has shown a more modest effect on economic growth [
11,
12,
13]. Despite policy progress, specific sectors—particularly agriculture—remain significant sources of emissions and require more targeted interventions [
13,
14]. Accordingly, recent studies stress the importance of designing climate policy that is sensitive to regional disparities, emission profiles, and socio-economic conditions [
14,
15].
A growing body of literature explores sector-specific emission dynamics, often focusing on carbon dioxide (CO
2) as the primary environmental indicator. Studies have highlighted the energy sector’s role as both the most significant emitter and the most responsive to policy incentives and renewable energy integration [
16,
17,
18,
19]. In contrast, industrial processes and agriculture exhibit more gradual reductions in emissions due to structural constraints and lower technological adaptability [
20,
21,
22]. These sectoral analyses provide valuable insight but often fail to explore how emission trajectories influence broader sustainable development outcomes.
In parallel, research on the Sustainable Development Goals (SDGs) has primarily taken the form of composite indicator frameworks, national rankings, or case studies [
3,
23]. While helpful for benchmarking progress, such approaches generally treat goals as independent, failing to reveal interlinkages or trade-offs that exist between them. Notably, very few studies investigate how reductions in sectoral emissions conditionally affect progress across multiple SDGs, leaving a gap in integrated environmental–development modelling.
Methodologically, studies have employed regression-based, structural equation modelling (SEM) and panel data models to examine the relationships between emissions, energy consumption, and development indicators [
16,
17,
24]. However, these methods often assume linearity and directionality a priori, and are limited in their capacity to model multidimensional conditional dependencies, feedback loops, or non-recursive relationships—all of which are central to understanding complex sustainability systems.
In recent years, there has been a growing call to adopt systems-based approaches that can capture the complexity of interactions between environmental and socio-economic variables. Bayesian networks (BNs) have gained recognition for their ability to model complex systems and infer probabilistic dependencies in sustainability contexts, including environmental policy, land use, and climate–development interactions [
11,
12,
25]. BNs are particularly suited to sustainability research, as they (1) handle both quantitative and qualitative data, (2) allow for indirect and mediated effects between variables, and (3) support scenario analysis for policy simulations. They are robust to missing values and structural uncertainty when used with bootstrap techniques.
Despite their potential, BNs remain underutilised in sustainability studies, particularly in the context of EU-wide assessments that link sectoral CO2 emissions to SDG performance. A limited number of studies apply Bayesian networks (BNs) to environmental policy modelling, and even fewer do so with a multisectoral structure or across longitudinal datasets.
In addition to direct emission-focused research, several adjacent studies explore related dimensions such as the water footprint of energy systems [
13,
14,
24,
26], bioenergy potentials and trade-offs and urban metabolism [
9,
19,
23,
27]. Policy-driven evaluations of the European Green Deal, EU ETS, and climate regulation also offer valuable context [
27,
28]. Nevertheless, these studies often remain confined to single sectors or policy instruments, limiting their applicability for integrating cross-goal sustainability.
This study addresses the gaps above by employing a Bayesian network model to examine the conditional interlinkages between sector-specific CO
2 emissions and multiple Sustainable Development Goals (SDGs) indicators across EU-27 countries [
14,
29]. By doing so, it advances both methodological and policy-relevant contributions, identifying leverage points where emission reductions can yield broader systemic benefits for sustainable development.
3. Materials and Methods
3.1. Data Sources and Coverage
This study utilises cross-sectional data from 2024 to examine the interdependencies between sectoral carbon dioxide (CO
2) emissions and sustainable development performance across the 27 EU member states [
25,
30]. Sectoral CO
2 emissions data were obtained from the European Environment Agency (EEA), disaggregated by the following IPCC categories: Energy; Industrial Processes and Product Use (IPPU); Agriculture; and Land Use, Land-Use Change, and Forestry (LULUCF).
Sustainable development indicators were sourced from the UN SDG Global Database, which provides standardised Goal Scores for SDGs 1 to 17. These composite scores reflect national performance across economic, social, and environmental domains.
3.2. Variable Selection and Missing Data
A total of 21 variables were used: 4 sectoral emission indicators and 17 SDG scores. All variables were entered in their original continuous form, with no transformations or discretisation applied.
Although 16 variables were fully observed, Goal 14 (Life Below Water) had missing values for six landlocked EU countries. These omissions indicate structural inapplicability of the indicator, rather than data limitations. In total, six values were absent from the SDG Goal 14 indicator across the 27-country dataset, out of 459 total observations for all SDG scores, representing approximately 1.3% of the matrix. This minimal level of missingness did not influence model estimation and was managed natively within the copula-based Bayesian framework. No imputation or case deletion procedures were employed. This underscores a key advantage of the copula-based Bayesian model: its tolerance of incomplete data, which facilitates robust structure learning through pairwise estimation without necessitating fully complete input matrices.
3.3. Bayesian Network Estimation
The analytical framework uses a Bayesian network estimated via the Gaussian Copula Graphical Model (gcgm) implemented in JASP 0.19.1 (Apple Silicon, Cupertino, CA, USA) [
31,
32]. This method infers an acyclic graph of conditional dependencies among variables based on nonparametric correlation structure and rank-transformed data. This approach is particularly suited for multidimensional sustainability analysis because it:
accommodates continuous input data;
captures nonlinear and non-recursive dependencies;
does not rely on predefined causal structures or strong parametric assumptions.
It should be noted that, although the model is referred to as a Bayesian network, the resulting structure is undirected and reflects conditional independence relationships rather than directional causality. The Gaussian copula graphical model estimates partial correlations among variables based on rank transformations, while Bayes Factor thresholds guide edge selection. No conditional probability tables or directional edges are inferred, and the resulting graph is best interpreted as a probabilistic association network rather than a causal structure.
3.4. Structure Learning and Robustness
Network structure learning was conducted using a hill-climbing algorithm optimised by the Bayesian Information Criterion (BIC). A Bayes Factor (BF10) > 10 was applied as a threshold for including edges, thereby ensuring statistical reliability.
Key parameters included (1) burn-in: 5000 iterations; (2) sampling iterations: 10,000; (3) bootstrap replications: 500; (4) edge stability threshold: 80% inclusion across replications; and (5) no fixed seed to preserve stochastic variation.
To ensure robustness, only those edges consistently retained in at least 80% of bootstrap replications were included in the final model. The resulting structure comprised 21 nodes and 39 non-zero edges out of 210 possible, yielding a sparsity level of 0.814. Furthermore, the posterior model distribution exhibited convergence across top-ranking network configurations, indicating the stability of key dependencies despite sampling variation.
This robustness validation demonstrates that the identified interdependencies are not artefacts of overfitting or algorithmic sensitivity, but reflect persistent statistical signals in the underlying data.
3.5. Methodological Justification
The Bayesian network model was chosen over traditional regression, SEM, or GMM approaches due to its flexibility in handling mixed data types, nonlinear dependencies, and conditional relationships, without requiring a priori assumptions about directionality or distributional form. Unlike panel models, which often assume independence or linearity, this method elucidates latent systemic linkages between emission sectors and SDG progress, thereby identifying actionable leverage points for sustainability policymaking.
4. Results
4.1. General Trends in CO2 Emissions in EU-27 Countries
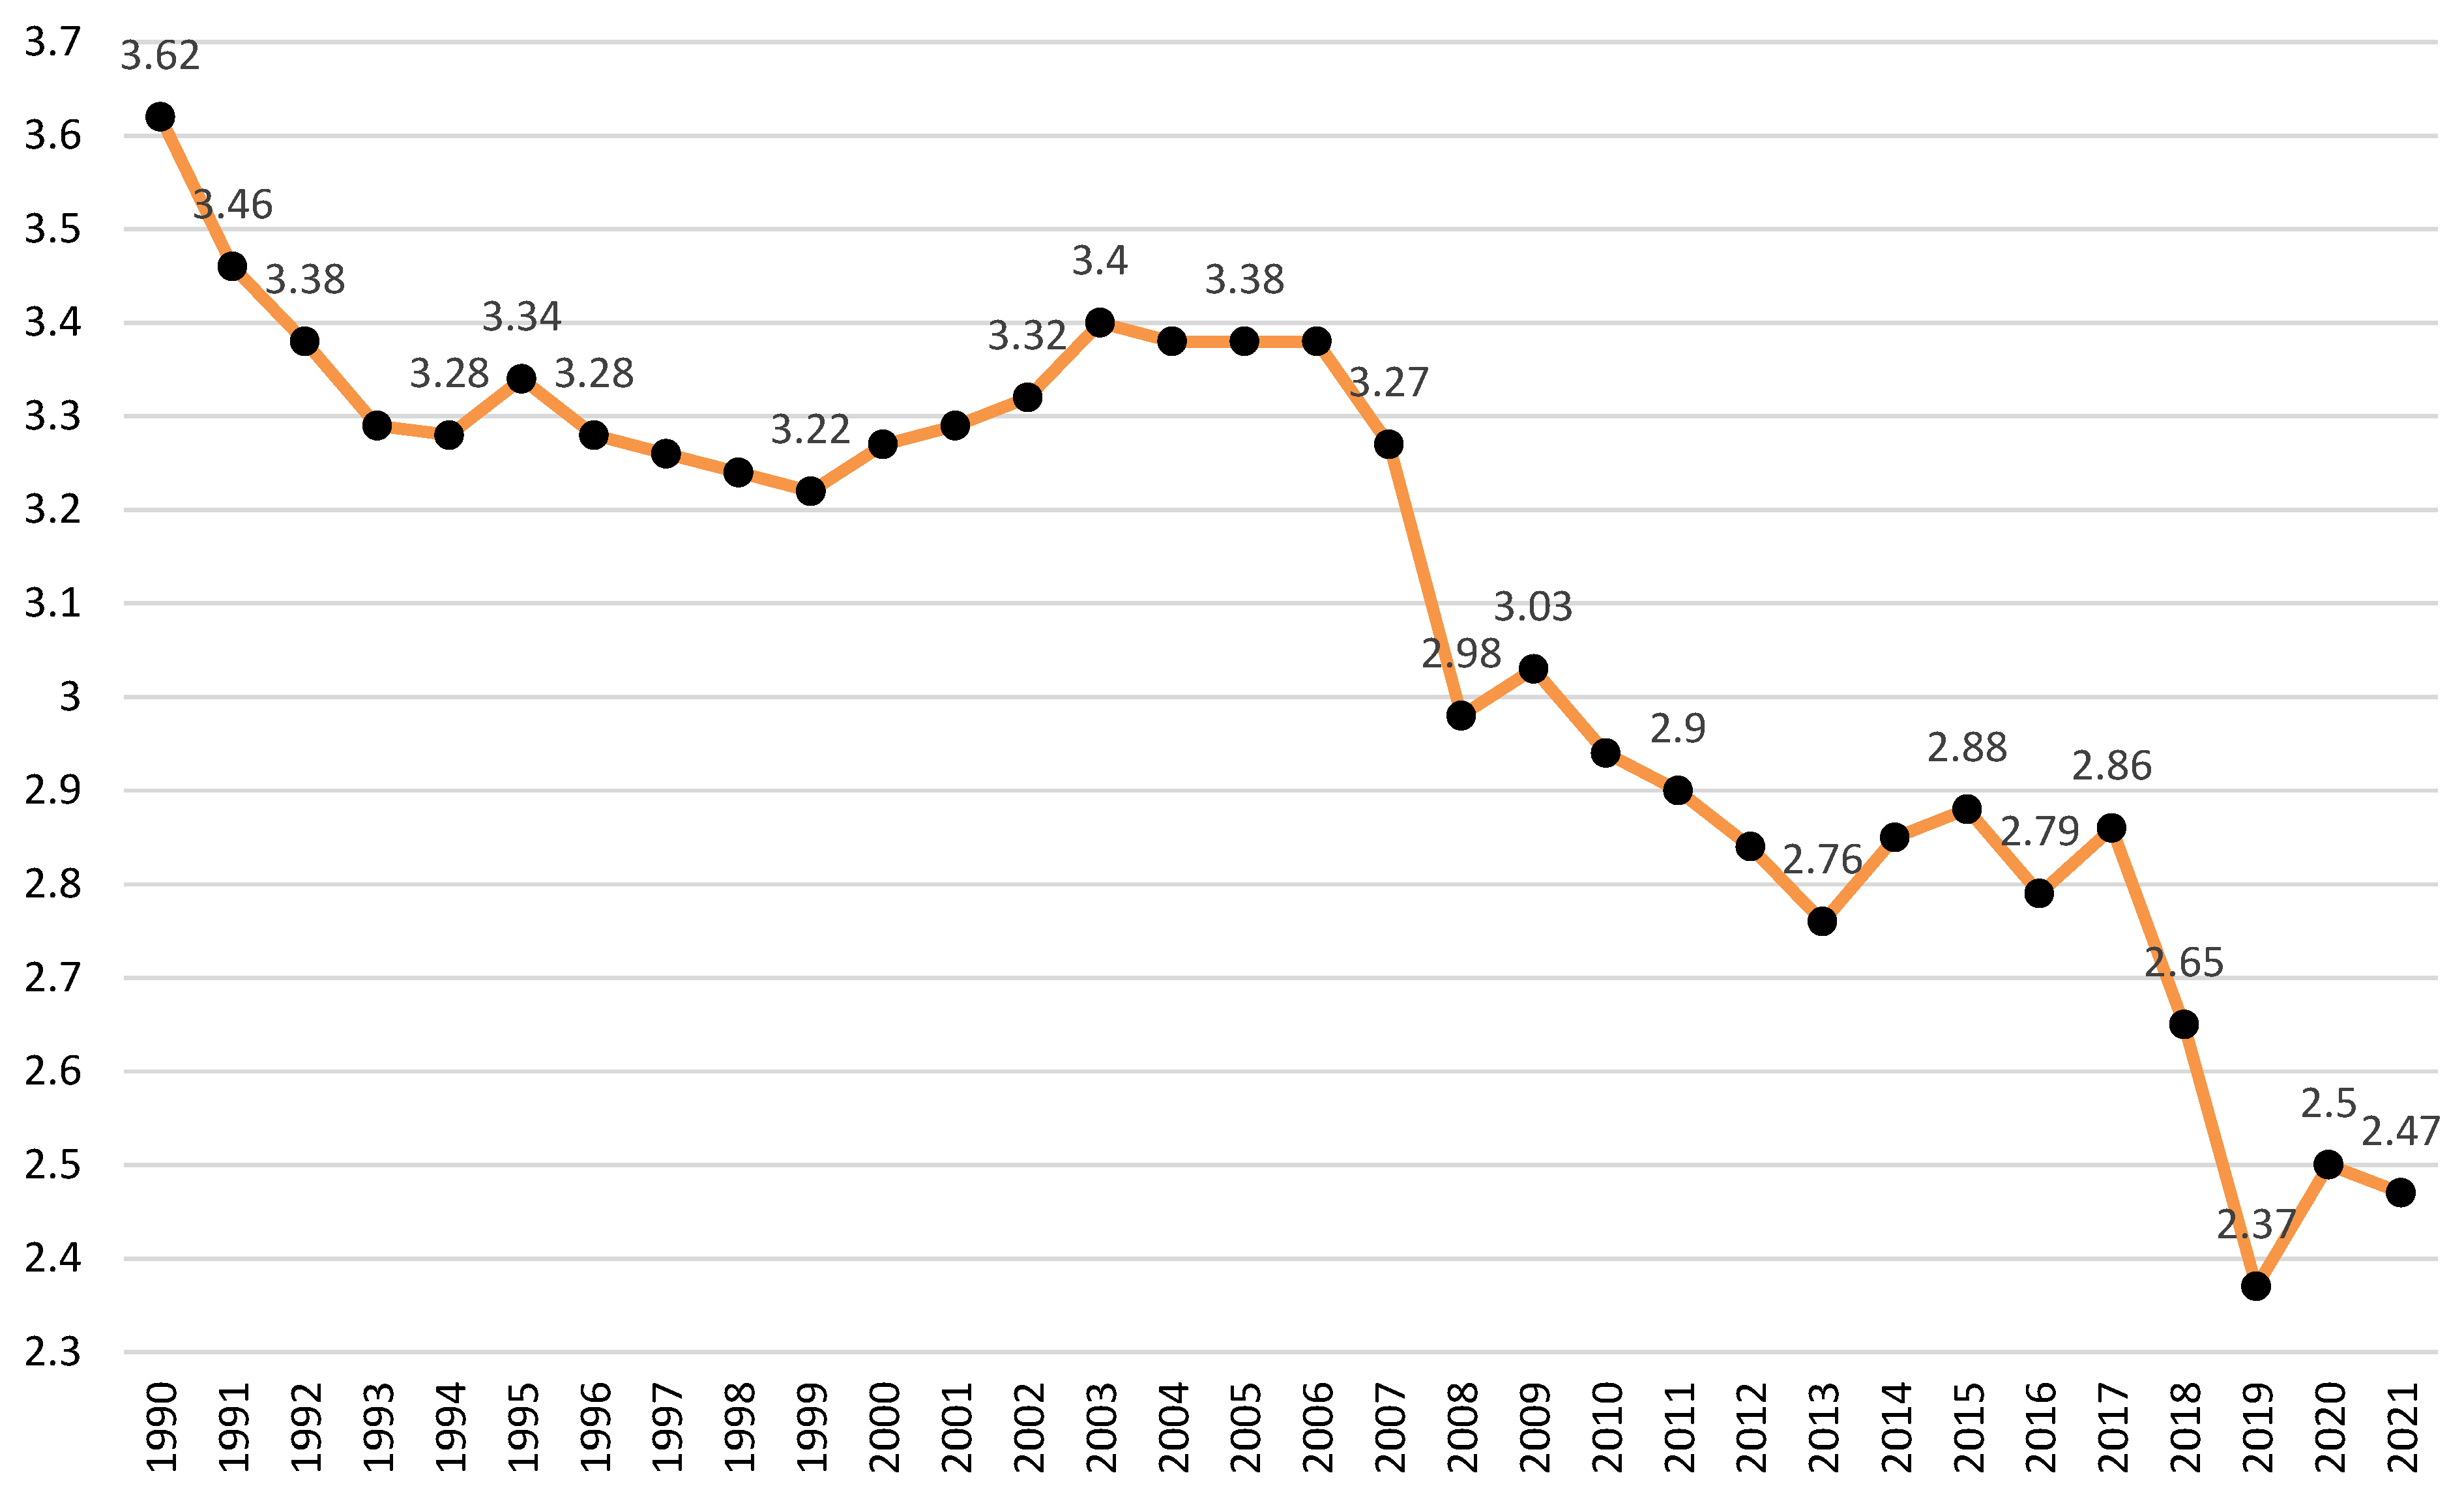
Figure 1 illustrates the trend of total CO
2 emissions in EU-27 countries (in billion tonnes) from 1990 to 2022. In certain years, significant declines in emissions are observed, indicating key moments of substantial environmental changes, economic crises, or other impactful events.
According to the observed trend, several periods of sharp emission decline and corresponding year-over-year changes have been identified as follows:
The most significant drop in emissions occurred in 2009, primarily due to the global financial crisis. During this period, key industrial sectors reduced their production, resulting in lower emissions and a decline in consumer demand. Energy-intensive industries such as manufacturing and construction were particularly affected. The overall reduction may also have been influenced by existing EU climate policies, such as the Emissions Trading System (EU ETS).
The second-largest decline occurred in 2020, coinciding with the COVID-19 pandemic, which resulted in widespread lockdowns, reduced transportation, and lower industrial emissions.
The early 1990s were marked by economic transitions in Eastern Europe following the collapse of the Soviet Union, which resulted in reduced industrial output in many European Union countries.
A marked decline in 2019, before the pandemic, may indicate the increasing impact of EU climate policies, such as the transition towards renewable energy sources and enhancements in energy efficiency.
The decline in emissions in 2008, just before the financial crisis, may be attributed to market uncertainty that hampered industrial activity.
In 2009, EU-27 countries significantly reduced emissions by approximately 292.8 million tonnes compared to the previous year. This coincided with a 4.35% decline in GDP, reflecting the impact of the global financial crisis (European Commission).
In 2020, emissions in the EU-27 decreased by approximately 277.2 million tonnes, coinciding with a 5.6% contraction in GDP. This period marks the onset of the COVID-19 pandemic, which caused widespread economic disruptions.
Eurostat data indicates a correlation between economic downturns and emission reductions in the EU-27. During recessionary periods, such as the 2009 financial crisis and the 2020 pandemic, reduced industrial activity and lower energy consumption likely contributed to significant decreases in greenhouse gas emissions. This highlights the interconnection between economic activity and environmental impact, demonstrating how economic slowdowns can lead to temporary reductions in emissions.
4.2. Sectoral Emissions in Industry: Trends and Reduction Rates
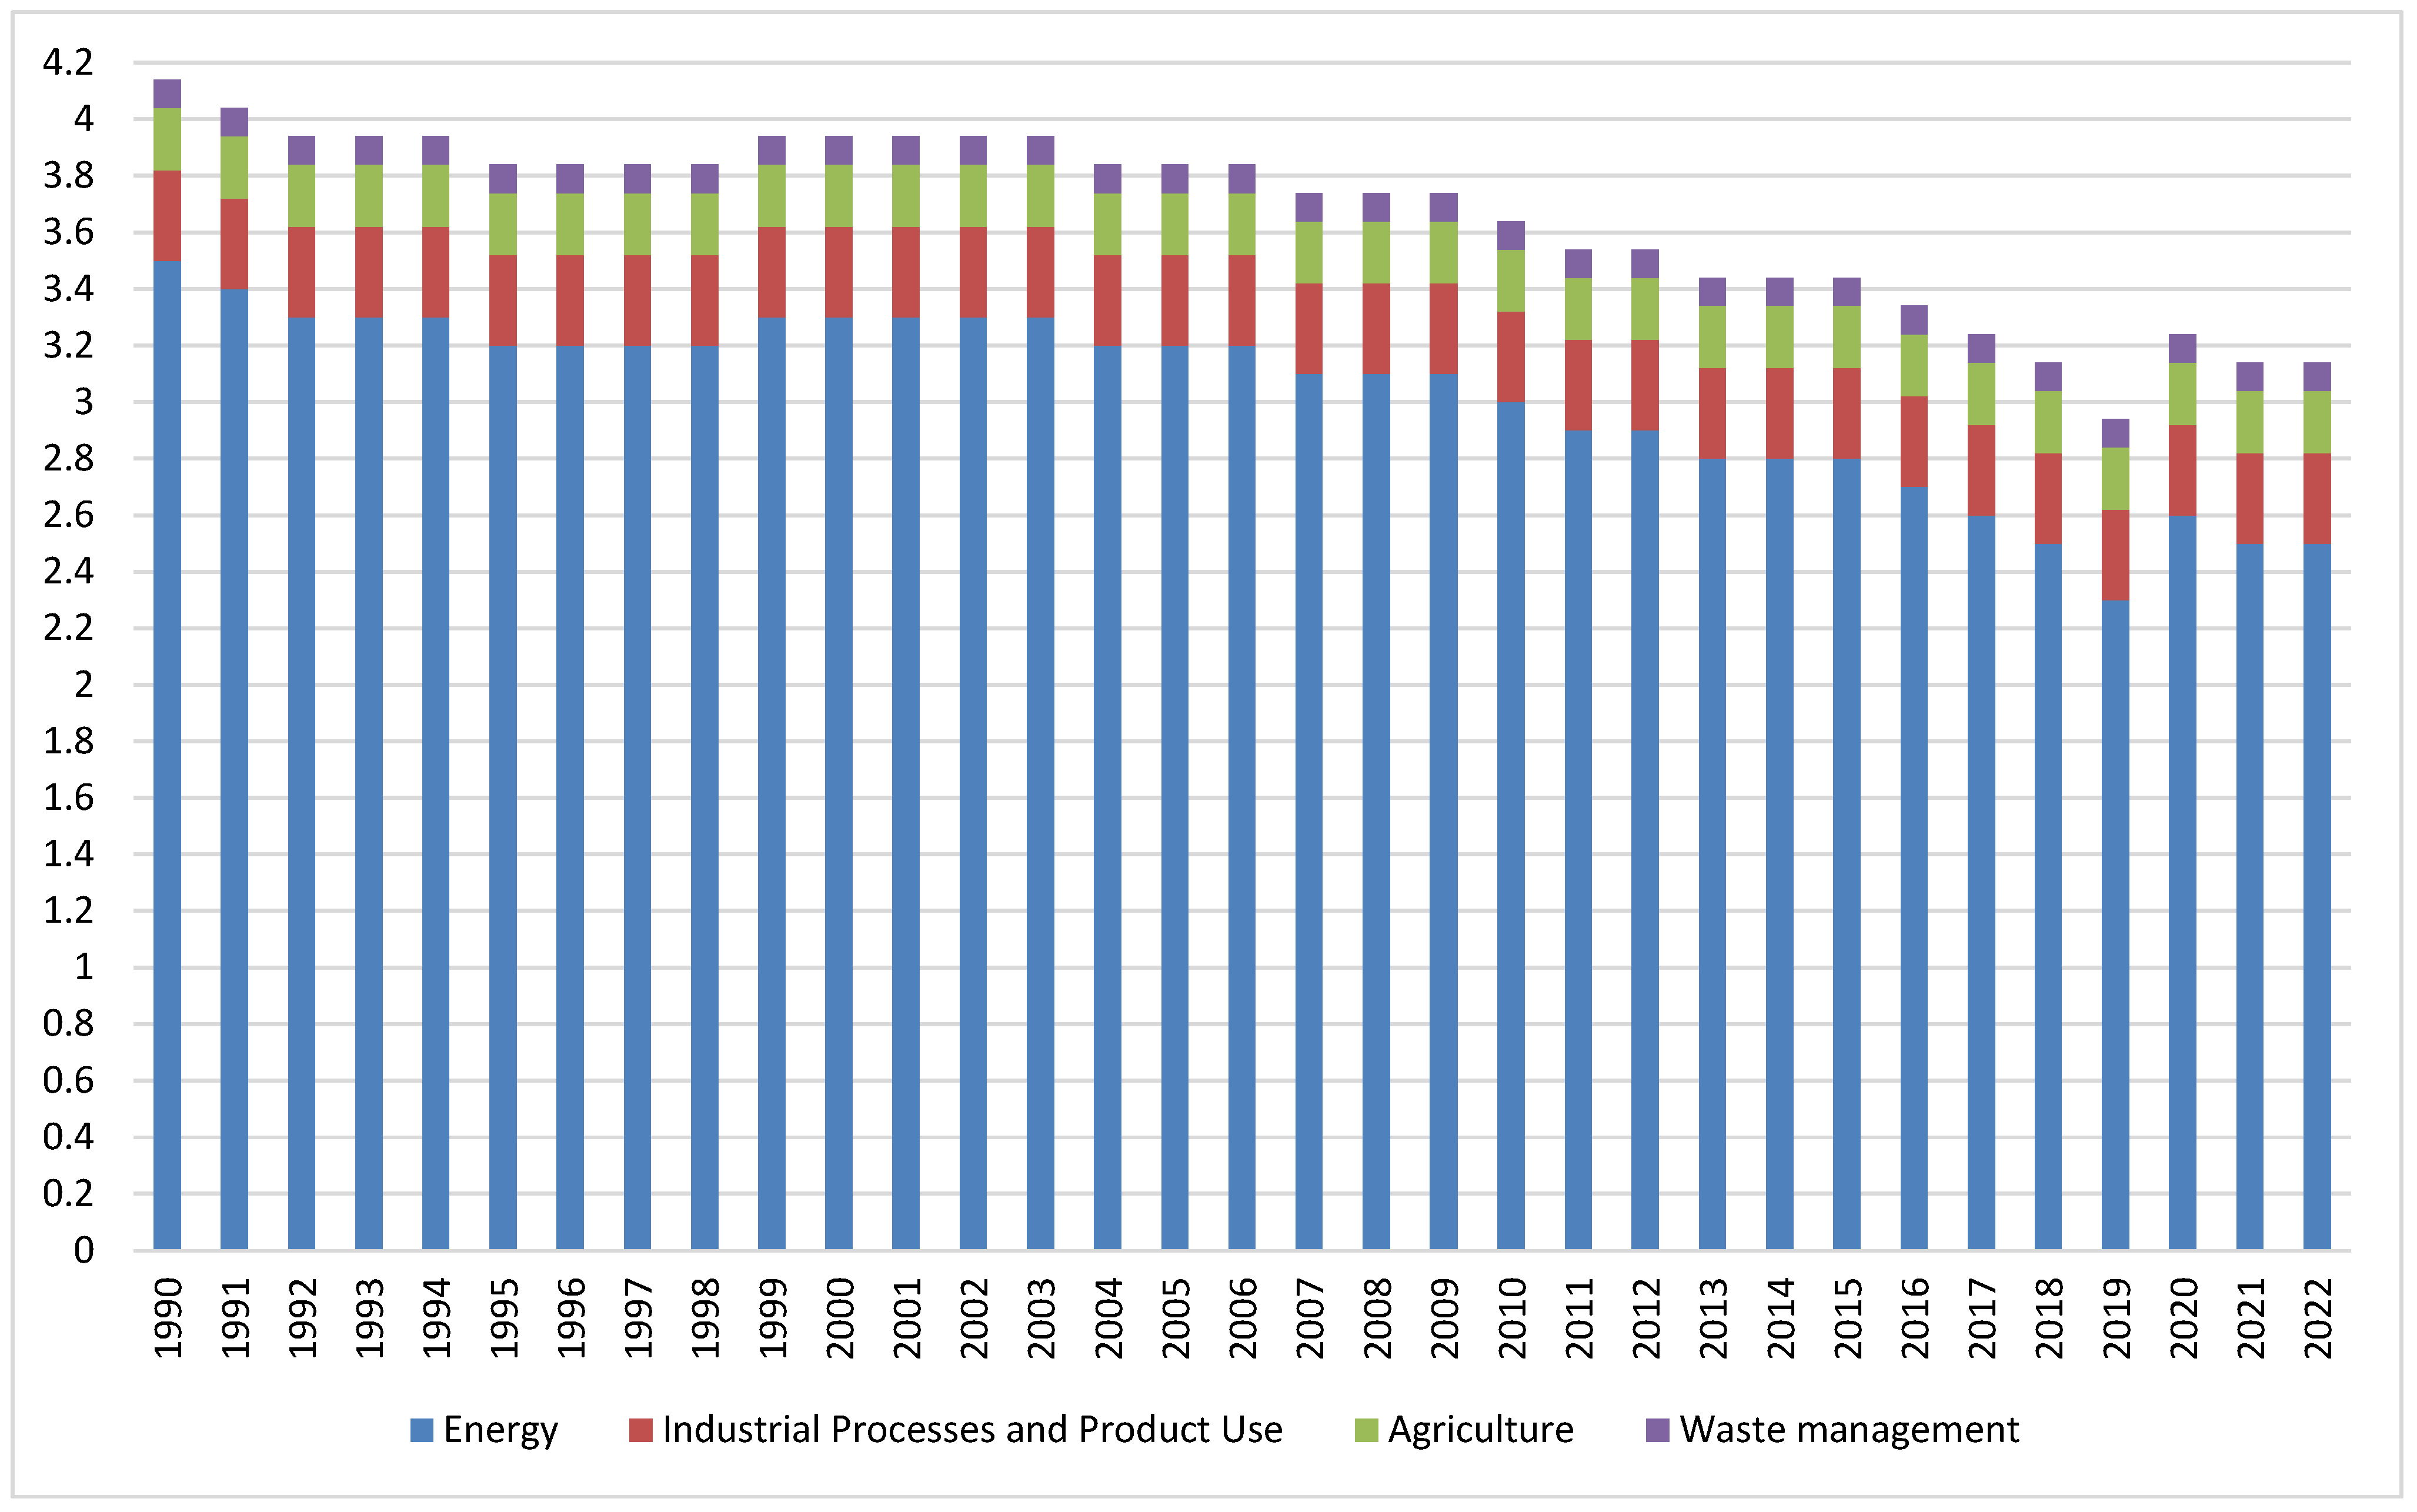
Figure 2 illustrates total CO
2-equivalent emissions (in billion tonnes) by sector for the EU-27 countries from 1990 to 2022. The figure emphasises the significant contribution of the energy sector to total emissions in comparison to other industries such as industrial processes, agriculture, and waste management. It also indicates the overall downward trend in emissions throughout the analysed period.
Figure 2 shows that the energy sector in EU-27 countries consistently accounts for the largest share of emissions, underscoring its pivotal role in driving economic activity and energy consumption. Despite its dominant position, emissions from this sector have been steadily declining, indicating a shift towards cleaner energy sources or improvements in energy efficiency.
The sectors related to industrial processes and product use, agriculture, and waste management contribute less to total emissions, yet their contributions remain relatively stable over time. In contrast to the more dynamic decline noted in the energy sector, these areas display more consistent and steady emission trends.
The overall emission trend across all sectors indicates a significant reduction, aligning with EU climate objectives, such as the 2020 climate and energy package and subsequent decarbonisation strategies. The gradual decrease in emissions, particularly in the energy sector, highlights the effectiveness of EU climate policy, including the Emissions Trading System (EU ETS), which incentivises the reduction of high-emission activities.
These observations underscore the need to develop targeted strategies that sustain progress while addressing the distinct challenges of each sector.
Emission trends across industrial sectors in the EU-27 reveal diverse trajectories and rates of reduction. The energy sector remains the largest source of emissions, reflecting its fundamental role in driving economic activity. Simultaneously, it exhibits the most notable and consistent decline in emissions over time, propelled by advancements in renewable energy, improvements in energy efficiency, and policy interventions such as the EU Emissions Trading System (EU ETS).
In comparison, emissions from industrial processes and product use are decreasing more slowly, albeit steadily, suggesting ongoing but less intense efforts to adopt cleaner technologies and processes.
The agricultural sector shows slight fluctuations, with emissions remaining relatively stable over time. This is likely due to the inherent challenges in decarbonising agrarian practices, including methane emissions from livestock and changes in land use. Although it accounts for a smaller share of total emissions, the waste management sector shows a moderate rate of reduction, reflecting progress in waste processing technologies and the implementation of recycling and circular economy principles.
The varying rates of emission reduction across sectors underscore the need for tailored strategies, including rapid technological advancements and renewable energy deployment in the energy and industrial sectors, as well as innovative practices in agriculture and waste management. Together, these sectoral efforts contribute to the EU’s overall emission reduction goals, while also illustrating the complexity of achieving uniform progress across different industries.
The energy sector leads in emission reductions over time, with a total decrease of approximately 1,023,733,909 tonnes of CO2. This significant decline reflects the impact of renewable energy deployment, improvements in energy efficiency, and stringent climate policies specifically targeting the energy sector. It also ranks highest in reduction rate, with an average annual decrease of about 31,991,685 tonnes of CO2, highlighting its pivotal role in accelerating decarbonisation efforts compared to other sectors.
4.3. Comparative Analysis of CO2 Emissions by Sector in European Countries
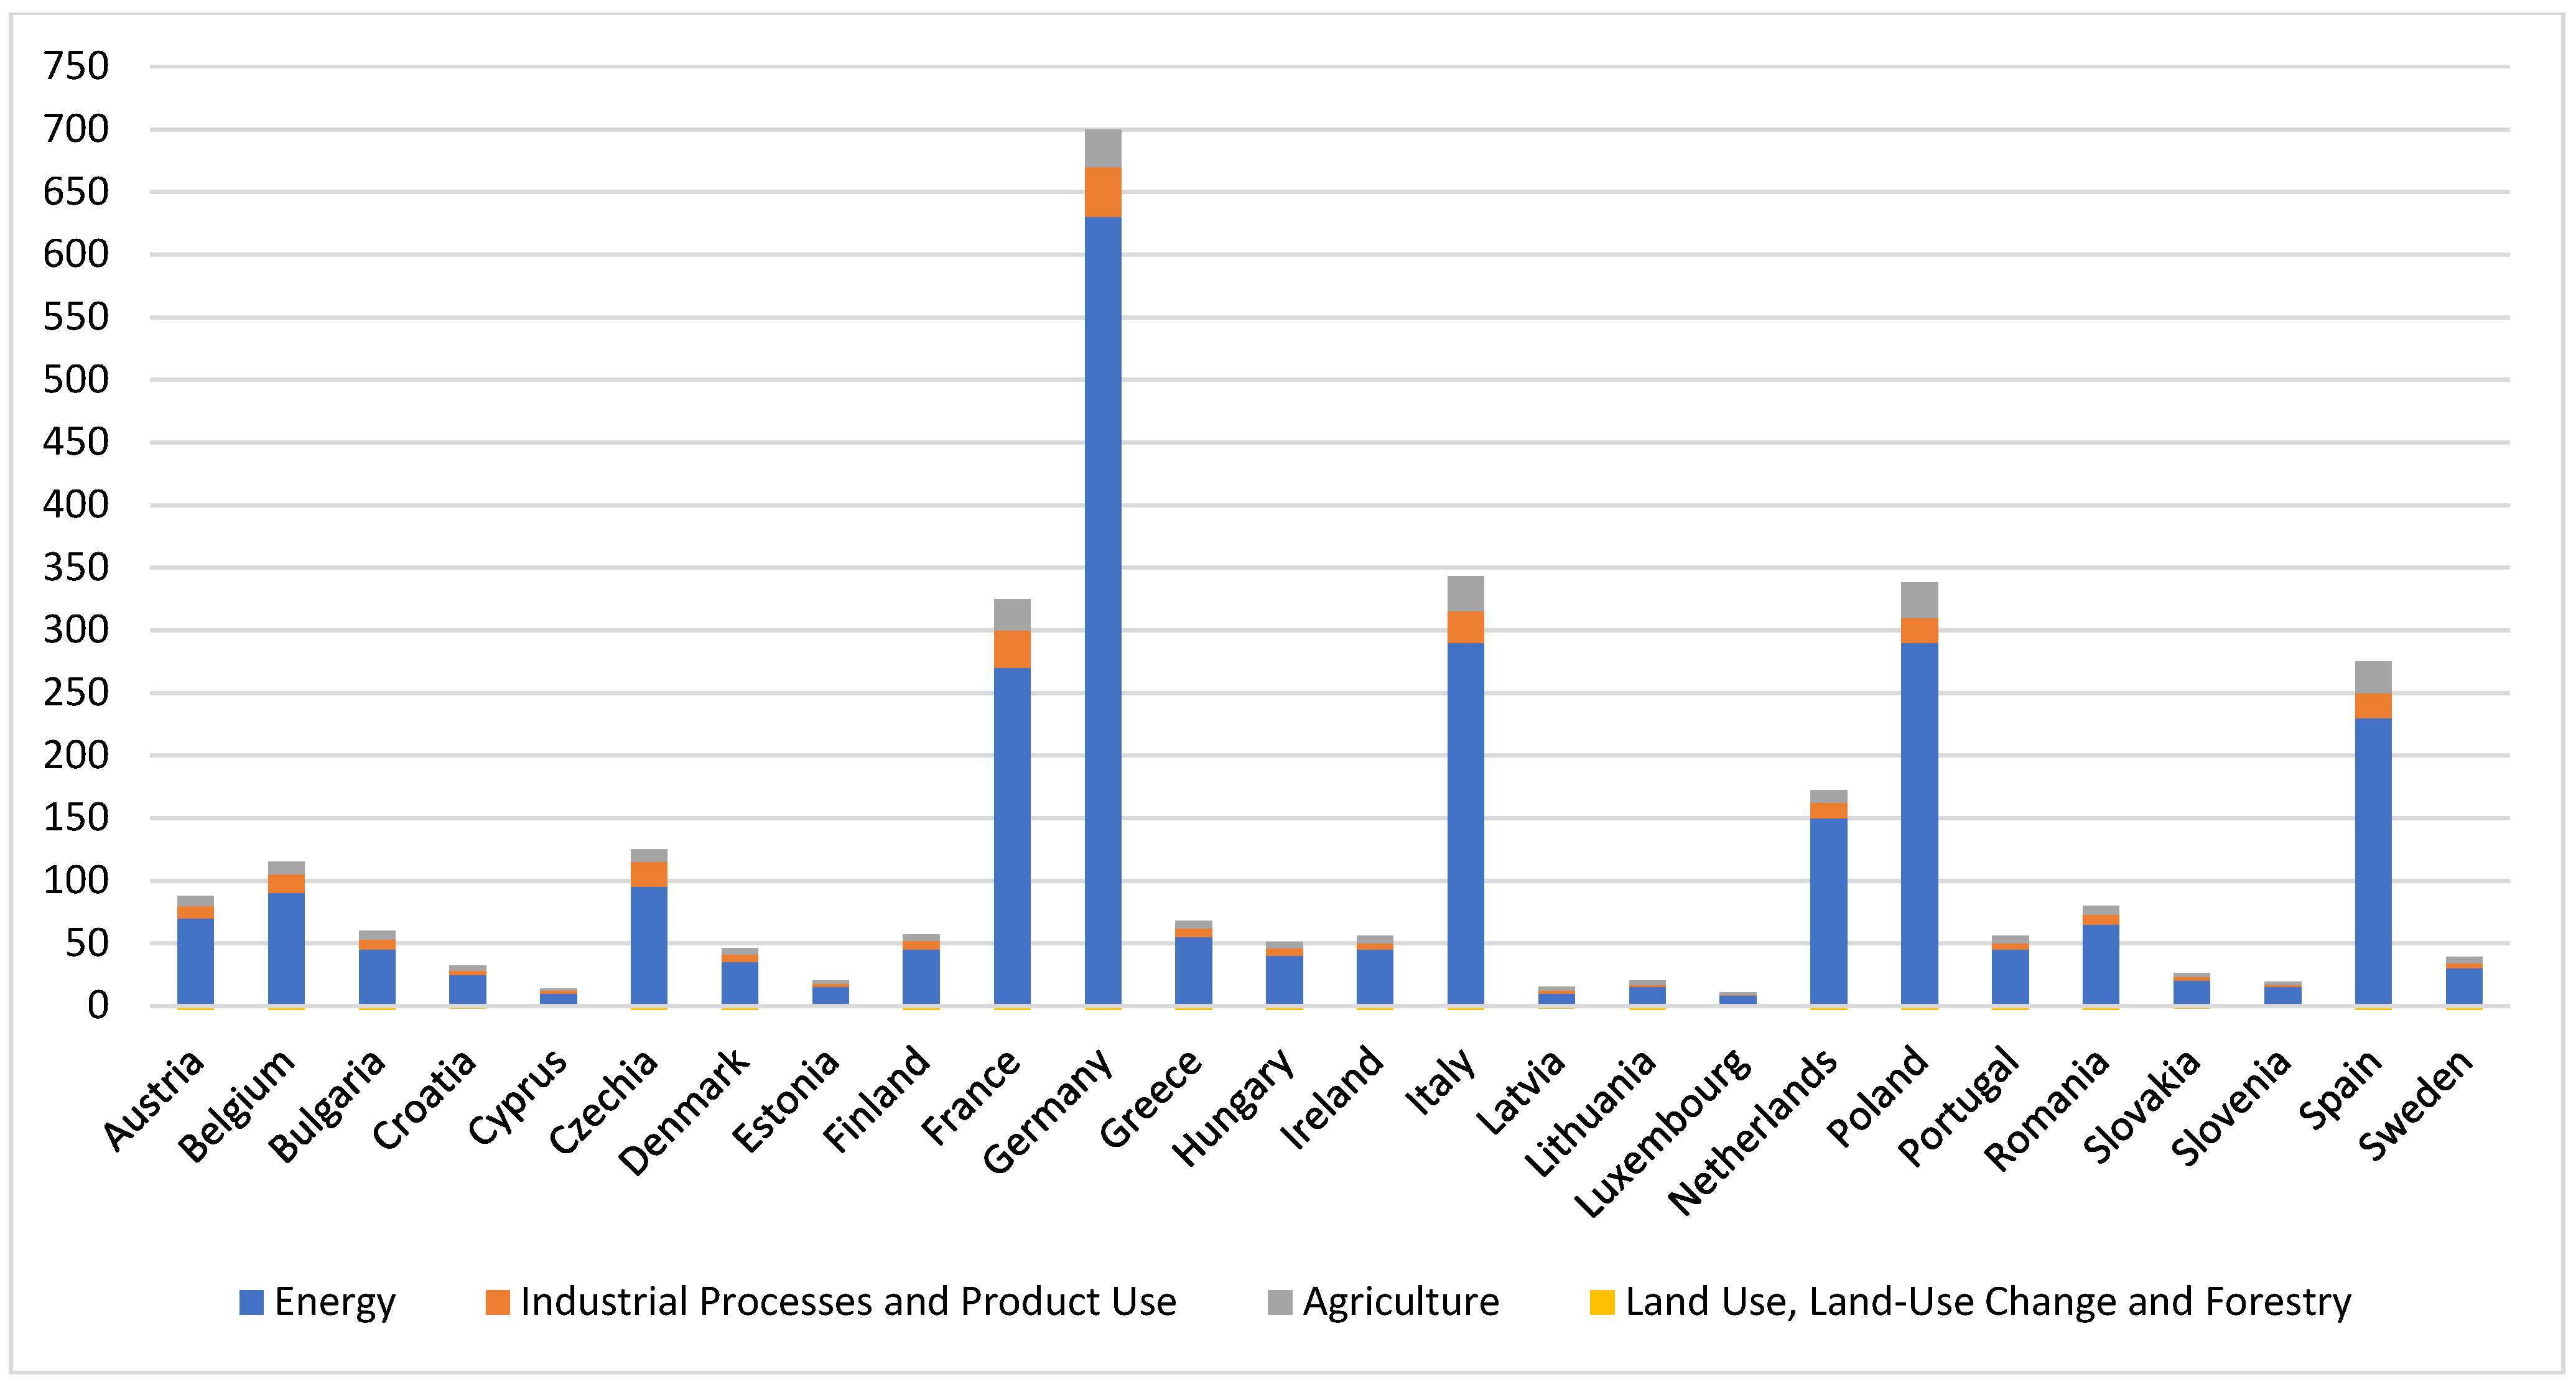
This section presents a comparison of CO2 emissions across four key sectors: energy; industrial processes and product use; agriculture; and land use, land-use change, and forestry (LULUCF) in selected European countries. The analysis reveals differences in sectoral contributions to total emissions, identifying specific trends for each country and their resulting policy implications for sustainable development.
Figure 3 illustrates that greenhouse gas (GHG) emissions vary significantly across different sectors of the economy, reflecting diverse national energy profiles, industrial bases, and land-use patterns. Breaking down emissions by sector provides a clearer understanding of the primary sources of emissions and the varying roles of individual countries in contributing to and mitigating climate change.
The energy sector remains the dominant source of emissions, with Germany standing out as the largest emitter at 627.98 million tonnes, significantly surpassing other European countries. This is primarily due to its reliance on coal-based energy production and the high energy intensity of its industrial sector [
33,
34,
35].
France (270.46 million tonnes) and Italy (324.61 million tonnes) also report considerable emissions, reflecting their energy-intensive economies. In contrast, smaller countries such as Malta (1.77 million tonnes) and Luxembourg (6.78 million tonnes) exhibit significantly lower emissions, primarily due to limited domestic energy production and a reliance on energy imports [
21,
22,
36].
Germany and France also lead in terms of industrial emissions, with amounts of 40.95 million tonnes and 27.76 million tonnes, respectively. This reflects the scale of their manufacturing sectors, particularly in steel, cement, and chemical production, all of which are associated with high CO
2 emissions [
22,
37]. In contrast, Malta records negligible industrial emissions of 5.68 thousand tonnes, indicating a limited industrial base and minimal presence of heavy industry.
Special attention must be given to the cement industry, which is both energy-intensive and highly emissions-intensive, contributing significantly to global and European CO2 emissions. These emissions result from both fossil fuel combustion and the decarbonisation of limestone-based raw materials during clinker production. Within the framework of sustainable development, this sector is attracting increasing interest, particularly with the implementation of low-emission technologies such as alternative cement formulations, concrete recycling, the use of fly ash, and carbon capture and storage (CCS). Embracing such solutions poses a significant challenge for environmental engineering while also creating opportunities for innovation and value generation in line with the circular economy model.
Agricultural emissions account for a significant portion of national carbon footprints. France (1.92 million tonnes) and Germany (2.54 million tonnes) lead in this category, mainly due to their substantial livestock populations and intensive agricultural practices [
22,
38].
In contrast, smaller countries like Cyprus (0.27 thousand tonnes) and Luxembourg (0.01 thousand tonnes) report minimal agricultural emissions, which reflect their lower levels of agricultural production and limited livestock farming. This sector is particularly significant due to the emissions of methane (CH
4) and nitrous oxide (N
2O), which are greenhouse gases with high global warming potential [
39].
The LULUCF sector (Land Use, Land-Use Change, and Forestry) plays a dual role in emissions inventories; land-use changes can both generate emissions and contribute to carbon sequestration. Most European countries report negative LULUCF values, indicating that they are net sinks of CO
2. Romania (−46.62 million tonnes) and Spain (−47.87 million tonnes) demonstrate particularly high carbon sequestration potential, mainly due to extensive forest areas and policies promoting afforestation [
40].
Conversely, the Netherlands reports positive LULUCF values (4.38 million tonnes), indicating that land-use changes are resulting in net emissions, likely owing to urbanisation, deforestation, or the conversion of agricultural land [
41].
4.4. Implications and Climate Policy Aspects
The conducted sectoral analysis highlights the necessity of implementing targeted climate policies tailored to national emission profiles. High-emission energy sectors, particularly in Germany, France, and Italy, require accelerated transitions towards renewable energy sources and the adoption of effective energy efficiency measures.
Industrial emissions in manufacturing-based economies necessitate the deployment of low-emission technologies, including carbon capture and storage (CCS), as well as enhancements in technological process efficiency. In agriculture, significant reductions in methane and nitrous oxide emissions can be achieved through proper livestock management and the application of sustainable farming practices.
Increasing the carbon sequestration potential in the LULUCF sector—through afforestation, soil carbon management, and sustainable land-use planning—remains essential for meeting Europe’s climate neutrality goals.
By integrating emission reduction actions adapted to the specific characteristics of each sector, European climate strategies can more effectively align with international climate commitments, including the Paris Agreement and the objectives of the European Green Deal, providing a comprehensive and practical approach to emission reduction.
4.5. Bayesian Network Analysis in the Context of CO2 Emissions and the Sustainable Development Goals (SDGs)
This section presents the results of the Bayesian network analysis, focusing on the impact of CO
2 emissions on achieving the Sustainable Development Goals (SDGs) and on evaluating the model’s effectiveness in capturing these relationships. The analysis reveals both direct and indirect effects, as well as structural dependencies between high-emission sectors (energy, industry, agriculture, and land use) and progress towards achieving the Sustainable Development Goals (SDGs) [
5,
6,
7,
8,
9,
14,
42].
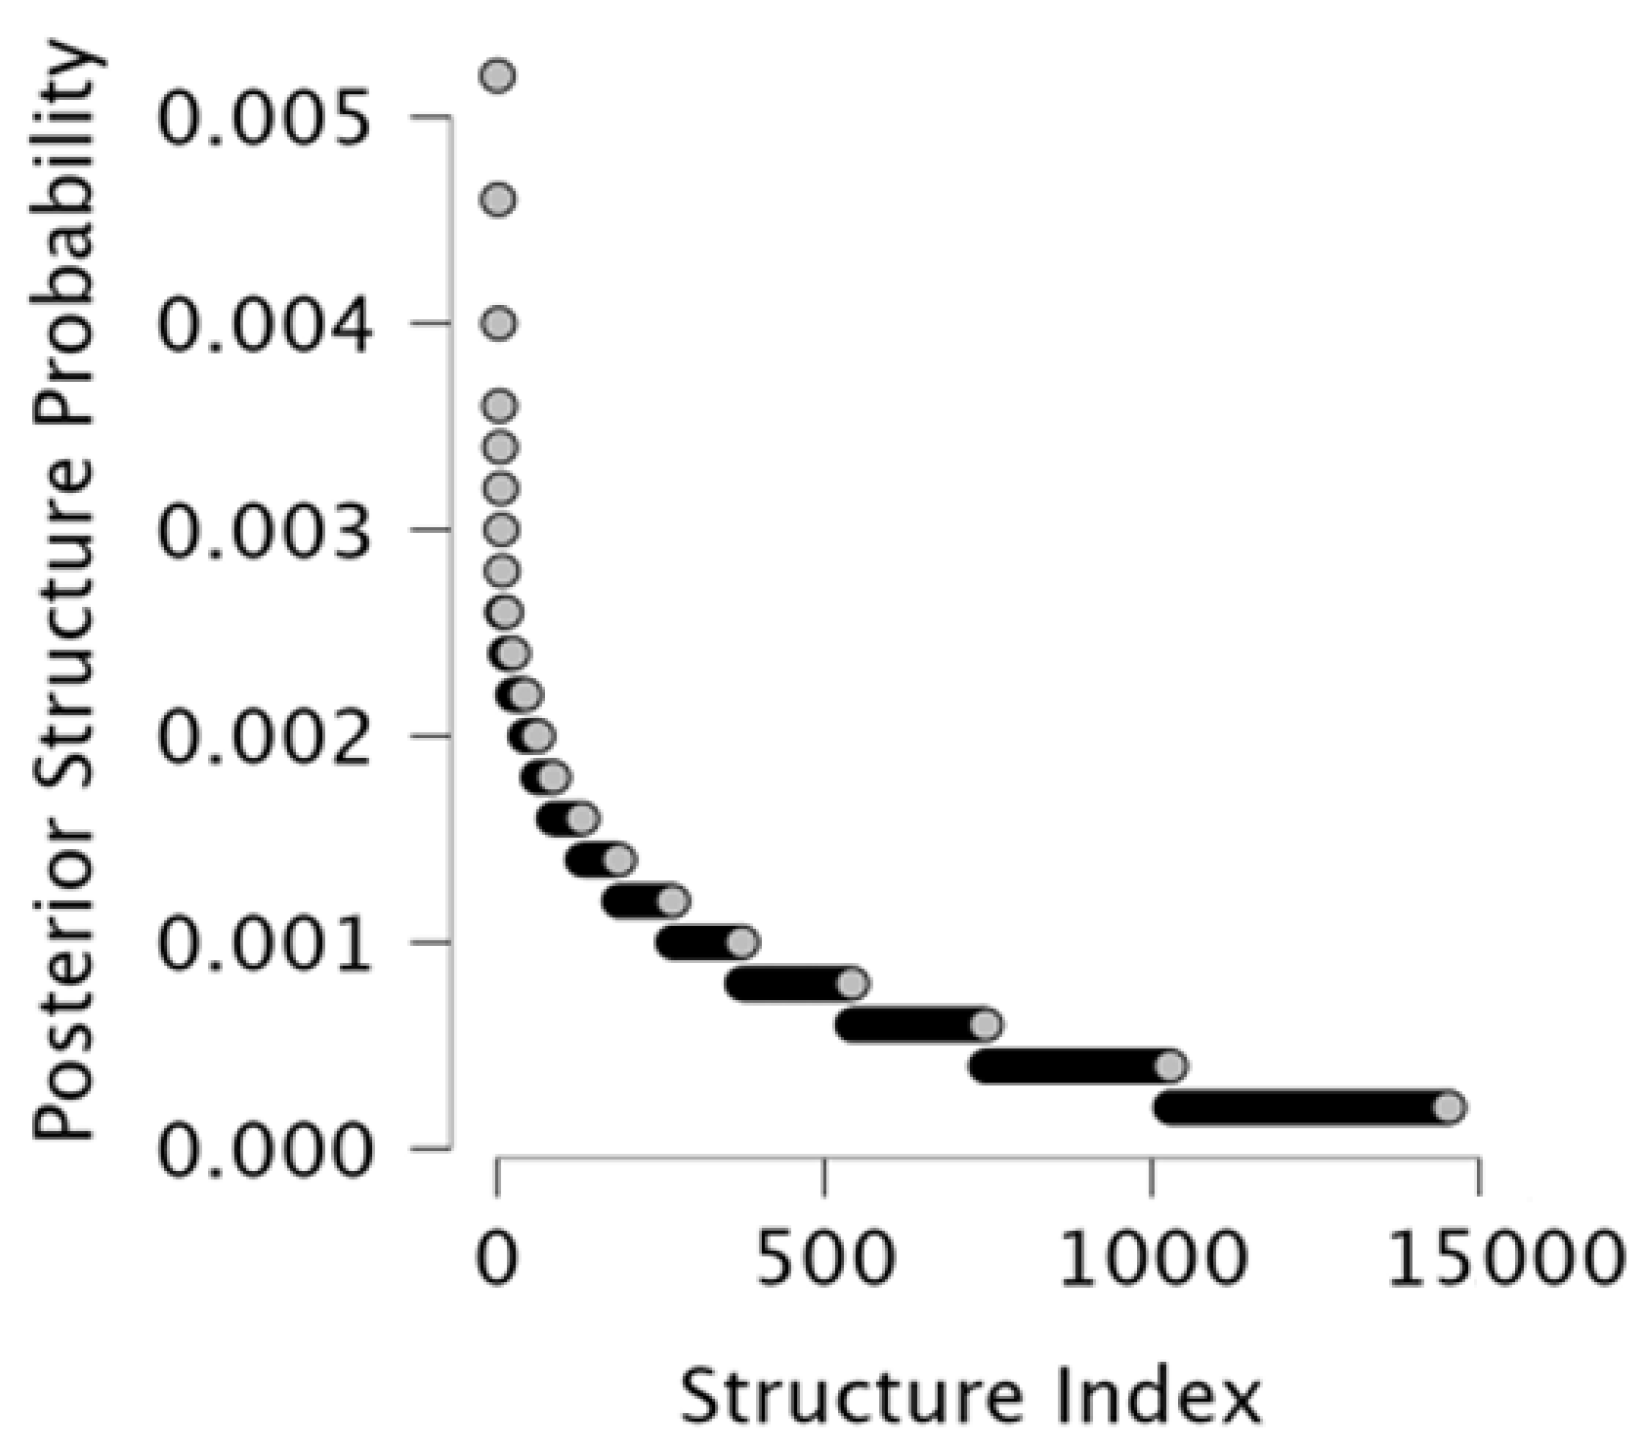
The constructed Bayesian network consists of 21 nodes and 39 non-zero edges out of 210 possible, resulting in a sparsity level of 0.814. This balance between connectivity and sparsity indicates that the model effectively captures significant dependencies while avoiding overfitting. The posterior probability distribution of the network structures (
Figure 4) shows that no single structure overwhelmingly dominates; however, the highest-scoring models display similar patterns, reinforcing the reliability of the results.
Table 1 summarises the conditional associations between sectoral CO
2 emissions and SDG indicators, as identified by the Bayesian network model. Only edges that met the inclusion criterion (BF
10 > 10) and were present in at least 80% of bootstrap samples are reported. Strong and stable dependencies are observed between the Energy and Industrial Processes sectors (0.749), as well as between Agriculture and SDG 8 (0.523), and between SDG 13 and SDG 12 (0.521), reflecting both sectoral co-dependencies and key development linkages.
Table 1 highlights several statistically significant conditional dependencies between sectoral CO
2 emissions and SDG performance. The strongest association is evident between the energy and industrial processes sectors (r = 0.749), reflecting their interlinked emission dynamics. While energy emissions do not directly relate to SDG indicators, they indirectly influence sustainability outcomes through industrial and clean energy pathways.
The industrial sector displays a negative association with SDG 8 (−0.121), indicating a potential trade-off between emissions and economic progress. Its modest positive connection to SDG 9 (0.085) reflects alignment with innovation despite environmental pressures. Agriculture is positively associated with SDG 8 (0.523); however, the absence of a direct link to SDG 13 highlights gaps in the integration of climate policy.
The LULUCF sector demonstrates a negative correlation with SDG 13 (−0.450), indicating climate risk, while exhibiting a positive association with SDG 15 (0.161), suggesting biodiversity co-benefits under sustainable land use.
Several indirect pathways also emerge. Energy links to SDG 13 through SDG 7 (0.527 → 0.329), emphasising the mediating role of clean energy. Similarly, adverse effects from industry cascade from SDG 8 to SDG 12, while SDG 16 may be negatively affected by accelerated sustainability transitions (−0.240). These dependencies underscore the systemic nature of emission–development linkages across the EU policy space.
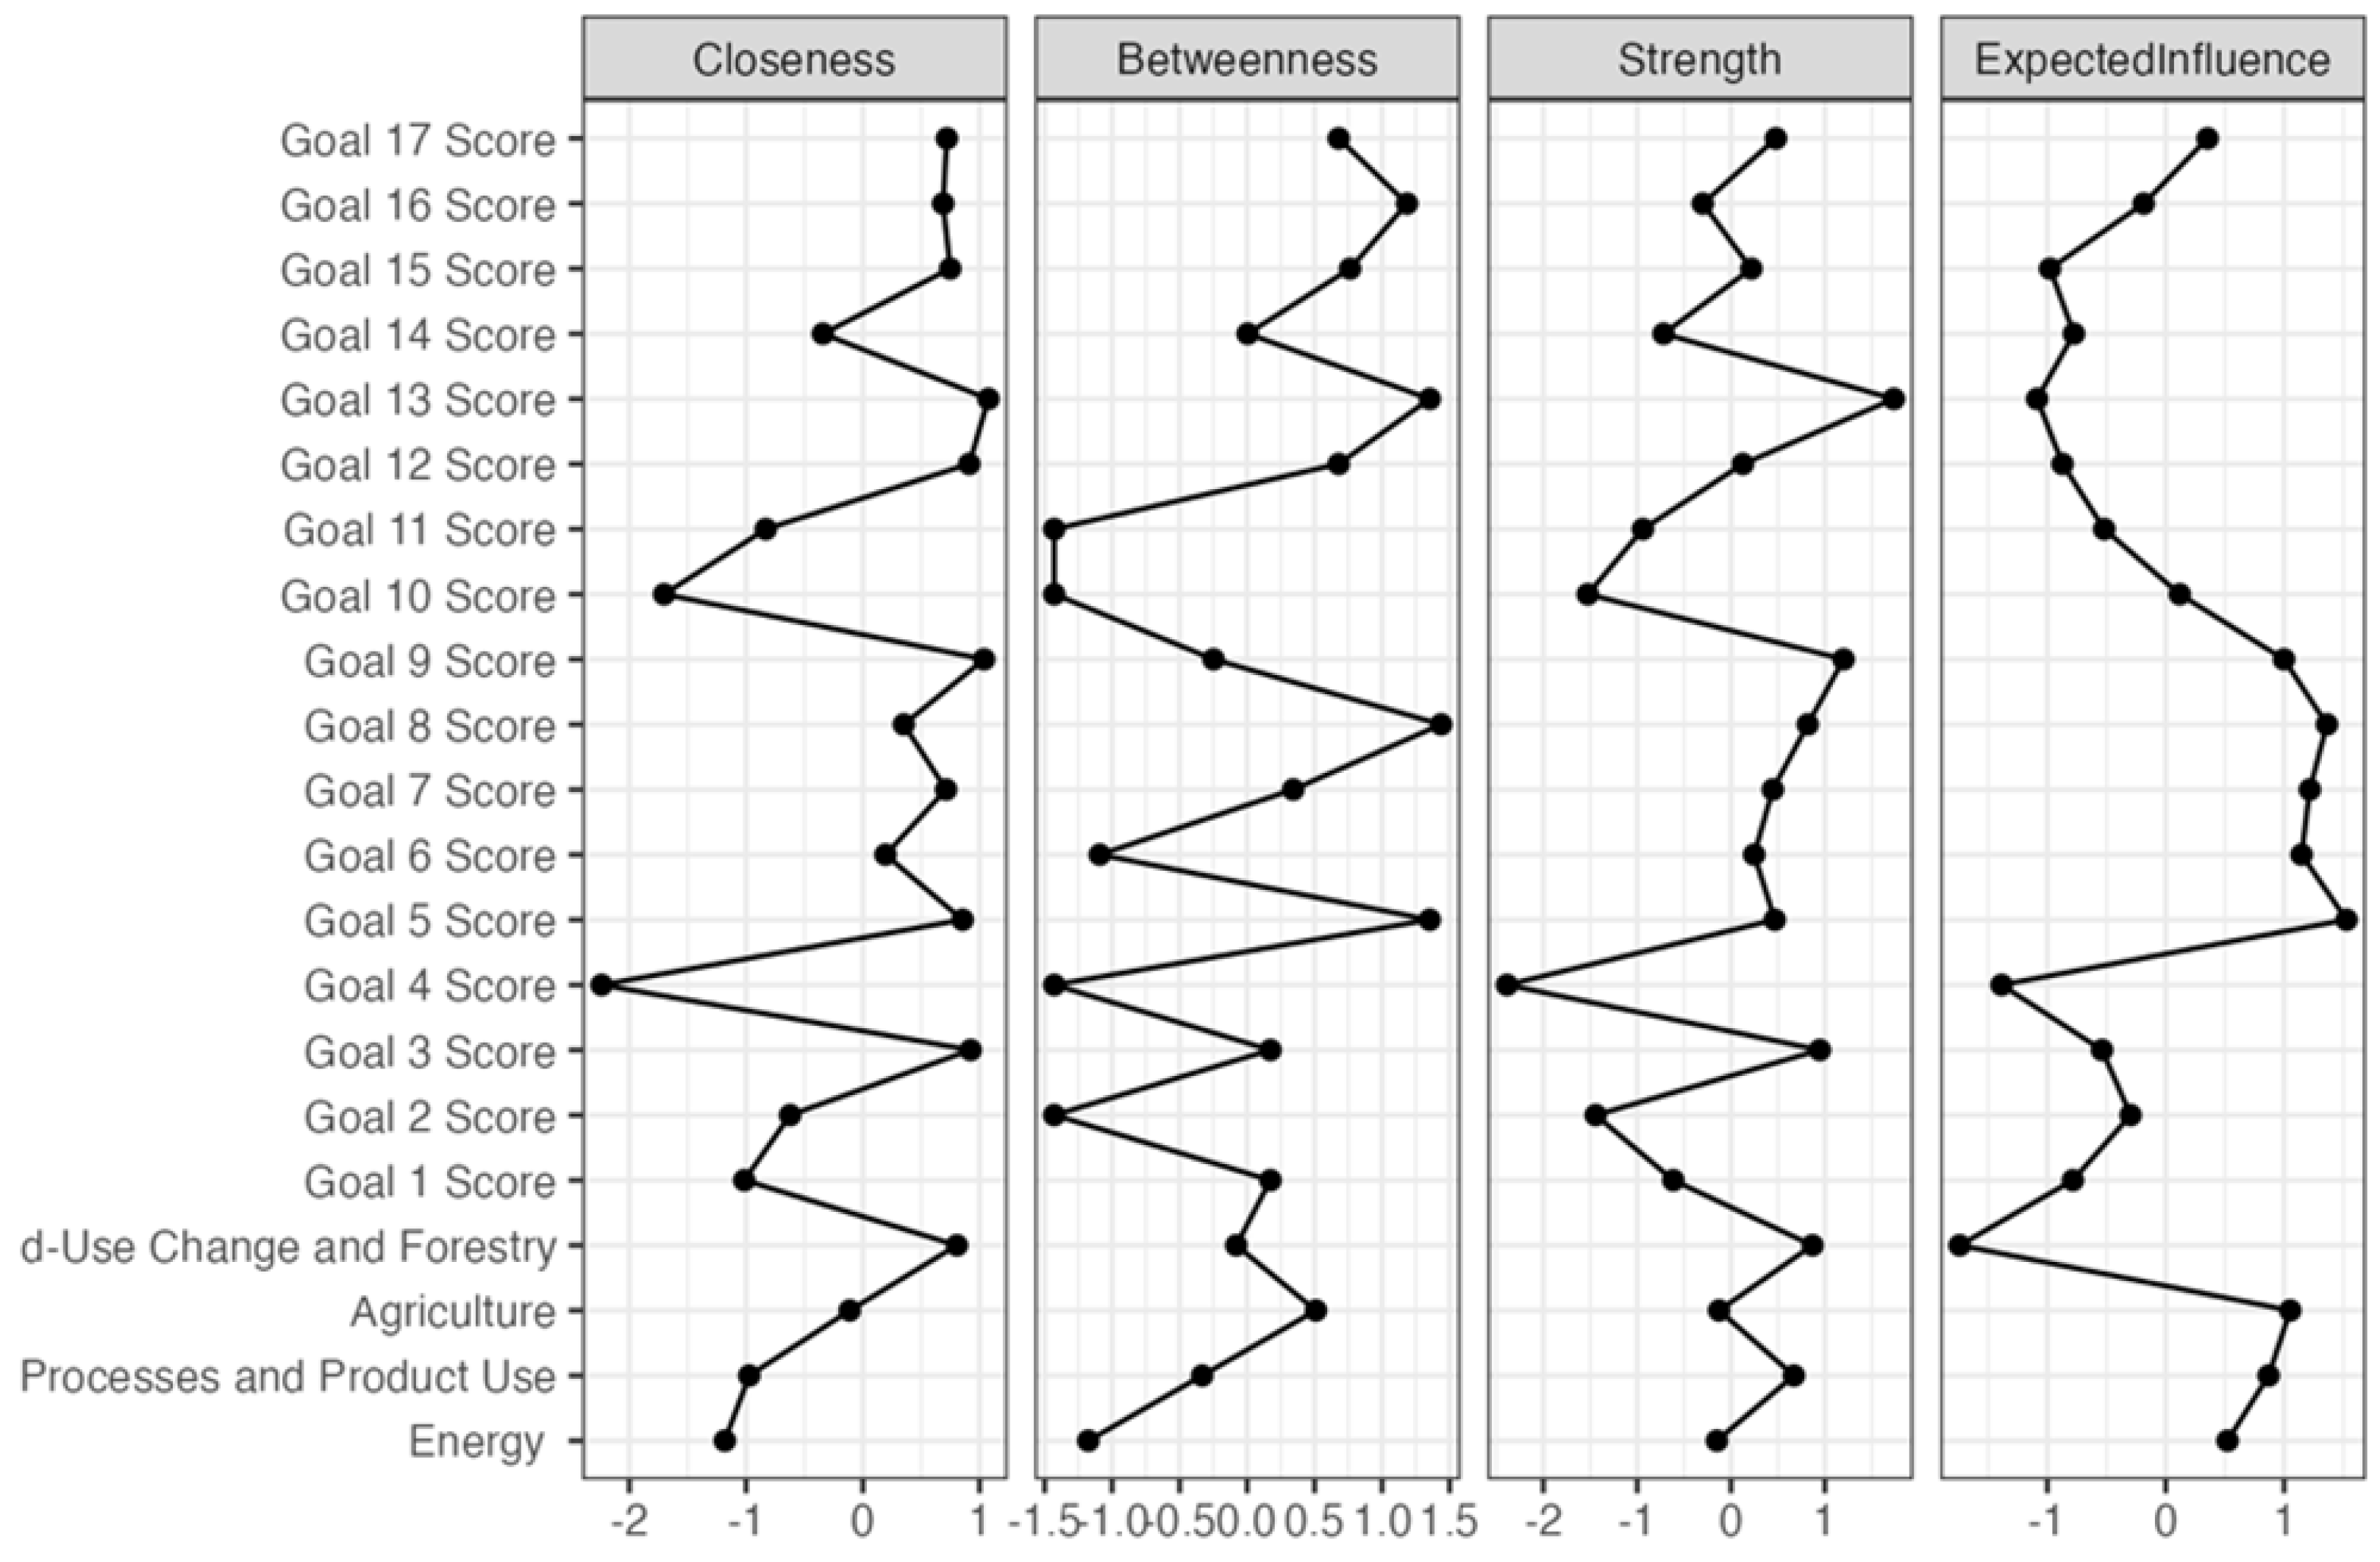
Centrality measures (
Figure 5) highlight the most influential nodes within the network as follows:
Goal 13 (Climate Action) exhibits the most significant impact strength (1.735), underscoring its essential role as a mediator of emission-related effects.
Industrial processes exhibit a high betweenness centrality (0.670), indicating that they serve as a bridge between emission sources and economic outcomes.
Goal 4 (Quality Education) exhibits the lowest centrality value (−2.388), indicating that educational policies are weakly linked to efforts aimed at reducing emissions.
The Bayesian network effectively captures key dependencies, as confirmed by the high-probability edges (
Table 2), which validates the statistical robustness of significant interactions between emissions and the Sustainable Development Goals (SDGs).
The analysis of the posterior structure reveals that several of the top-ranked models exhibit consistent structural patterns, particularly in the relationship between emission sectors and sustainable development outcomes. This convergence across high-scoring models reinforces the robustness and internal consistency of the network. Notably, Goal 13 (Climate Action) assumes a strong centrality, indicating its pivotal role in mediating the influence of sectoral emissions on the broader performance of the Sustainable Development Goals. The central position of climate-related targets highlights their integrative function across environmental, economic, and institutional domains. These findings suggest that accelerating progress on SDG 13 can generate positive ripple effects across multiple sustainability targets, underscoring the strategic importance of climate policy in achieving systemic transformation.
5. Discussion
5.1. From Structural Trends to Probabilistic Dependencies
The descriptive analysis (
Section 4) revealed long-term trends in emission reductions and sectoral disparities across the EU-27, with the energy sector playing a dominant role. In contrast, emissions from agriculture and industrial processes remained relatively stable. These structural patterns underlie the Bayesian network model developed in this study, which models conditional interdependencies among sectoral emissions and Sustainable Development Goal (SDG) indicators.
The results confirm earlier empirical insights while extending them through a systems-based lens. For instance, the absence of a direct connection between energy emissions and SDG 13 is offset by strong mediated pathways via SDG 7 (Affordable and Clean Energy). This structure aligns with prior findings on the indirect yet pivotal role of energy system transitions in climate outcomes [
22,
37,
43]. Crucially, the model includes only those links retained in at least 80% of 500 bootstrap replications and with a Bayes Factor exceeding 10, ensuring high confidence in the inferred dependencies. This robustness enables cautious yet meaningful policy interpretation [
44,
45,
46,
47].
5.2. Interpreting Edge Weights as Policy Leverage
While Bayesian networks in their standard form do not permit deterministic scenario testing (e.g., “10% emission reduction leads to x% SDG gain”), they do allow for policy-relevant probabilistic inferences. Edge weights—quantifying conditional dependencies—act as proxies for the expected directional influence between nodes. For example:
The Energy → Industrial Processes edge (0.749) confirms the interdependence of sectors. Policies aimed at reducing energy-related emissions are likely to propagate through industrial decarbonisation.
The strong connection between Agriculture and SDG 8 (0.523) implies that agricultural activity robustly supports economic growth. However, the absence of a direct link between Agriculture and SDG 13 indicates limited standalone climate leverage unless land-use or LULUCF policies are aligned.
The SDG 7 to SDG 13 edge (0.329) suggests that investments in clean energy access may produce broader climate co-benefits than reforms in sectors that lack direct climate connectivity (e.g., Agriculture).
These probabilistic relationships can inform soft scenario planning. For example, an increased policy emphasis on clean energy (raising SDG 7 scores) is likely to lead to more effective improvements in SDG 13 outcomes than direct interventions in sectors without a strong causal pathway to climate action [
48,
49].
5.3. Sectoral Trade-Offs and Structural Co-Benefits
The network also highlights policy trade-offs and potential co-benefits. Industrial processes exhibit a negative influence on SDG 8 (−0.121), indicating a tension between emission-intensive growth and inclusive economic development. However, a positive impact on SDG 9 (0.085) suggests potential gains through innovation and infrastructure upgrades.
Similarly, the LULUCF → SDG 13 relationship (−0.450) highlights the emission cost of land-use change, while the positive connection to SDG 15 (0.161) indicates the biodiversity co-benefits of sustainable forestry. These conditional relationships reflect real-world policy dilemmas—how to prioritise land as both a carbon sink and a habitat—and emphasise the need for integrated planning [
50,
51].
5.4. Scope and Methodological Constraints
This study models relationships at the level of aggregated sectors—Energy, Industry (IPPU), Agriculture, and LULUCF—reflecting the underlying data structure. As the model is designed to identify systemic, macro-level dependencies, it does not operate at the resolution of specific subsectors (e.g., cement or steel production). Such sectoral disaggregation exceeds the data’s granularity and would conflict with the analysis’s intended scope, which aims to capture structural linkages relevant for high-level policy design.
Furthermore, the model does not allow for the quantification of deterministic scenarios, such as MtCO2/year reductions under marginal abatement cost (MAC) curves. Achieving this would necessitate the use of dynamic Bayesian decision networks or interventional causal models, which are beyond the scope of the current study. Instead, we depend on probabilistic inference and the relative strength of structural connections.
5.5. Contribution to Literature and Policy
This study contributes to the growing body of research on sustainability interlinkages by providing a novel, probabilistically grounded map of how emissions from macro-sectors influence multiple Sustainable Development Goals (SDGs) domains. The findings corroborate earlier work on the potential for directed technical change to reshape emissions pathways, while adding a layer of statistical rigour by identifying where leverage points manifest across the EU-27 system [
31,
46,
52].
Future work may extend this model by incorporating counterfactual simulations, integrating time dynamics, or applying Bayesian decision frameworks to assess scenario-specific policy costs and benefits.
6. Conclusions
This study employed a Bayesian network model to examine the conditional dependencies between aggregated sectoral CO2 emissions and Sustainable Development Goal (SDG) performance across EU-27 countries, using the most recent data available for 2024. The sectors considered—energy, industrial processes, agriculture, and land use—were selected for their relevance to EU climate targets and emission structures.
The results indicate that emissions from the energy sector are not directly associated with SDG outcomes, but influence progress indirectly via clean energy pathways. In particular, the link from energy emissions to SDG 7 (Clean Energy), and subsequently to SDG 13 (Climate Action), suggests that renewable energy development plays a central mediating role in translating emission reductions into sustainable development gains.
Emissions from the industrial sector are negatively related to SDG 8 (Economic Growth), and positively to SDG 9 (Innovation and Infrastructure), reflecting a nuanced balance between economic trade-offs and innovation potential. Agriculture exhibits a positive relationship with SDG 8, but its indirect contribution to climate pressure is evident through its connection to land-use dynamics. LULUCF emissions display a negative relationship with SDG 13, supporting the interpretation that land-based carbon sources remain a critical constraint in climate mitigation.
The analysis further identifies interlinkages between SDG 12 (Responsible Consumption) and SDG 16 (Institutions), where a negative association may indicate implementation challenges or institutional friction in advancing sustainability reforms.
These findings underline the importance of policy coordination across sectors. While sectoral emission reductions are necessary, their effectiveness depends on how they align with broader systemic structures and development pathways. SDGs that act as mediators—such as clean energy and responsible consumption—emerge as potential leverage points in the EU’s transition strategy.
Further research could extend the model to dynamic settings or explore scenario testing to evaluate how targeted sectoral interventions, such as incremental annual emission reductions, may influence long-term progress across multiple Sustainable Development Goals (SDGs).


 ,
, 


