Abstract
Vehicle-to-Grid (V2G) technology enables electric vehicles (EVs (Unless otherwise specified, Electric Vehicles (EVs) in this study refer to the totality of BEVs, PHEVs, and other battery-equipped vehicles that have the potential to participate in V2G)) to interact with renewable energy sources, positioning it as a key driver of energy system decentralization. While V2G holds significant potential for enhancing grid stability and economic efficiency, its large-scale deployment requires a robust economic assessment. However, existing research predominantly focuses on technical feasibility, lacking comprehensive economic evaluations due to the complexity of V2G system architectures. To bridge this gap, we propose the BSTP (Business-Stakeholders-Technology-Policy) V2G economic evaluation framework and the VRR (Value Realization Rate) methodology, employing a Semi-Systematic Co-Design Approach. This framework systematically characterizes the evolution of V2G business models, the interactions among key stakeholders, the influence of technological and policy factors, and the criteria for economic feasibility assessment. Furthermore, we identify a “Big Models, No Trials” issue in V2G economic research, where large-scale theoretical models lack empirical validation. To address this challenge and ensure the practical applicability of our framework, we define six core challenges that must be resolved for a rigorous economic evaluation of V2G. Our findings provide a structured foundation for future research and policy development, offering insights that could accelerate the transition to decentralized energy systems.
1. Introduction
1.1. Motivation and Objectives
Technological advancements in the energy and transportation sectors are key to achieving sustainable social development [1]. Renewable energy and electric vehicles (EVs) are at the forefront of this progress. However, concerns are emerging about the instability of renewable energy sources [2] and the debated environmental benefits of EVs [3]. Vehicle-to-Grid (V2G) technology [4] offers a solution by enabling EVs to interact with the power grid through bidirectional charging. This technology allows EVs not only to draw electricity from the grid but also to return stored energy to the grid during periods of high demand or shortages [5]. As a result, EVs become mobile energy storage units, contributing to grid stability and load balancing. Crucially, V2G can be integrated with renewable energy sources, enhancing their stability and maximizing the environmental value of EVs [6].
The promotion and application of V2G will bring significant changes to the current energy system, with decentralization being its most notable feature [7]. Unlike traditional energy systems, where energy production and distribution are centralized, V2G systems place individual users at the center, with energy production and use happening on a personal level [8]. This characteristic means that V2G represents more than just a foundational shift; it redefines the roles of various stakeholders in the energy system, making individual users the most important actors [9]. A comprehensive evaluation of the economic value of V2G for different stakeholders will be a key challenge for its implementation and promotion [10,11]. Here, employing a Semi-Systematic Co-Design Approach, we propose a BSTP framework (Business models, Stakeholders, Technological Routes, as well as Policies and Regulations) to assess the economic value of V2G systems. This framework examines the evolution of business models, the interactions among stakeholders, and the impact mechanisms of technological roadmaps and policy regulations. By providing a structured approach, the BSTP framework enables a comprehensive assessment of the economic feasibility of V2G applications, thereby enhancing their contribution to sustainable development.
1.2. Why Economic Value Analysis of V2G Is Crucial
The landscape of V2G research demonstrates notable strengths in its conceptual coherence and robust technical focus (Appendix A offers a more in-depth analysis of overall V2G research trends) yet reveals significant gaps in addressing social dimensions. The foundational aspects of V2G, its system configurations, interface topologies, and market mechanisms have been well-established [12]. Furthermore, the environmental, technological, and economic benefits of V2G, alongside the recognized challenges such as battery degradation, high investment costs, user behavior uncertainties (e.g., anxiety and unpredictability), and societal impacts, have reached a consensus among researchers [8]. V2G research spans a wide range of disciplines, penetrating fields from engineering to sociology. While significant advancements have been made in technical areas, such as power electronics [13], energy management strategies [14], bidirectional charger topologies [15,16], and EV battery degradation [17], studies have consistently highlighted a research gap in the social aspects of V2G [18], including economic and business models, user behavior, and regulatory frameworks [19].
The economic value analysis of V2G is not just a research gap; key challenges associated with V2G implementation, as discussed above, are fundamentally tied to economic issues [8,18]. Battery degradation and investment costs are direct economic barriers, while user behavior uncertainties can largely be addressed through appropriate economic incentives [20,21]. Similarly, privacy and security concerns translate to increased maintenance costs. These observations underscore that the core challenges to V2G adoption and promotion are predominantly economic in nature.
While numerous studies have analyzed the economic value of V2G systems using simulations or hypothetical scenarios, they often rely on overly simplistic assumptions and lack a comprehensive framework to guide their analyses. Some comprehensive studies explore the roles of stakeholders and business models within V2G systems [9], yet they often fail to address the interconnections between stakeholders, business models, and their dynamic interactions. This disconnect highlights the need for an integrated analytical framework.
Building on these insights, this paper aims to propose a holistic framework for evaluating the economic value of V2G systems. Specifically, the framework addresses three key research questions:
- How can specific V2G business models be effectively developed and implemented to maximize economic benefits?
- What are the relationships among V2G stakeholders, and how do these relationships influence the economic outcomes?
- What are the key factors, and how do they influence the economic value for different stakeholders?
By addressing these questions, the proposed framework provides a structured and comprehensive approach to guiding future research and practical applications in the economic evaluation of V2G systems. More importantly, it enables decision-makers and investors to derive more actionable and insightful conclusions from the evaluation, rather than relying solely on the theoretical superiority of systems depicted through complex algorithms or technical details.
1.3. Structure
Following the Introduction in Section 1, Section 2 outlines our research methodology and provides an overview of the fundamental aspects of the core literature reviewed. Section 3 presents the primary outcome of this study—the BSTP framework—along with a detailed breakdown of its key components. Section 4 explores the application of the BSTP framework and highlights the gaps in existing studies on V2G economic linkages. Finally, Section 5 concludes the paper with a summary of key findings.
2. Methodology
This study adopts a Semi-Systematic approach to review academic literature to develop a framework for evaluating the economic value of V2G systems. Given that research on V2G economic analysis often integrates multidisciplinary technical assessments or is dispersed across various sociological studies, a fully systematic quantitative meta-analysis is not feasible. Therefore, we applied the Semi-Systematic approach, which offers the flexibility to identify key insights across disciplines while maintaining a balance between systematicity and breadth. This approach is particularly well-suited for V2G research, as the field remains emerging and highly complex.
Our methodology is informed by a range of studies [22,23,24,25] and incorporates a co-design methodology to iteratively construct, review, and refine the proposed framework. Our co-author team brings together diverse expertise across multiple disciplines, ensuring a comprehensive approach to our research. With expertise in energy economics, the team brings critical insights into market dynamics and policy implications. Combining backgrounds from both academia and industry, the team integrates strong technical knowledge in electrical engineering and communication security with practical experience in vehicle engineering and complex energy systems. This collaboration bridges theoretical research with real-world applications, enabling a well-rounded evaluation of the economic potential of Vehicle-to-Grid technology. A detailed description of the methodological process is provided in Figure 1 and the paper selection process was conducted using a machine-based filtering method, as detailed in Algorithm 1.
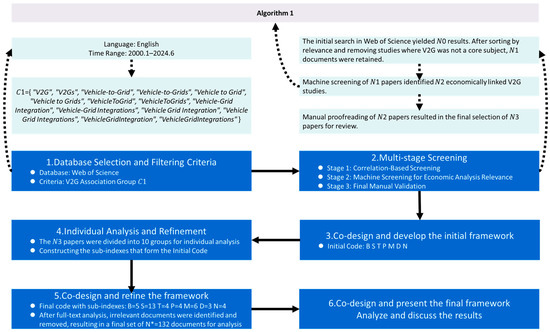
Figure 1.
Flowchart of the Semi-Systematic Approach with Co-Design Methodology. Note: For details on the code and related indexes, refer to Supplementary Data S1. Solid lines represent the main sequence, and dashed lines indicate the order of subprocesses within individual steps.
| Algorithm 1. Machine Filtering Algorithm for V2G Research Papers Based on Criteria: Economy Association Group C2 |
| Input: |
| A folder containing Excel files exported from Web of Science, with a total of N1 research papers, each containing multiple data fields including abstracts. |
| Output: |
| A new sheet in each Excel file listing titles and abstract of papers whose abstracts contain economic-related keywords, with a total of N2 filtered papers. |
| Step 1: Initialize Economic Keywords |
| Define the set C2 as follows: |
| {“economy”, “value”, “cost”, “benefit”, “price”, “profit”, “revenue”, “income”, “expense”, “investment”, “return”, “tariff”, “subsidy”, “funding”, “capital”, “expenditure”, “payback”, “depreciation”, “transaction”, “market”, “trade”, “finance”, “liquidity”, “budget”, “incentive”, “credit”, “tax”, “rate”, “interest”, “margin”, “dividend”, “yield”} |
| Step 2: Iterate Through Files in the Folder |
For each Excel file in the specified folder:
|
| Step 3: Identify Relevant Columns |
For each sheet:
|
| Step 4: Filter Papers Based on Keywords |
For each row in the sheet:
|
| Step 5: Save Filtered Titles |
If any titles are selected:
|
Step 6: Complete Processing
|
Fundamental Aspects of the Core Literature Reviewed
We have compiled the fundamental details of the N* core reviewed papers [26,27,28,29,30,31,32,33,34,35,36,37,38,39,40,41,42,43,44,45,46,47,48,49,50,51,52,53,54,55,56,57,58,59,60,61,62,63,64,65,66,67,68,69,70,71,72,73,74,75,76,77,78,79,80,81,82,83,84,85,86,87,88,89,90,91,92,93,94,95,96,97,98,99,100,101,102,103,104,105,106,107,108,109,110,111,112,113,114,115,116,117,118,119,120,121,122,123,124,125,126,127,128,129,130,131,132,133,134,135,136,137,138,139,140,141,142,143,144,145,146,147,148,149,150,151,152,153,154,155,156,157], along with the classification and coding process employed during the framework construction, into Supplementary Data S1. Fundamental details of the 132 core reviewed papers on V2G economic evaluation can be found in Figure 2. As shown in Figure 2a, the majority of the 132 reviewed papers were published from 2018 onward, with over 15 papers published annually since 2019. The citation distribution of these papers is illustrated in Figure 2b, where 75% of the papers have fewer than 50 citations, with a median of 21. While a small number of papers exceed 100 citations, most remain within a lower citation range.
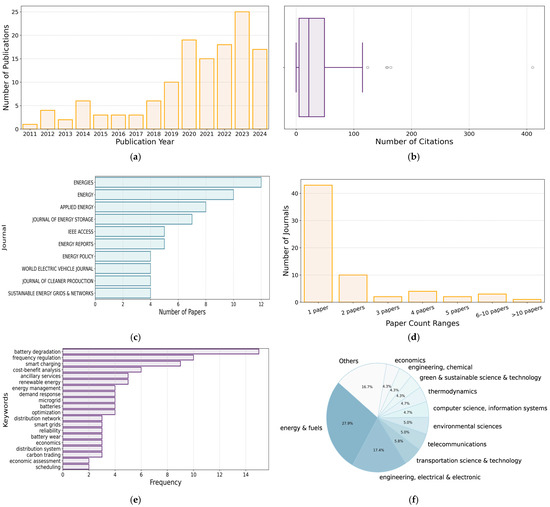
Figure 2.
Fundamental details of the N* core reviewed papers on V2G Economic Evaluation. (a) Distribution of publication years (b) Box plot of citation counts (c) Top 10 journals with the most published papers (d) Distribution of publications by volume (e) Top 20 author-defined keywords (excluding basic terms like V2G and EV) (f) Proportion of Web of Science (WOS) subject categories.
Figure 2c,d present the distribution of journals in which these papers were published. Energies, Energy, and Applied Energy are the most frequent publication venues, each featuring more than eight relevant papers, whereas over 40 journals contain only a single related publication.
Figure 2e highlights the most frequently used author-defined keywords, with “battery degradation”, “frequency regulation”, and “smart charging” appearing most often (each occurring more than eight times). Finally, Figure 2f illustrates the distribution of Web of Science (WOS) research categories, showing that most studies fall under “Energy & Fuels”, and “Engineering, Electrical & Electronic”. This suggests that existing economic value analyses of V2G remain predominantly within technical and engineering domains.
3. A BSTP Framework
To analyze the economic value of V2G systems, we propose the BSTP framework (Business model, Stakeholders, Technological Routes, as well as Policies and Regulations). As illustrated in Figure 3, the framework is a three-layer structure. At its core, the innermost layer represents the Business model, the central element of the economic framework. Surrounding it is the second layer, Stakeholders, which includes direct stakeholders (up-down) and indirect stakeholders (left-right) as participants in the business model. The outermost layer consists of Influencing Factors, divided into Policies and Regulations (red, left) and Technological Routes (blue, right), which directly shape stakeholder behavior and influence the business model’s formation. This framework effectively summarizes the key elements of V2G economic evaluation and clarifies their logical relationships. Next, we will systematically explain the meaning of these elements layer by layer.
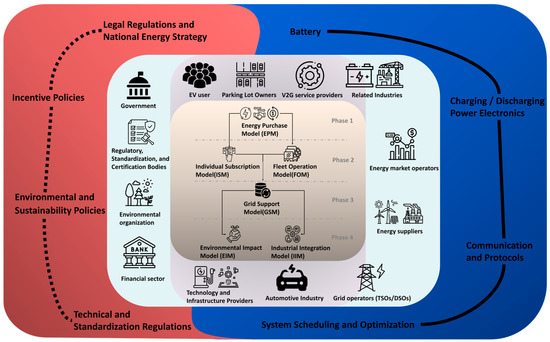
Figure 3.
BSTP framework outline (The conceptual design of this figure was inspired by insights drawn from 132 prior studies). Note: Solid lines represent the actual physical effects associated with technological route connections, while dashed lines indicate the flexible influence of policy and regulatory frameworks.
3.1. Business Model
To systematically characterize the business models that may emerge from V2G, we propose a four-phase evolutionary framework. To the best of our knowledge, this represents the first comprehensive generalization of V2G business models based on our focused research and analysis. The evolution across these phases is primarily driven by changes in societal EV ownership rates; however, due to space limitations, further descriptions and definitions of separated phases are provided in Appendix B. Next, we will describe each phase in detail.
3.1.1. Phase 1-Initial Deployment
In Phase 1, the societal EV ownership rate is less than 6%. During this phase, establishing the business model primarily relies on the promotion and awareness of the V2G concept, alongside the development of necessary infrastructure. The business model at this stage is largely driven by government initiatives.
As illustrated in Figure 4, the government, positioned at the top of the model, provides subsidies to the Core V2G Participants (CVPs). These CVPs include EV users (both individual and collective owners), parking lot owners (both individual and collective), and concurrent stakeholders. One group supplies energy, while the other provides charging and discharging equipment.
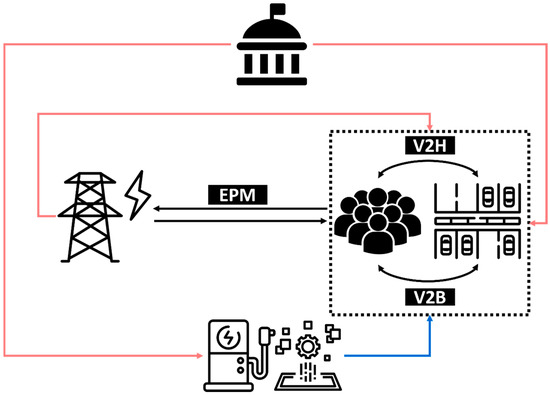
Figure 4.
Schematic of Phase 1-Initial Deployment (The meaning of the symbols can be found in Table 1; The conceptual design of this figure was inspired by insights drawn from 132 prior studies).
The Energy Purchase Model (EPM) serves as the foundational business model in this phase. CVPs not only earn revenue from electricity sales (with Grid Operators) but also receive government subsidies, similar to the Feed-in Tariff (FIT) system. These subsidies provide strong incentives for users to participate in V2G. However, as the number of participants grows, the subsidies will gradually decrease. In addition to EPM, CVPs will also realize local V2G operation through V2B (Vehicle-to-Building) or V2H (Vehicle-to-Home) at the same time.
In addition to directly supporting CVPs, the government also provides subsidies and support to Technology and Infrastructure Providers at the bottom of the model. This support encourages the emergence of companies specializing in infrastructure development and service provision in related fields. These providers deliver essential equipment and technical support to the CVPs.
The key to maximizing business value in this stage lies in effectively setting subsidy levels and dynamic adjustment rules. This approach aims to promote and popularize the V2G concept while laying the groundwork for future development.
3.1.2. Phase 2-Integration of Operations
When social EV penetration reaches 6% or more, the business model will progressively transition into Phase 2, building on the initial development of V2G to enhance system operations and unlock value beyond simple arbitrage. As shown in Figure 5, this phase remains primarily driven by the government sector. A notable development in this stage is the inclusion of a new stakeholder in the CVPs—Energy Suppliers. These suppliers include regional conventional power plants or discrete renewable energy providers, which may overlap with the original CVP or be introduced later.
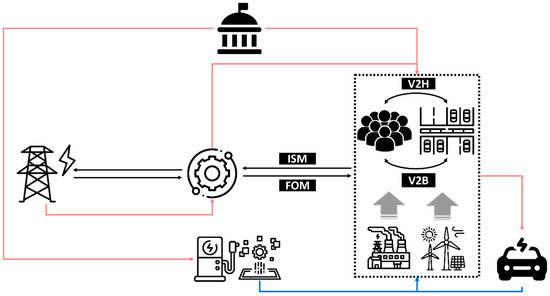
Figure 5.
Schematic of Phase 2-Integration of Operations (The meaning of the symbols can be found in Table 1; The conceptual design of this figure was inspired by insights drawn from 132 prior studies).
In addition to the original V2B or V2H approaches, spinning reserve functions can now be implemented within the CVPs group in a form like a microgrid or a distribution network. These functions help stabilize the intermittent operation of renewable energy sources by providing immediate power supply adjustments, ensuring grid reliability. Additionally, spinning reserves can act as a backup power supply during emergencies, such as earthquakes, and support innovative applications like V2G-enabled emergency power systems in facilities such as multi-level parking structures. This maximizes the use of the V2G’s fast response characteristics.
Another critical stakeholder introduced in Phase 2 is the V2G Service Provider (VSP). VSPs will lead the coordination between CVPs and grid operators, taking over the role of managing the scale of CVP groups. VSPs regulate the behavior of CVPs during specific timeframes to improve operational efficiency and economic value. These providers may take the form of specialized V2G operating companies, aggregators under the virtual power plant (VPP) concept, or entities that own a substantial number of charging and discharging units. Under their leadership, individual and collective users can better integrate with energy suppliers.
The primary business models in Phase 2 are the Individual Subscription Model (ISM) and the Fleet Operation Model (FOM):
- The ISM could evolve by increasing the options available to participants in a liberalized wholesale electricity market, offering diverse subscription packages for engaging with V2G services.
- The FOM involves contracting fleets of vehicles (e.g., taxis, buses, rental cars, or used cars) to provide V2G services when idle.
A significant characteristic of Phase 2 is the structured and organized expansion of V2G systems, necessitating effective management and coordination by VSPs. Additionally, the automotive industry emerges as a new stakeholder in this phase. Automakers can enrich the ISM by offering V2G-ready options when selling EVs, such as higher-capacity batteries to support V2G services, thereby enabling users to generate more revenue. In summary, the success of the business model in Phase 2 hinges on the development and effectiveness of VSPs. As the central facilitator of internal and external CVP connections, VSPs stimulate market activity, enhance system efficiency, and drive the expansion of the CVP community through positive feedback loops.
3.1.3. Phase 3-Grid Regulation Maturity
When social EV ownership exceeds 18%, the business model is expected to enter the third stage (Figure 6), marked by the maturation and completeness of the V2G business model. At this stage, government involvement in operations will cease entirely, transitioning to a fully market-driven system. Energy market operators will replace the government as the primary driver of this phase. The government’s role will shift to regulatory oversight, ensuring the market operates fairly and efficiently.
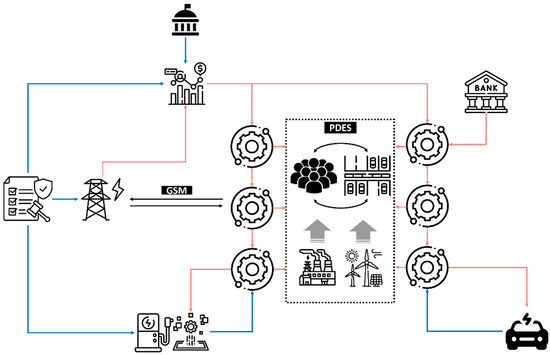
Figure 6.
Schematic of Phase 3-Grid Regulation Maturity (The meaning of the symbols can be found in Table 1; The conceptual design of this figure was inspired by insights drawn from 132 prior studies).
While the roles of Core V2G Participants (CVPs) remain unchanged, their scale will expand significantly. Correspondingly, V2G Service Providers (VSPs) will diversify and form a matrix structure, leading to the emergence of a partially decentralized energy system (PDES) within some CVPs.
Phase 3 introduces a single new business model, the Grid Support Model (GSM). In this model, the arbitrage function will no longer play a role; instead, V2G will focus on supporting grid operations through services such as frequency regulation, voltage adjustment, supply and demand balancing, and participation in intraday or day-ahead power trading markets.
With the transition to a fully market-oriented system, banks and other financial institutions will play an important role in financing operations. Simultaneously, the expansion of the V2G ecosystem will necessitate the involvement of Regulatory, Standardization, and Certification Bodies. These entities will be responsible for regulating operations, establishing laws and regulations, and safeguarding user privacy. In summary, the core focus for maximizing business value in this stage lies in the development and enforcement of rules and regulations. These frameworks are essential for ensuring a fair market environment, transparent operating rules, and robust privacy protections.
3.1.4. Phase 4-Full Decentralization
When the EV retention rate exceeds 50%, the business model will transition into the final stage, representing a fully decentralized energy system, as illustrated in Figure 7. In this stage, the Core V2G Participants (CVPs) will integrate both power market operators and grid operators, operating under a completely decentralized framework. This system will leverage blockchain and related technologies to ensure transparency, security, and efficiency in energy transactions. The existing energy system architecture will be fundamentally transformed, with decentralized rules replacing centralized control. In this scenario, the government’s role will be fully limited to regulatory oversight and the establishment of guiding policies, as operational responsibilities will be entirely relinquished to market mechanisms.
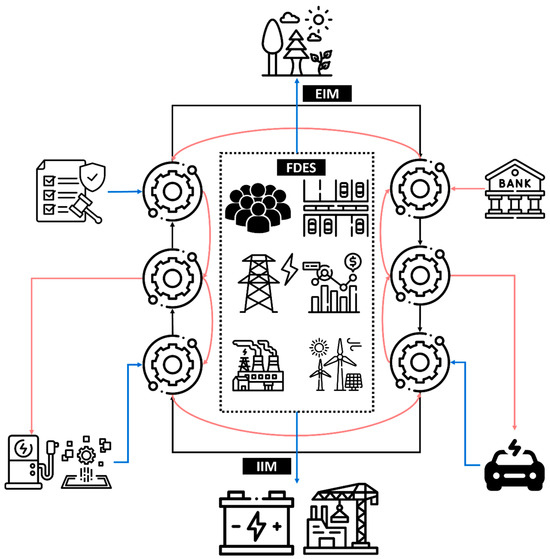
Figure 7.
Schematic of Phase 4-Full Decentralization (The meaning of the symbols can be found in Table 1; The conceptual design of this figure was inspired by insights drawn from 132 prior studies).
Unlike traditional analyses that focus on incremental improvements, this stage envisions the realization of the Environmental Impact Model (EIM) and the Industrial Integration Model (IIM) as critical components of the V2G ecosystem. These models represent the culmination of V2G’s potential, extending its influence beyond energy management to broader societal and industrial contributions.
Environmental Impact Model (EIM), the EIM, and V2G systems are actively integrated with environmental organizations to enhance environmental value. Through this model, EVs equipped with V2G capabilities can support carbon offset initiatives, renewable energy promotion, and emissions reductions. For example:
- Carbon Offsetting: EVs could provide surplus electricity to grids during peak generation periods, utilizing hydrogen energy or other emerging low-emission distributed generation methods, further reducing reliance on fossil fuels.
- Monitoring and Reporting: Advanced technologies embedded within the V2G infrastructure could monitor real-time carbon savings and provide transparent environmental impact reports. In a decentralized energy system, EVs function as small-scale terminals, responsible for data collection and are seamlessly integrated into the network for continuous monitoring and analysis.
Industrial Integration Model (IIM), IIM extends the V2G ecosystem beyond the energy sector, fostering integration with other industries to create a mutually beneficial network. Key aspects of this model include:
- Partnerships with Smart City Initiatives: V2G systems could integrate with smart grids, urban planning, and intelligent transportation systems, supporting smart city goals like reducing energy wastage, improving traffic flow, and enhancing energy reliability.
- Synergies with Telecommunications: The IIM could incorporate telecommunications infrastructure for real-time data exchange, enabling seamless coordination between energy providers, grid operators, and end-users.
- Emergency Preparedness and Resilience: V2G capabilities could support disaster recovery efforts by providing backup power during natural disasters, ensuring energy availability in critical scenarios.
3.2. Stakeholders
We have identified and summarized 13 key stakeholders in V2G business models. These stakeholders have been categorized based on their degree of participation in V2G-related activities. Table 1 outlines the definitions of the 13 key stakeholders involved in the business model, alongside their icons and the connections depicted in the business model phase diagram in Section 3.1.

Table 1.
Stakeholders in Business model with Corresponding Index, Icons, and Definitions.
It is important to note the following:
- Index A represents the Core V2G Participants (CVPs), referring to entities that provide direct energy for the V2G system and are formed at different phases of the business model.
- Index B denotes the V2G Service Providers (VSPs), who act as integrators of V2G services.
- Index C refers to stakeholders directly involved in V2G service transactions.
- Index D represents affiliates of V2G service transactions.
The progression from Index A to Index D reflects a gradual weakening of V2G affiliation, illustrating the varying levels of involvement and influence within the system.
In a pioneering effort, we have also analyzed the relationships among these stakeholders within the context of the V2G business model. These relationships significantly influence the outcomes of economic value analyses for V2G systems. We classify the complex stakeholder relationships into three main categories: Fusion Interactions, Transactional Dynamics, and Value Chain Gaming. It is important to note that peer competition (e.g., competition between different VSP companies, individual EV users, or groups with competing interests) or other simple relationships are excluded from this analysis. This is because such competition pertains only to ordinary business dynamics, whereas our primary focus is on the formation of business models and the evaluation of the economic value of V2G systems.
3.2.1. Fusion Interactions
Fusion Interactions refers not to a simple merger, cooperation, or upstream/downstream process, but to the overlapping roles of different stakeholders or the gradual formation of integration interactions. This relationship is most likely to occur within Core V2G Participants (CVPs), as shown in Figure 8, particularly when the business model evolves to Phase 2 and Phase 3. During these phases, fusion may occur within CVPs, with A12 and A13 being the most common groups. Examples include communities with public parking lots or those that have adopted solar power extensively. A23, on the other hand, represents a future scenario where EV charging stations rely on renewable energy inputs. If such charging stations were integrated within a community, they would evolve into A123, forming a more comprehensive CVP.
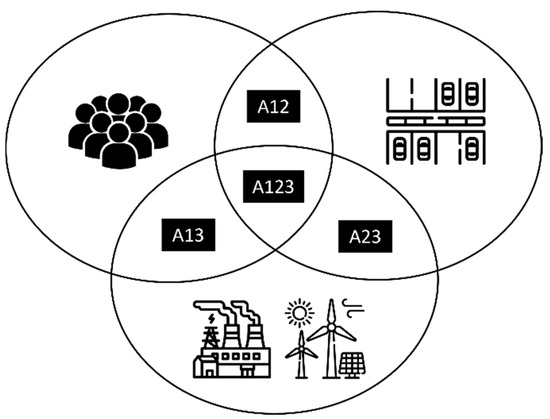
Figure 8.
Fusion Interactions among stakeholders. This figure illustrates the merging of stakeholders A1–A3 to form closer interest groups (Refer to Table 1 for the meaning of the symbols).
Unlike simple interest alignment or cooperation, Fusion Interactions allow for better integration of resources, maximizing the value of V2G systems. This is considered one of the essential processes for decentralizing the energy system. Fusion Interactions also support the formation of localized, self-sufficient energy ecosystems, enabling the community to take a more active role in energy production, storage, and consumption.
The enablers of integration are also crucial in driving Fusion Interactions. During Phase 1, government advocacy is indispensable in creating the necessary regulatory and infrastructural environment. Governments can incentivize community-level CVPs by providing subsidies, policy support, and educational initiatives to promote the adoption of renewable energy and V2G-compatible technologies. As the business model transitions to Phase 2 and Phase 3, VSPs take on more responsibility as enablers, driven by commercial interests. They act as integrators, facilitating the alignment of technology, services, and market incentives to create profitable and scalable V2G solutions. When the business model evolves to Phase 4, and stakeholders (e.g., Grid Operators and Energy Market Operators) will also integrate into the CVP group. This process will largely depend on the evolution of the technological landscape, including advancements in blockchain technology, smart grid management, and renewable energy storage solutions.
Despite their benefits, Fusion Interactions also pose significant challenges, as they occur among a large number of heterogeneous entities, which is also one of the most distinctive features of the V2G system. Firstly, Fusion Interactions often involve stakeholders with differing priorities, making it difficult to align goals and manage conflicts, especially within CVPs where resources and responsibilities overlap. Secondly, the formation of CVPs may marginalize smaller, independent stakeholders or entities unable to integrate, potentially reducing inclusivity in the V2G ecosystem. To address these challenges, it is essential to establish clear regulatory frameworks and monitoring mechanisms to ensure fairness and transparency in CVP operations. Encouraging collaboration among stakeholders and providing incentives for smaller entities to participate in V2G systems can also enhance inclusivity and mitigate the risks associated with Fusion Interactions.
3.2.2. Transactional Dynamics
Transactional Dynamics, on the other hand, represents a common but complex relationship within business models. These relationships can be classified into two main types, as illustrated in Figure 9.
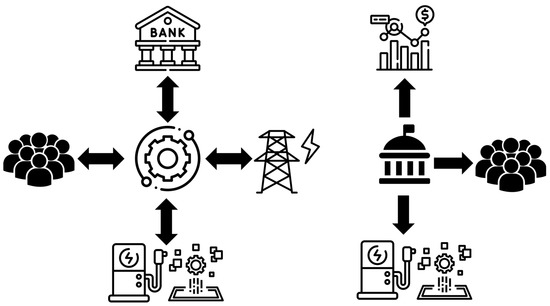
Figure 9.
Transactional Dynamics among Stakeholders. This figure depicts the transactional dynamics between stakeholders, showcasing VSP-centered symmetric transactions (as a bidirectional arrow) on the left and government-centered asymmetric transactions (as a unidirectional arrow) on the right (Refer to Table 1 for the meaning of the symbols).
The first type, depicted on the left side of Figure 9. involves symmetric Transactional Dynamics, where value exchange is reciprocal, and both parties receive proportional benefits. For example:
- A bank invests in a VSP enterprise and earns a corresponding financial return.
- The VSP provides services to user communities and receives a commission in return.
- The VSP trades electricity with grid operators and receives payment.
- The VSP engages with equipment service providers and acquires technology and equipment in exchange for monetary compensation.
These relationships are categorized into three common types of symmetric exchanges: Money-Money, Money-Energy, and Money-Services.
The second type, shown on the right side of Figure 9, involves asymmetric Transactional Dynamics, which are often centered on governments. In these scenarios, one party provides money, technology, or services without directly receiving anything in return. For example:
- Governments may provide subsidies to users or technology companies during Phases 1 and 2 of the business models.
- Governments may regulate the electricity market or provide system support through rule-based entities.
- Such contributions aim to achieve broader objectives, such as the long-term stability of the energy system, rather than immediate or direct returns.
Unlike Fusion Interactions, which reflect highly individualized and complex stakeholder roles, Transactional Dynamics are characterized by non-linearities and uncertainties, which are also key features of the V2G system. These challenges are particularly evident in:
- Energy Supply Prediction: The integration of renewable energy sources introduces variability and unpredictability in energy supply.
- Electricity Market Uncertainty: Fluctuations in electricity prices and market conditions make it difficult to forecast revenue streams.
- User Behavior Variability: Changes in user preferences and usage patterns add complexity to modeling economic outcomes.
- Technological Route Divergence: Competing technological pathways can create bifurcations, making it challenging to determine the most economically viable route.
- Policy Uncertainty and Quantification: Policy changes and difficulties in quantifying their impacts can further complicate revenue and value predictions.
While many of these issues are inherent to the energy system as a whole, the overlay of V2G-specific transactional relationships amplifies these complexities. This underscores the need for robust modeling and adaptation.
3.2.3. Value Chain Gaming
Value Chain Gaming is a relationship that arises under the V2G business model, as illustrated in Figure 10. In this context, four main stakeholders are shown in the V2G interest chain. To maximize their benefits, VSPs aim to attract more EV users with stable power supply. However, EV users may prioritize their personal transportation needs, particularly during peak travel times, leading to unpredictability in their willingness to sell electricity. This forces VSPs to negotiate incentives or develop strategies to stabilize energy contributions while respecting user flexibility leading to a dynamic interplay or “gaming” scenario between these stakeholders.

Figure 10.
Value Chain Gaming among Stakeholders. This figure illustrates the value chain gaming between stakeholders in the operation of the V2G system. From left to right, it represents the interaction between EV user usage and VSP power selling, VSP power selling and grid stability, and grid stability and environmental value (Refer to Table 1 for the meaning of the symbols).
A more apparent example is the strategy employed by VSPs in participating in power trading across different markets to maximize their profits. However, these trading strategies are not always conducive to grid stability. For instance, peak-valley arbitrage, while profitable for VSPs, can conflict with grid requirements such as frequency regulation or capacity reserve maintenance, creating a game between VSP interests and grid stability.
Furthermore, grid stability and the realization of environmental value also involve gaming dynamics. For example, during summer sunny peaks, when solar energy generation is at its maximum, VSPs and the grid may aim to trade and distribute more electricity to balance supply and demand. However, environmental objectives may prioritize storing surplus electricity for later use. These conflicting goals create a three-way game among VSPs, grid operators, and environmental priorities.
Additionally, grid operators and government policies introduce further complexity. While grid operators focus on short-term operational stability and cost efficiency, governments may enforce renewable energy quotas or prioritize decarbonization, creating tension between immediate operational goals and long-term sustainability mandates.
The 4-Phase business model was specifically designed to mitigate the impacts of Value Chain Gaming. This progressive model introduces increasing complexity in Value Chain Gaming relationships:
- P1 focuses solely on CVP arbitrage, where participants optimize their own benefits.
- P2 incorporates the profitability of VSPs, reflecting their role in integrating services.
- P3 adds grid stability considerations, balancing operational efficiency with system reliability.
- P4 ultimately includes environmental value as a key driver, aligning all stakeholders toward sustainability goals.
Unlike other studies, this stakeholder analysis adopts a clearer and more structured approach, avoiding the pitfalls of combining all complex games into a single framework or focusing on isolated transactions. Instead, we advocate for placing Value Chain Gaming at the forefront of V2G economic research. By addressing it through truncated assumptions and focusing on specific scenarios, researchers can achieve more accurate and actionable insights while accounting for the dynamic and interdependent nature of these relationships.
3.3. Influencing Factors
We categorize Influencing Factors into two main groups, as illustrated in Figure 3: policies and regulations (PR) on the left side of the outer circle and technical routes (TR) on the right. Table 2 provides a detailed breakdown of each influencing factor, along with the stakeholders most affected by them. Additionally, Appendix C outlines the additional information on influencing factors. In our analysis, we classify the impact of influencing factors on stakeholders into three categories: positive, negative, and dual. A positive classification indicates that the presence of certain policies or technologies enhances the economic value of the corresponding stakeholders. Conversely, a negative classification implies that these factors hinder economic value acquisition. The dual category represents more complex cases where the impact of influencing factors is dynamic and requires further simulation and validation, as it may change over time and across different scenarios.
Table 2.
Influencing Factors of V2G Systems Economic Value Evaluation.
For Technical Routes, it should be noted that, except for TR1, we did not find independent economic evaluation studies explicitly focusing on other technical routes. For TR2, we provide a relative cost evaluation in Figure A5 and Figure A6, where values in parentheses represent estimated cost ranges (higher and lower bounds). The diversity of power electronic devices necessitates trade-offs in equipment selection, depending on project-specific requirements and regional factors such as infrastructure and regulatory conditions. Economic evaluations of power electronic device selection remain underexplored. However, overall cost evaluations of power electronics often consider factors such as the number of components, system complexity, and operational efficiency. For instance, a system using two unidirectional converters incurs significantly higher costs than one employing a bidirectional converter due to increased hardware requirements and control complexity (as Figure A6). Wireless charging and discharging systems generally incur the highest costs. However, high-cost systems often offer advantages such as improved efficiency, better compatibility, and enhanced stability. At this stage of V2G development, the integration of power electronic optimization with economic considerations is particularly crucial.
For TR3, since communication devices and encrypted data transmission are extensively adopted in various industries, including IT security and smart grids, the economic cost of this component primarily relies on empirical baseline data, along with projections of technological advancements in the V2G domain. The economic cost of TR3 implementation primarily depends on the following factors: the scale of the system, which determines the required hardware and affects maintenance complexity; capital investment in hardware and software, including communication security modules, server infrastructure costs, and V2G platform development; operation and maintenance (O&M) costs, covering communication fees, certificate management, cybersecurity maintenance, and regular server/software updates; and the system’s operational lifespan.
TR4 is marked by a substantial rise in complexity with the evolution of business models, leading to a proportional increase in economic costs. The economic cost is projected to increase in tandem with this rising complexity. Table A3 outlines key system planning strategies applicable at different phases of business model evolution.
With the exception of PR1, policies have no direct impact on stakeholders’ economic value assessment. As noted in Appendix A, there is a substantial lack of research on the sociological aspects of V2G compared to its technological aspects. For PR1, we refer to examples from other domains, such as the energy sector and industrial applications. Regarding V2G, we summarize how incentives are structured and implemented across different categories and mechanisms (see Table A4).
We examine two key environmental policies (PR2) that impact the economic valuation of V2G: Carbon Emissions Trading (or carbon pricing mechanisms), which directly influences the quantification of users’ carbon emissions and facilitates offset mechanisms, and Battery Recycling, as a measure to address battery degradation exacerbated by V2G usage. These policies are analyzed under the staged business model theory usually in Phase 4.
Broader environmental policies, such as the integration of renewable energy, are excluded from this discussion as their direct impact on V2G is limited. While the design of environmental policies related to V2G and the evaluation of its environmental value are crucial topics, they fall beyond the scope of this study. Therefore, we do not extend our analysis to additional environmental policies with economic implications. The role of environmental policies in the economic valuation of V2G is a subject for future investigation.
In PR3, we summarize existing standards developed for V2G and those that may be extended to this domain. It should be noted that the standards outlined in PR3 encompass the communication protocols mentioned in TR3. Our findings indicate that standards typically have a broader scope than protocols, often encompassing multiple protocols within their framework. While standards are usually established by regulatory bodies and may be mandatory in certain regions, protocols primarily define technical specifications and operational procedures. Protocols can be compatible with multiple standards, but their implementation is typically constrained by the specific standard adopted within a given regulatory framework. Furthermore, while existing standards cover certain aspects of V2G operation, there is no unified global standard particularly focusing on user behavior and system scheduling rules. Addressing these gaps represents an important research direction for advancing V2G.
Due to significant differences in national energy strategies and legal frameworks (PR4), our discussion is primarily based on selected content from certain countries. This information also contributes to our analysis of the policies and regulations discussed above. Further research into the energy strategy and legal aspects of V2G is beyond the scope of this study. Consequently, our discussion in this area is limited to selected examples, and the impact of energy strategies and legal frameworks on V2G business models warrants further in-depth analysis within specific analytical contexts.
Mechanisms of Influencing Factors
Most importantly, we find that the mechanisms through which influencing factors operate follow a Hierarchical Progressive structure, as shown in Figure 11. While Figure 3 provides a macro-level overview of the BSTP framework, including its hierarchical structure and overall components, Figure 11 specifically illustrates how the outer-layer influencing factors interact with and impact the middle-layer stakeholders. At the top level, the Government and PR4_Legal Regulations and National Energy Strategy function as the Decision-Making and Regulatory Group, establishing checks and balances that vary depending on geographical and institutional contexts. This group is responsible for setting policies, driving their implementation, and legislating regulations that ensure V2G compliance with appropriate operational frameworks. Additionally, they regulate the financial and energy markets, including market operations and reforms.
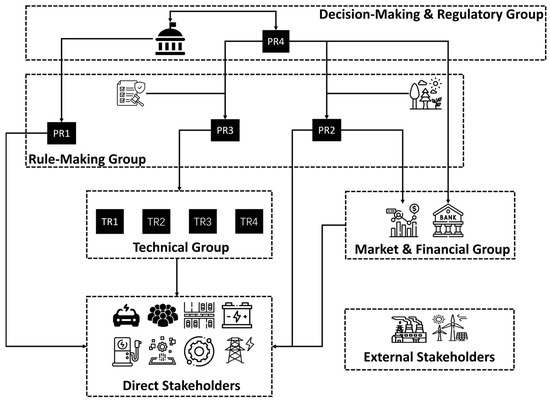
Figure 11.
The Hierarchical Progressive Mechanism of Influencing Factors. Note: The icons represent stakeholders, with their corresponding meanings listed in Table 1. Other black blocks represent specific influencing factors, and their indices and corresponding meanings can be found in Table 2. Dashed boxes indicate groupings of stakeholders and influencing factors at different levels within the Hierarchical Progressive Mechanism, and arrows represent their directional influence across or within levels. The mechanism design was inspired by insights drawn from 132 prior studies.
Under the influence of the Decision-Making and Regulatory Group, several key entities form the Rule-Making Group, including PR1_Incentive Policies, Environmental Organizations and their PR2_Environmental and Sustainability Policies, Regulatory Standardization and Certification Bodies and their PR3_Technical and Standardization Regulations.
Within this framework, PR1 and some PR2 policies, such as battery recycling regulations, directly impact the economic value of specific stakeholders, which we define as direct stakeholders. Meanwhile, PR3 influences direct stakeholders indirectly through the Technical Group (TR1–4, see Table 2), while PR2 acts through the Market and Financial Group. These interactions create a structured pathway for how policies and technical standards shape economic outcomes.
The direct stakeholders referred to here are the same as those defined in Figure 3. In contrast, other stakeholders—who are not directly affected—may benefit through other mechanisms such as developing standards and regulations and collecting licensing fees, providing trading platforms and financial services that act as intermediaries, or technology entities that seek to integrate V2G applications. This differentiation highlights the layered impact of policy and technical decisions on various actors within the V2G ecosystem.
3.4. Conceptual Modeling of the BSTP Framework and an Illustrative Example
3.4.1. Conceptual Modeling of the BSTP Based on Value Realization Rate
So far, we have established the theoretical foundation of the BSTP framework. To enhance its practical applicability and analytical robustness, we now proceed to develop a mathematical model.
We define a space representing the domain in which the BSTP framework operates under any spatio-temporal or contextual setting as where: denotes the set of stakeholders involved in the system, represents the available technological pathways, denotes the policy and regulatory conditions that influence the system.
For a specific scenario operating under a given spatio-temporal context, we define a subspace , which consists of a selected subset of elements from S. For example, the Phase 1 scenario described in Section 3.1.1, denoted by , is defined as: .
This configuration indicates that the Phase 1 analysis considers the following actors and elements: users, parking lot owners, transmission and distribution system operators (TDSOs), infrastructure providers, and governmental agencies; battery technology and charging/discharging power electronics; as well as economic incentives and national energy strategies within the legal and regulatory framework.
By integrating these foundational elements, the economic value of the simplest energy trading business model under Phase 1 can be systematically evaluated.
For a given stakeholder operating within a specific subspace , we define a set of abstract functions to characterize both the changes in its economic value and its interactions with other stakeholders .
To begin with, we define the function , which represents the benefit accrued to stakeholder at a specific time , as shown in Equation (1):
Taking stakeholder in the scenario as an example, its economic benefit includes both the arbitrage value from purchasing electricity from the TDSOs () and the government subsidy received (). This is formalized in Equation (2):
It is important to emphasize that the function can also represent a more generalized form of utility. For example, the government (stakeholder ) may seek not only direct economic returns, but also additional value dimensions such as environmental value (denoted as ), grid stability (), and V2G penetration ().
In such cases, represents a transformed or composite utility, incorporating multiple value components. This relationship is defined in Equation (3):
where , and denote the respective weighting coefficients assigned to each component, reflecting the government’s prioritization of environmental impact, grid stability, and technology diffusion in its value composition.
Different technological factors () and policy factors () will influence the structure of the function , and this influence varies depending on the stakeholder . For example, the presence of affects the discharge efficiency of user . If a specific policy factor such as is not included in the scenario (i.e., ), then the government subsidy received by becomes zero, .
Next, we define the function , as shown in Equation (4), to represent the cost incurred by stakeholder within the V2G system at a specific time :
Similarly, it is possible to define a more specific cost function for stakeholder in the scenario , as expressed in Equation (5). In this case, the total cost consists of two components:
denotes the additional cost associated with battery degradation, which is determined by the presence of ;
represents the infrastructure investment cost, which is influenced by .
The composite cost function is therefore given by:
In most existing research, the focus has been on analyzing (as in Equation (6)), which represents the actual benefit of stakeholder at a particular moment , or on establishing a general utility function (Equation (7)) that quantifies the aggregate benefit of multiple stakeholders within the system.
To enhance the economic evaluation of the V2G system, we propose a Value Realization Rate (VRR) indicator, which enables a more comprehensive assessment of both economic value and system feasibility, as defined in Equation (8).
In this formulation, denotes the expected economic value for stakeholder , typically treated as a constant reference value. This value can differ depending on the stakeholder:
For , may represent the expected electricity sales revenue per unit of time or the anticipated subsidy;
For , it may reflect the expected return on infrastructure technology investment;
For , it may correspond to the allocated budget or expected expenditure cap.
The VRR indicator thus serves as a benchmarked ratio between actual and expected value realizations, facilitating performance comparisons across scenarios.
Furthermore, we redefine in Equation (9) by incorporating (Equation (10)), which accounts for the influence of stakeholder relationships on their realized returns.
Taking the Fusion Interactions described in Section 3.2.1 as an example, the economic value assessment for user may evolve through the integration process with Parking Lot Owners () and Regional Energy Suppliers (), as shown in Equation (11).
In this case, represents the impact coefficient reflecting the post-integration adjustment in ’s value realization. This coefficient captures potential financial transfers to or from and based on predetermined sharing ratios or access to more favorable terms. As a result, integration may lead to enhanced net benefits for stakeholder .
When applying either a continuous or discrete model for analysis, we obtain (Equations (12)–(14)).
At this stage, the ideal design objectives of the V2G system, as conceptualized under the BSTP framework, can be formalized as shown in Equation (15).
which is subject to the constraint that for all . This condition ensures that, for a given economic evaluation space within the V2G system, the total Value Realization Rate across all participating stakeholders during a period is maximized, while guaranteeing that every stakeholder remains in a profitable state (i.e., with positive ).
The interpretation of follows a structured approach:
- signifies that the acquired economic value or utility aligns with or exceeds the expected level.
- 0 < suggests that while the stakeholder gains economic value or utility, it does not meet expectations.
- ≤ 0 indicates that the stakeholder operates at a loss within the V2G system.
Detailed definitions of all symbols used in the preceding equations are summarized in Table 3. It is worth emphasizing that the foregoing mathematics provides only a highly abstract, conceptual outline of how the BSTP framework can be modeled. In practice, the VRR-based evaluation can be integrated with a variety of analytical tools—such as multi-criteria decision analysis (MCDA), game-theoretic formulations, agent-based simulations, or other quantitative methods. Consequently, the mathematical representation presented here is not unique; it should be adapted and tailored to the specific research question and modeling approach adopted.
Table 3.
Notation and Definitions for VRR Analysis.
In the present study, we offer the concept and one concise illustrative case. Owing to space limitations, a full specification of the model and an exhaustive analytical demonstration cannot be provided here. A brief case study is given in Section 3.4.2, while a comprehensive treatment will be presented in our forthcoming work.
3.4.2. An Illustrative Example
This section analyzes the economic value and feasibility of a V2G system under the Phase 1—Initial Deployment scenario in Japan, using the BSTP framework and the VRR methodology. The analysis is conducted based on the following assumptions regarding the business model, stakeholders, and system operations:
Referring to Figure 4, we assume that five key stakeholders—A1, A2, C1, C2, and D2 (see Table 1)—are involved in Phase 1. Among these, A1 and A2 are assumed to be highly integrated; that is, vehicles are charged exclusively at private home parking lots. Public parking and shared residential facilities (e.g., apartment complexes) are excluded from consideration.
The policy environment is assumed to permit reverse electricity flow and sales from individual users to the grid. A fixed-price buyback mechanism, similar to Japan’s Feed-in Tariff (FIT) system, is implemented. This mechanism compensates users at a predetermined rate for electricity supplied back to the grid, covering both the user subsidy and equipment depreciation costs.
From the user side, all EV owners are assumed to be homogeneous: they use the same type of vehicle, follow identical driving and charging patterns, and exhibit no variation in V2G acceptance or participation behavior. Each user is assumed to discharge 60% of their EV battery capacity daily back to the grid. Factors such as TR3 and TR4 are not considered at this stage.
For TDSOs, we ignore potential costs related to grid access, metering, and system stability that might be incurred by retrofitting infrastructure to accommodate V2G functionality.
For technology and infrastructure providers, it is assumed that all development and deployment costs are fully subsidized by the government, resulting in zero infrastructure costs for end-users.
Regarding the government, it is assumed that its V2G subsidy budget is financed through an increase in the national electricity tariff. This mechanism parallels the Renewable Energy Empowerment Credit (REEC) structure under the FIT system. The government’s objective is to maximize V2G penetration while minimizing its fiscal burden—in other words, achieving the highest adoption rate at the lowest possible increase in electricity bills.
Under these assumptions, the VRR-based model is constructed as shown in Equations (16)–(23).
This is where represents the subsidy received by the user, denotes the battery loss incurred by the user when participating in the V2G process, indicates the profit expected by the user, and refers to the government’s budget allocated for the electricity tariff increase. denotes the cost of the user subsidy borne by the government, while represents the infrastructure investment cost also paid by the government. All values are defined on a per-unit-of-time and per-unit-of-electricity basis. The variable represents the penetration rate of V2G (0.06 is an assumption in Appendix A.2, serving as the threshold value reached in Phase 1).
The results illustrated in Figure 12 demonstrate that all three variables—, and —exhibit approximately linear trends as the monthly user subsidy increases. Specifically, both and increase monotonically from negative values, reflecting a gradual improvement in stakeholder benefits. In contrast, shows a declining trend while remaining positive, indicating that government expenditures are steadily consumed but not yet exhausted.
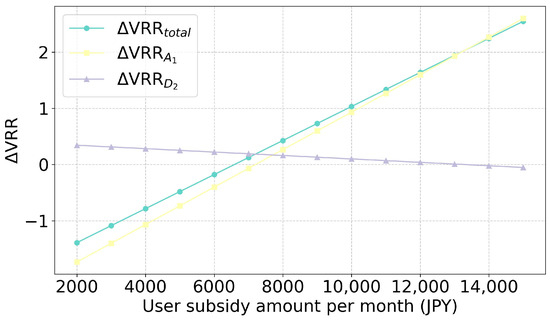
Figure 12.
Relationship between user subsidy levels and changes in the ΔVRR of different stakeholders. Note: All subsidy values are in Japanese yen (JPY); 1 USD ≈ 150 JPY, ΔVRRtotal here only consider A1 and D2.
Two critical thresholds are highlighted in the graph:
- Around 7000 JPY per month, both and become positive. This represents the point at which all stakeholders begin to receive net economic benefits, signaling a win-win equilibrium for the overall system.
- Around 12,000 JPY per month, approaches zero, suggesting that public expenditures or system-level burdens may exceed sustainable limits—i.e., beyond this point, subsidy costs may surpass the government’s budget capacity or acceptable cost-benefit thresholds.
This figure underscores the utility of the VRR method in evaluating economic outcomes across multiple stakeholders in the context of V2G systems. It offers quantitative insights to guide the design of subsidy policies, striking a balance between user incentives and systemic sustainability. These results highlight the potential of the VRR approach as a powerful analytical tool for policy formulation and system optimization.
4. Discussion
Now that we have outlined the BSTP framework and the VRR methodology for its application in economic value analysis, this section examines the distribution of BSTP elements across existing V2G economic literature, as illustrated in Figure 13. The goal is to identify prevailing research trends and highlight key gaps in the current body of work.
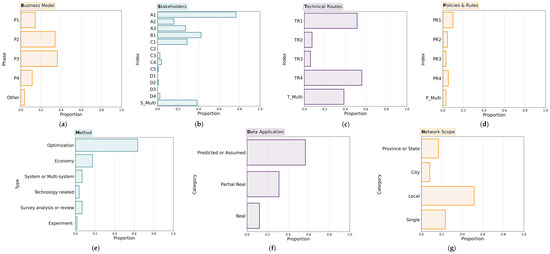
Figure 13.
Statistical Analysis of V2G Economic Literature. (a) Distribution of business model phases analyzed in different studies (b) Percentage of different stakeholders examined as study subjects (c) Percentage of different technological routes considered (d) Percentage of different policies and regulations analyzed (e) Percentage of different research methodologies used (f) Percentage of studies utilizing real-world data (g) Percentage of studies examining the scope of the V2G network.
4.1. Big Models, No Trials
Based on our review of 132 articles related to the economic analysis of V2G (see Supplementary Data S1), most studies appear to be “ahead of their time.” As shown in Figure 13a, over 47% of the studies focus on the P3 and P4 of the business model, which involve large-scale V2G applications in electricity markets, carbon trading, or advanced decentralized energy systems. While these technologies hold significant promise, only 14% of the studies examine the P1 stage, where applications such as single-user arbitrage could be more easily validated.
This misalignment is further highlighted in Figure 13f, where only 12% of the studies incorporate real-world data—mainly from battery degradation experiments or individual surveys—while over 56% rely entirely on hypothetical scenarios. Additionally, Figure 13e shows that more than 63% of the studies use optimization-based simulations, often prioritizing technical complexity, model intricacies, and algorithmic details over clear, comprehensive conclusions about economic viability.
This tendency to focus on theoretical sophistication rather than practical validation creates a disconnect between research and real-world implementation. Policymakers and investors, who play a crucial role in driving V2G adoption, require tangible economic insights to inform decision-making. However, the prevailing “Big Models, No Trials” approach risks trapping V2G research in a cycle of academic discourse with limited real-world impact.
4.2. Filling the Missing Pieces
To address the “Big Models, No Trials” issue and facilitate the practical application of the method, we propose the following key research directions:
- Targeted Breakthrough Research
As shown in Figure 13g, over 51% of existing studies focus on localized systems (e.g., microgrids or distributed energy systems). However, research based on single-user experiments, surveys, and data integration remains crucial. These foundational studies can provide robust empirical support for the implementation of and similar approaches, strengthening the theoretical framework with real-world validation.
- 2.
- Step-by-Step and Systematic Studies
A structured, incremental approach is essential for advancing V2G research. Our study emphasizes the importance of P1 and P2, where clearly defining cost-benefit flows and identifying stakeholder boundaries is critical. This structured perspective aligns with the insights of Huber et al. [67] and Kim et al. [72].
- 3.
- Exploring Intra-Stakeholder Relationships
As shown in Figure 13b, over 61% of studies consider only a single stakeholder. However, V2G is inherently a multi-stakeholder system. Our review identifies several studies [29,43,66,80,109] that acknowledge the Value Chain Gaming among multiple stakeholders. Nearly all studies involving system scheduling focus on Transactional Dynamics between stakeholders, yet none have examined Fusion Interactions. While 38% of studies include multiple stakeholders, particularly in microgrid contexts, many rely on hypothetical scenarios rather than real-world implementations. Further research is needed to understand the complex benefit distribution mechanisms in actual V2G ecosystems.
- 4.
- Addressing “Cold” Stakeholders
Figure 13b also shows that nearly 80% of studies primarily focus on users, with CVPs (Core V2G Participants) and VSPs (V2G Service Providers) receiving some attention. However, apart from a few studies on Energy Market Operators [134,136], there is a notable lack of research on Technology and Infrastructure Providers, the Automotive Industry, and the Financial Sector. While these entities are not directly involved in V2G transactions, their role in shaping business models is critical.
- 5.
- Technological Integration of Charging, Discharging, and Communication Infrastructure
The economic evaluation of V2G is heavily influenced by infrastructure and communication technologies. Although some studies [94,95] explore these aspects, they are often overshadowed by research on batteries and energy planning. As shown in Figure 13c, over 50% of studies focus on the latter, whereas fewer than 10% analyze charging and discharging equipment or communication infrastructure. Additionally, research on regional differences, optimal selection of charging/discharging and communication equipment, and economic cost comparisons of different topologies remains largely unexplored.
- 6.
- Investigating the Impact of Policy and Regulation Frameworks
As seen in Figure 13d, research on policy and regulation impacts accounts for less than 10% of V2G studies, with incentives policy addressed in only 9.8% of cases. This is insufficient, as incentive structures and mechanisms are fundamental drivers of P1 and P2 adoption. Furthermore, user behavior regulation, given the potential large-scale participation of EV users in V2G, requires systematic examination. While preliminary operational frameworks have been proposed by different entities, they remain incomplete. Legal frameworks, energy policies, and governance strategies should be further explored to create a stable and scalable V2G ecosystem.
5. Conclusions
To enhance the economic evaluation of V2G systems, this study adopts the Semi-Systematic Co-Design Approach to develop the BSTP framework, which integrates four key dimensions: Business Models, Stakeholders, Technological Routes, and Policies and Regulations. We construct a four-phase evolutionary process for V2G business models, identify 13 potential stakeholders within the V2G ecosystem, and conduct an in-depth analysis of three types of stakeholder-specific relationships. Additionally, we categorize the key influencing factors into two major groups—Technological Routes and Policies and Regulations—detailing their content and mechanisms within V2G systems.
Furthermore, we propose the Value Realization Rate (VRR) evaluation method to facilitate the application of BSTP in assessing the value and feasibility of V2G economic systems. This method is informed by our review of 132 core studies on V2G economic analysis, through which we identify six critical challenges that must be addressed in future research on V2G economic evaluation.
Unlike studies that focus primarily on technical aspects, our research provides a clear and direct reference for policymakers and investors, offering insights essential for shaping the development of the V2G industry. Ultimately, this study contributes to advancing V2G adoption and plays a pivotal role in the broader transition toward decentralized energy systems.
However, it is important to note that this study is conceptual in nature and intended as a review-based synthesis. The proposed BSTP framework and the VRR method are not empirically validated in this paper. Instead, we provide only a simplified illustrative example to demonstrate potential applications. Future studies should focus on collecting real-world data to validate and refine the proposed models and methods.
Moreover, as this research is primarily situated within the market and technological context of Japan, the generalizability of the framework may be limited. Differences in energy market structures, regulatory systems, and levels of technological maturity across countries necessitate further adaptation and localization of the BSTP framework. Future work should explore cross-national applications and conduct empirical assessments to enhance the global relevance and robustness of the proposed approach.
Supplementary Materials
The following supporting information can be downloaded at https://www.mdpi.com/article/10.3390/en18123088/s1, Supplementary Data S1: Supplementary Data S1: Overview of 132 reviewed papers: metadata, coding classifications, and summary statistics.
Author Contributions
Conceptualization, C.Z.; methodology, C.Z. and M.G.; software, C.Z. and H.K.; validation, H.K. and M.G.; formal analysis, H.K.; investigation, C.Z.; resources, M.G.; data curation, C.Z.; writing—original draft preparation, C.Z.; writing—review and editing, H.K. and M.G.; visualization, C.Z.; supervision, M.G.; project administration, M.G.; funding acquisition, M.G. All authors have read and agreed to the published version of the manuscript.
Funding
We sincerely acknowledge the financial support provided by the Council for Science, Technology and Innovation (CSTI) through the Cross-ministerial Strategic Innovation Promotion Program (SIP) under the 3rd period of SIP “Smart Energy Management System” (Grant Number JPJ012207), funded by the Japan Science and Technology Agency (JST).
Conflicts of Interest
Author Hiroshi Kitamura was employed by the company NEC Corporation. The remaining authors declare that the research was conducted in the absence of any commercial or financial relationships that could be construed as a potential conflict of interest.
Abbreviations
The following abbreviations are used in this manuscript:
| V2G | Vehicle-to-Grid |
| V2B | Vehicle-to-Building |
| V2H | Vehicle-to-Home |
| BSTP | Business models, Stakeholders, Technological Routes, as well as Policies and Regulations |
| PR | Policies and Regulations |
| TR | Technical Routes |
| EV | Electric Vehicle |
| PHEV | Plug-in Hybrid Electric Vehicle |
| BEV | Battery Electric Vehicle |
| VRR | Value Realization Rate |
| CVPs | Core V2G Participants |
| VSPs | V2G Service Providers |
| ISM | Individual Subscription Model |
| GSM | Grid Support Model |
| FOM | Fleet Operation Model |
| EPM | Energy Purchase Model |
| PDES | Partial Decentralized Energy System |
| FDES | Full Decentralized Energy System |
| V2G | Vehicle-to-Grid |
| V2B | Vehicle-to-Building |
Appendix A. Overview of V2G Research Trends and Developments
Appendix A.1. Survey Methodology and Notes
To identify trends in existing research on V2G, this section analyzes current literature reviews on V2G. The presence of literature reviews indicates that substantial research has been conducted in a specific niche, leading to the development of recognizable patterns that can be summarized. This survey primarily relies on the Web of Science (WoS) database, focusing on publications in English from 1990 to 2024. The search terms include “V2G”, “Vehicle-to-Grid”, and “Vehicle to Grid”, with the selection limited to review papers.
After excluding early access papers, a total of 1229 papers were obtained as of November 30, 2024. These were sorted by relevance, and 39 review papers were selected as the survey sample. Papers ranked 40th and beyond were excluded, as their focus deviated from the core topic of V2G.
The information from these 39 papers is summarized in Table A1, where “Year” refers to the year of publication and “Country” indicates the country of the corresponding author. It is important to highlight that V2G is a multidisciplinary field of research. Therefore, we categorized “Method” to reflect the type of review:
- Narrative Review—Authors investigate a specific topic and related articles, providing qualitative insights into existing trends and future directions (e.g., the concept and development of V2G systems).
- Comprehensive Review—Authors analyze a large body of literature on a specific topic in depth (e.g., a survey of charging technologies).
- Scoping Review—Authors explore a broad field of research to assess the volume of studies and identify trends.
- Systematic Review—Authors focus on a single research question, applying clearly defined filtering rules to produce precise, methodologically detailed analyses (e.g., battery degradation studies).
- Meta-Analysis—Authors extract data from multiple studies and conduct statistical analyses (e.g., evaluating the economic benefits of V2G systems across different studies).
It is important to note that the definitions of review methodologies were formulated after completing our investigation. These definitions may differ from the descriptions within the reviewed papers or the definitions used in other studies. The quantitative criteria distinguishing different methods are presented in Figure A1. In addition to methodology, we also define the scope of the review.
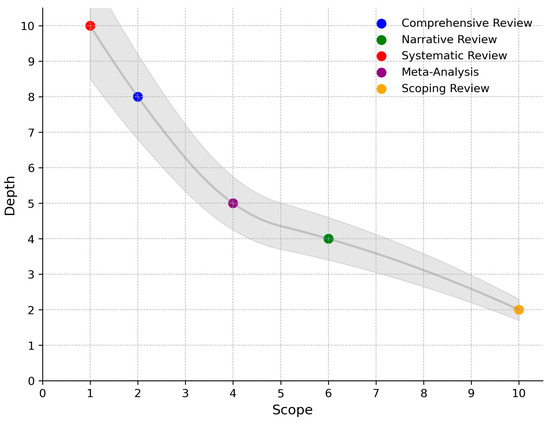
Figure A1.
Quantitative Criteria of Different Review Methods Note: The horizontal axis represents the scope of research categories involved in each review method, while the vertical axis indicates the depth of involvement in individual research categories. Both dimensions are qualitatively divided into 10 levels. Each review method corresponds to a specific range and depth level. The shaded area reflects the margin of error that may occur during the practical application of these methods. This figure illustrates qualitative trends only.
- Concept—The review focuses on the concepts, frameworks, and evaluations of V2G. It may touch on technological or social aspects but does not conduct an in-depth analysis tied to specific research questions.
- Technology—The review addresses a specific technological issue related to V2G, providing a focused analysis rather than a broad or macro-level overview.
- Social—The review explores a particular social aspect of V2G, delving into societal implications or challenges rather than describing overarching frameworks.
Regarding the focus on economic aspects, we define the classifications as follows:
- Yes—The primary theme of the review consistently addresses economic-related topics throughout the text.
- Part—Economic aspects are discussed in at least one section or chapter of the review.
- No—This category includes studies that are either economically irrelevant or mention economic elements without further analysis.
Table A1.
Summary of Review Papers on the Topic of V2G.
Table A1.
Summary of Review Papers on the Topic of V2G.
| Ref_No. | Year | Country | Journal | Key Topics | Method | Scope of Review | Focus on Economic Aspects |
|---|---|---|---|---|---|---|---|
| [158] | 2013 | Turkey | IEEE Transactions on Transportation Electrification | System concept | Comprehensive review | Concept | Part |
| [159] | 2014 | Korea | Renewable and Sustainable Energy Reviews | Renewable energy integration | Comprehensive Review | Concept | No |
| [160] | 2014 | India | Renewable and Sustainable Energy Reviews | Key Issues and Solutions in V2G Applications | Narrative Review | Concept | No |
| [161] | 2015 | India | IEEE Systems Journal | Scheduling | Comprehensive Review | Technology | No |
| [16] | 2015 | Pakistan | Journal of Power Sources | Impact of V2G on grid | Narrative Review | Concept | No |
| [162] | 2016 | Malaysia | Renewable and Sustainable Energy Reviews | Framework, benefits, and challenges of V2G | Narrative Review | Concept | Part |
| [18] | 2017 | Denmark | Annual Review of Environment and Resources | Sociotechnical system | Narrative Review | Social | Part |
| [19] | 2018 | Denmark | Environmental Research Letters | Sociotechnical system | Critical and systematic review | Social | Part |
| [163] | 2018 | France | Journal of Power Sources | Battery degradation | Systematic review | Technology | Yes |
| [164] | 2018 | Belgium | Energies | Power Conversion Unit | Comprehensive Review | Concept | No |
| [165] | 2019 | India | IET Power Electronics | Wireless charging | Narrative Review | Concept | No |
| [17] | 2019 | UK | 2019 IEEE Milan PowerTech | Battery degradation | Systematic review | Technology | No |
| [166] | 2019 | China | Renewable and Sustainable Energy Reviews | Power interaction mode, scheduling methodology andmathematical foundation | Narrative Review | Concept | No |
| [13] | 2019 | India | Journal of Energy Storage | Power electronics | Systematic review | Technology | No |
| [167] | 2019 | Turkey | Energies | Communication Standard and Charging Topologies | Narrative Review | Concept | No |
| [168] | 2020 | Turkey | Journal of Science | System concept | Narrative Review | Concept | No |
| [9] | 2020 | UK | Renewable and Sustainable Energy Reviews | Actors and business models | Comprehensive Review | Social | Yes |
| [8] | 2021 | Turkey | Renewable energy focus | Literature on V2G | Scoping Review | Concept | Part |
| [14] | 2021 | Malaysia | Sustainable Energy Technologies and Assessments | Energy management strategy | Comprehensive Review | Technology | No |
| [169] | 2021 | Australia | Journal of Emerging and Selected Topics in Power Electronics | Battery degradation | Systematic review | Technology | No |
| [170] | 2021 | Germany | Renewable and Sustainable Energy Reviews | Factors influencing the economic success | Meta-Analysis | Social | Yes |
| [12] | 2022 | Turkey | Journal of Energy Storage | Concepts, interface topologies, and marketing | Comprehensive review | Concept | Part |
| [171] | 2023 | India | Energies | Bidirectional Converter Topologies | Comprehensive review | Technology | No |
| [172] | 2023 | China | Energies | Modeling, Regulation, and Market Operation | Narrative Review | Social | Part |
| [173] | 2023 | Thailand | Sustainability | System concept | Narrative Review | Concept | No |
| [174] | 2023 | Belgium | World Electric Vehicle Journal | Charging Infrastructure | Systematic review | Concept | Part |
| [175] | 2023 | India | World Electric Vehicle Journal | System concept | Narrative Review | Concept | No |
| [176] | 2023 | Pakistan | Energy Reports | System concept | Narrative Review | Concept | No |
| [15] | 2024 | India | IEEE Transactions on Transportation Electrification | Bidirectional Charger Topologies | Comprehensive review | Technology | No |
| [177] | 2024 | Italy | Applied Sciences | Literature on V2G | Scoping Review | Concept | Part |
| [178] | 2024 | Spain | Electronics | Communications and Data Science | Narrative Review | Technology | No |
| [179] | 2024 | China | Energies | Electricity Market | Narrative Review | Social | Yes |
| [180] | 2024 | Italy | Energies | System concept | Narrative Review | Concept | No |
| [181] | 2024 | India | Discover Applied Sciences | Charger topologies | Narrative Review | Technology | No |
| [182] | 2024 | China | World Electric Vehicle Journal | Control Strategies and Economic Benefits | Narrative Review | Concept | Part |
| [183] | 2024 | Czechia | WIREs Energy and Environment | System concept | Scoping Review | Concept | Part |
| [184] | 2024 | Belgium | Energy Reports | System concept | Comprehensive review | Concept | No |
| [185] | 2024 | China | Energy Reports | System concept | Comprehensive review | Concept | No |
| [186] | 2024 | Australia | Renewable and Sustainable Energy Reviews | Battery degradation | Systematic review | Technology | No |
Appendix A.2. Overview of Existing Reviews
Based on the categorization outlined in Appendix A.1, we compiled and analyzed the basic profiles of existing studies. The results are presented in Figure A2. The number of V2G review studies (Figure A2a) remained relatively stable until 2022, with no more than six publications per year. However, post-2022, there was a significant surge, reaching 11 publications in 2024, accounting for 28% (11/39) of the total. Regarding the nationality of the corresponding authors (Figure A2b), India led with eight studies (21%), followed by Turkey and China, each contributing five studies (13%). All other countries produced fewer than 3 studies. In terms of publication venues (Figure A2c), Renewable and Sustainable Energy Reviews and Energies published the highest number of articles, with 7 and 6, respectively. Other journals published fewer than 3 articles each.
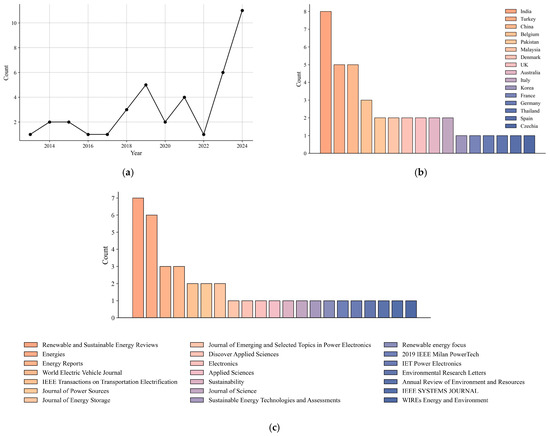
Figure A2.
Basic Information on V2G Review Papers. Note: (a) Distribution of publication years of the reviewed papers; (b) Distribution of the countries of the first authors’ affiliated institutions; (c) Distribution of the journals in which the papers were published.
In addition to the basic information, we also summarized the core characteristics of these review studies in Figure A3. As illustrated in Figure A3a, nearly half of the reviews employed the Narrative Review method (16 out of 39), while Meta-Analysis and Critical Review methods were each represented by only one study. Regarding the focus of these reviews (Figure A3b), studies on System Concepts and Power Electronic Devices dominated, collectively accounting for 20 out of 39 reviews. The distribution of studies across other topics was more balanced. From the perspective of review scope (Figure A3c), more than half of the studies remain centered on generalizing system concepts, with fewer reviews addressing practical research questions. Specifically, for the theme of economic issues (Figure A3d), only 3 reviews directly explored economic topics (3 out of 39, or 8%), while 11 reviews incorporated limited economic discussions (11 out of 39, or 28%).
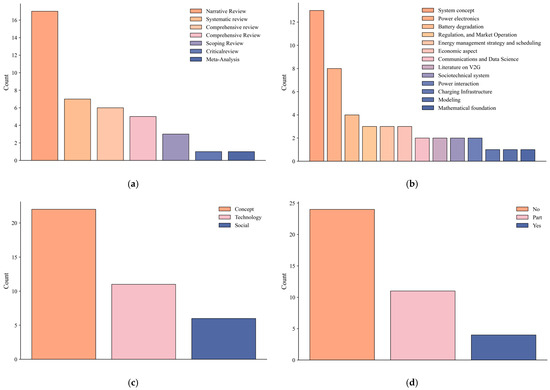
Figure A3.
Core Information on V2G Review Papers. Note: (a) Distribution of key topics covered in the reviews; (b) Distribution of methods used in the reviews; (c) Distribution of the scope of review; (d) Distribution of whether the review is related to economic research.
The results clearly indicate that the current stage of V2G research can be characterized by two key phases: emergence and inflection. In the early stages, the volume of V2G studies was minimal, with most focusing on conceptual analyses, preliminary evaluations, or well-established areas such as power electronics. However, in recent years, increasing attention has been directed towards emerging technological domains, including communication and security, energy management, and notably, sociological aspects. This shift has led to a sharp rise in the number of publications. Returning to the core focus of this study, research on the economic aspects of V2G remains scarce. Notably, there is a complete absence of framework reviews and comprehensive analyses in this area, underscoring the urgency and significance of addressing this research gap.
Appendix B. Descriptions and Definitions of Separated Phase
The business model for V2G remains in a state of flux. To systematically summarize the potential business models for V2G, we propose an evolutionary projection based on the proportion of EV ownership. As illustrated in Figure A4, the evolution of the business model is divided into four phases. The vertical axis represents the share of EV ownership, defined as the proportion of EVs among all vehicles in society, while the horizontal axis denotes the time scale in years. This projection (EV ownership) is an approximation, drawing heavily on insights from Qian et al. [187].
The classification of Phases 1–4 is derived from insights in previous studies [188,189]. Our analysis highlights system size—defined as the ratio of V2G participants to EV users—as the most significant factor influencing V2G system capabilities. The specific definitions and explanations of separated phases are as follows.
Phase 1: Initial Deployment, during this phase, the share of EVs in society is projected to remain below 6%. The V2G concept will be in its early stages, with minimal user participation and limited commercial applications.
Phase 2: Integration of Operations, in this phase, the EV market share is projected to increase to 6~18%, and V2G systems are expected to see substantial commercial adoption, with more than half of EV users actively participating. This estimate is not only based on our previous research but also heavily informed by established social studies on user perceptions of V2G and their willingness to engage with it.
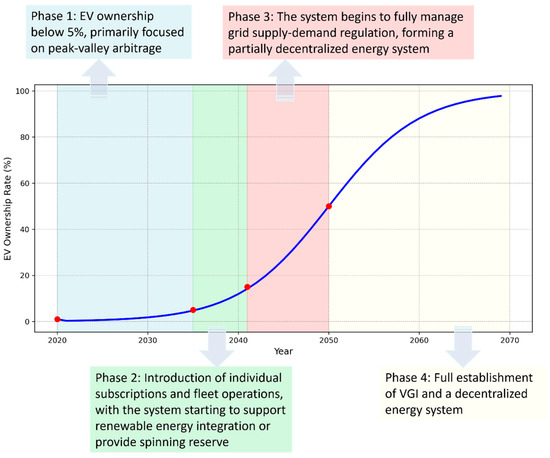
Figure A4.
Stages of Formation and Evolution of the V2G Business Model.
However, variations in electricity consumption and vehicle ownership across different countries and regions may lead to discrepancies in phase boundary ratios. As a result, Figure A4 should be considered a qualitative reference rather than a definitive metric. The following section outlines the derivation process of these boundary points, starting from a single-region case study.
Solely taking Japan as an example [188], in the Kanto region, the Electricity Supply and Demand Adjustment Market (EPRX) recorded a daily load of approximately 1000–5000 MW per BLOCK in Replacement Reserve-for FIT (RRFIT)—the product with the highest adjustment capability requirements in 2022 (one BLOCK represents three hours). Meeting the power adjustment requirements of a single BLOCK in RRFIT would necessitate a continuous electricity supply of approximately 3350 MW on average.
At present, EV ownership in the Kanto region is around 1%, with an estimated electricity supply of approximately 3000 MWh per hour [188]. To fulfill the power adjustment requirements for a single BLOCK, a minimum capacity of 9000 MWh is required, implying that EV ownership must triple. Furthermore, based on our findings [189], the minimum user participation rate in Japan at the current stage may be as low as 50%. Therefore, we set an EV ownership rate of 6% as the threshold for entering Phase 2, meaning that the EV fleet can at least meet the adjustment requirements of any product within the EPRX market for a short period (one BLOCK).
Considering seasonal variations, there could be 3–4 peak BLOCKs per day, along with additional power adjustment product needs. To independently meet all these demands, the EV share would need to reach at least 18%, marking the threshold for entering Phase 3.
Phase 3: Grid Regulation Maturity, when the EV share reaches 18%, the business model will enter the Grid Regulation Maturity stage. At this stage, the V2G system will fully manage the grid’s supply and demand adjustments and integrate into decentralized energy systems. As the system scales, it will expand its involvement in various power transactions.
Phase 4: Full Decentralization, upon reaching 50% EV ownership, the grid system is expected to transition into the Full Decentralization phase. This threshold is determined with reference to transaction records from JEPX (Japan Electric Power Exchange), where power demand in a BLOCK within the Kanto region can reach 120,000 MWh during winter and summer peak periods.
For estimation purposes, we assume a V2G participation rate of 80% at P4. Under this assumption, once EV penetration reaches 50%, the V2G system alone would be capable of supplying the electricity demand of a BLOCK in the Kanto region—not just for grid balancing, but also for peak electricity supply.
It is important to note that all phase transition thresholds are subject to uncertainties in EV penetration rate projections, V2G participation forecasts, geographic variations, and other influencing factors. Therefore, our phase classification serves as a qualitative reference rather than a precise prediction. The inability to accurately define these thresholds represents a limitation of our study, but also highlights a key direction for future research.
Appendix C. Additional Information on Influencing Factors
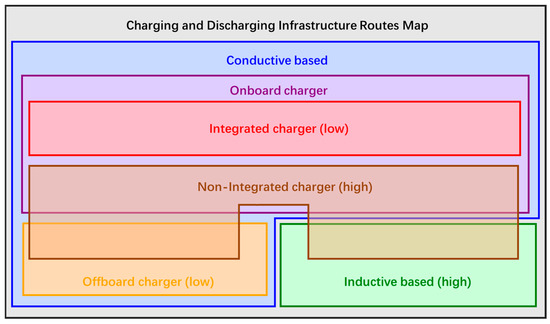
Figure A5.
Classification and Inclusion Relationships of V2G Charging and Discharging Systems Note: The values in parentheses indicate the magnitude of relative costs. Conductive-based: Systems that transfer power through physical connectors. Inductive-based: Wireless power transfer systems using electromagnetic fields. Onboard Charger: Chargers integrated into the EV, typically lower power but portable. Off-board Charger: High-power chargers located externally, often used in public charging stations. Integrated Charger: Combines charging and power conversion functions in a single unit. Non-integrated Charger: Separate components for charging and power conversion. The inclusion relationships and cost information are synthesized from fragmented data reported in [13,164,165,167,177].
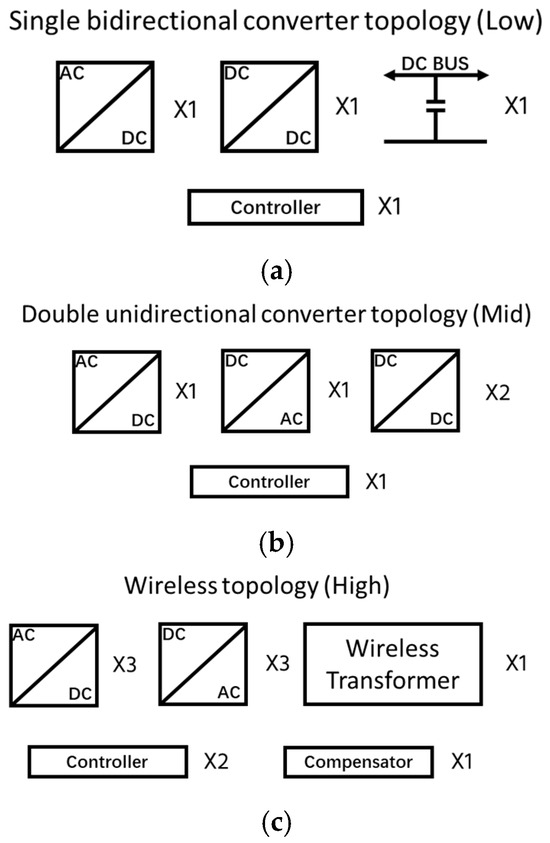
Figure A6.
Number of Components in Typical Charging and Discharging Topologies, with Relative Costs in Parentheses Note: (a) Single bidirectional converter topology; (b) Double unidirectional converter topology; (c) Wireless topology. The estimation of the number of components is derived from the information provided in [13,165]. Within the scope of this study, we provide only the first-stage converter circuit. For the inverter and rectifier components that constitute the converter, the topology can become highly complex, encompassing designs such as full-bridge topology, three-level topology, isolated matrix in bidirectional AC-DC converters (BADC), isolated topologies, non-isolated topologies, resonant topologies, and others in bidirectional DC-DC converters (BDC). However, detailed descriptions of these are beyond the scope of this study. We will provide corresponding explanations and analyses in subsequent work.
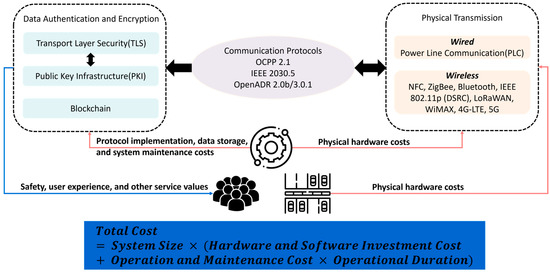
Figure A7.
Communication and Protocols—Elements and Their Impact on Stakeholders with Cost Estimation Methodology Note: Icons representing stakeholders and relationship lines can be found in Table 2. Communication protocols form the core element at the center, unidirectionally influencing data encryption and security on the left-hand side. However, the implementation of these protocols also relies on the hardware on the right-hand side, which is designed according to the protocols’ specifications, creating a bidirectional relationship between the protocols and the hardware. The conceptual framework is derived from the authors’ industry experience.
Table A2.
Types of Batteries Used in EVs and Relevant Information.
Table A2.
Types of Batteries Used in EVs and Relevant Information.
| Battery | Cycles | Expected Life, Years | Installation Cost, $/kWh | Energy Efficiency, % | Gravimetric Energy Density, Wh/kg | Status |
|---|---|---|---|---|---|---|
| Current | ||||||
| Lithium-ion NMC (Nickel Manganese Cobalt) | 2000 | 10 | 120–180 | 90 | 150–250 | Widely used in BEVs and PHEVs. |
|
NCA (Nickel Cobalt Aluminum) | 1500 | 12 | 150–200 | 92 | 200–260 | High energy density, fast charging, primarily used in Tesla. |
| LFP (Lithium Iron Phosphate) | 4000 | 15 | 80–120 | 88 | 90–160 | Safe, long cycle life, lower range, used in BYD, Tesla Model 3. |
| LMO (Lithium Manganese Oxide) | 1000 | 8 | 100–150 | 85 | 100–150 | Fast charging, but lower lifespan, used in some hybrids. |
| Future | ||||||
| PEMFC (Proton Exchange Membrane Fuel Cell) | 3000 | 7 | 1000–1500 | 50 | ~800–1200 | Used in FCEVs—Applied in hydrogen-powered EVs (Toyota Mirai, Hyundai Nexo). |
| Solid-State Battery | 5000 | 15 | 300–500 | 95 | 250–500 | Higher energy density, safer. |
| Silicon-Anode Li-ion | 3000 | 12 | 250–400 | 92 | 300–450 | Potential for EV range boost. |
| Sodium-Ion (Na-ion) | 3000 | 10 | 50–100 | 85 | 100–160 | Cheaper alternative to Li-ion. |
| LTO (Lithium Titanate) | 10,000 | 20 | 200–300 | 98 | 50–110 | Ultra-long lifespan, low energy density, used in specialized EVs. |
| Zn-Air (Zinc-Air) | 1000 | 10 | 50–100 | 45 | 350–700 | Low rechargeability and low energy density limit EV use. |
| Al-Air (Aluminum-Air) | 1000 | 10 | 30–80 | 40 | 1300–2800 | High range but non-rechargeable. |
| Discard or Cannot Use | ||||||
| VRB (Vanadium Redox Battery) | 10,000 | 15 | 750–850 | 70 | 10–40 | Very low energy density and heavy weight make it unsuitable for EVs. |
| Ni-Cd (Nickel-Cadmium) | 2000 | 20 | 1200–1500 | 85 | 40–80 | Environmental concerns and poor performance led to phase-out. |
| Zn-Br2 (Zinc-Bromine) | 3000 | 7 | 600–800 | 70 | 60–90 | Low power density and slow response time prevent EV adoption. |
| Lead-acid | 2000 | 15 | 400–600 | 85 | 30–50 | Used as a 12V auxiliary battery in EVs, but not for main propulsion. |
| Na-S (Sodium-Sulfur) | 4000 | 10 | 600–800 | 75 | 100–200 | High operating temperature (~300 °C) and safety risks make it impractical for EVs. |
| ZEBRA (Sodium-Nickel Chloride) | 4000 | 10 | 750–1000 | 75 | 90–150 | High-temperature issues, used in commercial vehicles. |
| SOFC (Solid Oxide Fuel Cell) | 10,000 | 15 | 500–1000 | 60 | 700–1200 | Used in stationary storage and not for EVs. |
Note: The summary format and some of the information are referenced from [190] and have been supplemented with the latest industry survey conducted by the authors’ team.
Table A3.
Functions Enabled by System Scheduling and Optimization Techniques at Different Business Model Phases, Including Applicable Algorithms.
Table A3.
Functions Enabled by System Scheduling and Optimization Techniques at Different Business Model Phases, Including Applicable Algorithms.
| Business Model Phase | System-Level | Control Algorithm-Level | ||||||||
|---|---|---|---|---|---|---|---|---|---|---|
| Coordinated | Centralized | Mobility Aware | RES Integrated | Ancillary Services | Market Mechanisms | Environmental Value | Model-Based | Rule-Based | Learning-Based | |
| 1 | X | X | X | X | X | X | X | X | √ | X |
| √ | X | X | X | X | X | X | X | √ | X | |
| 2 | √ | X | X | √ | X | X | X | X | √ | X |
| √ | √ | √ | √ | X | X | X | √ | √ | X | |
| 3 | √ | √ | √ | √ | √ | X | X | √ | √ | X |
| √ | √ | √ | √ | √ | X | X | √ | √ | √ | |
| 4 | √ | √ | √ | √ | √ | √ | X | √ | X | √ |
| √ | √ | √ | √ | √ | √ | √ | √ | X | √ | |
Note: System-Level: “X” or “√” indicates the implementation of certain functions or algorithms under system scheduling and optimization techniques in each business model phase. Refers to the functions that can be implemented in system planning, such as: Coordinated: Ensuring synchronization between EVs, grid operations, and other resources. Centralized: Managing all EV decisions and operations from a central control point. Mobility Aware: Incorporating EV mobility patterns and user behavior into system planning. RES Integrated: Optimizing the integration of Renewable Energy Sources (RES) with V2G operations. Ancillary Services: Supporting grid stability through services like frequency regulation and load balancing. Market Mechanisms: Utilizing pricing strategies and dynamic market participation for economic optimization. Environmental Value: Promoting sustainability by leveraging V2G to reduce carbon emissions and enhance energy efficiency. Control Algorithm: Refers to the types of algorithms applied, including: Model-Based: Using mathematical models to simulate and optimize system operations. Rule-Based: Implementing predefined rules and thresholds for decision-making. Learning-Based: Employing machine learning and AI to adapt to dynamic environments and uncertainties. All information is based on independent synthesis by the authors’ team.
Table A4.
Incentive Policy Types, Mechanisms, and Potential Application Scenarios Across Business Model Phase.
Table A4.
Incentive Policy Types, Mechanisms, and Potential Application Scenarios Across Business Model Phase.
| Content | Description | Business Model Phase | |||
|---|---|---|---|---|---|
| P1 | P2 | P3 | P4 | ||
| Incentive Types | |||||
| Purchase Subsidy | Financial reimbursement provided to users, parking lot owners, or other stakeholders to offset the initial costs of purchasing electric vehicles (EVs) and installing compatible charging and discharging equipment. This subsidy aims to reduce the upfront investment barrier and encourage the adoption of V2G-compatible infrastructure | √ | √ | X | X |
| Tax Reduction | Tax incentives provided to various stakeholders to promote the adoption and development of EV and V2G technology. These include tax breaks for users purchasing or maintaining electric vehicles, tax reductions for corporations owning parking lots with V2G infrastructure, and tax incentives for companies involved in the EV industry, Vehicle Service Providers (VSP), and V2G technology and equipment manufacturing or deployment | X | √ | √ | X |
| Electricity Purchase | Subsidies provided to consumers for selling electricity back to the grid, modeled after mechanisms such as Feed-in Tariffs (FIT) or Feed-in Premiums (FIP). These subsidies incentivize users to participate in V2G programs by offering financial compensation for the electricity discharged from their EVs, ensuring a profitable return for their contribution to grid stability and energy supply | X | √ | √ | √ |
| Electricity Price Incentive | Discounts on electricity costs for EV charging offered to customers participating in V2G programs. This may include preferential charging rates during off-peak hours or special incentive tariffs applied at the point of sale, designed to encourage user engagement and optimize grid efficiency by aligning charging behavior with grid demand | √ | X | X | X |
| Service Subsidy | Special incentives provided to users for utilizing services related to V2G participation, such as discounts or reimbursements for parking fees at public parking lots equipped with V2G-compatible infrastructure. These subsidies may also include priority access to charging stations, reduced membership fees for V2G-related platforms, or other service-based benefits designed to enhance user convenience and promote V2G adoption | √ | √ | √ | √ |
| Technical Assistance | Subsidies provided to enterprises involved in the development, production, or deployment of V2G-compatible technology and equipment. These subsidies aim to reduce the financial burden of innovation and infrastructure expansion, encouraging technological advancements and accelerating the adoption of V2G systems | √ | √ | X | X |
| Incentive Mechanisms | |||||
| One-Time Subsidy | A flat-rate financial incentive provided as a one-time payment upon the occurrence of a specific event, such as the purchase of an EV, installation of V2G-compatible charging equipment, or the initial enrollment in a V2G program. | √ | √ | X | X |
| Phased Subsidy | A subsidy mechanism where the amount of financial support changes over defined time periods or based on specific milestones, such as increasing V2G penetration levels, technological advancements, or market maturity. This approach allows for gradual adjustment of incentives to align with market development and policy goals, ensuring a sustainable transition as reliance on subsidies decreases over time | X | √ | √ | X |
| Price Difference Subsidy | A subsidy mechanism similar to the Feed-in Tariff (FIT) or Feed-in Premium (FIP) system, where the difference between the cost of electricity sold by participants and the prevailing market price is covered through financial support. This mechanism can also extend to subsidizing the purchase or installation of V2G-compatible infrastructure by offsetting the cost difference between standard and advanced systems, encouraging both energy contributions and technological adoption | X | √ | X | X |
| Dynamic Subsidy | A flexible subsidy mechanism where the amount of financial support fluctuates based on short-term changes in market conditions, such as supply and demand, grid capacity, or electricity prices. This approach ensures that subsidies are responsive to real-time market dynamics, incentivizing participants to adjust their behavior in alignment with grid needs and economic efficiency | X | X | √ | √ |
| Guaranteed Minimum Income Subsidy | A subsidy mechanism designed to ensure that participants, whether individuals or corporations, receive a baseline level of income over the long term. This approach aims to mitigate financial risks and prevent losses associated with market fluctuations or unforeseen circumstances, providing stability and encouraging sustained participation in V2G programs or related activities | X | X | X | √ |
Note: “X” or “√” indicates the possible application of a specific incentive type or mechanism in each business model phase. All information is based on independent synthesis by the authors’ team.
Table A5.
Technical and Standardization Regulations Established or Potentially Expandable in V2G.
Table A5.
Technical and Standardization Regulations Established or Potentially Expandable in V2G.
| Type | Standard and Version (Source Link) | Scope | Description |
|---|---|---|---|
| Charging and discharging equipment interface | CHAdeMO | North America and Japan | A DC fast-charging standard that supports bidirectional charging (V2G) |
| Combined Charging System (CCS) | China, Europe, and USA | A versatile charging standard that supports both AC and DC charging | |
| Charging and discharging topology | IEC 63110 | Worldwide | Focuses on the management of electric vehicle charging and discharging infrastructure |
| SAE J3072 | USA and Canada | Specifies requirements for interconnection of onboard EV inverters with the power grid | |
| IEC 61851 | Worldwide | Specifies general requirements for EV conductive charging systems | |
| Communication | ISO 15118 | Worldwide | Provides a protocol for communication between EVs and charging stations, supporting smart charging and V2G |
| OCPP 2.1 | Worldwide | An open protocol for managing communication between charging stations and back-end systems | |
| IEEE 2030.5 | Worldwide | A communication standard for smart energy applications, including demand response and DER integration | |
| IEC 61850 | Worldwide | A global standard for communication in smart grids and power utility automation | |
| OpenADR 2.0b/3.0.1 | Worldwide | An open standard for automated demand response, enabling communication between utilities and users | |
| SAE J2931/1-2023 | USA and Canada | Covers communication protocols between EVs and charging systems in North America | |
| SAE J2847/3-2023 and SAE J2836/3 | USA and Canada | Defines use cases and communication requirements for bidirectional charging, including V2G | |
| SAE J2953/1 | USA and Canada | Specifies interoperability and performance requirements for wireless charging | |
| SAE J2953/2 | USA and Canada | Extends the wireless charging interoperability standard to include advanced features | |
| Grid interconnection | IEEE 1547 | Worldwide | Provides standards for the interconnection of DERs with the electric power grid |
| EN 50549 | Europe | Specifies requirements for grid connection of distributed energy resources in Europe | |
| Privacy and cybersecurity | IEC 62443 | Worldwide | Defines security requirements for industrial automation and control systems |
| ISO/IEC 27001 | Worldwide | Specifies requirements for establishing and maintaining information security management systems | |
| Energy metering and settlement | MID (Measuring Instruments Directive) | Europe | A European directive regulating the accuracy and performance of energy measurement devices |
| ANSI C12 | USA and Canada | Sets standards for the accuracy and performance of electric meters in North America | |
| Device longevity and performance | IEC 62660 | Worldwide | Defines performance and testing requirements for lithium-ion batteries used in EVs |
| SAE J2954 | USA and Canada | Specifies wireless charging systems for EVs, including safety, performance, and interoperability |
Note: All information is summarized based on publicly available sources.
References
- van der Kam, M.J.; Meelen, A.A.H.; van Sark, W.G.J.H.M.; Alkemade, F. Diffusion of solar photovoltaic systems and electric vehicles among Dutch consumers: Implications for the energy transition. Energy Res. Soc. Sci. 2018, 46, 68–85. [Google Scholar] [CrossRef]
- Xu, L.; Feng, K.; Lin, N.; Perera, A.T.D.; Poor, H.V.; Xie, L.; Ji, C.; Sun, X.A.; Guo, Q.; O’Malley, M. Resilience of renewable power systems under climate risks. Nat. Rev. Electr. Eng. 2024, 1, 53–66. [Google Scholar] [CrossRef]
- Tuffour, J.P.; Ewing, R. Can battery electric vehicles meet sustainable energy demands? Systematically reviewing emissions, grid impacts, and coupling to renewable energy. Energy Res. Soc. Sci. 2024, 114, 103625. [Google Scholar] [CrossRef]
- Kempton, W.; Letendre, S.E. Electric vehicles as a new power source for electric utilities. Transp. Res. Part D Transp. Environ. 1997, 2, 157–175. [Google Scholar] [CrossRef]
- Shariff, S.M.; Iqbal, D.; Saad Alam, M.; Ahmad, F. A state of the art review of electric vehicle to grid (V2G) technology. IOP Conf. Ser. Mater. Sci. Eng. 2019, 561, 012103. [Google Scholar] [CrossRef]
- Letcher, M.; Britton, J. The role of electric vehicle-to-X in net zero energy systems: A comprehensive review. Energy Res. Soc. Sci. 2025, 122, 104021. [Google Scholar] [CrossRef]
- Gümrükcü, E.; Klemets, J.R.A.; Suul, J.A.; Ponci, F.; Monti, A. Decentralized energy management concept for urban charging hubs with multiple V2G aggregators. IEEE Trans. Transp. Electrif. 2022, 9, 2367–2381. [Google Scholar] [CrossRef]
- Bibak, B.; Tekiner-Moğulkoç, H. A comprehensive analysis of Vehicle to Grid (V2G) systems and scholarly literature on the application of such systems. Renew. Energy Focus 2021, 36, 1–20. [Google Scholar] [CrossRef]
- Sovacool, B.K.; Kester, J.; Noel, L.; Zarazua de Rubens, G. Actors, business models, and innovation activity systems for vehicle-to-grid (V2G) technology: A comprehensive review. Renew. Sustain. Energy Rev. 2020, 131, 109963. [Google Scholar] [CrossRef]
- Demuth, J.L.; Buberger, J.; Huber, A.; Behrens, E.; Kuder, M.; Weyh, T. Unveiling the power of data in bidirectional charging: A qualitative stakeholder approach exploring the potential and challenges of V2G. Green Energy Intell. Transp. 2024, 3, 100225. [Google Scholar] [CrossRef]
- Song, A.; Dan, Z.; Zheng, S.; Zhou, Y. An electricity-driven mobility circular economy with lifecycle carbon footprints for climate-adaptive carbon neutrality transformation. Nat. Commun. 2024, 15, 5905. [Google Scholar] [CrossRef] [PubMed]
- İnci, M.; Savrun, M.M.; Çelik, Ö. Integrating electric vehicles as virtual power plants: A comprehensive review on vehicle-to-grid (V2G) concepts, interface topologies, marketing and future prospects. J. Energy Storage 2022, 55, 105579. [Google Scholar] [CrossRef]
- Sharma, A.; Santanu, S. Review of power electronics in vehicle-to-grid systems. J. Energy Storage 2019, 21, 337–361. [Google Scholar] [CrossRef]
- Alsharif, A.; Tan, C.W.; Ayop, R.; Dobi, A.; Lau, K.Y. A comprehensive review of energy management strategy in Vehicle-to-Grid technology integrated with renewable energy sources. Sustain. Energy Technol. Assess. 2021, 47, 101439. [Google Scholar] [CrossRef]
- Upputuri, R.P.; Subudhi, B. A comprehensive review and performance evaluation of bidirectional charger topologies for V2G/G2V operations in EV applications. IEEE Trans. Transp. Electrif. 2023, 10, 583–595. [Google Scholar] [CrossRef]
- Habib, S.; Kamran, M.; Rashid, U. Impact analysis of vehicle-to-grid technology and charging strategies of electric vehicles on distribution networks—A review. J. Power Sources 2015, 277, 205–214. [Google Scholar] [CrossRef]
- Guo, J.; Yang, J.; Lin, Z.; Serrano, C.; Cortes, A.M. Impact analysis of V2G services on ev battery degradation—A review. In Proceedings of the 2019 IEEE Milan Power Tech, Milan, Italy, 23–27 June 2019; pp. 1–6. [Google Scholar]
- Sovacool, B.K.; Axsen, J.; Kempton, W. The future promise of vehicle-to-grid (V2G) integration: A sociotechnical review and research agenda. Annu. Rev. Environ. Resour. 2017, 42, 377–406. [Google Scholar] [CrossRef]
- Sovacool, B.K.; Noel, L.; Axsen, J.; Kempton, W. The neglected social dimensions to a vehicle-to-grid (V2G) transition: A critical and systematic review. Environ. Res. Lett. 2018, 13, 013001. [Google Scholar] [CrossRef]
- van Heuveln, K.; Ghotge, R.; Annema, J.A.; van Bergen, E.; van Wee, B.; Pesch, U. Factors influencing consumer acceptance of vehicle-to-grid by electric vehicle drivers in the Netherlands. Travel Behav. Soc. 2021, 24, 34–45. [Google Scholar] [CrossRef]
- Geske, J.; Diana, S. Willing to participate in vehicle-to-grid (V2G)? Why not! Energy Policy 2018, 120, 392–401. [Google Scholar] [CrossRef]
- Snyder, H. Literature review as a research methodology: An overview and guidelines. J. Bus. Res. 2019, 104, 333–339. [Google Scholar] [CrossRef]
- Gough, D. Meta-narrative and realist reviews: Guidance, rules, publication standards and quality appraisal. BMC Med. 2013, 11, 22. [Google Scholar] [CrossRef] [PubMed]
- King, S.; Locock, K.E. A circular economy framework for plastics: A semi-systematic review. J. Clean. Prod. 2022, 364, 132503. [Google Scholar] [CrossRef]
- Spake, R.; Bellamy, C.; Graham, L.J.; Watts, K.; Wilson, T.; Norton, L.R.; Wood, C.M.; Schmucki, R.; Bullock, J.M.; Eigenbrod, F. An analytical framework for spatially targeted management of natural capital. Nat. Sustain. 2019, 2, 90–97. [Google Scholar] [CrossRef]
- Abronzini, U.; Attaianese, C.; D’Arpino, M.; Di Monaco, M.; Tomasso, G. Cost minimization energy control including battery aging for multi-source EV charging station. Electronics 2019, 8, 31. [Google Scholar] [CrossRef]
- Ahmadian, A.; Sedghi, M.; Mohammadi-Ivatloo, B.; Elkamel, A.; Golkar, M.A.; Fowler, M. Cost-benefit analysis of V2G implementation in distribution networks considering PEVs battery degradation. IEEE Trans. Sustain. Energy 2017, 9, 961–970. [Google Scholar] [CrossRef]
- Al-Awami, A.T.; Sortomme, E. Coordinating vehicle-to-grid services with energy trading. IEEE Trans. Smart Grid 2011, 3, 453–462. [Google Scholar] [CrossRef]
- Al-Obaidi, A.A.; Farag, H.E.Z. Optimal design of V2G incentives and V2G-capable electric vehicles parking lots considering cost-benefit financial analysis and user participation. IEEE Trans. Sustain. Energy 2023, 15, 454–465. [Google Scholar] [CrossRef]
- Amamra, S.-A.; Marco, J. Vehicle-to-grid aggregator to support power grid and reduce electric vehicle charging cost. IEEE Access 2019, 7, 178528–178538. [Google Scholar] [CrossRef]
- Arias, N.B.; Hashemi, S.; Andersen, P.B.; Træholt, C.; Romero, R. Assessment of economic benefits for EV owners participating in the primary frequency regulation markets. Int. J. Electr. Power Energy Syst. 2020, 120, 105985. [Google Scholar] [CrossRef]
- Arslan, O.; Oya, E.K. Cost and emission impacts of virtual power plant formation in plug-in hybrid electric vehicle penetrated networks. Energy 2013, 60, 116–124. [Google Scholar] [CrossRef]
- Augello, A.; Gallo, P.; Sanseverino, E.R.; Sciabica, G.; Sciumè, G. Certifying battery usage for V2G and second life with a blockchain-based framework. Comput. Netw. 2023, 222, 109558. [Google Scholar] [CrossRef]
- Bahmani, M.H.; Shayan, M.E.; Mishra, D.K. Quantifying the impact of electricity pricing on electric vehicle user behavior: A V2G perspective for smart grid development. Energy Sources Part A Recovery Util. Environ. Eff. 2024, 46, 4524–4542. [Google Scholar] [CrossRef]
- Bashash, S.; Hosam, K.F. Cost-optimal charging of plug-in hybrid electric vehicles under time-varying electricity price signals. IEEE Trans. Intell. Transp. Syst. 2014, 15, 1958–1968. [Google Scholar] [CrossRef]
- Beyazıt, M.A.; Taşcıkaraoğlu, A.; Catalão, J.P. Cost optimization of a microgrid considering vehicle-to-grid technology and demand response. Sustain. Energy Grids Netw. 2022, 32, 100924. [Google Scholar] [CrossRef]
- Bhoir, S.; Caliandro, P.; Brivio, C. Impact of V2G service provision on battery life. J. Energy Storage 2021, 44, 103178. [Google Scholar] [CrossRef]
- Blasuttigh, N.; Pastore, S.; Scorrano, M.; Danielis, R.; Massi Pavan, A. Vehicle-to-ski: A V2G optimization-based cost and environmental analysis for a ski resort. Sustain. Energy Technol. Assess. 2023, 55, 102916. [Google Scholar] [CrossRef]
- Bortotti, M.F.; Rigolin, P.; Udaeta, M.E.M.; Grimoni, J.A.B. Comprehensive energy analysis of vehicle-to-grid (V2G) integration with the power grid: A systemic approach incorporating integrated resource planning methodology. Appl. Sci. 2023, 13, 11119. [Google Scholar] [CrossRef]
- Brinkel, N.; Zijlstra, M.; van Bezu, R.; van Twuijver, T.; Lampropoulos, I.; van Sark, W. A comparative analysis of charging strategies for battery electric buses in wholesale electricity and ancillary services markets. Transp. Res. Part E Logist. Transp. Rev. 2023, 172, 103085. [Google Scholar] [CrossRef]
- Caggiani, L.; Prencipe, L.P.; Ottomanelli, M. A static relocation strategy for electric car-sharing systems in a vehicle-to-grid framework. Transp. Lett. 2021, 13, 219–228. [Google Scholar] [CrossRef]
- Cao, Y.; Li, D.; Zhang, Y.; Chen, X. Joint optimization of delay-tolerant autonomous electric vehicles charge scheduling and station battery degradation. IEEE Internet Things J. 2020, 7, 8590–8599. [Google Scholar] [CrossRef]
- Chen, P.; Han, L.; Xin, G.; Zhang, A.; Ren, H.; Wang, F. Game theory based optimal pricing strategy for V2G participating in demand response. IEEE Trans. Ind. Appl. 2023, 59, 4673–4683. [Google Scholar] [CrossRef]
- Datta, U.; Saiprasad, N.; Kalam, A.; Shi, J.; Zayegh, A. A price—regulated electric vehicle charge—discharge strategy for G2V, V2H, and V2G. Int. J. Energy Res. 2019, 43, 1032–1042. [Google Scholar] [CrossRef]
- Dawn, S.; Rao, G.S.; Vital, M.L.N.; Rao, K.D.; Alsaif, F.; Alsharif, M.H. Profit Extension of a Wind-Integrated Competitive Power System by Vehicle-to-Grid Integration and UPFC Placement. Energies 2023, 16, 6730. [Google Scholar] [CrossRef]
- Elkholy, M.H.; Said, T.; Elymany, M.M.; Senjyu, T.; Gamil, M.M.; Song, D.; Ueda, S.; Lotfy, M.E. Techno-economic configuration of a hybrid backup system within a microgrid considering vehicle-to-grid technology: A case study of a remote area. Energy Convers. Manag. 2024, 301, 118032. [Google Scholar] [CrossRef]
- Farzin, H.; Mehdi, M. Reliability enhancement of active distribution grids via emergency V2G programs: An analytical cost/worth evaluation framework. Sci. Iran. 2019, 26, 3635–3645. [Google Scholar] [CrossRef]
- Fernandes, C.; Frías, P.; Latorre, J.M. Impact of vehicle-to-grid on power system operation costs: The Spanish case study. Appl. Energy 2012, 96, 194–202. [Google Scholar] [CrossRef]
- Gandhi, H.A.; Andrew, D.W. City-wide modeling of vehicle-to-grid economics to understand effects of battery performance. ACS Sustain. Chem. Eng. 2021, 9, 14975–14985. [Google Scholar] [CrossRef]
- Geng, J.; Bai, B.; Hao, H.; Sun, X.; Liu, M.; Liu, Z.; Zhao, F. Assessment of vehicle-side costs and profits of providing vehicle-to-grid services. eTransportation 2024, 19, 100303. [Google Scholar] [CrossRef]
- Ghofrani, M.; Arabali, A.; Etezadi-Amoli, M.; Fadali, M.S. Smart scheduling and cost-benefit analysis of grid-enabled electric vehicles for wind power integration. IEEE Trans. Smart Grid 2014, 5, 2306–2313. [Google Scholar] [CrossRef]
- Ghosh, A.; Vaneet, A. Menu-based pricing for charging of electric vehicles with vehicle-to-grid service. IEEE Trans. Veh. Technol. 2018, 67, 10268–10280. [Google Scholar] [CrossRef]
- Ginigeme, K.; Wang, Z. Distributed optimal vehicle-to-grid approaches with consideration of battery degradation cost under real-time pricing. IEEE Access 2020, 8, 5225–5235. [Google Scholar] [CrossRef]
- Giordano, F.; Diaz-Londono, C.; Gruosso, G. Comprehensive aggregator methodology for evs in v2g operations and electricity markets. IEEE Open J. Veh. Technol. 2023, 4, 809–819. [Google Scholar] [CrossRef]
- Golla, N.K.; Dharavat, N.; Sudabattula, S.K.; Velamuri, S.; Kantipudi, M.V.V.P.; Kotb, H.; Shouran, M.; Alenezi, M. Techno-economic analysis of the distribution system with integration of distributed generators and electric vehicles. Front. Energy Res. 2023, 11, 1221901. [Google Scholar] [CrossRef]
- Goncearuc, A.; Sapountzoglou, N.; De Cauwer, C.; Coosemans, T.; Messagie, M.; Crispeels, T. Profitability evaluation of vehicle-to-grid-enabled frequency containment reserve services into the business models of the core participants of electric vehicle charging business ecosystem. World Electr. Veh. J. 2023, 14, 18. [Google Scholar] [CrossRef]
- Greaker, M.; Hagem, C.; Proost, S. An economic model of vehicle-to-grid: Impacts on the electricity market and consumer cost of electric vehicles. Resour. Energy Econ. 2022, 69, 101310. [Google Scholar] [CrossRef]
- Gu, Y.; Liu, M. Fair and privacy-aware EV discharging strategy using decentralized whale optimization algorithm for minimizing cost of EVs and the EV aggregator. IEEE Syst. J. 2021, 15, 5571–5582. [Google Scholar] [CrossRef]
- Habib, H.U.R.; Subramaniam, U.; Waqar, A.; Farhan, B.S.; Kotb, K.M.; Wang, S. Energy cost optimization of hybrid renewables based V2G microgrid considering multi objective function by using artificial bee colony optimization. IEEE Access 2020, 8, 62076–62093. [Google Scholar] [CrossRef]
- Han, S.; Han, S. Economic feasibility of V2G frequency regulation in consideration of battery wear. Energies 2013, 6, 748–765. [Google Scholar] [CrossRef]
- Hanemann, P.; Bruckner, T. Effects of electric vehicles on the spot market price. Energy 2018, 162, 255–266. [Google Scholar] [CrossRef]
- Harnischmacher, C.; Markefke, L.; Brendel, A.B.; Kolbe, L. Two-sided sustainability: Simulating battery degradation in vehicle to grid applications within autonomous electric port transportation. J. Clean. Prod. 2023, 384, 135598. [Google Scholar] [CrossRef]
- He, Y.; Zhou, Y.; Wang, Z.; Zhang, G. Quantification on fuel cell degradation and techno-economic analysis of a hydrogen-based grid-interactive residential energy sharing network with fuel-cell-powered vehicles. Appl. Energy 2021, 303, 117444. [Google Scholar] [CrossRef]
- Hemmati, R.; Hasan, M. Investment deferral by optimal utilizing vehicle to grid in solar powered active distribution networks. J. Energy Storage 2020, 30, 101512. [Google Scholar] [CrossRef]
- Huang, S.; Liu, W.; Zhang, J.; Liu, C.; Sun, H.; Liao, Q. Vehicle-to-grid workplace discharging economics as a function of driving distance and type of electric vehicle. Sustain. Energy Grids Netw. 2022, 31, 100779. [Google Scholar] [CrossRef]
- Huang, Z.; Guo, Z.; Ma, P.; Wang, M.; Long, Y.; Zhang, M. Economic-environmental scheduling of microgrid considering V2G-enabled electric vehicles integration. Sustain. Energy Grids Netw. 2022, 32, 100872. [Google Scholar] [CrossRef]
- Huber, D.; De Clerck, Q.; De Cauwer, C.; Sapountzoglou, N.; Coosemans, T.; Messagie, M. Vehicle to grid impacts on the total cost of ownership for electric vehicle drivers. World Electr. Veh. J. 2021, 12, 236. [Google Scholar] [CrossRef]
- Huang, S.; Liu, W.; Zhang, J.; Liu, C.; Sun, H.; Liao, Q. Techno economic analysis of vehicle to grid (V2G) integration as distributed energy resources in Indonesia power system. Energies 2020, 13, 1162. [Google Scholar] [CrossRef]
- Hutty, T.D.; Pena-Bello, A.; Dong, S.; Parra, D.; Rothman, R.; Brown, S. Peer-to-peer electricity trading as an enabler of increased PV and EV ownership. Energy Convers. Manag. 2021, 245, 114634. [Google Scholar] [CrossRef]
- Karapidakis, E.; Konstantinidis, G.; Vidakis, N.; Yfanti, S. Economic Assessment of Photovoltaics Sizing on a Sports Center’s Microgrid Equipped with PEV Chargers. Appl. Syst. Innov. 2022, 5, 78. [Google Scholar] [CrossRef]
- Kiaee, M.; Cruden, A.; Sharkh, S. Estimation of cost savings from participation of electric vehicles in vehicle to grid (V2G) schemes. J. Mod. Power Syst. Clean Energy 2015, 3, 249–258. [Google Scholar] [CrossRef]
- Kim, J.; Kim, J.; Jeong, H. Key parameters for economic valuation of V2G applied to ancillary service: Data-driven approach. Energies 2022, 15, 8815. [Google Scholar] [CrossRef]
- Kim, K.; Choi, Y.; Kim, H. Data-driven battery degradation model leveraging average degradation function fitting. Electron. Lett. 2017, 53, 102–104. [Google Scholar] [CrossRef]
- Kolawole, O.; Al-Anbagi, I. Electric vehicles battery wear cost optimization for frequency regulation support. IEEE Access 2019, 7, 130388–130398. [Google Scholar] [CrossRef]
- Koubaa, R.; Yoldas, Y.; Goren, S.; Krichen, L.; Onen, A. Implementation of cost benefit analysis of vehicle to grid coupled real Micro-Grid by considering battery energy wear: Practical study case. Energy Environ. 2021, 32, 1292–1314. [Google Scholar] [CrossRef]
- Lee, C.-Y.; Jang, J.-W.; Lee, M.-K. Willingness to accept values for vehicle-to-grid service in South Korea. Transp. Res. Part D Transp. Environ. 2020, 87, 102487. [Google Scholar] [CrossRef]
- Christos, T.; Tziotas, E.E.; Pompodakis, G.I.; Orfanoudakis, G.I. Techno-Economic Feasibility of Fuel Cell Vehicle-to-Grid Fast Frequency Control in Non-Interconnected Islands. Hydrogen 2024, 6, 1. [Google Scholar] [CrossRef]
- Li, J.; Li, A. Optimizing electric vehicle integration with vehicle-to-grid technology: The influence of price difference and battery costs on adoption, profits, and green energy utilization. Sustainability 2024, 16, 1118. [Google Scholar] [CrossRef]
- Li, R.; Ren, H.; Wu, Q.; Li, Q.; Gao, W. Cooperative economic dispatch of EV-HV coupled electric-hydrogen integrated energy system considering V2G response and carbon trading. Renew. Energy 2024, 227, 120488. [Google Scholar] [CrossRef]
- Li, X.; Tan, Y.; Liu, X.; Liao, Q.; Sun, B.; Cao, G.; Li, C.; Yang, X.; Wang, Z. A cost-benefit analysis of V2G electric vehicles supporting peak shaving in Shanghai. Electr. Power Syst. Res. 2020, 179, 106058. [Google Scholar] [CrossRef]
- Li, Z.; Jiang, Y.; Zhang, X.; Tian, W. Market-based optimal control of plug-in hybrid electric vehicle fleets and economic analysis. J. Energy Eng. 2016, 142, 04015025. [Google Scholar] [CrossRef]
- Liang, H.; Liu, Y.; Li, F.; Shen, Y. Dynamic economic/emission dispatch including PEVs for peak shaving and valley filling. IEEE Trans. Ind. Electron. 2018, 66, 2880–2890. [Google Scholar] [CrossRef]
- Lim, J.; Lee, S.-E.; Park, K.-Y.; Kim, H.-S.; Choi, J.-H. VxG pattern-based analysis and battery deterioration diagnosis. Energies 2021, 14, 5422. [Google Scholar] [CrossRef]
- Liu, J.; Zhong, C. An economic evaluation of the coordination between electric vehicle storage and distributed renewable energy. Energy 2019, 186, 115821. [Google Scholar] [CrossRef]
- Lotfi, S.; Sedighizadeh, M.; Abbasi, R.; Hosseinian, S.H. Vehicle-to-grid bidding for regulation and spinning reserve markets: A robust optimal coordinated charging approach. Energy Rep. 2024, 11, 925–936. [Google Scholar] [CrossRef]
- Lyu, X.; Liu, T.; Liu, X.; He, C.; Nan, L.; Zeng, H. Low-carbon robust economic dispatch of park-level integrated energy system considering price-based demand response and vehicle-to-grid. Energy 2023, 263, 125739. [Google Scholar] [CrossRef]
- Ma, T.; Mohammed, O. Economic analysis of real-time large-scale PEVs network power flow control algorithm with the consideration of V2G services. IEEE Trans. Ind. Appl. 2014, 50, 4272–4280. [Google Scholar] [CrossRef]
- Manzolli, J.A.; Trovão, J.P.F.; Antunes, C.H. Electric bus coordinated charging strategy considering V2G and battery degradation. Energy 2022, 254, 124252. [Google Scholar] [CrossRef]
- Marongiu, A.; Roscher, M.; Sauer, D.U. Influence of the vehicle-to-grid strategy on the aging behavior of lithium battery electric vehicles. Appl. Energy 2015, 137, 899–912. [Google Scholar] [CrossRef]
- Mehdizadeh, M.; Nordfjaern, T.; Klöckner, C.A. Estimating financial compensation and minimum guaranteed charge for vehicle-to-grid technology. Energy Policy 2023, 180, 113649. [Google Scholar] [CrossRef]
- Menniti, D.; Pinnarelli, A.; Sorrentino, N.; Vizza, P.; Brusco, G.; Barone, G.; Marano, G. Techno economic analysis of electric vehicle grid integration aimed to provide network flexibility services in Italian regulatory framework. Energies 2022, 15, 2355. [Google Scholar] [CrossRef]
- Mercan, M.C.; Kayalica, M.Ö.; Kayakutlu, G.; Ercan, S. Economic model for an electric vehicle charging station with vehicle-to-grid functionality. Int. J. Energy Res. 2020, 44, 6697–6708. [Google Scholar] [CrossRef]
- Miglani, A.; Kumar, N. A blockchain based matching game for content sharing in content-centric vehicle-to-grid network scenarios. IEEE Trans. Intell. Transp. Syst. 2024, 25, 4032–4048. [Google Scholar] [CrossRef]
- Mortaz, E.; Alexander, V.; Yury, D. An optimization model for siting and sizing of vehicle-to-grid facilities in a microgrid. Appl. Energy 2019, 242, 1649–1660. [Google Scholar] [CrossRef]
- Mullan, J.; Harries, D.; Bräunl, T.; Whitely, S. The technical, economic and commercial viability of the vehicle-to-grid concept. Energy Policy 2012, 48, 394–406. [Google Scholar] [CrossRef]
- Nagel, N.O.; Jåstad, E.O.; Martinsen, T. The grid benefits of vehicle-to-grid in Norway and Denmark: An analysis of home-and public parking potentials. Energy 2024, 293, 130729. [Google Scholar] [CrossRef]
- Noel, L.; Zarazua de Rubens, G.; Kester, J.; Sovacool, B.K. Beyond emissions and economics: Rethinking the co-benefits of electric vehicles (EVs) and vehicle-to-grid (V2G). Transp. Policy 2018, 71, 130–137. [Google Scholar] [CrossRef]
- Noel, L.; McCormack, R. A cost benefit analysis of a V2G-capable electric school bus compared to a traditional diesel school bus. Appl. Energy 2014, 126, 246–255. [Google Scholar] [CrossRef]
- Onishi, V.C.; Antunes, C.H.; Trovão, J.P.F. Optimal energy and reserve market management in renewable microgrid-PEVs parking lot systems: V2G, demand response and sustainability costs. Energies 2020, 13, 1884. [Google Scholar] [CrossRef]
- Parsons, G.R.; Hidrue, M.K.; Kempton, W.; Gardner, M.P. Willingness to pay for vehicle-to-grid (V2G) electric vehicles and their contract terms. Energy Econ. 2014, 42, 313–324. [Google Scholar] [CrossRef]
- Peng, C.; Zou, J.; Lian, L.; Li, L. An optimal dispatching strategy for V2G aggregator participating in supplementary frequency regulation considering EV driving demand and aggregator’s benefits. Appl. Energy 2017, 190, 591–599. [Google Scholar] [CrossRef]
- Peng, C.; Niu, Y. Optimal serving strategy for vehicle-to-grid business: Service agreement, energy reserve estimation, and profit maximization. Front. Energy Res. 2023, 11, 1199442. [Google Scholar] [CrossRef]
- Philip, T.; Whitehead, J.; Prato, C.G. Adoption of electric vehicles in a laggard, car-dependent nation: Investigating the potential influence of V2G and broader energy benefits on adoption. Transp. Res. Part A Policy Pract. 2023, 167, 103555. [Google Scholar] [CrossRef]
- Qi, J.; Li, L. Economic operation strategy of an EV parking lot with vehicle-to-grid and renewable energy integration. Energies 2023, 16, 1793. [Google Scholar] [CrossRef]
- Quinn, C.; Zimmerle, D.; Bradley, T.H. Bradley. An evaluation of state-of-charge limitations and actuation signal energy content on plug-in hybrid electric vehicle, vehicle-to-grid reliability, and economics. IEEE Trans. Smart Grid 2012, 3, 483–491. [Google Scholar] [CrossRef]
- Rahman, M.; Gemechu, E.; Oni, A.O.; Kumar, A. The development of a techno-economic model for assessment of cost of energy storage for vehicle-to-grid applications in a cold climate. Energy 2023, 262, 125398. [Google Scholar] [CrossRef]
- Rodríguez-Molina, J.; Castillejo, P.; Beltrán, V.; Martínez-Núñez, M. A model for cost–benefit analysis of privately owned vehicle-to-grid solutions. Energies 2020, 13, 5814. [Google Scholar] [CrossRef]
- Samadi, M.; Javad, F. Effective self-committed V2G for residential complexes. Sustain. Energy Grids Netw. 2023, 35, 101114. [Google Scholar] [CrossRef]
- Sarparandeh, M.H.; Mehdi, E. Pricing of Vehicle-to-Grid Services in a Microgrid by Nash Bargaining Theory. Math. Probl. Eng. 2017, 2017, 1840140. [Google Scholar] [CrossRef]
- Schetinger, A.M.; Dias, D.H.N.; Borba, B.; Silva, G.D.P. Techno-economic feasibility study on electric vehicle and renewable energy integration: A case study. Energy Storage 2020, 2, e197. [Google Scholar] [CrossRef]
- Schuller, A.; Dietz, B.; Flath, C.M.; Weinhardt, C. Charging strategies for battery electric vehicles: Economic benchmark and V2G potential. IEEE Trans. Power Syst. 2014, 29, 2014–2022. [Google Scholar] [CrossRef]
- Shaheen, H.I.; Rashed, G.I.; Yang, B.; Yang, J. Optimal electric vehicle charging and discharging scheduling using metaheuristic algorithms: V2G approach for cost reduction and grid support. J. Energy Storage 2024, 90, 111816. [Google Scholar] [CrossRef]
- Shi, L.; Guo, M. An economic evaluation of electric vehicles balancing grid load fluctuation, new perspective on electrochemical energy storage alternative. J. Energy Storage 2023, 68, 107801. [Google Scholar] [CrossRef]
- Shirazi, Y.; Carr, E.; Knapp, L. A cost-benefit analysis of alternatively fueled buses with special considerations for V2G technology. Energy Policy 2015, 87, 591–603. [Google Scholar] [CrossRef]
- Wu, W.; Lin, B. Benefits of electric vehicles integrating into power grid. Energy 2021, 224, 120108. [Google Scholar] [CrossRef]
- Signer, T.; Sandmeier, T.; Fichtner, W. Modeling V2G spot market trading: The impact of charging tariffs on economic viability. Energy Policy 2024, 189, 114109. [Google Scholar] [CrossRef]
- Singh, J.; Tiwari, R. Cost benefit analysis for V2G implementation of electric vehicles in distribution system. IEEE Trans. Ind. Appl. 2020, 56, 5963–5973. [Google Scholar] [CrossRef]
- Singh, K.; Singh, A. Behavioural modelling for personal and societal benefits of V2G/V2H integration on EV adoption. Appl. Energy 2022, 319, 119265. [Google Scholar] [CrossRef]
- Sovacool, B.K.; Kester, J.; Noel, L.; de Rubens, G.Z. Income, political affiliation, urbanism and geography in stated preferences for electric vehicles (EVs) and vehicle-to-grid (V2G) technologies in Northern Europe. J. Transp. Geogr. 2019, 78, 214–229. [Google Scholar] [CrossRef]
- Su, X.; Yue, H.; Chen, X. Cost minimization control for electric vehicle car parks with vehicle to grid technology. Syst. Sci. Control Eng. 2020, 8, 422–433. [Google Scholar] [CrossRef]
- Taljegard, M.; Walter, V.; Göransson, L.; Odenberger, M.; Johnsson, F. Impact of electric vehicles on the cost-competitiveness of generation and storage technologies in the electricity system. Environ. Res. Lett. 2019, 14, 124087. [Google Scholar] [CrossRef]
- Tamura, S. A V2G strategy to increase the cost-benefit of primary frequency regulation considering EV battery degradation. Electr. Eng. Jpn. 2020, 212, 11–22. [Google Scholar] [CrossRef]
- Tchagang, A.; Yoo, Y. V2B/V2G on energy cost and battery degradation under different driving scenarios, peak shaving, and frequency regulations. World Electr. Veh. J. 2020, 11, 14. [Google Scholar] [CrossRef]
- Thakur, J.; de Almeida, C.M.L.; Baskar, A.G. Electric vehicle batteries for a circular economy: Second life batteries as residential stationary storage. J. Clean. Prod. 2022, 375, 134066. [Google Scholar] [CrossRef]
- Thingvad, A.; Calearo, L.; Andersen, P.B.; Marinelli, M. Empirical capacity measurements of electric vehicles subject to battery degradation from V2G services. IEEE Trans. Veh. Technol. 2021, 70, 7547–7557. [Google Scholar] [CrossRef]
- Tian, X.; Cheng, B.; Liu, H. V2G optimized power control strategy based on time-of-use electricity price and comprehensive load cost. Energy Rep. 2023, 10, 1467–1473. [Google Scholar] [CrossRef]
- Tirunagari, S.; Gu, M.; Meegahapola, L. Reaping the benefits of smart electric vehicle charging and vehicle-to-grid technologies: Regulatory, policy and technical aspects. IEEE Access 2022, 10, 114657–114672. [Google Scholar] [CrossRef]
- Türkoğlu, A.S.; Güldorum, H.C.; Sengor, I.; Çiçek, A.; Erdinç, O.; Hayes, B.P. Maximizing EV profit and grid stability through virtual power plant considering V2G. Energy Rep. 2024, 11, 3509–3520. [Google Scholar] [CrossRef]
- Villante, C.; Ranieri, S.; Duronio, F.; De Vita, A.; Anatone, M. An energy-based assessment of expected benefits for V2H charging systems through a dedicated dynamic simulation and optimization tool. World Electr. Veh. J. 2022, 13, 99. [Google Scholar] [CrossRef]
- Visakh, A.; Selvan, M.P. Feasibility assessment of utilizing electric vehicles for energy arbitrage in smart grids considering battery degradation cost. Energy Sources Part A Recovery Util. Environ. Eff. 2022, 44, 4664–4678. [Google Scholar] [CrossRef]
- Visakh, A.; Parvathy, S.M. Energy-cost minimization with dynamic smart charging of electric vehicles and the analysis of its impact on distribution-system operation. Electr. Eng. 2022, 104, 2805–2817. [Google Scholar] [CrossRef]
- Wang, J.; Wu, Z.; Du, E.; Zhou, M.; Li, G.; Zhang, Y.; Yu, L. Constructing a V2G-enabled regional energy internet for cost-efficient carbon trading. CSEE J. Power Energy Syst. 2020, 6, 31–40. [Google Scholar]
- Wang, M.; Craig, M.T. The value of vehicle-to-grid in a decarbonizing California grid. J. Power Sources 2021, 513, 230472. [Google Scholar] [CrossRef]
- Wang, X.; Wei, J.; Wen, F.; Wang, K. A trading mode based on the management of residual electric energy in electric vehicles. Energies 2023, 16, 6317. [Google Scholar] [CrossRef]
- Wen, S.; Lin, N.; Huang, S.; Wang, Z.; Zhang, Z. Lithium battery health state assessment based on vehicle-to-grid (V2G) real-world data and natural gradient boosting model. Energy 2023, 284, 129246. [Google Scholar] [CrossRef]
- Wolinetz, M.; Axsen, J.; Peters, J.; Crawford, C. Simulating the value of electric-vehicle-grid integration using a behaviourally realistic model. Nat. Energy 2018, 3, 132–139. [Google Scholar] [CrossRef]
- Yang, W.; Zhu, X.; Xiao, Q.; Yang, Z. Enhanced multi-objective marine predator algorithm for dynamic economic-grid fluctuation dispatch with plug-in electric vehicles. Energy 2023, 282, 128901. [Google Scholar] [CrossRef]
- Yao, X.; Fan, Y.; Zhao, F.; Ma, S.C. Economic and climate benefits of vehicle-to-grid for low-carbon transitions of power systems: A case study of China’s 2030 renewable energy target. J. Clean. Prod. 2022, 330, 129833. [Google Scholar] [CrossRef]
- Ye, B.; Xie, M.; Yu, Z.; Lu, Z.; Yan, D.; Su, B.; Wang, P.; Jiang, J. Technical and economic study of renewable-energy-powered system for a newly constructed city in China. Energy Rep. 2024, 11, 5069–5082. [Google Scholar] [CrossRef]
- Yoshioka, N.; Asano, H.; Bando, S. Economic evaluation of charging/discharging control of electric vehicles as system flexibility considering control participation rate. Electr. Eng. Jpn. 2020, 211, 15–25. [Google Scholar] [CrossRef]
- Yu, B.; Lei, X.; Shao, Z.; Jian, L. V2G Carbon Accounting and Revenue Allocation: Balancing EV Contributions in Distribution Systems. Electronics 2024, 13, 1063. [Google Scholar] [CrossRef]
- Yu, H.; Tu, J.; Lei, X.; Shao, Z.; Jian, L. A cost-effective and high-efficient EV shared fast charging scheme with hierarchical coordinated operation strategy for addressing difficult-to-charge issue in old residential communities. Sustain. Cities Soc. 2024, 101, 105090. [Google Scholar] [CrossRef]
- Zagrajek, K.; Paska, J.; Sosnowski, Ł.; Gobosz, K.; Wróblewski, K. Framework for the introduction of vehicle-to-grid technology into the polish electricity market. Energies 2021, 14, 3673. [Google Scholar] [CrossRef]
- Zeng, B.; Luo, Y.; Liu, Y. Quantifying the contribution of EV battery swapping stations to the economic and reliability performance of future distribution system. Int. J. Electr. Power Energy Syst. 2022, 136, 107675. [Google Scholar] [CrossRef]
- Zeng, X.; Nazir, M.S.; Khaksar, M.; Nishihara, K.; Tao, H. A day-ahead economic scheduling of microgrids equipped with plug-in hybrid electric vehicles using modified shuffled frog leaping algorithm. J. Energy Storage 2021, 33, 102021. [Google Scholar] [CrossRef]
- Zhang, G.; Liu, H.; Xie, T.; Li, H.; Zhang, K.; Wang, R. Research on the dispatching of electric vehicles participating in vehicle-to-grid interaction: Considering grid stability and user benefits. Energies 2024, 17, 812. [Google Scholar] [CrossRef]
- Zhang, H.; Liu, Y.; Li, J.; Yu, H.; Xu, H.; Ma, K.; Liang, Y.; An, X.; Hu, X. Influence Factors of the V2G Economic Benefits of Pure Electric Logistics Vehicles: A Case Study in Chengdu. Int. J. Automot. Technol. 2023, 24, 1411–1422. [Google Scholar] [CrossRef]
- Zhang, P.; Chen, N.; Kumar, N.; Abualigah, L.; Guizani, M.; Duan, Y.; Wang, J.; Wu, S. Energy allocation for vehicle-to-grid settings: A low-cost proposal combining DRL and VNE. IEEE Trans. Sustain. Comput. 2023, 9, 75–87. [Google Scholar] [CrossRef]
- Zhang, X.; Rao, R. A benefit analysis of electric vehicle battery swapping and leasing modes in China. Emerg. Mark. Financ. Trade 2016, 52, 1414–1426. [Google Scholar] [CrossRef]
- Zhang, Y.; Lu, M.; Shen, S. On the values of vehicle-to-grid electricity selling in electric vehicle sharing. Manuf. Serv. Oper. Manag. 2021, 23, 488–507. [Google Scholar]
- Zhao, Y.; Noori, M.; Tatari, O. Vehicle to Grid regulation services of electric delivery trucks: Economic and environmental benefit analysis. Appl. Energy 2016, 170, 161–175. [Google Scholar] [CrossRef]
- Zheng, Y.; Shao, Z.; Shang, Y.; Jian, L. Modeling the temporal and economic feasibility of electric vehicles providing vehicle-to-grid services in the electricity market under different charging scenarios. J. Energy Storage 2023, 68, 107579. [Google Scholar] [CrossRef]
- Zheng, Y.; Shao, Z.; Lei, X.; Shi, Y.; Jian, L. The economic analysis of electric vehicle aggregators participating in energy and regulation markets considering battery degradation. J. Energy Storage 2022, 45, 103770. [Google Scholar] [CrossRef]
- Zhong, Q.; Buckley, S.; Vassallo, A.; Sun, Y. Energy cost minimization through optimization of EV, home and workplace battery storage. Sci. China Technol. Sci. 2018, 61, 761–773. [Google Scholar] [CrossRef]
- Zhou, C.; Qian, K.; Allan, M.; Zhou, W. Modeling of the cost of EV battery wear due to V2G application in power systems. IEEE Trans. Energy Convers. 2011, 26, 1041–1050. [Google Scholar] [CrossRef]
- Zhou, C.; Xiang, Y.; Huang, Y.; Wei, X.; Liu, Y.; Liu, J. Economic analysis of auxiliary service by V2G: City comparison cases. Energy Rep. 2020, 6, 509–514. [Google Scholar] [CrossRef]
- Zhou, G.; Zhao, Y.; Lai, C.S.; Jia, Y. A profitability assessment of fast-charging stations under vehicle-to-grid smart charging operation. J. Clean. Prod. 2023, 428, 139014. [Google Scholar] [CrossRef]
- Yilmaz, M.; Krein, P.T. Review of the impact of vehicle-to-grid technologies on distribution systems and utility interfaces. IEEE Trans. Power Electron. 2012, 28, 5673–5689. [Google Scholar] [CrossRef]
- Mwasilu, F.; Justo, J.J.; Kim, E.K.; Do, T.D.; Jung, J.W. Electric vehicles and smart grid interaction: A review on vehicle to grid and renewable energy sources integration. Renew. Sustain. Energy Rev. 2014, 34, 501–516. [Google Scholar] [CrossRef]
- Hota, A.R.; Juvvanapudi, M.; Bajpai, P. Issues and solution approaches in Phev integration to smart grid. Renew. Sustain. Energy Rev. 2014, 30, 217–229. [Google Scholar] [CrossRef]
- Mukherjee, J.C.; Gupta, A. A review of charge scheduling of electric vehicles in smart grid. IEEE Syst. J. 2014, 9, 1541–1553. [Google Scholar] [CrossRef]
- Tan, K.M.; Ramachandaramurthy, V.K.; Yong, J.Y. Integration of electric vehicles in smart grid: A review on vehicle to grid technologies and optimization techniques. Renew. Sustain. Energy Rev. 2016, 53, 720–732. [Google Scholar] [CrossRef]
- Thompson, A.W. Economic implications of lithium ion battery degradation for Vehicle-to-Grid (v2x) services. J. Power Sources 2018, 396, 691–709. [Google Scholar] [CrossRef]
- Garcés Quílez, M.; Abdel Monem, M.; El Baghdadi, M.; Yang, Y.; Van Mierlo, J.; Hegazy, O. Modelling, analysis and performance evaluation of power conversion unit in G2V/V2G application—A review. Energies 2018, 11, 1082. [Google Scholar] [CrossRef]
- Joseph, P.K.; Devaraj, E.; Gopal, A. Overview of wireless charging and vehicle-to-grid integration of electric vehicles using renewable energy for sustainable transportation. IET Power Electron. 2019, 12, 627–638. [Google Scholar] [CrossRef]
- Zheng, Y.; Niu, S.; Shang, Y.; Shao, Z.; Jian, L. Integrating plug-in electric vehicles into power grids: A comprehensive review on power interaction mode, scheduling methodology and mathematical foundation. Renew. Sustain. Energy Rev. 2019, 112, 424–439. [Google Scholar] [CrossRef]
- Vadi, S.; Bayindir, R.; Colak, A.M.; Hossain, E. A review on communication standards and charging topologies of V2G and V2h operation strategies. Energies 2019, 12, 3748. [Google Scholar] [CrossRef]
- Altin, N.; Sarp, M. Review on vehicle-to-grid systems: The most recent trends and smart grid interaction technologies. Gazi Univ. J. Sci. 2020, 33, 394–411. [Google Scholar] [CrossRef]
- Lehtola, T.A.; Zahedi, A. Electric vehicle battery cell cycle aging in vehicle to grid operations: A review. IEEE J. Emerg. Sel. Top. Power Electron. 2019, 9, 423–437. [Google Scholar] [CrossRef]
- Heilmann, C.; Friedl, G. Factors influencing the economic success of grid-to-vehicle and vehicle-to-grid applications—A review and meta-analysis. Renew. Sustain. Energy Rev. 2021, 145, 111115. [Google Scholar] [CrossRef]
- Panchanathan, S.; Vishnuram, P.; Rajamanickam, N.; Bajaj, M.; Blazek, V.; Prokop, L.; Misak, S. A comprehensive review of the bidirectional converter topologies for the vehicle-to-grid system. Energies 2023, 16, 2503. [Google Scholar] [CrossRef]
- Jia, H.; Ma, Q.; Li, Y.; Liu, M.; Liu, D. Integrating Electric Vehicles to Power Grids: A Review on Modeling, Regulation, and Market Operation. Energies 2023, 16, 6151. [Google Scholar] [CrossRef]
- Hossain, S.; Rokonuzzaman, M.; Rahman, K.S.; Habib, A.K.M.A.; Tan, W.-S.; Mahmud, M.; Chowdhury, S.; Channumsin, S. Grid-vehicle-grid (G2V2G) efficient power transmission: An overview of concept, operations, benefits, concerns, and future challenges. Sustainability 2023, 15, 5782. [Google Scholar] [CrossRef]
- Van den bergh, O.; Weekx, S.; De Cauwer, C.; Vanhaverbeke, L. Locating charging infrastructure for shared autonomous electric vehicles and for vehicle-to-grid strategy: A systematic review and research agenda from an energy and mobility perspective. World Electr. Veh. J. 2023, 14, 56. [Google Scholar] [CrossRef]
- Vishnu, G.; Kaliyaperumal, D.; Jayaprakash, R.; Karthick, A.; Kumar Chinnaiyan, V.; Ghosh, A. Review of Challenges and Opportunities in the Integration of Electric Vehicles to the Grid. World Electr. Veh. J. 2023, 14, 259. [Google Scholar] [CrossRef]
- Mastoi, M.S.; Zhuang, S.; Munir, H.M.; Haris, M.; Hassan, M.; Alqarni, M.; Alamri, B. A study of charging-dispatch strategies and vehicle-to-grid technologies for electric vehicles in distribution networks. Energy Rep. 2023, 9, 1777–1806. [Google Scholar] [CrossRef]
- Comi, A.; Idone, I. The use of electric vehicles to support the needs of the electricity grid: A systematic literature review. Appl. Sci. 2024, 14, 8197. [Google Scholar] [CrossRef]
- Uribe-Pérez, N.; González-Garrido, A.; Gallarreta, A.; Justel, D.; González-Pérez, M.; González-Ramos, J.; Arrizabalaga, A.; Asensio, F.J.; Bidaguren, P. Communications and Data Science for the Success of Vehicle-to-Grid Technologies: Current State and Future Trends. Electronics 2024, 13, 1940. [Google Scholar] [CrossRef]
- Wan, M.; Yu, H.; Huo, Y.; Yu, K.; Jiang, Q.; Geng, G. Feasibility and Challenges for Vehicle-to-Grid in Electricity Market: A Review. Energies 2024, 17, 679. [Google Scholar] [CrossRef]
- Micari, S.; Napoli, G. Electric Vehicles for a Flexible Energy System: Challenges and Opportunities. Energies 2024, 17, 5614. [Google Scholar] [CrossRef]
- Rana, R.; Saggu, T.S.; Letha, S.S.; Bakhsh, F.I. V2G based bidirectional EV charger topologies and its control techniques: A review. Discov. Appl. Sci. 2024, 6, 588. [Google Scholar] [CrossRef]
- Chen, G.; Zhang, Z. Control Strategies, Economic Benefits, and Challenges of Vehicle-to-Grid Applications: Recent Trends Research. World Electr. Veh. J. 2024, 15, 190. [Google Scholar] [CrossRef]
- Štogl, O.; Miltner, M.; Zanocco, C.; Traverso, M.; Starý, O. Electric vehicles as facilitators of grid stability and flexibility: A multidisciplinary overview. Wiley Interdiscip. Rev. Energy Environ. 2024, 13, e536. [Google Scholar] [CrossRef]
- Goncearuc, A.; De Cauwer, C.; Sapountzoglou, N.; Van Kriekinge, G.; Huber, D.; Messagie, M.; Coosemans, T. The barriers to widespread adoption of vehicle-to-grid: A comprehensive review. Energy Rep. 2024, 12, 27–41. [Google Scholar] [CrossRef]
- Yang, Y.; Wang, W.; Qin, J.; Wang, M.; Ma, Q.; Zhong, Y. Review of vehicle to grid integration to support power grid security. Energy Rep. 2024, 12, 2786–2800. [Google Scholar] [CrossRef]
- Lehtola, T. Vehicle-to-grid applications and battery cycle aging: A review. Renew. Sustain. Energy Rev. 2025, 208, 115013. [Google Scholar] [CrossRef]
- Qian, L.; Soopramanien, D. Incorporating heterogeneity to forecast the demand of new products in emerging markets: Green cars in China. Technol. Forecast. Soc. Change 2015, 91, 33–46. [Google Scholar] [CrossRef]
- Zhang, C.; Kitamura, H.; Goto, M. Feasibility of vehicle-to-grid (V2G) implementation in Japan: A regional analysis of the electricity supply and demand adjustment market. Energy 2024, 311, 133317. [Google Scholar] [CrossRef]
- Zhang, C.; Kitamura, H.; Goto, M. Exploring V2G Potential in Tokyo: The Impact of User Behavior through Multi-Agent Simulation. IEEE Access 2024, 12, 118981–119002. [Google Scholar] [CrossRef]
- May, G.J.; Davidson, A.; Monahov, B. Lead batteries for utility energy storage: A review. J. Energy Storage 2018, 15, 145–157. [Google Scholar] [CrossRef]


Disclaimer/Publisher’s Note: The statements, opinions and data contained in all publications are solely those of the individual author(s) and contributor(s) and not of MDPI and/or the editor(s). MDPI and/or the editor(s) disclaim responsibility for any injury to people or property resulting from any ideas, methods, instructions or products referred to in the content. |
© 2025 by the authors. Licensee MDPI, Basel, Switzerland. This article is an open access article distributed under the terms and conditions of the Creative Commons Attribution (CC BY) license (https://creativecommons.org/licenses/by/4.0/).