Article

Economic Analysis of Global CO2 Emissions and Energy Consumption Based on the World Kaya Identity

1
Department of Management, University of Information Technologies and Management, 35-225 Rzeszów, Poland
2
Department of Public Administration, Law and Humanity Sciences, Kherson State Agrarian and Economical University, 73006 Kropyvnytskiy, Ukraine
3
Faculty of Business Administration and Economics, European University Viadrina, 15230 Frankfurt, Germany
*
Author to whom correspondence should be addressed.
Energies 2025, 18(7), 1661; https://doi.org/10.3390/en18071661
Submission received: 21 February 2025 / Revised: 9 March 2025 / Accepted: 14 March 2025 / Published: 26 March 2025
(This article belongs to the Special Issue New Trends in Energy, Climate and Environmental Research)

Abstract

This research seeks to elucidate the relationship between economic activities, energy consumption, and CO2 emissions, thereby contributing to a deeper understanding of the economic dimensions of climate change mitigation efforts within the European context, which may be useful for developing policies to mitigate CO2 emissions and promote sustainable development. This study investigates world CO2 emissions and their relation to population growth and finds a strong positive relation based on data from 1969 to 2023. The World Kaya Identity has been applied to understand how changes in the involved factors affect CO2 emissions over time. When studying the more complex relation between the variables by controlling for energy use, GDP, and carbon intensity based on the Kaya Identity, the authors identified an overall long-term coupling of all factors. Considering short-term variations, population growth appears to have an insignificant effect, and carbon intensity appears most influential on CO2 emissions. As a next step, we take a disaggregated view on different country settings, economic sectors, and energy sources to further analyze the role carbon intensity plays for increased CO2 emissions. Here, we lay a special focus on the European perspective. This descriptive analysis lets us draw some general conclusions regarding strategies for reducing the negative impact of CO2 emissions and political efforts for sustainability transformations. This study is important for the current state of science, since a clear economic assessment of the negative effects of carbon dioxide is necessary for planning measures and costs in the ecological sphere, the correct assessment of the impact on the health of the population, the prospective implementation of preventive measures at all levels, and financing measures to reduce the negative effects of carbon dioxide. The authors found a significant positive effect of GDPpc, energy intensity, and carbon intensity on impact and an insignificant effect on the population. Thus, an unexpected increase in the population likely does not have short-term effects on CO2 emissions, and the responses to GDPpc and energy intensity both decrease after some periods, while the shock in carbon intensity shows a significant effect even after 10 years. This is reasonable in the sense that both increases in GDP and energy intensity might be alleviated by technological progress and, thus, only show a short-term positive effect on CO2 emissions. The carbon intensity of energy consumption is more crucial for the long-term change of CO2 emissions. For this reason, we study the decomposition of energy use in more detail by considering descriptive statistics over time and over different sectors and countries.
JEL Classification:
H40; O 130; B 220; D 720; D 920

1. Introduction

In the context of global climate change, the assessment of carbon dioxide (CO2) emissions is of paramount importance. Fossil fuel combustion remains a primary contributor to CO2 emissions worldwide, necessitating a thorough economic analysis to understand its implications [1,2,3,4,5]. This study focuses on examining CO2 emissions from coal, oil, and natural gas usage, particularly from a European perspective. The purpose of this study is to conduct an economic analysis of global fossil CO2 emissions, with a specific focus on understanding the dynamics and implications of these emissions within the European context. By examining trends, factors influencing emissions, and potential economic consequences, this research aims to provide insights that can inform policy decisions aimed at mitigating CO2 emissions and promoting sustainable development.
Previous studies have highlighted the intricate relationship between population growth and carbon emissions, albeit with varying perspectives on causality and directionality [6,7,8,9,10]. While some research suggests that population growth drives increased energy demand and consequently higher CO2 emissions, others argue that rising emissions contribute to environmental degradation and associated population pressures [11,12,13,14,15]. In ref. [13], publish year is 2007 the author insists on restricting the transfer of high carbon emissions industries and encouraging the long-term sustainable development of renewable energy [13]. Moreover, the role of socio-economic factors, technological advancements, and policy interventions in shaping this relationship remains a subject of scholarly debate [5,6,7,11,16].
The accelerating pace of industrialization and urbanization has significantly reshaped global energy consumption patterns, resulting in a pronounced surge in fossil CO2 emissions. Concurrently, the world’s population has been steadily expanding, with projections indicating continued growth in the coming decades [14,17,18]. This phenomenon raises critical questions about the nexus between population dynamics and CO2 emissions, warranting an in-depth investigation to comprehend its underlying dynamics. Preliminary findings suggest a significant positive correlation between population growth and fossil CO2 emissions, indicating that as population size increases, so do carbon emissions. This relationship is further mediated by socio-economic factors, with rapid urbanization and industrialization exacerbating the demand for fossil fuels. Additionally, disparities in energy access and consumption patterns across regions contribute to variations in emission levels.
The investigations of different scientists collectively shed light on various aspects of green enterprises, encompassing their impact on sustainability, the role of entrepreneurship, the relationship between green practices and business performance, and the challenges and opportunities faced by small and medium-sized enterprises in adopting sustainable measures [15]. For example, M. Dula and A. Kraszkiewicz [7], provide a comprehensive overview of global carbon emissions, including fossil CO2 emissions, land-use changes, and atmospheric CO2 concentrations. Their study offers valuable insights into global emission trends and their implications for climate change mitigation efforts [7].
The World Energy Outlook of International Energy Agency (IEA) is a key reference for understanding global energy trends and their implications for CO2 emissions. It examines scenarios for future energy consumption, including the role of fossil fuels, renewable energy sources, and energy efficiency measures [19]. The IPCC’s Sixth Assessment Report (2021) provides a comprehensive synthesis of the latest scientific understanding of climate change, including the drivers of CO2 emissions, their impacts on the climate system, and the implications for ecosystems and human societies [20].
In their influential study [21], publish year is 2010, Davis et al. [21] analyzed the implications of existing energy infrastructure for future CO2 emissions trajectories. They highlighted the importance of early action to mitigate emissions from current fossil fuel-based systems and transition to low-carbon alternatives [21]. In another paper [11], O. A. Bustos-Brinez and J. Rosero Garcia, focusing on the transportation sector, discuss strategies for achieving rapid decarbonization to mitigate CO2 emissions. The authors explored technological innovations, behavioral changes, and policy interventions necessary to transition to sustainable transportation systems [11].
The authors I. Bae, S. Park, J. Shin, J. M. Triolo, and S.G. Shin propose a technology of direct capture of carbon in the air, which in the future will be of key importance for reducing the concentration of carbon dioxide in the atmosphere. The authors analyzed the technical and economic advantages of using a hydrogen-powered solid oxide fuel cell as a source of electricity and high-quality heat for the process of direct air carbon capture. The current levelized cost of capture for the system varies significantly depending on the price of renewable hydrogen production, between GBP 314 and GBP 1505 per tonne of CO2 captured. According to the researchers, such a process could be a viable alternative to the direct capture of air-fed natural gas, with the levelized cost of capture by 2050 expected to be GBP 191 per tonne. Such studies make our future more optimistic [6].
Edenhofer et al. [8], via a comparative analysis, evaluated the economic costs and benefits of different mitigation strategies for stabilizing CO2 concentrations at low levels. They assessed the feasibility and affordability of various approaches to achieve ambitious climate targets [8]. In another work, the authors evaluated mitigation pathways compatible for limiting global warming to 1.5 °C above pre-industrial levels [9]. They discussed the socio-economic transformations required to achieve such ambitious climate targets, including measures to reduce fossil CO2 emissions [9].
An unsolved issue of modern methodology is the economic evaluation of the negative impact of carbon dioxide emissions and the establishment of interdependence between the number of populations and the volume of emissions, this scientific research of the authors is devoted to these issues. Such a study is extremely important for the current state of science, since a clear economic assessment of the negative effects of carbon dioxide is necessary for planning measures and costs in the ecological sphere, further correct (adequate) assessments of the impact on the health of the population, the prospective implementation of preventive measures at all levels (interstate, national, at the level of territorial communities, and at the object level), and financing measures to reduce the negative effects of carbon dioxide.
The objective of this research is the economic aspects of global fossil CO2 emissions, particularly as they relate to the European region. This study investigates the trends in CO2 emissions resulting from the use of coal, oil, and natural gas and explores the economic drivers behind these emissions. By analyzing empirical data and employing econometric models, this study seeks to elucidate the relationship between economic activities, energy consumption, and CO2 emissions, thereby contributing to a deeper understanding of the economic dimensions of climate change mitigation efforts.
This study delves into the escalating interdependency observed between fossil CO2 emissions and population growth across the globe. With burgeoning concerns regarding climate change and its ramifications, it is imperative to scrutinize the intricate relationship between these variables. Through empirical analysis and theoretical frameworks, this research elucidates the drivers and mechanisms underlying the growing reliance on fossil fuels and their correlation with population expansion. By identifying key factors contributing to this phenomenon, this study offers valuable insights into potential strategies for mitigating CO2 emissions and fostering sustainable development.
The research is conducted based on the real data of the Statistics Portal for Market Data [3,22] using the correlation–regression method based on the basis of CO2 emissions for the period of 1969–2023. The statistical significance of the model was tested based on the basis of Fisher’s and Student’s criteria.
The rest of the paper runs as follows: Section 2 shows the methodology. Section 3 presents the empirical study and offers a discussion. Section 4 ends with the conclusions.

2. Materials and Methods

2.1. General Methodology

To elucidate the escalating dependency between fossil CO2 emissions and population growth, this study employs a mixed methods approach. Quantitative analysis involves statistical techniques such as regression analysis to examine the correlation between population size and CO2 emissions, controlling for relevant variables such as GDP per capita, energy consumption per capita, and industrial activity. Additionally, qualitative methods such as case studies and comparative analysis are utilized to provide a nuanced understanding of the contextual factors influencing this relationship.
This section outlines the approach taken to collect, analyze, and assess data pertinent to the Sustainable Development Goals, emphasizing a combination of quantitative and qualitative methodologies to provide a comprehensive understanding of the progress and challenges in achieving the SDGs.
During our investigation, the following methodological approaches had been used:
Data Collection: This study begins by gathering comprehensive datasets on global fossil CO2 emissions, disaggregated by source (coal, oil, natural gas) and region. Data on economic indicators such as GDP, industrial output, energy consumption, and population demographics are collected from reputable international sources such as the World Bank, the International Energy Agency (IEA), and national statistical agencies. Special attention is paid to data specific to European countries to provide a focused analysis from a European perspective. In this article, the authors investigated data on carbon dioxide emissions around the world by using data from 1969 to 2023.
Econometric Modeling: Econometric models are developed to analyze the relationship between fossil CO2 emissions and various economic factors. Time-series analysis techniques, such as autoregressive integrated moving average (ARIMA) or vector autoregression (VAR), are employed to capture the dynamic nature of the data. Multiple regression models are constructed to assess the impact of economic variables such as GDP, industrial activity, energy consumption, and population size on fossil CO2 emissions. The models are estimated using appropriate statistical software, ensuring robustness and reliability of the results.
Panel data analyses, such as fixed effects or random effects models, are utilized to account for cross-country heterogeneity and time series variations. Panel regressions are conducted to examine the influence of both time-varying and time-invariant factors on fossil CO2 emissions within the European region. Robustness checks are performed to validate the stability and consistency of the estimated coefficients.
Scenario analysis is conducted to assess the potential impact of policy interventions and technological advancements on future fossil CO2 emissions [23]. Different scenarios are formulated based on varying assumptions regarding economic growth trajectories, energy transition pathways, and policy measures. Sensitivity analysis is performed to evaluate the resilience of the findings under different scenarios and identify key uncertainties.
A comparative analysis is undertaken to benchmark the fossil CO2 emissions intensity of European countries against global counterparts. Key drivers of variations in emissions intensity are identified, considering factors such as the industrial structure, energy mix, technological innovation, and policy frameworks. Cross-country comparisons provide valuable insights into best practices and policy lessons for mitigating CO2 emissions while sustaining economic growth.
Interpretation and Policy Implications: The findings of the econometric analysis and scenario assessments are interpreted in light of their economic implications for European countries. Policy recommendations are formulated based on the empirical evidence, aiming to reconcile economic growth objectives with environmental sustainability goals. This study concludes with insights into the challenges and opportunities associated with reducing fossil CO2 emissions from a European perspective, highlighting avenues for further research and policy action.

2.2. Statistical Analysis of the World Kaya Identity

The Kaya Identity is an equation that expresses CO2 emissions as the product of four factors [24]: population, GDP per capita, energy intensity (energy use per unit of GDP), and carbon intensity (CO2 emissions per unit of energy), i.e.,
E C O 2 = N P · C E G D P · C O 2 C E ,
where ECO2 is the CO2 emissions, measured in tons; NP is the number of populations in millions of persons; GDP is the gross domestic product (GDP); and CO2 is the carbon dioxide concentrations in the atmosphere.
In other words,
E C O 2 = N P · G D P p c · E I · C I ,
where ECO2 is the CO2 emissions, measured in tons; NP is the number of populations, measured in millions of persons; GDPpc is the gross domestic product per capita (currency in USD); Ei is the energy intensity; and Ci is the carbon intensity.
This equation can be applied to understand how changes in the involved factors affect CO2 emissions over time. To conduct a statistical analysis of the Kaya Identity, we employ a cointegration analysis to separate short-term effects from long-term effects [24]. This enables us to assess the long-term equilibrium relationship between the involved factors and draw conclusions on the short-term effects of each factor.
The relationship between CO2 emissions and economic performance is a well-studied topic. Discussions around decoupling or the environmental Kuznet curve specifically study the long-term relations between the two variables [25]. The vast literature often applies cointegration and similar time series techniques to assess how CO2 emissions, GDP, and/or energy consumption are related over time based on either a panel set up of several countries or by focusing on a country group [14,26,27]. Here, we aim to focus on the specific form and variable set up of the Kaya Identity at the world level. We dive into more detail regarding specific country and sector studies later on.

3. Results and Discussion

We use worldwide data from 1969 to 2023, which have been collected from “Our World in Data” [28,29,30]. The variables, GDP per capita and energy intensity, are only available in a step of 10 years before 1990 and have been linearly interpolated for that reason. The percentage changes in the involved variables are displayed in Figure 1. We find a clear upward trend in worldwide CO2 emissions, GDP per capita, and population and a slight downward trend in carbon and energy intensity. The cointegration analysis in the following figure is supposed to analyze whether these non-stationary variables follow a joint long-term trend.

3.1. Cointegration Analysis: The Long-Term Relationship

We logarithmize the Kaya Identity in (1) in order to identify the linear relationship between the involved variables. As a next step, we run the Johansen test for cointegration and find one cointegration relationship between the variables (see [31], for an introduction to cointegration analysis). The resulting test statistics and critical values are the following:
Test10 pct5 pct1 pct
r <= 4|2.657.529.2412.97
r <= 3|12.3017.8519.9624.60
r <= 2|31.4232.0034.9141.07
r <= 1|60.4749.6553.1260.16
r = 0|106.2271.8676.0784.45
By including one cointegration relationship, we run a vector error correction model (VECM) and obtain the following long-run relationship between the variables:
E C O 2 =   9.836 + 0.978   P o p u l a t i o n + 1.975   G D P p c + 2.742   E n e r g y   I n t e n s i t y + 1.039   C a r b o n   I n t e n s i t y  
Thus, we find that a combination of the involved variables results in a stable long-run equilibrium. We include a constant in the long-term relation, as all involved variables show a trend in their original form. It might be noteworthy that the coefficients are normalized with respect to CO2 emissions and might be standardized in another way. We find the smallest coefficient related to the population and the largest one with regard to carbon intensity.

3.2. The Short-Term Effects

As a next step, we are interested in how CO2 emissions react to a change in the involved variables in the short run. Meaning after having filtered out the long-run relationship, we can identify the short-term effects, that is, the effect a shock in one variable has on CO2 emissions. For this, we transform the VECM into a vector autoregressive (VAR) model and calculate impulse response functions. For this, we use a standard set up and identify the structural relations using short-term restrictions (i.e., a Cholesky decomposition); we assume that the population is ordered first (does not react on impact to a change in any of the variables), and CO2 emissions are ordered last (react on impact to all variables). The responses of CO2 emissions to all variables are displayed in Figure 2 and are joint with 16% and 84% bootstrap confidence intervals.
The authors found a significant positive effect of GDPpc, energy intensity, and carbon intensity on impact and an insignificant effect on the population. Meaning an unexpected increase in population likely does not have short-term effects on CO2 emissions; that is, the responses to GDPpc and energy intensity both decrease after some periods, while the shock in carbon intensity shows a significant effect even after 10 years. This is reasonable in the sense that both increases in GDP and energy intensity might be alleviated by technological progress and, thus, only show a short-term positive effect on CO2 emissions. The carbon intensity of energy consumption is more crucial for the long-term change of CO2 emissions. For this reason, we study the decomposition of energy use in more detail in the following section by considering descriptive statistics over time and over different sectors and countries.

3.3. Correlation–Regression Method

In this work, an interdependence between population size and fossil CO2 emissions in the world has been detected (Table 1). It was found that increasing the cost of nature protection increases the cost of innovation, i.e., preventive measures, and not just to eliminate the negative consequences. The results of the verification of the model of dependence of the world population size and fossil CO2 emissions are shown in Table 2.
Since Fisher’s criterion is F = 1277.8, which is more than its critical value of Fcr =4.03, the model is adequate and statistically significant. Since the values of b0 = −5.4696755 and b1 = 35.7470537 are greater than the critical value of tcr = 2.007, it confirms the adequacy and significance of this regression model. To find estimates of the parameters of the model, b0 and b1 used the value of the population size and fossil CO2 emissions (Table 2). As a result of calculations, the values of the model parameters were obtained, with b0 = −5.469 and b1 = 35.747 [14,15,35].
The economic interpretation of the model is that with the increase in population size as a whole, the fossil CO2 emissions also increase. As a result, we need the formation of adequate preventive measures in nature protection. Accordingly, the correlation model obtained in this study of the dependence of population size and fossil CO2 emissions is as follows [36]:
y ̑ = b 0 + b 1 x
The resulting function in our case will look like this:
Y = 5.4696755 + 35.747 x
To verify the correctness of the choice of the structure of the dependence of population size and fossil CO2 emissions in the form of linear regression, we assessed the statistical verification of the model for significance, adequacy, and quality. Determination and correlation coefficients have been used to assess the quality of the constructed model. The statistical significance of the model was tested based on the basis of Fisher’s and Student’s criteria.

3.4. Assessment of Model Adequacy and Hypothesis Testing

To assess the adequacy of the model with statistical data, the value of the coefficient of determination, R2, has been calculated. Since the value of the coefficient of determination is R2 = 0.98, the impact of fossil CO2 emissions in Ukraine (1969–2023) is quite significant. The degree of closeness of the linear relationship between the model variables was estimated using the correlation coefficient. Based on the value of r = 0.96, it was concluded that there is a close linear relationship between the indicators of the model.
According to the statistical tables of Fisher’s F-distribution [3,36] at a given level of significance of α = 0.05, the critical value of Fisher’s criterion of Fcr = 4.03 has been found. Because the actual value of Fisher’s criterion (Ff = 1277.85) is more than critical, this indicates the statistical significance of the constructed model as a whole and its adequacy. According to the selected level of significance of α = 0.05 and the degrees of freedom according to the statistical tables of Student’s t-distribution, the critical value of Student’s criterion of tcr = 2.007 was found. Since tb0 = −5.4696755 and tb1 = 35.7470537 are greater than tcr, we concluded that the statistical significance of the parameters b0 and b1 is significant. The results of the verification of the model of dependence of population size and fossil CO2 emissions indicate the adequacy of the model to statistics and the existence of a close linear relationship between its variables, as well as the significance of the model as a whole and its parameters.
The United States has one of the largest CO2 economies globally, as it is driven primarily by its extensive use of fossil fuels in various sectors such as transportation, industry, and electricity generation. Despite efforts to transition towards cleaner energy sources, the US remains heavily reliant on coal and natural gas, resulting in significant CO2 emissions. China has rapidly emerged as the world’s largest emitter of CO2, fueled by its rapid industrialization and extensive coal consumption. While the country has made substantial investments in renewable energy and implemented policies to curb emissions, its continued economic growth and reliance on coal-fired power plants pose challenges for reducing CO2 emissions.
The European Union (EU) has implemented ambitious climate policies aimed at reducing CO2 emissions and transitioning to a low-carbon economy [32]. Through mechanisms such as the EU Emissions Trading System (EU ETS) and renewable energy targets, the EU has made significant progress in decarbonizing its economy, with renewable energy sources now accounting for a growing share of electricity generation. Germany has pursued an energy transition (Energiewende) aimed at reducing CO2 emissions and increasing the share of renewable energy in its energy mix. Despite significant investments in wind and solar power, Germany still faces challenges related to the phase-out of nuclear power and the continued use of coal for electricity generation [25,32,35].
India’s CO2 economy is characterized by a growing energy demand driven by population growth, urbanization, and industrialization. While the country has made efforts to expand its renewable energy capacity and improve energy efficiency, it continues to rely heavily on coal for electricity generation, resulting in substantial CO2 emissions. Brazil’s CO2 economy is influenced by its significant agricultural sector, as well as its reliance on fossil fuels for transportation and electricity generation. While Brazil has made progress in reducing deforestation-related emissions, challenges remain in curbing emissions from other sectors and transitioning to cleaner energy sources. These examples illustrate the diversity of CO2 economies worldwide, shaped by factors such as economic development, energy resources, and policy choices [32,33,37]:
Key economic indicators for reducing the negative impact of CO2 from fossil fuels include the following:
Costs of low-carbon energy technologies: analysis of the costs associated with implementing low-CO2 technologies, such as renewable energy sources, energy efficiency, and carbon capture, is important for assessing the economic efficiency of emissions reduction measures.
Internal and external costs of carbon permits: analysis of the economic implications of internal carbon permit markets or CO2 emissions trading systems can help determine the effectiveness of these mechanisms in incentivizing emissions reductions.
Cost of CO2 emissions offsetting: assessing the cost of CO2 emissions offsetting, particularly through offset projects, can help determine the value of carbon credits and their role in incentivizing investments in carbon projects.
Economic impacts of energy policies and regulations: analysis of the economic impacts of energy policies, such as emission standards or support for renewable energy, allows for an assessment of their impact on competitiveness and economic development.
Economic risks of carbon assets: analysis of risks associated with declining demand for coal, oil, and gas due to emissions regulation or technological change is important for investors and companies operating in carbon-intensive sectors.
Impact on employment and social stability: analysis of the economic impact of transitioning to clean energy systems on employment, social stability, and regional development allows for the consideration of social aspects of energy transitions.
An important tool for forecasting carbon dioxide emissions is foresight, according to the authors. Foresight involves the systematic exploration of possible futures to inform decision-making and policy development. In the context of CO2 emissions and climate change, foresight can play a crucial role in identifying emerging trends, assessing future risks and opportunities, and designing proactive strategies to mitigate CO2 emissions and adapt to climate impacts. By employing foresight methodologies such as scenario analysis, trend analysis, and stakeholder engagement, policymakers, businesses, and civil society organizations can anticipate the potential trajectories of CO2 emissions, explore alternative pathways for sustainable development, and identify innovative solutions to address climate challenges. Foresight can also help in anticipating technological breakthroughs, market disruptions, and policy changes that may impact CO2 emissions and inform strategic planning and investment decisions in sectors such as energy, transportation, and agriculture. Overall, integrating foresight into CO2-related decision-making processes can enhance resilience, foster innovation, and facilitate the transition to a low-carbon and climate-resilient future. In this work, the comparison of the GDPs of developed countries, their renewable energy share, and CO2 emissions has been summarized in a Table 3.
These are just example data and financial indicators for illustrative purposes. Actual values may vary based on the specific sources and time periods used for analysis. This table provides a comparative analysis of selected countries based on key financial and statistical indicators related to CO2 emissions and renewable energy. The United States has the highest GDP among the listed countries, indicating a strong economic presence, while also exhibiting relatively high CO2 emissions per capita and a moderate renewable energy share. However, its carbon intensity, measured as CO2 emissions per unit of GDP, is comparatively lower than some other nations. China, despite having a slightly lower GDP than the United States, surpasses the US in terms of CO2 emissions per capita, reflecting its significant industrial activity and reliance on coal-based energy production. However, China also demonstrates a relatively high share of renewable energy in its energy mix [1,29,30].
The European Union showcases a sizable GDP alongside moderate CO2 emissions per capita; this is indicative of a more efficient and less carbon-intensive economy compared to both the United States and China. Moreover, the EU boasts a significant proportion of renewable energy in its energy consumption, indicating progress towards decarbonization. India exhibits a relatively lower GDP compared to the other listed countries but also has lower CO2 emissions per capita. Nevertheless, its carbon intensity remains notable, suggesting opportunities for improving energy efficiency and transitioning towards cleaner energy sources. Germany, with a substantial GDP, demonstrates relatively high CO2 emissions per capita, likely influenced by its industrial base. However, Germany also exhibits a considerable share of renewable energy, reflecting its commitment to energy transition and reducing carbon dependency. Brazil showcases a moderate GDP alongside relatively low CO2 emissions per capita, indicating a less carbon-intensive economy. Moreover, Brazil stands out with a substantial share of renewable energy, underscoring its potential for sustainable development and mitigating CO2 emissions [1,16,19,20,32,38].
Overall, the analysis highlights variations in economic strength, carbon emissions, renewable energy adoption, and carbon intensity among the selected countries, reflecting different approaches to economic development and climate action. Changes in carbon dioxide emissions in the selected countries worldwide from 1990 to 2022 are shown Figure 3. In 2022, CO2 emissions in the United Kingdom were 41% lower than in 1990, while emissions in the United States were around 2.6% lower. In contrast, emissions in China and India were more than 300% higher in 2022 than in 1990 due to economic growth. Since 1990, the UK has achieved the fastest CO2 reductions in the G7. Much of the UK’s emissions cuts are attributable to the country’s phase-out of coal-fired power, which now accounts for roughly 2% of the UK’s power generation, and the shift toward natural gas and renewable energy sources. In addition to climate policies, global events play a major role in emissions trends. Global CO2 emissions were down 4.9% in 2020 compared to 2019, as polluting industries were temporarily disrupted throughout the year as a result of the coronavirus pandemic [3]. The global financial crisis in 2009 also had a significant impact on emissions. Over the past two decades, many developing countries have seen significant increases in per capita emissions [28,29]. Due to China’s rapid industrial development, per capita emissions have increased by nearly 200% since 2000 to eight metric tons per person. Similarly, in Vietnam, India, and Indonesia, emissions have increased significantly. Also, per capita emissions in developed countries such as the UK, for example, have halved since 2000. However, China’s per capita CO2 emissions are less than those produced by the average American, who produces nearly twice as much, at 15 metric tons of carbon dioxide per year (three times the global average per capita emissions). The Middle East region has even higher values of CO2 emissions, with Qatar and Kuwait averaging over 25 metric tons of CO2 per capita [1,3,19,20].
The power industry was by far the biggest contributor to global carbon dioxide (CO2) emissions in 2022, accounting for roughly 38%. The transportation sector was responsible for the second-largest share of global CO2 emissions that year, at just over 20%. Global power sector CO2 emissions have increased by more than 50% since the turn of the century and currently total more than 14 billion metric tons (GtCO2e) per year. However, direct CO2 emissions from power and heat generation are projected to have peaked. As the world’s largest electricity consumer, China is also the biggest contributor to global power sector emissions by far [3]. In 2022, China produced more than 4.7 GtCO2 from electricity generation, the majority of which was produced by coal-fired power plants [1,3,12,29,32,33].
In order to achieve the goals of sustainable development, a reduction in carbon dioxide emissions is essential. The change in global CO2 emissions by fuel type, relative to 2019 levels, is presented in Figure 4.
Annual carbon dioxide (CO2) emissions worldwide from 1940 to 2023 (Figure 5) and average monthly carbon dioxide (CO2) levels in the atmosphere worldwide from 1990 to 2024 are presented below (Figure 6).
Monthly mean atmospheric carbon dioxide concentrations reached a record high of 424.55 parts per million (ppm) in February 2024. This was an increase of roughly 15% compared with average levels recorded in February 2000. In 2023, global average annual CO2 concentrations reached a record high of more than 421 ppm. CO2 concentrations typically fall during the summer months [3,22]. This is a result of plants taking in more CO2 through photosynthesis than they release through respiration during the warmer months, which is when they are growing the most.
The widely accepted measure of the relationship between population size and volumes of fossil CO2 emissions is the correlation coefficient, which has reached a value of 0.96. This signifies a high level of correlation, indicating a strong positive relationship between these two variables. In the context of this correlation coefficient, the high value of 0.96 suggests that as the population size increases in a country, there is a significant increase in the volumes of fossil CO2 emissions. Such a strong positive correlation may be driven by growing energy needs, industrialization, transportation demands, and other factors requiring the use of coal, oil, and natural gas, leading to substantial CO2 emissions into the atmosphere. Analyzing the correlation coefficient allows for understanding and quantifying the relationship between CO2 emission levels and population size, which is crucial for developing and implementing strategies to mitigate the impact of anthropogenic emissions on climate processes.
For Europe, there are several prospects in terms of reducing the negative impact of CO2 emissions:
Increase renewable energy usage: Europe can further increase the utilization of renewable energy sources such as solar and wind energy. Extensive investments in renewable energy will help reduce the dependency on coal and other fossil fuels, leading to a decrease in CO2 emissions.
Stimulation of energy efficiency: European countries can enhance measures to improve energy efficiency in industry, construction, and transportation. Investments in energy-efficient technologies and infrastructure will help reduce energy consumption and CO2 emissions.
Implementation of carbon targets: introducing carbon targets and an internal carbon market can incentivize companies to reduce CO2 emissions and innovate towards cleaner technologies.
Transitioning transport models: the proliferation of electric vehicles, the development of public transportation, and the promotion of cycling and walking mobility can help decrease CO2 emissions from transportation.
Promotion of a circular economy: Implementing circular economy principles can contribute to waste reduction and CO2 emissions, as well as create new opportunities for economic development. The overarching goal for Europe is to achieve carbon neutrality by 2050, requiring a comprehensive approach and cooperation at all levels of society.
In ref. [25], publish year is 2020, Hepburn et al. discuss the economic rationale for carbon pricing as a policy instrument to reduce CO2 emissions. The scientists examine different carbon pricing mechanisms, their effectiveness in incentivizing emission reductions, and their implications for economic efficiency and equity [25]. The European Commission outlines the European Union’s ambitious agenda for achieving climate neutrality by 2050 [28,42]. It encompasses a wide range of policy initiatives, including regulations, investments, and incentives aimed at reducing fossil CO2 emissions and promoting sustainable development [32]. The work [13] provides a seminal analysis of the economics of climate change, emphasizing the urgency of mitigating CO2 emissions to avoid catastrophic impacts, as well as evaluates the costs of inaction versus the costs of mitigation and argues for immediate and decisive policy action. Another work [4,35] provides an overview of the environmental Kuznet curve (EKC) hypothesis, which suggests an inverted U-shaped relationship between economic development and environmental degradation, including CO2 emissions. It critically evaluates empirical evidence for the EKC across different countries and sectors [13]. In work [44] R. M. Wright, C. L. Quéré, N. Mayot, A. Olsen, and D. Bakker introduce shared socio-economic pathways (SSPs), a set of scenarios that explore alternative future trajectories of socio-economic development and their implications for greenhouse gas emissions. They provide a framework for understanding the interactions between demographic trends, economic growth, and CO2 emissions and apply input–output analysis to assess the environmental impacts of economic activities, including CO2 emissions [44].
D. Atstāja [16] analyzes the economic implications of the Kyoto Protocol, an international agreement aimed at reducing greenhouse gas emissions, including CO2. The author discusses the challenges and opportunities associated with implementing emissions reduction targets and the role of economic instruments such as emissions trading [16]. K. T. Hoang, C. A. Thilker et al. [45] examine the relationship between demographic trends, particularly population growth, and future CO2 emissions. Using integrated assessment models, they assess the impact of demographic changes on energy demand and carbon emissions trajectories [45].
H. Ritchie and others offer a critical commentary on population projections and their implications for future energy demand and CO2 emissions [46]. They examined the assumptions underlying IPCC scenarios and argued for greater consideration of population dynamics in climate change assessments. In ref. [41], publish year is 2020, Chen, M. A., and Françoise Carré [41] propose five key principles for aligning high-level climate policies, such as international agreements, with local development priorities. They emphasize the importance of considering socio-economic factors, including population dynamics, in designing effective climate mitigation strategies [41].
C. Fischer and R. Newell [47] conduct a decomposition analysis of carbon dioxide emissions from water and air transport in Europe. They examine the contributions of various factors, including population growth, economic activity, and technological change, to changes in emissions over time [47]. I. Bae et al. [6] employ computable general equilibrium modeling to assess the carbon burden of European Union expansion. The scientists analyze the economic and environmental implications of integrating new member states and explore policy options for managing carbon emissions effectively.
H. Lütkepohl examines the concept of path dependence in energy systems and economic development, exploring how historical trajectories shape current energy consumption patterns and CO2 emissions [31]. The article highlights the challenges of transitioning to sustainable energy systems and the role of policies in overcoming path dependence. The scientific community holds various viewpoints on the issue of reducing CO2 emissions and establishing green enterprises. Here are some key perspectives on reducing the negative impact of CO2 from fossil fuels with the references to the authors’ sources (Table 4).
These are just some of the key viewpoints held by scientists on the issue of reducing CO2 emissions and establishing green enterprises. This topic is complex and has many diverse aspects, requiring a comprehensive approach to solving the problem.

4. Conclusions

The evolution of enterprises towards sustainable practices, encapsulating green policies and economic growth, heralds a new era in business paradigms. It underscores the pivotal role of businesses as agents of change in addressing global challenges while fostering inclusive growth and environmental stewardship. By harmonizing ecological consciousness with socio-economic imperatives, enterprises can chart a course towards a more sustainable and prosperous future.
The following conclusions were formed as a result of the conducted research:
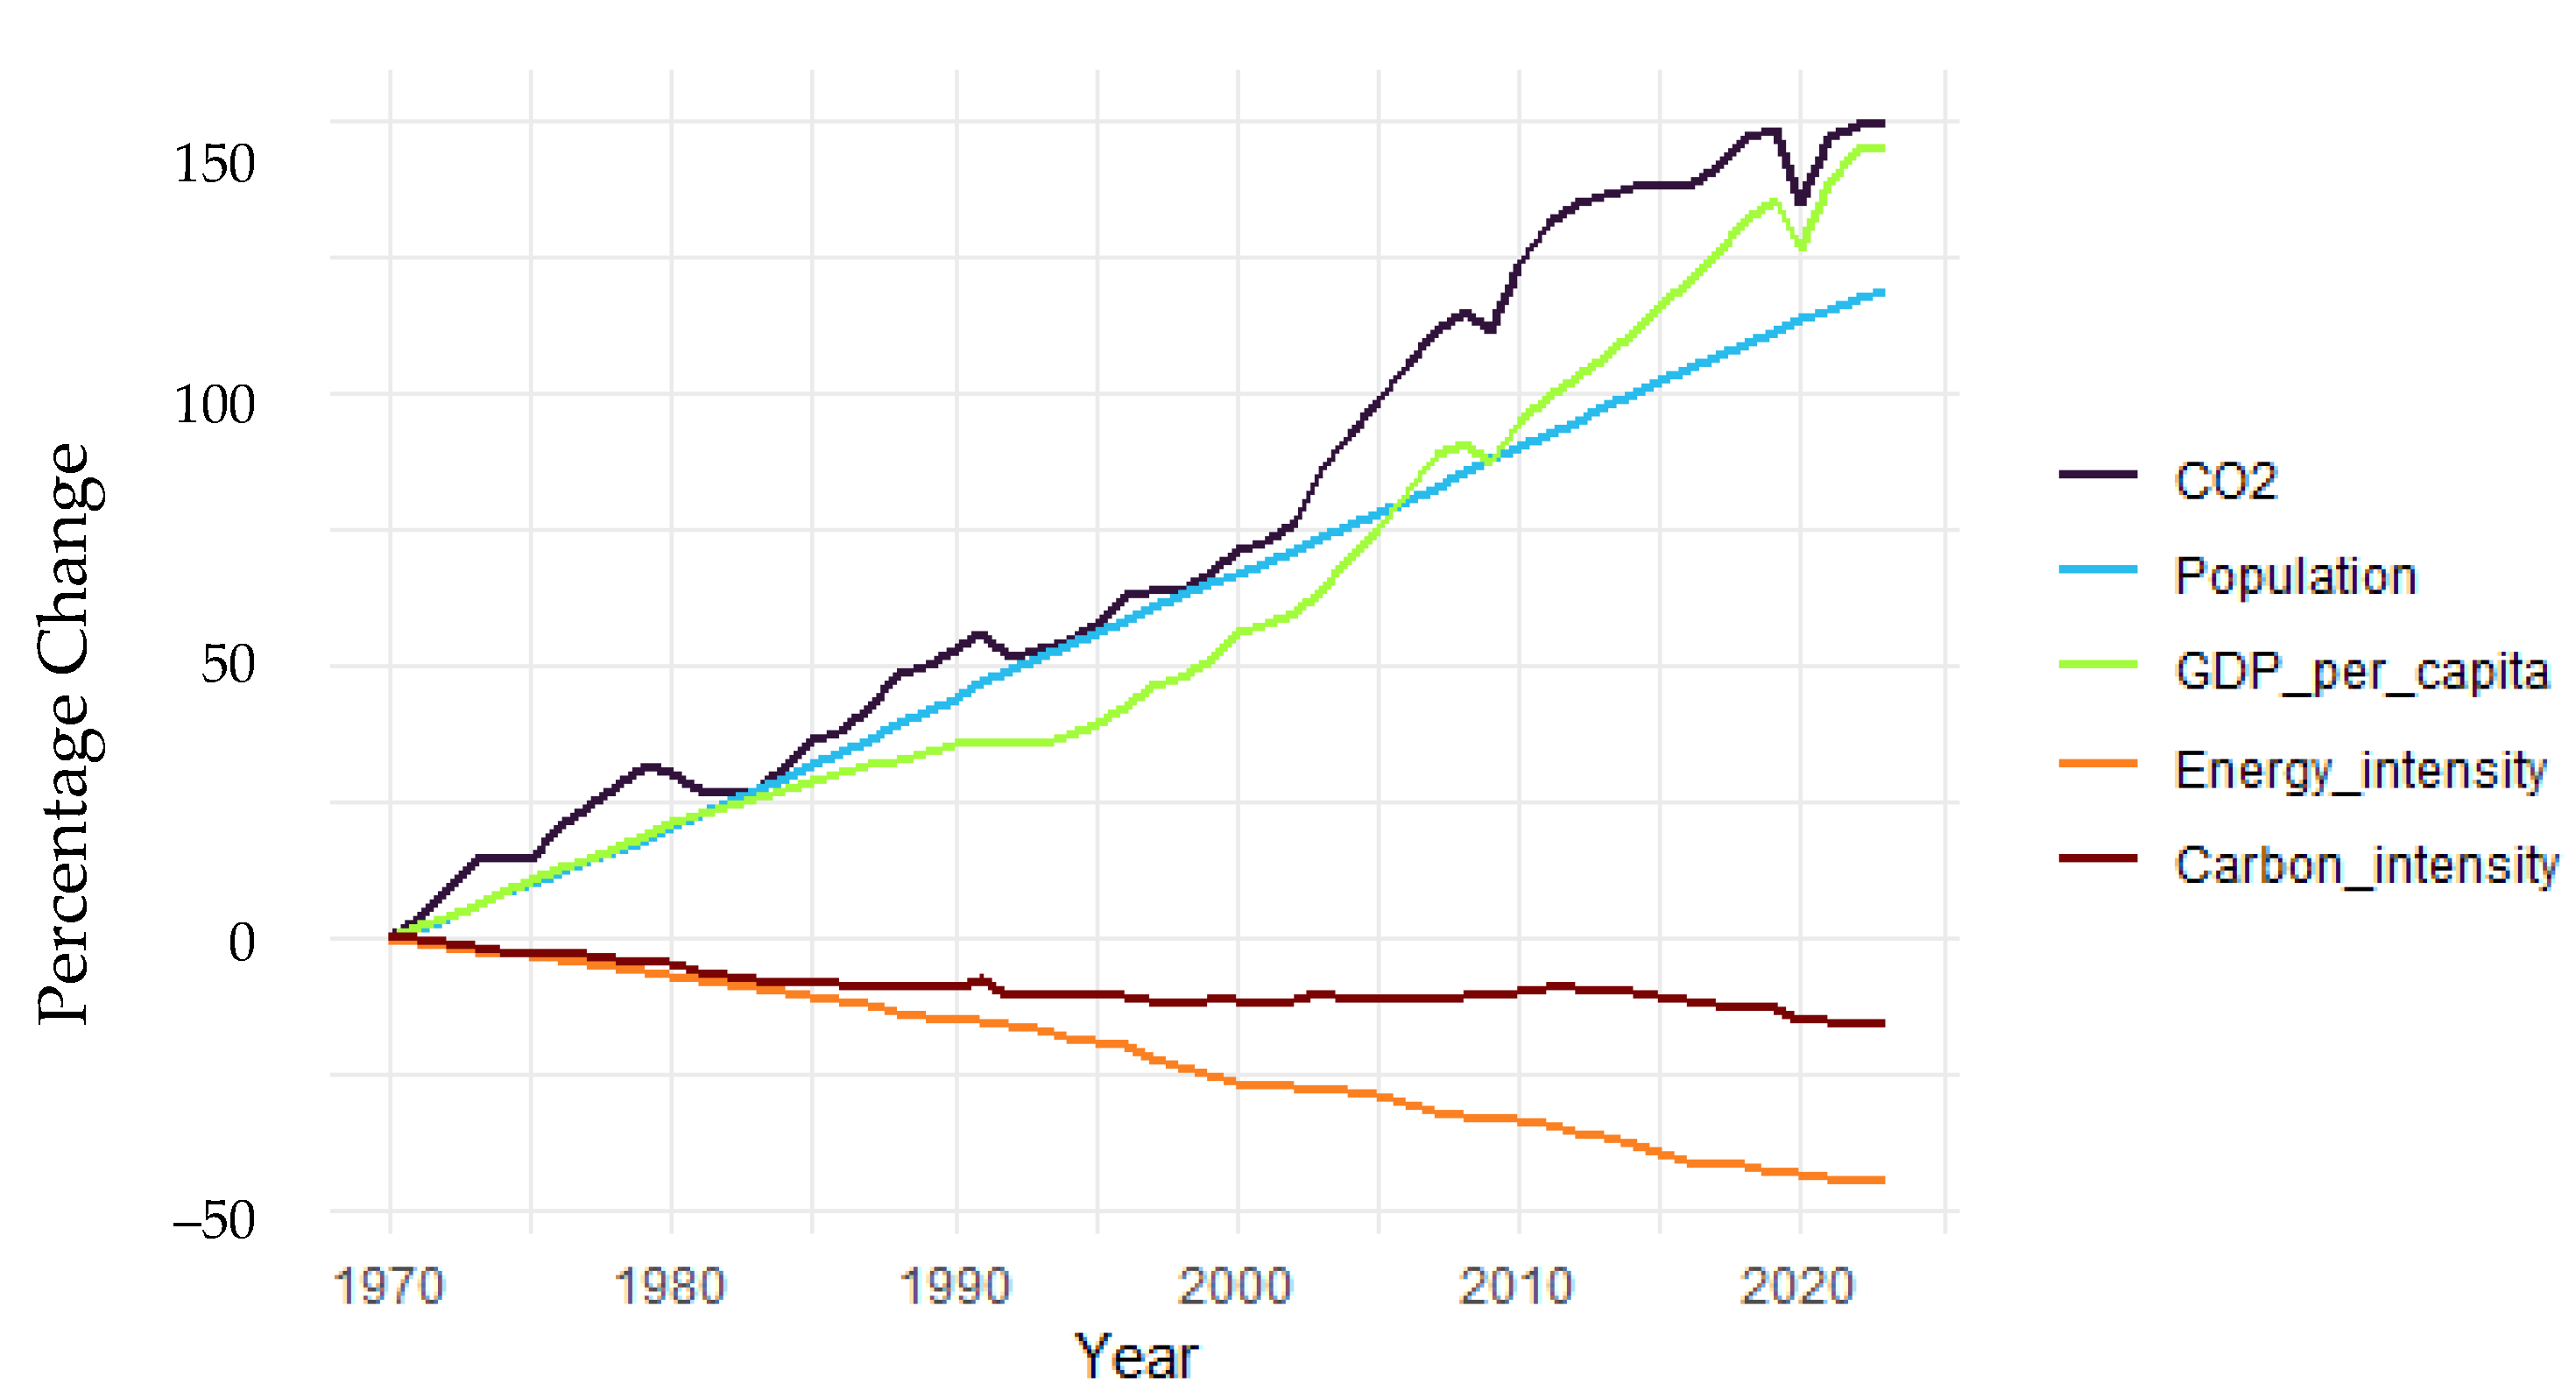
  • The Kaya Identity is an equation that expresses CO2 emissions as the product of four factors: population, GDP per capita, energy intensity (energy use per unit of GDP), and carbon intensity (CO2 emissions per unit of energy). The authors used cointegration analysis, which allowed us to assess the long-term equilibrium relationship between the involved factors and draw conclusions about the short-term effects of each factor. The database used by the authors included data from around the world from 1969 to 2023. Since the variables GDP per capita and energy intensity are available only in 10-year increments up to 1990, the authors linearly interpolated them and found a clear trend towards an increase in global CO2 emissions, GDP per capita, and the population and a slight trend towards a decrease in carbon and energy intensity. The authors logarithmized the Kaya identity to determine the linear relationship between the involved variables, performed the Johansen test for cointegration, and found one cointegration relationship between the variables to enter into the cointegration analysis. Thus, the authors found that the combination of the involved variables leads to a stable long-term equilibrium. The authors included a constant value in the long-run relationship, since all the variables involved show a trend in their original form, and the coefficients normalized to CO2 emissions can be standardized in another way. The smallest coefficient is found to be related to the population and the largest to carbon intensity.
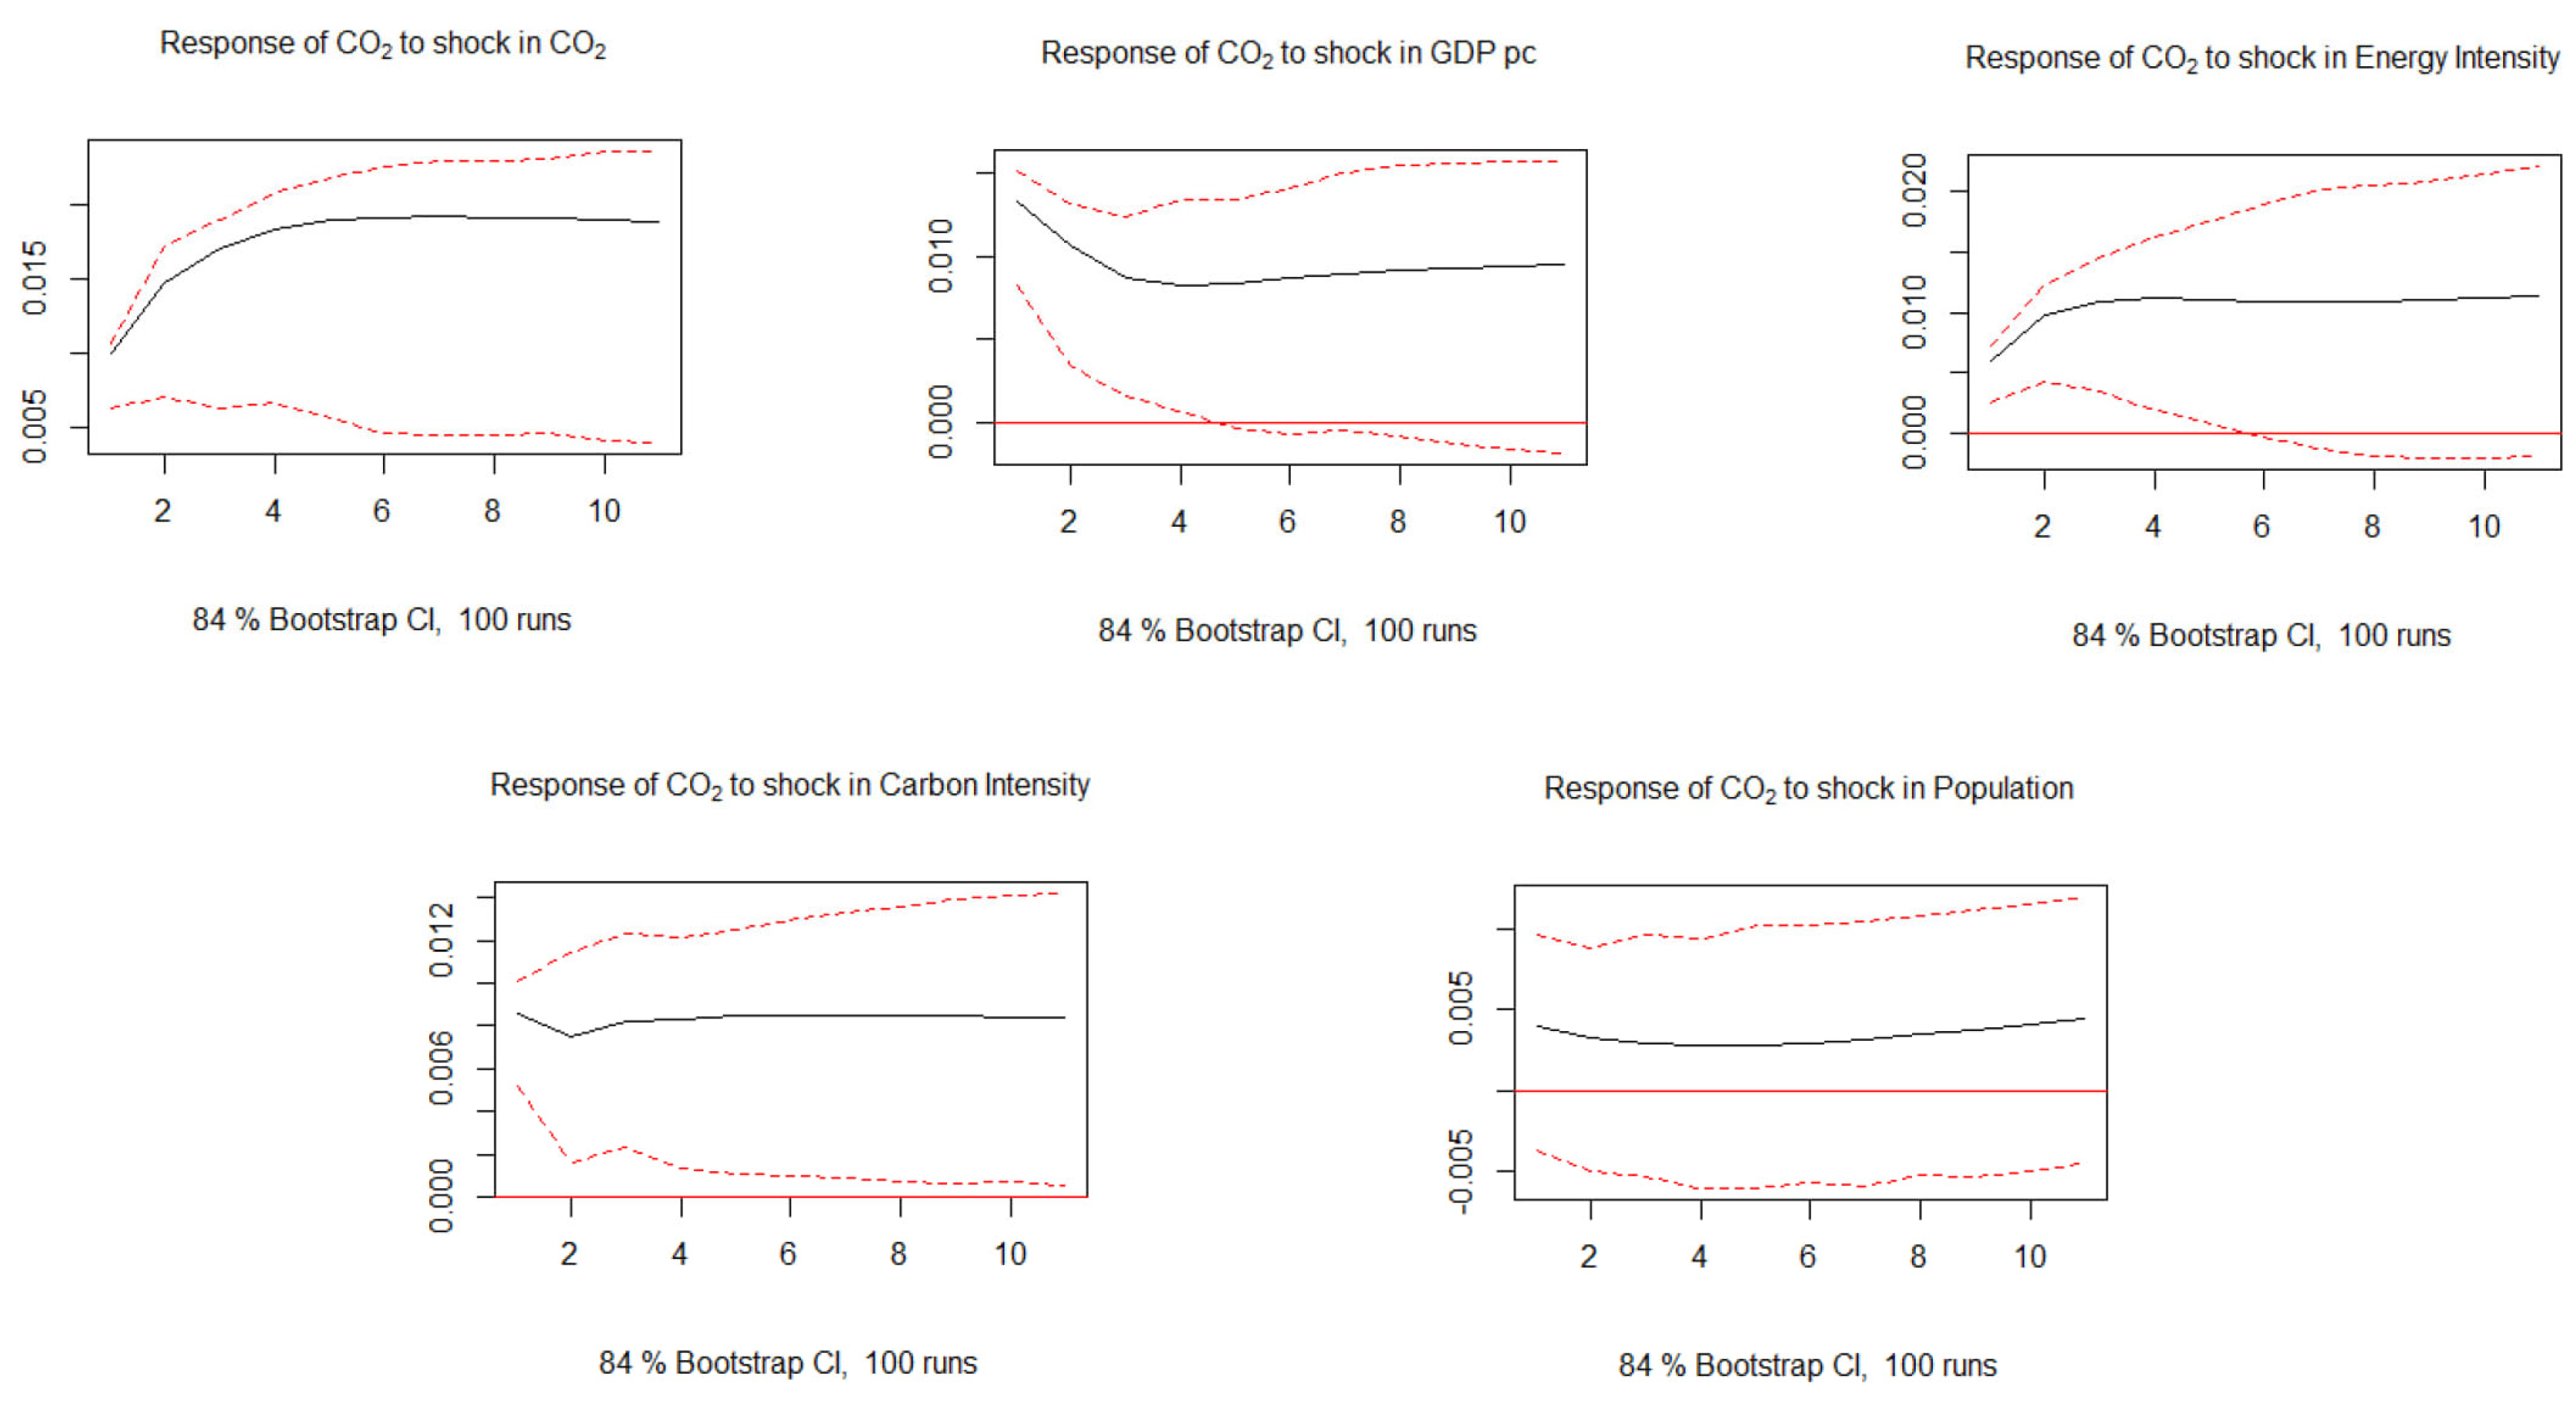
  • Since the authors found significant positive effects of GDPpc, energy intensity, and carbon intensity on the impact and insignificant effects on the population, this implies that an unexpected increase in population is unlikely to have a short-term impact on CO2 emissions; that is, the responses to GDPpc and energy intensity diminish over time, while the shock to carbon intensity shows a significant impact even after 10 years. This is reasonable in the sense that both GDP and energy intensity increases can be mitigated by technological progress and thus show only a short-term positive impact on CO2 emissions. Carbon intensity in energy consumption is more important for the long-term change in CO2 emissions. For this reason, the authors examined the decomposition of energy consumption in detail, considering descriptive statistics over time and across sectors and countries. Kaya identification was applied to reveal how changes in the factors involved affect CO2 emissions over time; the authors estimated how CO2 emissions respond to changes in the relevant variables in the short term. After filtering out the long-term relationship, the short-term effects of a shock in one variable on CO2 emissions were determined. To do this, the authors transformed the VECM into a vector autoregressive (VAR) model and calculated impulse response functions. To do this, we applied the standard set up and determined structural relationships using short-term constraints; that is, we assume that the population is ordered first (does not respond to changes in any of the variables), and CO2 emissions are ordered last (respond to changes in all variables). The responses of CO2 emissions to all variables are pooled with 16% and 84% initial confidence intervals.
  • The results of this study highlight the complex interplay between population dynamics and fossil CO2 emissions, underscoring the need for multifaceted approaches to address climate change and promote sustainable development. Understanding the drivers and consequences of increasing dependence on fossil fuels allows policymakers to formulate targeted measures to decouple economic growth from carbon emissions and promote a transition to renewable energy sources. The authors see several avenues for Europe to reduce the negative impact of CO2 emissions: increasing the use of renewable energy, promoting energy efficiency, implementing carbon emission targets, shifting to public transport models, and promoting a circular economy. The authors find a strong correlation between the population and fossil CO2 emissions. The calculated correlation coefficient of R = 0.96 indicates a strong positive relationship between the population and fossil CO2 emissions. Certainly, according to the authors’ well-founded claim, demographics have a significant impact on carbon dioxide emissions, underscoring the need for targeted policies to address the environmental impacts of population growth. The calculated correlation coefficient suggests that climate change mitigation efforts must take into account the role of population dynamics in shaping carbon emission trajectories. Strategies to reduce CO2 emissions should not only focus on technological innovation and policy interventions but also include population considerations to effectively address the root causes of emissions growth.
  • Policy frameworks should prioritize investments in renewable energy, energy efficiency, and sustainable urban planning while also promoting access to education, healthcare, and family planning services to manage population growth sustainably. Addressing the interplay between population growth, economic development, and environmental sustainability requires integrated approaches that balance socio-economic objectives with environmental conservation goals. Such a study is extremely important for the current state of science, since a clear economic assessment of the negative effects of carbon dioxide is necessary for planning measures and costs in the ecological sphere, further correct (adequate) assessments of the impact on the health of the population, the prospective implementation of preventive measures at all levels (interstate, national, at the level of territorial communities, and at the object level), and financing measures to reduce the negative effects of carbon dioxide.
  • Collaborative efforts to share best practices, transfer technology, and mobilize financial resources can facilitate the implementation of effective mitigation strategies and accelerate the transition to a low-carbon economy. Given the global nature of climate change, addressing the nexus between population dynamics and CO2 emissions requires coordinated action at the international level. While the correlation coefficient provides valuable insights into the relationship between population size and CO2 emissions, further research is needed to explore the underlying mechanisms driving this correlation. The author’s future studies will examine the role of socio-economic factors, technological advancements, and policy frameworks in shaping carbon emissions trajectories across different regions and time periods, providing evidence-based guidance for informed decision-making and climate action.

Author Contributions

Conceptualization, A.Y., A.L. and S.M.; literature review, A.Y., A.L. and S.M.; methodology, S.M., A.Y. and A.L.; formal analysis, A.Y. and S.M.; writing, A.L., A.Y. and S.M.; conclusions and discussion, A.Y. and A.L. All authors have read and agreed to the published version of the manuscript.

Funding

This research received no external funding.

Data Availability Statement

Data and materials are available from the author upon request.

Conflicts of Interest

The authors declare no conflicts of interest.

References

  1. Agenda 2030 for Sustainable Development. 2015. Available online: https://www.ticketforchange.org/become-a-changemaker-mooc (accessed on 1 January 2025).
  2. Charles, K.; Zack, G. Scenarios for Future Global Growth to 2050. Center for Global Development. Paper 634. 2023. Available online: https://www.cgdev.org/sites/default/files/scenarios-future-global-growth-2050.pdf (accessed on 13 March 2025).
  3. Statista—The Statistics Portal for Market Data. 2024. Available online: https://www.statista.com/ (accessed on 13 March 2025).
  4. The World Bank. The World Bank in Poland. Overview. 2023. Available online: https://www.worldbank.org (accessed on 9 October 2020).
  5. Wright, R.M.; Le Quéré, C.; Mayot, N.; Olsen, A.; Bakker, D.C.E. Fingerprint of Climate Change on Southern Ocean Carbon Storage. Glob. Biogeochem. Cycles 2023, 37, e2022GB007596. [Google Scholar] [CrossRef]
  6. Bae, I.; Park, S.; Shin, J.; Triolo, J.M.; Shin, S.G. Country-Specific Modeling of Methane Production and Emission Reduction Utilizing Pig Manure. Energies 2025, 18, 95. [Google Scholar] [CrossRef]
  7. Dula, M.; Kraszkiewicz, A. Theory and Practice of Burning Solid Biofuels in Low-Power Heating Devices. Energies 2025, 18, 182. [Google Scholar] [CrossRef]
  8. Edenhofer, O.; Steckel, J.C.; Jakob, M.; Bertram, C. Reports of coal’s terminal decline may be exaggerated. Environ. Res. Lett. 2018, 13, 024019. [Google Scholar] [CrossRef]
  9. Edenhofer, O.; Pichs-Madruga, R.; Sokona, Y.; Seyboth, K.; Kadner, S.; Zwickel, T.; Eickemeier, P.; Hansen, G.; Schlömer, S.; von Stechow, C. Renewable Energy Sources and Climate Change Mitigation: Special Report of the Intergovernmental Panel On Climate Change; Cambridge University Press: Cambridge, UK, 2012; Available online: https://books.google.com.ua/books?hl=en&lr=&id=AjP9sVg01zoC&oi=fnd&pg=PR9&dq=info:9AvGqqi0mp8J:scholar.google.com&ots=p01XS0iWGN&sig=K--6DPgp1CSDtf4GnobUWsgFaNY&redir_esc=y#v=onepage&q&f=false/ (accessed on 13 March 2025).
  10. Shironitta, K.; Okamoto, S.; Kagawa, S. Cross-country analysis of relationship between material input structures and consumption-based CO2 emissions. Environ. Econ. Policy Stud. 2019, 21, 533–554. [Google Scholar] [CrossRef]
  11. Bustos-Brinez, O.A.; Rosero Garcia, J. Clustering Analysis for Active and Reactive Energy Consumption Data Based on AMI Measurements. Energies 2025, 18, 221. [Google Scholar] [CrossRef]
  12. Dong, F.; Li, J.; Li, Z.; Chen, Y.; Zheng, L.; Lu, B.; Liu, Y. Exploring synergistic decoupling of haze pollution and carbon emissions in emerging economies: Fresh evidence from China. Environ. Dev. Sustain. 2024, 26, 17281–17318. [Google Scholar] [CrossRef]
  13. Stern, N. The Economics of Climate Change: The Stern Review. Cambridge University Press: Cambridge, UK, 2007; Volume 1, pp. 50–75. [Google Scholar]
  14. Yakymchuk, A.; Yakymchuk, O.; Popadynets, N.; Bilyk, R.; Yakubiv, V.; Maksymiv, Y.; Hryhoruk, I.; Irtyshcheva, I.; Husakovska, T.; Boiko, Y. Integral Assessment of the Level of Ukraine’s Economic Security: Modeling and Economic Analysis. Accounting 2020, 7, 381–390. [Google Scholar] [CrossRef]
  15. Yakymchuk, A. The Carbon Dioxide Emissions’ World Footprint: Diagnosis of Perspectives. Scientific Papers of Silesian University of Technology—Organization and Management Series—Issue. Wydaw. Politech. Śląskiej 2024, 195, 665–683. [Google Scholar] [CrossRef]
  16. Atstāja, D. Renewable Energy for Sustainable Development: Opportunities and Current Landscape. Energies 2025, 18, 196. [Google Scholar] [CrossRef]
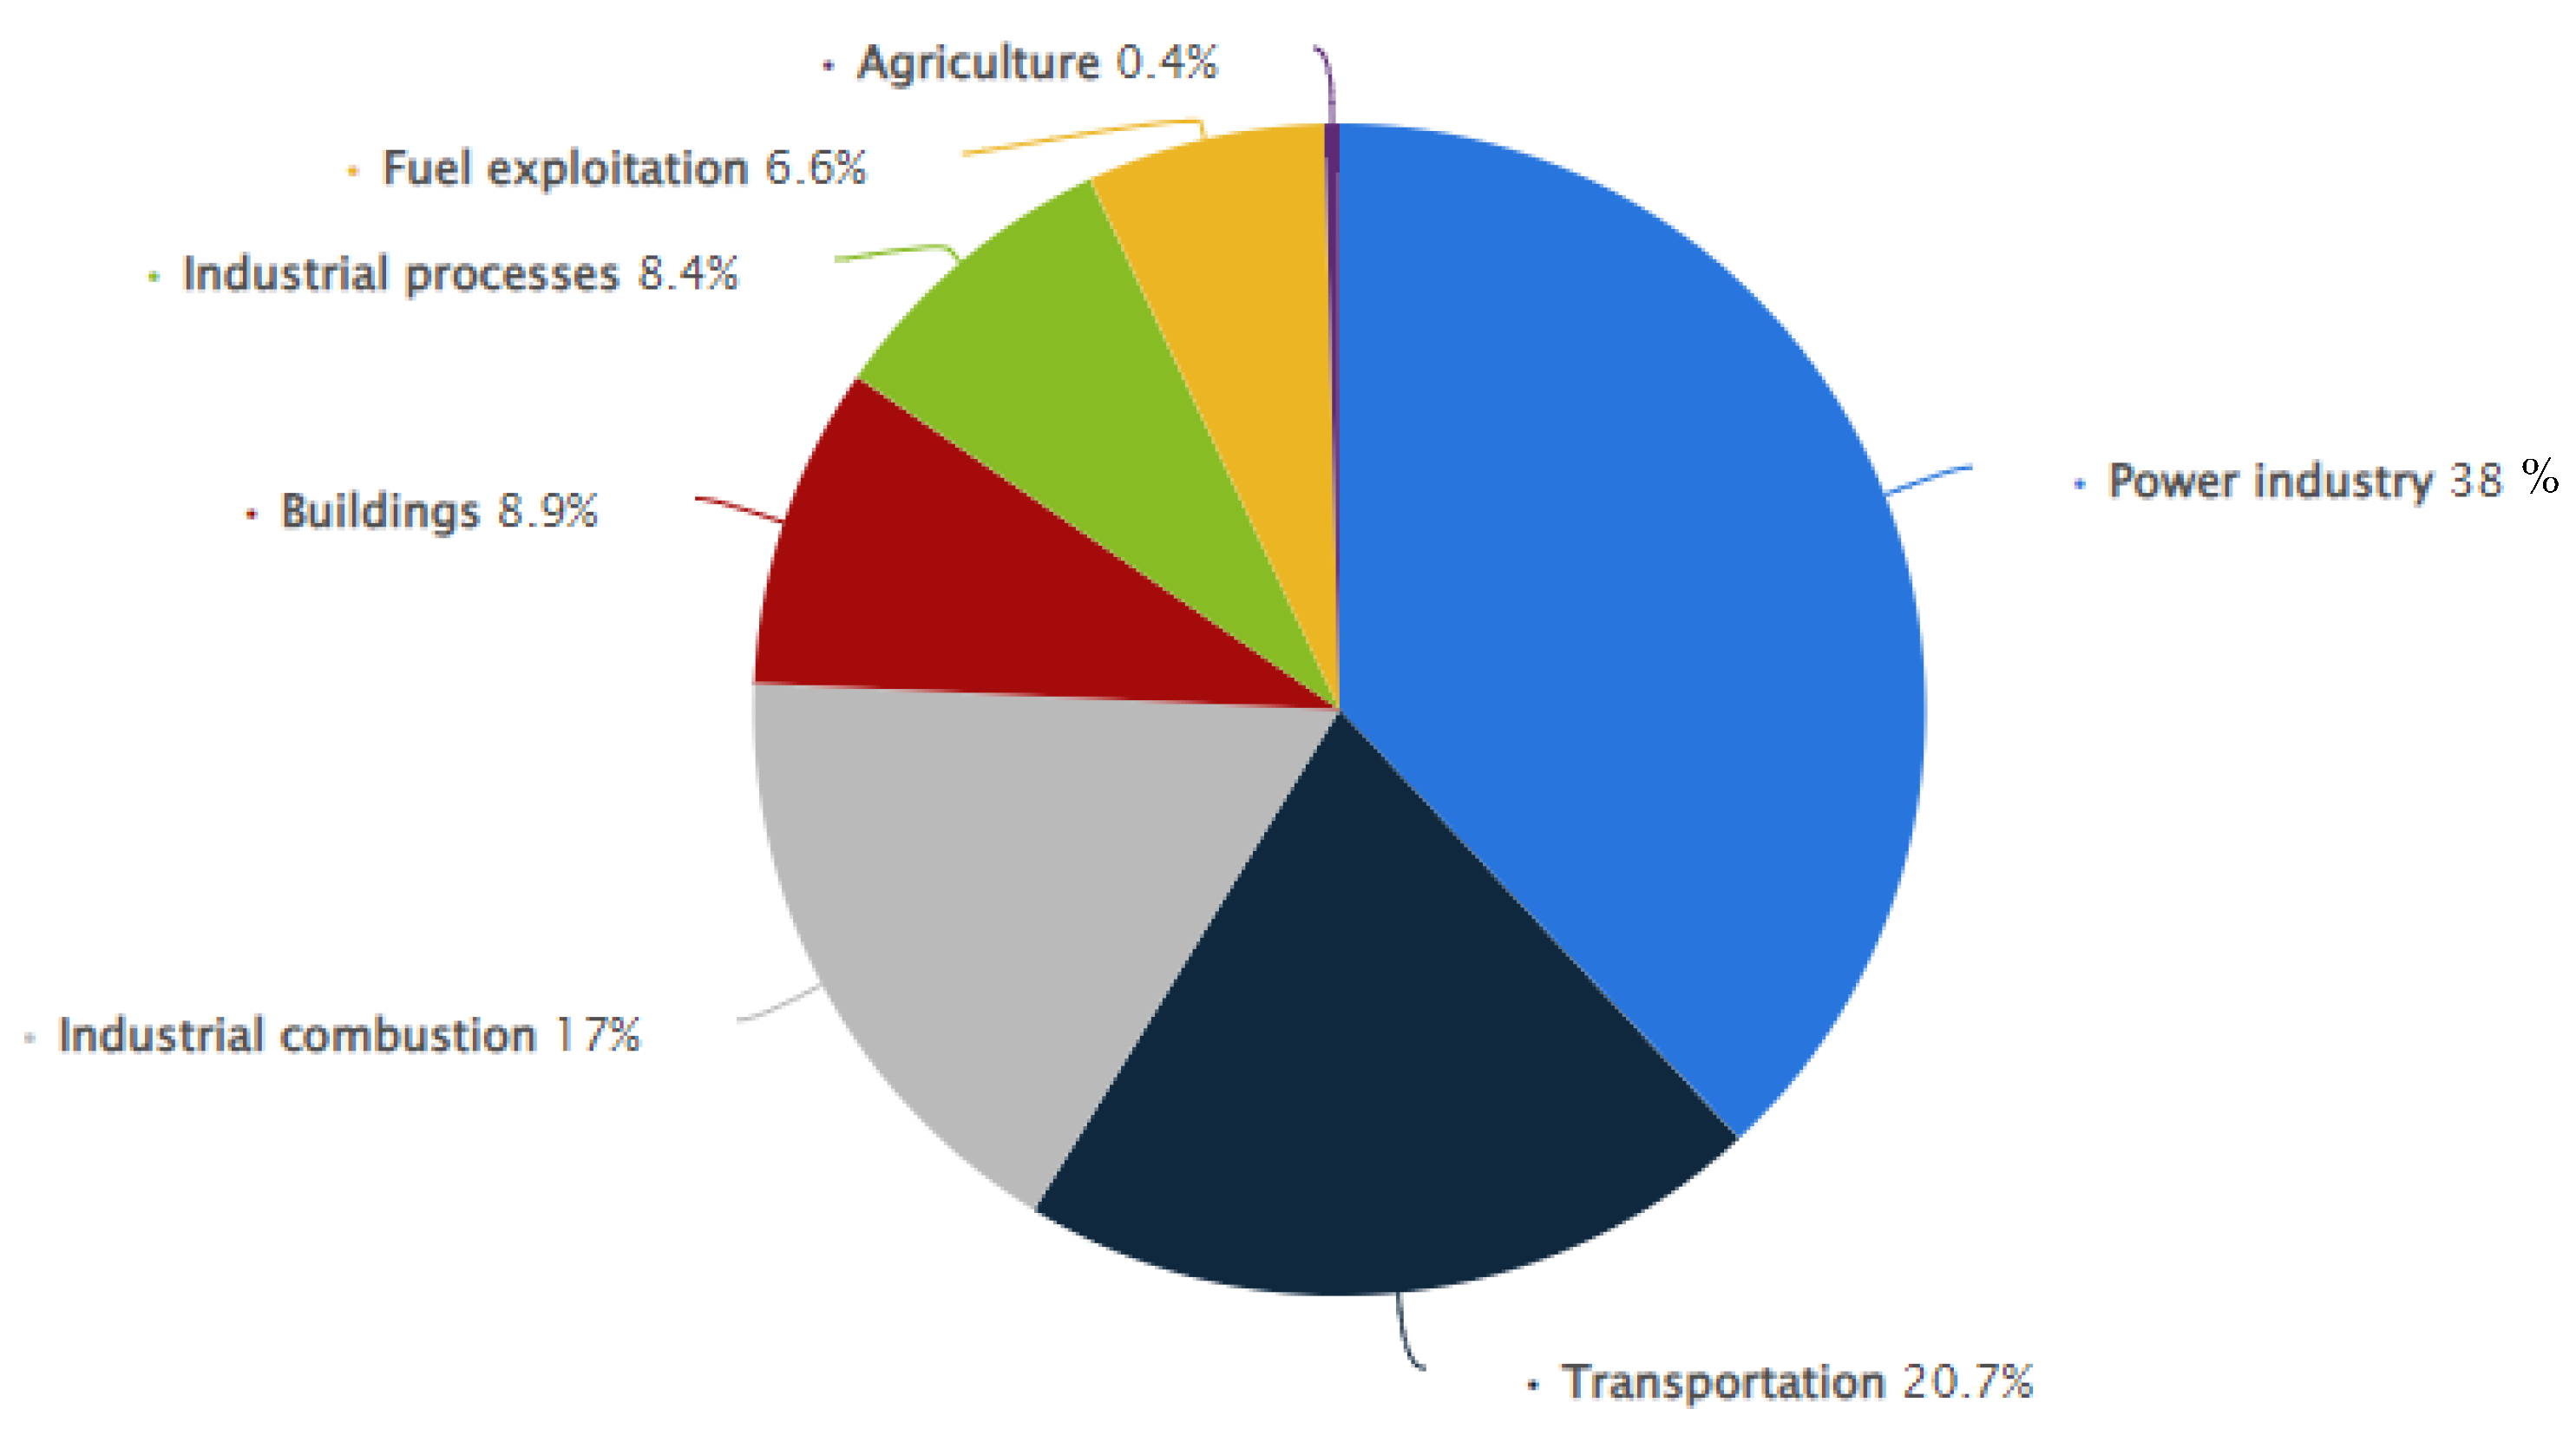
  17. Distribution of Carbon Dioxide Emissions Worldwide in 2022, by Sector. 2024. Available online: https://www.statista.com/statistics/1129656/global-share-of-co2-emissions-from-fossil-fuel-and-cement/ (accessed on 13 March 2025).
  18. Nowak, C.; Kowalski, M. Impact of Renewable Energy Investments on Employment in Poland. Energy Policy 2019, 134, 110964. [Google Scholar]
  19. International Energy Agency (IEA). World Energy Outlook; International Energy Agency (IEA): Paris, France, 2020; Volume 3, pp. 50–75. [Google Scholar]
  20. Intergovernmental Panel on Climate Change (IPCC). IPCC Sixth Assessment Report. In Climate Change 2021: The Physical Science Basis; Intergovernmental Panel on Climate Change (IPCC): Geneva, Switzerland, 2021; Volume 1, pp. 200–250. [Google Scholar]
  21. Davis, S.J.; Caldeira, K.; Matthews, H.D. Implications of Existing Energy Infrastructure for Future CO2 Emissions Trajectories. Environ. Res. Lett. 2010, 5, 300–320. [Google Scholar]
  22. Statistics Poland GUS (sdg.gov.pl). Available online: https://sdg.gov.pl (accessed on 13 March 2025).
  23. Nwokolo, S.C.; Obiwulu, A.U.; Okonkwo, P.C. Africa’s Propensity for a Net Zero Energy Transition, 1st ed.; CRC Press: Boca Raton, FL, USA, 2024. [Google Scholar] [CrossRef]
  24. Yoichi, K.; Keiichi, Y. Environment, Energy, and Economy: Strategies for Sustainability; United Nations Univ. Press: Tokyo, Japan, 1997. [Google Scholar]
  25. Hepburn, C.; Stern, N.; Stiglitz, J.E. “Carbon pricing” special issue in the European economic review. Eur. Econ. Rev. 2020, 127, 103440. [Google Scholar] [CrossRef] [PubMed] [PubMed Central]
  26. Jiang, Y.; Ren, Z.; Lu, C.; Li, H.; Yang, Z. A region-based low-carbon operation analysis method for integrated electricity-hydrogen-gas systems. Appl. Energy 2024, 355, 122230. [Google Scholar] [CrossRef]
  27. Zhao, Q.; Han, F.; Huang, Y.; She, X.; You, Z.; Zhang, B. Research of the carbon footprint calculation and evaluation method based on the pattern microalgae for biodiesel production. Renew. Energy 2024, 231, 120912. [Google Scholar] [CrossRef]
  28. OECD. Global Debt Report 2024: Bond Markets in a High-Debt Environment; OECD Publishing: Paris, France, 2024. [Google Scholar] [CrossRef]
  29. Official Site of the European Statistics Service. 2024. Available online: https://eurostat.ec.europa (accessed on 13 March 2025).
  30. Organisation for Economic Co-Operation and Development (OECD). Gross National Income (GNI) Indicator; OECD: Paris, France, 2020; Available online: https://doi.org/10.1787/8a36773a-en (accessed on 13 March 2025).
  31. Lütkepohl, H. New Introduction to Multiple Time Series Analysis. Springer Books; Springer: Berlin/Heidelberg, Germany, 2005; ISBN 978-3-540-27752-1. [Google Scholar]
  32. European Commission (European Green Deal). European Green Deal: Roadmap to Sustainable Europe; European Commission: Brussels, Belgium, 2019; Volume 2, pp. 10–30. [Google Scholar]
  33. Jędrzejowska, K.; Wróbel, A. Gospodarka Światowa 2022–2023: Czas Niepewności, Niepokoju i Postępującej Fragmentacji. Rocznik Strategiczny. 2022. Available online: https://wnpism.uw.edu.pl/wp-content/uploads/2023/06/08_Gospodarka_KJedrzejowska_AWrobel.pdf (accessed on 13 March 2025).
  34. Official Site of the State Statistics Service of Ukraine. 2024. Available online: http://www.ukrstat.gov.ua (accessed on 13 March 2025).
  35. Tenga, X.; Lub, L.C.; Chiu, Y.-H. How the European Union reaches the target of CO2 emissions under the Paris Agreement. Eur. Plan. Stud. 2020, 28, 1836–1857. [Google Scholar] [CrossRef]
  36. Yakymchuk, A.; Rataj, M. Development of the green policy strategies of enterprises: A decent work. Econ. Environ. 2024, 89, 752. [Google Scholar] [CrossRef]
  37. Lewandowska, A.; Stopa, M. Do SME’s innovation strategies influence their effectiveness of innovation? Some evidence from the case of Podkarpackie as peripheral region in Poland. Equilibrium. Q. J. Econ. Econ. Policy 2019, 14, 521–536. [Google Scholar] [CrossRef]
  38. Lewandowska, A.; Pater, R.; Cywiński, Ł. Determinants of business innovation in the Regional Innovation System context. Policy implications for a less developed region. Stud. Reg. Lokal. 2019, 1, 5–27. [Google Scholar] [CrossRef]
  39. Annual Carbon Dioxide (CO2) Emissions Worldwide from 1940 to 2023. 2024. Available online: https://www.statista.com/statistics/276629/global-co2-emissions/ (accessed on 13 March 2025).
  40. Carbon Dioxide Emissions of the Most Polluting Countries Worldwide in 2010 and 2022. 2024. Available online: https://www.statista.com/statistics/270499/co2-emissions-in-selected-countries/ (accessed on 13 March 2025).
  41. Chen, M.A.; Carré, F. The Informal Economy Revisited Examining the Past, Envisioning the Future; Routledge: Oxfordshire, UK, 2020; 308p, Available online: https://library.oapen.org/bitstream/id/43b3c6c8-6a94-4fbe-94a8-a6580b73be2c/9780367191511_text.pdf (accessed on 13 March 2025)ISBN 978-0-367-19151-1.
  42. CO2 Emissions per Capita vs. Population Growth. 2021. Available online: https://ourworldindata.org/grapher/co-emissions-per-capita-vs-population-growth (accessed on 13 March 2025).
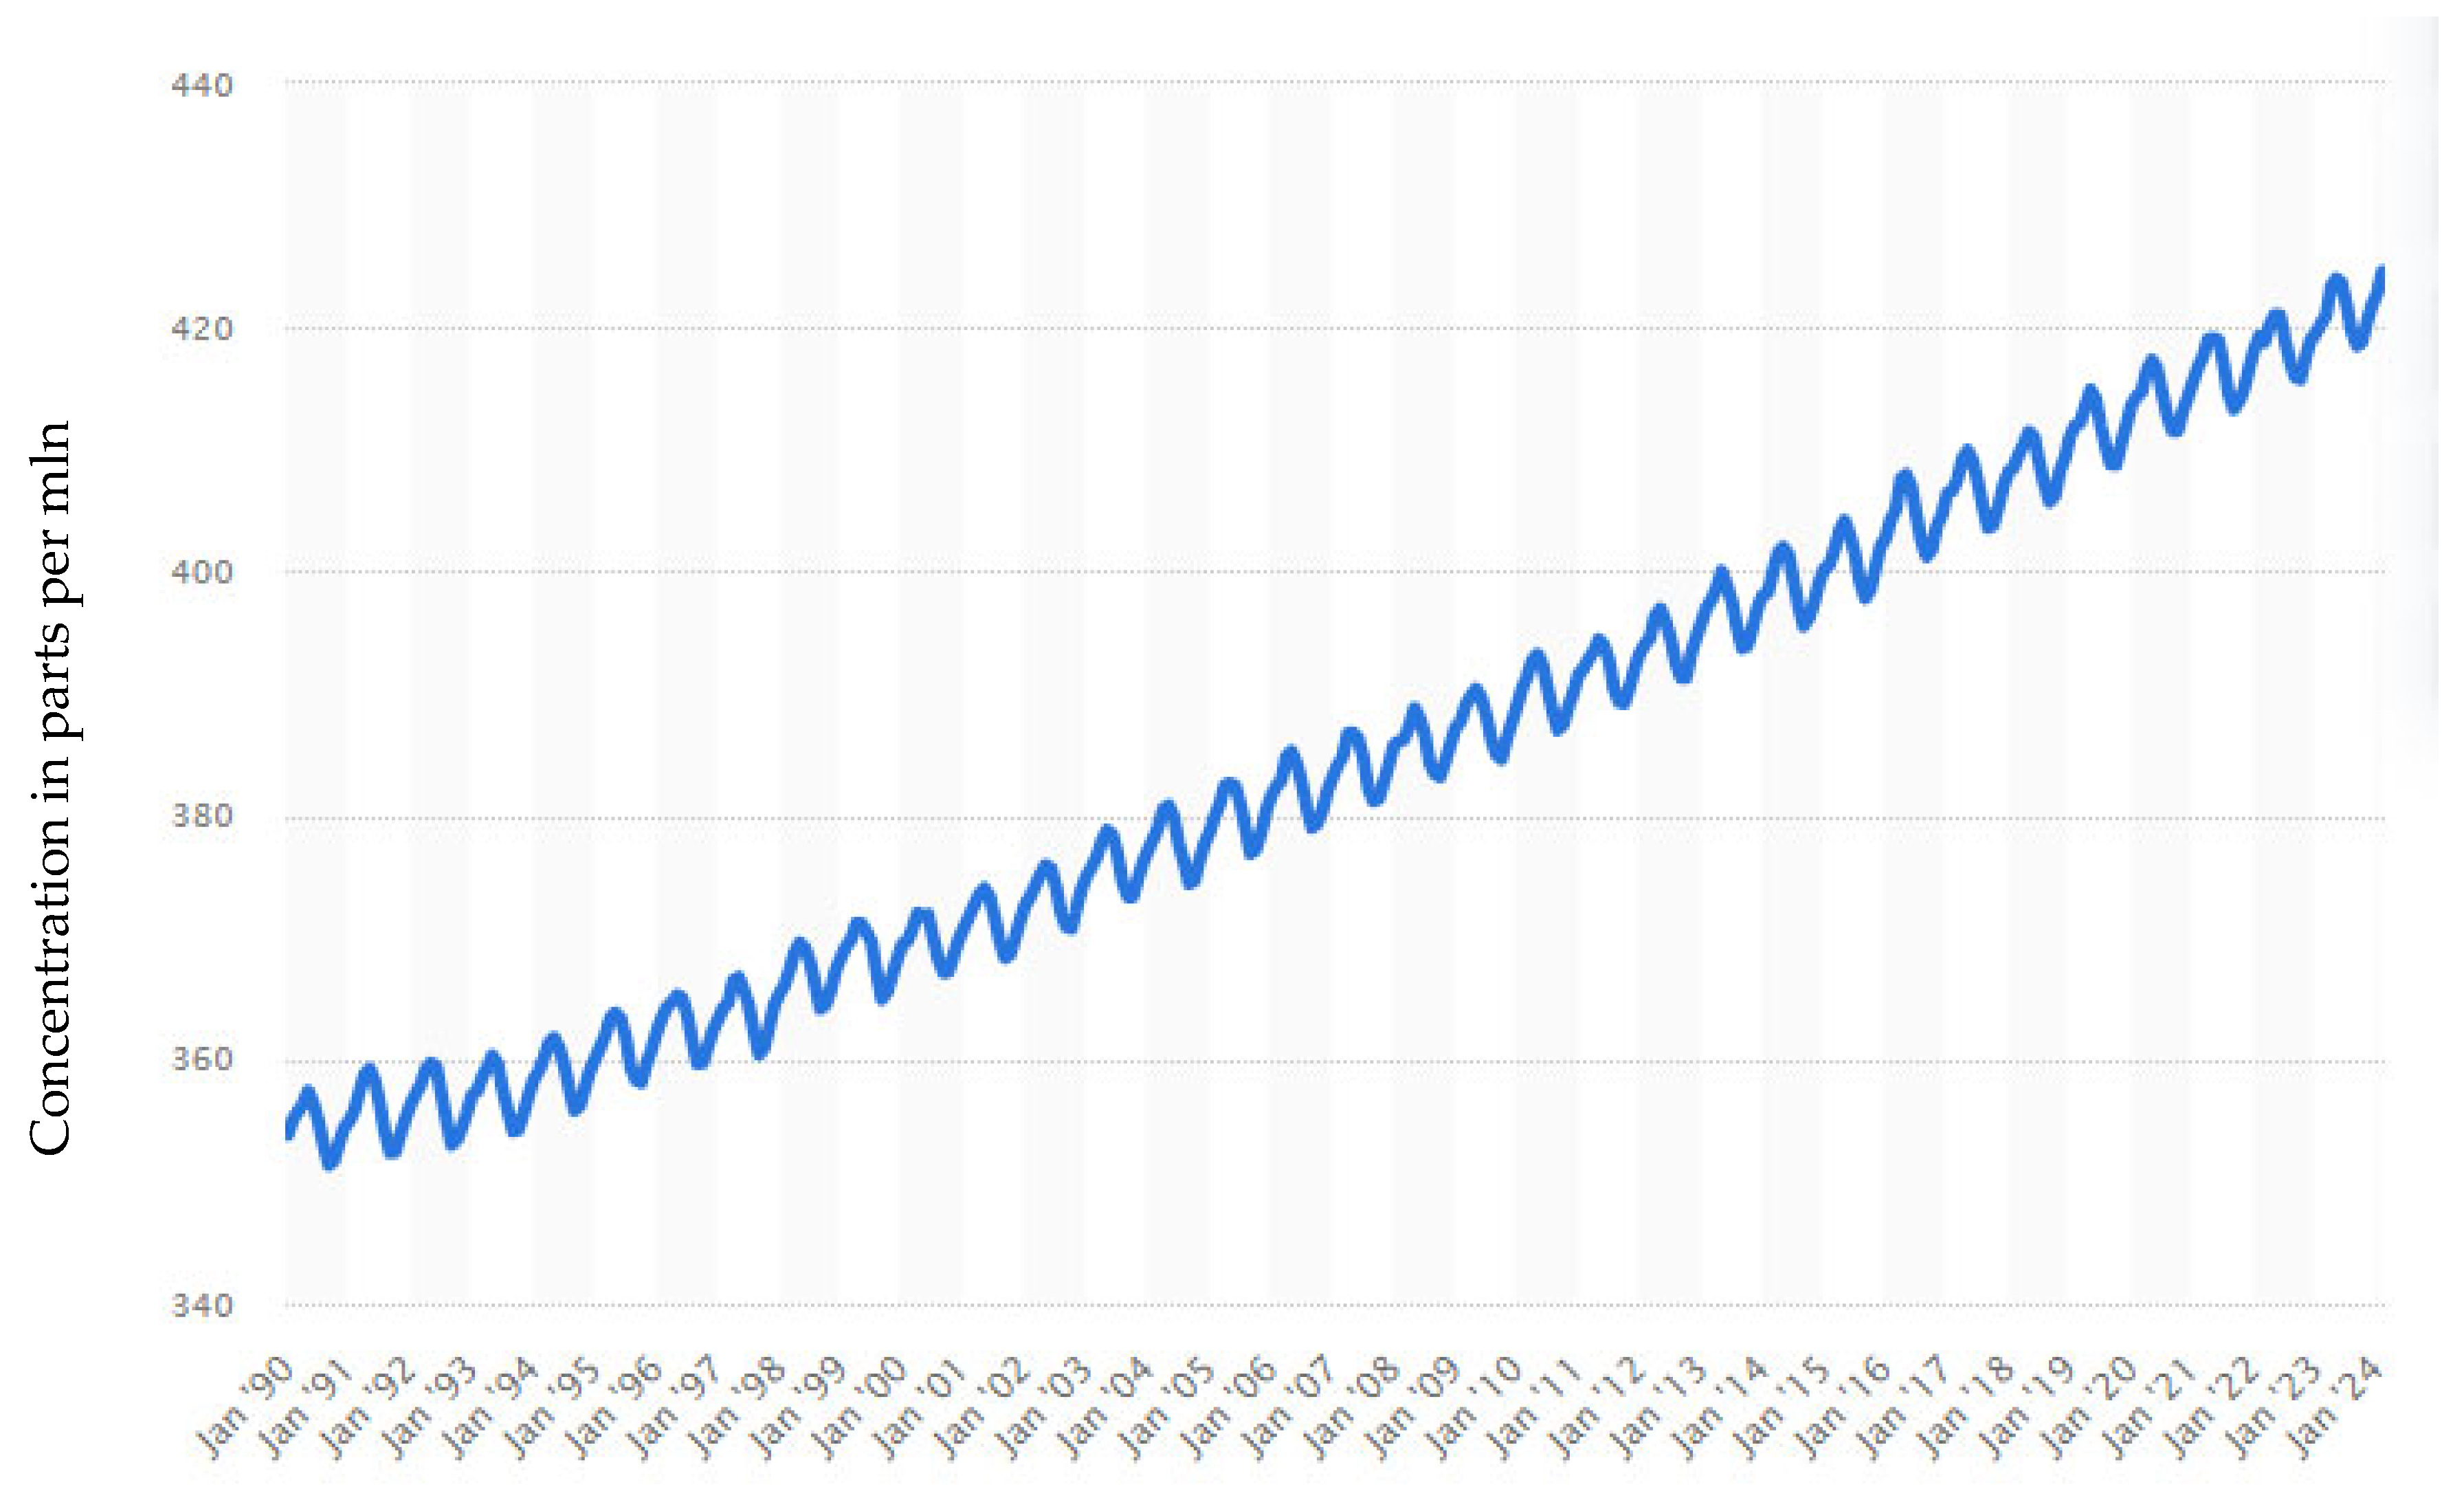
  43. Average Monthly Carbon Dioxide (CO2) Levels in the Atmosphere Worldwide from 1990 to 2024. 2024. Available online: https://www.statista.com/statistics/1091999/atmospheric-concentration-of-co2-historic/ (accessed on 13 March 2025).
  44. Wright, R.M.; Quéré, C.L.; Mayot, N.; Olsen, A.; Bakker, D. Fingerprint of climate change on Southern Ocean carbon storage. ESS Open Arch. 2022, 12. [Google Scholar] [CrossRef]
  45. Hoang, K.T.; Thilker, C.A.; Knudsen, B.R.; Imsland, L.S. A hierarchical framework for minimising emissions in hybrid gas-renewable energy systems under forecast uncertainty. Appl. Energy 2024, 373, 123796. [Google Scholar] [CrossRef]
  46. Ritchie, H.; Rosado, P.; Roser, M. CO2 and Greenhouse Gas Emissions. Data Adapted from Global Carbon Project, Bolt and van Zanden. 2023. Available online: https://ourworldindata.org/grapher/co2-intensity (accessed on 13 March 2025).
  47. Fischer, C.; Newell, R. Environmental and technology policies for climate mitigation. J. Environ. Econ. Manag. 2008, 55/2, 142–162. Available online: https://ideas.repec.org/a/eee/jeeman/v55y2008i2p142-162.html (accessed on 13 March 2025). [CrossRef]
  48. Roser, M.; Arriagada, P.; Hasell, J.; Ritchie, H.; Ortiz-Ospina, E. Economic Growth. Data adapted from World Bank, Bolt and van Zanden, Angus Maddison. 2023. Available online: https://ourworldindata.org/grapher/global-gdp-over-the-long-run (accessed on 13 March 2025).
  49. Polish Ministry of Climate and Environment. National Action Plan for Renewable Energy Sources; Ministry of Climate and Environment: Warsaw, Poland, 2020. [Google Scholar]
  50. Smith, A.; Johnson, B. Renewable Energy Policies and Job Creation: The Case of Poland. Renew. Energy 2020, 112, 14–22. [Google Scholar]
  51. Yakymchuk, A.; Popadynets, N.; Valyukh, A.; Skrypko, T.; Levkov, K. Rural “green” tourism as a driver of local economy development in the process of decentralization of power. Agric. Resour. Econ. 2021, 7, 232–259. [Google Scholar]
  52. Yakymchuk, A.; Valyukh, A.; Pustovit, N.; Yakymchuk, O. Development of the Nature-Reserved Fund of Ukraine on the Basis of the Best Polish Experience. In Proceedings of the 2022 IX International Scientific Conference Determinants of Regional Development, Pila, Poland, 27–28 October 2022; pp. 79–95. [Google Scholar] [CrossRef]
  53. What are the Sustainable Development Goals? 2024. Available online: https://www.sightsavers.org/policy-and-advocacy/global-goals/?gad_source=1&gclid=Cj0KCQiAy9msBhD0ARIsANbk0A8x3Z2OnYDAmW8AnYh0x_J1zig90-bAHcaScOs_SQ2D5UOCrks7GksaApPaEALw_wcB (accessed on 13 March 2025).
  54. Griffiths, I.; Wang, R.; Ling-Chin, J.; Roskilly, A.P. Solid oxide fuel cells with integrated direct air carbon capture: A techno-economic study. Energy Convers. Manag. 2024, 315, 118739. [Google Scholar] [CrossRef]
  55. Organisation for Economic Co-operation and Development (OECD). OECD Data: Gross National Income. Available online: https://data.oecd.org (accessed on 13 March 2025).
  56. Poland—Contribution of Travel and Tourism to GDP as a Share of GDP. Poland Contribution of Travel and Tourism to GDP (% of GDP), 1995–2020. 2019. Available online: http://www.knoema.com (accessed on 13 March 2025).
Figure 1. Variables of the Kaya Identity. Percentage change over the years from 1969 to 2023 of the variables involved in the Kaya Identity; the variables have been partly linearly imputed before 1990. Source: calculated by the authors.
Energies 18 01661 g001
Figure 2. Impulse response functions for the VAR model transformed from the estimated VECM and identified via Cholesky restrictions; CO2 emissions are ordered last. Bootstrap confidence intervals based on 100 draws. Source: calculated by the authors.
Energies 18 01661 g002
Figure 3. Changes in carbon dioxide emissions in the selected countries worldwide from 1990 to 2022. Source: based on data from [1,3,28,29,32]. * updated statistical data.
Energies 18 01661 g003
Figure 4. Change in global CO2 emissions by fuel type, relative to 2019 levels, from 2015 to 2022. Source: based on data from [39,40,41,42].
Energies 18 01661 g004
Figure 5. Distribution of carbon dioxide emissions worldwide by sector in 2022. Source: based on data from [17].
Energies 18 01661 g005
Figure 6. Global atmospheric concentration of carbon dioxide by month from 1990 to 2024. Source: based on data from [43].
Energies 18 01661 g006
Table 1. Data statistics for the correlation–regression model.
YearFossil CO2 Emissions, mln TonsPopulation, mln Persons
196915,669.73760.1
197015,678.83770.2
197115,679.73773.4
197216,464.93844.8
197317,441.83920.3
197417,396.43995.5
197517,346.54069.4
197618,3294142.5
197718,874.34215.7
197819,477.44289.7
197920,031.94365.6
198019,803.84444
198119,439.74524.6
198219,184.24607.9
198319,301.74691.9
198419,904.74775.8
198520,176.74861.7
198620,530.34950
198721,195.45040.9
198821,945.75132.3
198922,341.85223.7
199022,450.45316.2
19912259.15406.2
199222,488.65492.7
199322,664.35577.4
199422,898.95660.7
199523,619.15743.2
199624,075.95825.1
199724,398.35906.5
199824,541.65987.3
199924,733.76067.8
200025,593.76148.9
200125,877.96230.8
200226,350.16312.4
200327,513.96393.9
200428,729.36475.8
200529,7696558.2
200630,756.26641.4
200731,916.56725.9
200832,124.46811.6
200931,770.56898.3
201033,587.86985.6
201134,578.47073.1
201234,790.67161.7
201335,416.67250.6
201435,686.87339
201535,631.17426.6
201635,753.37513.5
201736,0307599.8
201836,7707683.8
201937,0407764.9
202035,0107840.9
202136,8207909.3
202237,1507975.1
202337,5508045.3
Source: based on [1,3,6,13,16,19,22,29,32,33,34].
Table 2. Results of the verification of the model of dependence of the world population size and fossil CO2 emissions.
IndicatorRegression Statistics of the Model
Observations53
Multiple R0.980622763
R-squared0.961621004
Normalized R-squared0.960868474
Standard error1379670296
Source: calculated by the authors.
Table 3. Comparison of the GDPs, renewable energy shares, and CO2 emissions of the developed countries of the world, 2021.
CountryGDP (Trillion $)CO2 Emissions (Metric tons per Capita)Renewable Energy Share (%)Carbon Intensity, kg CO2
United States21.4316.611.60.301
China14.347.126.80.702
European Union18.716.418.90.342
India2.871.919.80.551
Germany4.428.914.80.203
Brazil1.872.142.30.112
Source: author’s work based on [1,3,6,13,16,19,21,22,29,33,34].
Table 4. Instruments of perspectives on reducing the negative impact of CO2 from fossil fuels.
Perspective on Reducing the Negative Impact of CO2Content of Perspective on Reducing the Negative Impact of CO2 from Fossil FuelsSource
Transition to renewable energy sourcesA fundamental strategy for mitigating CO2 emissions involves transitioning from fossil fuels to renewable energy sources such as solar, wind, and hydroelectric power. This shift not only reduces greenhouse gas emissions but also promotes energy security and independence.[1,12,14,15,20,22,23,25,26,40,42,43,44,48,49,50,51]
Energy efficiency improvementsEnhancing energy efficiency across various sectors, including industry, transportation, and buildings, can significantly reduce the demand for fossil fuels and associated CO2 emissions. Investments in energy-efficient technologies and practices offer cost-effective solutions for lowering emissions while improving productivity.[4,5,15,16,17,28,31,34,35,38,39,41,43,45,48,51,52]
Carbon pricing mechanismsImplementing carbon pricing mechanisms, such as carbon taxes or emissions trading systems, internalizes the social cost of CO2 emissions and provides economic incentives for emission reductions. By placing a price on carbon, these mechanisms encourage businesses and consumers to adopt cleaner technologies and behaviors.[5,8,14,15,16,17,24,33,34,35,36,37,42,43,47,50,52,53]
Technological innovation and researchContinued investment in research and development of low-carbon technologies is essential for accelerating the transition away from fossil fuels. Innovations in renewable energy, carbon capture and storage (CCS), and sustainable transportation offer promising solutions for reducing CO2 emissions while fostering economic growth.[3,6,7,9,14,15,20,24,26,28,34,39,41,44,50,51,52,53]
Policy support and international cooperationStrong policy frameworks at the national and international levels are critical for driving emissions reductions and promoting clean energy transitions. Governments play a central role in setting ambitious targets, implementing supportive policies, and providing incentives for clean energy investments. International cooperation is also vital for addressing transboundary environmental challenges and promoting global climate action.[5,14,15,17,19,22,23,28,32,36,40,41,46,50,51,53,54]
Decentralized energy systemsTransitioning towards decentralized energy systems, characterized by distributed generation and localized energy production, can enhance resilience, reduce transmission losses, and facilitate the integration of renewable energy sources. Community-led initiatives and decentralized energy solutions empower local stakeholders and promote sustainable development.[4,11,13,14,25,32,33,35,39,43,49,50,55,56]
Behavioral change and public awarenessPromoting public awareness and fostering behavioral change are essential components of efforts to reduce CO2 emissions. Education, outreach campaigns, and incentives for sustainable behaviors can mobilize individuals and communities to adopt environmentally friendly practices, such as energy conservation, recycling, and alternative transportation modes.[4,9,11,13,14,15,17,19,21,26,28,30,31,35,50,51,54]
Natural climate solutionsHarnessing the potential of natural climate solutions, such as reforestation, afforestation, and sustainable land management, can sequester carbon dioxide from the atmosphere and mitigate the impacts of climate change. Protecting and restoring ecosystems, including forests, wetlands, and mangroves, not only mitigates CO2 emissions but also enhances biodiversity and ecosystem services.[1,6,9,10,13,14,15,16,22,29,34,35,39,42,48,49]
Just transition and social equityTransitioning to a low-carbon economy must be accompanied by efforts to ensure social equity and address the needs of vulnerable communities. A just transition framework emphasizes fair employment opportunities, social safety nets, and inclusive decision-making processes to mitigate the social and economic impacts of decarbonization.[2,7,8,10,11,12,13,14,15,17,20,26,34,35,37,38,40,45,48,51,53]
Long-term planning and resilience buildingLong-term planning and resilience building are essential for adapting to climate change and minimizing its adverse effects. Integrated climate risk assessments, infrastructure investments, and adaptive management strategies enhance resilience to climate-related hazards and uncertainties, reducing the vulnerability of communities and ecosystems.[4,5,6,11,14,15,17,18,24,25,26,30,31,33,35,36,40,41,42,44,45,46,48,50,51,52,53,56];
Source: compiled by the authors.
Disclaimer/Publisher’s Note: The statements, opinions and data contained in all publications are solely those of the individual author(s) and contributor(s) and not of MDPI and/or the editor(s). MDPI and/or the editor(s) disclaim responsibility for any injury to people or property resulting from any ideas, methods, instructions or products referred to in the content.

