Article

Comparative Energy and Environmental Analysis of Combined Cycle CHP Combustion Operations via Simulation for Biomass and Industrial Materials Derived from Waste

by
Dasith Wijesekara
1,
Lasitha Kularathna
1,
Pawani Abesundara
1,
Udayangani Lankathilaka
1,
Imesha Muhandiram
1,
Prasad Amarasinghe
1,
Shakya Abesinghe
1,
Chanaka Galpaya
2 and
Kaveenga Koswattage
1,2,*
1
Faculty of Technology, Sabaragamuwa University of Sri Lanka, Belihuloya 70140, Sri Lanka
2
Center for Nano Device Fabrication and Characterization (CNFC), Faculty of Technology, Sabaragamuwa University of Sri Lanka, Belihuloya 70140, Sri Lanka
*
Author to whom correspondence should be addressed.
Energies 2025, 18(12), 3062; https://doi.org/10.3390/en18123062
Submission received: 22 March 2025 / Revised: 25 April 2025 / Accepted: 30 April 2025 / Published: 10 June 2025
(This article belongs to the Section B: Energy and Environment)

Abstract

The Combined Cycle Combined Heat and Power (CCCHP) systems are an effective way to improve energy efficiency and reduce emissions. This paper examines the energy and environmental impact of CCCHP combustion using waste biomass like the biomass of spent wash (SW), waste crankcase oil (WCO), and bagasse (BA) using an advanced Ebsilon Professional 16 software simulation model. The simulations were designed to achieve 150 MW total power output and 25 MW heating energy. Simulation results indicate that the minimum fuel feed requirement of a 10.762 kg/s flow rate was recorded at the highest calorific value (CV) fuel briquette of 1:8 ratio BA–WCO. The BA–WCO system demonstrates a significantly higher heat recovery capacity in the heat recovery steam generator (HRSG) compared to the BA–SW system. At a 1:8 ratio, it recovers 1463 kJ/kg versus 583 kJ/kg, and 1391 kJ/kg versus 498 kJ/kg at a 1:3 ratio. The CCCHP efficiency was much higher for BA–WCO than those developed from spent wash–bagasse, yielding up to 41.1% compared to a maximum of 26.71%. Furthermore, the BA–WCO system showed a better result than the BA–SW CCCHP system by emitting a low amount of flue gas with low temperature.

1. Introduction

Biomass energy is one of the earliest energy sources. Since humans discovered fire a quarter of a million years ago, the burning of biomass fuels has been used to generate energy [1]. From ancient times, and still so today, the most widely used conversion method for biomass is combustion. Biomass combustion is a reaction of biomass such as wood, crop residues, or other organic materials with oxygen in the air to generate energy. The chemical energy in the biomass fuel is converted into heat through the combustion [2]. The stoichiometric equation for the combustion of biomass is given as follows:
Biomass + O2 + N2 → CO2 + H2O (g) + N2 + Heat
Current estimates of the energy in biomass used annually for traditional and modern combustion applications are 33.5 and 16.6 EJ, respectively, and combustion accounts for 85 percent of the world’s energy usage [2,3]. The use of biomass fuels in combustion also provides substantial benefits with regards to environmental concerns. Biomass absorbs carbon dioxide during its growth and emits it during combustion [4]. The utilization of biomass fuels for power production offers the advantage of a renewable and CO2-neutral fuel [5]. Furthermore, using municipal and industrial waste biomass for combustion offers a sustainable waste management solution. The use of biomass resources reduces the dependency on fossil energy resources such as coal and petroleum fuel [6]. Furthermore, the utilization of techniques such as cogeneration of power and heat generation can also be introduced in biorefinery operations to improve the efficiency of biomass combustion technology and expand capacity for biomass combustion and related systems [7].
Based on the findings of recent studies, there appears to be a huge potential for integrating renewable energies like solar energy with fossil fuel in a combined cycle power plant operation to enhance efficiency while reducing environmental impact. As an example, the integrated solar combined cycle system (ISCCS) used a solar-based steam methane reforming (SMR) system to gain a higher efficiency improvement compared with the conventional steam turbine system [8]. These improvements show the significance of replacing or reducing non-renewable fossil fuel consumption with renewable fuel sources. The present study also uses a similar approach of reducing fossil fuels with waste biomass-derived briquettes made from spent wash, bagasse, and the industrial waste crankcase oil, integrating them with Combined Cycle Combined Heat and Power (CCCHP) systems. This method utilizes the industrial waste streams and contributes to decarbonizing the energy sector by reducing the reliance on non-renewable fossil fuels, while providing an effective waste management solution.

1.1. Importance of Combined Heat and Power (CHP) Operation

In recent years, concepts of integrating renewables in an integrated energy system (IES), that is the integration of different energy sources, have been proposed and among various energy technologies, combined heat and power (CHP) plants have risen in interest due to their high efficiency [9]. The CHP process allows the simultaneous production of usable heat and electricity in an integrated process using a common fuel or energy source [10]. While producing electricity, the CHP plant can also supply heat for the heating demand of other heating purposes. By using the CHP operation, it is possible to use the energy source in a more efficient way and reduce the environmental impact [11]. In 2008, the International Energy Agency (IEA) presented a report on the benefits of CHP investments, and it showed that CHP is a cost-effective and important solution for the reduction of CO2 emissions. Furthermore, they also predict a reduction in the investment costs, owing to lower investments in transmission and distribution networks. Technological flexibility improves the operational flexibility of the system; promotes renewable energy integration; ensures the safety, economic operation, and market profitability of CHP plants; and improves the profitability and safety of the electricity and heating sectors [10].

1.2. Challenges and Difficulties of Biomass Utilization for Combustion Application

Utilizing biomass for burning purposes offers a route towards generating energy. However, various obstacles and challenges impede its widespread implementation. This segment delves into the hurdles in using biomass for burning purposes, concentrating on fuel properties, technological constraints, and environmental consequences. Combusting biomass offers an environmentally friendly technique to produce energy. However, storage is a significant challenge in the use of biomass. Due to its bulk and high moisture content, raw biomass is vulnerable to spontaneous combustion, self-heating, and microbial deterioration. Maintaining biomass quality requires proper storage conditions, which come at an additional expense. Briquettes, which have a higher energy density, less moisture content, and better combustion efficiency, are frequently made from biomass to address these problems. Additionally, briquetting streamlines handling and shipping, making biomass a more viable and sustainable fuel source [12]. Agricultural residues and energy crops, which are types of second generation biomass fuels, can vary greatly in their chemical characteristics. This variability has an impact on how they burn. When compared to woody biomass, agricultural residues tend to have lower ash melting points and higher levels of elements like nitrogen (N), sulfur (S), and chlorine (Cl) [13]. These differences can lead to issues during combustion, such as ash build up, formation of slag, and increased emissions of nitrogen oxides (NOx) and sulfur dioxide (SO2) [13]. Burning agricultural biomass fuels can sometimes cause problems with ash. Straw, miscanthus, and maize are known to create clumps of ash and slag in boilers. When alkali metals like potassium (K) and sodium (Na) mix with silica (SiO2), they can form compounds with melting points that make slagging worse at the temperatures boilers usually operate [13]. Moreover, adapting current combustion technologies to accommodate woody biomass fuels poses a notable hurdle. Boilers originally intended for woody biomass may face difficulties coping with the increased ash content and lower melting points of residues [12,13]. This discrepancy can result in issues like a struggle to extinguish the fire, ash buildup, and slag formation, requiring regular maintenance and impacting efficiency levels [13]. For the technological progress of biomass use, the enhancement of combustion systems is crucial. For example, moving grate systems have demonstrated potential in dealing with fuels that are high in ash content by eliminating ash from the combustion area. Nevertheless, additional research and improvements are necessary to tune these systems for a variety of biomass fuels [13]. When biomass is burned, it can cause air pollution if not handled correctly. Agricultural residues containing nitrogen can produce levels of NOx emissions, which are difficult to regulate using standard combustion methods. Moreover, the inclusion of chlorine and sulfur in biomass fuels may lead to the release of hydrochloric acid (HCl) and SO2, which can contribute to rain and damage combustion equipment [14]. The emission of particles is a concern when burning biomass, as incomplete combustion can release particles that pose health risks and contribute to air pollution. To address these problems, advanced technologies, like precipitators and fabric filters, are crucial for reducing these emissions and meeting environmental standards [15].

1.3. Importance of Industrial Waste Biomass Combustion for CHP Applications

The CHP system saves 30–40% of energy when compared with separated heat and power generation applications [16]. Conventional CHP systems use coal and hydrocarbon as their main fuel. Coal burning has created a lot of environmental issues in the world, such as high carbon dioxide emission, GHG emission, and an effect on wider climate change [17]. But nowadays, a lot of industries are changing from coal and traditional fuel to renewable and waste biomass incineration CHP systems [18]. More advantages can be gained through these changes; waste management solutions can be provided for industrial waste and fuel costs can be saved for CHP systems. This will provide motivation for newcomers in the CHP industry. In the sugar manufacturing process, bagasse is generated as an agricultural residue. It is produces in very large quantities, and many industries are facing huge problems in providing waste management solutions for this waste [19]. They have to store this waste inside their factory premises. Due to the low bulk density of this material, it takes up a large amount of space in industrial settings. It is a burning issue for the sugar manufacturing industries [20]. Spent wash is another main waste stream, generated while producing bioethanol using molasses, which is a by-product of the sugar manufacturing industry. This is a liquid waste, and when producing one liter of ethanol, eighteen liters of liquid waste, including spent wash, are generated [21]. This waste generation rate is also very high, and it has become a critical issue in bioethanol-producing industries. In total, 700 million tons of sugarcane bagasse are produced annually worldwide [22]. Approximately 24 million metric tons of waste engine oil are produced each year worldwide [23], and in India, the distillery industry produces approximately 40 billion liters of spent wash annually [24]. Discharging these underutilized waste materials into the environment causes significant pollution. If we can use these waste materials as a fuel for the CHP system, there are a lot of advantages for these industries. Waste management solutions can be provided for agricultural residue as well as spent wash. Then, without disturbing the production process, industries can smoothly run their sugar manufacturing operations and the bioethanol production process. This initiative will provide sustainable waste management solutions for these waste materials. Waste crankcase oil (WCO) is another industrially generated waste which is focused on in this research study. Around 40% of automotive lubrication oil is discarded without proper treatment, leading to huge environmental pollution and the wasting of an energy-rich valuable resource [25]. Moreover, the recycling of this oil can help extract waste energy, conserve resources, and reduce environmental damage.
Normal CHP systems are run using traditional fuels, making it expensive; therefore, through this new initiative of converting industrial waste into fuel, companies can also save energy costs. It will provide resource recovery and sustainable waste management solutions to the world. The study of the potential to use biomass and industrial waste for CHP systems in an efficient manner is very important for the future. The composition of biomass and industrial waste can be changed in different ratios to achieve optimum efficiency of the CHP system, which is very important. Performing these analyses by constructing a CHP plant physically is very costly, and impossible with the current financial structure. That is why a simulation is very important for these types of studies. For this study, the EBSILON professional 16 simulation software is used to simulate the CHP system for different biomass and industrial waste ratios to achieve optimum system efficiency.

1.4. EBSILON Simulation with Different Types of Solid Fuel

Germany’s STEAG GmbH created the simulation platform EBSILON. It is useful for mass balance and heat balance calculations and the design, assessment, and optimization of various power plant types [26]. The EBSILON professional 16 Software is an advanced software application that can accurately, and with flexibility, model thermodynamic cycle operations. In the field of energy, it is used to simulate and optimize power plants, optimizing their performance and efficiency from the beginning of design to the end of operation [27]. The EBSILON software provides predefined components related to thermal power stations and is also compatible with a wide range of working materials (coal, LNG, steam, exhaust gasses, and binary mixtures) with a user-friendly GUI compared to other alternatives such as Aspen HYSYS. Also, these components come up with characteristic equations, which can be used in computational matrices. These equations can be solved using the Gauss–Seidel algorithm after the linearization. Also, this software uses standard libraries such as the water–steam table IAPWS-IF97, the REFProp (for organic fluids), and also Coolprop and TREND, which are very useful in thermodynamic applications [27]. This study uses the Ebsilon software to simulate the generation of power using different fuel sources according to their heating values. The heating values quantify the total amount of heat energy produced during the complete combustion of a specific amount of material. Heating values are a measure of the energy content contained within a substance, typically expressed in terms of energy per unit mass or volume [28]. Bagasse is the fibrous, pulpy substance that remains after crushing sugarcane to extract the juice. All of the fuel used in sugar plant production operations is made of sugarcane bagasse, which also produces heat and power [29]. The bagasse and WCO, mixed in various proportions, produce high-energy briquettes. This study analyzed the CV, mean, and highest heating value of each briquette’s ratios. The 1:3 bagasse-to-WCO (BA–WCO) calorific value was 26.465 MJ/kg [30]. The higher calorific value of 1:8 bagasse-to-waste oil energy briquettes has a 41.141 MJ/kg calorific value [30]. The calorific value of the raw bagasse sample is 21.035 MJ/kg [19,30]. In this study, the production of energy briquettes using sugarcane bagasse and spent wash from sugarcane industry waste was investigated. This study analyzed the calorific value of various bagasse-to-spent wash (BA–SW) briquette ratios. The non-evaporated spent wash–bagasse 1:3 briquette sample had the maximum CV. The CV of the 1:3 and 1:8 ratio of non-evaporated spent wash with bagasse were 13.982 MJ/kg and 12.364 MJ/kg, respectively [19].

1.5. Objective of Research Study

The primary objective of this research study is to perform a comparative analysis of energy consumption and combustion efficiency variation for solid fuels burning in similar combustion processes. A combined heat and power simulated system was designed using Ebsilon Professional 16 simulation software and the thermodynamic, thermochemical, and physical rates were analyzed to evaluate the energy and combustion efficiency values. Sensitive analysis was performed for the combustion process for different biomass briquettes produced from industrial waste materials. The different CV ranges of different solid biofuels in the combustion system were analyzed to identify the optimum CHP operation condition that achieved the highest efficiency. Moreover, additional key outcomes of this study are the thermodynamic property analysis for different biomass briquettes’ combustion systems and the observation of the environmental impact of these biomass combustion operations. The findings from this study will afford insights into the improvement opportunities in the combustion operation, environmental impact, and possibility of replacing coal fuel with a renewable biomass source to create a sustainable energy practice.

2. Methods

The briquette samples prepared from the waste materials of bagasse, waste oil, and spent wash were analyzed and verified using an automatic bomb calorimeter (model 5E-C5508, CKIC Changsha, China). The CVs of bagasse-to-waste crankcase oil briquettes in ratios of 1:3 and 1:8 were recorded as 26.465 MJ/Kg and 41.141 MJ/Kg, respectively. The CVs of the fuel briquettes formed of bagasse and non-evaporated spent wash in ratios of 1:3 and 1:8 were 13.982 MJ/kg and 12.364 MJ/kg, respectively. The fuel feed conditions for the four different simulated systems are described in Table 1.

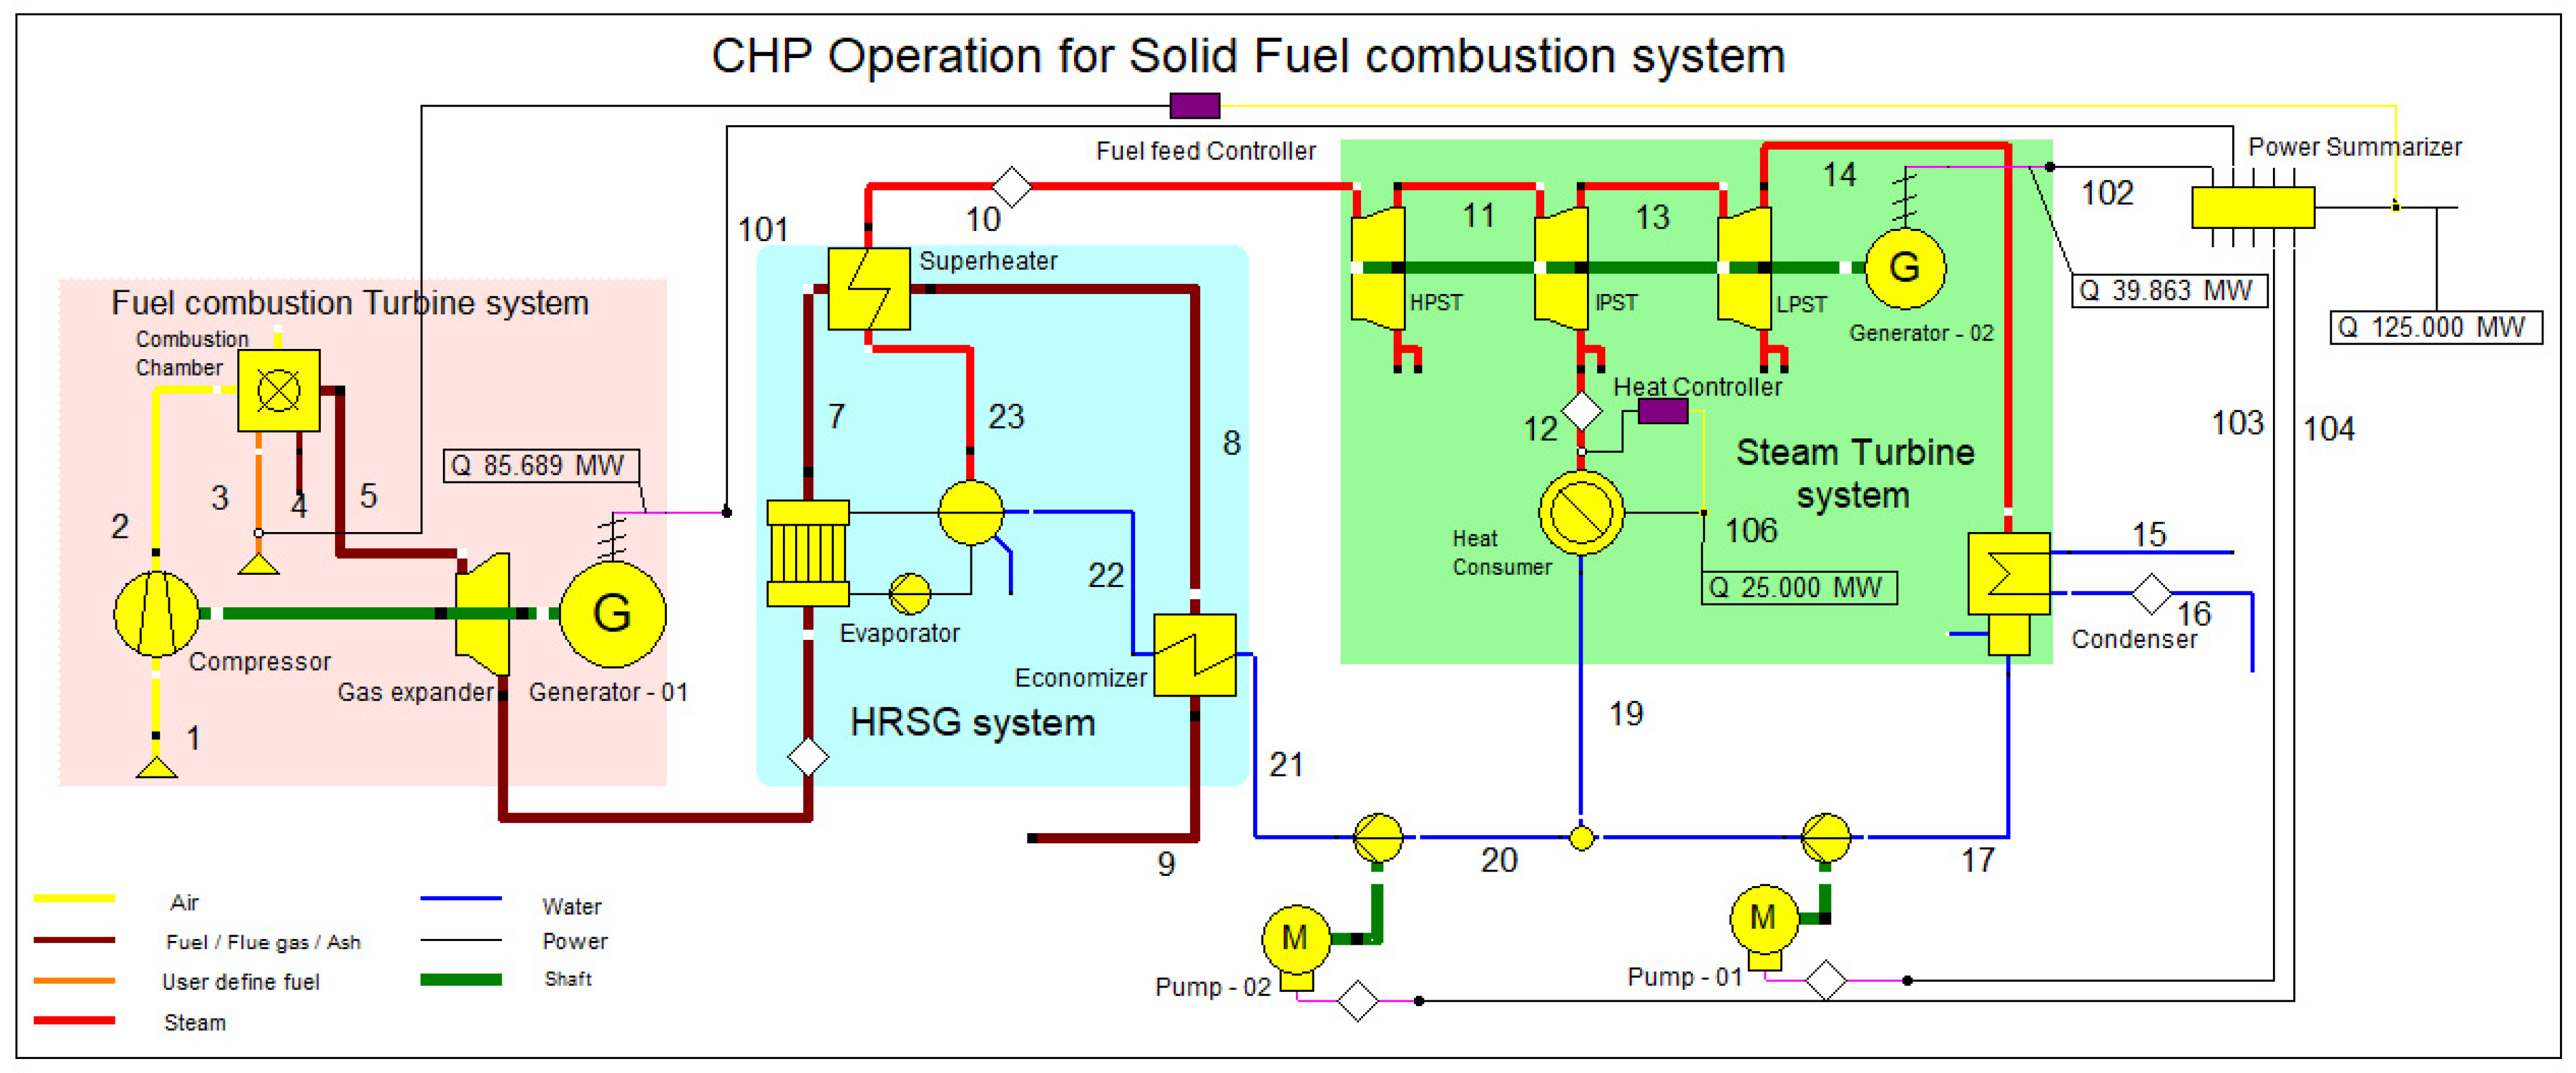
2.1. EBSILON Simulation Design Steps

The EBSILON professional 16 simulation software was used to simulate the combined heat and power (CHP) plant. This CHP plant model consists of three main designs: fuel combustion system, heat recovery steam generator system (HRSG), and steam turbine system, as shown in Figure 1. The design shown in Figure 1 efficiently represents the major components and processes of the CCCHP plant, and Table 2 defines the streamline description for Figure 1. Furthermore, a schematic diagram is shown in Appendix A.

2.2. Fuel Combustion System

Initially, the fuel combustion system was designed to combust the briquette samples. This fuel combustion system consists of an air compressor, fuel inlet, combustion chamber, expander, and generator to produce electricity, as shown in Figure 2. The primary air inlet was designed to inlet the air. The air compressor was used to pressurize the inlet air. The gas turbine unit’s generated power was intended to be used in the air compression process. The system was designed to generate 25 MW of heat energy and 125 MW of electricity in the CHP operation. In order to study the performance metrics when using various fuel input systems, three different gas turbine systems were built. In order to generate electricity, the gas turbine Brayton cycle assembly consists of an air compressor, with the combustion controllable variable being the electrical power generated and the controlling variable being the fuel input flow rate. Controllable variable is the electrical power generated, while the controlling variable is the fuel input flow rate. The fuel combustion system parameters are described in Table 3.

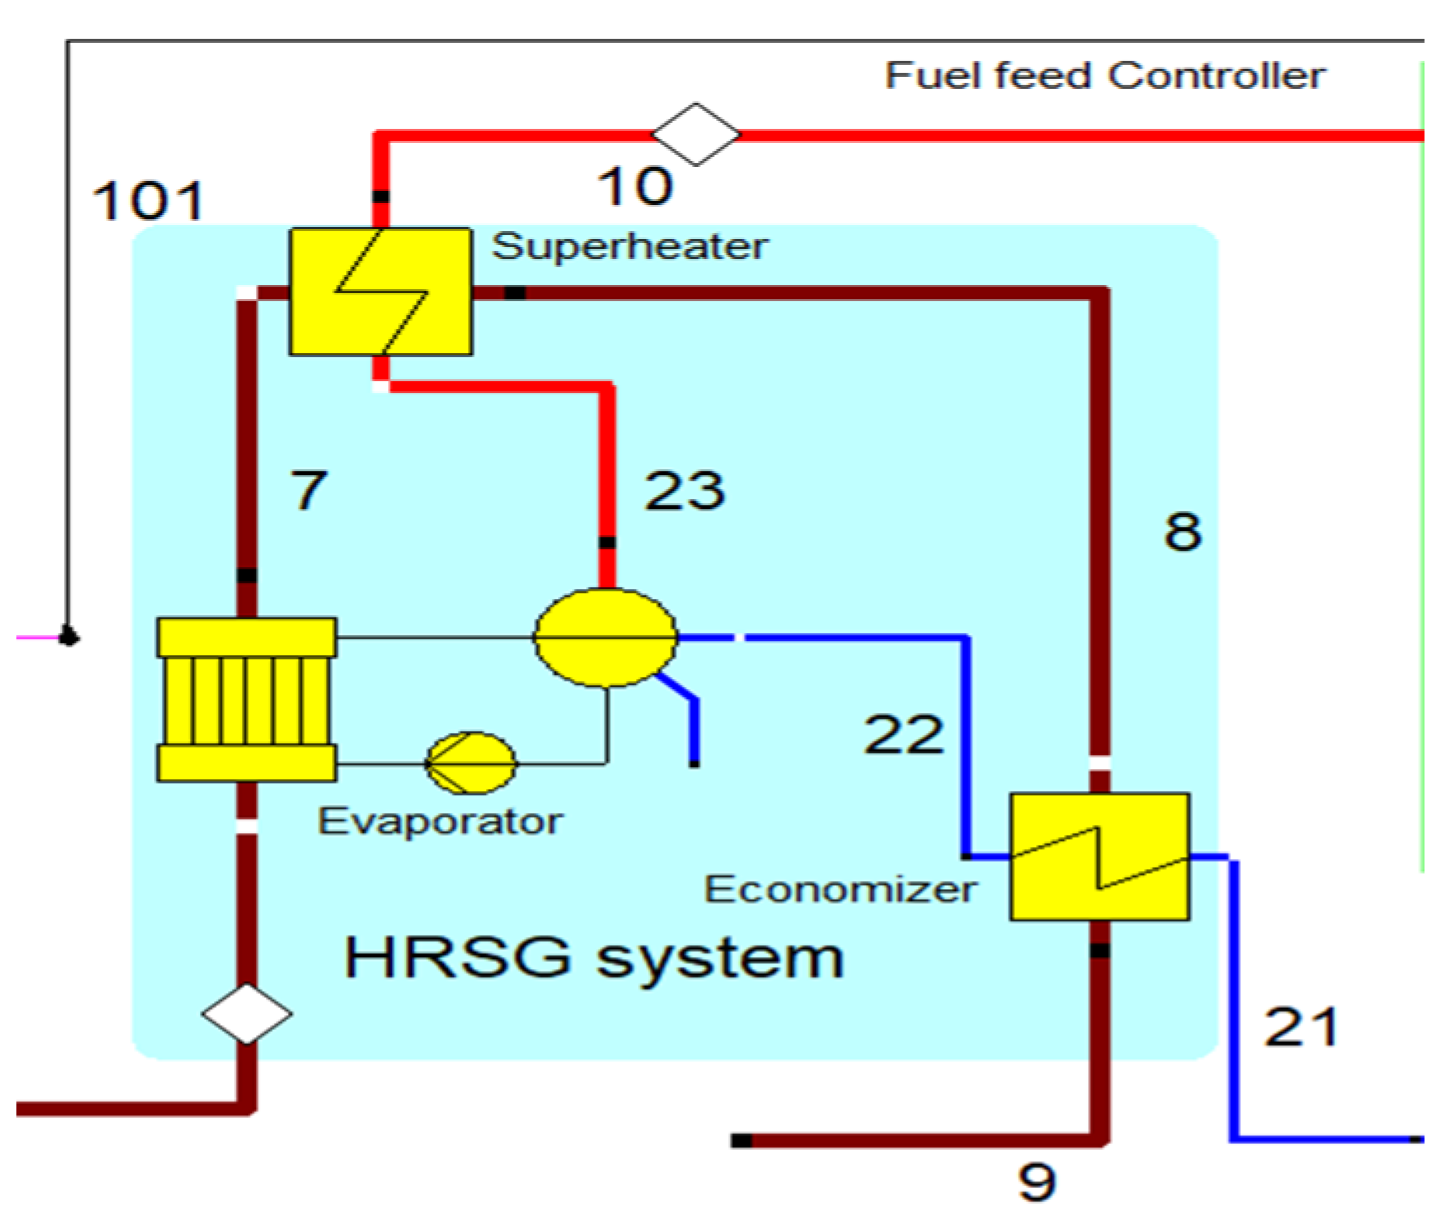
2.3. Heat Recovery Steam Generator (HRSG)

The heat recovery steam generator unit consists of an economizer, evaporator, and superheater, as shown in Figure 3’s arrangement. In the HRSG unit, heat transfer occurs between water and exhaust gasses. The exhaust gasses released from the combustion unit absorbed the water and generated the superheated steam at around 575 °C, with 120 bars from the inlet water temperature at around 42 °C. The HRSG parameters are described in Table 4.

2.4. Steam Turbine System

The combined cycle of power generation and CHP concepts are fulfilled, in part, by the steam turbine Rankine cycle system, which generates heat energy and electricity, as shown in Figure 4. Three distinct pressure and temperature units make up the steam turbine system: the low-pressure steam turbine (LPST), the intermediate-pressure steam turbine (IPST), and the high-pressure steam turbine (HPST). Their operation conditions are described in Table 5.

2.5. Power Generation, Collection, and Consumption

The simulation system was designed with combined cycle power generation. A gas turbine generator unit and a steam turbine system generator unit are the two locations where the power was generated in the simulation system. In addition, two pumping operations were incorporated into the design to return the condensate water to the HRSG system. The pumping process was powered by the electricity produced by the gas and steam turbine systems.

2.6. Physical Data Analysis—Energy

The data on the pressure, temperature, enthalpy, mass flow, entropy, and power consumption values of each stream and unit were taken from the Ebsilon professional 16 simulation software. Finally, a detailed analysis was conducted. These physical characteristics were crucial in determining which units used the most energy and power during operation, which is essential for enhancing this power generation process even more. Based on the results in Figure 5 and Figure 6, a lower mass flow rate and higher CV were found in the bagasse and waste crankcase oil (BA–WCO) samples compared to the bagasse and spent wash (BA–SW) samples.

2.7. Energy Efficiency Calculation

Finally, the energy efficiency of the simulation design is addressed. The energy efficiency is calculated in the whole system using this formula:
η e l = P e l m ˙ f u e l     L H V
where
  • ηel = electrical energy efficiency
  • Pel = electrical power produced (kW or MW)
  • mfuel = fuel feed rate (kg/s)
  • LHV = lower heating value of the fuel (kJ/kg)
η C C H P = P e l + Q t h m ˙ f u e l L H V
Here,
  • ηCCHP = overall energy efficiency of the CCHP system
  • Q t h = useful thermal energy produced (kW or MW)

3. Results and Discussion

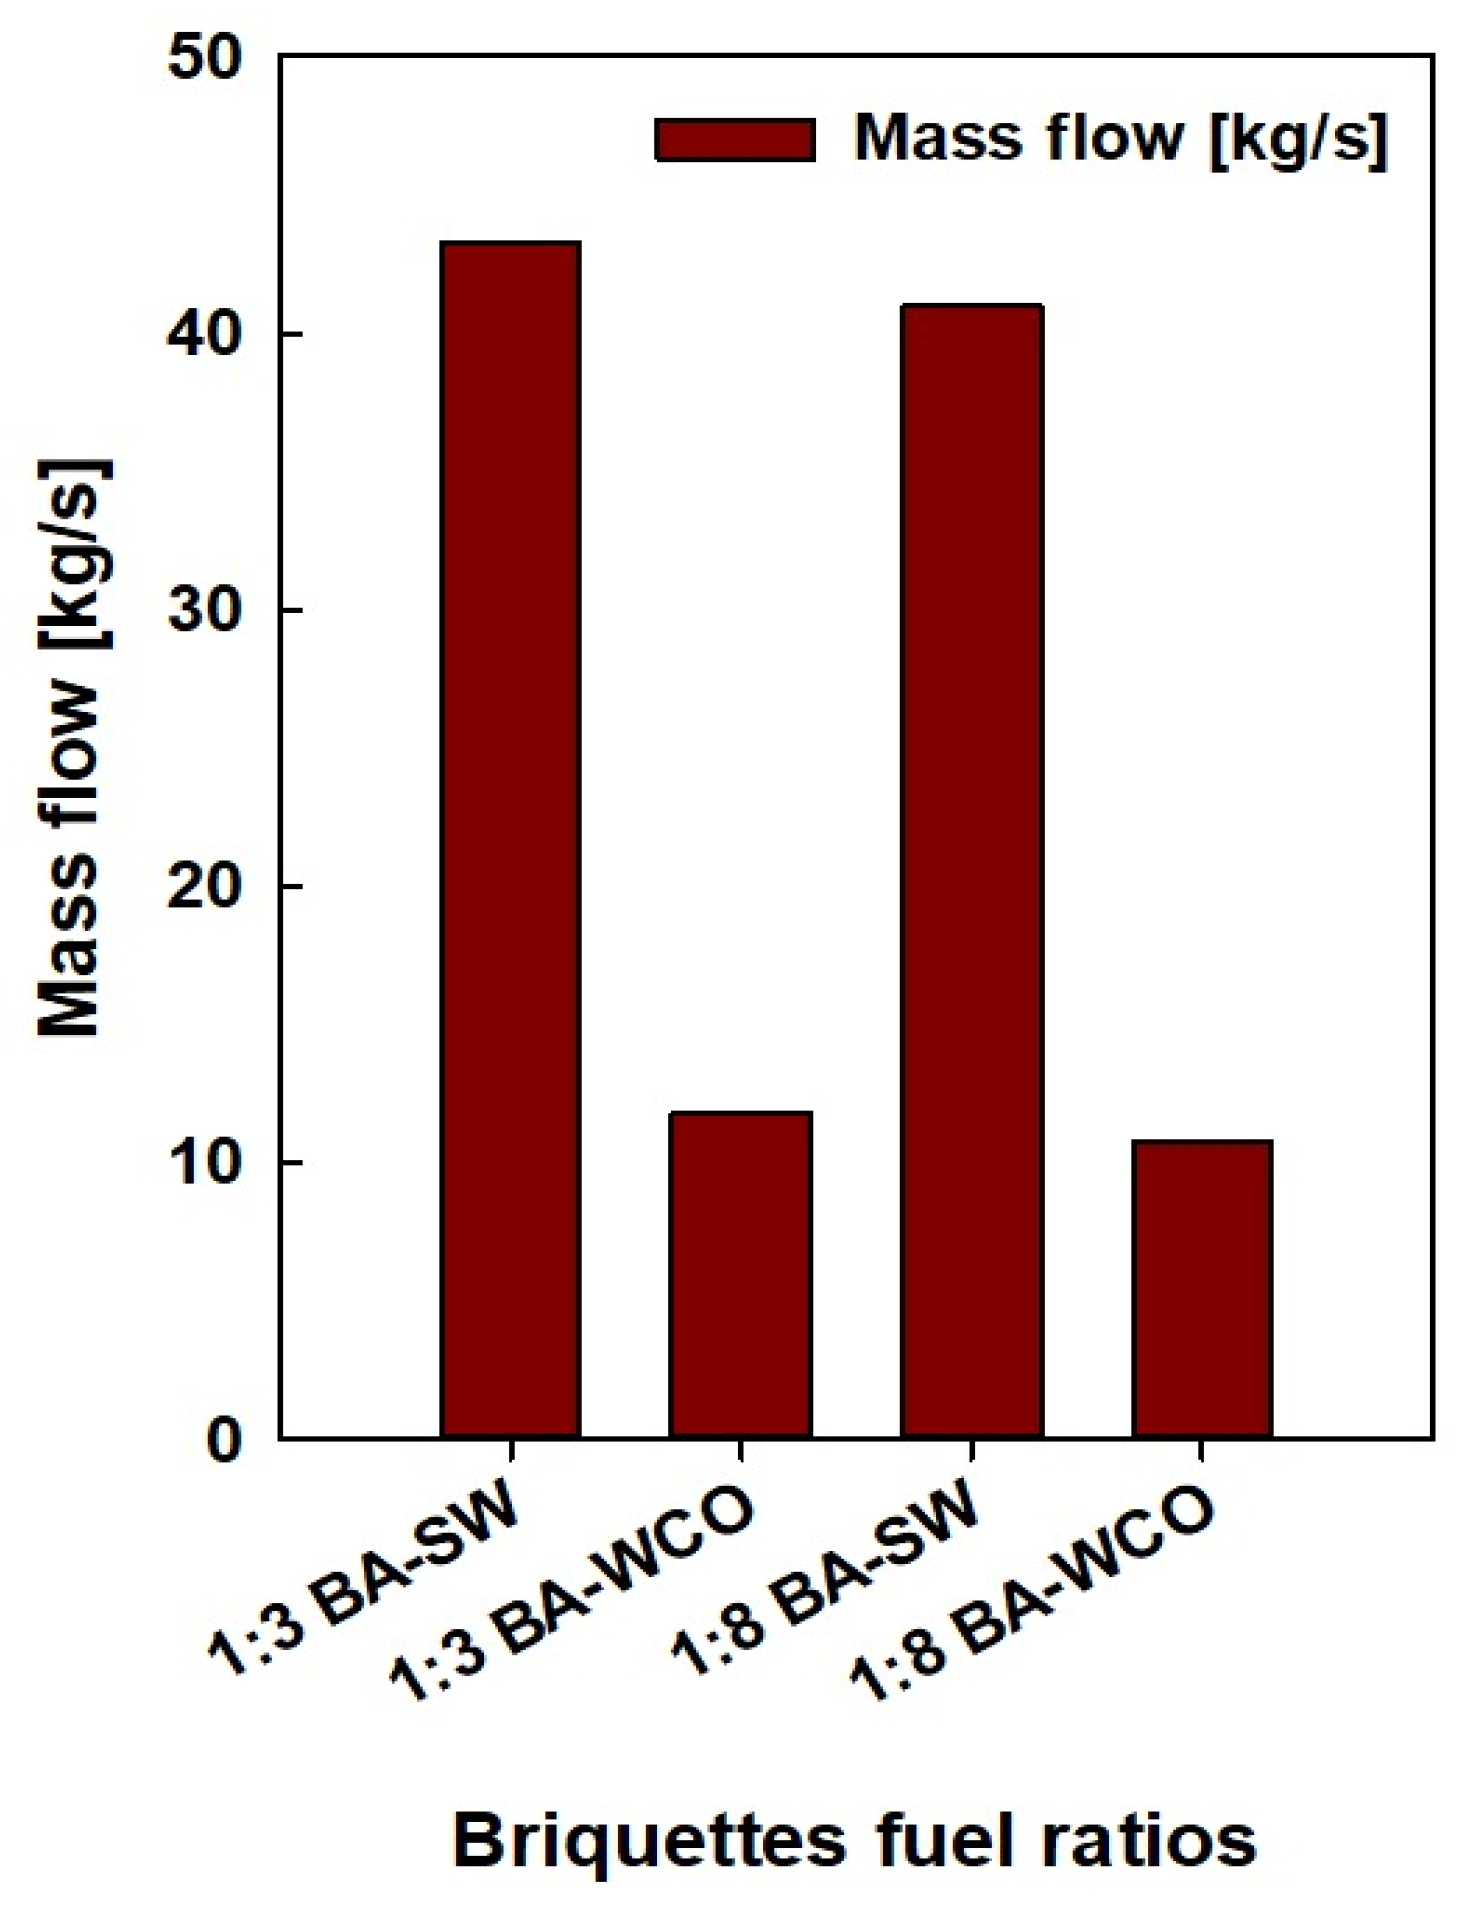
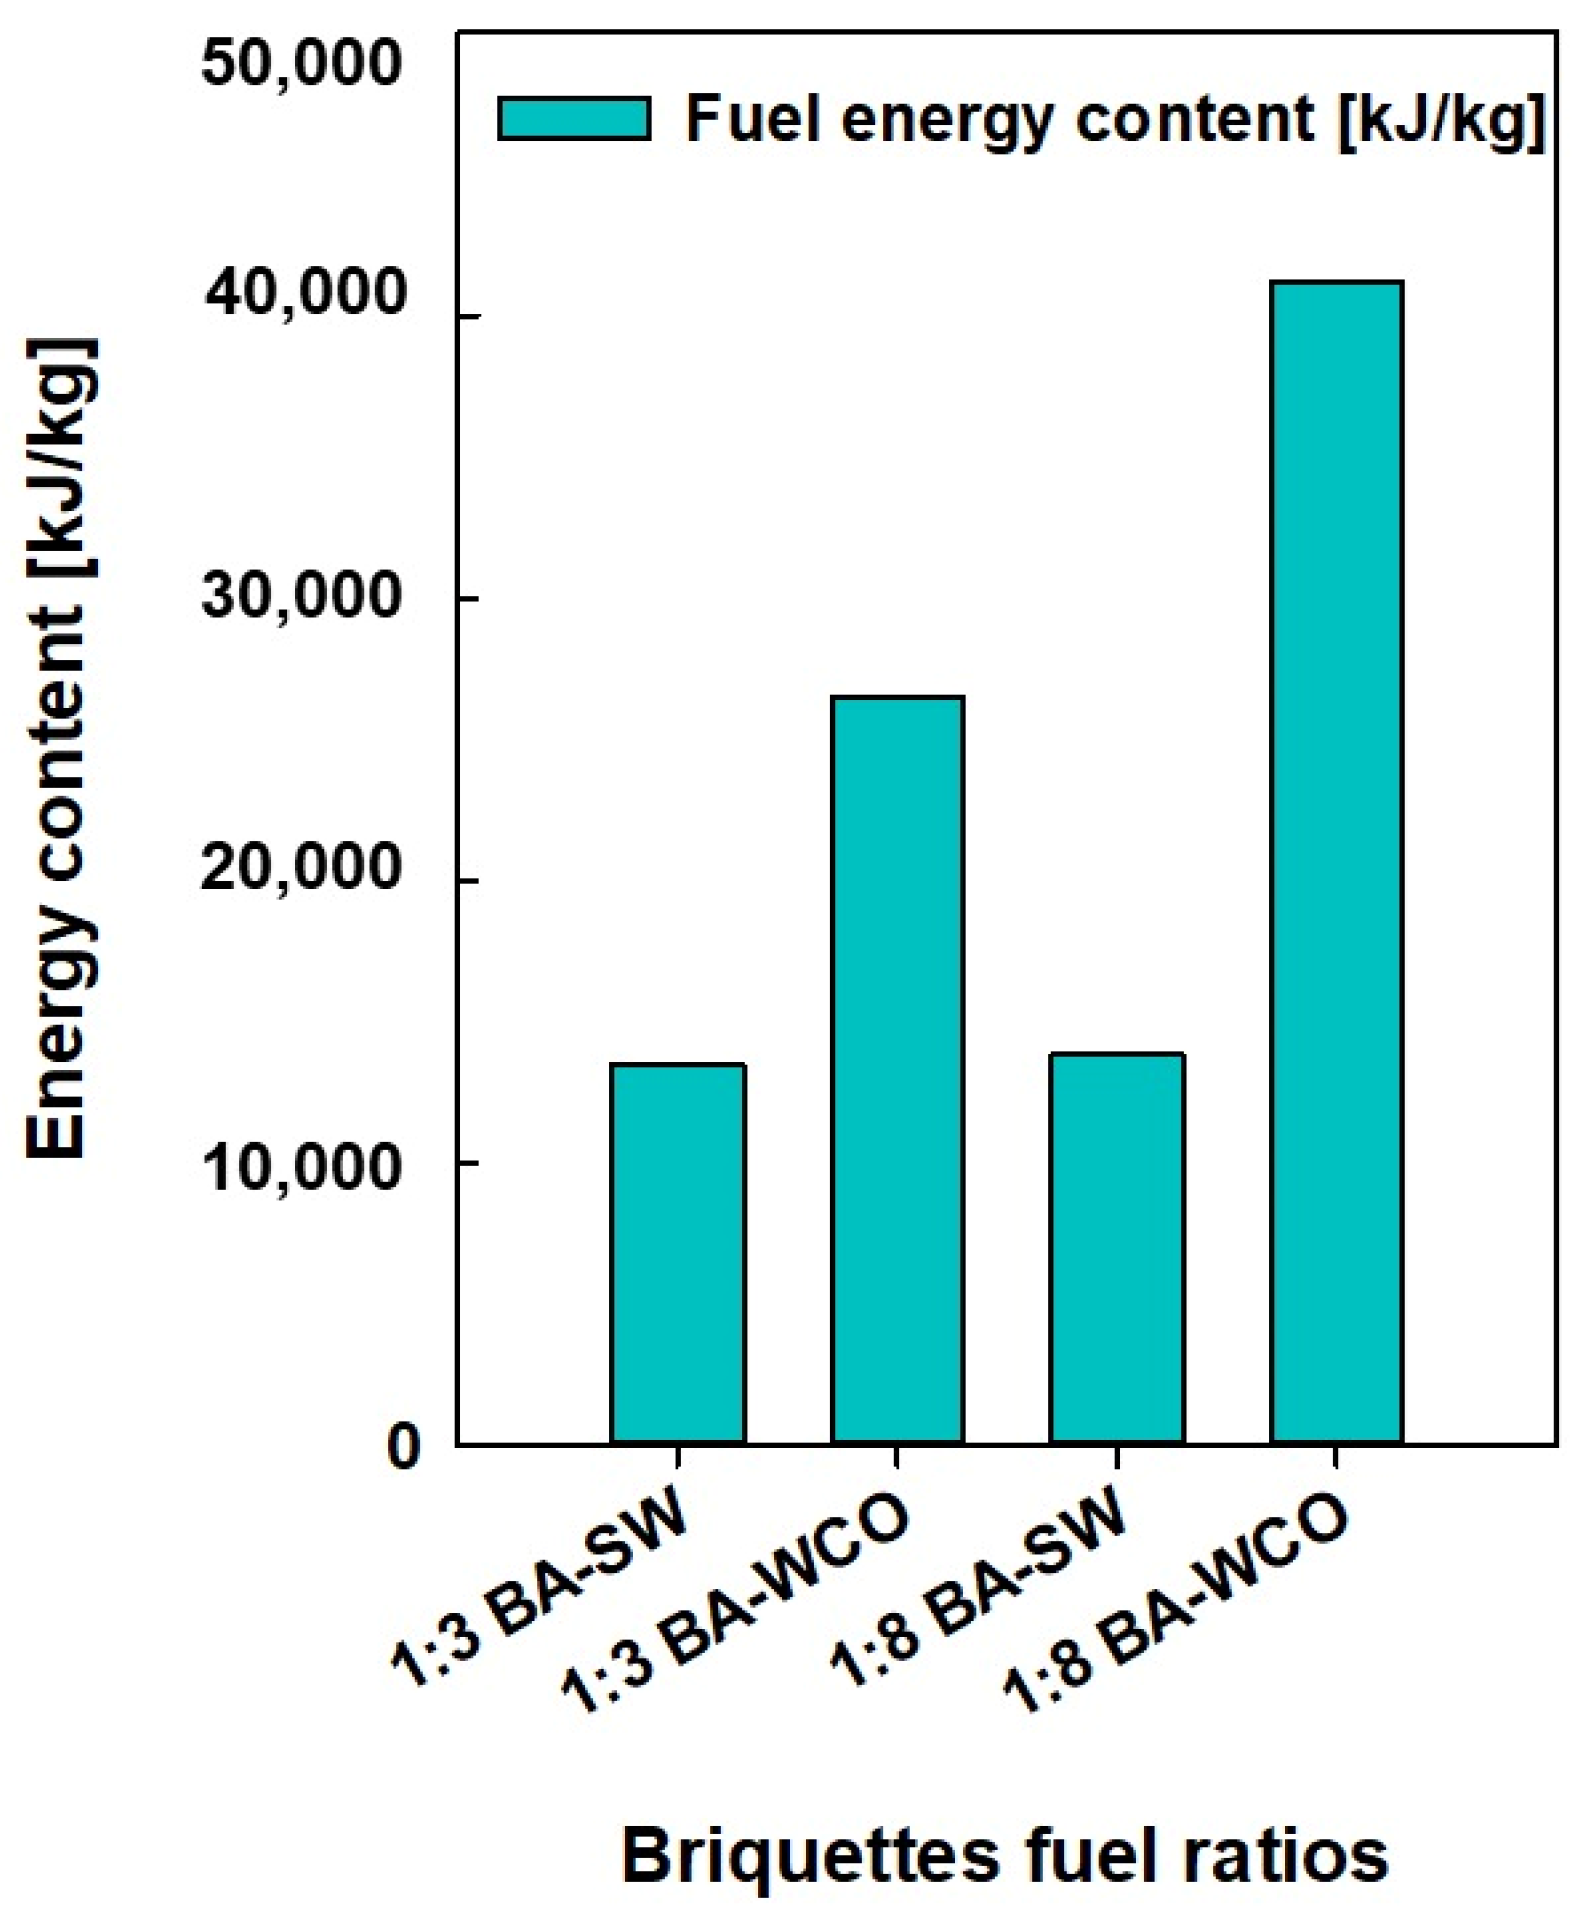
3.1. Fuel Consumption Variation
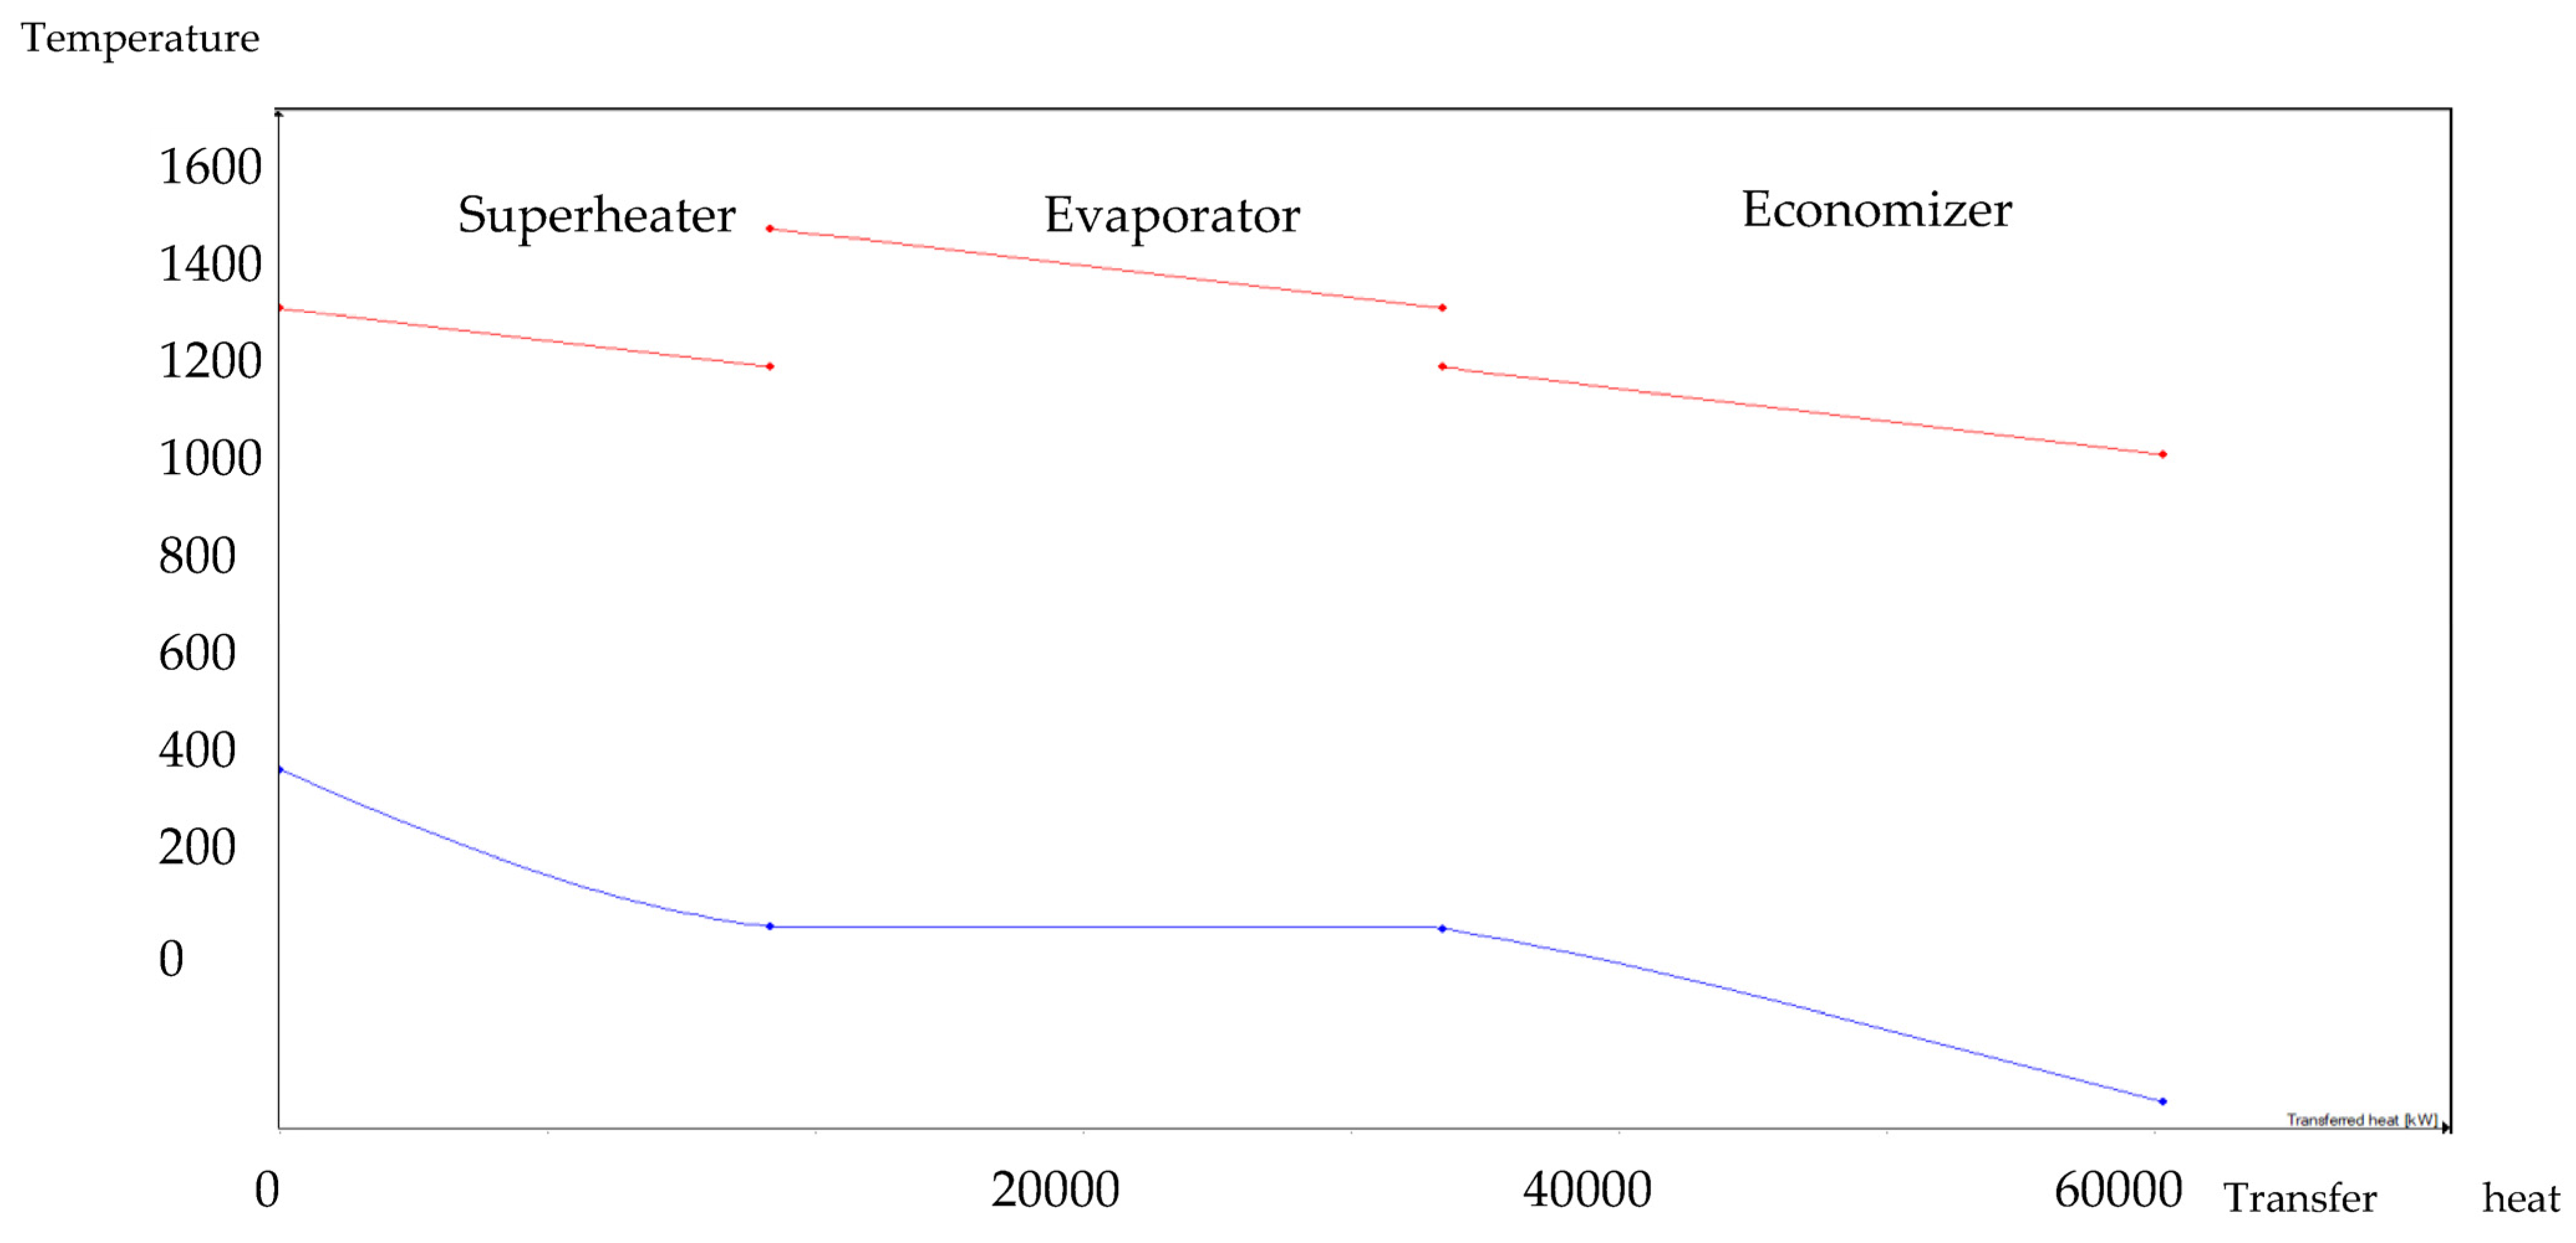
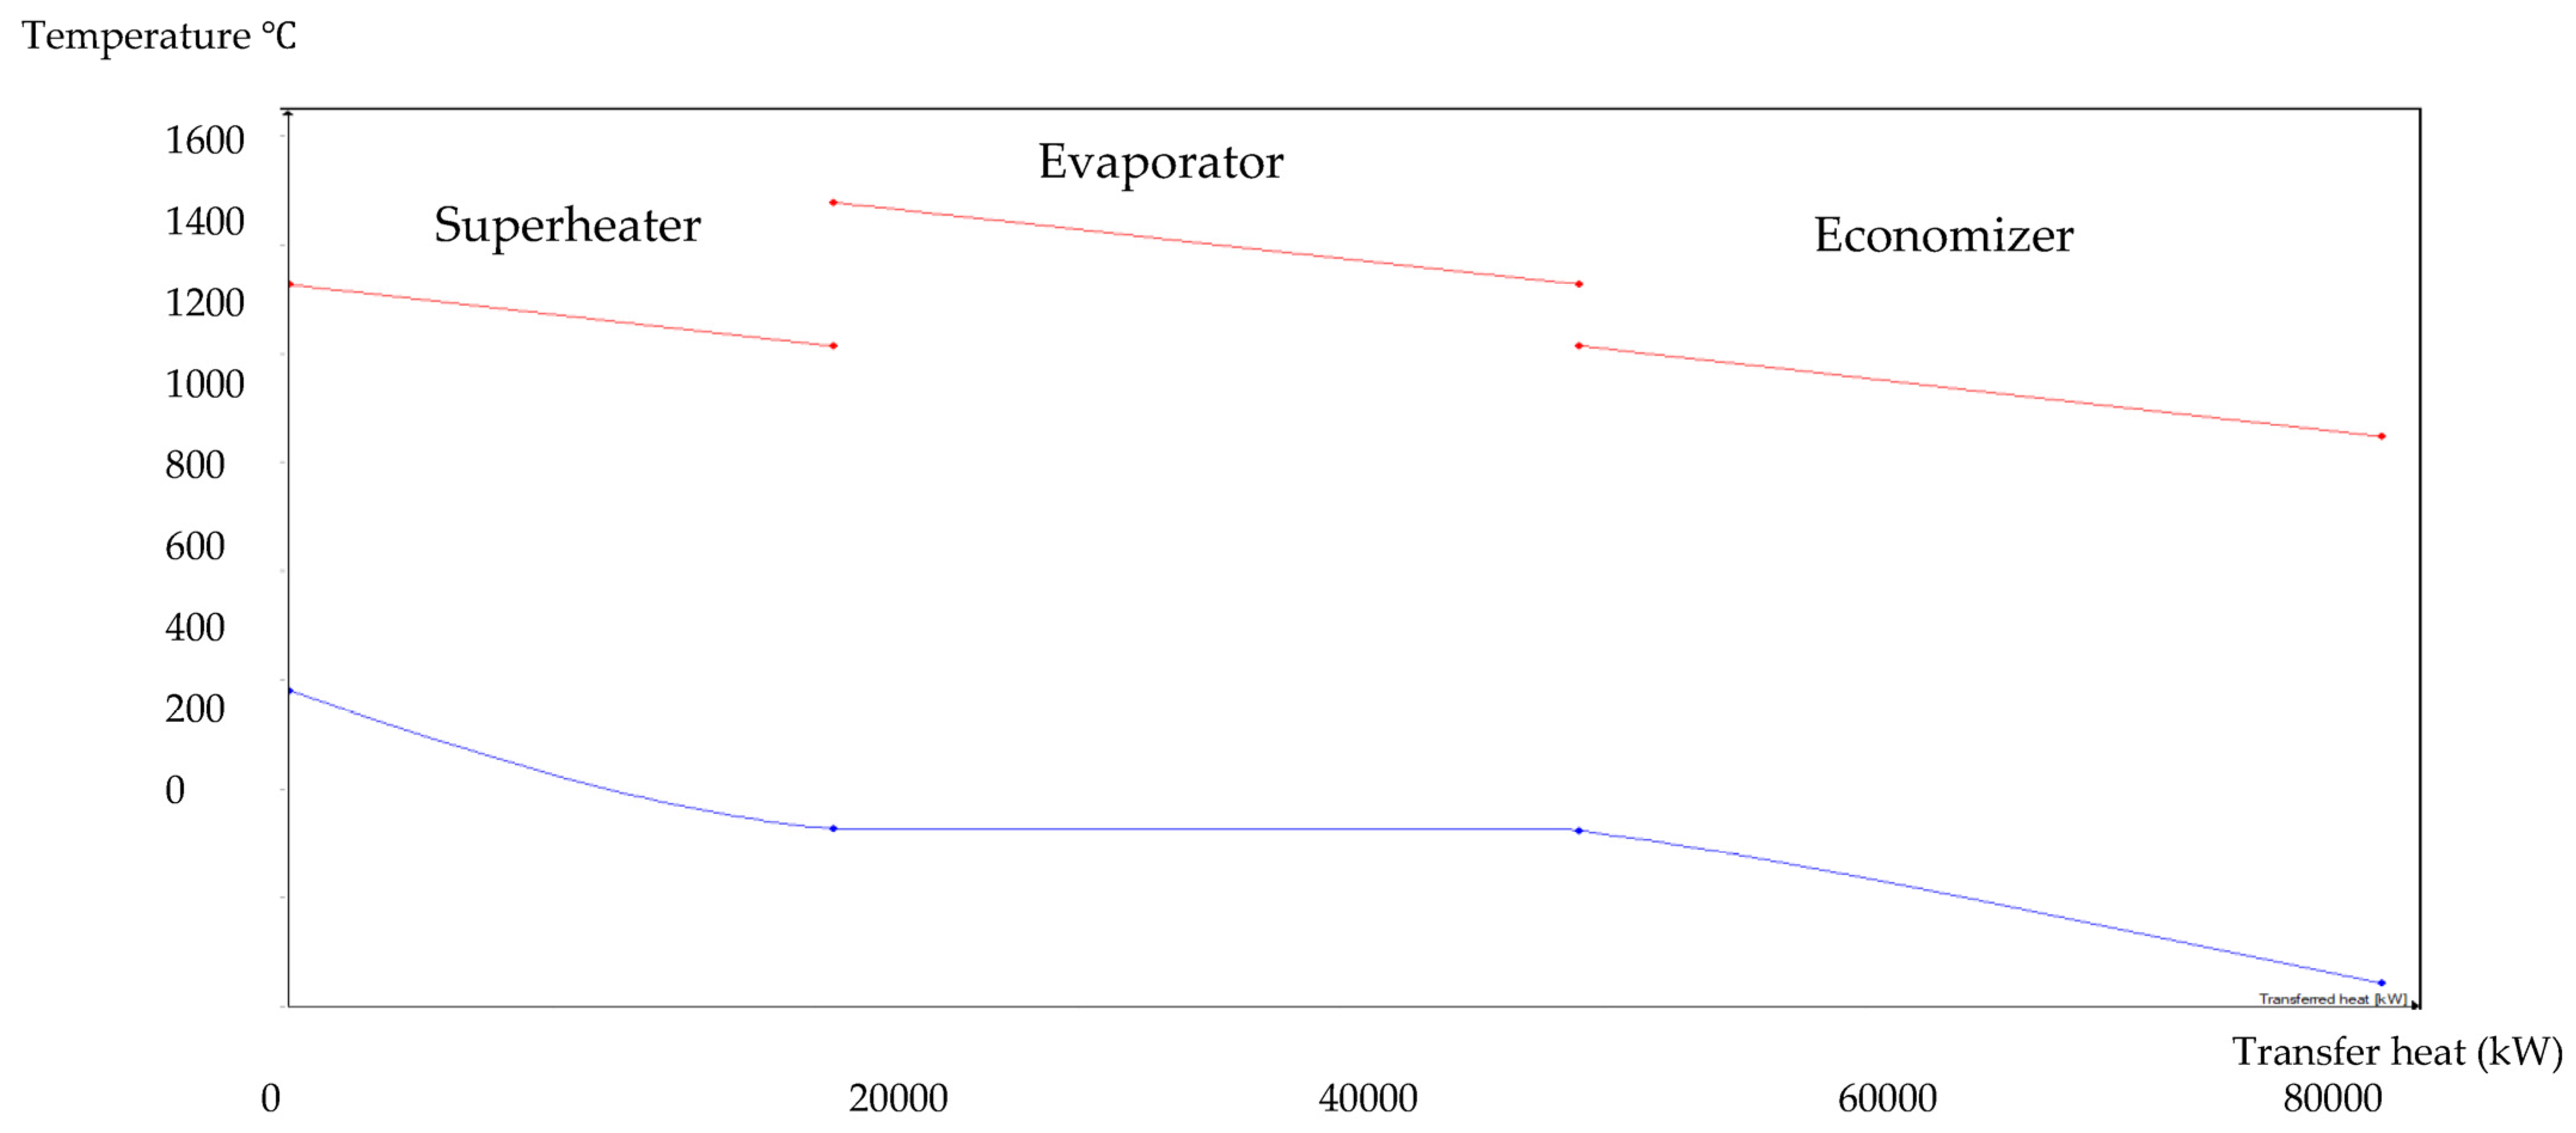
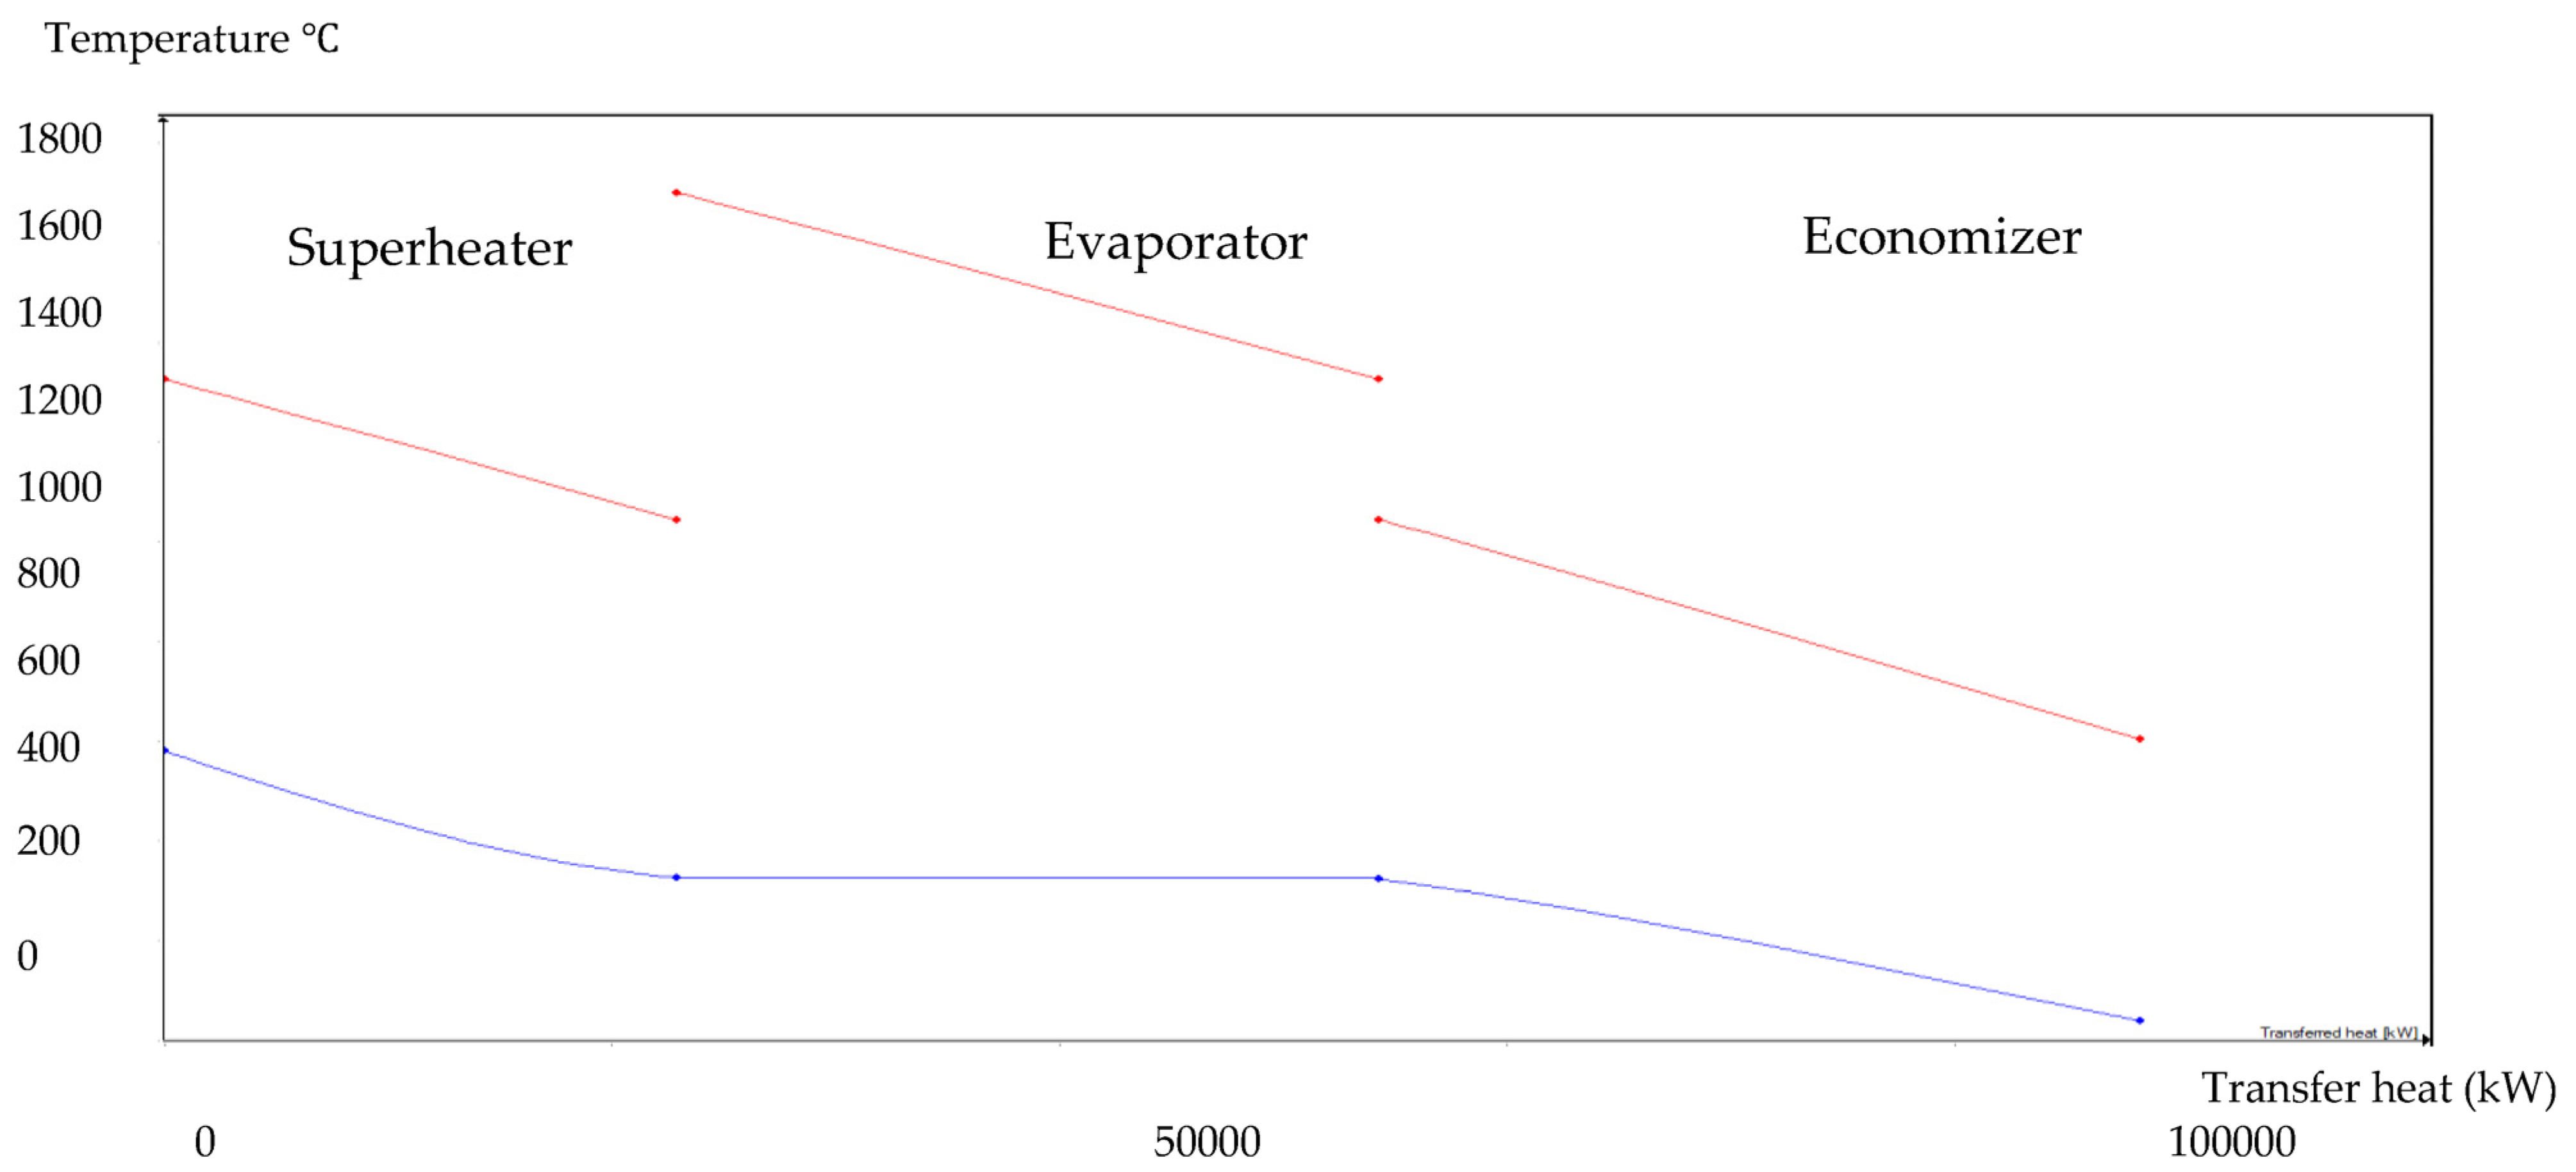
Figure 5 shows the fuel feed flow rate required to produce a total of 150 MW of power in the designed CCCHP operation and Figure 6 shows the CV of the raw fuel feed for the system. Based on Figure 5 and Figure 6, the BA–SW samples require a higher amount of fuel feed than BA–WCO to produce a total of 150 MW power due to the lower CV of BA–SW samples. The minimum fuel feed requirement of the 10.762 Kg/s flow rate was recorded at the highest CV fuel briquette of a 1:8 ratio of BA–WCO, with 41.141 MJ/Kg calorific value. Conversely, the briquette of 1:3 BA–SW, with the lowest CV of 13.496 MJ/Kg, needs the highest fuel feed flow rate of 42.223 Kg/s to fulfill the 150 MW power production for CHP operation

3.2. HRSG Diagram

The HRSG unit consists of an economizer, evaporator, and superheater. In the HSRG unit, heat is transferred between water and exhaust gasses. The exhaust gasses released from the combustion unit absorbed the water and generated the superheated steam at around 575 °C, with 120 bars from the inlet water temperature at around 42 °C. The system parameters of the HRSG system are shown in Table 4. The primary purpose of using this HRSG system is steam generation and heat recovery. Inlet water in the evaporator can be preheated using an economizer, which will work as a heat recovery unit. The evaporator generates the steam, which is converted into a high-temperature level using a superheater. An economizer helps reduce waste heat and improves the system’s efficiency. This HRSG system is a critical unit in the CCCHP system for waste heat recovery, steam generation, operation cost reduction, and improvement of the overall system efficiency. Based on the results from Figure 7, Figure 8, Figure 9 and Figure 10, the temperature gap between the hot and cold sides in BA–WCO is higher than in the BA–SW graphs. The lower temperature gap between the cold and hot sides of the heat exchanger design is due to the higher temperature of the BA–WCO combustion flue gas. However, with similar operational conditions of producing 150 MW total CCCHP operation, the BA–SW flue gas-to-water system performs a more efficient heat exchanging operation compared to the BA–WCO system in the HRSG. The increased efficiency with a lower temperature gap design also reduces the long-term operational cost and also the initial equipment purchasing cost [36].
Figure 11 indicates the enthalpy of the exhaust gas streamline (streams 6, 7, 8, and 9) and the enthalpy of various fuel briquette ratios, such as 1:3 and 1:8 bagasse-to-spent wash and bagasse-to-WCO fuel briquettes. Streamline 6 shows the highest enthalpy values in each fuel type. Moreover, the BA–WCO combusted flue gas stream has a higher enthalpy value compared to BA–SW, and the highest of 2149 kJ/kg was recorded at 1:8 BA–WCO in streamline 6. Therefore, compared to the BA–SW fuel combustion system, the flue gas of BA–WCO briquettes has a significantly higher heating value. The 1:8 BA–WCO fuel exhaust line enthalpy of 2149 kJ/kg was reduced to 686 kJ/kg after the HRSG process at the stream, with a significant enthalpy decrease of 1463 kJ/kg from line 6 to 9 in the HRSG process. The heating value of 1:8 BA–SW flue gas was 1826 kJ/kg; this value dropped to 1243 kJ/kg from lines 6 to 9 in the HRSG process. Therefore, the heat content of the water absorbed is less than that of the 1:8 BA–WCO fuel sample. A similar pattern was observed in the 1:3 ratio samples. As the flue gas passed through the system, the heating value of the 1:3 BA–WCO fuel declined from 2125 kJ/kg to 734 kJ/kg, and a greater amount energy transfer to the water system was observed by the enthalpy as a drop of 1391 kJ/kg of heating value. In contrast, the enthalpy loss of the 1:3 BA–SW sample was 498 kJ/kg lower than that of the BA–WCO. This indicates that the water received more heat from the 1:3 BA–WCO fuel in the HRSG unit, which enhanced the production of steam and increased the amount of electricity generated as a result of this higher energy recovery from the flue gas in BA–WCO CCCHP-operated HRSG process, with a higher amount of power generated in the steam turbine Rankine cycles, as described in Section 3.3.

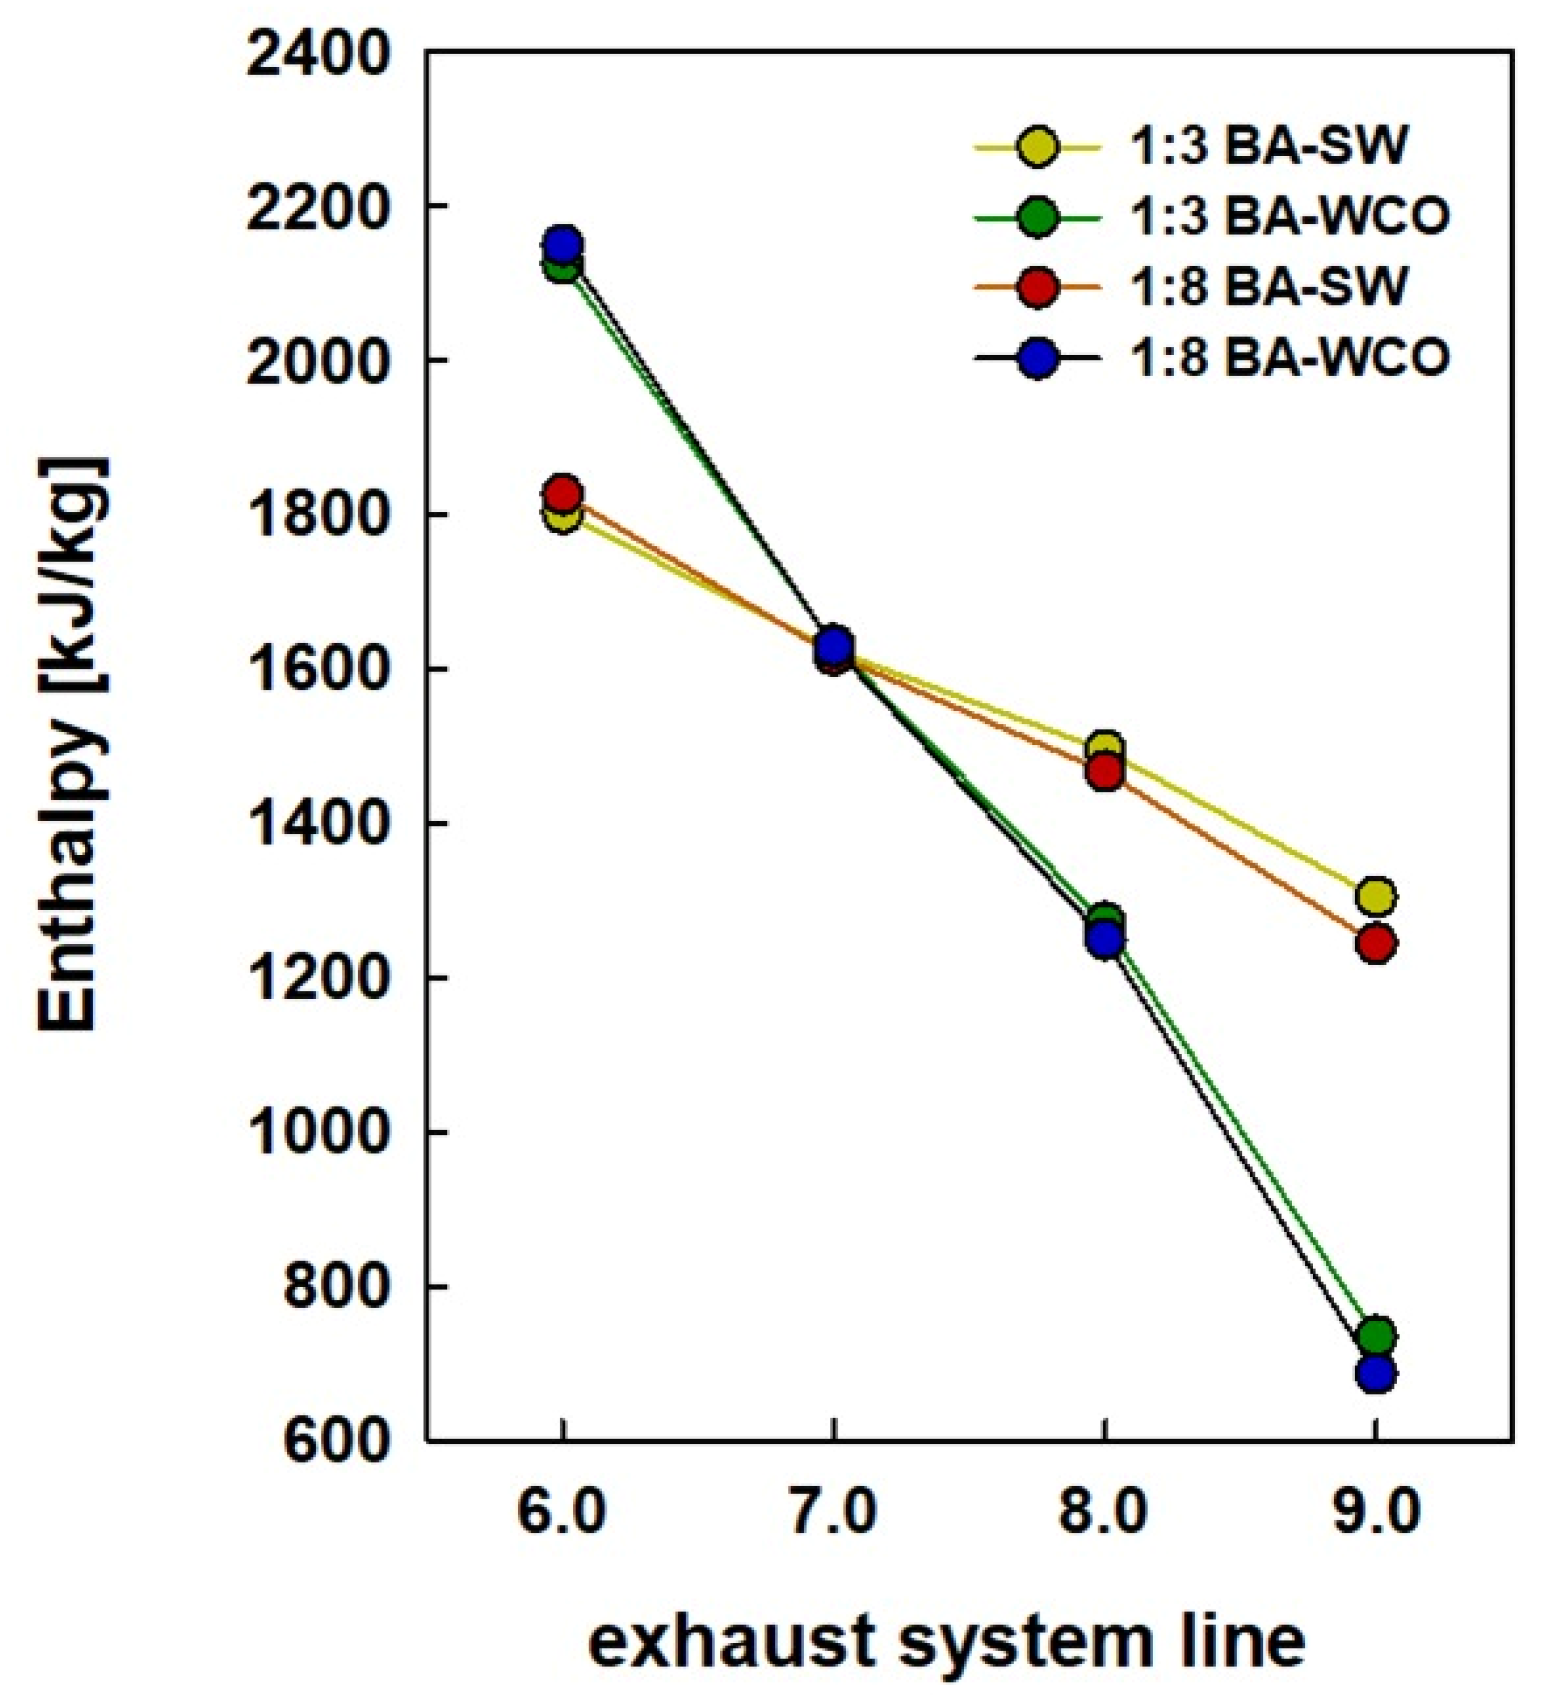
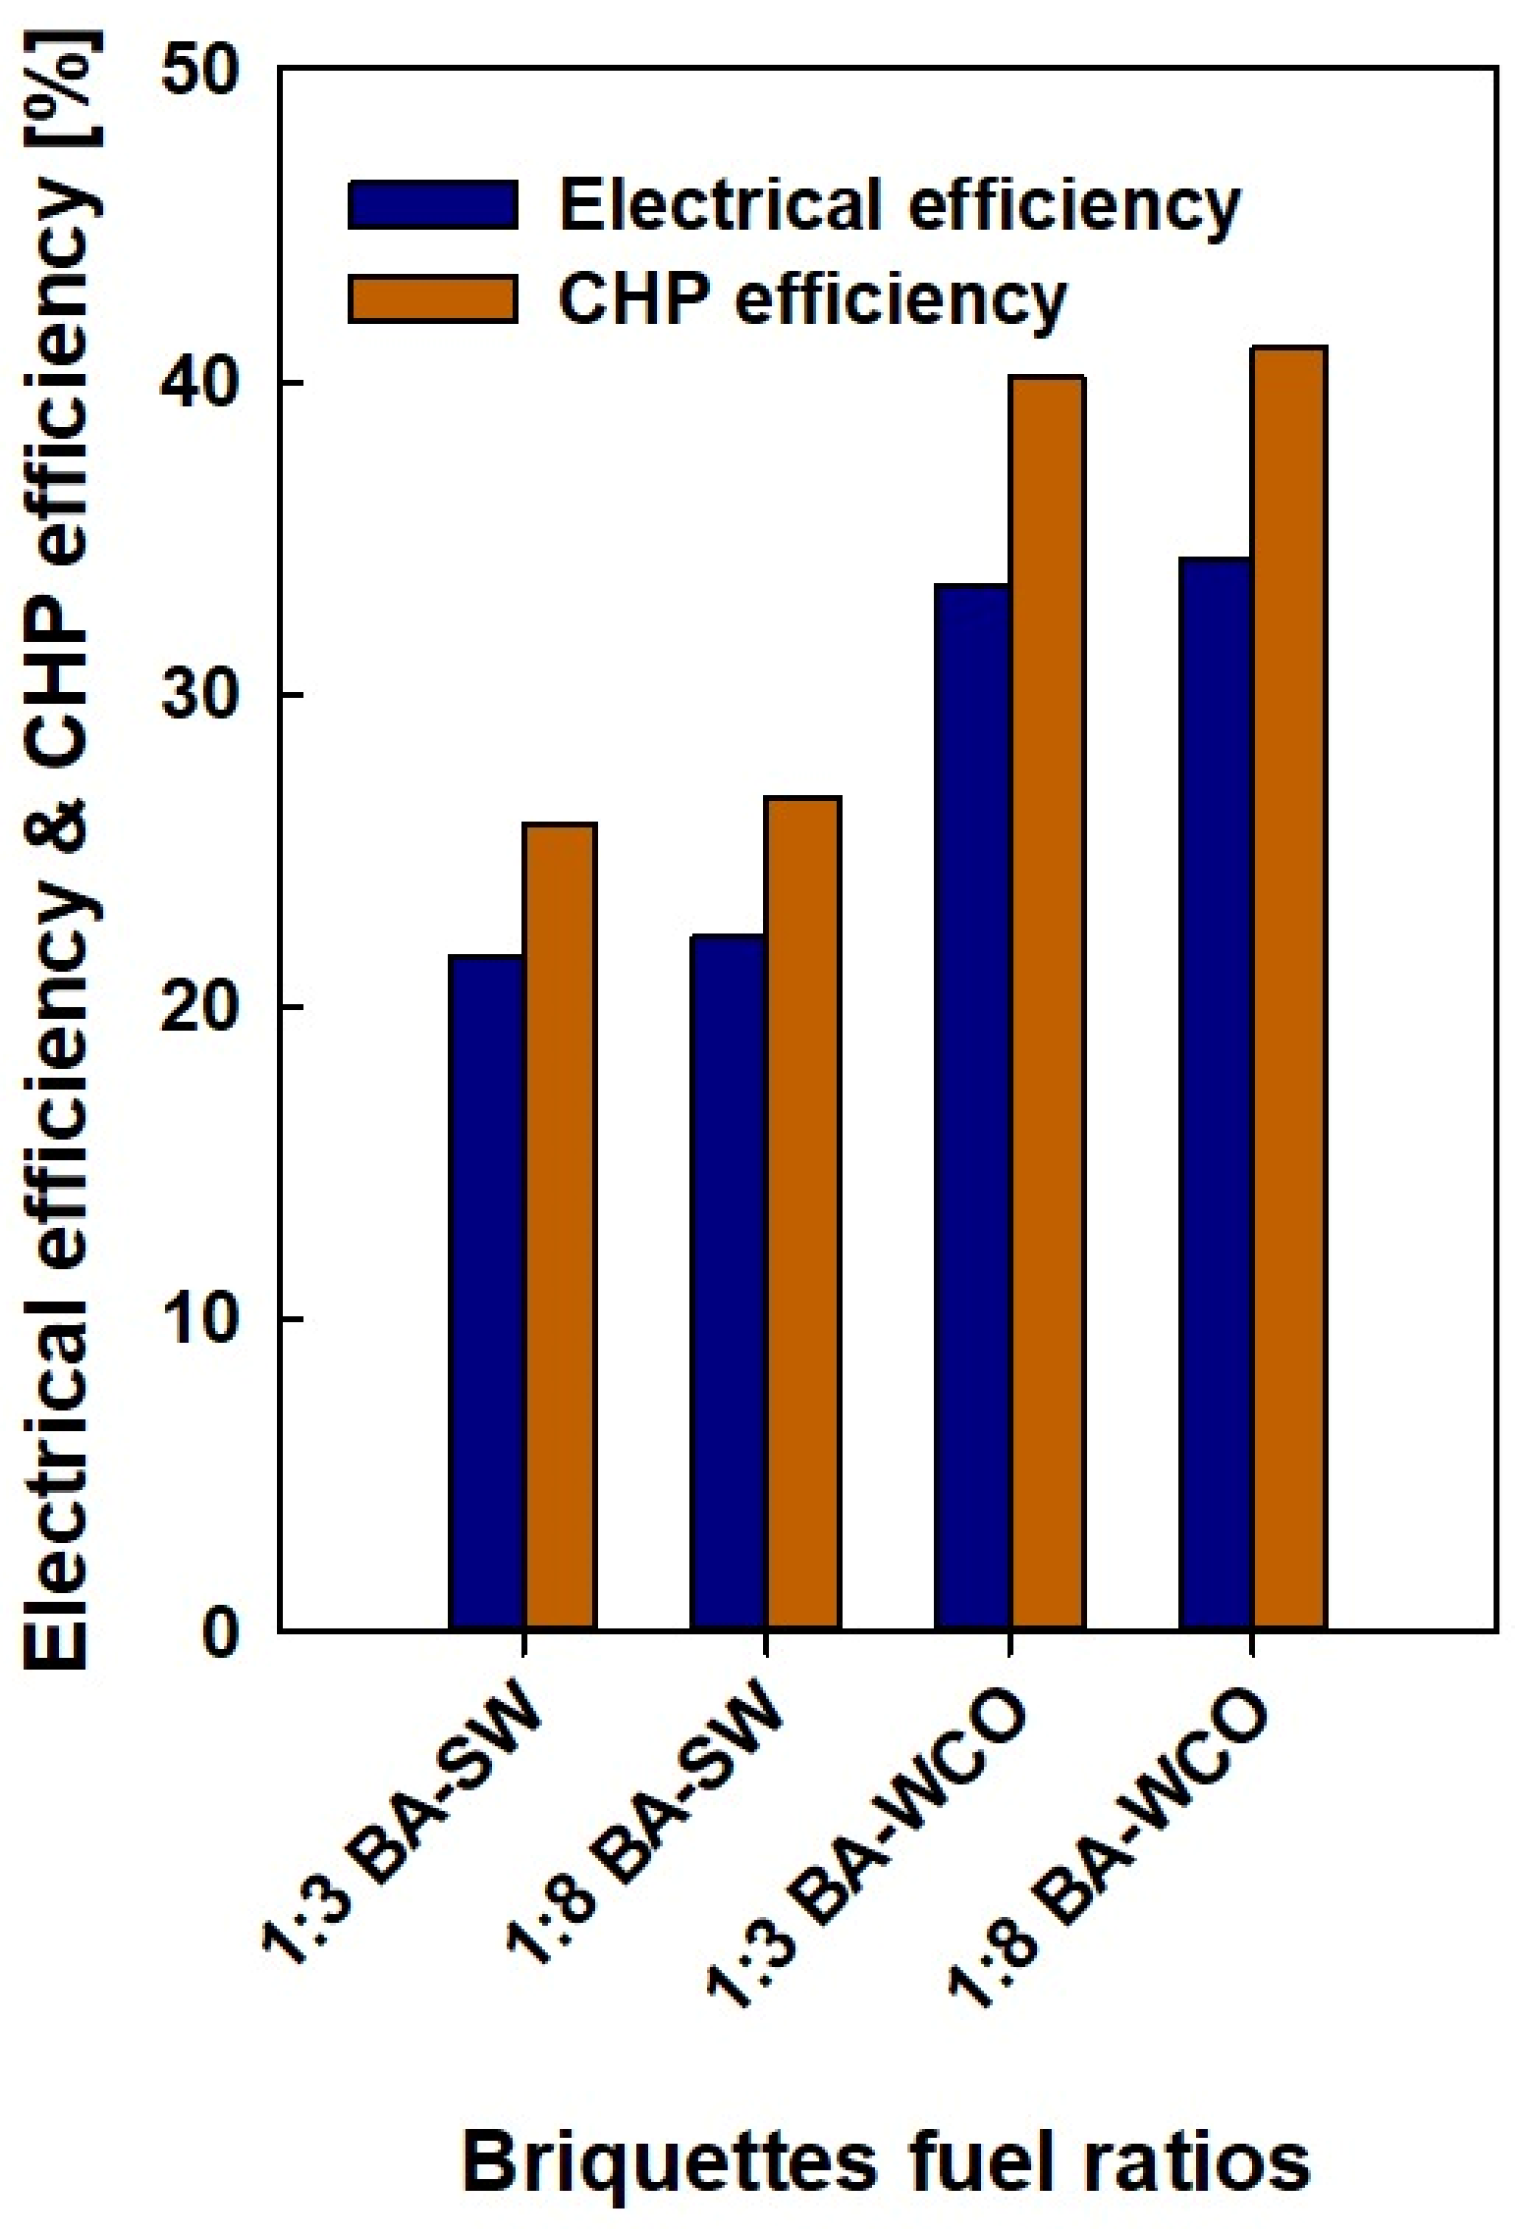
3.3. Energy Analysis

Figure 12 shows the electrical efficiency and combined heat and power efficiency of each fuel briquette for systems varying with the briquette ratios. The ratios of bagasse-to-WCO and bagasse-to-spent wash (1:3 and 1:8 ratios) represent an axis of this graph. The y-axis is the electrical efficiency and CHP efficiency of each fuel briquette sample. Electrical efficiency represents the efficiency of the system in converting fuel energy into electrical energy; moreover, combined heat and power are the combined efficiency of producing electricity and useful heat from the fuel. In the 1:3 bagasse-to-spent wash briquettes ratio, the electrical efficiency is 21.59% and the CHP efficiency is 25.88%. In the 1:8 bagasse-to-spent wash briquettes ratio, the electrical efficiency improves slightly to 22.28% and the CHP efficiency increases to 26.71%. The bagasse-to-spent wash 1:8 briquette samples slightly improve both CHP and electrical efficiency. For the 1:3 bagasse-to-waste crankcase oil briquettes ratio, the electrical efficiency is 33.47% and the CHP efficiency is 40.11%. In the 1:8 bagasse–waste crankcase oil briquettes ratio, the electrical efficiency improves slightly to 34.3% and the CHP efficiency increases to 41.1%. The bagasse-to-waste crankcase oil 1:8 briquettes sample displays a slight increase in CHP and electrical efficiency. In both bagasse-to-WCO fuel types, the electrical efficiency and CHP efficiency are significantly increased compared to the bagasse-to-spent wash fuel types. Systems with WCO as a component show much better performance (both in terms of electrical efficiency and CHP efficiency) than bagasse-to-spent wash briquettes; this indicates that WCO might be a more energy-dense or combustible component, leading to improved efficiency. CHP efficiency was always higher than electrical efficiency for all fuel ratios, which is expected since CHP systems recover additional energy in the form of heat.
This CCCHP simulation was designed to generate 150 MW of total power, with the total power output dependent on both the gas turbine system and the Rankine cycle. As described in Section 3.2, a large amount of energy was released from water to BA–WCO fuel. Compared to the BA–SW fuel, this resulted in a more effective Rankine cycle that generated more power. As shown in the results in Table 6, in the steam turbine Rankine cycle, the 1:3 BA–WCO fuel produced 80.16 MW of energy, while the 1:3 BA–SW fuel produced 49.89 MW. The 1:8 BA–WCO and 1:8 BA–SW fuels’ Rankine cycles generated 81.32 MW and 57.14 MW of power, respectively. According to the power generation distribution, the BA–SW briquette fuel generated more power for gas turbines than the BA–WCO fuel. The gas turbine system in the 1:8 BA–SW sample produced 68.62 MW, whereas the 1:3 BA–SW briquette sample produced 75.78 MW. To produce these amounts of power, BA–SW fuel required more fuel than BA–WCO. The power generation distribution showed that the BA–SW briquette fuel produced more power for gas turbines than the BA–WCO fuel. In contrast to the 1:3 BA–SW briquette sample, which produced 75.78 MW, the gas turbine system in the 1:8 BA–SW sample produced 68.62 MW. Compared to the BA–WCO, the BA–SW performs at a lower heat recovery capacity, as described in Section 3.2, and more fuel is required to generate the total power requirement.

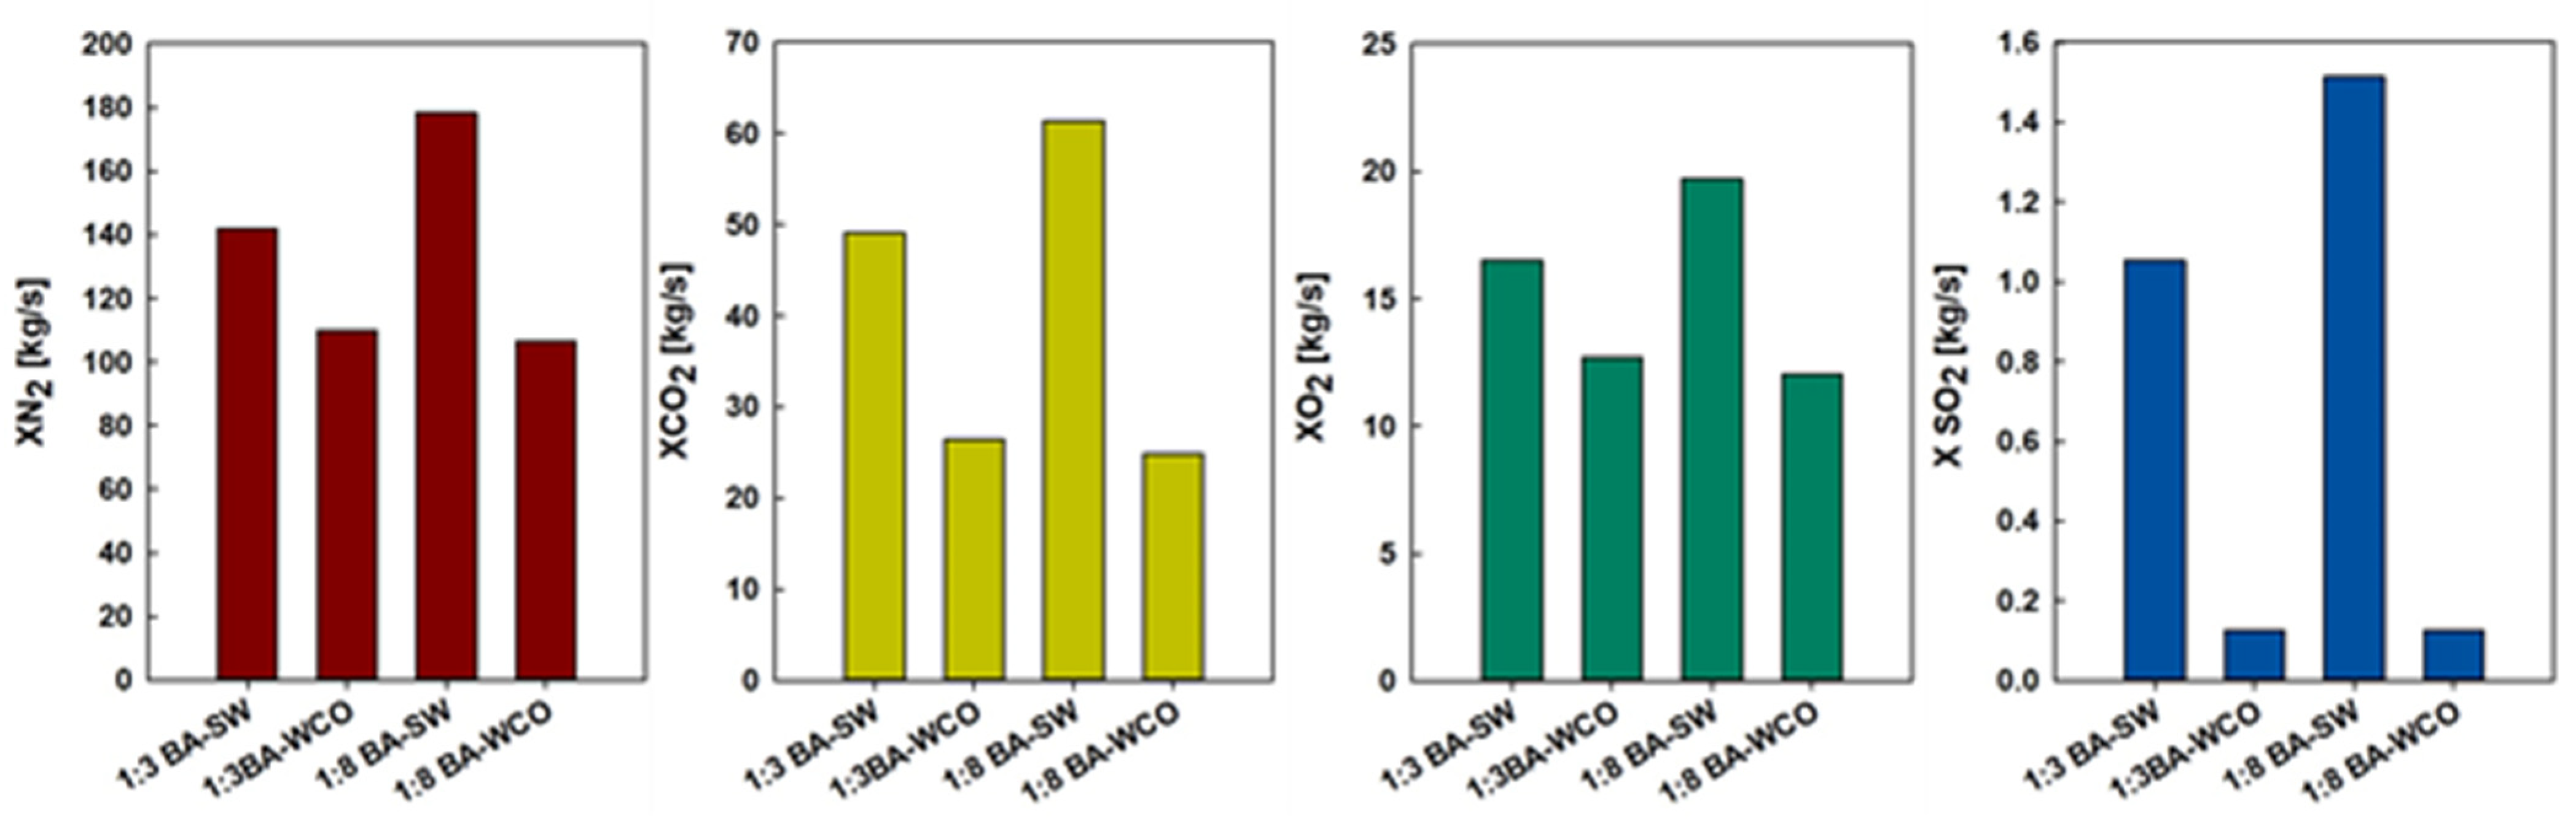
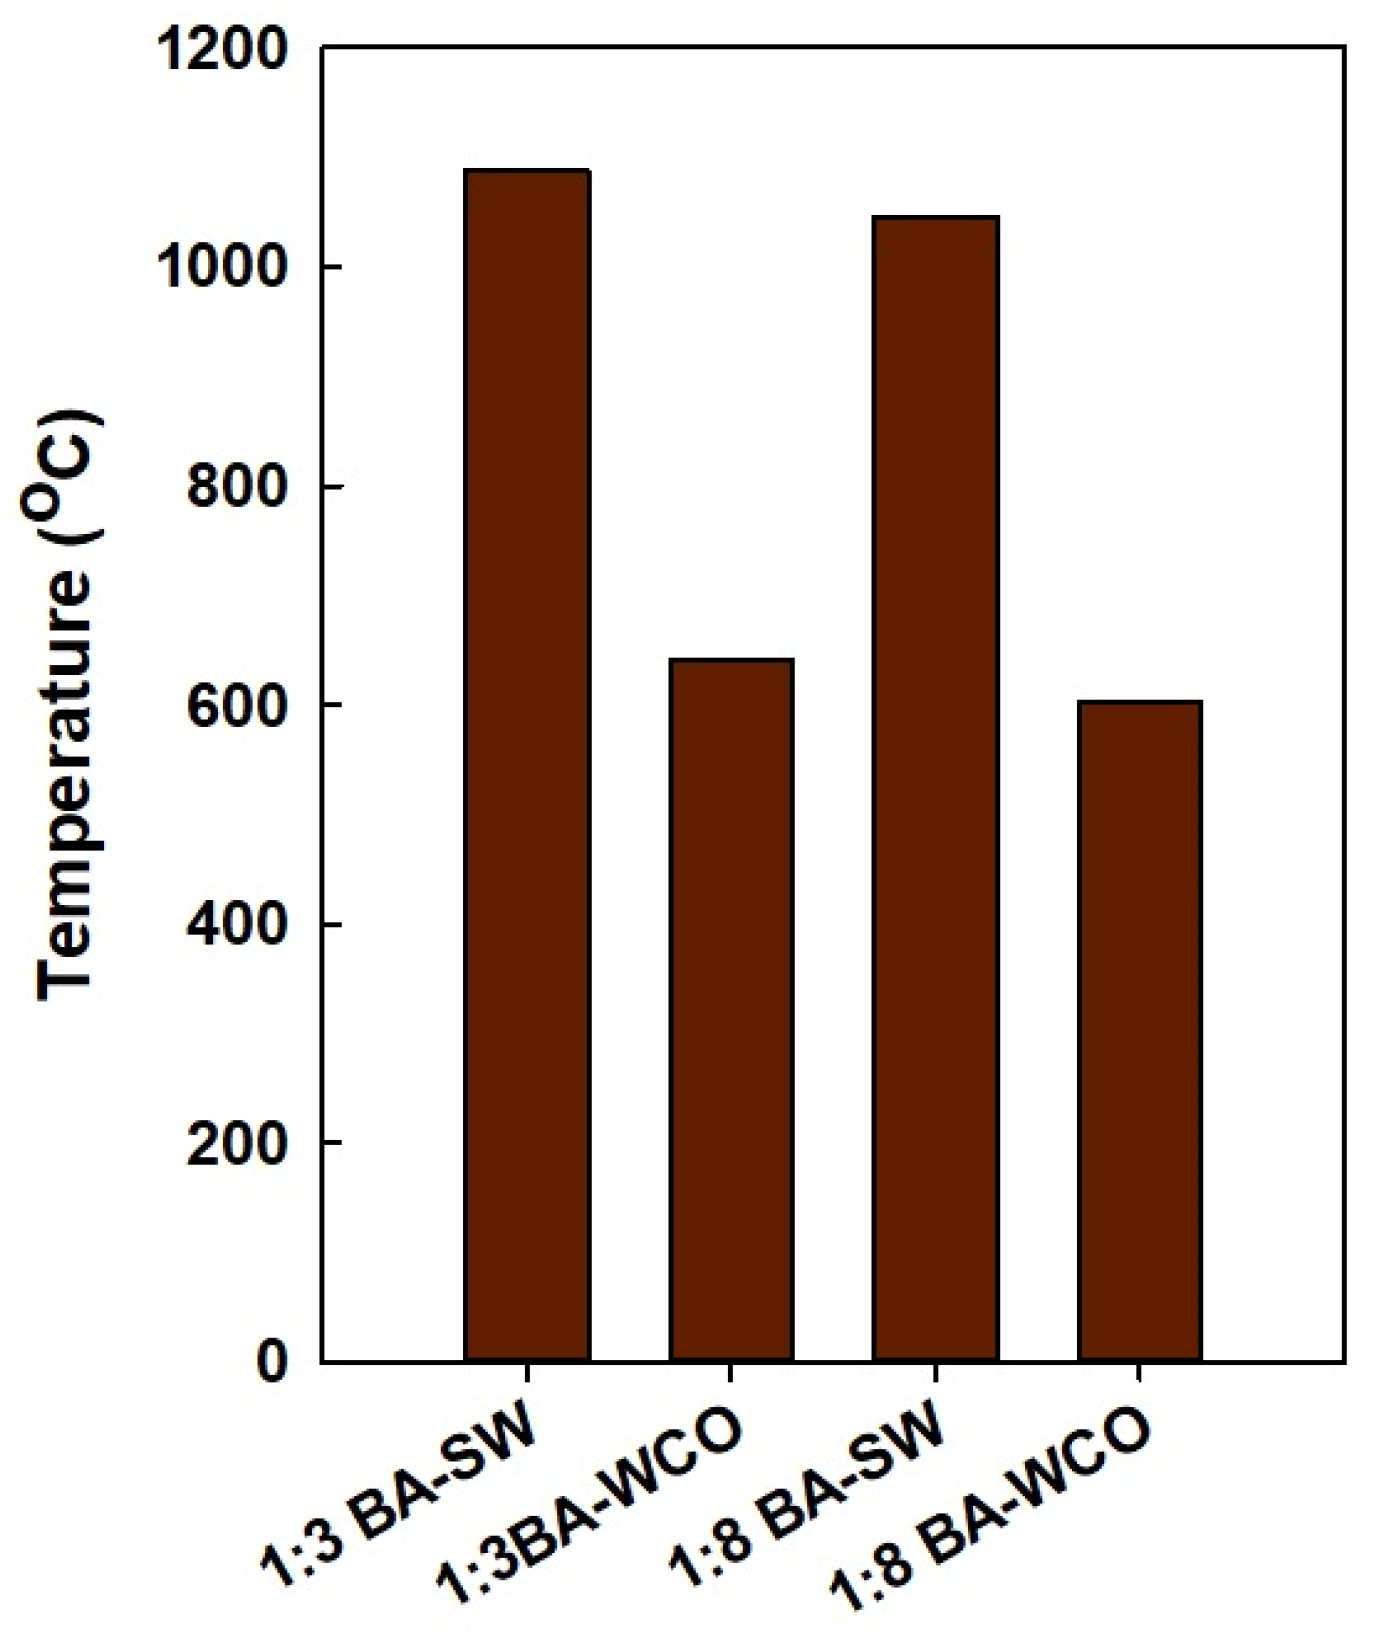
3.4. Environment Analysis

In CHP systems, biomass combustion has an integral role in sustainable energy generation, with different types of biomass fuel exhibiting differing combustion efficiencies and levels of emissions. This work presents a comparative study on the energy performance and environmental impact of mixtures of BA–SW and BA–WCO. The relevant significant emissions investigated are carbon dioxide (CO2), nitrogen (N2), oxygen (O2), and sulfur dioxide (SO2), and their application in the environmentally friendly and technically efficient CHP operation is taken into consideration.
Figure 13 shows that nitrogen emissions display considerable variation with fuel compositions, and the highest nitrogen levels were measured in the 1:8 BA–SW mixture as 178.47 Kg/s, followed by the 1:3 BA–SW mixture release of 141.95 kg/s of nitrogen. When the spent wash portion was increased, nitrogen emission increased from 109.82 kg/s to 178.47 kg/s. This implies that the spent wash mixtures are of higher nitrogen content. In contrast, nitrogen emissions are significantly lower when burning BA and WCO. In the 1:3 BA–WCO mixture, at 109.82 Kg/s of nitrogen, and the 1:8 BA–WCO mixture releases 106.68 Kg/s of nitrogen. The main reason for this variation is that more spent wash fuel has to be consumed than WCO. When increasing the WCO portion, nitrogen emission is reduced. According to these results, spent wash combustion releases more nitrogen than waste crankcase oil combustion. Based on the illustration in Figure 13, the carbon dioxide emissions showed distinct differences between various biomass mixtures. The most notable amount of CO2 emission was found with the 1:8 BA–SW mixture, at 61.42 Kg/s, followed by the 1:3 BA–SW mixture, which released 49.12 Kg/s of CO2. The lowest CO2 emissions come from the WCO mixtures, with the 1:8 BA–WCO mixture only reaching 24.85 kg/s of CO2 emission and the 1:3 BA–WCO mixture providing 26.44 Kg/s of CO2. This happened due to more spent wash fuel being consumed for this combustion than the WCO. Increasing the spent wash portion of the fuel mixture causes CO2 emission to increase significantly. However, increasing the WCO portion does not significantly affect CO2 emission; it shows low CO2 emission. According to Figure 13, the oxygen emissions also provide insight into how each biomass mixture combusts. Residual oxygen is expected to be inversely proportional to the combustion efficiency. Generally, the higher the oxygen concentration in the exhaust gasses, the more oxygen remains unused during combustion. In the series, the highest oxygen emissions were observed for the 1:8 BA–SW mixture, which shows 19.72 kg/s of oxygen emission, followed by the 1:3 BA–SW mixture, which emitted 16.51 kg/s of oxygen; very low oxygen emission can be seen in the 1:3 BA–WCO mixture, with 12.69 kg/s, and the 1:8 BA–WCO mixture released 12.06 kg/s of oxygen in its combustion. The main reason for this variation is that more spent wash fuel was consumed than WCO for this experiment. The sulfur dioxide emissions set these biomass fuels apart regarding their environmental effect. According to Figure 13, after mixing 1:8 BA–SW, the emitted SO2 quantity was 1.51 kg/s, and the 1:3 BA–SW mixture released 1.05 kg/s. This is the second-highest SO2 emission, which implies that spent wash contains a rich sulfur concentration that adds to a higher level of SO2 being released during combustion. However, that quantity is also very low. However, in WCO mixtures, the SO2 emission was almost negligible, with 1:3 BA–WCO at 0.12 kg/s and 1:8 at 0.13 kg/s. Moreover, the biomass has significant environmental benefits when compared to conventional fossil-fueled CCCHP systems in terms of emissions. For comparable power outputs, coal-based systems normally release between 0.91 and 0.95 kg/kWh of CO2 and 6.94 and 7.2 g/kWh of SO2 [37]. The BA–WCO biomass system in this study, on the other hand, only released 0.59 kg/kWh of CO2, indicating a notable decrease in greenhouse gas emissions. Furthermore, the use of biomass as a renewable and carbon-neutral fuel offers more sustainable energy generation.
Ultimately, the BA–WCO combustion CCCHP operation emits a lower amount of Nitrogen, carbon dioxide, oxygen, and sulfur dioxide when compared with the BA–SW combustion. In addition, a large amount of wasted wash was burned for this combustion compared with the waste crankcase oil. When more fuel burns, there is a potential to release more gasses due to that combustion. That may also be why there are high gas emissions when burning spent wash mixtures. According to this CCCHP system, to produce 150 MW total power, burning the BA–SW mixture will emit more harmful gasses to the environment compared to the BA–WCO mixture.
According to the exhaust gas temperatures shown in Figure 14, the temperature of the BA–SW briquette flue gasses released into the environment was higher than the BA–WCO combustion system. Additionally, in this CHP system, after rotating the gas turbine, the second step is rotating a steam turbine to transfer heat to the water. However, the heat transfer from the wash mixture to the water does not happen efficiently, therefore explaining the presence of a high exhaust gas temperature. Overall, when it burns the spent wash mixture, heat transfer from flue gas to water in the HRSG system does not happen efficiently when compared with the heat transfer of WCO combustion, as described in Section 3.2 and Section 3.3.

4. Conclusions

This study evaluated the energy efficiency and environmental impact of burning biomass waste and industrial waste briquettes in a CCCHP operation. The primary focus was to identify the potential of utilizing these waste briquets of bagasse with spent wash (BA–SW) and waste crankcase oil (BA–WCO) in a CCCHP system and compare their performance from energy and environmental perspectives using Ebsilon Professional 16 for simulations. The designed system consists of 150 MW total power output with 125 MW of electricity and 25 MW of heating energy. The CVs were comparatively different for each fuel mixture; therefore, the required amount of fuel mass flow rate was varied in producing a total of 150 MW power. The highest CV, at 41.141 MJ/Kg, was demonstrated by the 1:8 ratio BA–WCO briquette, which also displayed the lowest fuel mass flow rate of 10.762 Kg/s. This system shows the most efficient operation, with higher efficiency, lower fuel requirement, and improved output in Rankine cycle steam turbines. Conversely, the BA–SW briquettes, especially in the 1:3 ratio, displayed the lowest CV, at 13.496 MJ/kg, and required the highest fuel flow rate of 42.223 kg/s to meet the system’s energy demands. However, despite the inefficiency in this CCCHP operation compared to the BA–WCO briquettes, BA–SW combustion offers a good waste management solution in terms of sustainability, due to the widespread availability of its components and waste reduction potential. Moreover, from a thermodynamic perspective, the BA–WCO also perform better than BA–SW briquettes, especially in the HRSG process. For instance, in the 1:8 BA–WCO system, 1463 kJ/kg of flue gas was released compared to 583 kJ/kg in the BA–SW system, highlighting more heat transfer to the water through HRSG in producing steam for Rankine cycle operation. Furthermore, the environmental assessments reinforced the better outcomes of the BA–WCO CCCHP systems compared to the BA–SW ones by showing lower environmental burden. Emissions from the 1:8 BA–WCO system were significantly lower than those from BA–SW briquettes. Specifically, CO2 emissions were 24.85 kg/s for BA–WCO compared to 61.42 kg/s for BA–SW, and SO2 emissions were 0.13 kg/s versus 1.51 kg/s, respectively. In sustainability, waste management, availability, economic, and industrial terms, both fuel briquettes demonstrate good potential for wide-scale adoption. However, the BA–WCO system presents better results, with efficient alternatives in CCCHP operation, due to its higher energy efficiency, lower fuel consumption, and lower environmental emission compared to BA–SW. Ultimately, this study underscores the need for further research into fuel optimization, combustion refinement, and emission control to enhance the viability of biomass-based alternative energy sources in industrial applications.

Author Contributions

Conceptualization, D.W. and K.K.; methodology, D.W., L.K., P.A. (Pawani Abesundara), U.L., I.M., P.A. (Prasad Amarasinghe) and S.A.; validation., D.W., P.A. (Prasad Amarasinghe), S.A. and C.G.; formal analysis, D.W. and C.G.; investigation, D.W., L.K., P.A. (Pawani Abesundara) and I.M.; resources, K.K.; data curation, P.A. (Prasad Amarasinghe), S.A. and C.G.; writing—original draft preparation, D.W., L.K., P.A. (Pawani Abesundara), U.L., I.M., P.A. (Prasad Amarasinghe), S.A. and C.G.; writing—review and editing, K.K.; visualization, D.W., L.K., P.A. (Pawani Abesundara), U.L., I.M., P.A. (Prasad Amarasinghe) and S.A.; supervision, K.K.; project administration, K.K.; funding acquisition, K.K. All authors have read and agreed to the published version of the manuscript.

Funding

This research was supported by the Science and Technology Human Resource Development Project, Ministry of Education, Sri Lanka, funded by the Asian Development Bank (Grant No CRG-R2-SB-1).

Data Availability Statement

Data are contained within the article.

Conflicts of Interest

The authors declare no conflicts of interest.

Appendix A

Figure A1. Schematic diagram of CCCHP operation for solid fuel combustion simulation system.
Energies 18 03062 g0a1

References

  1. Demirbas, A. Combustion characteristics of different biomass fuels. Prog. Energy Combust. Sci. 2004, 30, 219–230. [Google Scholar] [CrossRef]
  2. Byden-and-Fridlund-Carbon-Negative-Heat-and-Power-with-Biochar-Production-Sid-2020.pdf. Available online: https://www.vok.nu/wp-content/uploads/2021/04/byden-and-fridlund-carbon-negative-heat-and-power-with-biochar-production-sid-2020.pdf (accessed on 21 March 2025).
  3. Sammy, S.; Donald, J. Biomass Combustion. Report Number: FSA-1056, University of Arkansas Division of Agriculture Cooperative Extension Service. Biomass Combustion-FSA1056. 2010. Available online: https://www.uaex.uada.edu/publications/pdf/FSA-1056.pdf (accessed on 21 March 2025).
  4. Emissions from Biomass Combustion—Bioenergy. Available online: https://www.ieabioenergy.com/blog/publications/emissions-from-biomass-combustion/ (accessed on 21 March 2025).
  5. Goede, A.P.H. CO2 neutral fuels. EPJ Web Conf. 2018, 189, 00010. [Google Scholar] [CrossRef]
  6. Jenkins, B.M.; Baxter, L.L.; Koppejan, J. Biomass Combustion. In Thermochemical Processing of Biomass, 1st ed.; Brown, R., Ed.; Wiley: Hoboken, NJ, USA, 2019; pp. 49–83. [Google Scholar] [CrossRef]
  7. Celebi, A.D.; Sharma, S.; Ensinas, A.V.; Maréchal, F. Next generation cogeneration system for industry—Combined heat and fuel plant using biomass resources. Chem. Eng. Sci. 2019, 204, 59–75. [Google Scholar] [CrossRef]
  8. Pashchenko, D. Integrated solar combined cycle system with steam methane reforming: Thermodynamic analysis. Int. J. Hydrogen Energy 2023, 48, 18166–18176. [Google Scholar] [CrossRef]
  9. Thorin, E.; Sandberg, J.; Yan, J. Combined Heat and Power. In Handbook of Clean Energy Systems, 1st ed.; Yan, J., Ed.; Wiley: Hoboken, NJ, USA, 2015; pp. 1–11. [Google Scholar] [CrossRef]
  10. Wang, J.; You, S.; Zong, Y.; Træholt, C.; Dong, Z.Y.; Zhou, Y. Flexibility of combined heat and power plants: A review of technologies and operation strategies. Appl. Energy 2019, 252, 113445. [Google Scholar] [CrossRef]
  11. Martinez, S.; Michaux, G.; Salagnac, P.; Bouvier, J.-L. Micro-combined heat and power systems (micro-CHP) based on renewable energy sources. Energy Convers. Manag. 2017, 154, 262–285. [Google Scholar] [CrossRef]
  12. Muazu, R.I.; Borrion, A.L.; Stegemann, J.A. Life Cycle Assessment Model for Biomass Fuel Briquetting. Waste Biomass Valor 2022, 13, 2461–2476. [Google Scholar] [CrossRef]
  13. Werther, J.; Saenger, M. Combustion of agricultural residues. Prog. Energy Combust. Sci. 2000, 26, 1–27. [Google Scholar] [CrossRef]
  14. Yamada, K. 98/03888 Decentralized biomass combustion: State of the art and future development. Fuel Energy Abstr. 1998, 39, 364. [Google Scholar] [CrossRef]
  15. Jenkins, B.M.; Baxter, L.L.; Jr, T.R.M.; Miles, T.R. Combustion properties of biomass. Fuel Process. Technol. 1998, 54, 17–46. [Google Scholar] [CrossRef]
  16. Sipilä, K. Cogeneration, biomass, waste to energy and industrial waste heat for district heating. In Advanced District Heating and Cooling (DHC) Systems; Elsevier: Amsterdam, The Netherlands, 2016; pp. 45–73. [Google Scholar] [CrossRef]
  17. Habib, M.A.; Khan, R. Environmental Impacts of Coal-Mining and Coal-Fired Power-Plant Activities in a Developing Country with Global Context. In Spatial Modeling and Assessment of Environmental Contaminants; Shit, P.K., Adhikary, P.P., Sengupta, D., Eds.; Environmental Challenges and Solutions; Springer International Publishing: Cham, Switzerland, 2021; pp. 421–493. [Google Scholar] [CrossRef]
  18. Levihn, F.; Nuur, C. Biomass and waste incineration CHP: The co-benefits of primary energy savings, reduced emissions and costs. In Energy Production and Management in the 21st Century: The Quest for Sustainable Energy; WIT Press: Southampton, UK, 2014; pp. 127–138. [Google Scholar] [CrossRef]
  19. Muhandiram, H.; Wijesekara, E.; Amarasinghe, A. Energy Densification of Bagasse as Briquettes for Bioenergy Production Through Integrated Utilization of Spent Wash. June 2024. Available online: http://dl.lib.uom.lk/handle/123/22598 (accessed on 21 March 2025).
  20. Alen, A.A. Cogenerations of Energy from Sugar Factory Bagasse. Am. J. Energy Eng. 2013, 1, 22. [Google Scholar] [CrossRef]
  21. Khalkar, K.M.; Gaikwad, K.N.; Khandbahale, D.S. Impact of Distillery Effluents on Growth Characteristics of Capscicum annum L. (Chilly) Plant. Int. J. Res. Anal. Rev. 2021, 8, 244–249. [Google Scholar]
  22. Hiranobe, C.T.; Gomes, A.S.; Paiva, F.F.; Tolosa, G.R.; Paim, L.L.; Dognani, G.; Cardim, G.P.; Cardim, H.P.; dos Santos, R.J.; Cabrera, F.C. Sugarcane Bagasse: Challenges and Opportunities for Waste Recycling. Clean Technol. 2024, 6, 662–699. [Google Scholar] [CrossRef]
  23. Lam, S.S.; Liew, R.K.; Cheng, C.K.; Chase, H.A. Catalytic microwave pyrolysis of waste engine oil using metallic pyrolysis char. Appl. Catal. B Environ. 2015, 176–177, 601–617. [Google Scholar] [CrossRef]
  24. Mohan, C.; Bashir, M.; Annachhatre, A.P. Anaerobic treatment of spentwash for recovery of clean energy. Mater. Today Proc. 2020, 32, 928–935. [Google Scholar] [CrossRef]
  25. Used Motor Oil Is a Big Contributor to the Pollution in Our Waterways and Drinking Water—Emagazine.com. Available online: https://emagazine.com/used-motor-oil-is-a-big-contributor-to-the-pollution-in-our-waterways-and-drinking-water/?utm_source=chatgpt.com (accessed on 21 March 2025).
  26. Yue, M.; Ma, G.; Shi, Y. Analysis of Gas Recirculation Influencing Factors of a Double Reheat 1000 MW Unit with the Reheat Steam Temperature under Control. Energies 2020, 13, 4253. [Google Scholar] [CrossRef]
  27. Wijesekara, D.; Amarasinghe, P.; Induranga, A.; Vithanage, V.; Koswattage, K.R. Energy, Exergy, and Environmental Impact Analysis and Optimization of Coal–Biomass Combustion Combined Cycle CHP Systems. Sustainability 2025, 17, 2363. [Google Scholar] [CrossRef]
  28. Abdalla, A.M.; Hassan, T.H.; Mansour, M.E. Performance of Wet and Dry Bagasse Combustion in Assalaya Sugar Factory—Sudan. Innov. Energy Res. 2018, 7, 179. [Google Scholar] [CrossRef]
  29. Messay, E.G.; Birhanu, A.A.; Mulissa, J.M.; Genet, T.A.; Endale, W.A.; Gutema, B.F. Briquette production from sugar cane bagasse and its potential as clean source of energy. Afr. J. Environ. Sci. Technol. 2021, 15, 339–348. [Google Scholar] [CrossRef]
  30. Kularathna, S.H.L.N.; Wijesekara, E.R.J.M.D.D.P. Production of High-Energy-Density Biomass Material Utilizing Bagasse and Waste Oil Derived from the Service Center Operations. Adv. Technol. 2025, 4, 8025. [Google Scholar] [CrossRef]
  31. Islam, M.M.; Hasanuzzaman, M.; Pandey, A.K.; Rahim, N.A. Modern energy conversion technologies. In Energy for Sustainable Development; Elsevier: Amsterdam, The Netherlands, 2020; pp. 19–39. [Google Scholar] [CrossRef]
  32. Jamilatun, S.; Amelia, S.; Pitoyo, J.; Ma’Arif, A.; Mufandi, I. Preparation and Characteristics of effective Biochar derived from sugarcane bagasse as adsorbent. Int. J. Renew. Energy Res. 2023, 13, 673–680. [Google Scholar] [CrossRef]
  33. Mohtaram, S.; Chen, W.; Zargar, T.; Lin, J. Energy-exergy analysis of compressor pressure ratio effects on thermodynamic performance of ammonia water combined cycle. Energy Convers. Manag. 2017, 134, 77–87. [Google Scholar] [CrossRef]
  34. Soltani, S.; Mahmoudi, S.M.S.; Yari, M.; Rosen, M.A. Thermodynamic analyses of a biomass integrated fired combined cycle. Appl. Therm. Eng. 2013, 59, 60–68. [Google Scholar] [CrossRef]
  35. Ata, A.B.; Seufert, P.M.; Heinze, C.; Alobaid, F.; Epple, B. Optimization of Integrated Gasification Combined-Cycle Power Plant for Polygeneration of Power and Chemicals. Energies 2021, 14, 7285. [Google Scholar] [CrossRef]
  36. Chin, H.H.; Wang, B.; Varbanov, P.S.; Klemeš, J.J.; Zeng, M.; Wang, Q.-W. Long-term investment and maintenance planning for heat exchanger network retrofit. Appl. Energy 2020, 279, 115713. [Google Scholar] [CrossRef]
  37. Fiehn, A.; Kostinek, J.; Eckl, M.; Klausner, T.; Gałkowski, M.; Chen, J.; Gerbig, C.; Röckmann, T.; Maazallahi, H.; Schmidt, M.; et al. Estimating CH4, CO2 and CO emissions from coal mining and industrial activities in the Upper Silesian Coal Basin using an aircraft-based mass balance approach. Atmos. Chem. Phys. 2020, 20, 12675–12695. [Google Scholar] [CrossRef]
Figure 1. CCCHP operation for solid fuel combustion simulation system.
Energies 18 03062 g001
Figure 2. Fuel combustion turbine system.
Energies 18 03062 g002
Figure 3. HRSG with system with an economizer, evaporator, and superheater unit.
Energies 18 03062 g003
Figure 4. Steam turbine system.
Energies 18 03062 g004
Figure 5. Mass flow of briquette fuel samples.
Energies 18 03062 g005
Figure 6. Fuel CV (kJ/kg) of briquette samples.
Energies 18 03062 g006
Figure 7. 1:3 BA–SW HRSG hot side graph–Ebsilon professional 16 simulation-derived graph.
Energies 18 03062 g007
Figure 8. BA–SW HRSG hot side graph–Ebsilon professional 16 simulation-derived graph.
Energies 18 03062 g008
Figure 9. BA–WCO HRSG hot side graph–Ebsilon professional 16 simulation-derived graph.
Energies 18 03062 g009
Figure 10. 1:8 BA–WCO HRSG hot side graph–Ebsilon professional 16 simulation-derived graph.
Energies 18 03062 g010
Figure 11. Enthalpy of exhaust gasses system from line 5 to 9, referring to Figure 1.
Energies 18 03062 g011
Figure 12. Electrical efficiency and CHP efficiency of the fuel.
Energies 18 03062 g012
Figure 13. N2, CO2, O2, and SO2 emission flow rates in the flue gas from CCCHP systems.
Energies 18 03062 g013
Figure 14. Exhaust gasses temperatures of each briquette formation in the CCCHP system.
Energies 18 03062 g014
Table 1. Fuel feed condition to produce a total of 150 MW.
Fuel Feed Briquettes’ Sample Weight Ratios to Produce the 150 MW EnergyMoisture Content (w/w) of Dried Briquettes Fuel Feed Composition % (w/w)
CHONSRef
Bagasse–Spent wash (w/w) 1:3 Briquettes fuel10.00%40.124.4235.723.161.58[31,32]
Bagasse–Spent wash (w/w) 1:8 Briquettes fuel10.00%40.874.2734.33.711.85[31,32]
Bagasse–WCO 1:3 (w/w) Briquettes fuel10.00%61.1910.9512.190.110.53[31,32]
Bagasse–WCO 1:8 (w/w) Briquettes fuel10.00%62.8811.476.080.10.58[31,32]
Table 2. Streamline description from Figure 1, Figure 2, Figure 3 and Figure 4.
Streamline Numbers Description
1Primary air inlet
2Compressed air line
3Fuel inlet line
4Ash line
5/6/7/8/9Exhaust flue gas line
10/11/12/13/14/23Steam lines
15Water inlet line for Condenser
16Water outlet line from Condenser
17/18/19/20/21/22Water lines
101/102/103/104Electricity lines
106Heat line
Table 3. Gas turbine system parameters.
ComponentParameterValueUnitReference
Air compressorInlet air pressure1BarEnvironment condition
Inlet air temperature25°CEnvironment condition
Pressure ratio2:1-[33,34]
Isentropic efficiency85%[33,34]
Mechanical efficiency99%Software derives
Combustion unitCV of bagasse-to-spent wash 1:312,364KJ/KgExperiment
CV of bagasse-to-spent wash 1:813,982KJ/KgExperiment
CV of bagasse-to-WCO 1:326,465KJ/KgExperiment
CV of bagasse-to-WCO 1:841,141KJ/KgExperiment
Air-to-fuel ratio1:2-Assumed
Pressure dropNegligible Assumed
Slag temperature850°CSoftware derives
Heat lossNegligible-Assumed
ExpanderIsentropic efficiency95%[33,34]
Mechanical efficiency99%Software derives
Inlet temperature (BA–SW 1:3 combustion)1700°C[34,35]
Inlet temperature (BA–SW 1:8 combustion)1710°C[34,35]
Inlet temperature (BA–WCO 1:3 combustion)1944°C[34,35]
Inlet temperature (BA–WCO 1:8 combustion)1965°C[34,35]
GeneratorNominal efficiency98%Assumed
Table 4. HRSG system parameters.
ComponentParameterValueUnitReference
EconomizerUpper terminal temperature difference
Thermal transmittance area
907.72
55.21
°C
kW/K
Software derives
Software derives
Effectiveness 1:3 BA–SW25.69%Software derives
1:8 BA–SW25.97
1:3 BA–WCO40.64
1:8 BA–WCO43.47
EvaporatorPinch Point1000.00°CSoftware derives
Effectiveness 1:3 BA–SW12.27%Software derives
1:8 BA–SW14.1
1:3 BA–WCO27.99
1:8 BA–WCO29.03
SuperheaterUpper terminal temperature difference
Cold side pressure drop
Hot side pressure drop
Thermal transmittance area
745.95
2
0.001
44.54
°C
Bar
Bar
kW/K
Software derives
Software derives
Software derives
Software derives
Effectiveness 1:3 BA–SW31.52%Software derives
1:8 BA–SW31.52
1:3 BA–WCO31.52
1:8 BA–WCO31.52
Table 5. Steam turbine parameters.
ComponentParameterValueUnitReference
Steam turbineInlet pressure HPST120Bar[28,29]
Inlet temperature HPST580°C[28,29]
Inlet pressure IPST40Bar[28,29]
Inlet temperature IPST411°C[28,29]
Inlet pressure LPST5Bar[28,29]
Inlet temperature LPST176°C[28,29]
HPST isentropic efficiency 88%Software derives
IPST isentropic efficiency 88%Software derives
LPST isentropic efficiency 88%Software derives
Generator efficiency 98%Assumed
HRSG-to-HPST steam quality (Dryness)1-Software derives
HPST-to-IPST steam quality (Dryness)1-Software derives
IPST-to-LPST steam quality (Dryness)1-Software derives
LPST-to-condenser steam quality (Dryness) 0.85-Software derives
Condenser Condenser pressure0.05Bar[28,29]
Table 6. Gas turbine system and steam turbine systems power generation values in combined cycle power generation operation.
SystemGas Turning System Power Generation MWSteam Turbine System Power Generation MWTotal Generated Power MWMotor Pump 01 Power kWMotor Pump 02 Power kW
1:3 BA–SW75.7849.89125.6720.91649.44
1:3 BA–WCO45.8880.16126.0435.811000.56
1:8 BA–SW68.6257.14125.7624.48733.59
1:8 BA–WCO44.7481.32126.0636.381013.98
Disclaimer/Publisher’s Note: The statements, opinions and data contained in all publications are solely those of the individual author(s) and contributor(s) and not of MDPI and/or the editor(s). MDPI and/or the editor(s) disclaim responsibility for any injury to people or property resulting from any ideas, methods, instructions or products referred to in the content.

