Abstract
Aiming at the problems of energy utilization efficiency and braking stability in electric vehicles, a high-efficiency and energy-saving control strategy that takes both driving and braking into account is proposed with the distributed hub motor-driven vehicle as the research object. Under regular driving and braking conditions, the front and rear axle torque distribution coefficients are optimized by an adaptive particle swarm algorithm based on simulated annealing and a multi-objective co-optimization strategy based on variable weight coefficients, respectively. During emergency braking, the anti-lock braking strategy (ABS) based on sliding mode control realizes the independent distribution of torque among four wheels. The joint simulation verification based on MATLAB R2023a/Simulink-Carsim 2020.0 shows that under World Light Vehicle Test Cycle (WLTC) conditions, the optimization strategy reduces the driving energy consumption by 3.20% and 2.00%, respectively, compared with the average allocation and the traditional strategy. The braking recovery energy increases by 4.07% compared with the fixed proportion allocation, improving the energy utilization rate of the entire vehicle. The wheel slip rate can be quickly stabilized near the optimal value during emergency braking under different adhesion coefficients, which ensures the braking stability of the vehicle. The effectiveness of the strategy is verified.
1. Introduction
The confluence of two major global challenges, the exacerbation of the energy crisis and the escalating environmental pollution problem, has catalyzed the accelerated development of new energy vehicles. These vehicles are regarded as pivotal technologies in the mitigation of greenhouse gas emissions and the enhancement of energy efficiency. Consequently, they have garnered substantial global attention. However, the challenges related to the prolonged charging duration and the diminished single-range capability require immediate attention [1]. Energy-saving control technology plays a crucial role in the enhancement of energy efficiency in hub-motor vehicles. The drive torque distribution, which serves as the core technology of the electric vehicle power system, has the potential to broaden the high-efficiency operating range and effectively improve the economy of the entire vehicle. This is achieved through the dynamic distribution of torque in the distributed hub-motor vehicle drive system. This dynamic distribution of torque overcomes the limitations of the traditional single-motor drive system, which has a narrow high-efficiency zone and low efficiency under high-power working conditions. The brake energy recovery system recovers kinetic energy during braking and converts it into electric energy, which is stored in an energy storage device. This system has the potential to reduce the braking system’s working intensity, prolong its service life, and enhance the energy utilization efficiency of the vehicle as a whole. Consequently, it is imperative to conduct a comprehensive study on the energy-saving strategies employed by hub-motor vehicles.
For drive torque optimization, related research mainly focuses on the optimization of motor torque efficiency and achieves the purpose of drive energy saving by allocating each motor torque through various optimization algorithms. He et al. employed a model predictive control strategy that took into account the energy consumption of the entire vehicle, thereby enabling the dynamic allocation of motor torque [2,3,4]. Su et al. employed a particle swarm algorithm to address the drive torque allocation problem [5].
With regard to the recovery of energy expended during braking, the extant research is chiefly oriented towards the enhancement of braking stability and the optimization of energy recovery efficiency. This objective is typically pursued by employing a combination of prescriptive regulations and optimization control strategies. Yang et al. coordinated the control of anti-lock braking strategy (ABS) and motor braking with a high energy recovery rate while ensuring the braking stability of the vehicle [6]. Li et al. have designed different fuzzy controllers to distribute the front and rear wheel braking forces and wheel-end electro-hydraulic braking forces or for mode switching under different operating conditions with strong robustness [7,8,9,10,11]. Li et al. proposed a regenerative braking logic that can improve the energy recovery rate by flexibly distributing the braking torque [12,13,14].
The aforementioned studies indicate a paucity of research on the full-domain optimization of drive and brake. In addition, the drive optimization algorithms used in the above studies may not be able to take into account the real-time and optimization effects, and the braking energy recovery strategy mainly targets the conventional working conditions, so it does not take into account the differences in the target demand under different working conditions, and most of the studies ignore the effects of the motor drive system and the characteristics of the power battery and fail to fully consider the constraints of the braking regulations.
In light of the numerous deficiencies in the extant research, this paper proposes a control strategy that is bifurcated into two aspects: driving and braking. In the context of driving conditions, the adaptive particle swarm optimization algorithm based on simulated annealing has been shown to enhance solution efficiency and facilitate the escape from local optima, with the objective of optimizing the energy consumption of the drive. Concurrently, during conventional braking, an optimization model is devised, taking into account the efficiency of the electric drive system, the charging and discharging characteristics of the power battery, and other pertinent factors. This model aims to enhance the braking energy recovery rate and ensure stability. The dynamic adjustment of the weight coefficients of the objective function through fuzzy control, in conjunction with the ideal brake force distribution curve (I-curve) and Economic Commission of Europe (ECE) regulation constraints, facilitates the optimization of the braking torque distribution under conventional braking conditions by the elite retention genetic algorithm. Additionally, the sliding-mode control-based ABS strategy is employed to reduce the braking time and ensure the braking stability of the vehicle under emergency braking conditions. Finally, the results of the joint simulation verification using MATLAB R2023a/Simulink and Carsim 2020.0 demonstrate the efficacy of the control strategy proposed in this paper in reducing vehicle drive energy consumption. The strategy ensures the braking stability of the vehicle while maximizing energy recovery under regular braking conditions. Additionally, it facilitates the timely control of the wheel slip rate in emergency braking conditions, maintaining it near the optimal slip rate and ensuring driving safety.
In Section 2, the present study undertakes a rigorous examination of the factors that influence energy savings control. It provides a comprehensive overview of the parameters of the hub motor vehicle and establishes a simulation model. In Section 3, an adaptive particle swarm optimization algorithm based on simulated annealing is proposed. In Section 4, the constraints of braking energy recovery are analyzed, and the braking torque allocation strategies under different operating conditions are proposed. In Section 5, the efficacy of the energy-saving control strategy is validated through tests conducted under the World Light Vehicle Test Cycle (WLTC) operating conditions. The conclusions of this study are presented in Section 6.
2. Energy-Saving Control Influences and Whole-Vehicle Modeling
2.1. Influencing Factors
(1) Motor drive system efficiency
The hub motor vehicle possesses four independently controllable wheels, and its power generation efficiency directly affects the drive torque energy-saving allocation and braking energy recovery efficiency. The relationship data between the efficiency of the motor drive system and the rotational speed and torque were obtained through bench tests. Then, the linear interpolation method was applied to fit the data to obtain the MAP diagram of the efficiency of the motor drive system, as shown in Figure 1.
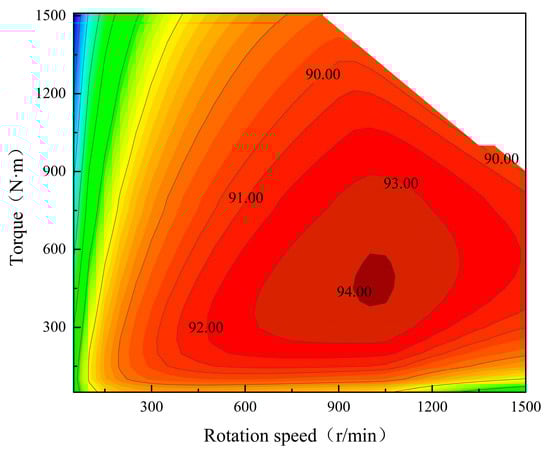
Figure 1.
Efficiency of motor drive system.
(2) Charge/discharge characteristics of power battery
The charging and discharging efficiency of the battery is influenced by numerous factors, including the state of charge (SOC) of the battery and the current. To address this complexity, this paper chooses and uses a battery equivalent model. This model is developed based on a comprehensive consideration of the hysteresis and rebound characteristics of the battery. The model is capable of effectively describing the changes in the electrical properties of the battery in different operating states. As illustrated in Figure 2, the equivalent circuit model can not only describe the relationship between the hysteresis voltage and the open-circuit voltage electro-motive force (EMF) and the SOC of the battery, but it can also be used to estimate the SOC of the battery directly by integrating the ampere-time method [15].
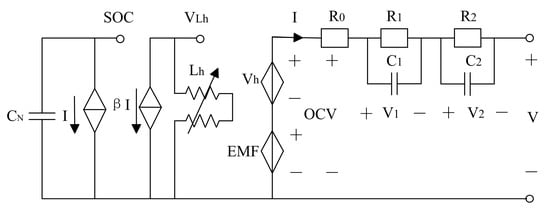
Figure 2.
Battery equivalent circuit model diagram.
Based on the equivalent circuit model of the battery shown in Figure 2, and according to the Kirchhoff’s Current Law (KCL) law of the circuit, the mathematical relationship equation about the current is obtained as follows.
where and are polarization capacitors (F).
The mathematical expression regarding the voltage is obtained from the Kirchhoff’s Voltage Law (KVL) of the circuit as shown in Equation (2):
where V is the operating voltage of the battery (V); EMF is the open-circuit voltage (V) of the battery, which is controlled by the SOC of the battery as a function of the remaining battery; and is the cell’s hysteresis voltage (V), which is also a function of SOC.
2.2. Whole Vehicle Model
Based on the MATLAB R2023a/Simulink platform, the control system model of the whole vehicle is built, including the battery model, motor model, etc., and the effectiveness of the braking energy recovery strategy is verified through joint simulation experiments with Carsim 2020.0. The parameters of the whole vehicle are shown in Table 1:

Table 1.
Vehicle parameters.
The hub motor and power cell parameters are shown in Table 2:
Table 2.
Parameters of hub motor and power battery.
(1) Battery model
Calculation of the SOC value of power battery by using the ampere-time integration method
where is the terminate battery SOC; is the initial battery SOC; is the charge/discharge current (A); is the battery capacity (Ah); ηb is the battery efficiency (%)
(2) Motor model
The relationship between the power battery charging current and the braking torque of the hub motor during regenerative braking is given by Equation (4):
where n is the motor speed (r/min); is the motor efficiency (%); is the individual motor braking torque (N·m); U is the battery operating voltage (V).
3. Drive Torque Optimization Strategy
Considering that inverter and motor losses are the main factors of drive energy loss, this paper will focus on minimizing the efficiency loss of the electric drive system, ignoring the influence of battery charging and discharging characteristics. In order to give full play to the advantage of independent controllable torque of the four wheels of a distributed hub motor vehicle and reduce the energy consumption of the whole vehicle, the torque of each drive motor should be reasonably distributed under different working conditions.
It should be noted that the particle swarm algorithm (PSO) has the defects of ease of prematurity, ease of falling into local optimum, slow convergence in the late stage, and low search accuracy. The simulated annealing algorithm (SA) has strong global search capability and can jump out of the local optimum by probabilistically accepting the worse solution, but it requires a higher annealing temperature, resulting in slow convergence. The adaptive particle swarm optimization algorithm based on simulated annealing used in this paper optimizes PSO by introducing the probabilistic jump mechanism of SA [16], which not only overcomes the PSO precocity problem by using the global search capability of SA but also improves the convergence speed of SA by dynamically adjusting the parameters to achieve a balance between global search and local development and improves the comprehensive performance of the algorithm. The flow of the improved particle swarm optimization algorithm is shown in Figure 3. Firstly, the particle swarm is initialized, its fitness function is calculated, and only the better solution is accepted when it is in the early stage of iteration; when it is in the late stage of iteration, it can be chosen whether to accept the worse solution or not according to the Metropolis criterion, and individual and global optimal values are updated, and the inertia weighting coefficients and the self and group learning factors are adjusted. Secondly, the speeds and positions of the particles are updated, and boundary condition processing and annealing processing are carried out. Finally, it is determined whether the termination condition is satisfied: if so, the run is ended; if not, the fitness function is calculated again, and the above process repeated.
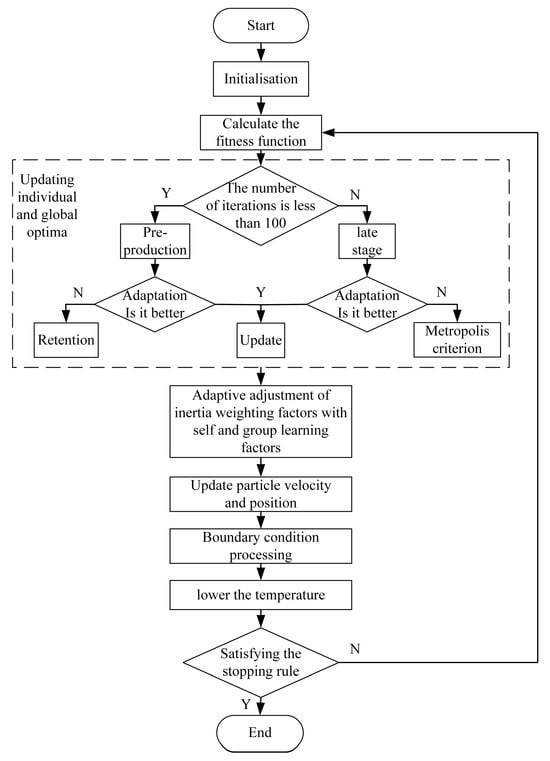
Figure 3.
Flowchart of adaptive particle swarm optimization algorithm based on simulated annealing.
In this paper, the improved particle swarm optimization algorithm is set to have a population size of 30, a dimension of 1, initial values of cognitive and social learning factors of 2 and 0.5, respectively, a temperature decay coefficient of 0.98, and a maximum number of iterations of 200.
(1) Optimization parameters
When the electric vehicle is traveling in a straight trajectory, the efficiency of the motor drive system exhibits significant variations under different speeds and torques [17]. Assuming that the output torque of the front and rear axle motors is equivalent on both sides, that the wheel speed of four wheels is uniform, and that there is no wheel slip, the front and rear axle drive torque can be reasonably allocated to operate the motors within the high-efficiency zone. This will achieve the optimal energy consumption of the drive system. Therefore, the front and rear axle drive torque allocation coefficients can be selected as the optimization parameters, as shown in the following equation:
where is the sum of the target torque (N·m) assigned to the two drive motors of the front axle; is the sum of the target torque (N·m) assigned to the two drive motors of the rear axle; is the longitudinal demand drive torque (N·m); is the torque distribution coefficient of the front axle.
(2) Objective function
When the total output power of the motor drive system is kept constant at the current drive torque and motor speed, the overall energy consumption can be optimized by minimizing the total input power of the motor drive system, which can be expressed as:
where is the speed of the front axle individual drive motors (r/min); is the speed of the rear axle individual drive motors (r/min); , is the front and rear axle individual motor drive system efficiency (%) at the current torque and speed; is the total input power of the motor drive system (W).
To improve the operational efficiency of the algorithm, the fitness function can be simplified as:
(3) Constraints
The drive torque distribution coefficient shall be between 0 and 1, when the coefficient is 0 for rear-wheel drive and when the coefficient is 1 for front-wheel drive. The torque and speed of individual wheels shall also be within the maximum range when the vehicle is driven, i.e., the following constraints shall be satisfied:
where is the maximum speed of the motor (r/min); is the peak motor torque (N·m);
(4) Optimization results
The optimal drive torque distribution coefficients under different demanded drive torque and motor speeds are solved by the simulated annealing-based adaptive particle swarm algorithm, as shown in Figure 4. When there is a driving demand, the driving torque allocation coefficient can be invoked by the look-up table method as a way to improve the efficiency of model operation. When the demand driving torque is small, it tends to be driven by a single axis, so that the working point of the electric drive system is close to the high-efficiency region, and when the demand driving torque is large, it tends to be evenly distributed, so that the electric drive system of both axes can be driven efficiently.
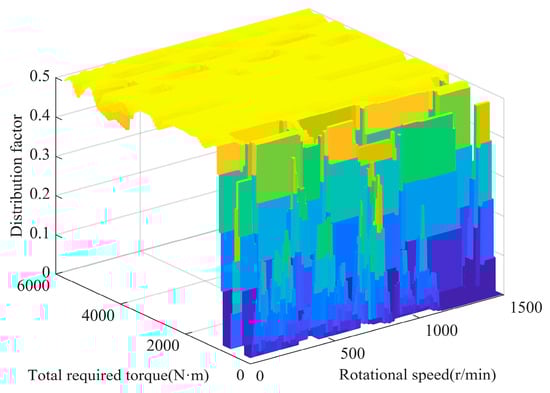
Figure 4.
Plot of optimized drive torque distribution coefficients.
4. Brake Energy Recovery Strategy
When the driver depresses the brake pedal, the system first calculates the demand braking torque and the wheel slip rate. If the slip rate of any one of the four wheels is greater than the optimal slip rate, then the braking torque of four wheels is independently allocated in real time according to the slip mode control, and only hydraulic braking is used at this time; if the slip rates of four wheels are under the optimal slip rate, it should be determined whether any one of the conditions is satisfied in the SOC ≥ 0.9 and the braking strength Z ≥ 0.7 with the vehicle speed Vx ≤ 5 km/h, and if it is satisfied, then only hydraulic braking is used, and the front and rear axles are allocated the braking torque according to the ideal braking torque allocation curve; if none of the above three conditions is satisfied, the braking torque is allocated according to the genetic algorithm optimization strategy, and the relationship between the demand braking torque and the maximum regenerative torque of a single hub motor is further judged. In instances where the demand braking torque is less than the maximum regenerative torque, pure regenerative braking is employed. Conversely, if the demand braking torque exceeds the maximum regenerative torque, electro-hydraulic composite braking is utilized. The control strategy flow is illustrated in Figure 5.
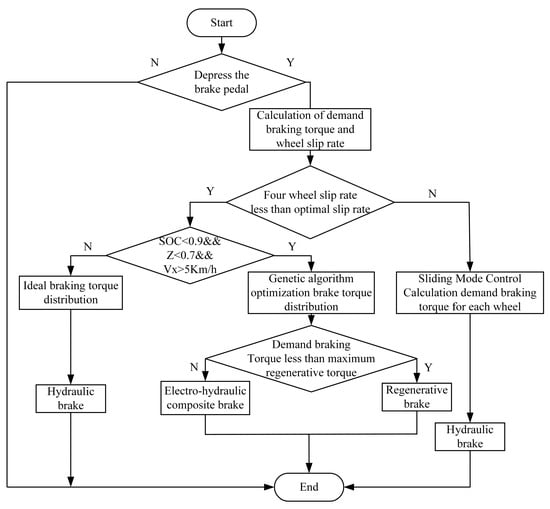
Figure 5.
Flow chart of brake energy recovery control strategy.
4.1. Constraints
Distributed drive vehicles will be limited in braking by vehicle speed, braking strength, braking stability, hub motors, and power batteries.
(1) Speed
When the vehicle is traveling at low speed, due to the low motor speed, the braking energy recovery capacity is poor, with the recovered energy even lower than the internal losses. To ensure safety and comfort during braking, this paper establishes a critical vehicle speed of 5 km/h [18]. The hydraulic brake is engaged when the vehicle speed falls below this threshold, facilitating braking energy recovery only when the speed exceeds the critical value.
(2) Brake strength
In the implementation of emergency braking to deal with emergency conditions, vehicles’ braking intensity is greater; in order to ensure braking safety, they must quickly and fully provide the required braking force. This paper takes 0.7 for the braking intensity critical value. Below this value the motor brake can be used; higher than this value, only the hydraulic brake.
(3) Brake Stability
In the design of the braking energy recovery strategy, the front and rear axle braking force allocation needs to fully consider the vehicle’s front and rear wheel locking order. According to the theory of braking stability, the rear axle lockup can easily cause skidding, so the actual braking force distribution needs to be located below the I curve to avoid the rear axle locking first; in order to reduce the chance of losing steering ability when the front wheels are locked during braking and to improve the adhesion efficiency, the closer the braking force distribution should be to the I curve, the better. At the same time, considering the braking efficiency and directional stability during braking, the brake force distribution coefficients of the front and rear axles should be between the I-curve and the ECE braking regulations [19], as shown in Figure 6; the shaded portion is the range of values when the braking intensity is lower than 0.7, and the front and rear axles are distributed in accordance with the I-curve (red line) when the braking intensity is higher than 0.7.
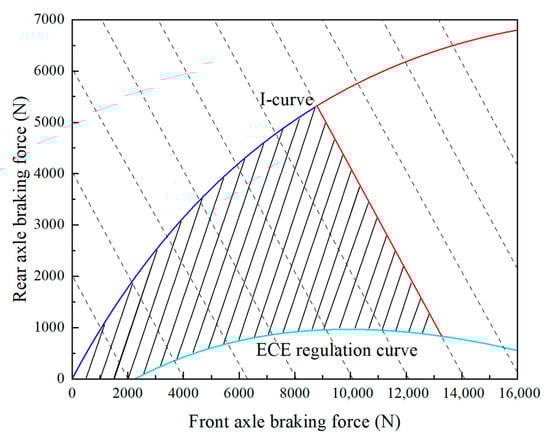
Figure 6.
I-curve and ECE brake regulation constraints map.
① Ideal front and rear axle power distribution
In different coefficients of adhesion φ on the road, when the adhesion coefficient remains constant, the braking stability of the vehicle is optimal when the wheels on both the front and rear axles lock simultaneously. This means that the magnitude of the braking force on the front and rear axles is respectively equal to the magnitude of their adhesion forces, and the sum of the braking forces on the front and rear axles is equal to the sum of the ground adhesion forces. The following equations can be derived:
where and is the front/rear axle ground longitudinal braking force (N); φ is coefficients of adhesion; is the normal reaction force of the ground on the front wheels (N); is the normal reaction force of the ground on the rear wheels (N); G is the gravity of the vehicle (N).
The front and rear axle brake force distribution curves at this point are I-curves with the expression
where is the height of the car’s centre of mass (m); L is the wheelbase (m); a and b are centre of mass to front/rear axle distances (m).
② ECE brake regulations
In order to ensure the braking efficiency and directional stability of the car during braking, the United Nations Economic Commission for Europe formulated the ECE R13 braking regulations. The M1 vehicle front and rear wheel brake braking force demonstrates the clear requirements of the regulations: when the braking strength of z = 0.15~0.80, the rear axle utilization coefficient of adhesion curve should not be above the front axle utilization coefficient of adhesion curve; when the coefficient of adhesion φ = 0.2~0.8, its braking strength should satisfy z ≥ 0.1 + 0.7 (φ − 0.2).
(4) Hub motors
The motor constitutes the core technology of braking energy recovery, which functions in reverse during braking to convert mechanical energy into electrical energy to charge the power battery. The external characteristics of the motor are illustrated in Figure 7, and the curve is divided into two regions: constant torque region and constant power region. The constant torque zone, which extends from zero speed to the rated speed, is characterized by a constant output torque of the motor, while the power output increases linearly with increasing speed. In contrast, the constant power zone, spanning from the rated speed to the maximum speed, exhibits a constant motor output power, accompanied by a gradual decrease in torque, following a hyperbolic trajectory as speed increases.
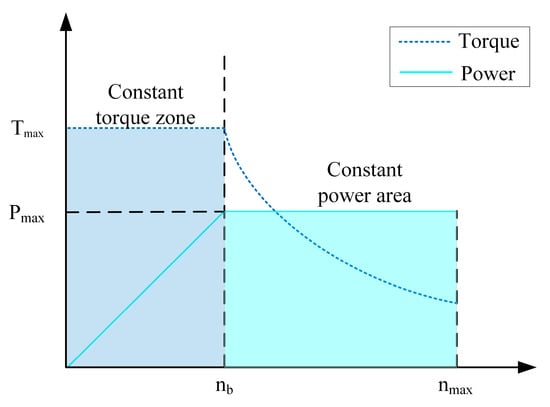
Figure 7.
Motor external characteristic diagram.
Based on this characteristic, the maximum braking torque that can be achieved by the motor at different speeds can be expressed as:
where is the maximum motor braking torque (N·m) under the motor characteristic constraints; is the peak motor power (kw); is the motor base speed (r/min).
(5) Power Battery
In the brake energy recovery, in order to extend the battery life, the charging power should be under the maximum charging power of the power battery, and at the same time to avoid over-charging and over-discharging, so this paper sets the SOC critical value of 90%, below which brake energy recovery can be enabled; more than that, only hydraulic braking is used.
4.2. Braking Torque Distribution for Conventional Braking Conditions
4.2.1. Braking Torque Allocation Strategy Based on Elite Preserving Genetic Algorithm
Due to the complexity and variability of the vehicle’s actual driving conditions, there are differences in the demand for regenerative braking and stability at different speeds and braking intensities. To address this issue, this paper proposes a fuzzy rule-based weight adaptive adjustment system [20]. This system utilizes fuzzy control to dynamically adjust the weight coefficients of the objective function. Subsequently, genetic algorithms are employed to optimize the front and rear axle braking torque distribution coefficients.
In order to expedite the convergence of the algorithm and circumvent the entrapment in local optimal solutions, an elite retention strategy is hereby proposed. The elite retention strategy identifies the individual with the highest level of fitness as the elite individual. This elite individual is then included in the subsequent generation of the population, while the least fit individual is eliminated, thereby ensuring that the population size remains constant.
Vehicle braking stability and braking energy recovery efficiency are taken as the optimization objectives to realize regenerative braking control strategy optimization. Elite retention genetic algorithm is used to solve the objective function, the number of populations in the genetic optimization algorithm is set to 20 termination generations of 100, and the crossover and mutation probabilities are 0.6 and 0.2, respectively. The flow is shown in Figure 8: firstly, initialization is carried out; secondly, the weight coefficients of the objective function are adjusted according to the current speed and braking intensity by the fuzzy control system, and the degree of adaptation is calculated, and the optimal two individuals are retained to the new generation of populations, and finally, it is judged whether the stopping rule is satisfied, and if it is satisfied, termination is carried out, and if it is not satisfied, a new generation of populations is generated by genetic operation, and the above cycle is repeated.
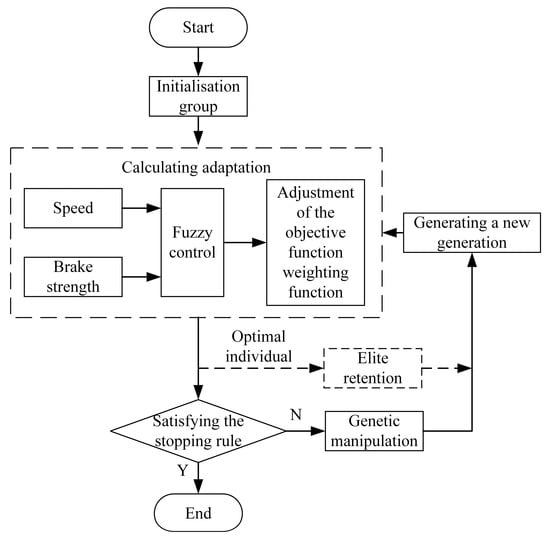
Figure 8.
Flowchart of improved genetic algorithm.
(1) Optimization parameters
In this study, the focus is exclusively on the longitudinal travel of the vehicle. It is posited that the wheel rotation speeds on both sides of the front and rear axles are equivalent and the torque is distributed uniformly. The distribution of braking torque between the front and rear axles has been demonstrated to have a significant impact on the recovery of braking energy and the stability of the braking system. In light of this, the front and rear axle brake torque distribution coefficients, denoted by β, have been identified as the primary optimization objective [21]. The genetic algorithm is employed to identify the optimal distribution coefficients under various operational speeds and demand braking torques. The front and rear axle torque distribution coefficient β is defined as:
where is the front axle demand braking torque (N·m); is the rear axle demand braking torque (N·m); is the total demand braking torque (N·m).
The distribution coefficient β should be between 0 and 1. When β = 0, braking is performed with only the two rear axle wheels, and when β = 1, braking is performed with only the two front axle wheels.
(2) Objective function
Before finding the optimal genetic algorithm, it is necessary to determine the fitness function based on the actual problem. Here, it is the objective function of the optimization algorithm. In addition, in order to reduce the scale difference between different objective functions, accelerate the convergence speed of the algorithm, and further improve the stability of the algorithm, the objective function needs to be normalized. In this paper, the braking stability and braking energy recovery rate are used as the objective functions. They are shown as follows:
where is the weighting factor for brake stability; is the weighting factor for brake energy recovery rate.
① Brake stability objective function
The closer the utilization adhesion coefficient is to the braking strength, the more fully the road surface adhesion conditions are exerted, and the more reasonable the braking force distribution of the automobile is. The ideal situation is to use the coefficient of adhesion is always equal to the braking strength, so the braking strength close to the degree of utilization of the coefficient of adhesion as a basis for stability. The formula is as follows:
where is the front wheel adhesion coefficient of the car; is the rear wheel adhesion coefficient of the car; z is the braking strength.
② Braking energy recovery objective function
The ratio of the actual recovered energy to the recoverable energy of the power battery is used as the braking energy recovery objective function, and the formula is as follows:
where is the actual recovered energy (J); is the ideal recovered energy (J).
(3) Constraints
Since the optimization of the front and rear axle braking torque distribution coefficients need to be considered to affect the vehicle braking stability, safety, and energy efficiency, the I-curve and the ECE braking regulations are used as the constraints in the optimization of the objective function [22], and the range of values of β under different braking intensities is shown as shaded in Figure 9, and its constraint formula is shown in the following equation:
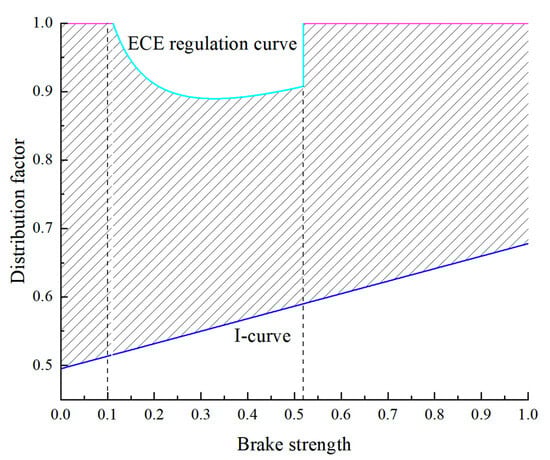
Figure 9.
Distribution coefficient constraints map.
(4) Optimization results
The front and rear axle braking torque distribution coefficients MAP plots under different vehicle speeds and braking torques obtained after optimization by genetic algorithm are shown in Figure 10. With the increase in braking torque, the front axle braking torque distribution coefficient is also gradually increased in order to ensure the stability and safety of vehicle braking.
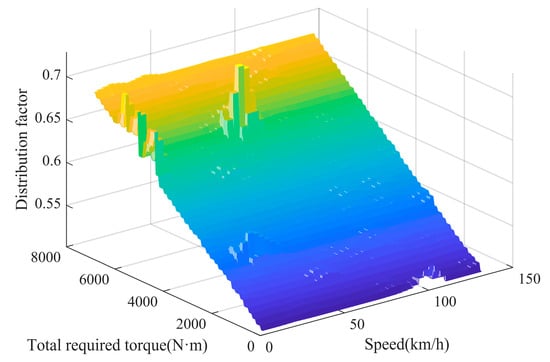
Figure 10.
Optimized MAP diagram of braking torque distribution coefficients for front and rear axles.
4.2.2. Dynamic Weight Allocation Strategy Based on Fuzzy Control
Vehicle speed and braking intensity are selected as the input parameters of the fuzzy controller, and the output is the proportionality coefficient of the two objective functions, so as to realize the dynamic allocation of the weights of braking stability and braking energy recovery under different driving states.
(1) Fuzzy affiliation function design
The domain of vehicle speed is set to [0, 140], and the fuzzy subsets are {VL, VM, VH}; the domain of braking intensity is set to [0, 1], and the fuzzy subsets are {ZL, ZM, ZH}, where L, M, and H stand for small, medium, and large degree of affiliation, respectively. The scale factor theories of both objective functions are [0, 1], and the fuzzy subsets are {LL, L, M, H, HH}. The degree of affiliation function for each parameter is shown in Figure 11.
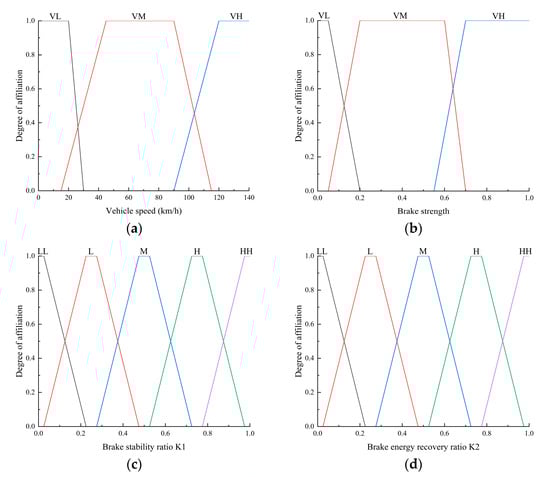
Figure 11.
Affiliation function of each parameter: (a) Vehicle speed; (b) Brake strength; (c) Brake stability ratio K1; (d) Brake energy recovery ratio K2.
(2) Fuzzy rule design
At lower speeds, less energy can be recovered, and braking energy recovery should be limited; at moderate speeds, the regenerative braking capacity can be improved; when speeds are high, braking stability should be focused on to ensure braking safety.
When the braking intensity is small, the regenerative braking torque percentage can be increased; when the braking intensity is medium, regenerative braking and braking stability should be considered comprehensively; if the braking intensity is large, it indicates that the vehicle needs to be stopped in a short distance and a short period of time, and then the regenerative braking should be reduced, and braking stability should be the main focus.
According to the above principles and a large number of expert experiences, while fully considering the driver’s driving safety, nine fuzzy rules as shown in Table 3 are established accordingly.
Table 3.
Table of fuzzy rules.
(3) Defuzzification
The outputs obtained through fuzzy inference are characterized by a degree of ambiguity; to obtain precise values, they must undergo a process of defuzzification. This paper employs the center of gravity method of defuzzification, a technique that is widely utilized in this context.
4.3. Braking Torque Distribution for Emergency Braking Conditions
In order to ensure that the anti-lock module can be quickly accessed in emergency braking situations, so that the slip rate is controlled near the optimal value until the vehicle stably completes the braking process, when the slip rate of any of the four wheels of the vehicle exceeds the optimal slip rate [23], it is switched to the antilock braking control strategy, which independently distributes the braking torque of the four wheels, so as to reduce the braking time of the vehicle to ensure the braking stability, at this time, in order to improve the safety of vehicle braking, only hydraulic braking is used.
Antilock braking based on sliding mode control takes the slip rate of four wheels as the control objective and the optimal slip rate as the input and designs a sliding mode controller to control the braking torque of the four-wheel hub motors so that the actual wheel slip rate is close to the optimal slip rate [24,25,26,27,28,29].
The simplified single-wheel kinematic model of the vehicle is:
where is the wheel moment of inertia (); is the angular acceleration of the wheel (); is the reaction force of braking force provided by the ground (N); is the braking torque of the wheel (N·m); is the wheel rolling radius without ground braking force (m).
The wheel slip rate is defined as follows:
where is the wheel slip rate; is the wheel angular velocity (); is the speed of the wheel center (m/s).
In this paper, we assume that the road conditions are constant, i.e., the optimal slip rate is unchanged to the wheel slip rate is located near the optimal slip rate, and define the switching function of the sliding mode control as:
where is the target slip rate, i.e., the optimal slip rate.
The first order derivative of the switching function is obtained:
From Equation (18), it follows that
The combined Equation (17) yields the slip mold control system as:
where is the target control torque of the wheel (N·m).
Exponential convergence law is chosen:
where is the isochronous convergence term and is the exponential convergence term.
To effectively attenuate the jitter of the sliding mode controller, a continuous saturation function is used instead of the sign function , and the saturation function is defined as:
where is the boundary layer width.
This gives the target control torque for the sliding mode control:
4.4. Electro-Hydraulic Brake Force Distribution Strategy
Under conventional braking conditions, if the vehicle meets the conditions for regenerative braking, the electro-hydraulic braking force distribution on a single hub motor uses the logic threshold value control algorithm, taking the maximum regenerative braking torque of the motor as the threshold value, and realizing a reasonable distribution of hydraulic braking torque and regenerative braking torque based on the size of the demand braking torque and the threshold value, and the specific braking force distribution strategy is as follows:
(1) When the demand braking torque is greater than the motor’s maximum regenerative braking torque, all four hub motors provide the motor’s maximum braking torque, and the excess braking torque is provided by the hydraulic brakes on all four wheels.
(2) When the demand braking torque is less than the maximum braking torque of the motors, only four hub motors are required for regenerative braking, and hydraulic braking is not necessary.
5. Simulation Results Analysis
5.1. Drive Conditions
Currently, the cycle conditions commonly used to evaluate vehicle energy consumption include New European Driving Cycle (NEDC), WLTC, China Light—duty Vehicle Test Cycle (CLTC), Urban Dynamometer Driving Schedule (UDDS), etc. Among them, the WLTC condition integrates urban and high-speed driving conditions, and the test conditions are more stringent and varied than those of NEDC and CLTC, which can more accurately simulate the actual range. It includes low-speed, medium-speed, high-speed, and ultra-high-speed tests, with a maximum speed of 131.3 km/h and an average speed of 46.5 km/h. The cycle conditions are shown in Figure 12.
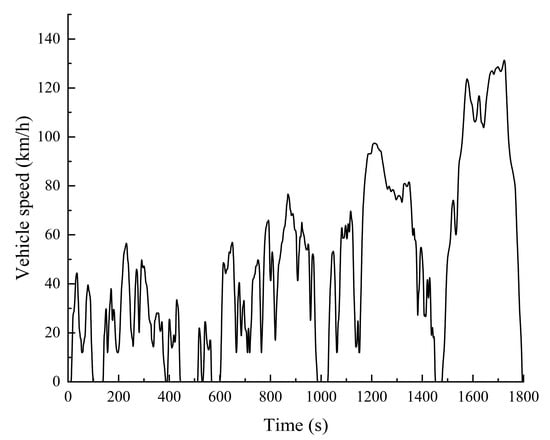
Figure 12.
WLTC cycle working condition diagram.
In a single WLTC condition, the SOC simulation curves of the power battery under different driving strategies are shown in Figure 13, and the SOC value under the driving optimization strategy decreases slowly; the final SOC is 0.30% higher than that of the average distribution strategy and 0.18% higher than that of the traditional particle swarm optimization strategy, which effectively extends the range. Some of the driving efficiency points of each strategy during the cycle are shown in Figure 14, and it is obvious that the number of high-efficiency points of the wheels under the optimization strategy is significantly more than that of the average distribution strategy and the traditional strategy, which shows that the optimization strategy can effectively utilize the energy-saving potential of the vehicle.
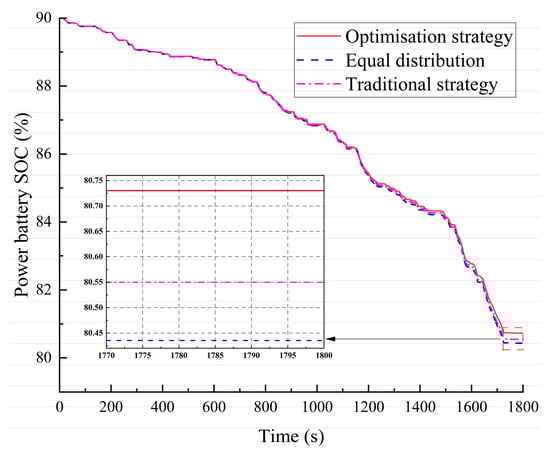
Figure 13.
Power battery SOC changes under different strategies.
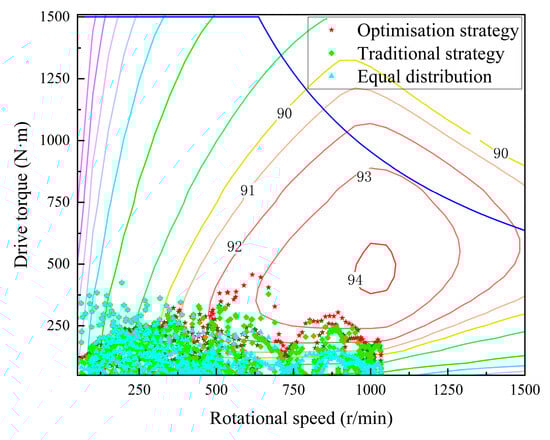
Figure 14.
Diagram of motor operating points during drive.
The energy consumption when driving is shown in Table 4, the drive optimization strategy reduces the energy consumption by 0.16 kw·h and 0.10 kw·h compared to the average distribution and the traditional strategy, and the energy consumption of the whole vehicle is reduced by 3.20% and 2.00%, respectively.
Table 4.
Drive energy consumption table.
5.2. Braking Conditions
There are various evaluation criteria for braking energy recovery performance [30], and in this paper, the ratio of braking energy actually recovered by the motor to the ideal recovered energy during braking is used as the evaluation criterion.
The regenerative braking energy is.
where is the regenerative braking power (W); is the battery charging voltage (V); is the battery charging current (A).
According to the kinetic energy theorem for automobiles, the kinetic energy expended by a car during braking is.
where m is the mass of the car (kg); is the braking initial instantaneous speed (m/s); is the braking end instantaneous velocity (m/s); is the initial instantaneous kinetic energy of braking (J); is the instantaneous kinetic energy at the end of braking (J).
The amount of kinetic energy lost is considered as recoverable energy when the vehicle is braked on a level road surface:
From the above equation, the brake energy recovery rate is given as.
where is the braking energy recovery rate (%).
(1) General braking conditions
The simulation curve of power battery SOC during braking is shown in Figure 15. In the WLTC cycle condition, the initial SOC of the power battery is 90%, and the decrease rate of the power battery SOC value under the optimization strategy decreases, and the SOC value at the end of the cycle is 81.60%, which improves the SOC by 0.04% compared to the fixed ratio allocation and verifies the high efficiency of braking energy recovery.
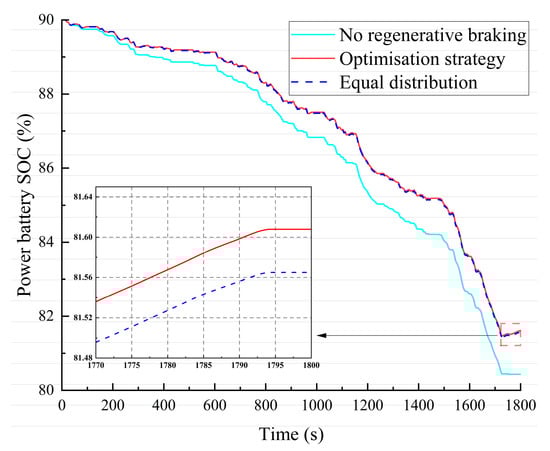
Figure 15.
Variation of SOC of power battery under braking strategy.
The effect of braking recovered energy is shown in Figure 16, the fixed allocation strategy recovers 0.68 kw·h, while the optimized strategy recovers 0.71 kw·h, which is an improvement of 4.07% in comparison.
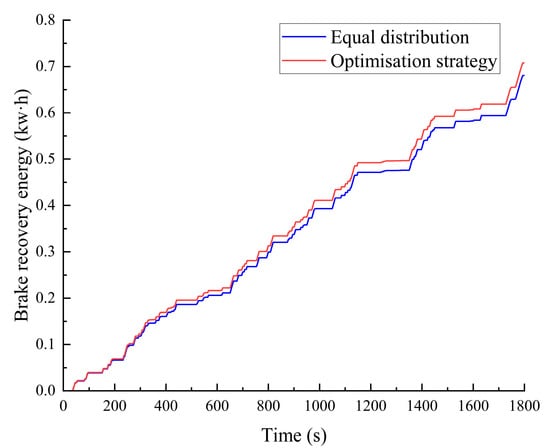
Figure 16.
Brake recovery energy diagram.
Brake energy recovery results are shown in Table 5. The energy recovery efficiency under the optimized strategy in the WLTC cycle condition is 31.39%, which is an improvement of 0.87% compared to the fixed ratio allocation strategy.
Table 5.
Brake energy recovery table.
(2) Emergency braking conditions
①Low adhesion coefficient pavement
On a low attachment road (with an attachment coefficient of 0.2), the initial speed is set to be 60 km/h and braking is performed at a braking intensity z = 0.5, and the simulation results are shown in Figure 17.
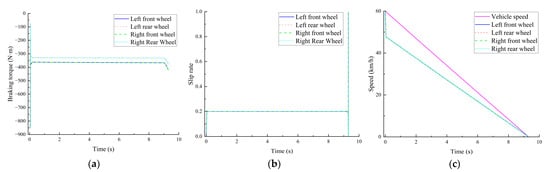
Figure 17.
Simulation results of low coefficient of adhesion pavements: (a) Braking torque; (b) Slippage rate; (c) Speed.
A thorough examination of the simulation results reveals that when a vehicle is engaged in emergency braking on a road surface characterized by a low adhesion coefficient, the peak adhesion coefficient of the road surface is considerably lower than the braking strength. Consequently, the wheel slip rate rapidly surpasses the optimal slip rate. In response, the ABS control system promptly intervenes, ensuring the stable output of braking torque for all four wheels within a brief interval. Thereafter, the torque exhibits no discernible vibration. In the initial phase of braking, the wheel speed undergoes a rapid decrease due to the concomitant increase in slip rate. Following a brief period of fluctuation, the wheel speed declines linearly, ultimately reaching a steady state after 9.3 s. During this process, the wheels maintain a non-locked state. It has been demonstrated that the braking strategy is capable of rapidly adjusting the braking torque and achieving precise control of the wheel slip rate under conditions of a low adhesion coefficient road surface. This ensures the braking stability and handling safety of the vehicle.
②High adhesion coefficient pavement simulation
On a highly attached road (with a coefficient of adhesion of 0.7), the initial speed is set to be 100 km/h, and braking is carried out with a braking intensity of z = 0.8, and the simulation results are shown in Figure 18.
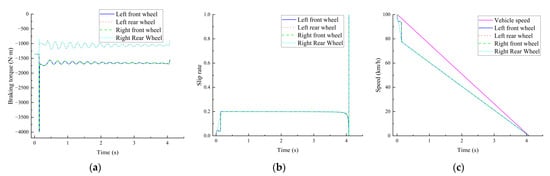
Figure 18.
Simulation results of high adhesion coefficient road surface: (a) Braking torque; (b) Slippage rate; (c) Speed.
As demonstrated by the simulation results, in situations where a vehicle is undergoing emergency braking on a road with a high coefficient of adhesion, there is a forward shift in the center of gravity. This results in an augmentation of the normal reaction force of the front axle and an increase in ground friction. Consequently, under these circumstances, the slip rate of the front axle wheels is within the optimal range. The slip rate of the rear axle wheels rapidly exceeds the optimal slip rate, prompting the vehicle to enter the ABS strategy to reduce the braking distance. Consequently, the slip rate of the four wheels is stabilized and controlled within the optimal range. The braking torque on the front axle suddenly increases and then decreases, after which the braking torque exhibits regular fluctuations. The wheel speed is affected by the sudden change in braking force. In the initial phase of braking, a brief jitter is observed, followed by a smooth decline in the front axle wheels. This is due to the low slip rate in the early stage, which results in the wheel speed being more similar to the vehicle’s speed. Subsequently, after the vehicle enters the anti-lock braking control, the wheel speed of the front axle becomes the same as that of the rear axle wheels. This process continues until the braking is fully completed in 4.1s; during this period, none of the wheels locked up, it can be seen that the strategy is effective in guaranteeing the vehicle braking stability and shortening the braking distance in the emergency braking conditions.
6. Conclusions
In this paper, a high-efficiency and energy-saving control strategy is proposed with distributed hub motor-driven vehicles as the research object. The impact of critical factors, including the efficiency of the electric drive system and the charging/discharging characteristics of the power battery, is thoroughly considered. A simulation environment is configured through the utilization of MATLAB R2023a/Simulink and Carsim 2020.0, employing diverse algorithms to optimize the distribution of driving and braking torque. The simulation is executed under WLTC cycle conditions, and the results demonstrate that the adaptive particle swarm optimization strategy based on simulated annealing reduces the total vehicle drive energy consumption in comparison with the average allocation and the traditional particle swarm strategy. Furthermore, the elite retention genetic algorithm optimization strategy based on adaptive weight coefficients increases the braking recycling energy in comparison with the fixed proportion allocation. Consequently, these strategies can effectively enhance the energy utilization efficiency of the vehicle and extend its mileage. In the context of emergency braking, anti-lock control based on sliding mode control can adapt to road conditions with varying levels of adhesion, ensuring good braking stability for the vehicle, verifying the effectiveness of the strategy.
Author Contributions
Conceptualization, X.Y.; methodology, B.H.; software, J.W.; validation, B.H. and J.W.; formal analysis, B.H. and M.M.; investigation, B.H.; resources, M.M.; data curation, B.H.; writing—original draft preparation, B.H. and J.W.; writing—review and editing, B.H. and M.M.; visualization, J.W.; supervision, X.Y.; project administration, X.Y.; funding acquisition, X.Y. All authors have read and agreed to the published version of the manuscript.
Funding
This research was funded by the National Key Research and Development Program of China, grant number 2023YFB2504305.
Data Availability Statement
The original contributions presented in the study are included in the article, further inquiries can be directed to the corresponding author/s.
Conflicts of Interest
The authors declare no conflicts of interest.
References
- Zhang, H.; Chen, D.; Zhang, H.; Liu, Y. Research on the Influence Factors of Brake Regenerative Energy of Pure Electric Vehicles Based on the CLTC. Energy Rep. 2022, 8, 85–93. [Google Scholar] [CrossRef]
- He, Z.; Shi, Q.; Wei, Y.; Zheng, J.; Gao, B.; He, L. A Torque Demand Model Predictive Control Approach for Driving Energy Optimization of Battery Electric Vehicle. IEEE Trans. Veh. Technol. 2021, 70, 3232–3242. [Google Scholar] [CrossRef]
- He, H.; Han, M.; Liu, W.; Cao, J.; Shi, M.; Zhou, N. MPC-Based Longitudinal Control Strategy Considering Energy Consumption for a Dual-Motor Electric Vehicle. Energy 2022, 253, 124004. [Google Scholar] [CrossRef]
- Prost, M.; Cvok, I.; Velenis, E. Energy-Efficient Optimal Torque Vectoring for a Four-Motor High-Performance Electric Vehicle. In Proceedings of the 16th International Symposium on Advanced Vehicle Control, Milan, Italy, 2–6 September 2024; Mastinu, G., Braghin, F., Cheli, F., Corno, M., Savaresi, S.M., Eds.; Springer Nature: Cham, Switzerland, 2024; pp. 804–811. [Google Scholar] [CrossRef]
- Su, Z.; Du, J. Optimization of External Characteristic Parameters of Multiple Motors for Electric Vehicles Based on Optimal Torque Distribution Coefficient. In Proceedings of the 2022 25th International Conference on Electrical Machines and Systems (ICEMS), Chiang Mai, Thailand, 29 November–2 December 2022; pp. 1–5. [Google Scholar] [CrossRef]
- Yang, Y.; Tang, Q.; Bolin, L.; Fu, C. Dynamic Coordinated Control for Regenerative Braking System and Anti-Lock Braking System for Electrified Vehicles under Emergency Braking Conditions. IEEE Access 2020, 8, 172664–172677. [Google Scholar] [CrossRef]
- Li, W.; Xu, H.; Liu, X.; Wang, Y.; Zhu, Y.; Lin, X.; Wang, Z.; Zhang, Y. Regenerative Braking Control Strategy for Pure Electric Vehicles Based on Fuzzy Neural Network. Ain Shams Eng. J. 2024, 15, 102430. [Google Scholar] [CrossRef]
- Ye, L.; Wu, Z.; Lv, W. Optimisation of Braking Energy Recovery for Rear-Drive Electric Vehicles Based on Fuzzy Control. Int. J. Veh. Des. 2023, 92, 93–112. [Google Scholar] [CrossRef]
- Liu, B.; Li, G.; Wang, S. Research on Multi-Mode Braking Energy Recovery Control Strategy for Battery Electric Vehicles. Appl. Sci. 2024, 14, 6505. [Google Scholar] [CrossRef]
- Cao, X.; Ishikawa, T. Optimum Design of a Regenerative Braking System for Electric Vehicles Based on Fuzzy Control Strategy. IEEJ Trans. Electr. Electron. Eng. 2016, 11, S186–S187. [Google Scholar] [CrossRef]
- Wu, X.; Cui, G.; Li, S.; Zhang, B.; Li, Z. Braking Force Distribution of Electric Vehicles Based on Fuzzy Control. In Proceedings of the 2018 5th International Conference on Information Science and Control Engineering (ICISCE 2018), Zhengzhou, China, 20–22 July 2018; Li, S., Dai, Y., Cheng, Y., Eds.; IEEE: New York, NY, USA, 2018; pp. 654–659. [Google Scholar] [CrossRef]
- Li, L.; Zhang, Y.; Yang, C.; Yan, B.; Martinez, C.M. Model Predictive Control-Based Efficient Energy Recovery Control Strategy for Regenerative Braking System of Hybrid Electric Bus. Energy Convers. Manag. 2016, 111, 299–314. [Google Scholar] [CrossRef]
- Li, W.; Du, H.; Li, W. Four-Wheel Electric Braking System Configuration with New Braking Torque Distribution Strategy for Improving Energy Recovery Efficiency. IEEE Trans. Intell. Transp. Syst. 2020, 21, 87–103. [Google Scholar] [CrossRef]
- Yang, K.; Zhang, Z.; Wang, J.; Ma, C.; Tan, D.; Shao, C. Optimization and Control for a Novel Uncoupled Regenerative Braking System of Three-Axle Electric Bus. J. Clean. Prod. 2025, 490, 144771. [Google Scholar] [CrossRef]
- Zhao, J.M. Modelling and Simulation of SOC Estimation for Lithium-Ion Batteries Based on Second-Order EKF. Master’s Thesis, Xi’an University of Science and Technology, Xi’an, China, 2018. [Google Scholar]
- Wang, E.; Sun, C.; Wang, C.; Qu, P.; Huang, Y.; Pang, T. A Satellite Selection Algorithm Based on Adaptive Simulated Annealing Particle Swarm Optimization for the BeiDou Navigation Satellite System/Global Positioning System Receiver. Int. J. Distrib. Sens. Netw. 2021, 17, 15501477211031748. [Google Scholar] [CrossRef]
- Wu, X.; Zheng, D.; Wang, T.; Du, J. Torque Optimal Allocation Strategy of All-Wheel Drive Electric Vehicle Based on Difference of Efficiency Characteristics between Axis Motors. Energies 2019, 12, 1122. [Google Scholar] [CrossRef]
- Xu, L.; He, X.; Shen, X. Improving Energy Recovery Rate of the Regenerative Braking System by Optimization of Influencing Factors. Appl. Sci. 2019, 9, 3807. [Google Scholar] [CrossRef]
- Li, S.; Yu, B.; Feng, X. Research on Braking Energy Recovery Strategy of Electric Vehicle Based on ECE Regulation and I Curve. Sci. Prog. 2020, 103, 0036850419877762. [Google Scholar] [CrossRef]
- Zu, E.H.; Shu, M.H.; Huang, J.C.; Lin, H.T. Energy Recovery Decision of Electric Vehicles Based on Improved Fuzzy Control. Processes 2024, 12, 2919. [Google Scholar] [CrossRef]
- Tang, M.; Zhang, X. Optimal Regenerative Braking Control Strategy for Electric Vehicles Based on Braking Intention Recognition and Load Estimation. IEEE Trans. Veh. Technol. 2024, 73, 3378–3392. [Google Scholar] [CrossRef]
- Gang, L.; Hao, L.; Xu, R. Simulation Study on Regenerative Braking System of Pure Electric Vehicle with Compound Power Supply. In Proceedings of the 2019 International Conference on Advanced Electronic Materials, Computers and Materials Engineering (AEMCME 2019), Changsha, China, 19–21 April 2019; IoP Publishing Ltd.: Bristol, UK, 2019; Volume 563, p. 032031. [Google Scholar] [CrossRef]
- Liu, H.; Lei, Y.; Fu, Y.; Li, X. An Optimal Slip Ratio-Based Revised Regenerative Braking Control Strategy of Range-Extended Electric Vehicle. Energies 2020, 13, 1526. [Google Scholar] [CrossRef]
- Wang, H.; Wang, J.; Pi, D.; Wang, Q.; Sun, X.; Liu, Y.; Xue, P. Optimization of Commercial Vehicle Mechatronics Composite ABS Braking Control Considering Braking Efficiency and Energy Regeneration. IEEE Trans. Transp. Electrif. 2025, 11, 2332–2343. [Google Scholar] [CrossRef]
- Wang, J.C.; He, R.; Kim, Y.B. Optimal Anti-Lock Braking Control with Nonlinear Variable Voltage Charging Scheme for an Electric Vehicle. IEEE Trans. Veh. Technol. 2020, 69, 7211–7222. [Google Scholar] [CrossRef]
- Itani, K.; De Bernardinis, A.; Khatir, Z.; Jammal, A. Comparison between Two Braking Control Methods Integrating Energy Recovery for a Two-Wheel Front Driven Electric Vehicle. Energy Convers. Manag. 2016, 122, 330–343. [Google Scholar] [CrossRef]
- Chen, Z.; Ding, R.; Zhou, Q.; Wang, R.; Zhao, B.; Liao, Y. Research on Coordinated Control of Electro-Hydraulic Composite Braking for an Electric Vehicle Based on the Fuzzy-TD3 Deep Reinforcement Learning Algorithm. Control Eng. Pract. 2025, 157, 106248. [Google Scholar] [CrossRef]
- Mei, P.; Yang, S.; Xu, B.; Sun, K. A Fuzzy Sliding-Mode Control for Regenerative Braking System of Electric Vehicle. In Proceedings of the 2021 7th International Conference on Control, Automation and Robotics (ICCAR), Singapore, 23–26 April 2021; IEEE: New York, NY, USA, 2021; pp. 397–401. [Google Scholar] [CrossRef]
- Zhang, Q.; Jiang, M.; Yuan, Y.; Fan, Z.; Chen, S. A Novel Coordinated Control Strategy of Regenerative Braking and Anti-Lock System for Electric Vehicles. Proc. Inst. Mech. Eng. Part D J. Automob. Eng. 2024, 238, 304–319. [Google Scholar] [CrossRef]
- Huang, S.; Wu, X.; Lin, T.; Chen, Q.; Ren, H. Recovery and Control Strategy of Electro-Hydraulic Composite Braking Energy for Electric Loader with Braking Intention Recognition. Appl. Sci. 2023, 13, 9853. [Google Scholar] [CrossRef]
Disclaimer/Publisher’s Note: The statements, opinions and data contained in all publications are solely those of the individual author(s) and contributor(s) and not of MDPI and/or the editor(s). MDPI and/or the editor(s) disclaim responsibility for any injury to people or property resulting from any ideas, methods, instructions or products referred to in the content. |
© 2025 by the authors. Licensee MDPI, Basel, Switzerland. This article is an open access article distributed under the terms and conditions of the Creative Commons Attribution (CC BY) license (https://creativecommons.org/licenses/by/4.0/).