1. Introduction
Compressed air energy storage (CAES), commonly known as an “air power bank”, is a technology that converts excess electrical energy into high-pressure air, which is then stored in underground caverns. When electricity is needed, the high-pressure air is released to generate electricity (
Figure 1) [
1]. CAES is an effective way to mitigate the impact of the integration of renewable energy sources such as wind and solar power and to balance power supply and demand [
2,
3,
4]. Compared to other energy storage technologies such as pumped hydroelectric energy storage (PHES) [
5,
6] and electrochemical storage [
7], CAES has several advantages such as a long lifespan, large scale, low cost [
8,
9], environmental friendliness, wide range of alternative sites, and easy maintenance, showing vast commercial prospects [
10,
11,
12]. Due to the need to stably store large volumes (tens of thousands to hundreds of thousands of cubic meters) of high-pressure air, CAES power plants commonly use underground salt caverns [
13] or lined rock caverns (LRCs). Though there are two large-scale CAES plants that use salt caverns to store air (one in Germany and one in the USA) [
14,
15], they are limited by geological conditions, as salt caverns are not available in all regions [
16]. In recent years, LRCs, which are artificially excavated and lined in hard rock, have received special attention due to their flexible layout, wide range of location options, and easy maintenance.
Silo-type LRCs and tunnel-type LRCs are two common types of underground LRCs [
17,
18]. The silo-type LRC is designed as a large vertical vessel, offering advantages such as low construction costs, substantial capacity, and high operational efficiency. Silo-type LRCs are usually larger in diameter and smaller in length than tunnel-type LRCs. However, they also face challenges, including stringent geological requirements and significant difficulties in excavation and support. In contrast, tunnel-type LRCs more closely resemble tunnels, generally imposing less stringent geological conditions and presenting relatively easier construction and support requirements compared to silo-type LRCs. This makes the tunnel-type LRC a more viable option in various geological contexts [
19]. The LRC is a key component of a CAES plant, including the sealing layer, lining layer, and surrounding rock mass. Building an LRC involves a series of key technologies such as site selection, type selection, thermodynamic response, stability, air tightness, and durability.
Through laboratory/field tests, thersitical derivations, and numerical simulations, many studies have focused on the site selection, thermodynamic response, stability, air tightness, and durability of LRCs. D. Allen et al. [
20] summarized the primary geological environmental conditions necessary for the construction of underground LRCs, considering factors such as the type of surrounding rock, geological structure, and hydrogeological conditions. Stille et al. [
21] reported the field test results of a shallow LRC under cyclic loads up to 52 MPa, describing the deformation and leakage of the LRC in detail. Johansson [
22] showed that excessive straining of the steel lining is avoided by placing the cavern at a sufficient depth, leaving fatigue of the steel lining as the critical failure mode. These earlier studies provide preliminary explorations of LRCs. With the increasing demand for energy storage, studies are increasingly focused on the uplift stability [
10,
23], thermodynamic response [
24,
25,
26,
27,
28,
29], mechanical response [
19,
30,
31,
32,
33,
34,
35], and leakage [
30,
36] of LRCs. These studies have contributed to a better understanding of LRCs. However, as can be seen from previously published works, few studies are focused on selecting the type of LRC. The lack of a reliable approach for selecting the type of LRC in CAES limits further applications. Which type of LRC is more suitable for a given geological condition, the tunnel-type LRC or the silo-type LRC? This question is a prerequisite for the detailed analysis of LRCs and is often ignored in existing studies.
To overcome this limitation, a quantitative and objective estimation approach to selecting the type of underground LRC in CAES is developed in this work. A common decision analysis method for quantitative estimation is the analytical hierarchy process (AHP) [
37,
38,
39,
40,
41,
42,
43]. Though the AHP is a quick and feasible approach to quantitative estimation, the weight values of the sensitivity parameter are usually based on subjective methods, such as expert scoring. It is better to obtain the weight values based on an objective database, for example, data from reliable numerical simulations [
44].
In this study, a quantitative evaluation method for selecting the type of underground LRC in CAES is presented. After verifying the reliability of numerical simulation, the mechanical responses of a tunnel- and silo-type LRC are simulated with varying sensitivity parameters. Then, the AHP method is used to propose scoring systems for the two types of LRCs based on the results of the sensitivity analysis. Furthermore, three independent scoring systems (displacement, stress, and state) are developed to give a comprehensive estimation of selecting the type of LRC in CAES. Finally, examples are given to illustrate the application of the scoring systems in selecting the type of LRC in CAES.
2. Methods
Quantitative estimation of an appropriate underground LRC is helpful in the design stage of CAES. In this study, scoring systems are proposed for tunnel-type LRCs and silo-type LRCs through an objective approach (numerical simulations). The proposed scoring systems can be used for quantitative estimation of an appropriate LRC under varying geological conditions.
A flowchart of the quantitative estimation approach is shown in
Figure 2, and it can be divided into two parts. The purpose of part I is to validate the reliability of the numerical simulations of the LRC, where the simulated results are compared with the analytical solution for a simple LRC case. The relevant content will be presented in
Section 3.1.
After the reliability of the numerical simulations of the LRC was verified, more complex simulations of two types of LRCs were conducted, and scoring systems are proposed in part II. The two types of LRCs under study are the tunnel-type LRC and the silo-type LRC, which are the most popular LRC types. The tunnel-type LRC is horizontally distributed, more closely resembling a tunnel. The silo-type LRC is vertically distributed and is larger in diameter and smaller in length than the tunnel-type LRC (
Figure 1). The simulation process is based on a sensitivity analysis. Six parameters are taken into consideration during the sensitivity analysis: the deformation modulus
, Poisson’s ratio
, the cohesion
, the friction angle
, the crustal stress
, and the lateral stress coefficient
. It is worth noting that the influence of the burial depth of the LRC on its mechanical response is essentially characterized by crustal stress. Therefore, the crustal stress, instead of the burial depth, is selected in the sensitivity analysis. Based on the numerical simulation results of these sensitivity parameters, the analytical hierarchy process (AHP) is used to calculate the weight of each sensitivity parameter affecting the mechanical response for different types of LRCs. Three aspects of the mechanical response of the LRC are taken into consideration: displacement, stress, and state. Therefore, three scoring systems for the two types of LRCs are proposed. The relevant content will be presented in
Section 3.2,
Section 3.3 and
Section 3.4. Some key equations used during the scoring process are given below.
The scoring systems are based on the sensitivities of six parameters to the mechanical response. These six sensitivity parameters have different units, and for a convenient comparison between the parameters, a normalization process is utilized. The normalization process is given by Equations (1) and (2).
where
is the sensitivity parameters and the subscripts
indicate the deformation modulus, Poisson’s ratio, cohesion, friction angle, crustal stress, and lateral stress coefficient, respectively.
is the minimum value in the same set of sensitivity parameter schemes, while
is the maximum value within the same set.
is the sensitivity parameters after normalization or positive normalization.
is the slope of the trendline of the mechanical response to normalized sensitivity parameters. Examples of the determination of the slopes will be given in
Section 3.3 and
Section 3.4.
The slopes of the trendline indicate the sensitivity of these parameters to the mechanical response of two types of LRCs. A larger slope value means a greater influence on the mechanical response of two types of LRCs. The assembly of the slopes is given by Equation (3), which can be used to determine the weight values of each sensitive parameter.
where
is the assembly of slopes for sensitivity curves and
is the slope of the sensitivity curve for each sensitivity parameter.
By comparing the relative magnitudes of the slopes, a matrix for the AHP can be constructed. This process involves systematically comparing the slopes of various sensitivity curves to form a hierarchical matrix that reflects the importance and priority of different sensitivity parameters.
where
is the hierarchical matrix and
is relative importance of parameter
to parameter
.
By normalizing the eigenvalues of the hierarchical matrix, the weight values of each sensitivity parameter can be obtained using Equations (5)–(7).
where
is the eigenvalue matrix of the hierarchical matrix and
is the weight value matrix of each sensitivity parameter.
To ensure that the hierarchical matrix maintains consistency in the decision analysis process, a consistency test is needed. The consistency test has been widely used and will not be further elaborated on here. Based on the weight values of various sensitivity parameters obtained above, the two types of LRCs can be scored using the following equation:
where
is the score of the LRC.
The score of the LRC can be used as a quantitative estimation of its suitability. It is more appropriate to build a type of LRC with a larger score for the given geological condition. Examples of application of the scoring systems are given in
Section 4.
3. Scoring Systems for Two Types of LRCs
As outlined previously, two types of underground LRCs can be used in a CAES plant: tunnel- and silo-type LRCs. The scoring systems for the two types of LRCs are given in this section to determine which type of LRC is better for a given geological condition. The scoring systems are based on the numerical simulation results of the mechanical response of the two types of LRC. Before proposing the scoring systems, it is necessary to verify the reliability of the numerical simulation conducted on the LRC.
3.1. Verification of the Reliability Numerical Simulation
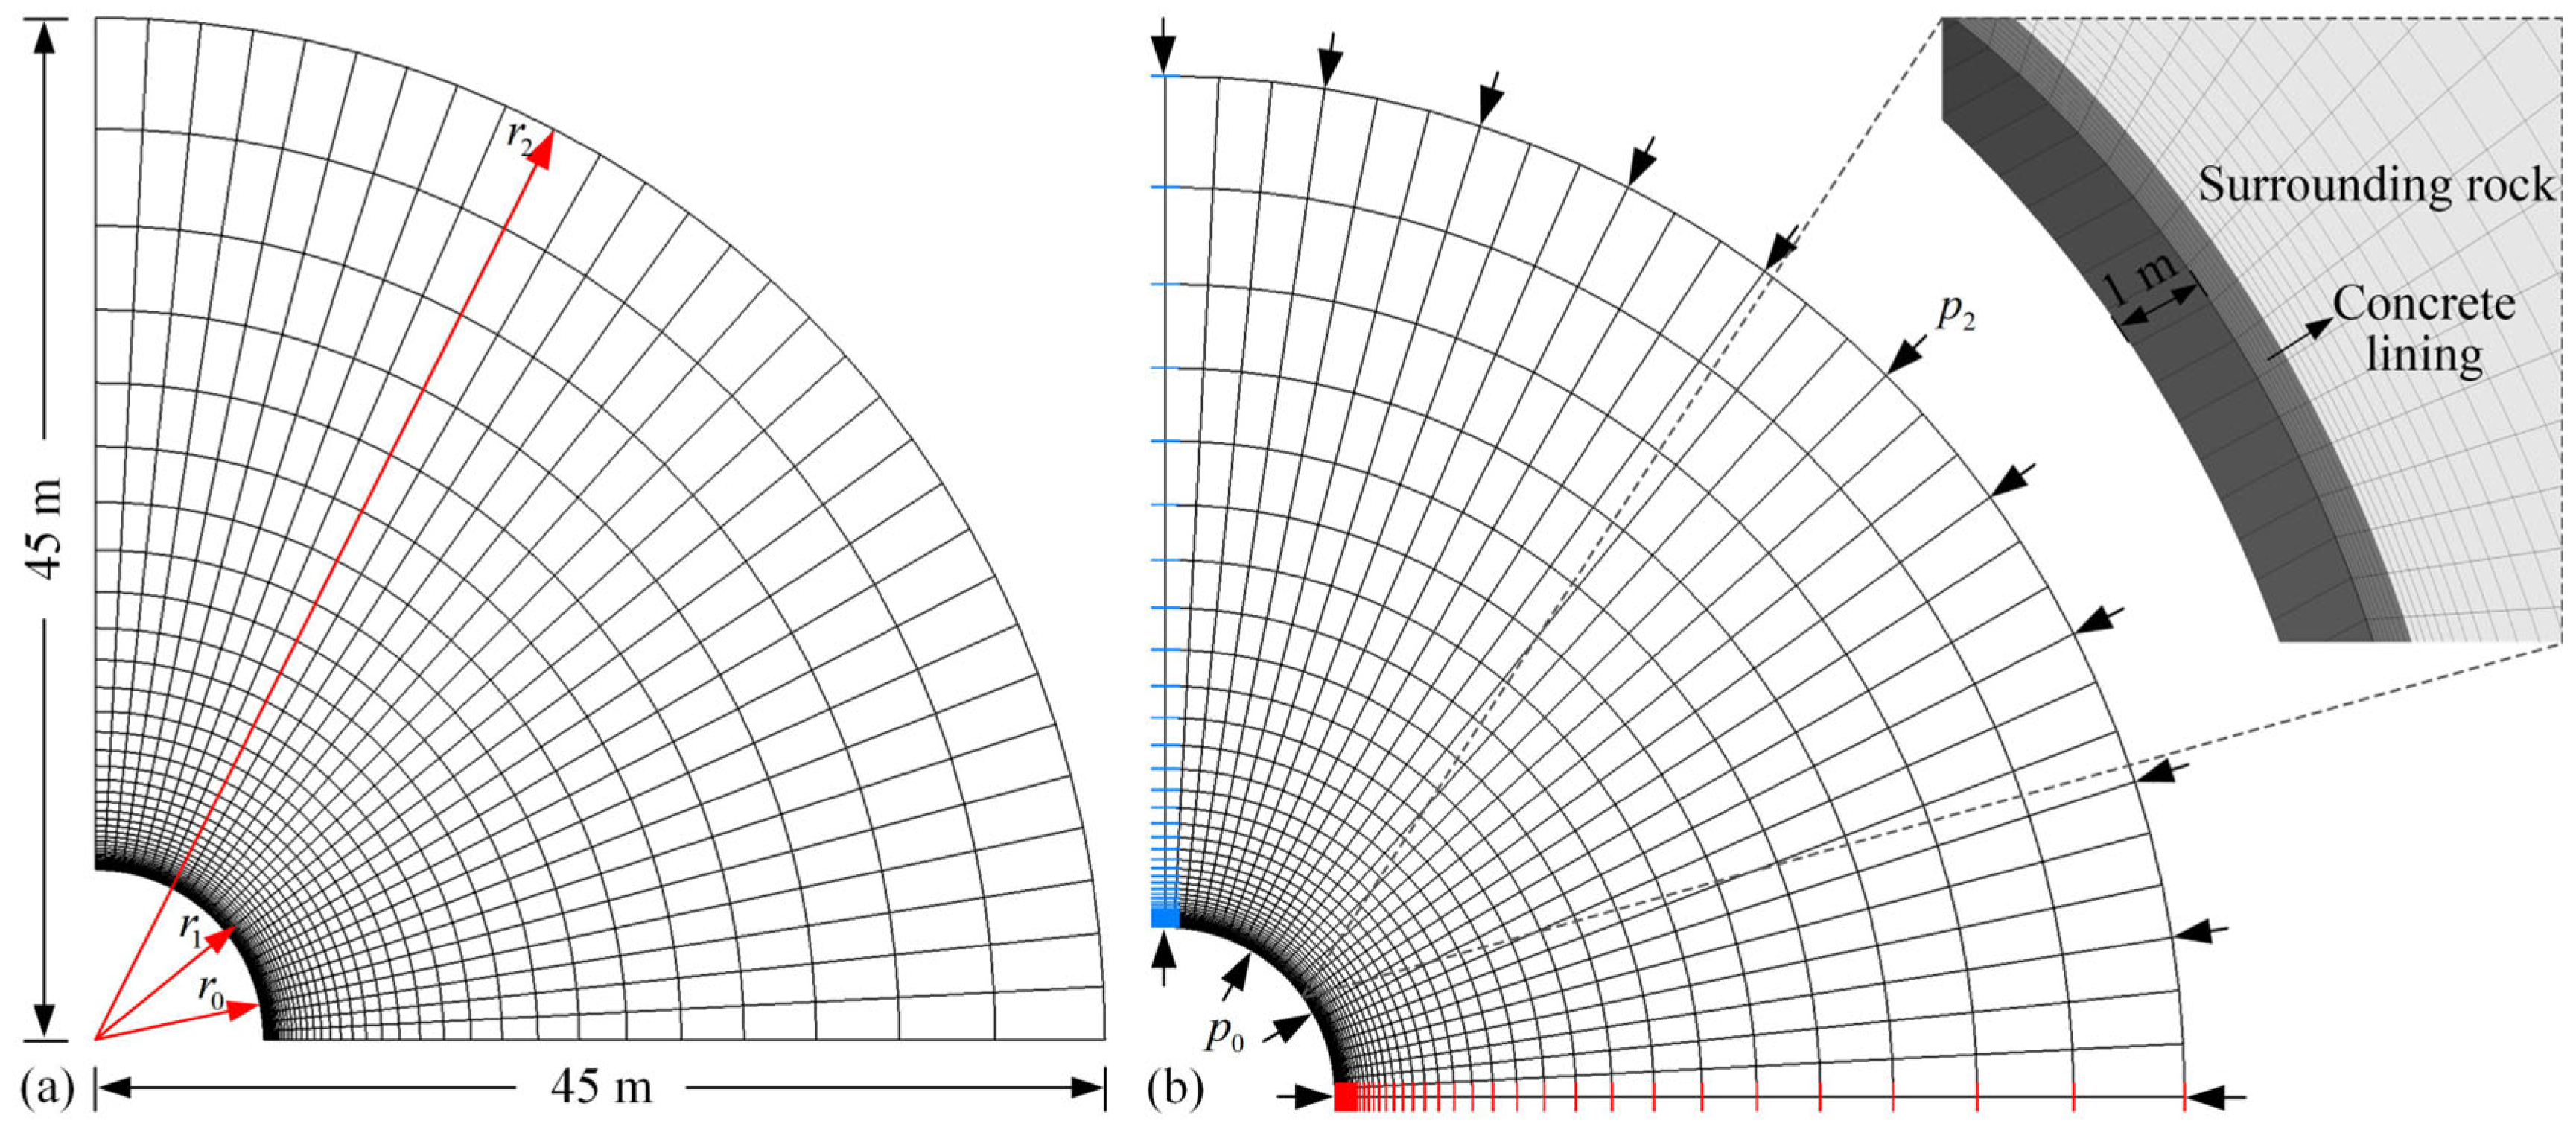
As CAES remains an emerging energy storage technology, there are few field or laboratory tests to assess its performance, and tests related to selecting the type of LRC are even rarer. Therefore, in this paper, the verification process is based on a comparison of the simulated results with the analytical solutions for a simple LRC case. The simple LRC case is given in
Figure 3, where the LRC structures are simplified into two layers: the concrete lining and the surrounding rock mass. These two structures are assumed to be completely in contact and subjected to uniform crustal stress and inner pressure (caused by the compressed air). Moreover, the LRC is regarded as an elastic plane strain problem when assumed to be long enough. Based on the above assumptions, analytical solutions for displacement and stress are as follows:
For a plain strain problem, the elastic modulus and Poisson’s ratio of the materials should be transformed using the following equations:
where
and
are the elastic modulus and Poisson’s ratio of the materials, respectively.
and
are the elastic modulus and Poisson’s ratio in the plane strain problem.
When the underground LRC is considered as a double-layer thick-walled cylinder, the corresponding stress and displacement are given by Equations (11) and (12).
where
is the radius distance;
and
are parameters determined by the boundary conditions; and
,
, and
are the radial stress, hoop stress, and radial displacement, respectively.
There are four unknown parameters in Equations (11) and (12) that can be determined by the boundary conditions of the LRC. There are two boundary conditions at the inner and outer boundaries of the LRC. The radial stress on the inner boundary of the LRC (the inner boundary of the concrete lining) is equal to the internal pressure, and the radial stress on the outer boundary (the outer boundary of the surrounding rock mass) is equal to the crustal stress. There are two other boundary conditions at the interface between the concrete lining and the surrounding rock mass; the radius displacement and stress remain consistent at the interface. Therefore, the four boundary conditions collectively form a system of linear equations (Equation (13)), which can be used to determine the unknown parameters in Equations (11) and (12).
where
,
, and
are the inner and outer radii of the concrete lining and surrounding rock mass, respectively; and
and
are the internal pressure and crustal stress, respectively.
Equations (11)–(13) give analytical solutions for the displacement and stress in the simple LRC case. These analytical solutions can be used to verify the reliability of numerical simulations on the LRC. Numerical simulations are carried out using the FLAC3D 6.0 software. Since the problem is axisymmetric, it is sufficient to analyze only a quarter of the LRC. The numerical simulation model of the simple LRC case is shown in
Figure 4. A three-dimensional model measuring 45 m × 1 m × 45 m is constructed to include the concrete lining and surrounding rock mass. The finer mesh is developed near the structures of the LRC to improve the simulation accuracy. The model is fixed horizontally at the bottom and vertically at the left. The inner and outer boundaries are subjected to inner pressure and crustal stress, respectively. The model is made of 1230 hexahedral elements and 2604 grid points, and an elastic model is assigned to the concrete lining and surrounding rock mass. The relevant parameters for the simple LRC case are listed in
Table 1.
The simulation process is as follows:
1. Apply a stress of 3 MPa at the outer boundary of the model to simulate crustal stress and calculate the displacement field before the operation of the LRC of CAES;
2. Remove the displacement field caused by crustal stress;
3. Apply inner pressure at the inner boundary to calculate the stress and displacement fields during the operation of the LRC for CAES (
Figure 4b).
Figure 5 and
Table 2 show comparisons of the analytical solutions with the simulated results for radial stress, hoop stress, and radial displacement. The numerical simulation results fit well with the analytical solutions, indicating that the numerical simulation method is reliable. In practical engineering, the LRC has a more complex shape as well as a more complex constitutive model for its structures. Therefore, more complicated simulations are needed to reflect the real operational conditions of the LRC. These complex simulations are presented in
Section 3.3 and
Section 3.4 to provide messages for the proposal of scoring systems for the two types of LRCs.
3.2. Numerical Modeling and Simulation Scheme
The reliability of numerical simulation of the mechanical response for a simple LRC case has been validated above. A similar simulation process is conducted in this subsection for more complicated LRC cases. Tunnel- and silo-type LRCs are simulated in this subsection. The corresponding numerical modeling and simulation scheme are given below.
Numerical models for the tunnel-type and silo-type LRCs are shown in
Figure 6 and
Figure 7, respectively. The tunnel-type LRC is longer in the horizontal direction and more closely resembles a tunnel. The tunnel-type LRC is a horizontal cylinder that is 15 m in diameter and 566 m in length (
Figure 6). To account for boundary effects, the domain was extended by six times the radius
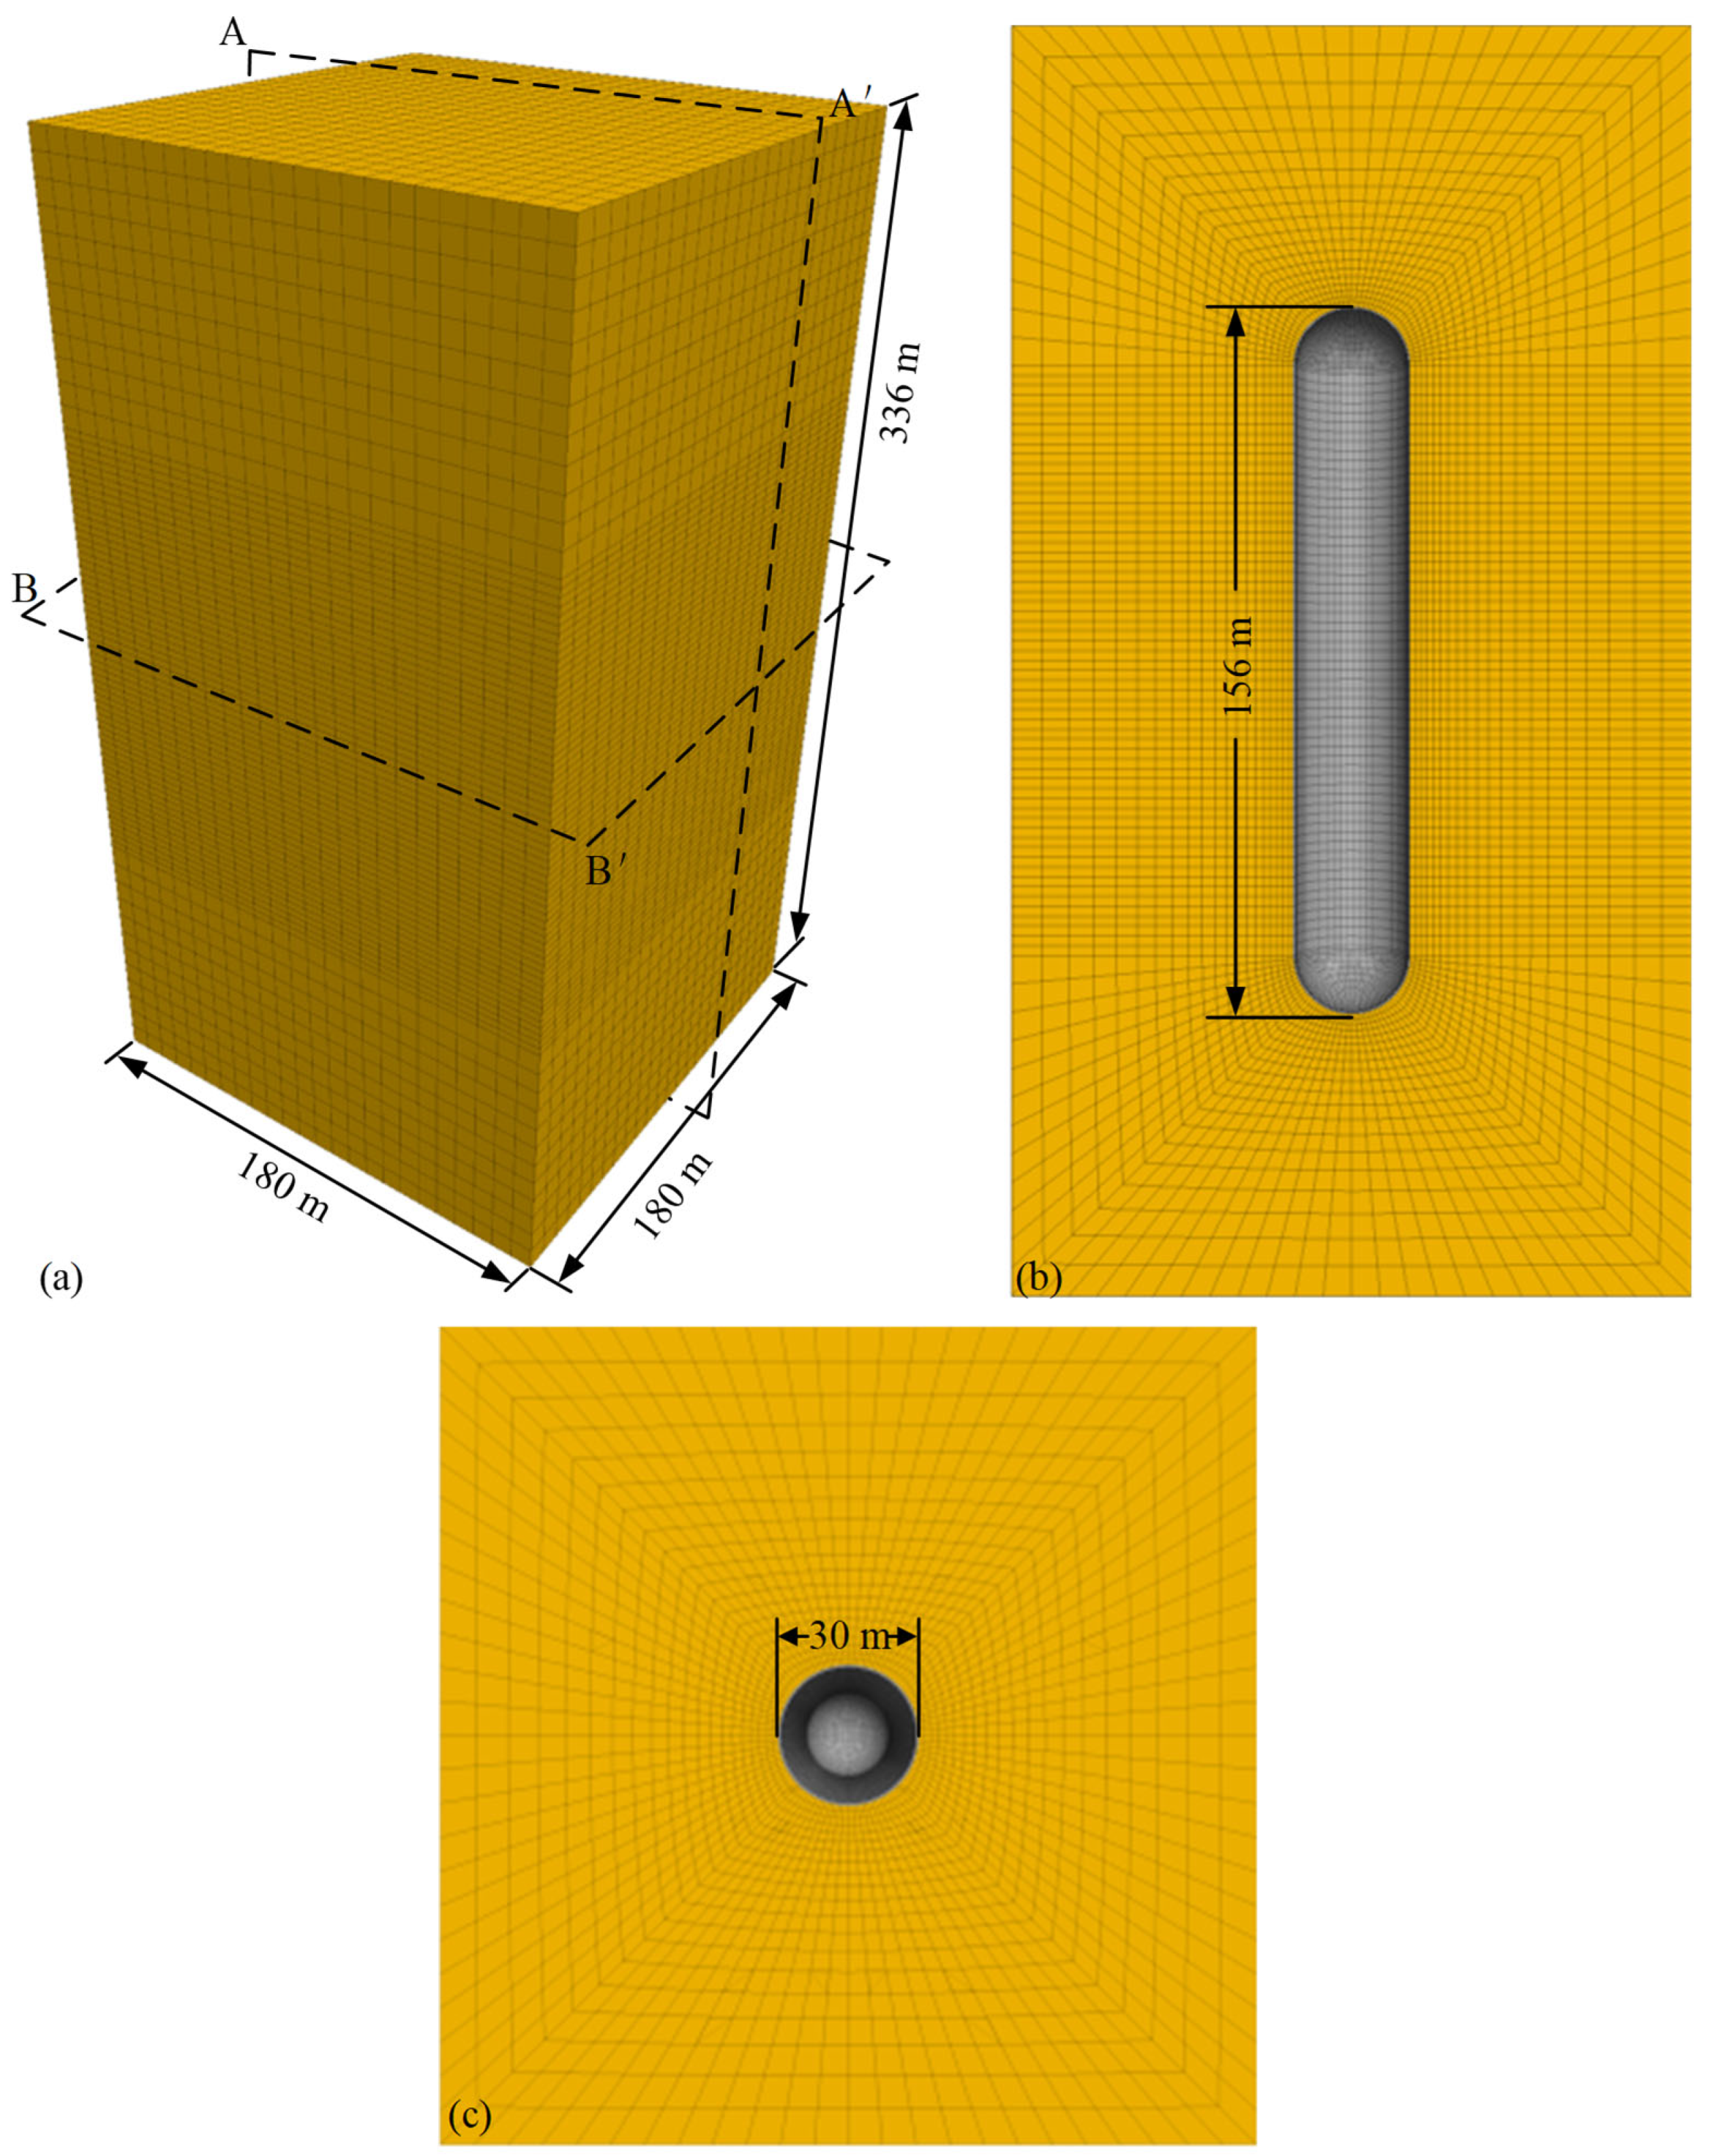
. Therefore, the total size of the tunnel-type LRC is 656 m × 90 m × 90 m. A total of 184,320 elements and 175,203 nodes are used in the tunnel-type LRC. Likewise, the silo-type LRC is 336 m × 180 m × 180 m in size with a vertically distributed cavern (
Figure 7). The cavern is 30 m in diameter and 156 m in height, with a hemispheric top and bottom. A total of 184,320 elements and 175,203 nodes are used in the silo-type LRC. The storage conditions are the same for the two types of LRCs: maximum internal pressure of 16 MPa and a storage volume of 100,000 m
3. Both the tunnel-type and silo-type LRCs feature C40 concrete as the concrete lining, which has an elastic modulus of 32.5 GPa and a Poisson’s ratio of 0.2. The thickness of the concrete lining is 0.5 m.
Despite the model being more complicated, the simulation schemes of the two types of LRCs are similar to those of the simple LRC cases outlined in
Section 3.1. Sensitivity analysis is needed to propose scoring systems for the two types of LRCs. Therefore, six sensitivity parameters are considered in this study: the deformation modulus
, Poisson’s ratio
, cohesion
, the friction angle
, crustal stress
, and the lateral stress coefficient
. The parameters for the sensitivity analysis of the tunnel-type and silo-type LRCs are listed in
Table 3.
Based on the numerical modeling and simulation scheme presented above, the mechanical response of the two types of LRCs can be simulated. The simulated results can be used to propose scoring systems for the tunnel-type LRC and silo-type LRC, which will be presented in
Section 3.3 and
Section 3.4, respectively.
3.3. Scoring Systems for Tunnel-Type LRCs
Scoring systems for tunnel-type LRCs are outlined in this subsection. Three aspects of the mechanical response of the LRC are taken into consideration when proposing the scoring systems: displacement, stress, and state. Therefore, three scoring systems are proposed for the tunnel-type LRC, namely the displacement scoring system, stress scoring system, and state scoring system.
3.3.1. Displacement Scoring System
Six sensitivity parameters are taken into consideration to build the displacement scoring system: the deformation modulus
, Poisson’s ratio
, cohesion
, the friction angle
, crustal stress
, and the lateral stress coefficient
. The maximum displacements occurring in the tunnel-type LRC are recoded when the six sensitivity parameters are varied. Taking the deformation modulus of the surrounding rock mass as an example, the displacement of the tunnel-type LRC under 16 MPa of internal pressure with different surrounding rock moduli is shown in
Figure 8. It can be seen that the displacement of the LRC decreases with increasing deformation modulus of the surrounding rock mass. When the deformation modulus of the surrounding rock is 5 GPa, the maximum displacement of the LRC is 23.30 mm; when the deformation modulus of the surrounding rock increases to 30 GPa, the maximum displacement of the LRC decreases to 6.50 mm. Moreover, the deformation zone of the tunnel-type LRC induced by gas storage is primarily concentrated at the crown and side walls, while the deformation at the bottom is relatively small.
According to Equations (1) and (2), the six sensitivity parameters are normalized, as listed in
Table 4. Based on the simulated results shown in
Figure 8, the relationship between the normalized modulus and maximum displacement is shown in
Figure 9a. A linear trend line with a slope of 15.89 can be obtained from
Figure 9. The slope of the trend line may reflect the sensitivity of the displacement of the LRC to the deformation modulus of the surrounding rock mass.
Similarly, the relationship between the maximum displacement of the tunnel-type LRC and the other five sensitivity parameters is shown in
Figure 9b–f. The slopes of these relationships are 1.37, 0.49, 0.74, 7.49, and 6.39. It can be seen that the Poisson’s ratio, cohesion, and friction angle have little or almost no effect on the displacement of the tunnel-type LRC, while the crustal stress and lateral stress coefficient significantly affect the displacement of the tunnel-type LRC.
According to the slopes shown in Equation (3), the sensitivity of these six parameters to the displacement of the tunnel-type LRC is given by
where
is the sensitivity matrix of displacement of the tunnel-type LRC.
By comparing the values in the sensitivity matrix, the relative importance of the six sensitivity parameters can be determined. A larger slope in the sensitivity matrix indicates greater importance. With the importance compared, the hierarchical matrix of displacement of the tunnel-type LRC in Equation (4) is given by
where
is the hierarchical matrix of displacement of the tunnel-type LRC.
The indexes in the hierarchical matrix indicate the six sensitivity parameters, as listed in
Table 5, and the eigenvalues of the hierarchical matrix are the weight values of the six sensitivity parameters. According to Equation (15), the weight values can be determined as follows:
where
represents the weight values of the six sensitivity parameters related to the displacement of the tunnel-type LRC.
It can be seen from Equation (16) that the sensitivity of the parameters to the displacement of tunnel-type LRCs is ranked, from high to low, as follows: deformation modulus, crustal stress, lateral stress coefficient, Poisson’s ratio, friction angle, and cohesion. With the determined weight values, the score of displacement of the tunnel-type LRC is given by
where
is the score of the tunnel-type LRC from the perspective of displacement. A larger score indicates lower displacement of the tunnel-type LRC.
3.3.2. Stress Scoring System
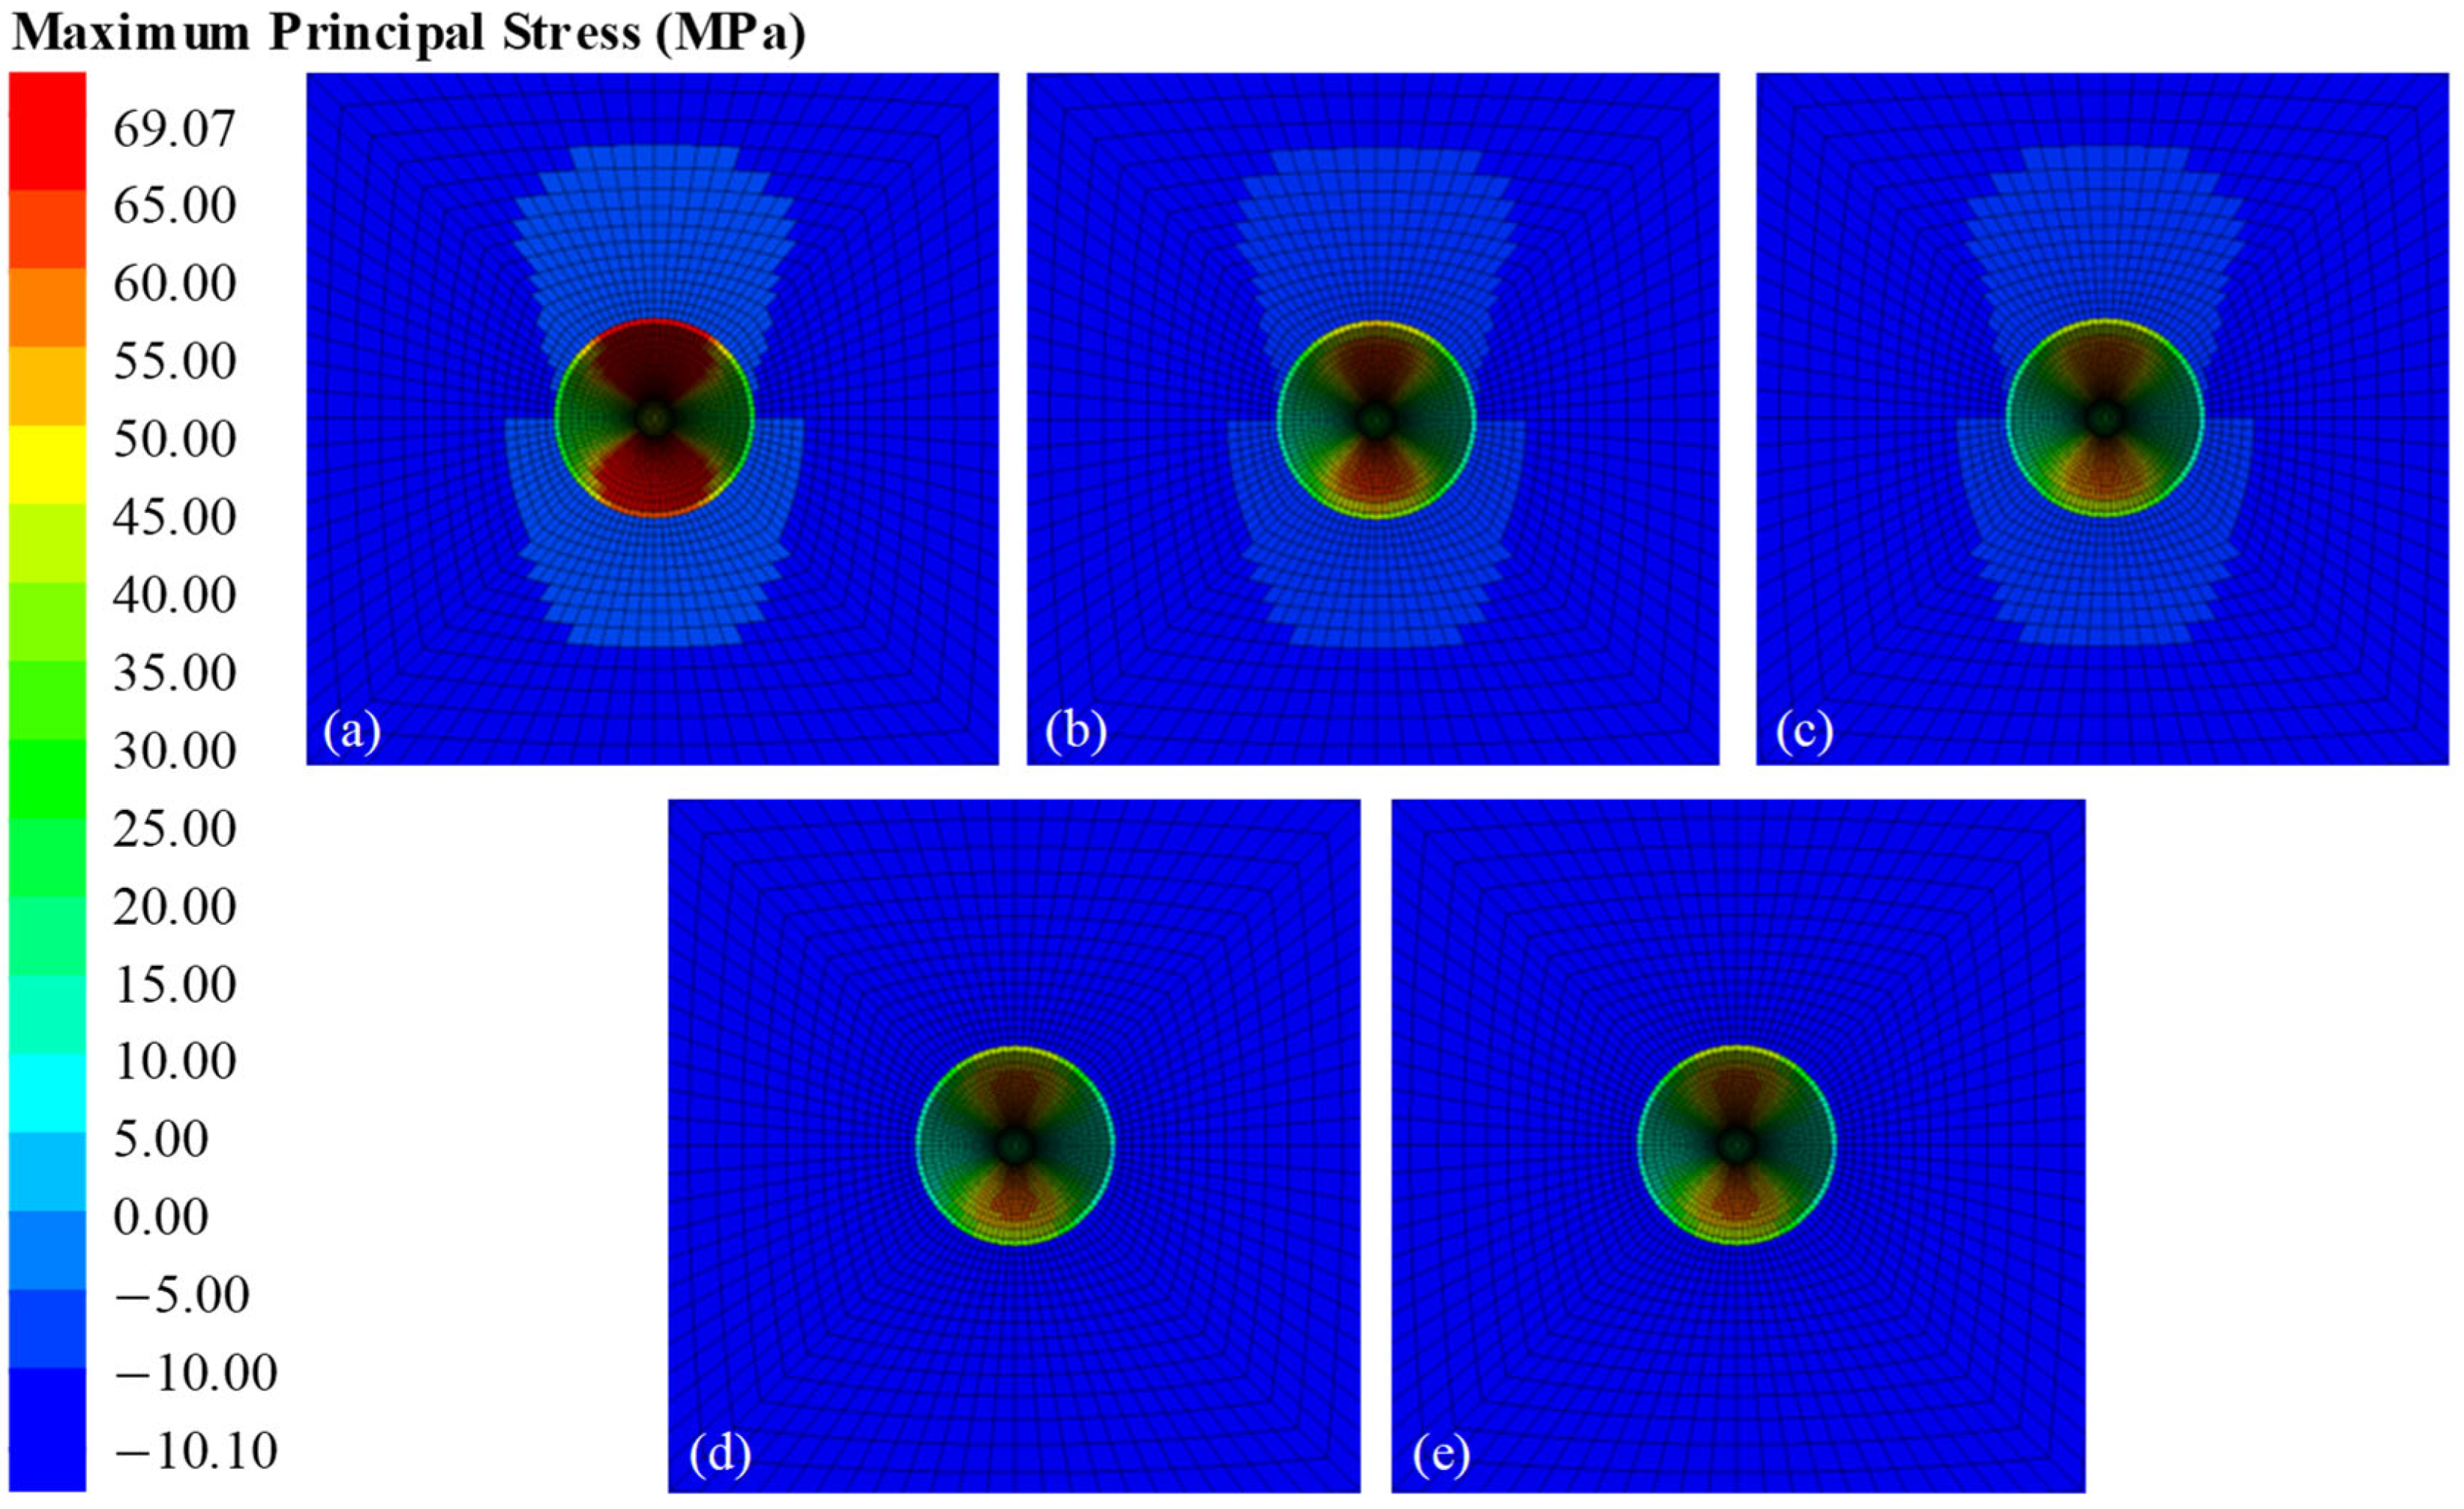
The same six sensitivity parameters are also taken into consideration to build the stress scoring system. The stress state of the tunnel-type LRC is recorded during the simulation process when the six sensitivity parameters are changed. Taking the crustal stress as an example, the maximum principal stresses of the tunnel-type LRC under 16 MPa of internal pressure with different crustal stresses are shown in
Figure 10. It can be seen that the maximum principal stress of the LRC decreases with increasing crustal stress. When the crustal stress is 2 MPa, the maximum principal stress of the LRC is 69.07 MPa; when the crustal stress increases to 10 MPa, the maximum principal stress of the LRC decreases to 23.15 MPa. The decreased tendency toward maximum principal stress indicates that a larger crustal stress is good for the construction of the tunnel-type LRC.
Notably, the maximum principal stress is a positive value, which indicates that the LRC is in a hoop tension state when the air is compressed; in particular, the concrete lining is subjected to high tensile stress, mostly larger than the tension strength of the concrete lining. Due to the high tensile stress, cracks may develop in the concrete lining during storage of the highly compressed air. Moreover, the maximum principal stress decreases sharply with the increase in radial distance. This indicates that only the vicinity of the LRC, within about one times the radius, is severely influenced by the compressed air. This severely influenced area may need to be strengthened when designing tunnel-type LRCs.
Using Equations (1) and (2), the six sensitivity parameters were normalized. Based on the analysis in
Section 3.3.1 and the simulated results shown in
Figure 10, the relationship between the normalized modulus and maximum principal stress can be obtained. The slope of this relationship is 42.62, and the slope of the trend line can reflect the sensitivity of the maximum principal stress of the LRC to crustal stress.
Similarly, the slopes of the relationship between the maximum principal stress of the tunnel-type LRC and the other five sensitivity parameters are 34.89, 6.69, 0.79, 1.49, and 38.92. It can be seen that the Poisson’s ratio, cohesion, and friction angle have little or no effect on the maximum principal stress of the tunnel-type LRC, while the deformation modulus and lateral stress coefficient significantly affect the maximum principal stress of the tunnel-type LRC.
According to the slopes mentioned above, the sensitivity of these six parameters to the stress of tunnel-type LRC is given by
where
is the sensitivity matrix of stress of the tunnel-type LRC.
By comparing the values in the sensitivity matrix, the relative importance of the six sensitivity parameters can be determined. A larger slope in the sensitivity matrix indicates greater importance. According to the analysis in
Section 3.3.1, we can also obtain the stress level matrix of the tunnel-type LRC.
The indexes in the hierarchical matrix indicate the six sensitivity parameters, as listed in
Table 5. The eigenvalues of the hierarchical matrix are the weight values of the six sensitivity parameters. According to the stress level matrix of tunnel-type LRC, the weight value can be determined as follows:
where
represents the weight values of the six sensitivity parameters to the stress of the tunnel-type LRC.
It can be seen from Equation (19) that the sensitivity of parameters to stress in the tunnel-type LRC, from high to low, ranks as follows: crustal stress, lateral stress coefficient, deformation modulus, Poisson’s ratio, friction angle, and cohesion. With the determined weight values, the stress score of the tunnel-type LRC is given by
where
is the stress score of the tunnel-type LRC. A larger score indicates smaller stress on the tunnel-type LRC.
3.3.3. State Scoring System
Displacement and stress scoring systems were built based on six sensitivity parameters. The same approach was used to build the state scoring system. The state of the tunnel-type LRC is recorded during the simulation process when the six sensitivity parameters are changed. Taking the lateral stress coefficient as an example, the elastoplastic states of the tunnel-type LRC under 16 MPa of internal pressure with different lateral stress coefficients are shown in
Figure 11. It can be seen that the volume of plastic zones decreases with an increase in the lateral stress coefficient. When the lateral stress coefficient is 0.33, the maximum yield range of the LRC is about three times the diameter of the LRC, and the volume of state is much larger than that of the LRC; when the lateral stress coefficient is increased to 0.67, the yield state of the LRC is greatly improved, and the plastic zones are only found near the perimeter of the LRC; and when the lateral stress coefficient is increased to 1.67, the state is almost nonexistent in the LRC. Therefore, a larger lateral stress coefficient may improve the stress state of the tunnel-type LRC. At the same time, the plastic zones are vertically distributed when the lateral stress coefficient is smaller than a unit; otherwise, it is horizontally distributed.
According to Equations (1) and (2), the six sensitivity parameters are normalized. Based on the analysis in
Section 3.3.1. and the simulated results shown in
Figure 11, the relationship between the normalized modulus and the plastic volume ratio (the ratio of the volume of the plastic zones to the volume of the LRC, Equation (21)) can be obtained. The slope of this relationship is 2.2860, and the slope of the trend line can reflect the sensitivity of the plastic volume ratio of the LRC to the lateral stress coefficient.
The plastic volume ratio is given by Equation (21):
where
is the plastic volume ratio;
is the volume of the plastic zones; and
is the volume of the LRC.
The plastic volume ratio determined by Equation (21) can be regarded as a quantitative description of the state of the LRC. A larger plastic volume ratio indicates that more of the LRC structure is yielded during storage of the highly compressed air. Similarly, the slopes of the relationships between the plastic volume ratio of the tunnel-type LRC and five other sensitivity parameters are 0.0210, 0.0190, 0.0320, 0.0740, and 2.4680. It can be seen that the deformation modulus, Poisson’s ratio, cohesion, and friction angle have little or almost no effect on the plastic volume ratio of the tunnel-type LRC, while the crustal stress variation has a significant effect on the plastic volume ratio in the tunnel-type LRC.
According to the slopes mentioned above, the sensitivity of these six parameters to the plastic volume ratio of the tunnel-type LRC is given by
where
is the sensitivity matrix of the state of the tunnel-type LRC.
By comparing the values in the sensitivity matrix, the relative importance of the six sensitivity parameters can be determined. A larger slope in the sensitivity matrix indicates greater importance. According to the analysis in 3.3.1, we can also obtain the state of the tunnel-type LRC.
The indexes in the hierarchical matrix indicate the six sensitivity parameters, as listed in
Table 5. The eigenvalues of the hierarchical matrix are the weight values of the six sensitivity parameters. According to the state of the tunnel-type LRC, the weight values can be determined as follows:
where
represents the weight values of the six sensitivity parameters to the state of the tunnel-type LRC.
It can be seen from Equation (23) that the sensitivity of the parameters to the state of the tunnel-type LRC ranks, from high to low, as follows: crustal stress, lateral stress coefficient, friction angle, cohesion, deformation modulus, and Poisson’s ratio. With the determined weight values, the score of the state of the tunnel-type LRC is given by
where
is the score of the tunnel-type LRC from the perspective of the state. A larger score indicates a smaller state of the tunnel-type LRC.
Table 6 summarizes the weight values for the tunnel-type LRC from the perspective of displacement, stress, and state. These weight values can be used to give a quantitative estimation of the suitability of the tunnel-type LRC, acquired using Equations (17), (20) and (24). A larger score indicates that it is more appropriate to build a tunnel-type LRC under the given geological conditions.
3.4. Scoring Systems for the Silo-Type LRC
Different from the tunnel-type LRC, the silo-type LRC is usually larger in diameter and vertically located in the rock. Scoring systems for the silo-type LRC are needed to compare which type of LRC is better for a given geological condition. Similar to the tunnel-type LRC, there are three scoring systems for the silo-type LRC, named the displacement scoring system, stress scoring system, and state scoring system, respectively.
According to Equations (1) and (2), the six sensitivity parameters are normalized, as listed in
Table 7. Based on the simulated results in FLAC3D 6.0, the relationship between the normalized modulus and the six sensitivity parameters can be obtained. The slope of the trend line can reflect the sensitivity of the displacement, stress, and state of the LRC to the deformation modulus of the surrounding rock mass.
The sensitivity of these six parameters to displacement, stress, and state of the silo-type LRC can be obtained based on the slopes of the trend mentioned above. By comparing the values in the sensitivity matrix, the relative importance of the six sensitivity parameters can be determined. A larger slope in the sensitivity matrix indicates greater importance.
In addition, we can also obtain the hierarchical matrix of displacement, stress, and state of the silo-type LRC. The indexes in the hierarchical matrix indicate the six sensitivity parameters, as listed in
Table 5. The eigenvalues of the hierarchical matrix are the weight values of the six sensitivity parameters. The weight values can be determined according to the hierarchical matrix of the silo-type LRC. With the determined weight values, the score of displacement, stress, and state of the silo-type LRC can be obtained.
Table 8 summarizes the weight values for the silo-type LRC from the perspective of displacement, stress, and state. These weight values can be used to give a quantitative estimation of the suitability of the silo-type LRC. A larger score indicates that it is more appropriate to build the silo-type LRC under the given geological conditions.
4. Application of Scoring Systems
Scoring systems for two types of LRCs have been proposed in
Section 3. These scoring systems can be used for quantitative evaluation of tunnel- and silo-type LRCs from the perspective of displacement, stress, and state. The scores are a linear combination of weight values and normalized sensitivity parameters. A detailed example of the application of these scoring systems is given below. The geological conditions of an example LRC are listed in
Table 9.
(1) Scores for tunnel-type LRCs
The parameters listed in
Table 9 can be normalized using Equation (1) or Equation (2). Together with the weight values listed in
Table 6, the scores for the tunnel-type LRC can be given from the displacement, stress, and state perspectives:
(2) Scores for silo-type LRCs
Similar to the scores of the tunnel-type LRC, the scores of the silo-type LRC can also be determined. The parameters listed in
Table 9 can be normalized using Equation (1) or Equation (2). Together with the weight values listed in
Table 8, the scores for the silo-type LRC can be given from the displacement, stress, and state perspectives:
Based on the scores of the two types of LRCs, it can be seen that from the perspectives of the displacement, stress, and state of the LRCs, the scores are 32.31, 31.51, and 31.33 for the tunnel-type LRC and 38.15, 36.50, and 35.70 for the silo-type LRC. Though the scores of the silo-type LRC are higher than those of the tunnel-type LRC, the scores for both types of LRCs are relatively low. Therefore, it can be concluded that neither the tunnel-type LRC nor the silo-type LRC is suitable to be built under the given geological conditions.
As illustrated in the example above, this method is convenient for quantitatively estimating the suitability of tunnel- and silo-type LRCs. Another 14 examples are listed in
Table 10 to further illustrate the application of the scoring systems. The estimated results of the 15 examples are intuitively shown in
Figure 12.
Taking CAES4 as an example, the scores are 62.79, 54.46, and 36.77 for the tunnel-type LRC and 38.55, 40.09, and 30.95 for the silo-type LRC. The scores of the tunnel-type LRC are much higher than those of the silo-type LRC. Therefore, it is more suitable to build a tunnel-type LRC for CAES4. Likewise, it is more suitable to build a silo-type LRC for CAES6. With the proposed scoring systems, it is convenient to give a quantitative estimation of an appropriate LRC for CAES. The estimation results are as follows: CAES3, CAES4, CAES7, CAES8, and CAES13 are more appropriate for the tunnel-type LRC, and CAES5, CAES6, CAES9, CAES10, CAES14, and CAES15 are more appropriate for the silo-type LRC. However, the scores of CAES1, CAES2, CAES11, and CAES12 are lower than 40, which may indicate that neither the tunnel-type LRC nor the silo-type LRC is suitable to be built under the given geological conditions. Considering
Table 6 and
Table 8, it can be concluded that the crustal stress is the most sensitive parameter for the tunnel-type LRC, and the lateral stress coefficient is the most sensitive parameter for the silo-type LRC. In other words, it is more suitable to build a tunnel-type LRC under high crustal stress and a silo-type LRC under a high lateral stress coefficient. Moreover, based on the scores of CAES7, CAES8, CAES10, and CAES15, it can be seen that a site with good rock mass quality and high crustal stress is suitable for both types of LRCs.
In this paper, the relationship between normalized sensitivity parameters and mechanical responses (displacement, stress, and state) is established using a linear fitting method, providing a simplified and practical framework for preliminary sensitivity analysis. The slope of the linear fitting curve is then used to determine sensitivity and hierarchical matrices in the scoring systems for type selection of LRCs. While linear regression offers computational efficiency and interpretability, it inherently assumes monotonic and proportional relationships between mechanical responses and sensitivity parameters, which may lead to deviations in the estimation results. For example, as shown in
Figure 13, the relationships between the displacement and the normalized deformation modulus of tunnel-type LRCs are nonlinear. Ignoring the nonlinear characteristics may lead to overestimation or underestimation of parameter sensitivity. It can be seen from
Figure 13 that the linear slope underestimates the sensitivity of the parameters at points A and B, overestimates at points D, E, and F, and provides accurate estimates at point C.
Subsequent research will introduce piecewise linear regression to describe the nonlinear relationships. As shown in
Figure 13, a three-segment piecewise linear regression is applied, which may achieve higher accuracy in estimating the sensitivity to the normalized deformation modulus. The sensitivity matrices and hierarchical matrices should also be segmented due to the piecewise linear regression of slopes, which will complicate the estimation method. Despite the above limitations, the current linear-based scoring system provides an approximate and convenient approach for the type selection of LRCs.
5. Conclusions
A quantitative estimation method for selecting the type of underground LRC in CAES systems is proposed in this paper. Based on numerical simulation of the mechanical response of the LRC, the AHP method is used to propose scoring systems for tunnel- and silo-type LRCs. The obtained scores can be used for quantitative estimation of the appropriate underground LRC, where it is more appropriate to build the type of LRC with the highest score under the given geological conditions. The main conclusions are as follows:
(1) Due to the fact that the scoring systems are based on numerical simulations rather than subjective methods such as expert ratings, the proposed method can provide quick and objective estimations of the appropriate type of underground LRC for CAES.
(2) According to the weight values of tunnel- and silo-type LRCs, the sensitivity of the parameters for tunnel-type caverns, from high to low, is as follows: crustal stress, lateral pressure coefficient, deformation modulus, friction angle, cohesion, and Poisson’s ratio. For the silo-type LRC, the sensitivity of the parameters from highest to lowest is as follows: lateral pressure coefficient, crustal stress, deformation modulus, friction angle, Poisson’s ratio, and cohesion.
(3) Based on the scoring systems, it can be seen that sites with good rock mass quality and high crustal stress are suitable for both types of LRCs.
Based on numerical simulation and the AHP method, this study presents a quantitative estimation method for the selection of underground LRC types for CAES. However, the thermal effects induced by operational temperature fluctuations and geothermal gradients on LRCs have not been considered. Therefore, it is necessary to integrate thermo-mechanical coupling models with field tests in future studies to further refine the scoring systems for the two types of LRCs, thereby enhancing their practical engineering applicability under realistic thermodynamic conditions.


