

Characterising Non-Intentional Supraharmonic Emissions from Inverters in Power Grids: Review and Challenges


Abstract
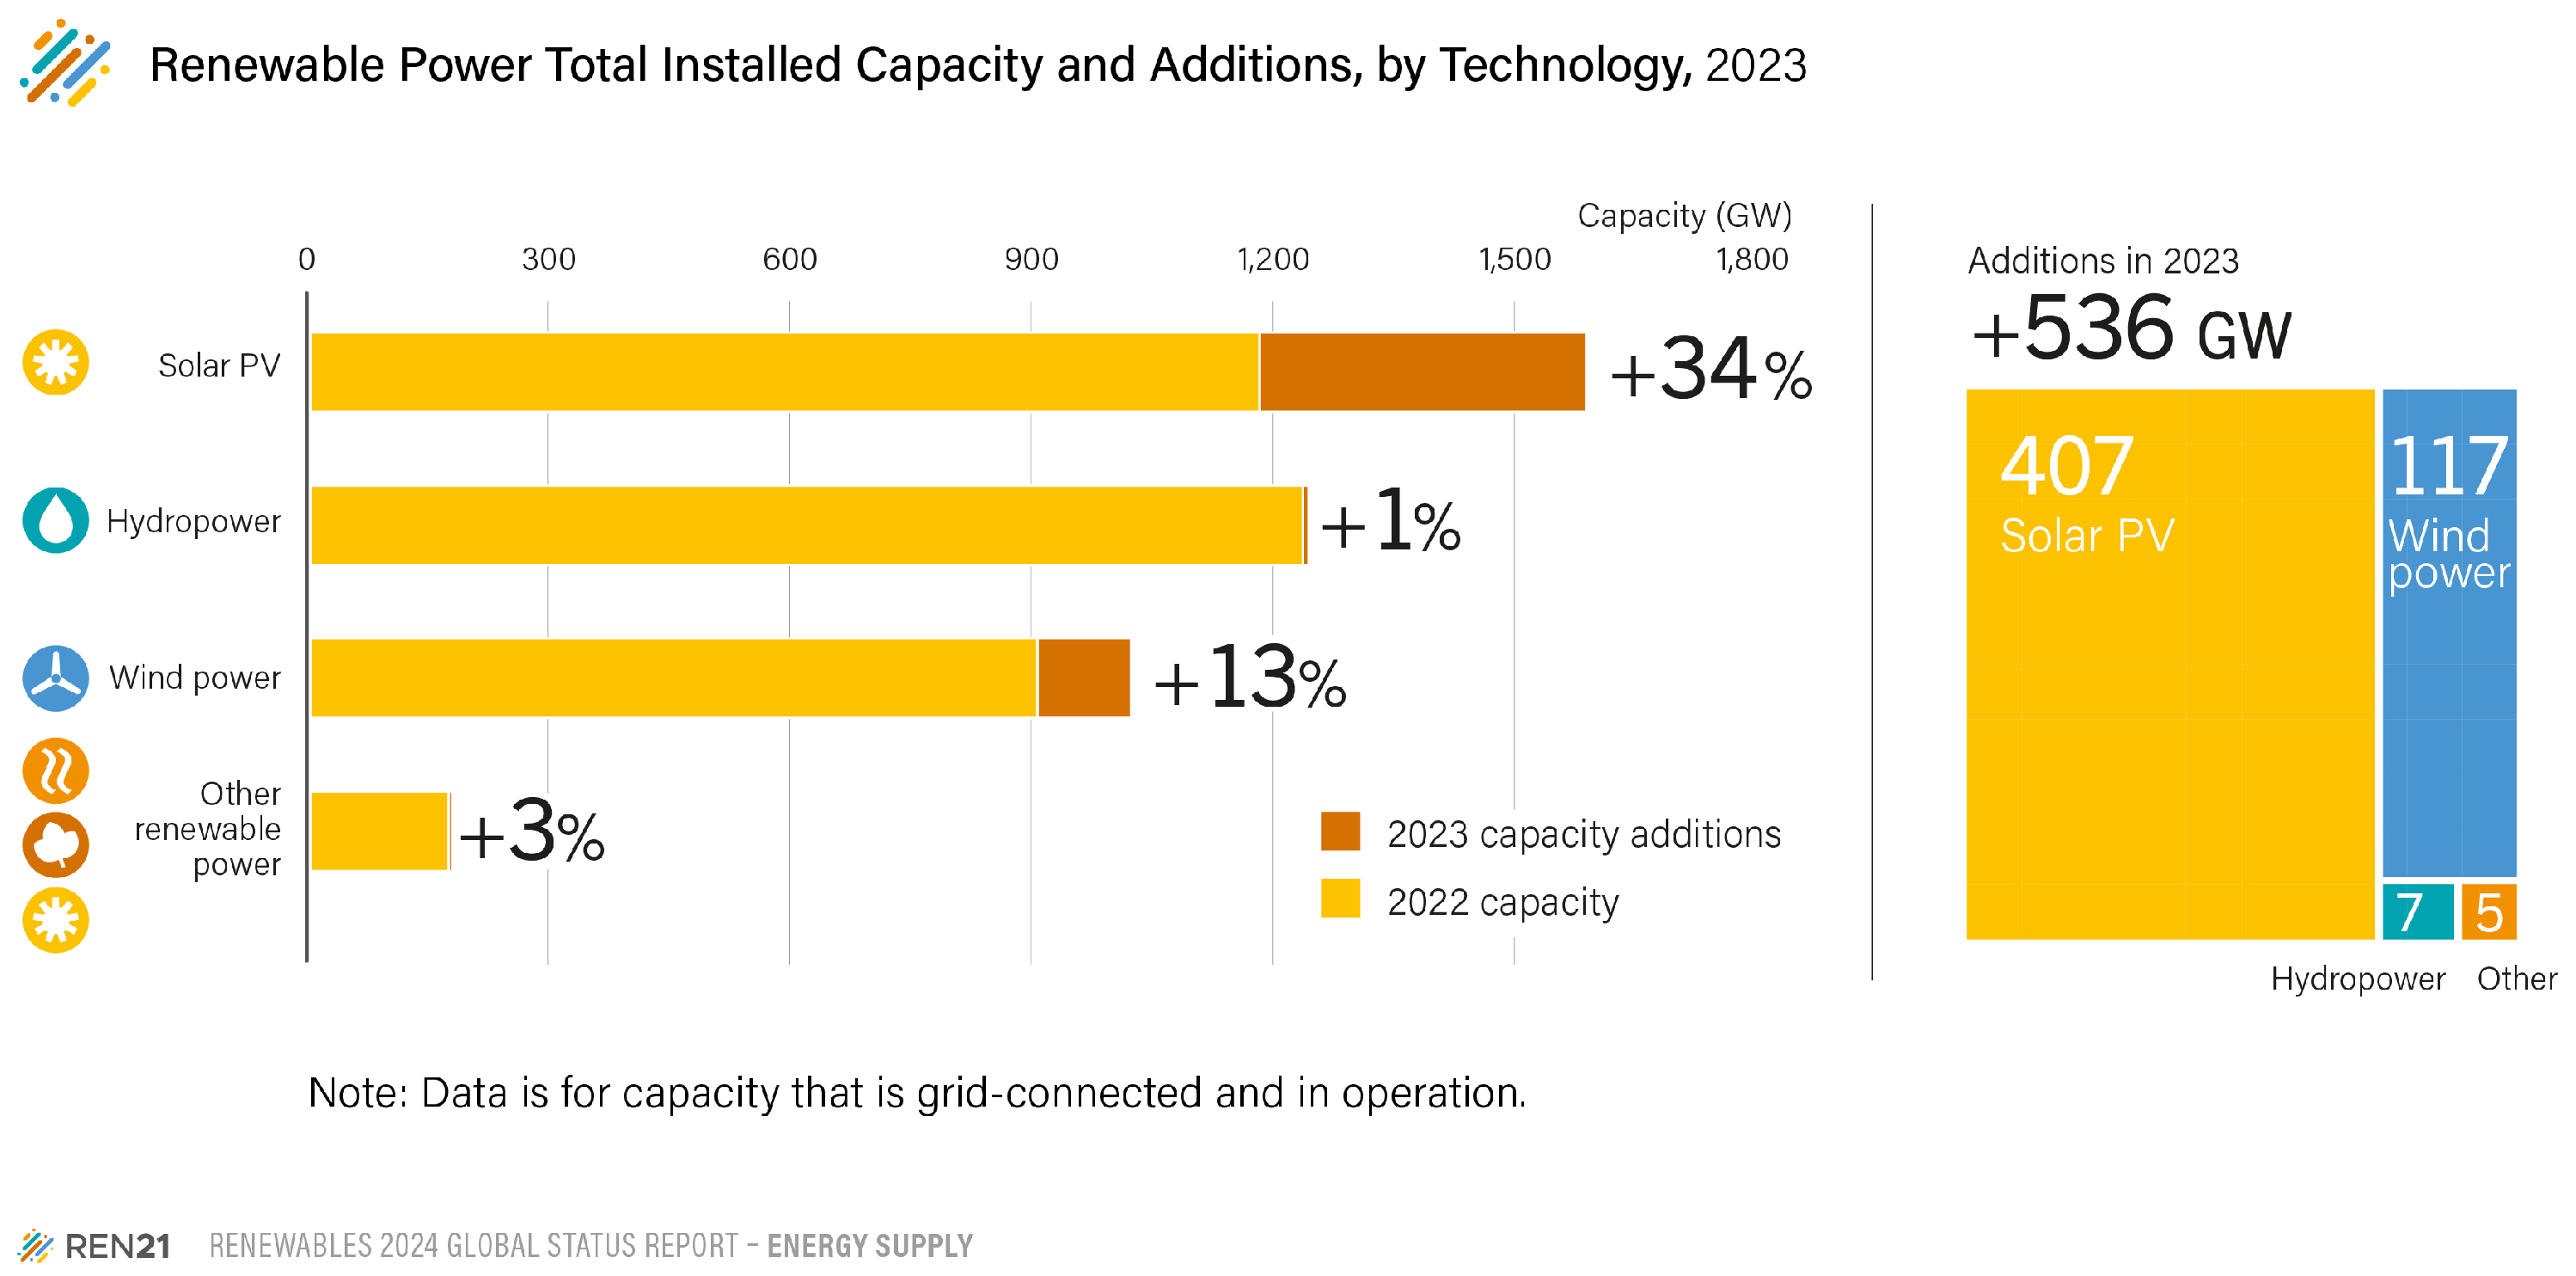
1. Introduction
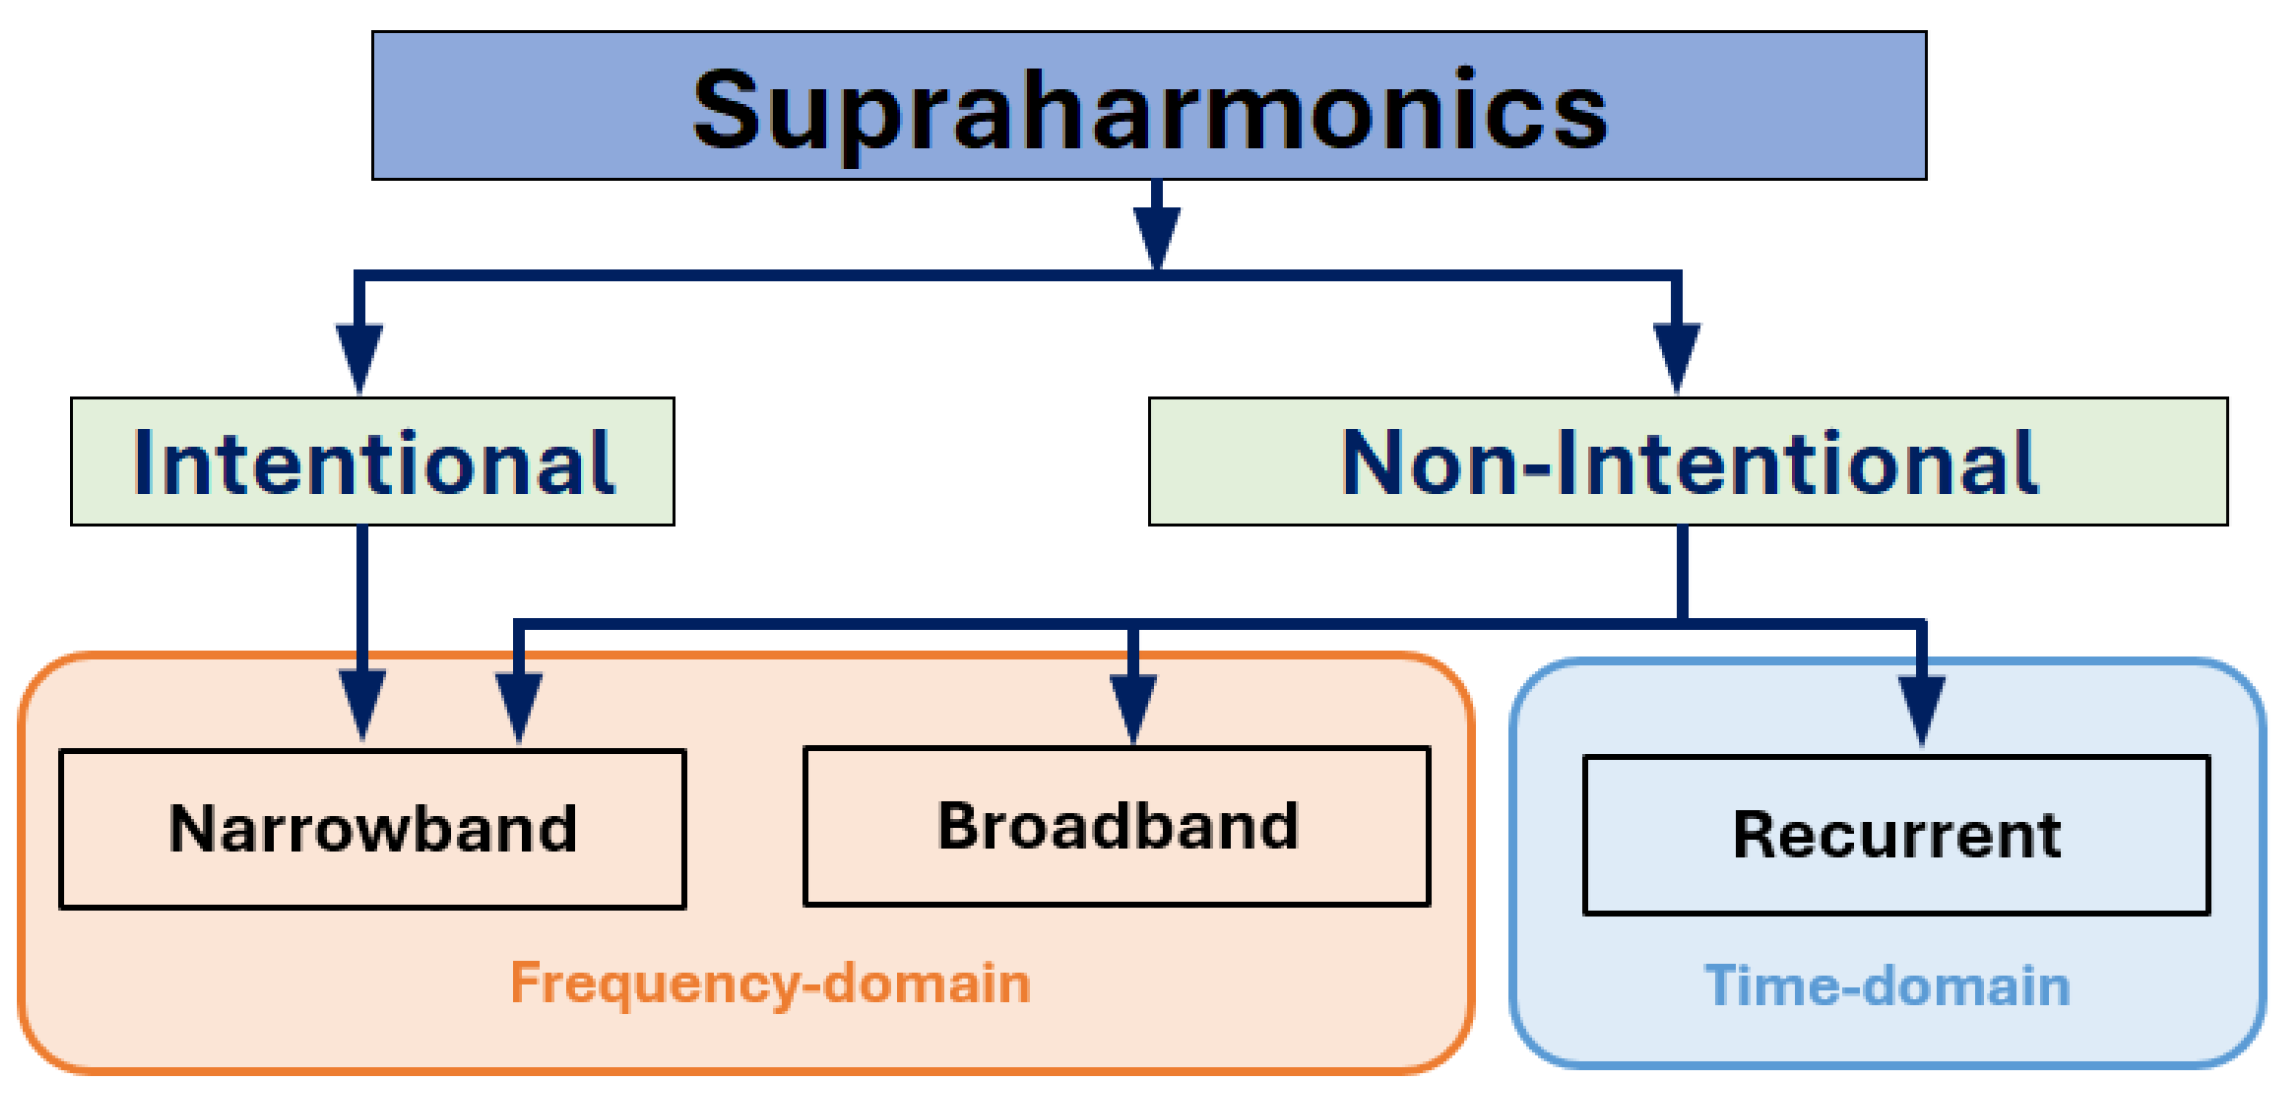
- Narrowband signals: identified as individual frequencies in the frequency domain, mainly due to PLC.
- Broadband signals: identified as a spectrum of adjacent frequency components in the frequency domain, mainly due to individual end-user equipment with active power-factor correction (APFC).
- Recurrent oscillations: typically identified in every 10 ms in the time domain, mainly due to PE converters around the current zero-crossing.
2. Emissions
- Industrial size converters (9–150 kHz)
- Street lamps (up to 20 kHz)
- EV chargers (15–100 kHz)
- PV inverters (4–20 kHz)
- Household devices (2–150 kHz)
- PLC (9–95 kHz)
2.1. Switching Frequency Emissions
2.2. Challenges
- Understanding other types of emission phenomena associated with PE converters in addition to switching frequency emissions.
- Generalisation of supraharmonic characteristics for similar types of devices, different types of devices, and interactions between neighbouring PE converters.
- Is it acceptable/sufficiently accurate to focus only on primary emissions (disregarding secondary emissions) for high-frequency emissions studies? If so, is it valid for the full range (2–150 kHz) or any specific frequency range depending on the emission characteristics?
- Development of systematic knowledge on diversity between the emission spectra from individual devices, diversity in the time of use of equipment, and cancellation of emission in the complex plane.
3. Propagation and Attenuation
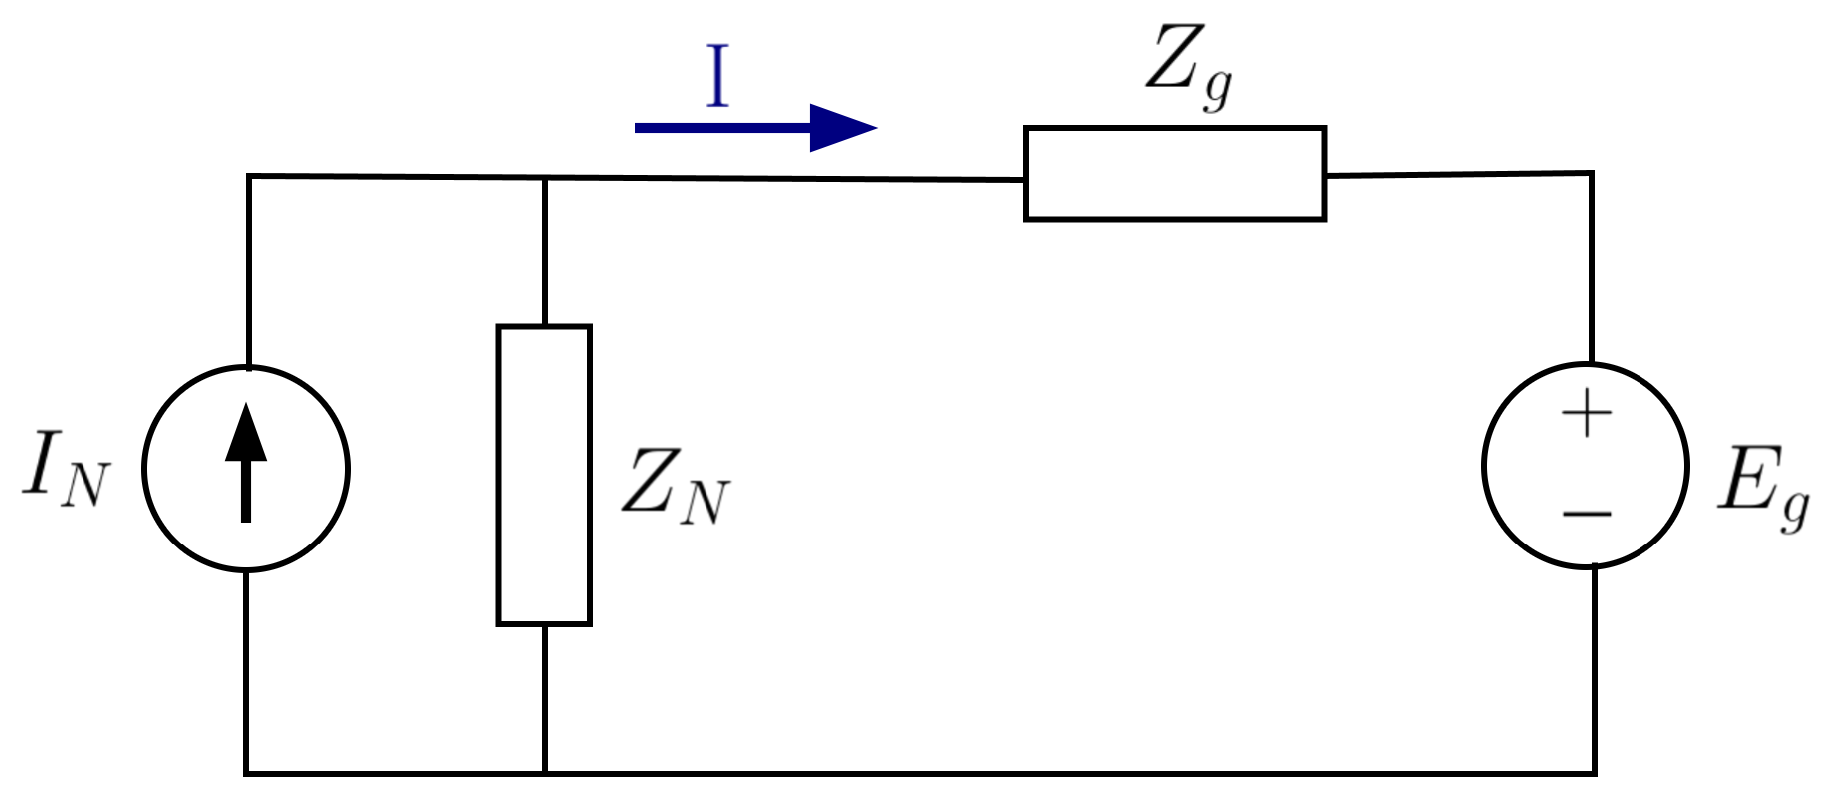
3.1. Primary and Secondary Emission
- I represents the total supraharmonic emission.
- and represent the Norton equivalent of internal emission and impedance, respectively.
- and represent the Thevenin equivalent of background voltage and grid impedance, respectively.
3.2. Propagation Between Devices Within Installation
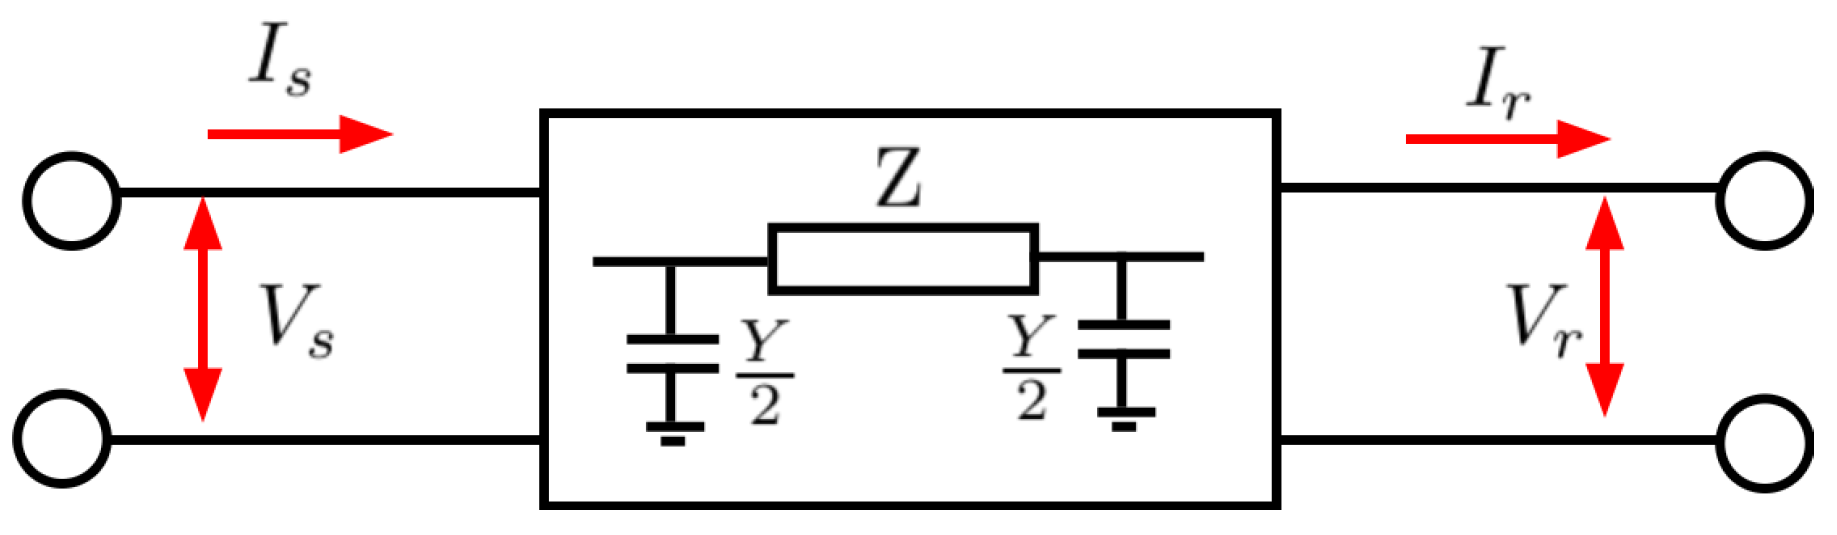
3.3. Propagation in an LV Network
- and represent sending end voltage and current, respectively.
- and represent receiving end voltage and current, respectively.
- Z and Y represent impedance and admittance, respectively.
| A | = |
| B | = Z |
| C | = |
| D | = |
3.4. Challenges
- How can the difference between primary and secondary emissions be distinguished in high-frequency emission studies?
- What is the explanation for two different harmonic spectra observed in the current measurement at the terminal of an individual device and the summated current? Is it due to emission characteristics or a low impedance path created by the front-end filters of devices? Is this identified throughout the complete high-frequency range (2–150 kHz)?
- The accuracy of the two-port network model needs to be assessed in a more simplified way by measuring supraharmonic emissions at both ends of a radial cable.
- Accurate measurement of supraharmonic emissions in MV/HV networks to quantify the propagation where direct measurement options are unavailable.
4. Measurement/ Summation Techniques
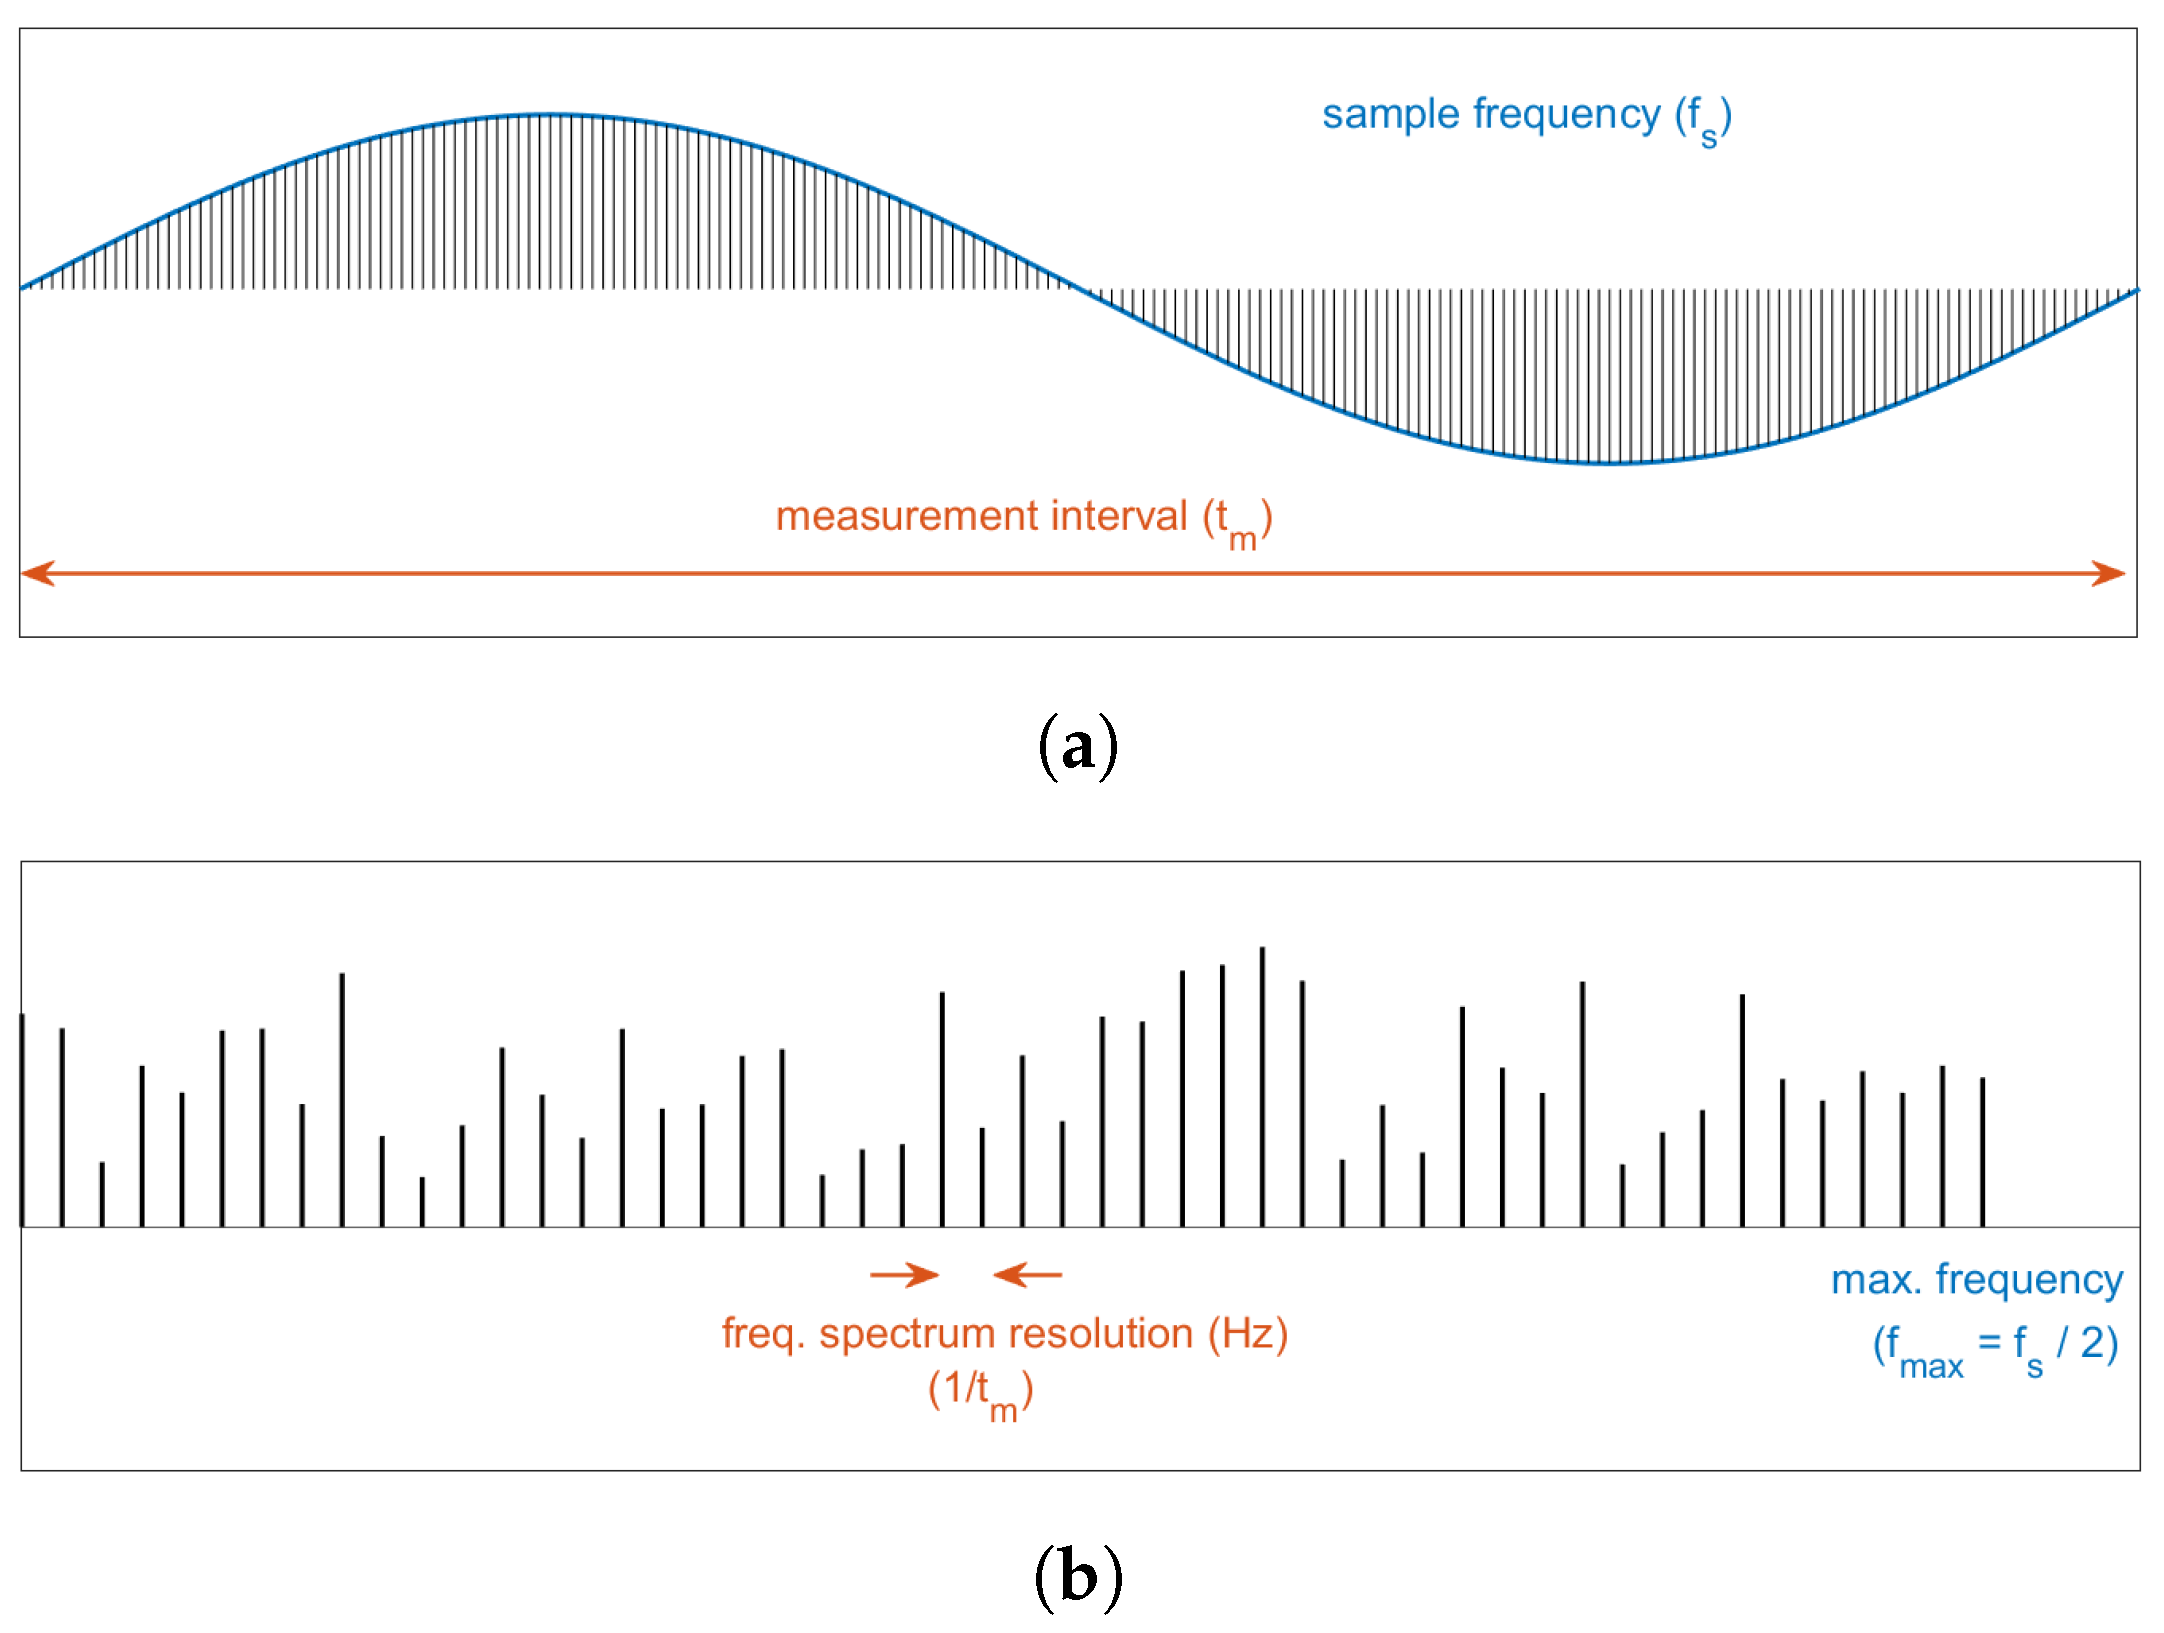
4.1. IEC 61000-4-7
4.2. IEC 61000-4-30
4.3. CISPR 16
- 1.
- Laboratory setting: the methodology is primarily intended for use in a controlled laboratory environment for assessing emissions from individual EUT.
- 2.
- Spectrum analyser: the methodology involves the use of a spectrum analyser equipped with a tuneable filter and detector to scan the frequency range sequentially over long measurement times.
- 3.
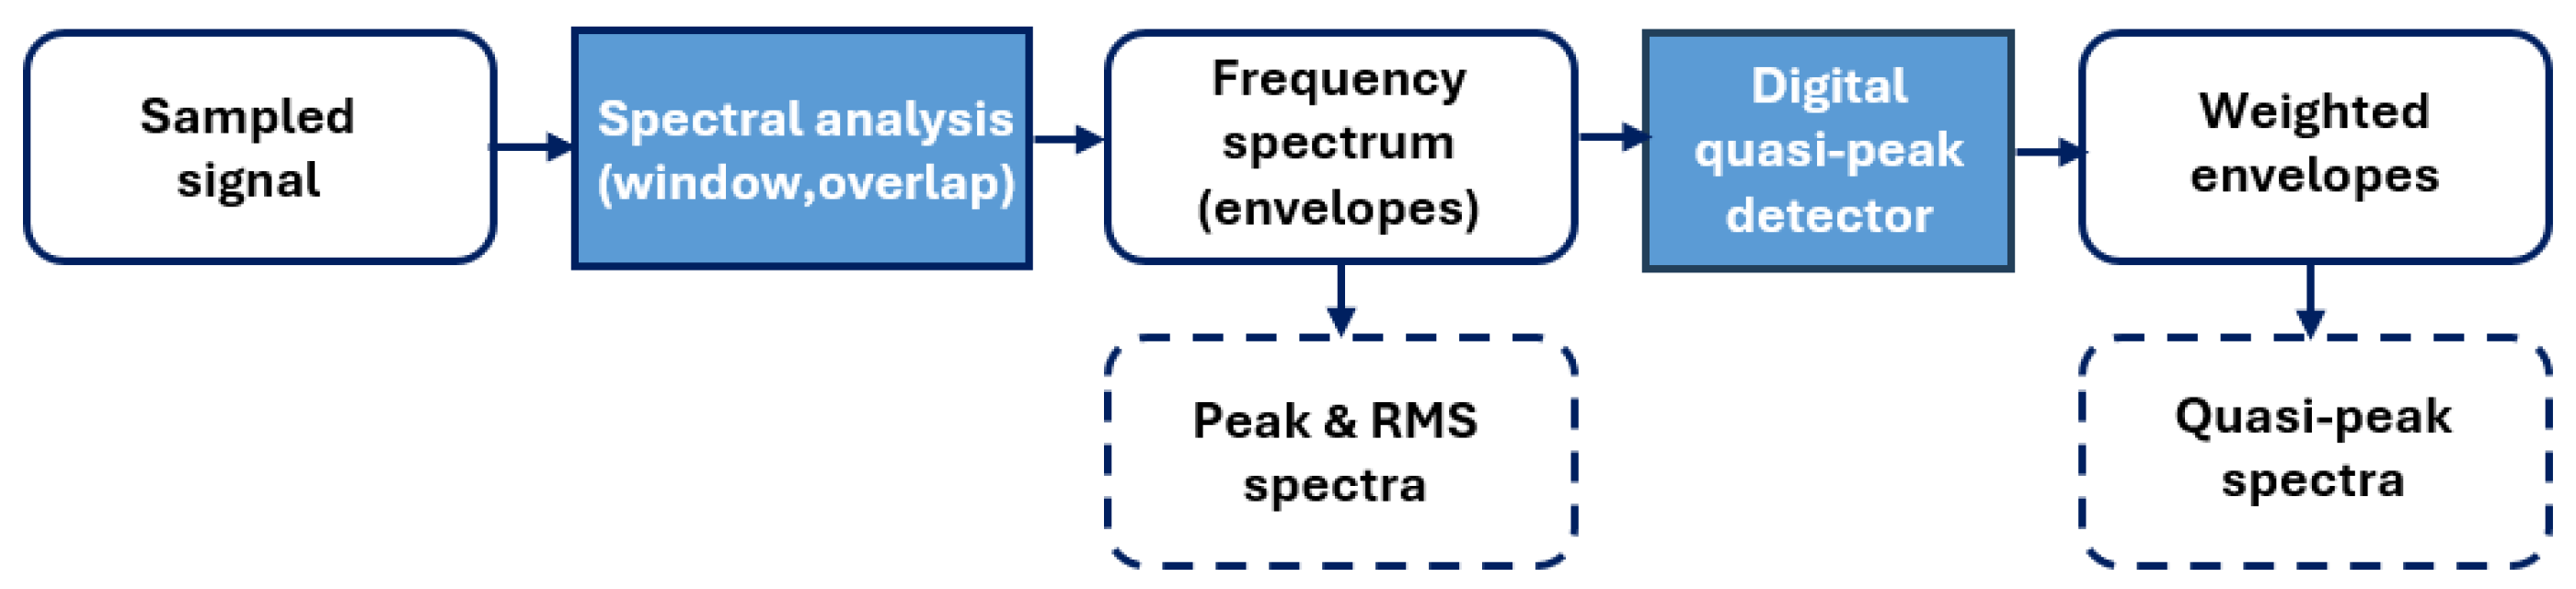
- Peak and quasi-peak detection: the methodology utilises peak and quasi-peak detectors to assess emissions and their impact on radio transmission interference.
- 4.
- 1.
- Computational burden: implementing a digital instrument with the capability to measure the entire frequency range simultaneously may result in a high computational burden, particularly for evaluating the signal amplitude in each frequency band [13].
- 2.
- Reproducibility: the tolerances of the methodology and the potential for different compliant implementations may raise concerns about the reproducibility of results, particularly for electricity supply network measurements [63].
- 3.
- Relevance to power supply quality: while the methodology is useful for assessing emissions and their impact on radio transmission, questions have arisen regarding its relevance to assessing the quality of power supply in the electricity supply grid environments [64].
4.4. Alternative Methods
4.5. Challenges
- Supraharmonic measurement requires high time resolution capability to capture high-frequency waveform distortion, which cannot be achieved with conventional measuring equipment. Therefore, a normative measurement technique is required for the design of measuring equipment, which in turn is the key to the recording and analysis of high-frequency emissions.
- Existing measurement techniques presented in standards provide indicative magnitude values, i.e., minimum, maximum, quasi-peak, RSS, for a group of supraharmonic emissions. Is there any possibility of defining a phase angle representation for a harmonic emissions band, allowing the identification of supraharmonic summation characteristics?
- Lack of reproducibility with IEC 61000-4-30/CISPR measurement techniques.
- No convention to differentiate narrowband and broadband signals in the frequency domain. A broadband signal in the IEC 61000-4-7 method (200 Hz resolution) may be identified as a narrowband signal in the IEC 61000-4-30 method (2 kHz resolution).
5. Modelling and Simulation
Challenges
- A complete understanding of emission characteristics is missing due to the lack of accurate harmonic models. Comprehensive models are only available from the inverter manufacturer. Thus, a generic simulation model is necessary for understanding supraharmonic characteristics.
- Models have been developed for harmonic analysis in the low-frequency range. However, the validity of these models in the high-frequency range is yet to be verified.
- For a multiple inverter system, it is assumed that each inverter operates at the same operating state. Thus, the linear summation is valid for low-frequency harmonic emissions. Do high-frequency emissions follow the same principle irrespective of the emission phenomena?
6. Mitigation
Challenges
- There are many PWM modulation techniques that have been developed to reduce switching frequency emissions in PE converters. However, a quantitative analysis of these reductions is yet to be performed.
- Lack of simulation models of PE converters makes it difficult to:
- 1.
- Quantify the reduction of switching frequency emissions against PWM modulation technique.
- 2.
- Introduce effective PWM modulation techniques to suppress switching frequency emissions.
7. Conclusions
Author Contributions
Funding
Data Availability Statement
Conflicts of Interest
Abbreviations
| AC | Alternating current |
| APFC | Active power factor correction |
| DC | Direct current |
| DER | Distributed energy resource |
| DFT | Discrete Fourier transform |
| EMC | Electromagnetic compatibility |
| EUT | Equipment under test |
| EV | Electric vehicle |
| GIL | Global innovations linkage |
| LV | Low voltage |
| MV | Medium voltage |
| PE | Power electronic |
| PEC | Power electronic converter |
| PLC | Power line communication |
| PLL | Phase locked loop |
| PQ | Power quality |
| PV | Photovoltaic |
| PWM | Pulse-width modulation |
| RES | Renewable energy source |
| RSS | Root sum squared |
| VSC | Voltage source converter |
References
- CIGRE JWG C4.24/CIRED. In Power Quality and EMC Issues with Future Electricity Networks; CIGRE: Paris, France, 2018.
- Bartak, G.F.; Abart, A. EMI of emissions in the frequency range 2 kHz–150 kHz. In Proceedings of the 22nd International Conference and Exhibition on Electricity Distribution (CIRED 2013), Stockholm, Sweden, 10–13 June 2013; pp. 1–4. [Google Scholar] [CrossRef]
- Darmawardana, D.; Perera, S.; Robinson, D.; Meyer, J.; Jayatunga, U. Important Considerations in Development of PV Inverter Models for High Frequency Emission (Supraharmonic) Studies. In Proceedings of the 2020 19th International Conference on Harmonics and Quality of Power (ICHQP), Dubai, United Arab Emirates, 6–7 July 2020; pp. 1–6. [Google Scholar] [CrossRef]
- Zavoda, F.; Langella, R.; Lazaroiu, G.C.; Bollen, M.; Rönnberg, S.K.; Meyer, J.; Ciufo, P. Power quality in the future grid—Results from CIGRE/CIRED JWG C4.24. In Proceedings of the 2016 17th International Conference on Harmonics and Quality of Power (ICHQP), Belo Horizonte, Brazil, 16–19 October 2016; pp. 931–936. [Google Scholar] [CrossRef]
- REN21 Secretariat. REN21 Renewables Global Status Report—Energy Supply. 2024. Available online: https://www.ren21.net/reports/global-status-report/ (accessed on 5 January 2025).
- Rönnberg, S.; Bollen, M. Propagation of Supraharmonics in the Low Voltage Grid; Number 2017:461. 2017. Available online: https://energiforskmedia.blob.core.windows.net/media/23665/propagation-of-supraharmonics-in-the-low-voltage-grid-energiforskrapport-2017-461.pdf (accessed on 20 June 2024).
- Espín-Delgado, A.; Rönnberg, S. Stochastic Modeling of Supraharmonic Propagation. In Proceedings of the PES General Meeting 2022, Denver, CO, USA, 17–21 July 2022. [Google Scholar] [CrossRef]
- Zolett, B.; Leborgne, R.C. Propagation of Supraharmonics Generated by PMSG Wind Power Plants into Transmission Systems. In Proceedings of the 2020 IEEE PES Transmission & Distribution Conference and Exhibition - Latin America (T&D LA), Montevideo, Uruguay, 28 September–2 October 2020; pp. 1–6. [Google Scholar] [CrossRef]
- Larsson, E.O.A.; Bollen, M.H.J. Emission and immunity of equipment in the frequency range 2 to 150 kHz. In Proceedings of the 2009 IEEE Bucharest PowerTech, Bucharest, Romania, 28 June–2 July 2009; pp. 1–5. [Google Scholar] [CrossRef]
- Subhani, S.; Cuk, V.; Cobben, J. A literature survey on power quality disturbances in the frequency range of 2-150 kHz. Renew. Energy Power Qual. J. 2017, 1, 405–410. [Google Scholar] [CrossRef]
- Espín-Delgado, A.; Rönnberg, S.; Sudha Letha, S.; Bollen, M. Diagnosis of supraharmonics-related problems based on the effects on electrical equipment. Electr. Power Syst. Res. 2021, 195, 107179. [Google Scholar] [CrossRef]
- Espín-Delgado, A.; Letha, S.S.; Rönnberg, S.K.; Bollen, M.H.J. Failure of MV Cable Terminations Due to Supraharmonic Voltages: A Risk Indicator. IEEE Open J. Ind. Appl. 2020, 1, 42–51. [Google Scholar] [CrossRef]
- Gallarreta, A.; Fernández, I.; Ritzmann, D.; Lodetti, S.; Khokhlov, V.; Wright, P.; Meyer, J.; de la Vega, D. A Light Measurement Method for 9–150 kHz Disturbances in Power Grids Comparable to CISPR Quasi-Peak. IEEE Trans. Instrum. Meas. 2022, 71, 9005410. [Google Scholar] [CrossRef]
- IEC/TR 61000-3-6; Electromagnetic Compatibility (EMC)-Part 3-6: Limits—Assessment of Emission Limits for the Connection of Distorting Installations to MV, HV and EHV Power Systems. IEC: Geneva, Switzerland, 2008.
- IEEE 519; IEEE Standard for Harmonic Control in Electric Power Systems. IEEE: New York, NY, USA, 2022. [CrossRef]
- Khajeh, K.G.; Solatialkaran, D.; Zare, F.; Mithulananthan, N. Harmonic Analysis of Multi-Parallel Grid- Connected Inverters in Distribution Networks: Emission and Immunity Issues in the Frequency Range of 0-150 kHz. IEEE Access 2020, 8, 56379–56402. [Google Scholar] [CrossRef]
- Nduka, O.S.; Pal, B.C. Harmonic Domain Modeling of PV System for the Assessment of Grid Integration Impact. IEEE Trans. Sustain. Energy 2017, 8, 1154–1165. [Google Scholar] [CrossRef]
- Darmawardana, D.; Perera, S.; Meyer, J.; Robinson, D.; Jayatunga, U.; Elphick, S. Development of high frequency (Supraharmonic) models of small-scale (<5kW), single-phase, grid-tied PV inverters based on laboratory experiments. Electr. Power Syst. Res. 2019, 177, 105990. [Google Scholar] [CrossRef]
- Varatharajan, A.; Schoettke, S.; Meyer, J.; Abart, A. Harmonic Emission of Large PV Installations Case Study of a 1 MW Solar Campus. Renew. Energy Power Qual. J. 2014, 12, 701–706. [Google Scholar] [CrossRef]
- Moghadam, H.; Ackermann, F.; Rogalla, S. Improving the Summation Law for Harmonic Current Emissions of Parallel Operated PV Inverters by Considering Equivalent Grid Impedance. Renew. Energy Power Qual. J. 2017, 1, 371–376. [Google Scholar] [CrossRef]
- Liyanage, S.; Perera, S.; Robinson, D. Harmonic Emission Assessment of Solar Farms: A Comparative Study Using EMT and Frequency Domain Models. CSE 2022. Available online: https://cse.cigre.org/cse-n025/harmonic-emission-assessment-of-solar-farms-a-comparative-study-using-emt-and-frequency-domain-models.html (accessed on 10 October 2022).
- Blanco Castañeda, A.; Heimbach, B.; Wartmann, B.; Meyer, J.; Mangani, M.; Oeschger, M. Harmonic, interharmonic and supraharmonic characterisation of a 12 MW wind park based on field measurements. CIRED—Open Access Proc. J. 2017, 2017, 677–681. [Google Scholar] [CrossRef]
- Espín-Delgado, A.; Rönnberg, S.; Busatto, T.; Ravindran, V.; Bollen, M. Summation law for supraharmonic currents (2–150 kHz) in low-voltage installations. Electr. Power Syst. Res. 2020, 184, 106325. [Google Scholar] [CrossRef]
- Slangen, T.; Ćuk, V.; Cobben, S. Summation of supraharmonic currents (2–150 kHz) from EV fast charging stations. Electr. Power Syst. Res. 2023, 220, 109371. [Google Scholar] [CrossRef]
- Rönnberg, S.K.; Castro, A.G.; Moreno-Munoz, A.; Bollen, M.H.J.; Garrido, J. Solar PV inverter supraharmonics reduction with random PWM. In Proceedings of the 2017 11th IEEE International Conference on Compatibility, Power Electronics and Power Engineering (CPE-POWERENG), Cadiz, Spain, 4–6 April 2017; pp. 644–649. [Google Scholar] [CrossRef]
- Rönnberg, S.K.; Castro, A.G.d.; Bollen, M.H.; Moreno-Munoz, A.; Romero-Cadaval, E. Supraharmonics from power electronics converters. In Proceedings of the 2015 9th International Conference on Compatibility and Power Electronics (CPE), Costa da Caparica, Portugal, 24–26 June 2015; pp. 539–544. [Google Scholar] [CrossRef]
- Lin, J.; Zhu, M.; Ding, T.; Gao, M.; Jiao, Y. Supraharmonics Mitigation Strategy of Rolling Mill Converter Clusters Considering High-frequency Circulating Currents. In Proceedings of the 2024 21st International Conference on Harmonics and Quality of Power (ICHQP), Chengdu, China, 15–18 October 2024; pp. 191–196. [Google Scholar] [CrossRef]
- Rajkumar, S.; Balasubramanian, R.; Kathirvelu, P. A Comprehensive Review on Supraharmonics—The Next Big Power Quality Concern. Smart Grids Sustain. Energy 2024, 9, 15. [Google Scholar] [CrossRef]
- Michalec, L.; Kostyła, P.; Leonowicz, Z. Supraharmonic Pollution Emitted by Nonlinear Loads in Power Networks—Ongoing Worldwide Research and Upcoming Challenges. Energies 2023, 16, 273. [Google Scholar] [CrossRef]
- Rönnberg, S.K.; Bollen, M.H.J.; Amaris, H.; Chang, G.W.; Gu, I.Y.H.; Kocewiak, L.H.; Meyer, J.; Olofsson, M.; Ribeiro, P.F.; Desmet, J. On waveform distortion in the frequency range of 2 kHz–150 kHz—Review and research challenges. Electr. Power Syst. Res. 2017, 150, 1–10. [Google Scholar] [CrossRef]
- Mirus International Inc. . Supraharmonics—The Next Big PQ Concern; Mirus International Inc.: Brampton, ON, Canada, 2022. [Google Scholar]
- Dewayalage, I.; Robinson, D.A.; Elphick, S.; Perera, S. Measurement of High-Frequency Voltage Harmonics above 2 kHz in High-Voltage Networks. Energies 2024, 17, 892. [Google Scholar] [CrossRef]
- Alkahtani, A.A.; Alfalahi, S.T.Y.; Athamneh, A.A.; Al-Shetwi, A.Q.; Mansor, M.B.; Hannan, M.A.; Agelidis, V.G. Power Quality in Microgrids Including Supraharmonics: Issues, Standards, and Mitigations. IEEE Access 2020, 8, 127104–127122. [Google Scholar] [CrossRef]
- Alfalahi, S.T.Y.; Alkahtani, A.A.; Al-Shetwi, A.Q.; Al-Ogaili, A.S.; Abbood, A.A.; Mansor, M.B.; Fazea, Y. Supraharmonics in Power Grid: Identification, Standards, and Measurement Techniques. IEEE Access 2021, 9, 103677–103690. [Google Scholar] [CrossRef]
- Ma, Z.; Xu, Q.; Li, P.; Wu, J.; Huang, H. Supraharmonics Analysis of Modular Multilevel Converter and Long Cable System. In Proceedings of the 2019 IEEE Sustainable Power and Energy Conference (iSPEC), Beijing, China, 21–23 November 2019; pp. 2585–2589. [Google Scholar] [CrossRef]
- He, L.; Xu, S.; Li, H.; Zhu, K.; Ji, Z. Analysis of the Supraharmonic Characteristics of VSR PWM Converter. In Proceedings of the 2023 IEEE 6th International Electrical and Energy Conference (CIEEC), Hefei, China, 2–14 May 2023; pp. 842–847. [Google Scholar] [CrossRef]
- Joshi, T.; Heydt, G.; Ayyanar, R. An Analysis Approach for the Assessment of Pulse-width Modulated Carrier Frequency Spectral Components in Power Distribution Systems with Photovoltaic Resources. Electr. Power Compon. Syst. 2015, 43, 2094–2104. [Google Scholar] [CrossRef]
- Ruan, X.; Wang, X.; Pan, D.; Yang, D.; Li, W.; Bao, C. Design of LCL Filter. In Control Techniques for LCL-Type Grid-Connected Inverters; Ruan, X., Wang, X., Pan, D., Yang, D., Li, W., Bao, C., Eds.; CPSS Power Electronics Series; Springer: Singapore, 2018; pp. 31–61. [Google Scholar] [CrossRef]
- Holmes, D.G.; Lipo, T.A. Modulation of Three Phase Voltage Source Inverters. In Pulse Width Modulation for Power Converters: Principles and Practice; IEEE: Piscataway, NJ, USA, 2003; pp. 215–258. [Google Scholar] [CrossRef]
- Balcells, J.; Santolaria, A.; Orlandi, A.; Gonzalez, D.; Gago, J. EMI reduction in switched power converters using frequency Modulation techniques. IEEE Trans. Electromagn. Compat. 2005, 47, 569–576. [Google Scholar] [CrossRef]
- Waniek, C.; Wohlfahrt, T.; Myrzik, J.M.; Meyer, J.; Klatt, M.; Schegner, P. Supraharmonics: Root causes and interactions between multiple devices and the low voltage grid. In Proceedings of the 2017 IEEE PES Innovative Smart Grid Technologies Conference Europe (ISGT-Europe), Turin, Italy, 26–29 September 2017; pp. 1–6. [Google Scholar] [CrossRef]
- Aboutaleb, A.M.; Desmet, J.; Knockaert, J. Impact of Grid-Connected Inverter Parameters on the Supraharmonic Emissions in Distributed Power Generation Systems. Machines 2023, 11, 1014. [Google Scholar] [CrossRef]
- Menti, A.; Pachos, P.; Psomopoulos, C.S. Supraharmonic Distortion at the Grid Connection Point of a Network Comprising a Photovoltaic System. Energies 2025, 18, 564. [Google Scholar] [CrossRef]
- Mariscotti, A.; Mingotti, A. The Effects of Supraharmonic Distortion in MV and LV AC Grids. Sensors 2024, 24, 2465. [Google Scholar] [CrossRef]
- Rönnberg, S.; Larsson, A.; Bollen, M.; Schanen, J.L. A simple model for interaction between equipment at a frequency of some tens of kHz. In Proceedings of the CIRED 21st International Conference on Electricity Distribution, Frankfurt, Germany, 6–9 June 2011. [Google Scholar]
- Espín-Delgado, A.; Busatto, T.; Ravindran, V.; Rönnberg, S.K.; Meyer, J. Evaluation of Supraharmonic Propagation in LV Networks Based on the Impedance Changes Created by Household Devices. In Proceedings of the 2020 IEEE PES Innovative Smart Grid Technologies Europe (ISGT-Europe), The Hague, The Netherlands, 26–28 October 2020; pp. 754–758. [Google Scholar] [CrossRef]
- Mohos, A.; Ladányi, J. Emission Measurement of a Solar Park in the Frequency Range of 2 to 150 kHz. In Proceedings of the 2018 International Symposium on Electromagnetic Compatibility (EMC EUROPE), Amsterdam, The Netherlands, 27–30 August 2018; pp. 1024–1028. [Google Scholar] [CrossRef]
- Frey, D.; Schanen, J.L.; Quintana, S.; Bollen, M.; Conrath, C. Study of high frequency harmonics propagation in industrial networks. In Proceedings of the International Symposium on Electromagnetic Compatibility—EMC EUROPE, Rome, Italy, 17–21 September2012; pp. 1–5. [Google Scholar] [CrossRef]
- Novitskiy, A.; Schlegel, S.; Westermann, D. Analysis of supraharmonic propagation in a MV electrical network. In Proceedings of the 2018 19th International Scientific Conference on Electric Power Engineering (EPE), Brno, Czech Republic, 16–18 May 2018; pp. 1–6. [Google Scholar] [CrossRef]
- Novitskiy, A.; Schlegel, S.; Westermann, D. Measurements and Analysis of Supraharmonic Influences in a MV/LV Network Containing Renewable Energy Sources. In Proceedings of the 2019 Electric Power Quality and Supply Reliability Conference (PQ) & 2019 Symposium on Electrical Engineering and Mechatronics (SEEM), Kärdla, Estonia, 12–15 June 2019; pp. 1–6. [Google Scholar] [CrossRef]
- Espín-Delgado, A.; Rönnberg, S. Modeling and Analysis of Supraharmonic Propagation for Stochastic Studies. IEEE Trans. Power Deliv. 2022, 37, 4899–4910. [Google Scholar] [CrossRef]
- Prudenzi, A.; Fioravanti, A.; Silvestri, A.; Ciancetta, F.; Fiorucci, E.; Mari, S. Overview of the Propagation of Supraharmonics in Power Systems. In Proceedings of the 2022 AEIT International Annual Conference (AEIT), Rome, Italy, 3–5 October 2022; pp. 1–6. [Google Scholar] [CrossRef]
- Slangen, T.; van Wijk, T.; Cuk, V.; Cobben, S. The Propagation and Interaction of Supraharmonics from Electric Vehicle Chargers in a Low-Voltage Grid. Energies 2020, 13, 3865. [Google Scholar] [CrossRef]
- Slangen, T.; de Jong, E.; Cuk, V.; Cobben, S. Transfer of supraharmonics through a MV/LV transformer. In Proceedings of the 27th International Conference on Electricity Distribution (CIRED 2023), Rome, Italy, 12–15 June 2023; Volume 2023, pp. 110–114. [Google Scholar] [CrossRef]
- Duan, R.; He, J.; Guo, C.; Zhou, F. Supraharmonics Transfer Characteristics of Transformer. In Proceedings of the 2021 IEEE 16th Conference on Industrial Electronics and Applications (ICIEA), Chengdu, China, 1–4 August 2021; pp. 1226–1231. [Google Scholar] [CrossRef]
- IEC/TR 61000-4-7; Electromagnetic compatibility (EMC)-Part 4-7: General Guide on Harmonics and Interharmonics Measurements, for Power Supply Systems and Equipment Connected Thereto. IEC: Geneva, Switzerland, 2002.
- IEC/TR 61000-4-30; Electromagnetic Compatibility (EMC)-Part 4-30: Testing and Measurement Techniques-Power Quality Measurement Methods. IEC: Geneva, Switzerland, 2003.
- CISPR 16-1-1; Specification for Radio Disturbance and Immunity Measuring Apparatus and Methods-Part 1-1: Radio Disturbance and Immunity Measuring Apparatus-Measuring Apparatus. IEC: Geneva, Switzerland, 2015.
- Mendes, T.M.; Duque, C.A.; Manso da Silva, L.R.; Ferreira, D.D.; Meyer, J.; Ribeiro, P.F. Comparative analysis of the measurement methods for the supraharmonic range. Int. J. Electr. Power Energy Syst. 2020, 118, 105801. [Google Scholar] [CrossRef]
- Khokhlov, V.; Meyer, J.; Grevener, A.; Busatto, T.; Rönnberg, S. Comparison of Measurement Methods for the Frequency Range 2–150 kHz (Supraharmonics) Based on the Present Standards Framework. IEEE Access 2020, 8, 77618–77630. [Google Scholar] [CrossRef]
- Gallarreta, A.; Fernández, I.; Ritzmann, D.; Lodetti, S.; Khokhlov, V.; de la Vega, D.; Wright, P.; Meyer, J. Statistical relationship between RMS and QP spectra of voltage measurements in the 9–150 kHz range. Electr. Power Syst. Res. 2023, 218, 109213. [Google Scholar] [CrossRef]
- Sandrolini, L.; Mariscotti, A. Impact of short-time fourier transform parameters on the accuracy of EMI spectra estimates in the 2-150 kHz supraharmonic interval. Electr. Power Syst. Res. 2021, 195, 107130. [Google Scholar] [CrossRef]
- Lodetti, S.; Gallarreta, A.; Ritzmann, D.; Khokhlov, V.; Wright, P.; Meyer, J.; Fernández, I.; de la Vega, D. On the suitability of the CISPR 16 method for measuring conducted emissions in the 2–150kHz range in low voltage grids. Electr. Power Syst. Res. 2023, 216, 109011. [Google Scholar] [CrossRef]
- Frigo, G. Measurement of Conducted Supraharmonic Emissions: Quasi-Peak Detection and Filter Bandwidth. Metrology 2022, 2, 161–179. [Google Scholar] [CrossRef]
- Li, K.; Zhao, W.; Li, S.; Huang, S. Performance Analysis of Matrix Pencil Method Applied to High-Resolution Measurement of Supraharmonics. Energies 2023, 16, 6136. [Google Scholar] [CrossRef]
- Carpinelli, G.; Bracale, A.; Varilone, P.; Sikorski, T.; Kostyla, P.; Leonowicz, Z. A New Advanced Method for an Accurate Assessment of Harmonic and Supraharmonic Distortion in Power System Waveforms. IEEE Access 2021, 9, 88685–88698. [Google Scholar] [CrossRef]
- Kuwałek, P.; Bracale, A.; Sikorski, T.; Rezmer, J. Synchronized Approach Based on Empirical Fourier Decomposition for Accurate Assessment of Harmonics and Specific Supraharmonics. IEEE Trans. Ind. Electron. 2025, 72, 992–1002. [Google Scholar] [CrossRef]
- Li, K.; Zhao, W.; Li, S.; Huang, S. Supraharmonics Measurement Based on Colored Noise Suppressed Matrix Pencil Method. IEEE Access 2023, 11, 94346–94357. [Google Scholar] [CrossRef]
- Ji, Y.; Yan, W.; Wang, W. Supraharmonic Detection Algorithm Based on Interpolation of Self-Convolutional Window All-Phase Compressive Sampling Matching Pursuit. Information 2024, 15, 127. [Google Scholar] [CrossRef]
- Lodetti, S.; Bruna, J.; Melero, J.J.; Khokhlov, V.; Meyer, J. A Robust Wavelet-Based Hybrid Method for the Simultaneous Measurement of Harmonic and Supraharmonic Distortion. IEEE Trans. Instrum. Meas. 2020, 69, 6704–6712. [Google Scholar] [CrossRef]
- Arranz-Gimon, A.; Zorita-Lamadrid, A.; Morinigo-Sotelo, D.; Duque-Perez, O. A Review of Total Harmonic Distortion Factors for the Measurement of Harmonic and Interharmonic Pollution in Modern Power Systems. Energies 2021, 14, 6467. [Google Scholar] [CrossRef]
- Tiwari, V.K.; Umarikar, A.C.; Jain, T. Fast Amplitude Estimation of Harmonics Using Undecimated Wavelet Packet Transform and Its Hardware Implementation. IEEE Trans. Instrum. Meas. 2018, 67, 65–77. [Google Scholar] [CrossRef]
- Mendes, T.M.; Duque, C.A.; Silva, L.R.M.; Ferreira, D.D.; Meyer, J. Supraharmonic analysis by filter bank and compressive sensing. Electr. Power Syst. Res. 2019, 169, 105–114. [Google Scholar] [CrossRef]
- Gallarreta, A.; Fernández, I.; González-Ramos, J.; de la Vega, D.; Angulo, I.; Arrinda, A. Technique for the comprehensive characterization of supraharmonic disturbances (9–150 kHz) in the joint time-frequency domain. Sustain. Energy Grids Netw. 2023, 36, 101181. [Google Scholar] [CrossRef]
- Gallarreta, A.; Fernández, I.; Ritzmann, D.; Lodetti, S.; Khokhlov, V.; Wright, P.; Meyer, J.; De La Vega, D. Adaptation of the IEC 61000-4-7 Measurement Method to CISPR Band A (9-150 kHz). In Proceedings of the 2022 IEEE 12th International Workshop on Applied Measurements for Power Systems (AMPS), Cagliari, Italy, 28–30 September 2022; pp. 1–6. [Google Scholar] [CrossRef]
- Blaabjerg, F.; Teodorescu, R.; Liserre, M.; Timbus, A. Overview of Control and Grid Synchronization for Distributed Power Generation Systems. IEEE Trans. Ind. Electron. 2006, 53, 1398–1409. [Google Scholar] [CrossRef]
- Liserre, M.; Dell’Aquila, A.; Blaabjerg, F. Stability improvements of an LCL-filter based three-phase active rectifier. In Proceedings of the 2002 IEEE 33rd Annual IEEE Power Electronics Specialists Conference. Proceedings (Cat. No.02CH37289), Cairns, QLD, Australia, 23–27 June 2002; Volume 3, pp. 1195–1201. [Google Scholar] [CrossRef]
- Shah, S. Step-by-Step Design of an LCL Filter for Three-Phase Grid Interactive Converter; 2015. Available online: https://www.academia.edu/37525414/Step_by_step_Design_of_an_LCL_Filter_for_Three_phase_Grid_Interactive_Converter (accessed on 12 February 2024).
- Liserre, M.; Blaabjerg, F.; Dell’Aquila, A. Step-by-step design procedure for a grid-connected three-phase PWM voltage source converter. Int. J. Electron. 2004, 91, 445–460. [Google Scholar] [CrossRef]
- Zhao, T.; Zong, Q.; Zhang, T.; Xu, Y. Study of photovoltaic three-phase grid-connected inverter based on the grid voltage-oriented control. In Proceedings of the 2016 IEEE 11th Conference on Industrial Electronics and Applications (ICIEA), Hefei, China, 5–7 June 2016; pp. 2055–2060. [Google Scholar] [CrossRef]
- Collin, A.J.; Meyer, J.; Davari, P.; Drapela, J.; Chang, G.W.; Langella, R. Modeling the Unintentional Emissions of Single-Phase Power Electronic Converters for Distortion Studies in the 2-150 kHz Range. IEEE Trans. Power Deliv. 2024, 39, 3126–3138. [Google Scholar] [CrossRef]
- Bracale, A.; Caramia, P.; Casolino, G.M.; de Falco, P.; Hussain, I.; Varilone, P.; Verde, P. Harmonic and Supra-Harmonic Emissions of Electric Vehicle Chargers: Modeling and Cumulative Impact Indices. IEEE Open Access J. Power Energy 2024, 11, 690–702. [Google Scholar] [CrossRef]
- Wang, Y.; Luo, D.; Xiao, X. Evaluation of supraharmonic emission levels of multiple grid-connected VSCs. IET Gener. Transm. Distrib. 2019, 13, 5597–5604. [Google Scholar] [CrossRef]
- Božiček, A.; Kilter, J.; Sarnet, T.; Papič, I.; Blažič, B. Harmonic Emissions of Power Electronic Devices Under Different Transmission Network Operating Conditions. IEEE Trans. Ind. Appl. 2018, 54, 5216–5226. [Google Scholar] [CrossRef]
- Gharani Khajeh, K.; Solatialkaran, D.; Zare, F.; Mithulananthan, N. An enhanced full-feedforward strategy to mitigate output current harmonics in grid-tied inverters. IET Gener. Transm. Distrib. 2021, 15, 827–835. [Google Scholar] [CrossRef]
- Mnider, A.M.; Atkinson, D.J.; Dahidah, M.; Armstrong, M. A simplified DQ controller for single-phase grid-connected PV inverters. In Proceedings of the 2016 7th International Renewable Energy Congress (IREC), Hammamet, Tunisia, 22–24 March 2016; pp. 1–6. [Google Scholar] [CrossRef]
- Panda, R.K.; Mohapatra, A.; Srivastava, S.C. An Effective Inertia Control Scheme for Solar PV Systems with Conventional dq Controller. In Proceedings of the 2018 IEEE Power & Energy Society General Meeting (PESGM), Portland, OR, USA, 5–10 August 2018; pp. 1–5. [Google Scholar] [CrossRef]
- Yang, L.; He, X.; Chang, A.; Liu, S. Analysis and design of L + LCL-filtered dual-frequency single-phase grid-connected inverter. IET Power Electron. 2020, 13, 1416–1425. [Google Scholar] [CrossRef]
- Liyanage, S.; Perera, S.; Robinson, D. Analytical Derivation of Three Phase Inverter Harmonic Model Parameters. In Proceedings of the 2021 IEEE PES Innovative Smart Grid Technologies—Asia (ISGT Asia), Brisbane, Australia, 5–8 December 2021; pp. 1–5. [Google Scholar] [CrossRef]
- Gharani Khajeh, K.; Solatialkaran, D.; Zare, F.; Mithulananthan, N. Harmonic analysis of grid-connected inverters considering external distortions: Addressing harmonic emissions up to 9 kHz. IET Power Electron. 2020, 13, 1934–1945. [Google Scholar] [CrossRef]
- Hong, L.; Shu, W.; Wang, J.; Mian, R. Harmonic Resonance Investigation of a Multi-Inverter Grid-Connected System Using Resonance Modal Analysis. IEEE Trans. Power Deliv. 2019, 34, 63–72. [Google Scholar] [CrossRef]
- Gao, B.; Wang, Y.; Xu, W. Modeling Voltage Source Converters for Harmonic Power Flow Studies. IEEE Trans. Power Deliv. 2021, 36, 3426–3437. [Google Scholar] [CrossRef]
- Das, J.C. Harmonic Reduction at the Source. In Power System Harmonics and Passive Filter Designs; IEEE: Piscataway, NJ, USA, 2015; pp. 229–279. [Google Scholar] [CrossRef]
- Dursun, M.; DÖŞOĞLU, M.K. LCL Filter Design for Grid Connected Three-Phase Inverter. In Proceedings of the 2018 2nd International Symposium on Multidisciplinary Studies and Innovative Technologies (ISMSIT), Ankara, Turkey, 19–21 October 2018; pp. 1–4. [Google Scholar] [CrossRef]
- Jalan, R.; Gaur, C.; Pandey, J.P. Analysis of Harmonic Reduction Using An Intelligent Control Active Filter in A Solar Grid with Variable Load. Int. J. Electr. Electron. Eng. 2024, 11, 212–222. [Google Scholar] [CrossRef]
- Letha, S.S.; Bollen, M.H.J.; Rönnberg, S.; Delgado, A.S. Propagation of supraharmonics in a medium-voltage network. In Proceedings of the CIRED 2021—The 26th International Conference and Exhibition on Electricity Distribution, Virtual, 20–23 September 2021; Volume 2021, pp. 638–642. [Google Scholar] [CrossRef]
- Rodriguez, J.; Franquelo, L.G.; Kouro, S.; Leon, J.I.; Portillo, R.C.; Prats, M.A.M.; Perez, M.A. Multilevel Converters: An Enabling Technology for High-Power Applications. Proc. IEEE 2009, 97, 1786–1817. [Google Scholar] [CrossRef]
- Moreno-Munoz, A.; Gil-de Castro, A.; Romero-Cavadal, E.; Rönnberg, S.; Bollen, M. Supraharmonics (2 to 150 kHz) and multi-level converters. In Proceedings of the 2015 IEEE 5th International Conference on Power Engineering, Energy and Electrical Drives (POWERENG), Riga, Latvia, 11–13 May 2015; pp. 37–41. [Google Scholar] [CrossRef]
- Siva, A.S.; Kumar, S.G.R.; Dhayalini, K. Supraharmonic mitigation in microgrid and electric vehicle charging station through multilevel converter. Indones. J. Electr. Eng. Comput. Sci. 2023, 32, 1309–1317. [Google Scholar] [CrossRef]
- Peiris, K.; Elphick, S.; David, J.; Robinson, D. Impact of Multiple Grid-Connected Solar PV Inverters on Harmonics in the High-Frequency Range. Energies 2024, 17, 2639. [Google Scholar] [CrossRef]
- Peiris, K.; Elphick, S.; David, J.; Robinson, D. Characterisation of supraharmonic emissions based on phase angle representation methods. Electr. Power Syst. Res. 2025, 241, 111368. [Google Scholar] [CrossRef]
- Peiris, K.; Elphick, S.; David, J.; Robinson, D. Characterisation of Harmonic Resonance Phenomenon of Multi-Parallel PV Inverter Systems: Modelling and Analysis. Energies 2025, 18, 443. [Google Scholar] [CrossRef]
- Peiris, K.; Robinson, D.; Elphick, S. Harmonic Distortion in Future Electricity Networks with Renewable Energy Sources. In Proceedings of the Workshop 3—Global Innovation Linkage Program—Power Quality of Future Electricity Networks, National Measurement Institute, Lindfield, Australia, 17–18 August 2023. [Google Scholar]


| Ref. | Analysis | Contributions | Limitations |
|---|---|---|---|
| [35] | High-frequency harmonics amplification and resonance in modular multilevel converters connected to long cables. | Established mathematical model for converter-long cable-load system. Discussed high-frequency amplification and resonance frequency calculation that aligns with field test results. | Resonant frequency solved using SciPy tools. |
| [36] | Factors influencing supraharmonic emissions including sampling methods, carrier phase shifting, dead zones and PWM control strategies. | Provides variation of supraharmonic emissions associated with VSR against various factors through mathematical modelling and simulation analysis. | Only analyses single-phase half-bridge voltage source rectifier (VSR) converter, where generalisation of results to other types of converters is not addressed. |
| [41] | Characterisation of switching frequency emissions with variations in magnitude and frequency. Resonance due to interactions between devices. | Examined supraharmonic emission from various household devices. Studied interactions between multiple devices and the grid. | The quantification of supraharmonic emission through measurements should consider multiple analysis types, i.e., time domain, frequency domain, time-frequency. |
| [42] | Switching frequency emissions from grid-connected inverters (GCIs) around the switching frequency and its multiples. | Supraharmonic emissions of single-phase GCIs are strongly dependent on the DC-link voltage and the coupling inductor. Mathematical analyses of GCI parameters on emissions are verified using an actual setup and simulation study. | Generalisation of MATLAB/Simulink (Version R2021b) model due to potential discrepancies or modelling assumptions. |
| [43] | Supraharmonic emissions from grid-connected photovoltaic systems. | Examines emissions from a three-phase grid-connected PV system. Assesses combined supraharmonic effects on grid connection distortion. | Supraharmonic characteristics depend on the converter type rather than environmental conditions, requiring a more rigorous treatment of the performance of PV systems. |
| [44] | Supraharmonic distortion impacts power loss and heating, which result in the ageing of dielectric materials and medium voltage (MV) cable failures. | Analysis of supraharmonic distortion effects on power networks and derivation of limits for supraharmonics compared to harmonics. | Accurate measurement of supraharmonic emissions in MV networks is yet to be achieved. |
| Ref. | Analysis | Contributions | Limitations |
|---|---|---|---|
| [51] | Dependence of propagation on the impedance of the grid and connected devices. | Presents a method for analysing supraharmonic propagation using a stochastic approach, which allows for a better understanding of the impact of LV loads in both strong and weak grid conditions. | Further investigation of the relationship between grid impedance and supraharmonic propagation is needed. |
| [8,52] | Propagation from wind power plants and photovoltaic systems. | Highlights the negative consequences of increased supraharmonics in power systems, including malfunction and failure of control circuits and protection devices, as well as insulation failures in cables and overheating of critical components like capacitor banks and transformers. | The impact of the multiple inverter system has not been provided. Generalisation of results due to variations in inverter technology and settings. |
| [46] | Propagation in low-voltage networks and interactions with nearby devices. | Propagation of supraharmonics towards the grid can vary, which is influenced by the number and type of connected devices and their impedance relative to the grid. | Does not address the long-term effects of supraharmonic emissions on the performance and reliability of various household devices |
| [53] | Propagation and attenuation by examining how supraharmonic currents behave in a low-voltage grid. | The study analyses the interaction between devices, specifically observing phenomena such as “frequency beating” and intermodulation, which can lead to the tripping of residual current devices, to better understand their impact on the grid. | Limited exploration of the broader implications of “frequency beating” and intermodulation interactions on the stability and reliability of the low-voltage grid. |
| [54,55] | Supraharmonic propagation in transformers. | Supraharmonic distortions can propagate through transformers, indicating that some components of the distortions propagate more easily, likely due to resonances. Distributed capacitances and leakage inductance affect the transfer characteristics. | Further investigation is required in this area to understand how transformers behave with increasing supraharmonics content from sources. |
| Method | Measurement Interval () (ms) | Freq. Spectrum Resolution () (Hz) | Analysis Interval |
|---|---|---|---|
| IEC 61000-4-7 | 200 | 5 | = (no gaps/overlap) |
| IEC 61000-4-30 | 0.5 | 2000 | < (with gaps) |
| CISPR 16-1-1 | 20 | 50 | > (with overlap) |
| Ref. | Measurement Method | Principle Operation | Advantages | Limitations |
|---|---|---|---|---|
| [65,68] | Matrix pencil method | Parametric estimation using singular value decomposition on data matrix. | Improved robustness to time-varying signals, high time resolution, effective noise reduction. | Primarily for lab emissions, lack of comprehensive knowledge on performance limits, complex and expensive. |
| [69] | Compressive sensing method | Reconstruction of sparse signals from fewer samples. | Reduced sampling rate, high frequency resolution, availability of various algorithms. | Relies on sparsity, computationally intensive, sensitive to noise. |
| [70,71,72] | Wavelet approach | Wavelet Packet Decomposition (WPD) for time-frequency analysis. | Robust against power frequency deviations, suitable for stationary and non-stationary signals | Coefficients affected by time deviation, choice of wavelet influences results. |
| [73,74] | Subsampling approach | Analogue filter banks to decompose harmonic spectrum with subsampling of sub-bands. | Reduced sampling rate requirements, reduced computational burden | Affected by analogue filter characteristics, requires frequency correction, analogue-to-digital converters may not be optimised for subsampling. |
| [13,61,75] | Quasi-peak (QP)-based methods | RM-A: Adaption of the IEC 61000-4-7 method for CISPR band A with a 20 ms measurement window. Light-QP: Alternative to the CISPR method, which uses the RM-A method to produce RMS values every 20 ms. Statistical QP: Statistical relationship between the RMS and QP values for CISPR Band A | Efficient QP estimation, lower computational burden than CISPR 16 | Primarily focused on QP values. |
| Ref. | Analysis | Contributions | Limitations |
|---|---|---|---|
| [81] | Modelling of Switching frequency emissions from single-phase power electronic converters (PECs). | A numerical case study of a fixed switching frequency converter is presented, demonstrating the application of different modelling approaches, i.e, time domain, frequency domain and hybrid models. | Lack of comprehensive validation procedures for the proposed models, suggesting that further research is required to establish robust methods for validating their accuracy and effectiveness. |
| [82] | Modelling of single-phase EV charger in Simulink environment | Assess cumulative emissions from single-phase EV chargers, extending the aggregation and diversity factors to the supra-harmonic range. | Further research is required to explore the effects of varying power levels among multiple EV chargers. |
| [83] | Modelling of multiple grid-connected VSC systems in MATLAB/Simulink environment. | Proposed model uses voltage sources connected in parallel with LCL filters to characterise switching frequency emissions at individual VSCs and the total supraharmonic current emission flowing into the grid. | Does not address potential mitigation strategies for reducing supraharmonic emissions in grid-connected systems. |
| [84] | Proposed a frequency-domain-based multiparameter model of PE devices. | Provides a methodology for defining accurate frequency-domain simulation models of PE devices through frequency-dependent multiparameter scanning, which allows for the assessment of harmonic contributions under various operating conditions and network impedances. | The accuracy of the simplified equivalent frequency-domain models compared to the EMT simulations in the time domain. |
| [85,86,87,88,89,90,91,92] | Improving solar PV inverter models | Adding a virtual admittance to the system via modification of the current control loop. Improvement of PV controller with a simplified dq controller, proposing not to obtain orthogonal current components. Application of virtual inertia by adjusting phase locked loop (PLL) parameters. | Accuracy of harmonic models for high-frequency harmonic analysis. |
| Ref. | Analysis | Contributions | Limitations |
|---|---|---|---|
| [94] | Passive filters | Impact of passive filters installed close to the source of harmonic emitter to trap the harmonic currents at the source and reduce propagation to the grid. | Introducing the resonance phenomenon, interacting capacitors of the passive filters with network inductances. |
| [95] | Active filtering techniques | Injection of harmonic currents into the system that are equivalent to the harmonic currents caused by harmonic emitters, but of opposite polarity to restore the sinusoidal waveform. Different control methods deployed in active filters, i.e, fuzzy logic, neural network and model predictive. | Costly compared to conventional passive filters. |
| [25,26] | Random PWM generation | Supraharmonic reduction by spreading the spectrum of the emission in a randomised manner. Uses random-pulse position modulation, which is similar to conventional PWM control with constant switching frequency; however, the pulse is randomly positioned during the switching period. A pseudo-random carrier that randomly combines two triangular carriers (both of the same frequency and opposite in phase) is proposed to produce randomness. The randomly selected “low” or “high” carrier is used to generate pseudo-random frequency carrier waveforms to generate PWM. | Further research is required for a better understanding of the interactive coupling mechanism of supraharmonics among converters. |
| [96,97,98,99] | Multi-level converters | Reduction of supraharmonic emissions from PE converters with the proper technology. Multi-carrier based PWM uses several triangular carrier signals to reduce output voltage harmonic content. Phase Shifted PWM is the most commonly used technique in Flying Capacitor & Cascaded H Bridge converters, which enables a reduction in switching frequency components and improved THD. Level-shifted PWM is widely used in neutral point clamped converters, which leads to less distorted line voltages but high harmonic content in input current. | Traditional assessments have been made for line-commutated converters, while self-commutated converters can generate significantly higher frequencies. Relevant technology to be deployed with the understanding of the correct usage of the converter. |
| Ref. | Analysis | Contributions |
|---|---|---|
| [100] | Understanding the harmonic behaviour of a grid-tied rooftop solar PV system based on measurements. | There are three harmonic current emission bands present within the frequency spectrum up to 20 kHz: 1. Low-frequency band in the 0–2 kHz range; 2. Broadband high-frequency band in the 2–5 kHz range due to the resonance introduced by the front-end filter of the inverter; 3. Narrowband high-frequency band near 16 kHz due to the switching frequency of the inverters considered. It has been identified that the inverter current comprises two components, called the circulation current component and the grid current component. General mathematical expressions for harmonic currents were derived for a system consisting of multiple inverters connected in parallel. |
| [101] | Proposes three methods to represent the phase angle for grouped supraharmonic emissions that assist in understanding their diversity. | Out of existing high-frequency harmonic measurement techniques, the IEC 61000-4-7 method, which provides phase angle information, is used to investigate the applicability of the summation law for high-frequency harmonic emissions. Results show that resonance emissions align in phase, allowing for simple addition. In contrast, switching frequency emissions are spread across the phase diagram, indicating phase diversity and cancellation. |
| [102] | Characterisation of harmonic resonance phenomenon of multi-parallel PV inverter systems | Presents the solar PV inverter modelling aspects considering the resonance impact, where a mathematical approach is presented to understand the resonant frequency variation within a system as the number of inverters changes. The characteristics were verified with the MATLAB/Simulink inverter model for both LCL and LC filter types. |
| [103] | Reduction of supraharmonic emissions in solar PV inverters via coordinated carrier waveform-based PWM technique | Developed a generic solar PV inverter model to characterise supraharmonic emissions corresponding to the switching frequency of PWM signals. The PV inverters were modelled using the most common voltage-oriented control under a synchronous reference frame in the MATLAB/Simulink software environment. The impact of carrier waveform phase shift has been evaluated as a technique for mitigating these switching-related emissions when multiple similar inverters are installed together, as in solar farms or larger commercial installations. |
Disclaimer/Publisher’s Note: The statements, opinions and data contained in all publications are solely those of the individual author(s) and contributor(s) and not of MDPI and/or the editor(s). MDPI and/or the editor(s) disclaim responsibility for any injury to people or property resulting from any ideas, methods, instructions or products referred to in the content. |
© 2025 by the authors. Licensee MDPI, Basel, Switzerland. This article is an open access article distributed under the terms and conditions of the Creative Commons Attribution (CC BY) license (https://creativecommons.org/licenses/by/4.0/).
Share and Cite
Peiris, K.; Elphick, S.; Robinson, D. Characterising Non-Intentional Supraharmonic Emissions from Inverters in Power Grids: Review and Challenges. Energies 2025, 18, 2980. https://doi.org/10.3390/en18112980
Peiris K, Elphick S, Robinson D. Characterising Non-Intentional Supraharmonic Emissions from Inverters in Power Grids: Review and Challenges. Energies. 2025; 18(11):2980. https://doi.org/10.3390/en18112980
Chicago/Turabian StylePeiris, Kasun, Sean Elphick, and Duane Robinson. 2025. "Characterising Non-Intentional Supraharmonic Emissions from Inverters in Power Grids: Review and Challenges" Energies 18, no. 11: 2980. https://doi.org/10.3390/en18112980
APA StylePeiris, K., Elphick, S., & Robinson, D. (2025). Characterising Non-Intentional Supraharmonic Emissions from Inverters in Power Grids: Review and Challenges. Energies, 18(11), 2980. https://doi.org/10.3390/en18112980