4.1. System Parameterization
Based on the dynamic simulation model of the LCES constructed by MATLAB/Simulink, the operating parameters of the 10 MW-class LCES are configured. The basic parameters of the system in the storage phase and the energy release phase are designed as shown in
Table 1, based on which the design work analysis and perturbation analysis are carried out.
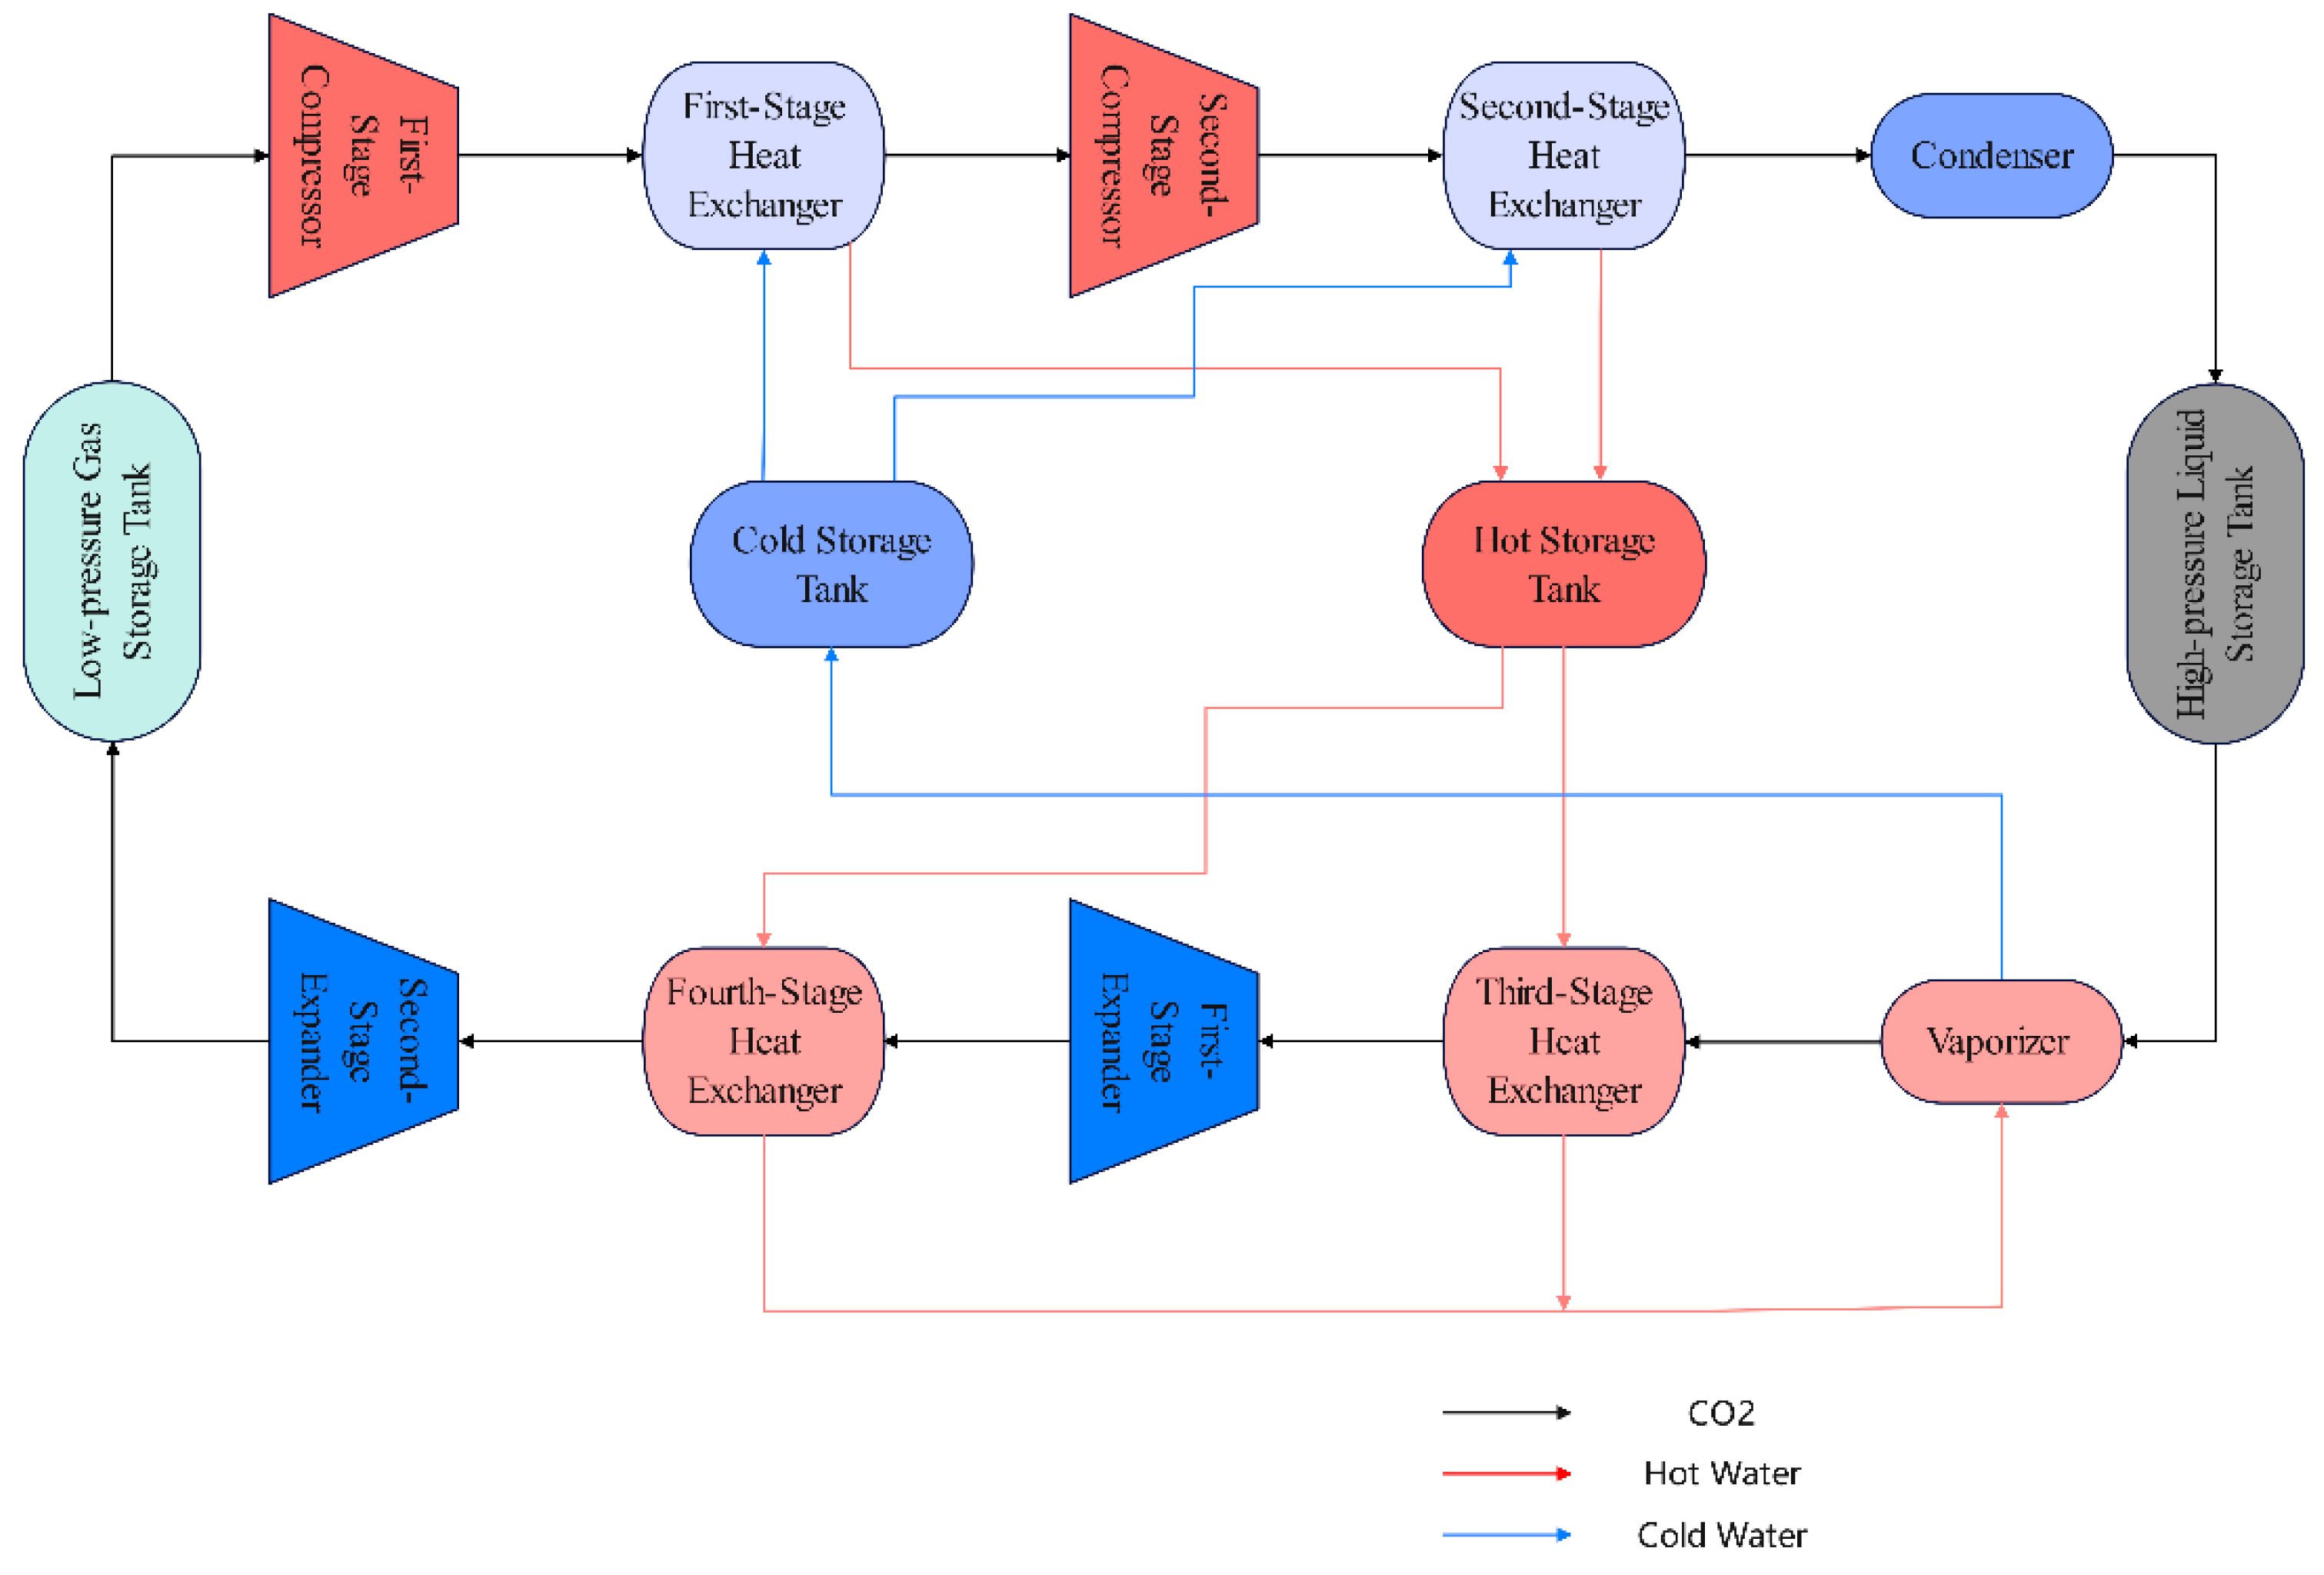
We set the heat exchange to medium as the high-pressure liquid water, hot storage tank, and high-pressure liquid storage tank are adiabatic; the cold storage tank and low-pressure gas storage tank exist; and in the heat exchange environment, after a period of time, the temperature inside the tank will gradually drop to the design temperature. The cold-storage-tank and low-pressure gaseous-tank energy storage and energy release stages are not carried out at the same time; after the operation of the energy storage stage, the cold storage tank, hot storage tank, low-pressure gas storage tank, and high-pressure liquid storage tank state data are synchronized to the energy release stage.
4.2. Design Condition Analysis
After the design of the basic parameters of the system, to ensure that the release of energy stages of the two expansions are of equal power output, and a total power of 10 MW, we carry out hot and cold load matching and debugging for the CO2 system and the mass flow of the heat transfer medium.
After debugging, the mass flow rates of the CO2 outlet of the low-pressure gas storage tank and the CO2 outlet of the high-pressure liquid storage tank are 42 kg/s, and the mass flow rates of the inlet and outlet of the cold storage tank and hot storage tank are 20.2 kg/s. In order to satisfy the heat demand of heating CO2 at the energy releasing stage, the mass flow rates of the inlet of the medium of the first-stage and second-stage heat exchangers are 9.2 kg/s and 11 kg/s, respectively; the outlet temperatures of the media of the two stages are 470.64 K and 470.17 K, respectively; and the medium temperature in the hot storage tank is 470.38 K after mixing. The outlet temperatures of the media are 470.64 K and 470.17 K, respectively, and the temperature of the medium entering the hot storage tank after mixing is 470.38 K. In order to satisfy the heat demand of the operational expander power and the vaporizer in vaporizing CO2, the mass flow rates of the media imported into the third-stage and fourth-stage heat exchangers are 15.17 kg/s and 5.03 kg/s, respectively, and the outlet temperatures of the two stages of the medium after heat exchanging are 351.54 K and 351.82 K, respectively. The temperature of the medium entering the vaporizer after mixing is 351.61 K.
After constructing the dynamic simulation model of the system and setting the system parameters in MATLAB/Simulink, the simulation is carried out under design conditions, and the simulation times of the energy storage and energy release phase are 1 h (3600 s) each. First, the energy storage system experiences compression for 1 h; then, the compression phase stops; and then, the operating parameters of the compression devices are input into the energy release system to experience the expansion for 1 h.
Figure 5 and
Figure 6 show the simulation results of the energy storage and energy release phases of the 10 MW-class LCES.
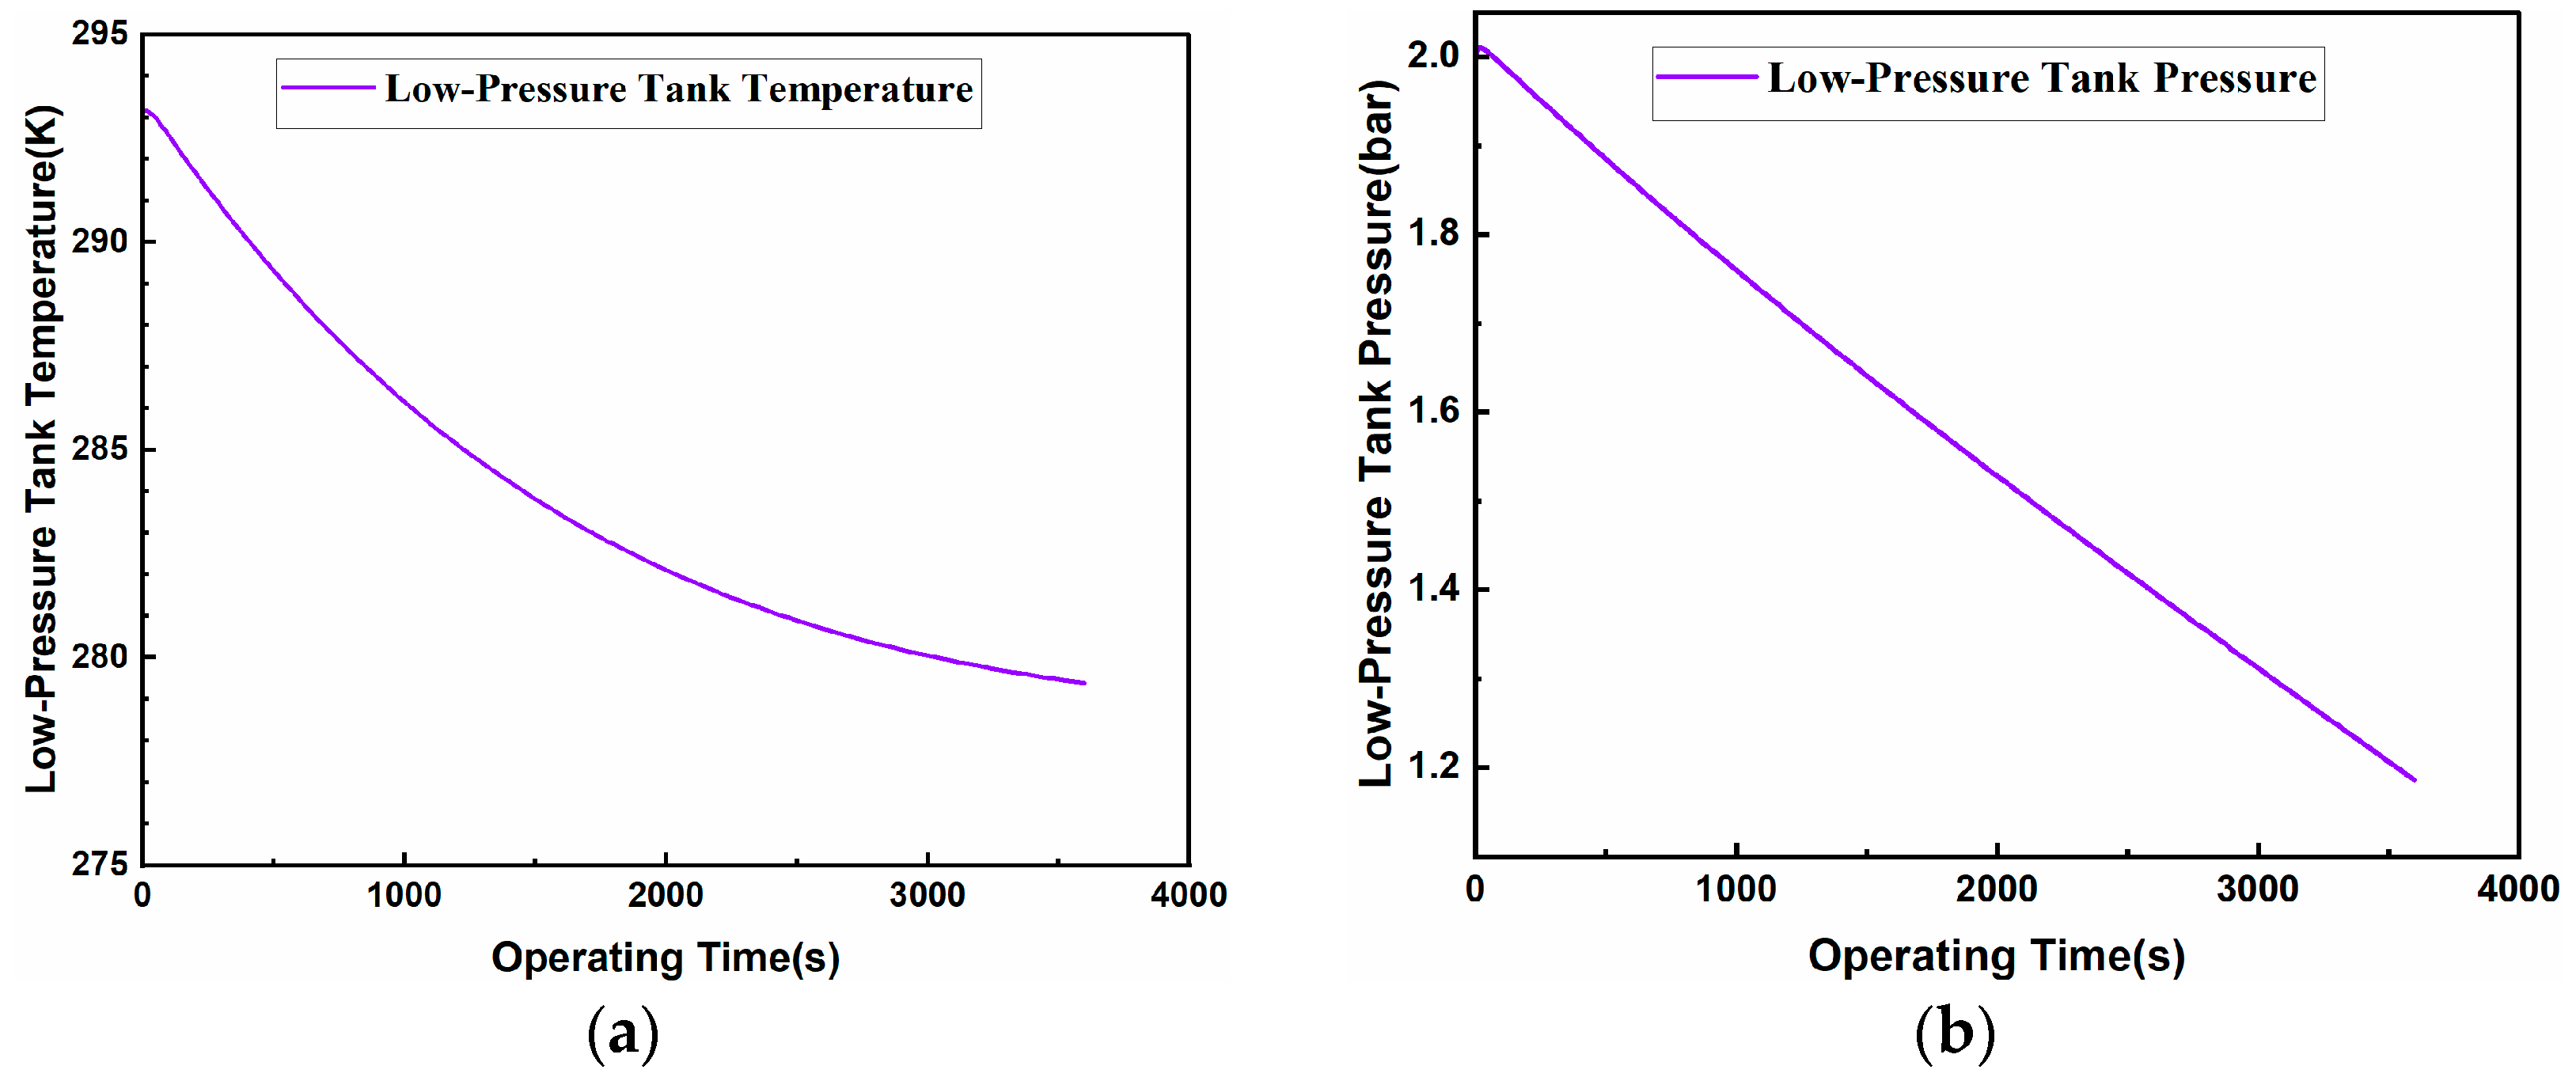
4.2.1. Energy Storage Stage
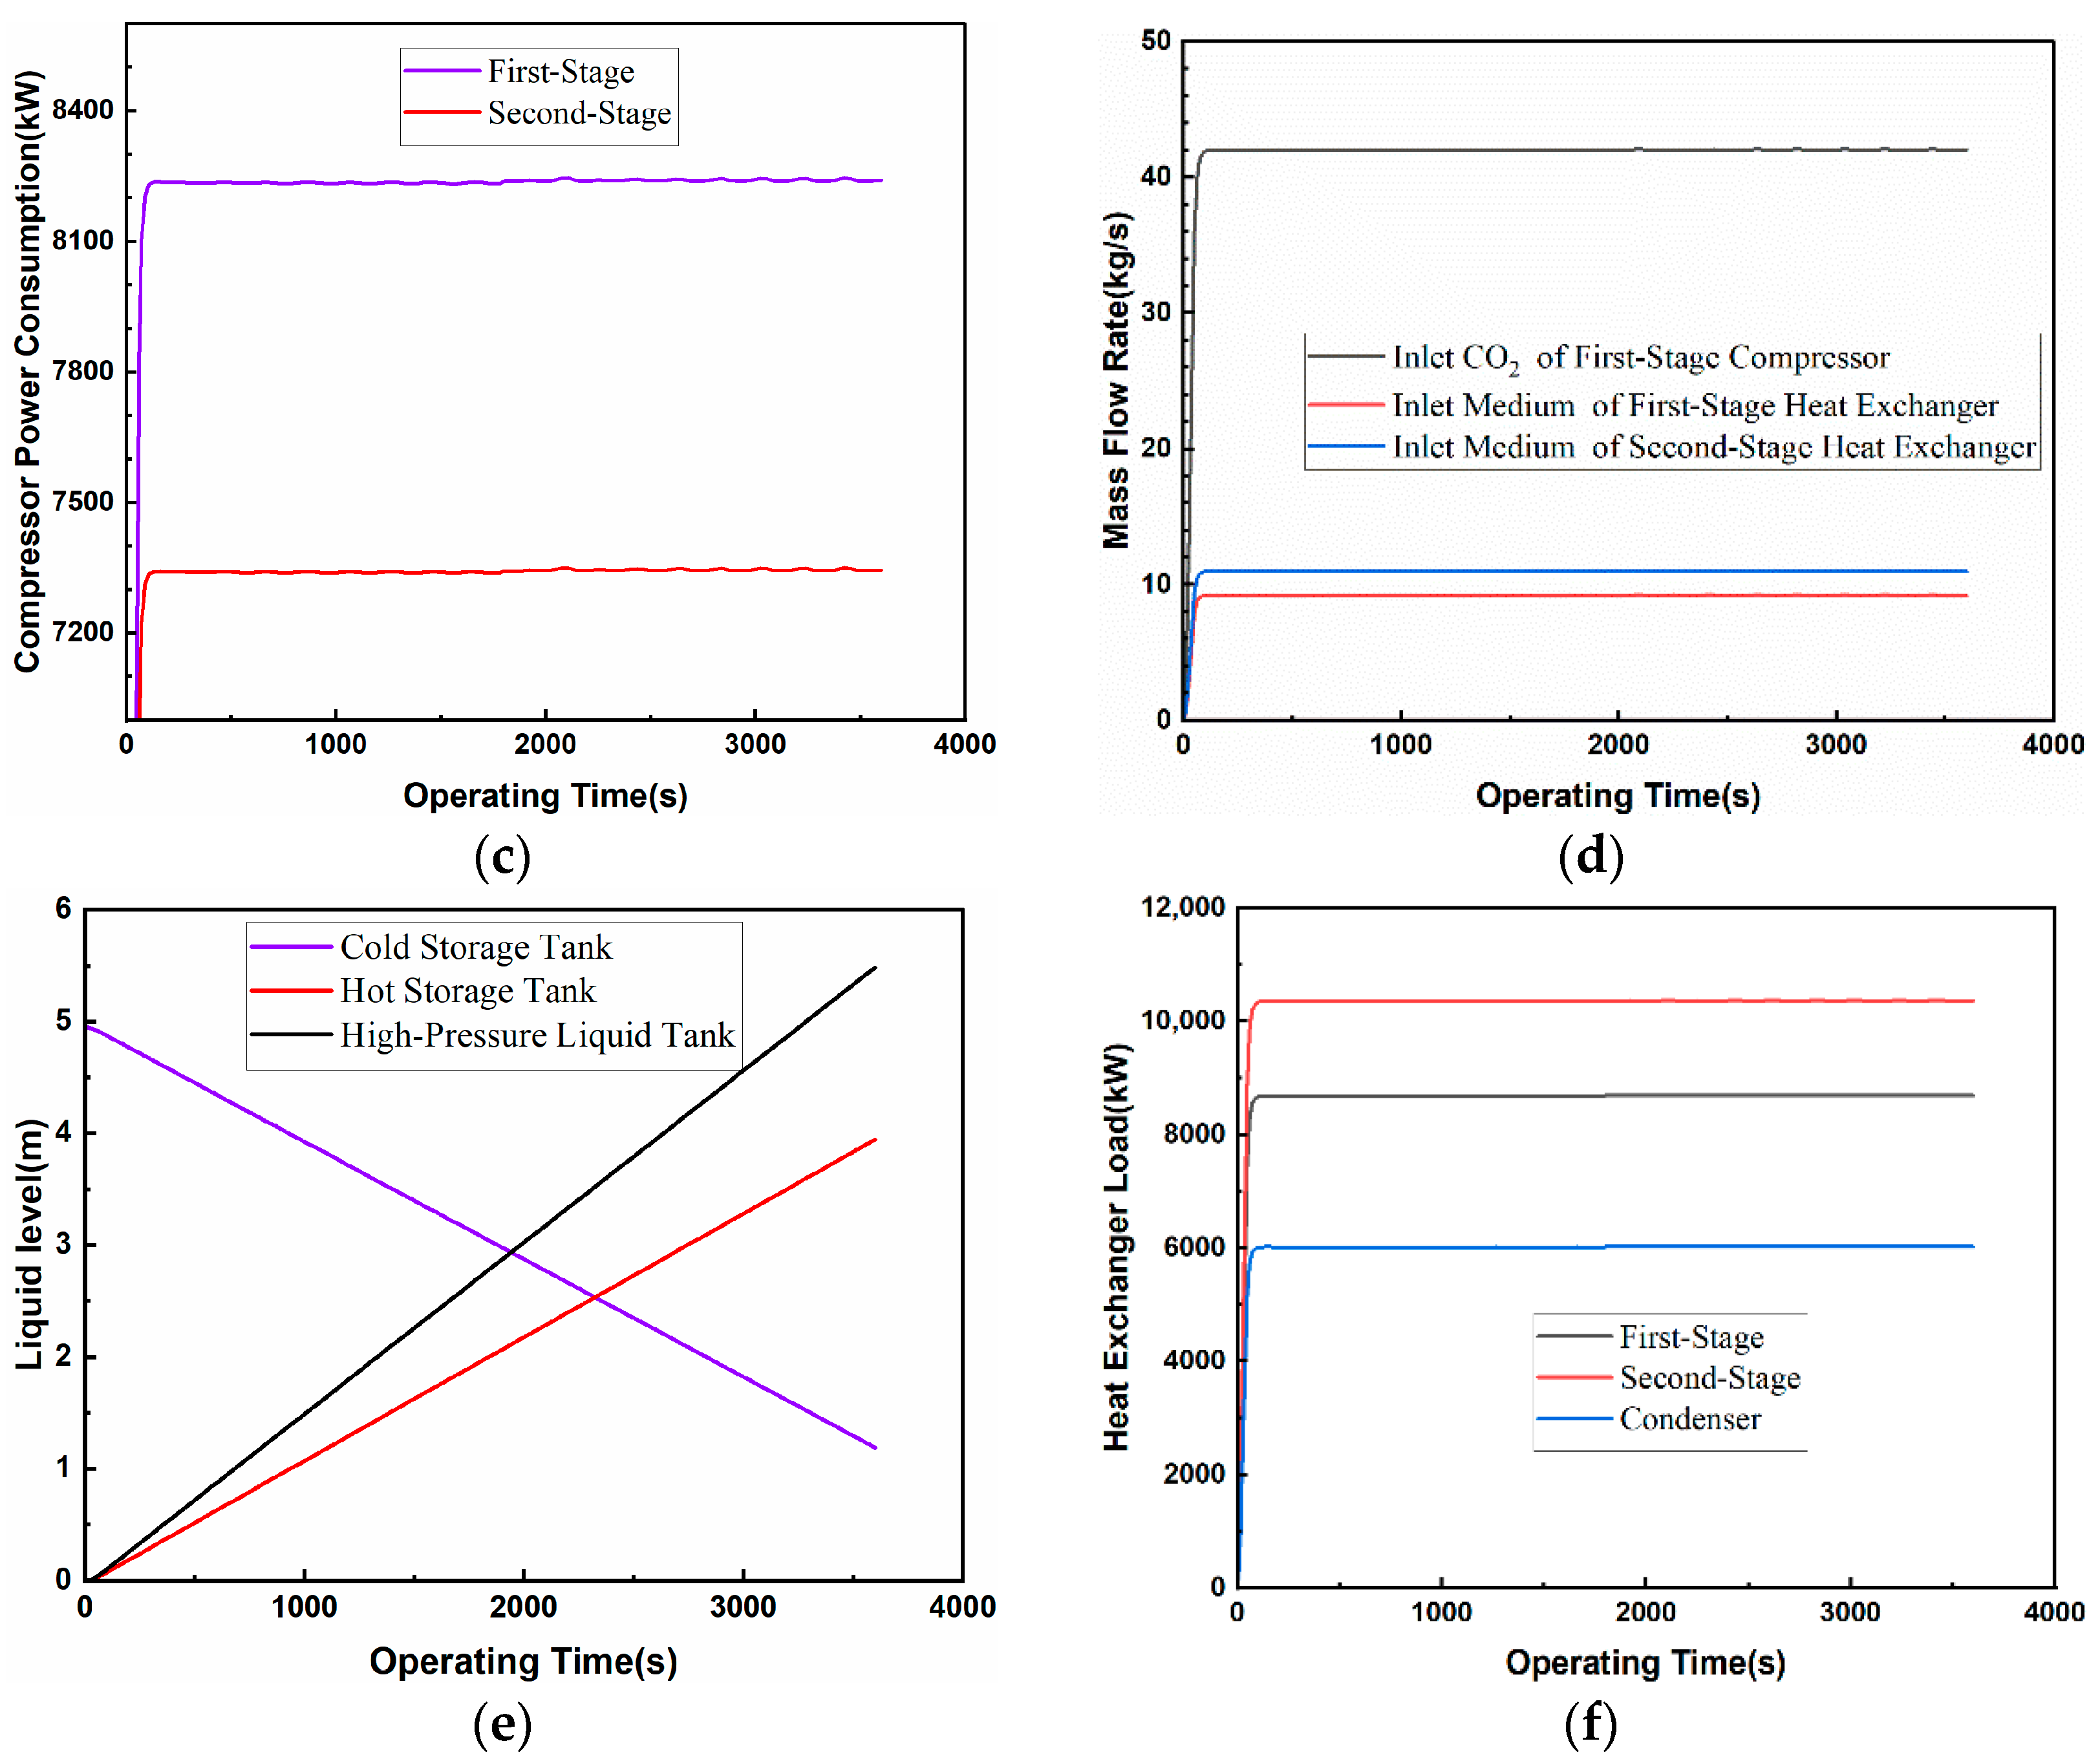
The operating parameters for each piece of equipment in the energy storage stage are shown in
Figure 5. A pressure stabilizer is installed at the rear side of the low-pressure gas storage tank so that the temperature and pressure of the CO
2 outlet from the low-pressure gas storage tank are kept at 273.15 K and 1 bar, respectively, which can cause the inlet temperature and pressure of the first-stage compressor to remain unchanged, and because the pressure ratio of the first stage is fixed, the temperature and pressure of the outlet of the first-stage compressor are kept constant. The compressor inlet mass flow rate is stabilized at 42 kg/s after climbing, and the power consumption of the first-stage compressor gradually rises to, and is maintained at, 8237.39 kW. The low-pressure gas storage tank with the CO
2 discharged at constant pressure and temperature; the temperature and pressure in the low-pressure gas storage tank gradually fell; and after 1 h, the temperature and pressure of the gas storage tank fell to 279.38 K and 1.18 bar respectively. The high-pressure after pressure boosting and cooling liquid CO
2 flows into the high-pressure liquid storage tank, after 1 h, the liquid level in the high-pressure liquid storage tank is maintained at 5.48 m. In 1 h, there is enough cold storage medium in the cold storage tank, which can cause the temperature and pressure drop of CO
2 at the outlet of the heat exchanger to be maintained at the set value. Because the second stage of the pressure ratio is fixed, the temperature and pressure at the outlet of the first-stage compressor are maintained at a constant level, and the second stage of the compressor is gradually increased to, and maintained at, 7342.58 kW. The liquid level in the cold storage tank is reduced from 4.95 m to 1.18 bar. The liquid level decreased from 4.95 m to 1.19 m, and due to the slight change in the density of the heat transfer medium, the liquid level in the hot storage tank increased from 0 to 3.95 m, and the temperature was maintained at 470.39 K. The electrical energy is stored in the form of thermal and potential energy in the hot storage tank and the high-pressure liquid storage tank, respectively.
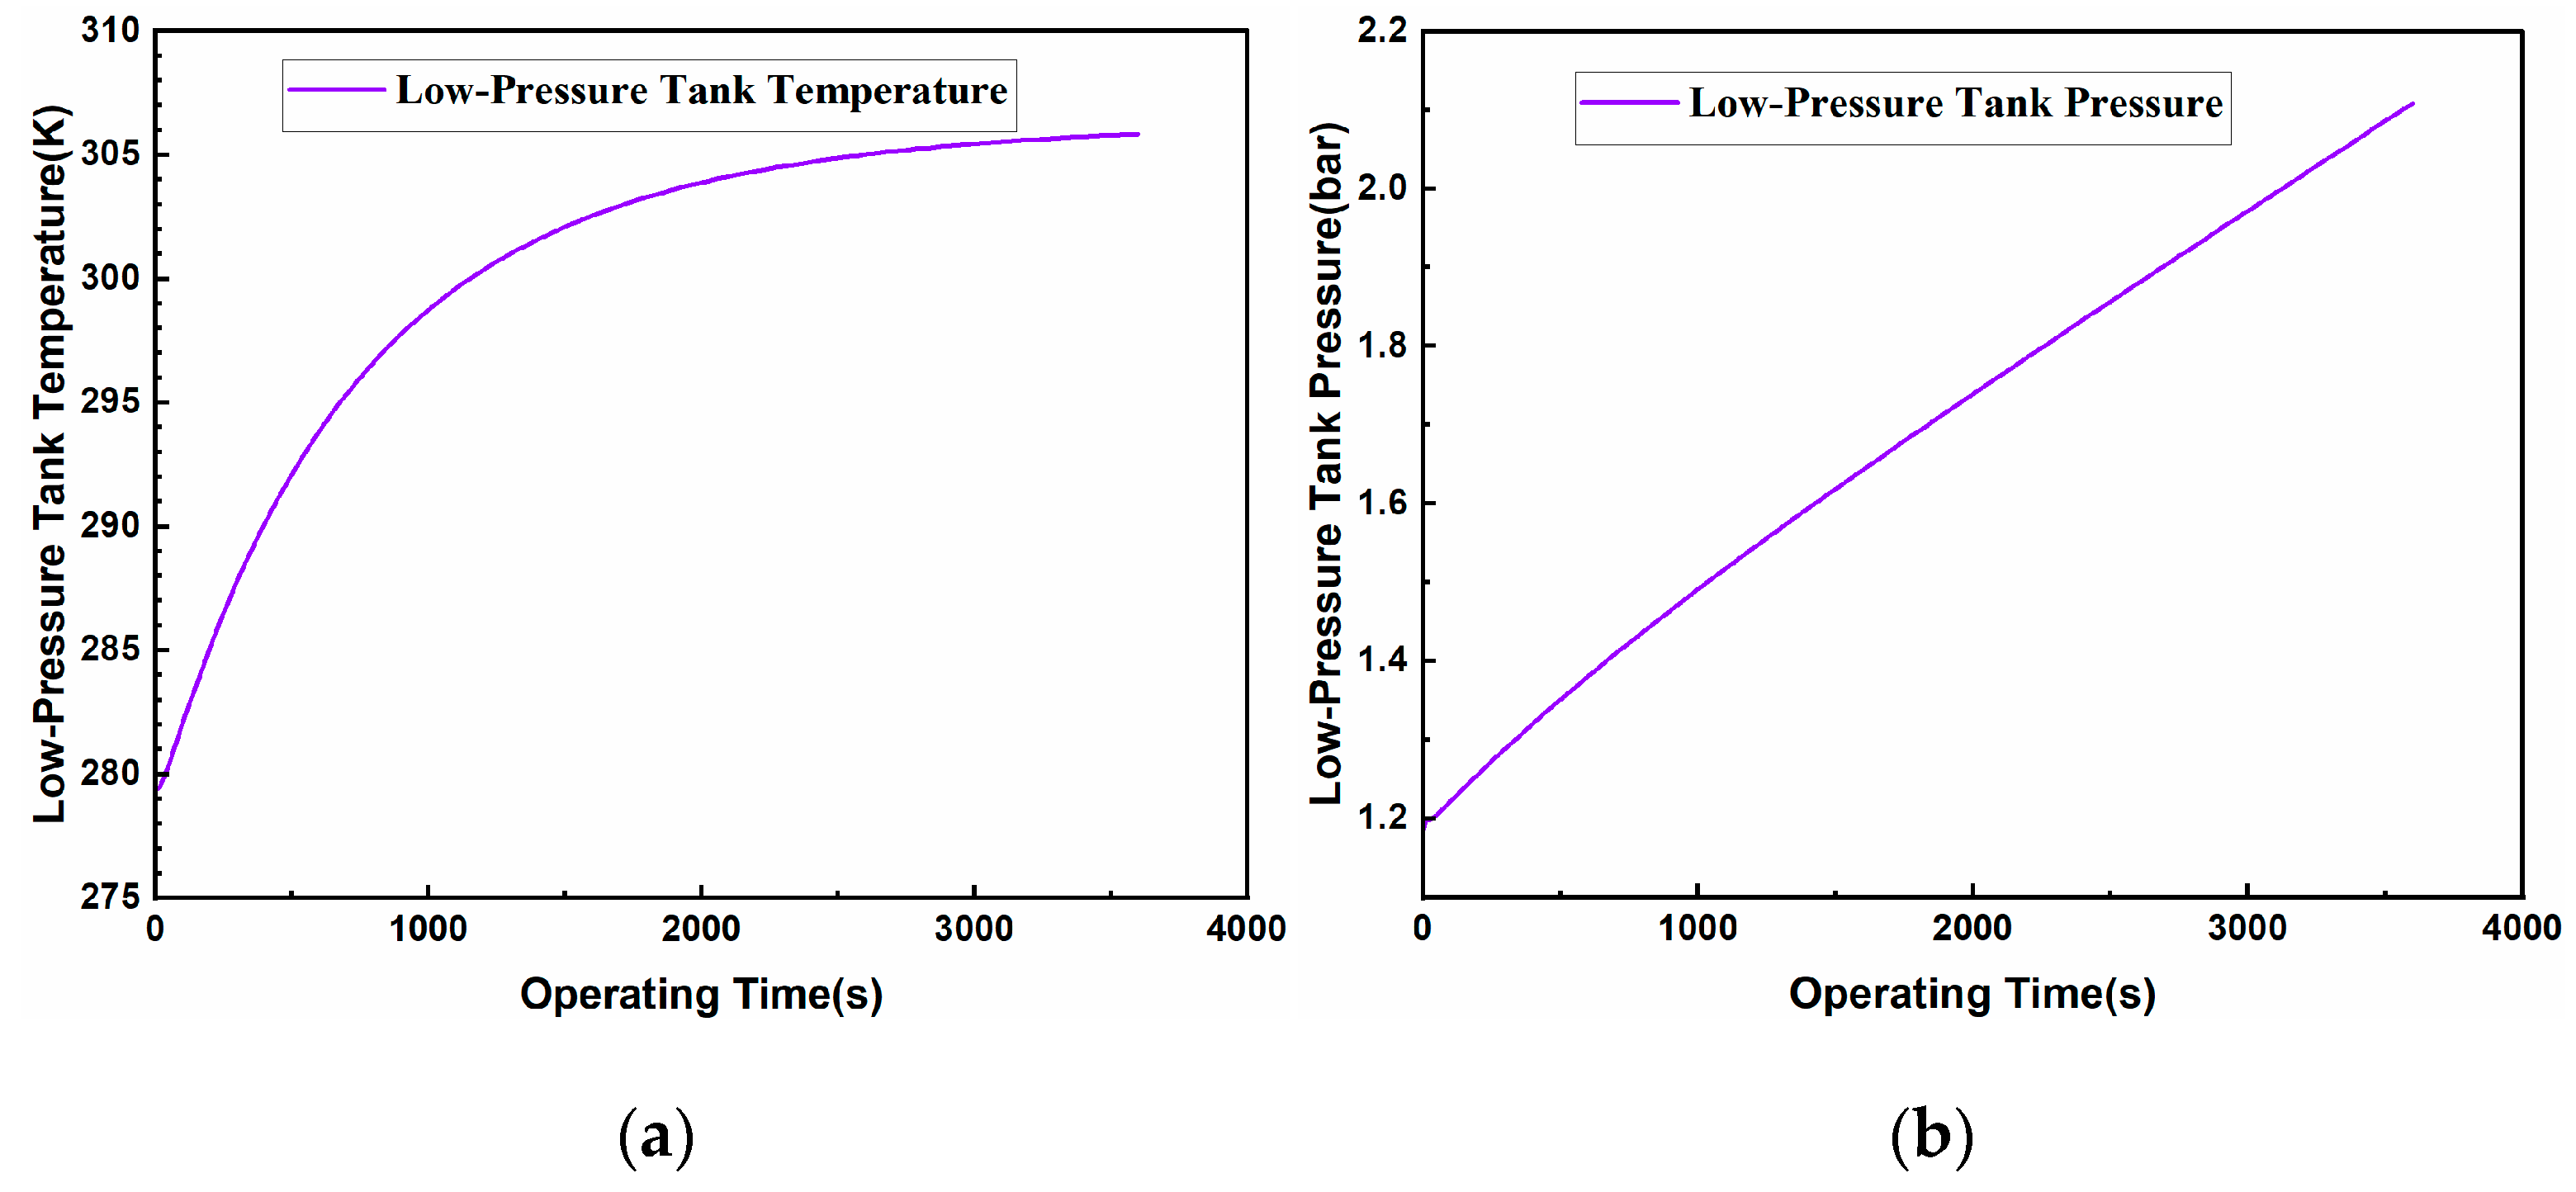
4.2.2. Energy Release Phase
As can be seen from
Figure 6, similar to the compression stage, in the expansion stage, because the temperature and pressure of the liquid CO
2 at the outlet of the high-pressure liquid storage tank remain constant, and because at the same time, the high-temperature medium stored in the hot storage tank is just enough for the heat exchanger to vaporize and heat the CO
2 for use during a period of 1 h, the expander is also operated in a fixed-pressure ratio, and the inlet mass flow rate of the expander is stabilized at 42 kg/s after climbing, so for the first- and second-stage expander, after 1 h, the liquid level in the hot storage tank drops to 0 from 3.95 m at the end of the compression stage, and the liquid level in the cold storage tank rises to 4.95 m from 1.19 m at the end of the compression stage, which is a slight increase compared with the initial level because of the decrease in the pressure and the increase in the temperature of the cooling water after the heat exchanger, which leads to a change in the density of the water. This is because the density of the cooling water after heat exchange is reduced in pressure and increased in temperature. In fact, after the heat exchange of the cooling water re-pumped through the liquid pump into the cold storage tank, the pressure of the cooling water will rise from 18.5 bar to 20 bar, and for 1.19 m of 293.15 K cooling water mixed with 306.86 K cooling water, although the temperature will rise for a short period of time, after a period of time, in the environment of the medium in the tank after the natural cooling process, the temperature will be reduced again to 293.15 K. The gaseous CO
2 expanded by the second-stage expander is filled into the low-pressure storage tank again, and the temperature and pressure of the CO
2 in the storage tank will increase from 279.38 K and 1.18 bar at the end of the compression stage to 305.83 K and 2.11 bar. The RTE of the system is calculated to be 65.3%, and the energy density of the system is 34.79 kW·h·m
−3. In comparing the system’s RTE (65.3%) with similar LCES studies, we note that Zheng [
21] reported 56.12% efficiency for a liquid CO
2 energy storage system based on two-stage cold and heat storage, while Wan [
22] achieved 61.83% efficiency in a liquid carbon dioxide energy storage system, validating our design’s competitiveness.
The simulation results show that the modular dynamic simulation model proposed in this paper can effectively characterize the dynamic properties of multi-physical parameters in the system compared with the traditional thermodynamic steady-state model. Through subsystem-level dynamic characterization, this model can accurately capture the transient response behavior of energy transfer during the energy storage/release process, providing a quantitative analysis tool for the study of dynamic system characteristics.
4.3. System Perturbation Analysis
System perturbation analysis is performed after the system design condition analysis to explore the effect of key parameters on the system, assuming that the system energy storage flow rate is the same as the energy release flow rate, and that the energy storage time and energy release time are both 1 h.
In the energy storage stage, to ensure that the outlet pressure and temperature of the medium in the cold storage tank, the isentropic efficiency and outlet pressure of the compressors at all levels, and the pressure drop of CO2 at all levels of the heat exchanger to maintain the design conditions, the values of the inlet temperature, pressure, and mass flow rate of the compressor under design conditions are maintained at 0~1200 s and 2400~3600 s. In 1200~2400 s, the inlet temperature of the first-stage compressor was changed from 293.15 K to 283.15~303.15 K, the inlet mass flow rate of the first-stage compressor was changed from 42 kg/s to 29.4~54.6 kg/s, and the inlet pressure of the first-stage compressor was changed from 1 bar to 0.5~1.5 bar. Through the automatic adjustment of the valve of the cold storage tank, the outlet temperatures of the medium of the first- and second-stage heat exchangers are maintained at design conditions of 470.65 K and 470.17 K, and the mass flow rate of the medium at the outlet of the cold storage tank is dynamically changed. The parameters of the system are changed as follows.
In the energy release stage, to ensure that the outlet pressure and temperature of the hot storage tank medium, the isentropic efficiency, the outlet pressure of all levels of the expander, and the CO2 pressure drop of all levels of the heat exchanger are maintained at the design condition, the values of the expander inlet temperature and mass flow rate are maintained at the design condition in the range of 0~1200 s and 2400~3600 s. In 1200~2400 s, the mass flow rate at the inlet of the first-stage expander is changed from 42 kg/s to 29.4~54.6 kg/s. The mass flow rate at the inlet of the first-stage expander is changed from 42 kg/s to 29.4~54.6 kg/s. Through the automatic adjustment of the hot storage tank valve to ensure that the third-stage and fourth-stage heat exchanger medium outlet temperatures are maintained at the design conditions of 351.54 K and 351.83 K such that the vaporizer has enough heat to vaporize the liquid CO2 in the outlet of the high-pressure tank, the mass flow rate of the medium in the outlet of the hot storage tank changes dynamically, and the changes in the various parameters of the system are as follows.
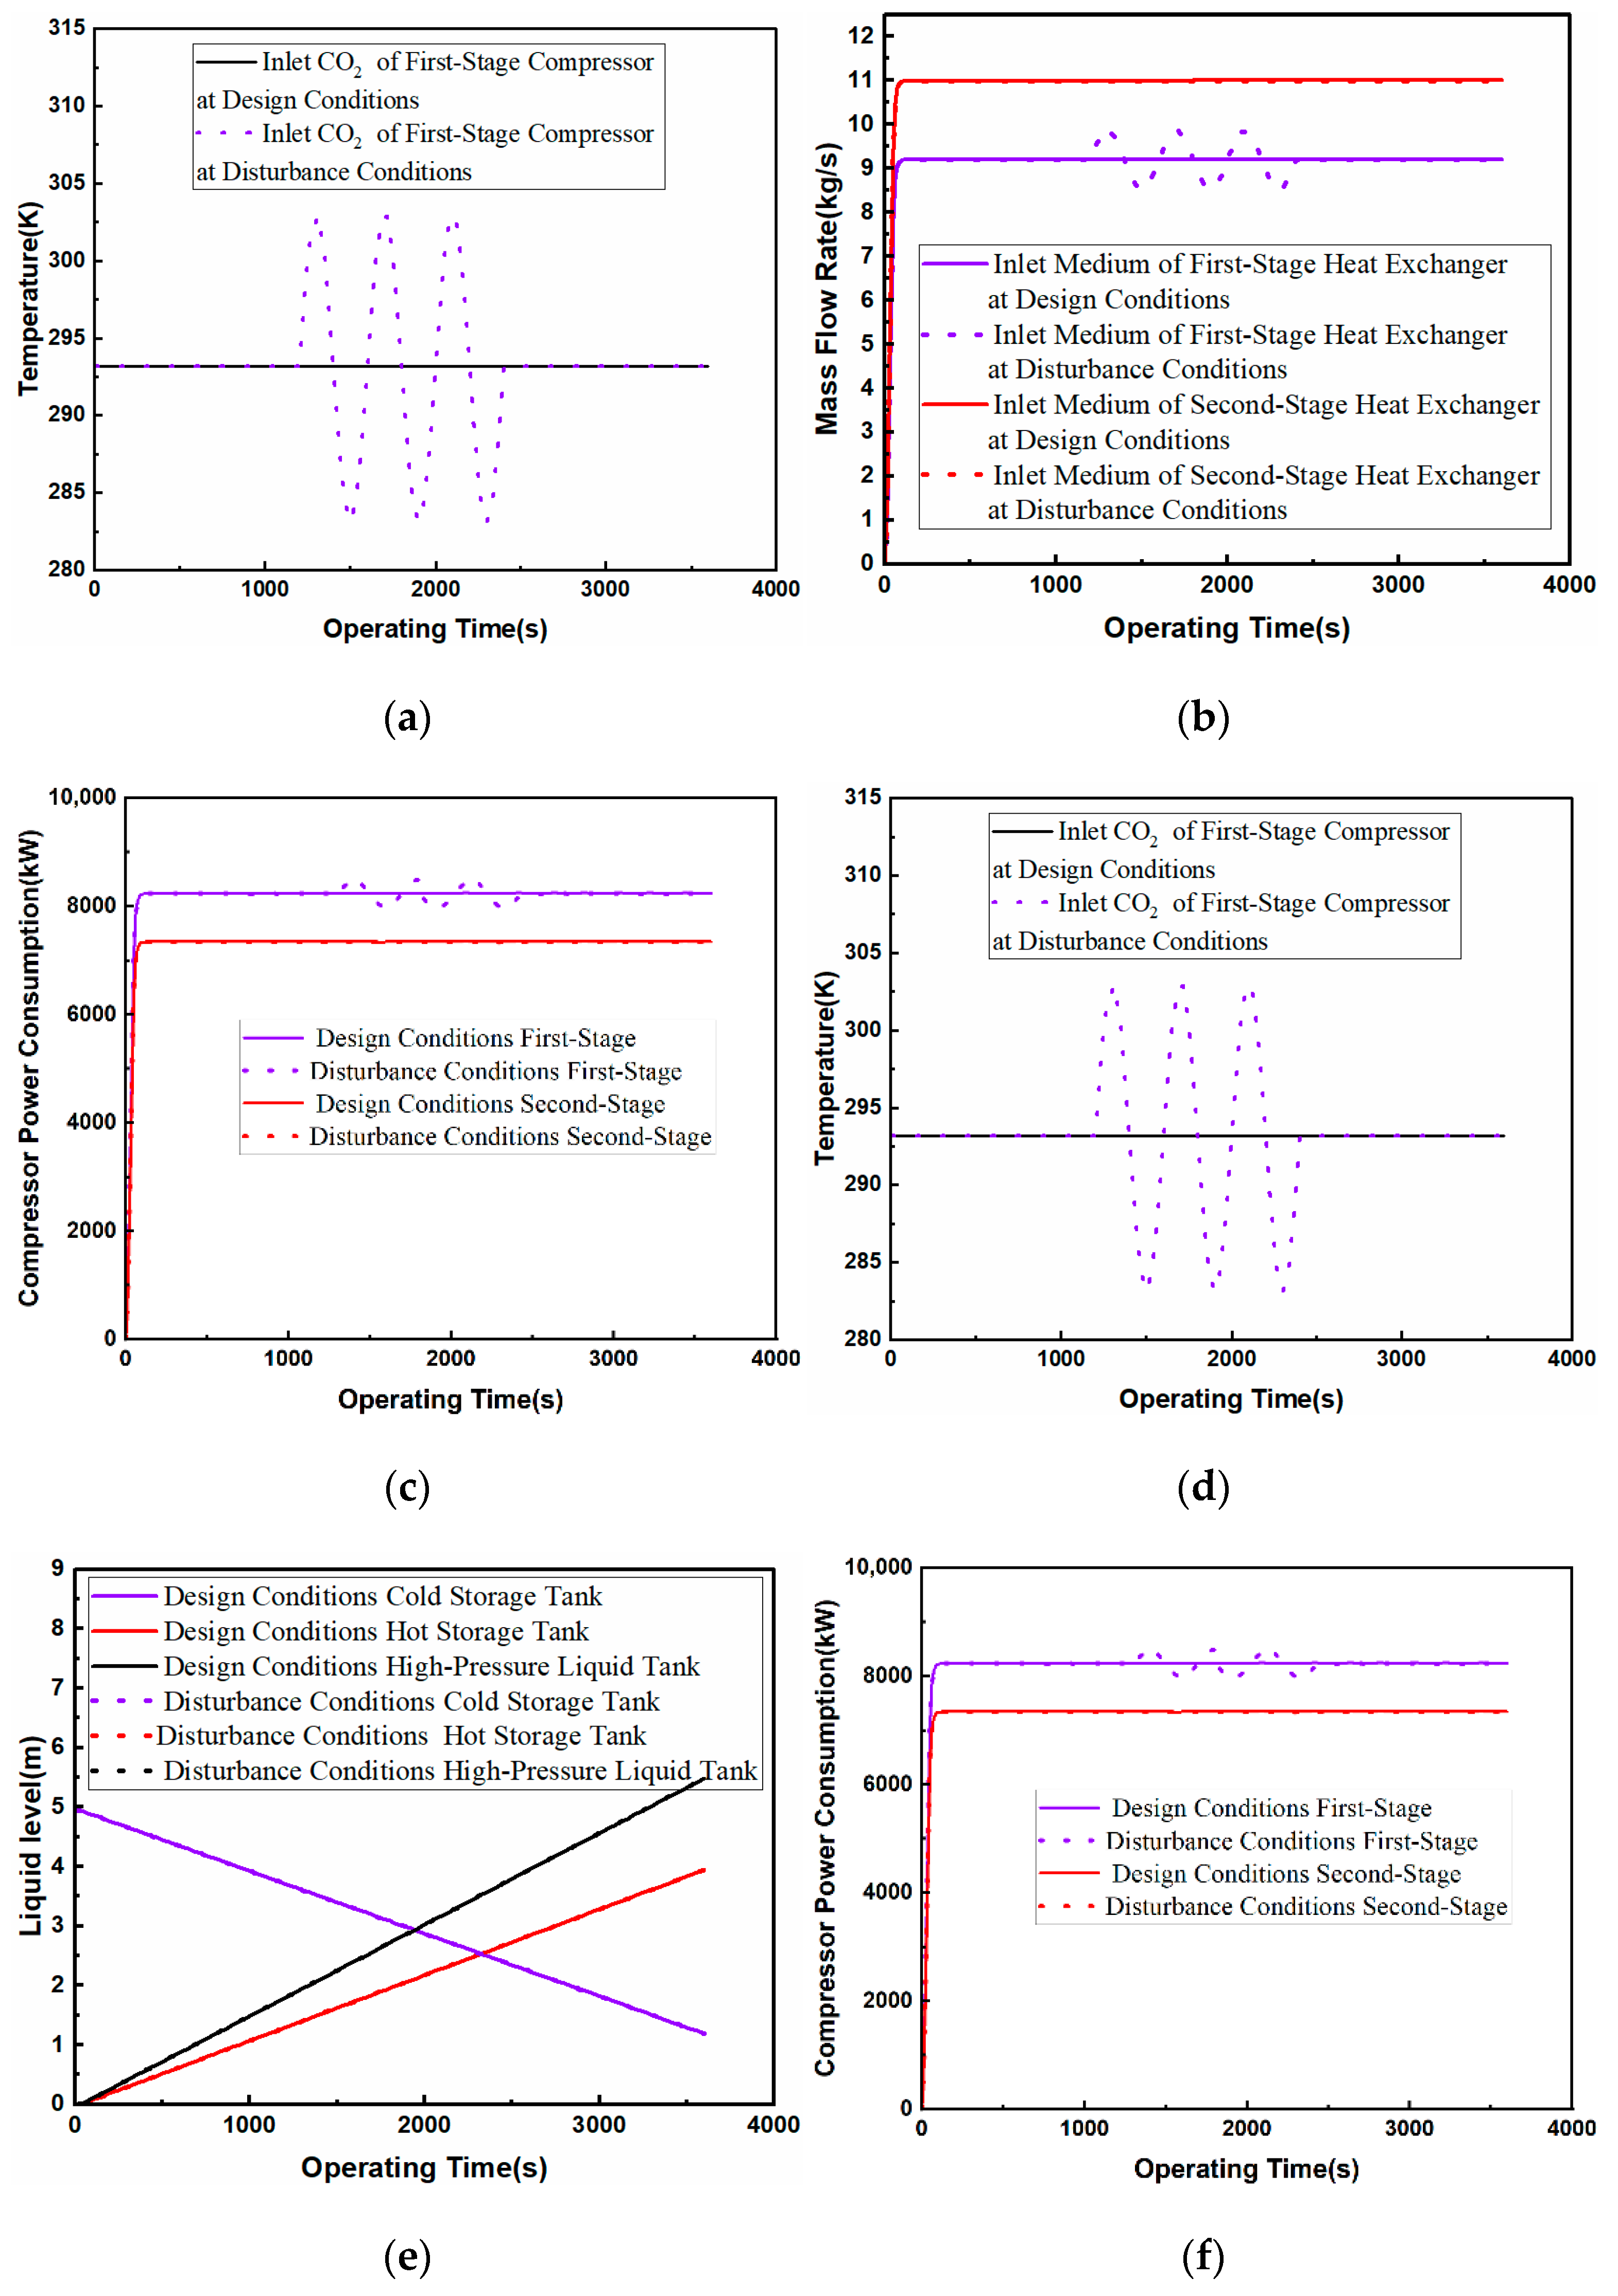
4.3.1. Effect of Compressor Inlet Temperature on the System
The effect of compressor inlet temperature perturbation on the system is shown in
Figure 7. During the dynamic operation of the system, when the inlet temperature of the first-stage compressor is perturbed in the range of 283.15~303.15 K within 1200~2400 s, the outlet temperature of the first-stage compressor is gradually synchronized with the change, resulting in a cycle change in the first-stage compressor power dissipation of 7977.49~8484.47 kW, which is equivalent to 96.84~102.99% under design working conditions. As the CO
2 temperature at the inlet of the first-stage heat exchanger changes synchronously from 510.39 K to 539.2 K, the mass flow rate of the medium at the outlet of the cold storage tank rises from 9.2 kg/s at the design condition to the maximum of 9.86 kg/s, which cause the outlet temperature of the medium at the first-stage heat exchanger to be maintained at 470.65 K so as to ensure that there is sufficient heat to heat CO
2 at the energy releasing stage. At the same time, the inlet temperature of the second-stage compressor is exchanged to 313.15 K at the design condition such that the power consumption of the second-stage compressor and the mass flow rate of the medium in and out of the second-stage heat exchanger remain unchanged.
Although the first-stage and second-stage heat exchanger medium outlet temperature and the second-stage heat exchanger import and export medium mass flow rate are unchanged, due to perturbation of the first-stage heat exchanger import and export mass flow rate, the total mass flow rate changes from 20.2 kg/s to the interval of 19.52~20.86 kg/s such that for the temperature of the hot storage tank in 1200~2400 s, there are small changes in the heat exchanger load in the first-stage heat exchanger at the first level. The heat transfer load of the first-stage heat exchanger is disturbed, and the heat transfer load of the second-stage heat exchanger and condenser remains unchanged. Since the total mass flow rate at the outlet of the cold storage tank does not have a large variation range, the level changes in the cold storage tank, the hot storage tank, and the high-pressure liquid tank are not obvious. This study shows that increasing the compressor inlet temperature will increase the heat of the compression by affecting the mass flow rate of the heat transfer medium, thus prolonging the time of energy release, but it will also cause the compressor power consumption to increase, and it is necessary to take into account the power and time of energy release to reasonably regulate the temperature of compressor inlet CO2.
4.3.2. Effect of Compressor Inlet Pressure on the System
The effect of compressor inlet pressure perturbation on the system is shown in
Figure 8. During the dynamic operation of the system, when the inlet pressure of the first-stage compressor varies in the interval of 0.5 bar to 1.5 bar during 1200~2400 s, the pressure ratio of the first-stage compressor changes from a fixed value of 10 to a variable value in the interval of 6.67~20 because the outlet pressure of the first-stage compressor is kept constant, resulting in the power consumption of the first-stage compressor changing in the range of 6481.83 kW to 11,679.55 kW. The outlet temperature of the first-stage compressor varies from 474.85 K to 623.49 K, and the trend is the opposite to that of the inlet pressure of the first-stage compressor. Due to the change in CO
2 temperature at the inlet of the first-stage heat exchanger, the mass flow rate of the medium 1 at the outlet of the cold storage tank also changes synchronously in the range of 6.91~13.88 kg/s, and the trend of change is the opposite to that of the inlet pressure of the first-stage compressor so as to maintain the outlet temperature of the medium of the first-stage heat exchanger in the range of 470.65 K, which ensures that there is sufficient heat to heat CO
2 at the energy release stage. At the same time, the inlet temperature of the second-stage compressor is exchanged for design working conditions value, so the power consumption of the second-stage compressor and the mass flow rate of the second-stage heat exchanger inlet medium remain unchanged.
The first and second heat exchanger medium outlet temperature and the second heat exchanger import and export medium mass flow rates are unchanged, but due to perturbation of the first-stage heat exchanger import and export mass flow rate, the total mass flow rate changes from 20.2 kg/s to the interval of 17.9~24.87 kg/s, so the temperature of the hot storage tank in 1200~2400 s. The heat transfer load of the second-stage heat exchanger and condenser remains unchanged. As the total mass flow rate at the outlet of the cold storage tank varies more than 20% under design conditions, and the mass flow rate at the inlet of the compressor stabilizes and remains unchanged, the rate of liquid level change in the cold storage tank and the hot storage tank changes, and the liquid level change in the high-pressure liquid tank is not obvious. This study shows that reducing the compressor inlet pressure will affect the compressor pressure ratio to make the compressor outlet temperature increase to further increase the heat of compression, thus extending the time of energy release; however, this will also cause the compressor power consumption to increase, and at the same time, it will cause the storage tank volume to become large and increase the total cost of the system; thus, we need to take into account the required energy release power, energy release time, and the system assembly of the original reasonable configuration of the compressor inlet pressure.
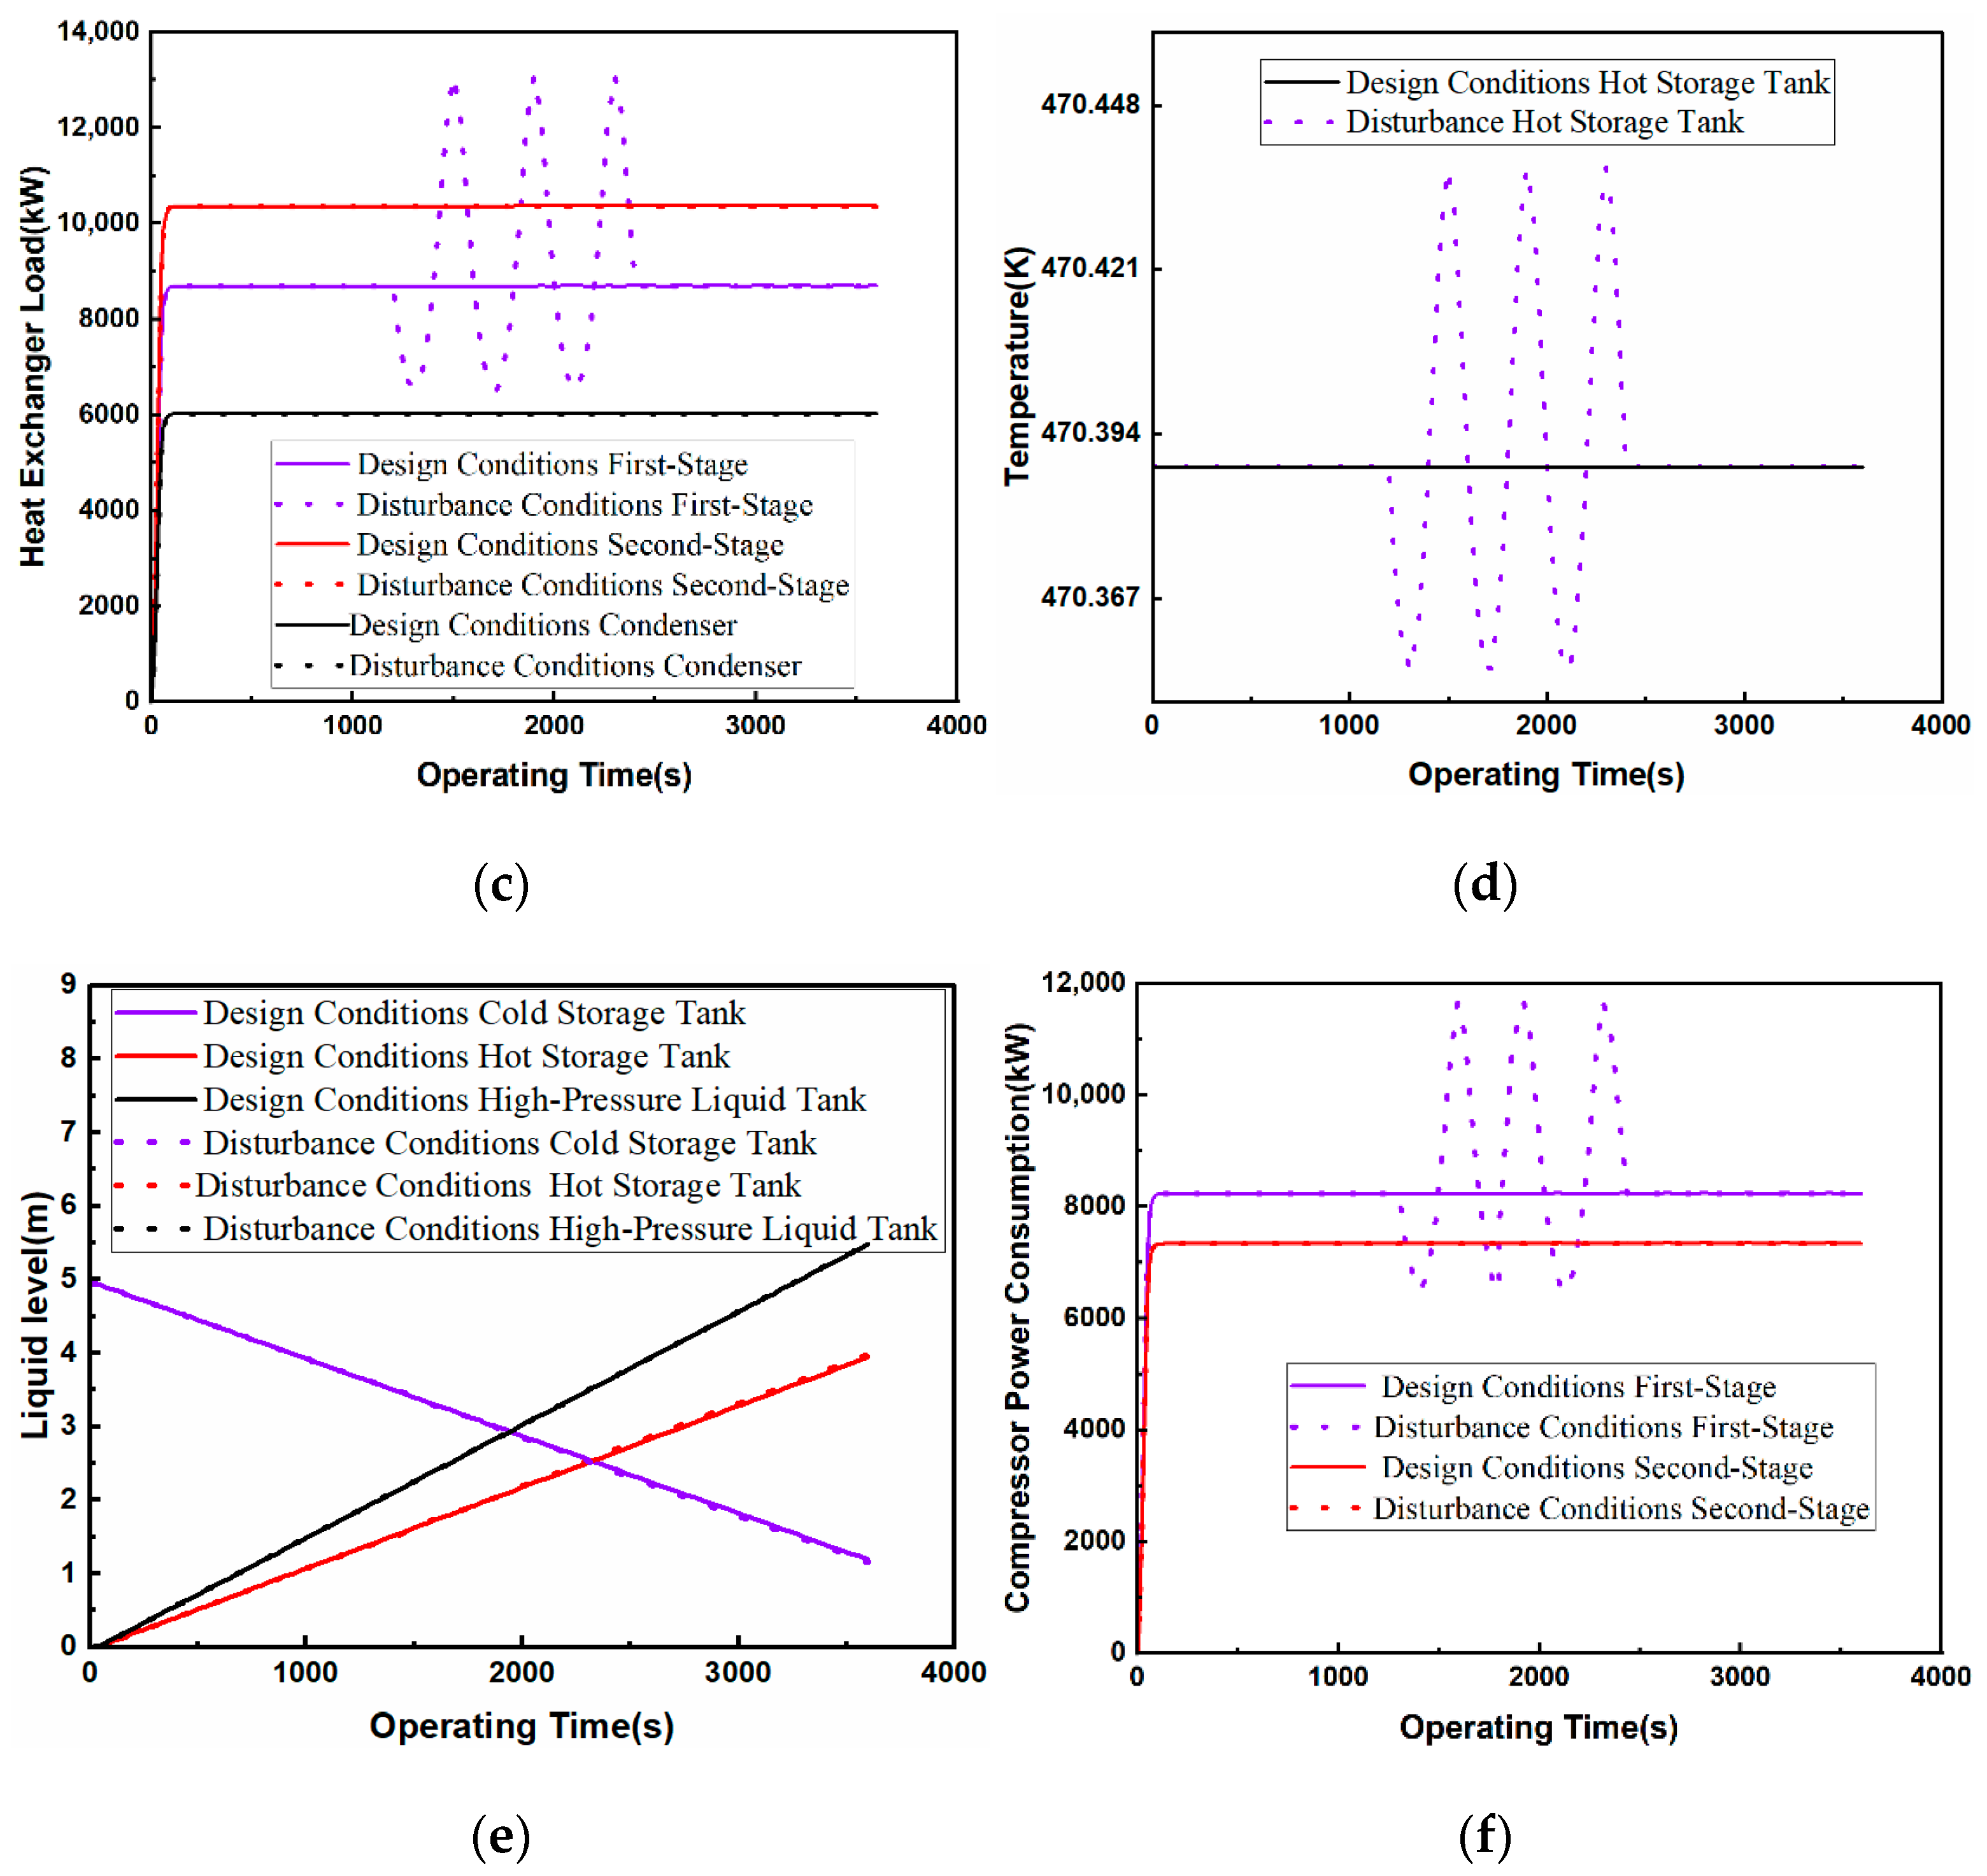
4.3.3. Effect of Compressor Inlet Mass Flow Rate on the System
The effect of compressor inlet mass flow rate perturbation on the system is shown in
Figure 9. During the dynamic operation of the compressed CO
2 energy storage system, when the inlet mass flow rate of the first-stage compressor is perturbed in the interval of 29.4~54.6 kg/s, the change in the outlet temperature of the first-stage compressor is not obvious, but due to the change in the inlet mass flow rate of the compressor, the first-stage compressor dissipation and the first-stage heat exchanger load change simultaneously. However, due to the change in the mass flow rate at the compressor inlet, the power consumption of the first-stage compressor and the heat exchange load of the first-stage heat exchanger are synchronized, and the power consumption of the first-stage compressor varies in the range of 5766.29~10,661.89 kW. Therefore, the mass flow rate of the medium outlet of the cold storage tank 1 also changes synchronously from 6.44 kg/s to 11.91 kg/s and has the same trend as that of the imported mass flow rate such that the outlet temperature of the medium in the first-stage heat exchanger is maintained at 470.65 K. Similarly to the first-stage compressor, since the inlet temperature of the second-stage compressor stays unchanged such that the outlet temperature of the second-stage compressor does not vary much, but the change in imported mass flow rate results in the power dissipation of the second-stage compressor and the heat exchanger load. However, due to the change in the inlet mass flow rate, the power consumption of the second-stage compressor and the heat transfer load of the second-stage heat exchanger change synchronously, and the power consumption of the second-stage compressor changes in the range of 5139.92~19,503.72 kW. Therefore, the mass flow rate of the medium outlet 2 of the cold storage tank also changes synchronously from 7.70 kg/s to 14.24 kg/s and has the same trend as that of the imported mass flow rate such that the medium outlet temperature of the second-stage heat exchanger is maintained at 470.17 K, which ensures that there is enough heat to heat CO
2 in the energy release stage.
The first and second heat exchanger medium outlet temperatures remain unchanged, and the two-stage heat exchanger CO2 inlet mass flow rate and medium inlet mass flow rate synchronization change, so as well as the heat exchanger, the second heat exchanger and condenser heat transfer load are synchronized with the change, but the temperature of the storage tank remains constant. As the total mass flow rate of the cold storage tank outlet from 20.2 to 14.14~26.15 kg/s interval changes, i.e., a perturbation amplitude of more than 20% under design conditions, the compressor inlet mass flow rate change up to 30%; thus, the rate of change of the level in the cold storage tank, the storage of heat, and the high-pressure liquid tank have been changed. This study shows that increasing the compressor inlet mass flow rate will increase the compressor outlet temperature and thus increase the heat of compression, thus prolonging the energy release time, but it will also cause the compressor power consumption to increase, and at the same time, it will cause the high-pressure liquid storage tank level to become smaller; thus, the system energy density becomes smaller, causing the system energy release time to become smaller; therefore, in the case of meeting the energy release of the system to meet the normal operation of the compressor, the inlet mass flow rate should be reduced as much as possible.
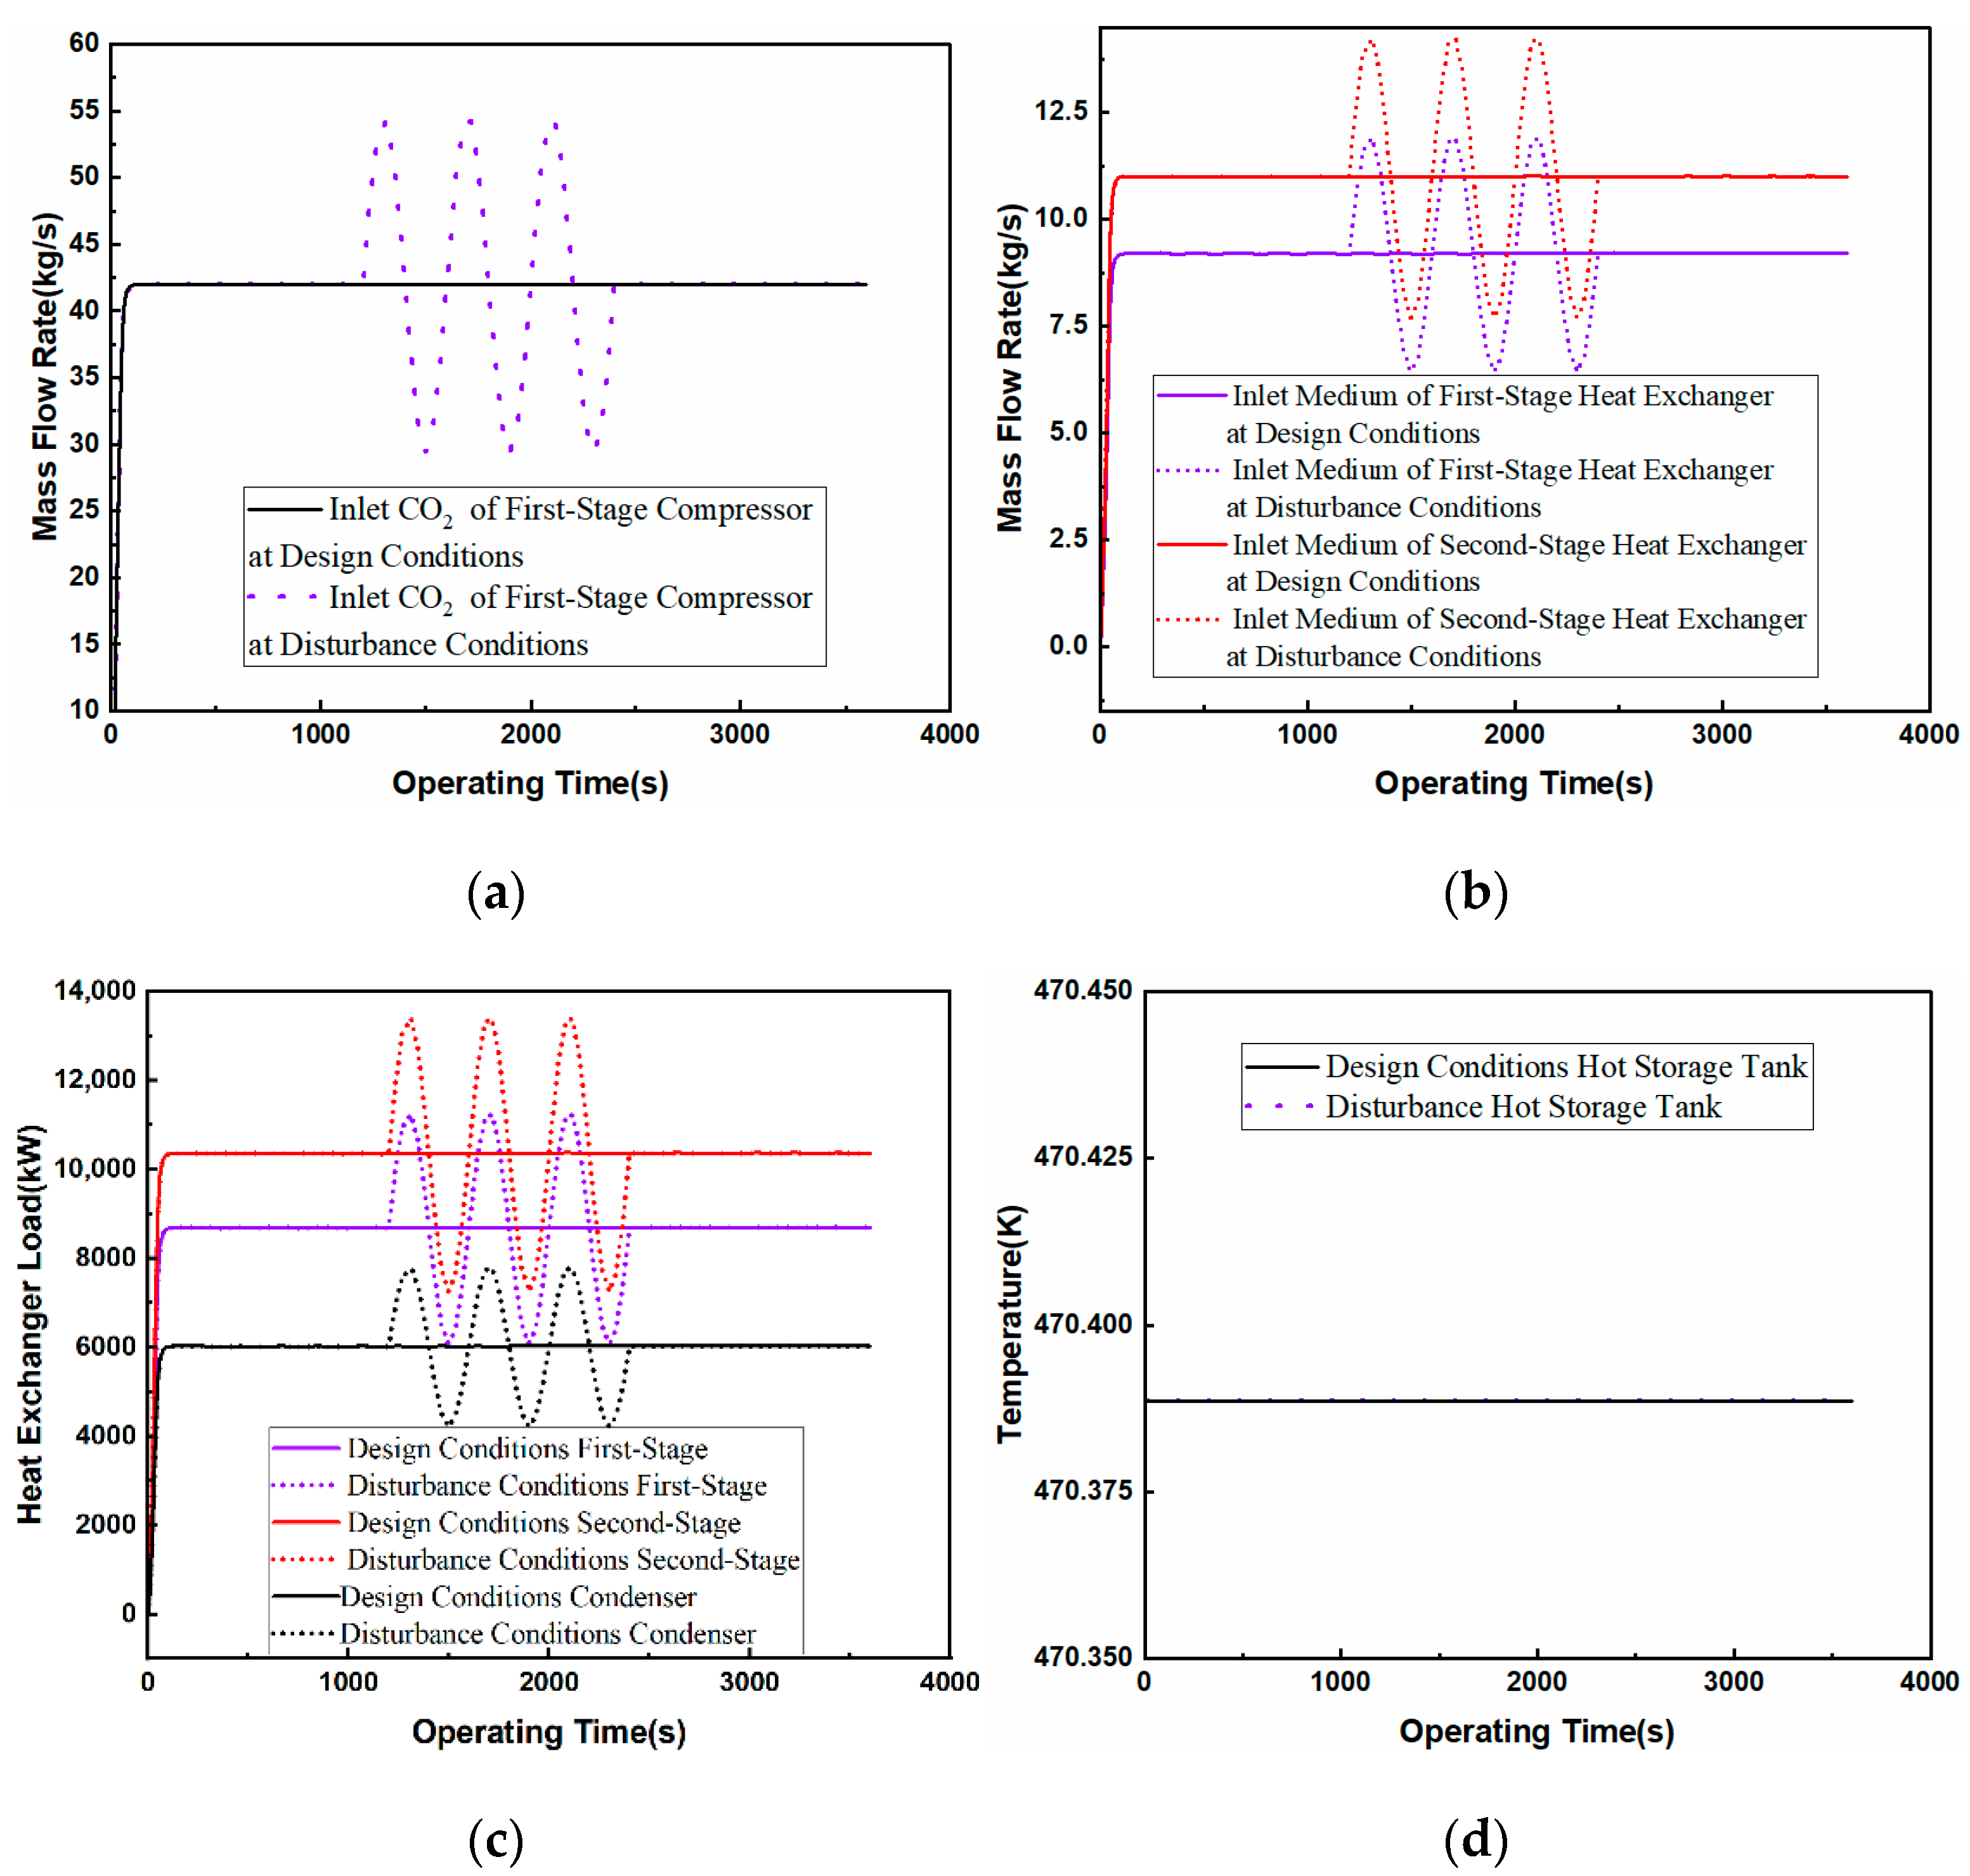
4.3.4. Effect of Expander Inlet Mass Flow Rate on the System
The effect of the high-pressure storage tank outlet mass flow rate on the system is shown in
Figure 10. During the dynamic operation of the compressed CO
2 energy storage system, the temperature and pressure of the high-pressure storage tank outlet liquid CO
2 in the energy release stage are maintained at 301.15 K and 70 bar, and the liquid CO
2 is changed into gaseous CO
2, with a temperature of 303.15 K and a pressure of 69 bar, via vaporizer heating and pressure loss. When the mass flow rate of the CO
2 exported from the high-pressure storage tank—i.e., the mass flow rate of vaporizer inlet—changes in the range of 29.4~54.6 kg/s, in order to ensure that the vaporizer is exchanged by enough heat, the outlet temperatures of the third-stage and fourth-stage heat exchanger media need to be maintained at the design condition of 351.51 K and 351.83 K; and at the same time, in order to ensure that the first-stage and the second-stage expander outlet temperature is maintained at 460 K and 427 K, the mass flow rate of the hot storage tank medium outlet 1 changes from 15.17 kg/s to 10.63~19.72 kg/s, and the mass flow rate of the hot storage tank medium outlet 2 changes from 5.03 kg/s to 3.52~6.53 kg/s to ensure that the vaporizer vaporizes CO
2 with enough heat.
Due to the third-stage and fourth-stage heat exchanger CO2 export temperatures, the first-stage and second-stage expander inlet temperature remain unchanged. The first-stage and second-stage expander export temperature changes are not obvious, but because of the change in the inlet mass flow rate, the first-stage and second-stage expander work synchronization changes: the first-stage expander work is in the range of 3694.73~6854.52 kW change; the second-stage expander work is in the range of 3435.43~6373.45 kW. As the CO2 inlet mass flow rate and medium inlet mass flow rate of the two-stage heat exchanger change synchronously, the heat transfer load of the vaporizer, third-stage heat exchanger, and fourth-stage heat exchanger change synchronously, and the temperature of the cold storage tank remains constant. As the total mass flow rate of the hot storage tank outlet changes from 20.2 to the 14.15~26.25 kg/s interval, i.e., a perturbation amplitude of more than 20% under design conditions, the compressor inlet mass flow rate change ranges up to 30%; thus, the rate of change of the liquid level in the cold storage tank, the storage of the heat tank, and that of the high-pressure liquid tank have been changed. This study shows that increasing the inlet mass flow rate of the expander will increase the power of the expander to conduct its function, but it will cause the liquid level in the high-pressure liquid storage tank—compared to design working conditions—to increase the rate of decline, which will make the energy release time shorter; thus, increasing the inlet mass flow rate should be within the limited capacity of the high-pressure liquid storage tank under balanced conditions with respect to energy release power and energy release time.
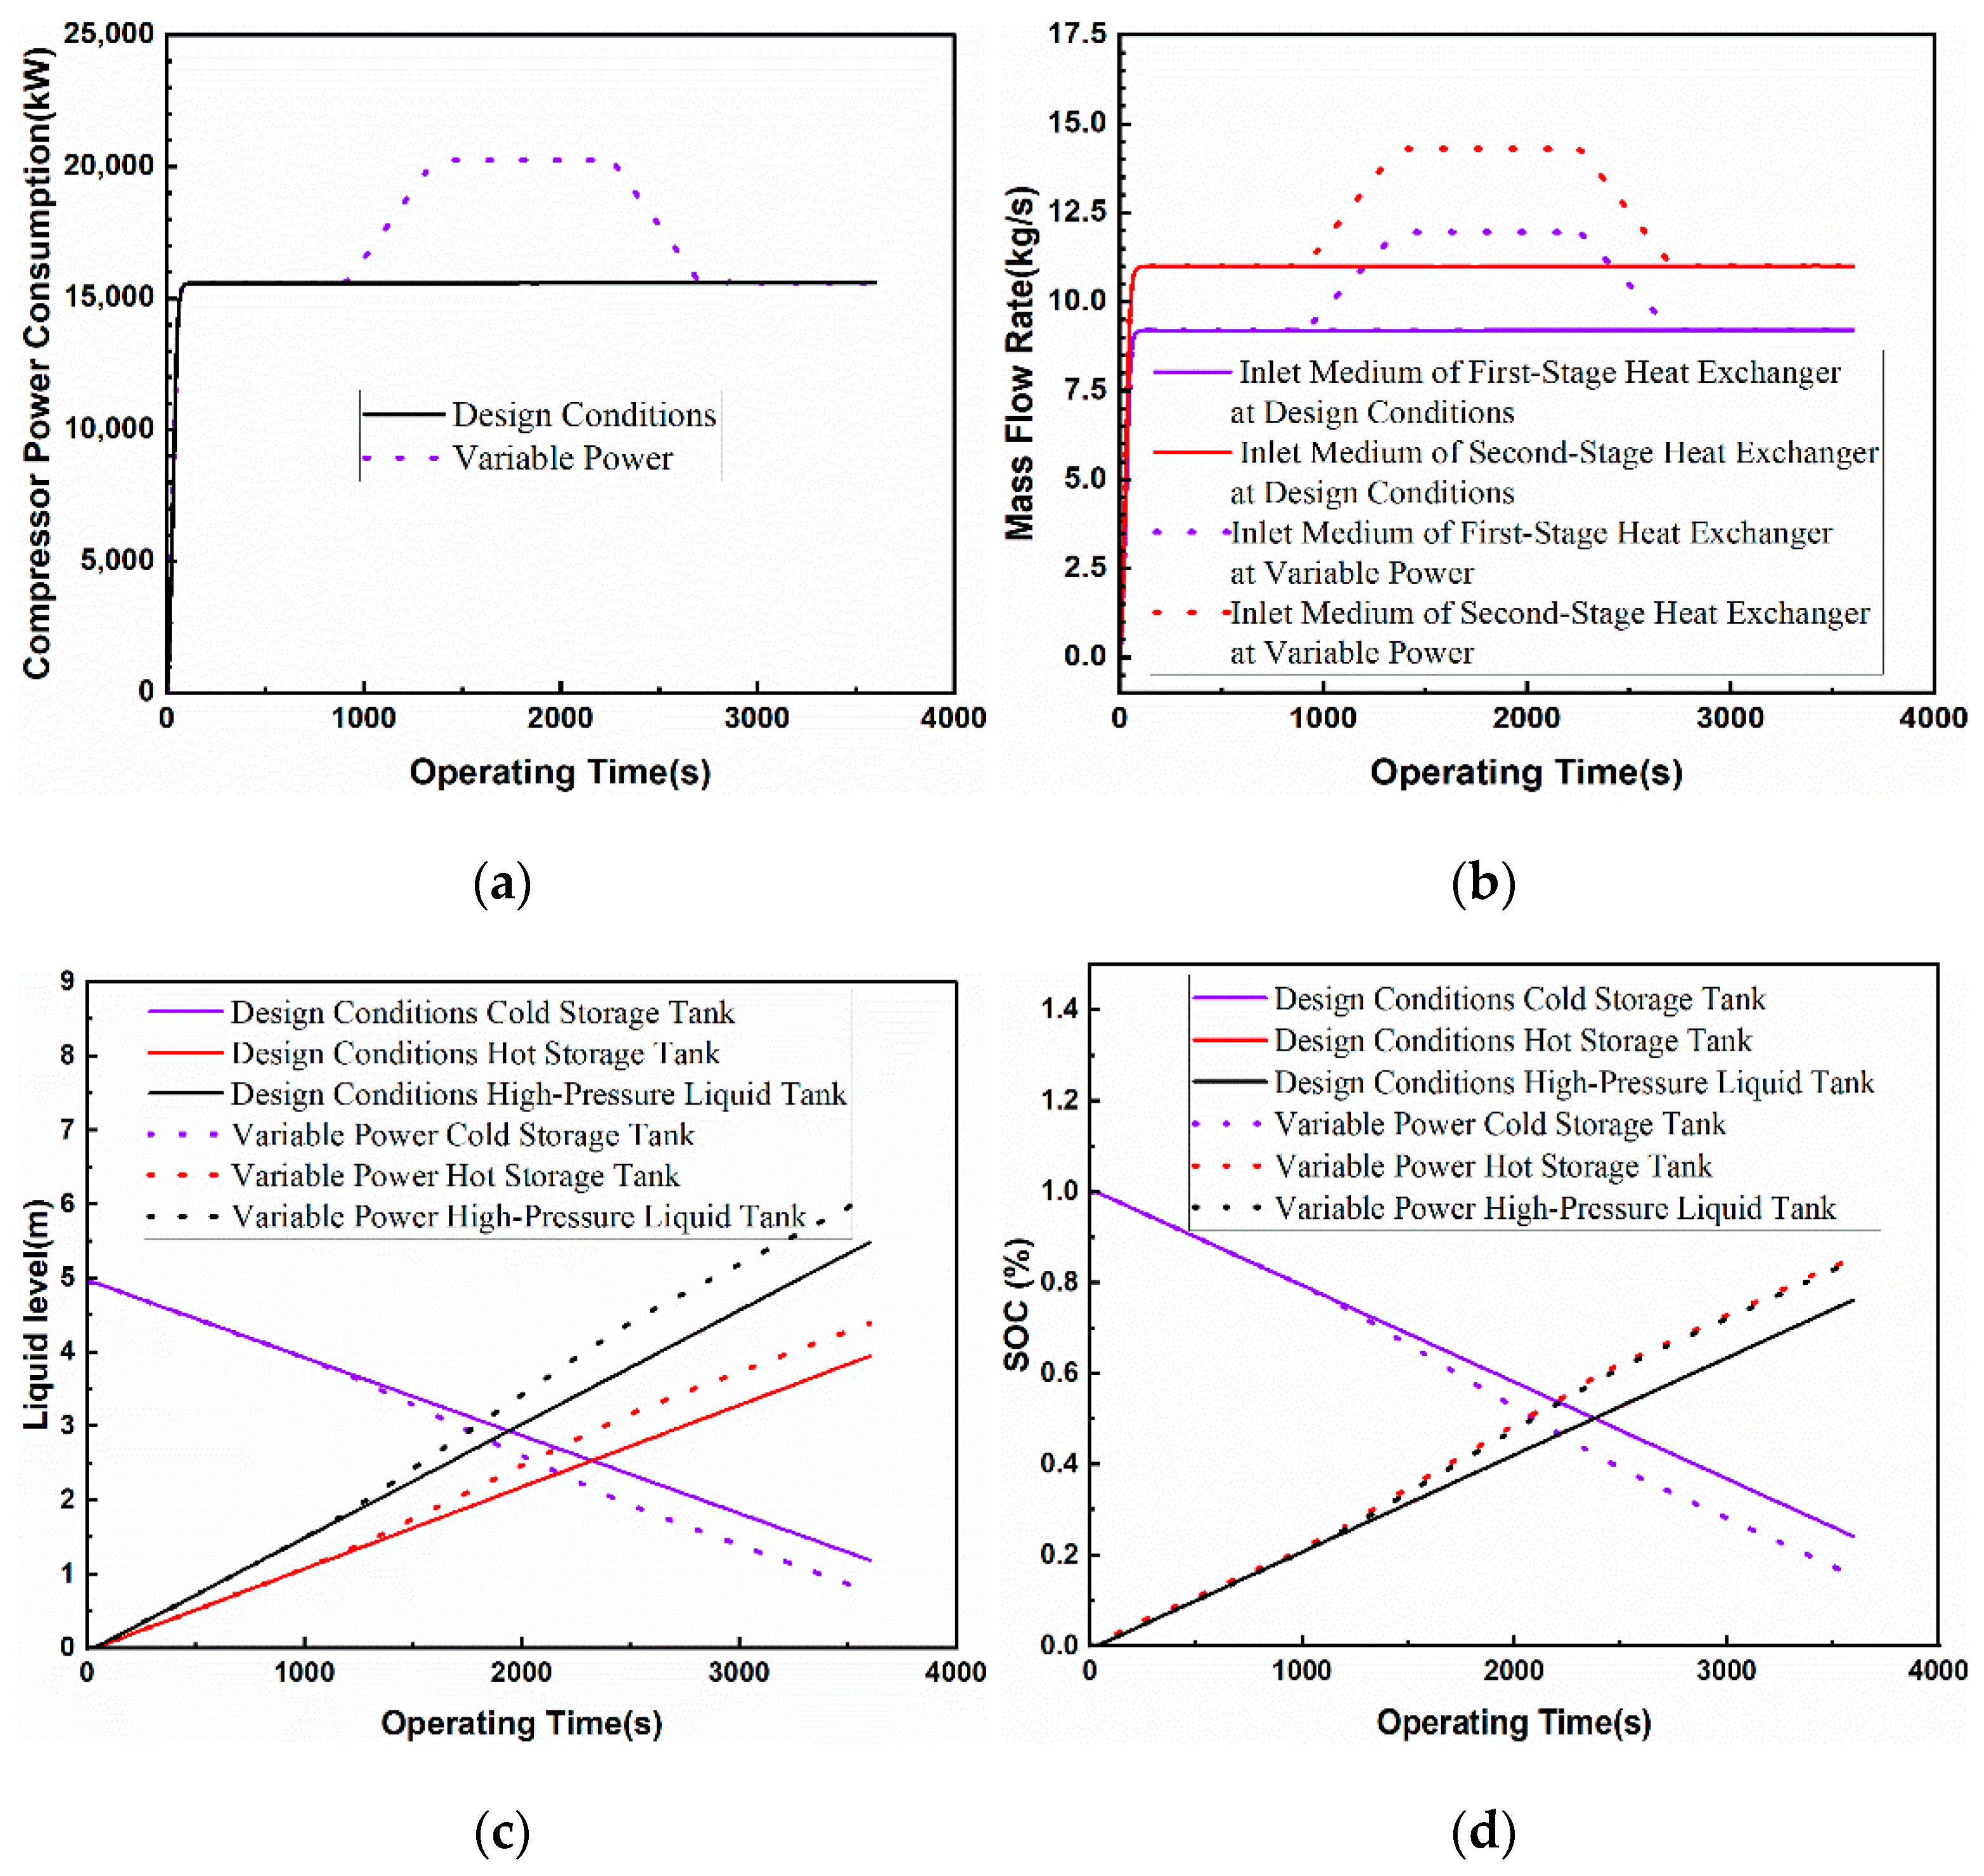
4.4. System Variable Power Analysis
Under the design working conditions, the power values of the first- and second-stage compressor in the energy storage stage are 8237.39 kW and 7342.58 KW, respectively, and the total power is 15,579.97 kW. The machine power values of the first- and second-stage expansion in the energy release stage are 5273.01 kW and 4902.94 kW, and the total power is 10,175.95 kW. A 30% margin is left in the cold storage tank, the hot storage tank, and the high-pressure liquid storage tank, and their design liquid levels are 4.945 m, 5.176 m, and 7.195 m, respectively. Other parameters are maintained at design conditions, and the following ±30% variable power response is carried out to observe the changes in the liquid level in the cold storage tank, the hot storage tank, and the high-pressure liquid storage tank, i.e., the system’s SOC values.
4.4.1. Energy Storage Phase in Variable Power Analysis
In the energy storage stage, it takes 0–900 s to maintain the compressor under design conditions for constant power operation, it takes 900~1350 s to make the total power of the compressor 10.39 kW/s at a positive climbing speed variable power operation, and it takes 1350~2250 s to maintain the compressor under design conditions for constant power operation. In 2250~2700 s, the total power of the compressor is made to run at 10.39 kW/s with a negative creep rate, and in 2700~3600 s, the compressor returns to run at constant power under design working conditions. The initial liquid level in the cold storage tank is 4.945 m, and the initial liquid level in the hot storage tank and the high-pressure liquid storage tank is zero.
The results of the tank level change are shown in
Figure 11. When the total compressor power is running at the set power, in order to maintain a carbon dioxide temperature of 313.15 K at the outlet of the first-stage and second-stage heat exchangers, the mass flow rate of the inlet medium of the first-stage heat exchanger gradually rises and stabilizes at 9.2 kg/s and then rises to 11.89 kg/s with the increase in compressor power, gradually decreasing and stabilizing at 9.2 kg/s. The mass flow rate of the inlet medium of the second-stage heat exchanger gradually rises and stabilizes at 11 kg/s and then rises to 14.22 kg/s with the increase in compressor power, gradually decreasing and stabilizing at 11 kg/s. The mass flow rate of the second-stage heat exchanger medium inlet gradually rises and stabilizes at 11 kg/s then rises to 14.22 kg/s with the increase in compressor power, gradually decreasing and stabilizing at 11 kg/s. With the inlet of the heat exchanger medium, the liquid level in the liquid storage tank gradually decreases, and the total mass of the outlet of the liquid storage tank under variable power conditions is larger than that under design conditions in an hour; thus, the system completes the operation of the variable power condition. The liquid level in the storage tank decreases to 0.76 m, which is 36% lower than the 1.19 m observes under design conditions. At the same time, due to the existence of positive and negative climbing stages in the compressor power under the variable power condition, the decrease rate of the corresponding liquid level in the storage tank is larger and then smaller compared with that under design conditions. Similarly, at the end of the system operation, the liquid level in the hot storage tank under variable power conditions rises to 4.39 m, which is 11.1% higher than that under design conditions (3.95 m), and the corresponding increase rate of the liquid level in the hot storage tank is larger and then smaller than that under design conditions. As the total power consumption of the compressor under variable power conditions is greater than the design condition over 1 h of system operation, the level of the high-pressure liquid storage tank under variable power conditions rises to 6.11 m after the system operation, which is 11.5% higher than that under design conditions (5.48 m), and the corresponding rate of elevation of the high-pressure liquid storage tank level is larger and then smaller compared with that under design conditions. The change in the SOC value of each liquid level is similar to the change in liquid level in the storage tank, and the SOC value of the cold storage tank under the variable power condition decreases from 100% to 15.89%, which is 34% lower than that obtained under design conditions (24.06%). Because the system is working under the same operating conditions, the hot storage tank and high-pressure liquid storage tank of the level SOC value change the synchronization from 0 to 84.89%.
4.4.2. Energy Release Phase in Variable Power Analysis
In the energy release stage, it takes 0–900 s to maintain the expander under design working conditions at a constant power operation, it takes 900~1350 s to maintain the total power of the expander at 6.78 kW/s positive climbing speed under variable power operation, it takes 1350~2250 s to maintain the expander at constant power operation under design working conditions, and it takes 2250~2700 s to maintain the total power of the expander in 6.78 kW/s. The total power of the expander is made to run at 6.78 kW/s in 2250~2700 s, and the total power of the expander is made to run at 6.78 kW/s in 2700~3600 s. The energy release phase is operated on the basis of the liquid level height parameters of each tank at the end of the energy storage phase, and the initial liquid level heights of the cold storage tank, the hot storage tank, and the high-pressure liquid storage tank are 0.76 m, 4.39 m, and 6.11 m, respectively.
The results of tank level change are shown in
Figure 12. When the total power of the expander is operated under the set power, in order to maintain the carbon dioxide temperature of the outlet of the third-stage and fourth-stage heat exchangers at 460 K and 427 K, respectively, the mass flow rate of the inlet of the third-stage heat exchanger medium gradually rises and stabilizes at 15.17 kg/s and then rises to 33.95 kg/s with the increase in compressor power, while the mass flow rate of the inlet of the fourth-stage heat exchanger medium gradually rises and stabilizes at 5.02 kg/s and then rises to 6.49 kg/s with the increase in compressor power. With the flow of the hot storage tank medium, the liquid level in the hot storage tank gradually lowers, and finally, in 2250 s, the liquid level in the hot storage tank falls to 0, and the system stops running. The liquid level in the cold storage tank rises from 0.76 m to 4.97 m, and the liquid level in the high-pressure liquid storage tank falls from 6.11 m to 2.18 m. Since there is a positive climbing phase of the pressure expander power under the variable power condition, the rate of increase in the liquid level in the corresponding cold storage tank and the high-pressure liquid tank in the range of 0–2250 s becomes larger compared with that under the design conditions; in particular, the rate of decrease in the liquid level in the hot storage tank becomes larger compared with that under the design conditions. The energy release phase stops at the 2250th s. At this moment, the liquid level in the hot storage tank under the variable power condition decreases from 84.89% to 0, the SOC value of the cold storage tank increases from 15.89% to 98.7%, and the SOC value of the high-pressure liquid storage tank decreases from 84.89% to 31.48%. It can be seen that under variable power conditions, there is a difference between the real-time SOC value of the system’s carbon dioxide capacity and the real-time SOC of the system’s hot and cold capacity, and it is necessary to take into account the power and operating time necessary for the storage and release of energy to design reasonable hot storage tank and the cold storage tank volumes in the actual operation.
Carrying out the system’s variable power characterization can provide key parameter support for the optimal scheduling of the integrated energy system with integrated compressed CO2 energy storage. In particular, it reveals the dynamic response characteristics and energy regulation boundaries of the storage unit in the cold–heat–electricity multi-energy cogeneration scenario.


