1. Introduction
As the global population continues to grow, so does the demand for electricity to power homes, businesses, and industries. This increasing energy requirement places immense pressure on existing power infrastructure, which remains heavily reliant on fossil fuels [
1]. The widespread use of these carbon-intensive energy sources has significantly contributed to climate change and global warming. In response, international agreements such as the Paris Agreement have set ambitious climate targets, requiring greenhouse gas (GHG) emissions to peak before 2025 and decline by 43% by 2030 to limit global warming to 1.5 °C [
2]. However, these targets remained unmet, with global temperatures continuing to rise. The urgency of addressing this issue is further exacerbated by geopolitical instability, including the war in Ukraine and tensions in the Middle East, which have underscored the critical need for energy security—an issue intrinsically linked to the ongoing energy crisis.
One of the most promising solutions for reducing fossil fuel consumption and improving energy efficiency is the Organic Rankine Cycle (ORC), which enables the conversion of low-grade heat into useful power. Unlike the conventional Rankine Cycle, which requires high temperatures and pressures to generate power using water as the working fluid, the ORC is specifically designed to operate with lower-temperature heat sources by employing organic working fluids optimized for these conditions [
3,
4]. The term “organic” in ORC refers to the use of organic compounds as the working fluid, allowing efficient energy conversion at lower temperatures [
5].
ORC technology is particularly well suited for utilizing low-grade heat sources, which include natural energy from wind, geothermal, solar, biomass, and ocean thermal energy, as well as heat from combined heat and power (CHP) systems [
6]. Additionally, waste heat recovery (WHR) has gained significant attention as an effective means of improving energy efficiency. Large amounts of low-temperature waste heat are lost in industrial sectors such as cement, ceramic, and oil processing industries, as well as from internal combustion engines (ICE) [
7]. By integrating ORC technology with these energy sources, efficiency can be enhanced, reducing reliance on fossil fuels.
The selection of an appropriate working fluid plays a crucial role in determining ORC efficiency and environmental impact. ORC systems require low-boiling-point fluids such as refrigerants, their mixtures, or specially designed substances that can effectively utilize heat sources ranging from approximately 100 °C to 350 °C [
8,
9]. Traditionally, fluids such as R134a have been widely used due to their favorable thermodynamic properties and strong cycle performance. However, these fluids pose significant environmental concerns due to their high Global Warming Potential (GWP). Similarly, earlier alternatives such as R113 and R114 exhibited high Ozone Depletion Potential (ODP), making them unsustainable for long-term applications. Future working fluids must balance efficiency with environmental responsibility, prioritizing low-GWP and low-ODP options while maintaining chemical stability, safety, cost-effectiveness, and availability. Recently, promising alternatives such as R1234ze and R1234yf have been identified, or even specifically developed, to serve as viable candidates for low-grade heat applications [
10,
11,
12,
13,
14].
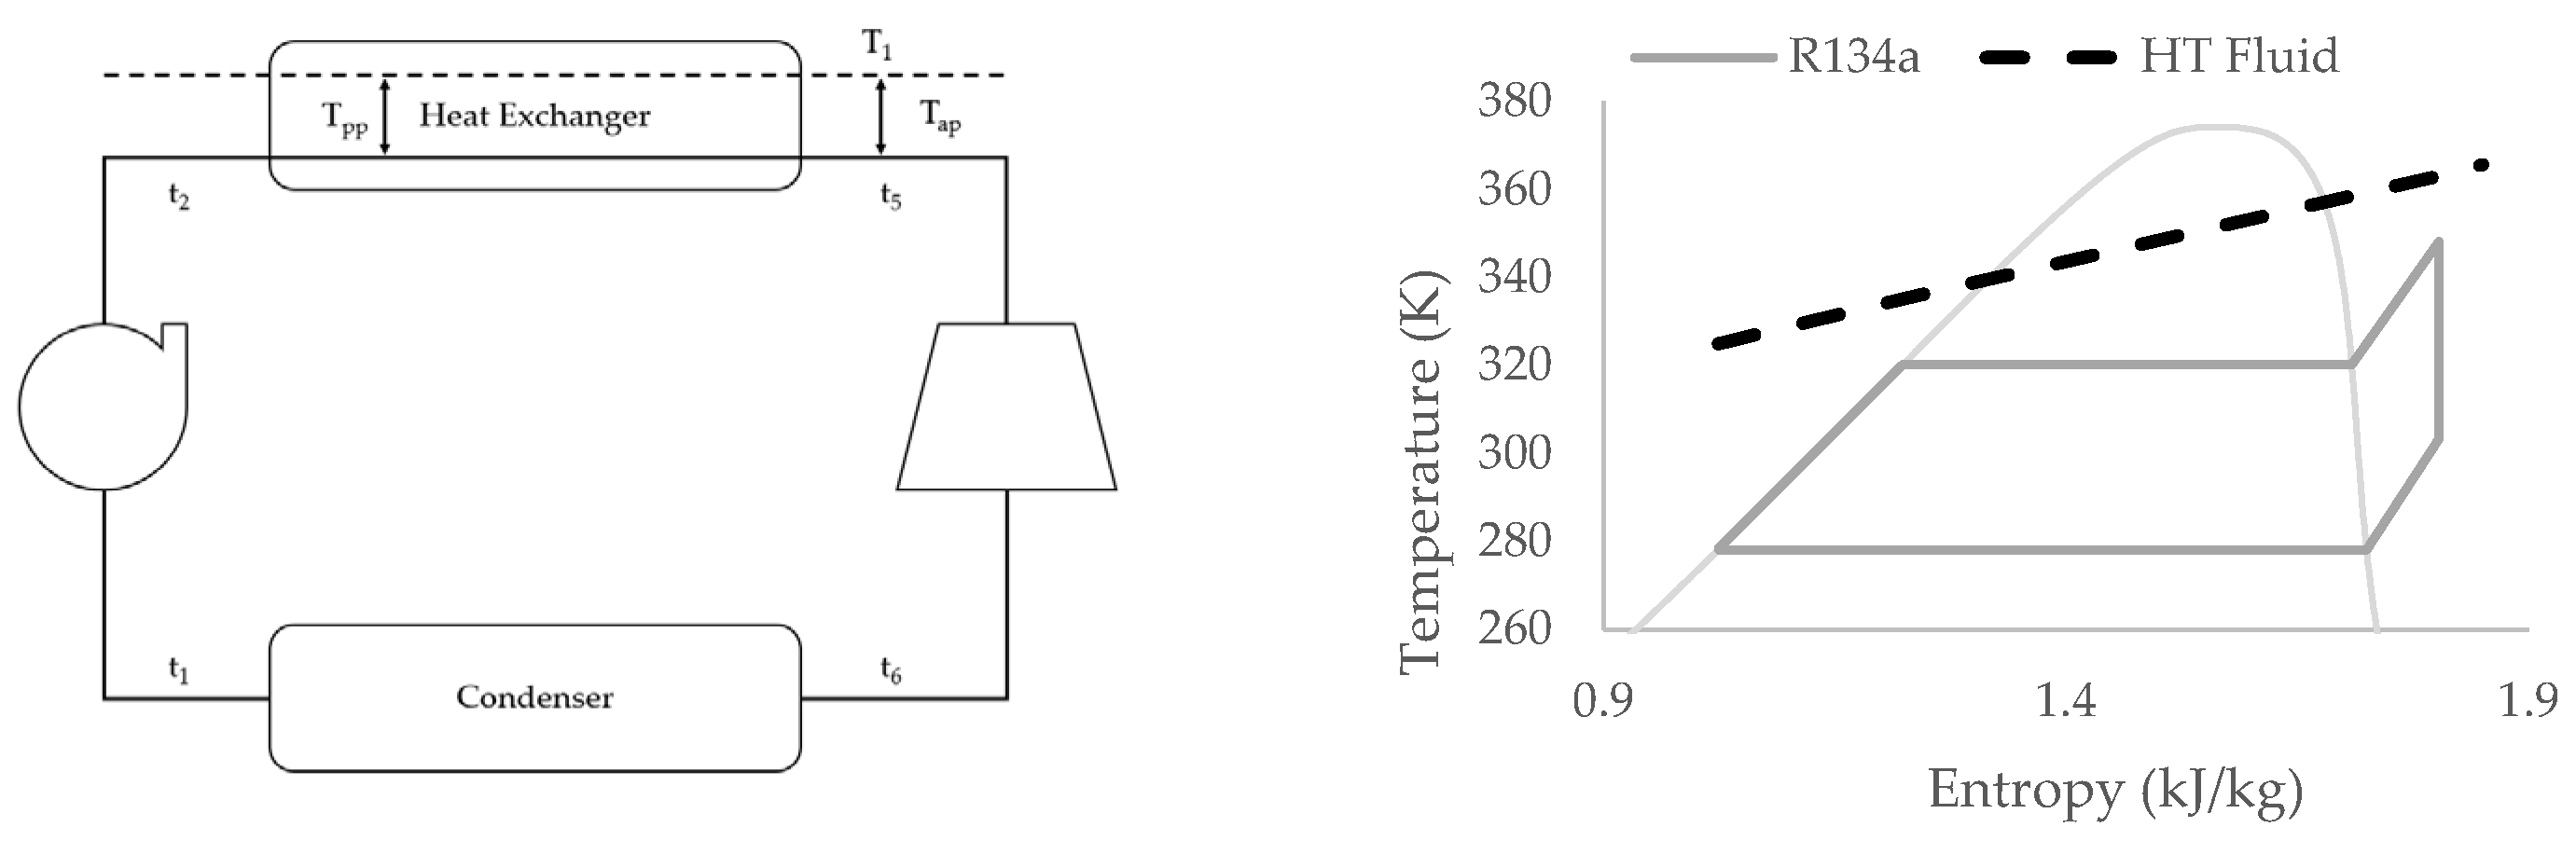
Beyond working fluids, the efficiency of an ORC system is heavily dependent on the design and optimization of its heat exchanger, which facilitates thermal energy transfer between the working fluid and the heat source. Among the various heat exchanger designs, shell-and-tube heat exchangers are the most widely used due to their adaptability across a range of operating temperatures and pressures [
15]. These exchangers offer advantages such as structural simplicity, cost-effectiveness, and ease of maintenance, with variations in tube length, shell configurations, and baffle arrangements influencing overall performance [
16]. Studies have shown that optimizing the heat exchanger can significantly enhance system efficiency, with the pinch point temperature playing a key role in determining the required heat transfer area. However, this optimization must be carefully balanced against cost constraints, as achieving higher efficiency may necessitate larger and more expensive heat exchanger designs [
17].
This study investigates the impact of variations in pinch point and approach point temperatures on heat exchanger size and overall ORC system efficiency for a number of selected working fluids. In addition, this study aims to link thermodynamic optimization with an economic analysis, offering a practical framework for selecting working fluids and designing cost-effective heat exchangers. Additional parameters such as net power output, turbine power, and back work ratio are also analyzed to provide a comprehensive evaluation of system performance. Through this combined approach, the research supports the design of economically viable and energy-efficient ORC systems, contributing to sustainable energy development.
3. Results and Discussion
As the original choice for working fluid, R134a was used as the baseline for comparison of system performance against other working fluids.
Table 3 demonstrates the range of overall heat transfer coefficients for each working fluid per section of heat exchanger with a pinch point and approach temperature of 15 K.
Across all three sections R1234yf has the highest overall heat transfer coefficient of 3422.389 W/m2 K, 6968.338 W/m2 K and 3973.915 W/m2 K. Alternatively, isobutane demonstrates the lowest overall heat transfer coefficients for the preheater section of 2915.285 W/m2 K whereas butane has the lowest for the phase change section of 4628.578 W/m2 K and Propane has the lowest for the super heater section of 3496.676 W/m2 K. Overall the phase change section had the highest overall heat transfer coefficients across all fluids which would be expected during evaporation.
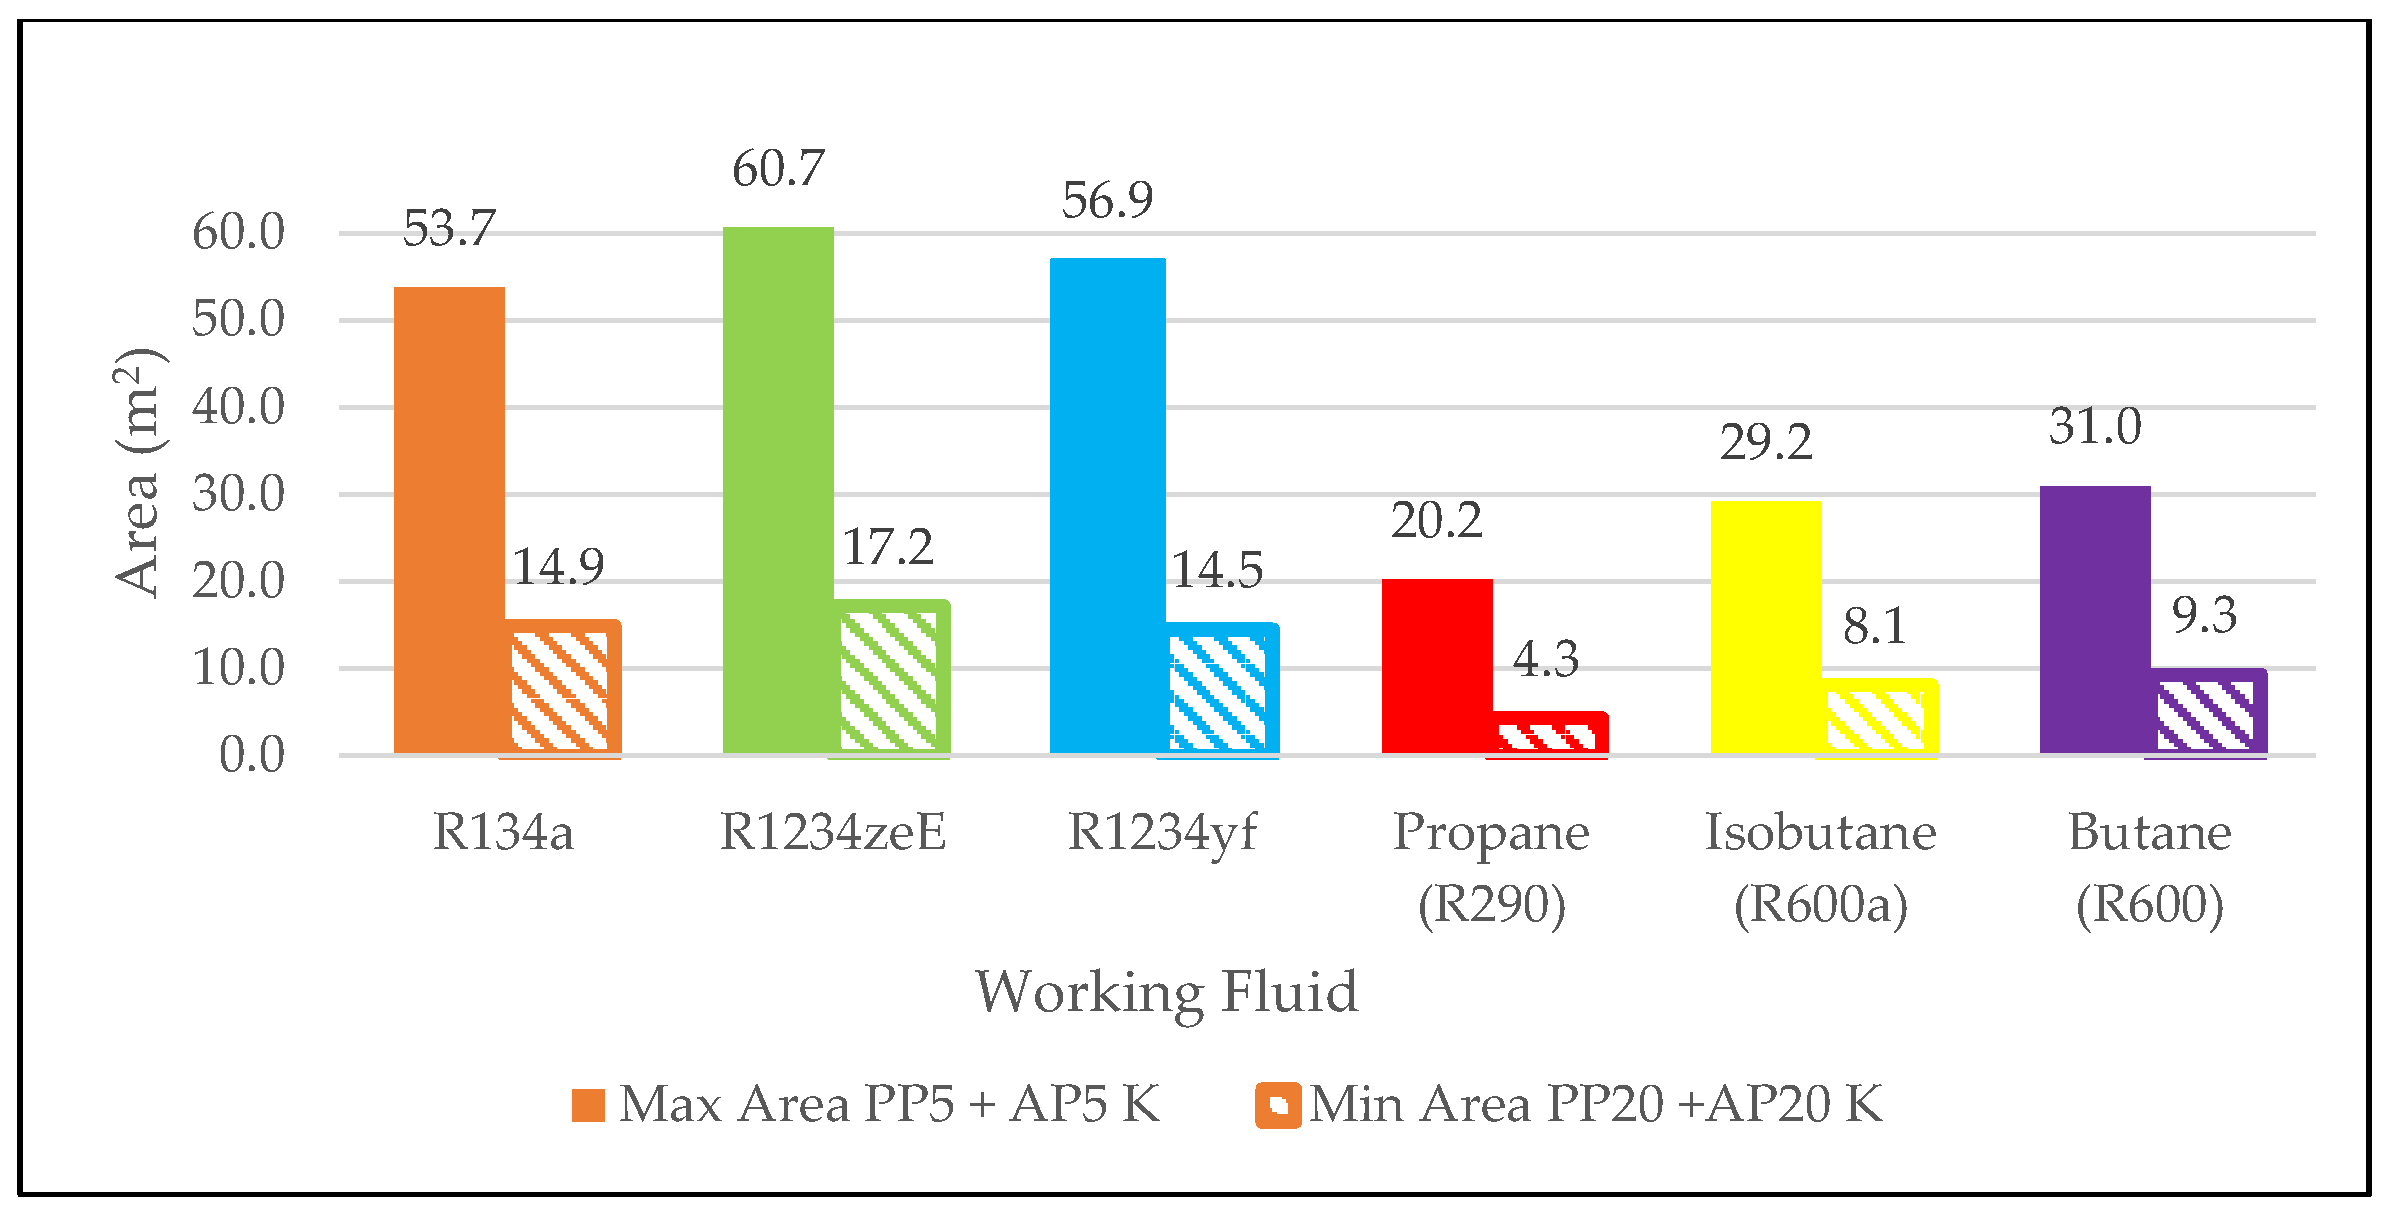
The maximum total area requirement occurs at pinch point and approach point temperature differences of 5 K for all fluids, as shown in
Figure 2. Heat exchanger designed for R134a required a surface area of 53.7 m
2, Comparatively, the smallest maximum area requirement of 20.2 m
2 was for Propane (R290), whereas R1234ze(E) had the largest heat exchanger area of 60.7 m
2. When the pinch point and approach point temperature differences were set at 20 K, the required area for R134a decreased to 14.9 m
2. Again, Propane (R290) had the smallest requirement at 4.3 m
2, while R1234ze(E) had the largest at 17.2 m
2, 2.3 m
2 greater than R134a. The reduction in the required area as the pinch point and approach point temperatures increased was significant. Heat exchanger area required for R134a decreased by 72.26% due to T
pp and T
App variation. Similar values are observed for other working fluids; for example, variation in the heat exchanger area for Propane (R290) was 78.65% and 71.63% for R1234ze(E).
Figure 3 shows that the heat exchanger area requirement decreases for all working fluids as the approach point temperature difference increases from 5 K to 20 K (for a fixed pinch point temperature difference of 15 K). For R134a, the heat transfer area reduced from 25.21 m
2 at an approach point temperature difference of 5 K to 21.67 m
2 at 20 K, representing a decrease of 14.05%. The largest area change was observed for R1234ze(E), which decreased from 28.58 m
2 to 24.84 m
2 over the same range—a reduction of 13.1%. This was only 0.20 m
2 greater than the reduction seen for R134a. At 5 K pinch point temperature difference, R1234ze(E) required 3.37 m
2 more area than R134a (28.58 m
2), and at 20 K, the difference narrowed slightly to 3.17 m
2 (R1234ze(E) requiring 24.84 m
2). Propane (R290), in contrast, exhibited the smallest heat exchanger area requirement across the range. At an approach point temperature difference of 5 K, the required heat exchanger area was 8.27 m
2, which is 16.94 m
2 less than that of R134a. This decreased further to 7.12 m
2, 14.55 m
2 smaller than R134a, at an approach point temperature difference of 20 K, giving a total net reduction of 1.16 m
2, which is 2.39 m
2 less than the reduction observed for R134a (3.54 m
2). These results highlight that although all fluids show a reduction in required heat transfer area with an increasing approach point temperature difference, the magnitude of change varies significantly, with R1234ze(E) having the highest heat transfer area difference and Propane (R290) the smallest. Furthermore, R134a and R1234yf demonstrated very similar area trends over the tested range (represented by nearly overlapping orange and blue lines, respectively), with R1234yf requiring only marginally higher heat transfer area. Across the entire approach point temperature difference range, the difference in required heat transfer area between the two fluids was less than 1%, indicating similar heat transfer characteristics under these operating conditions.
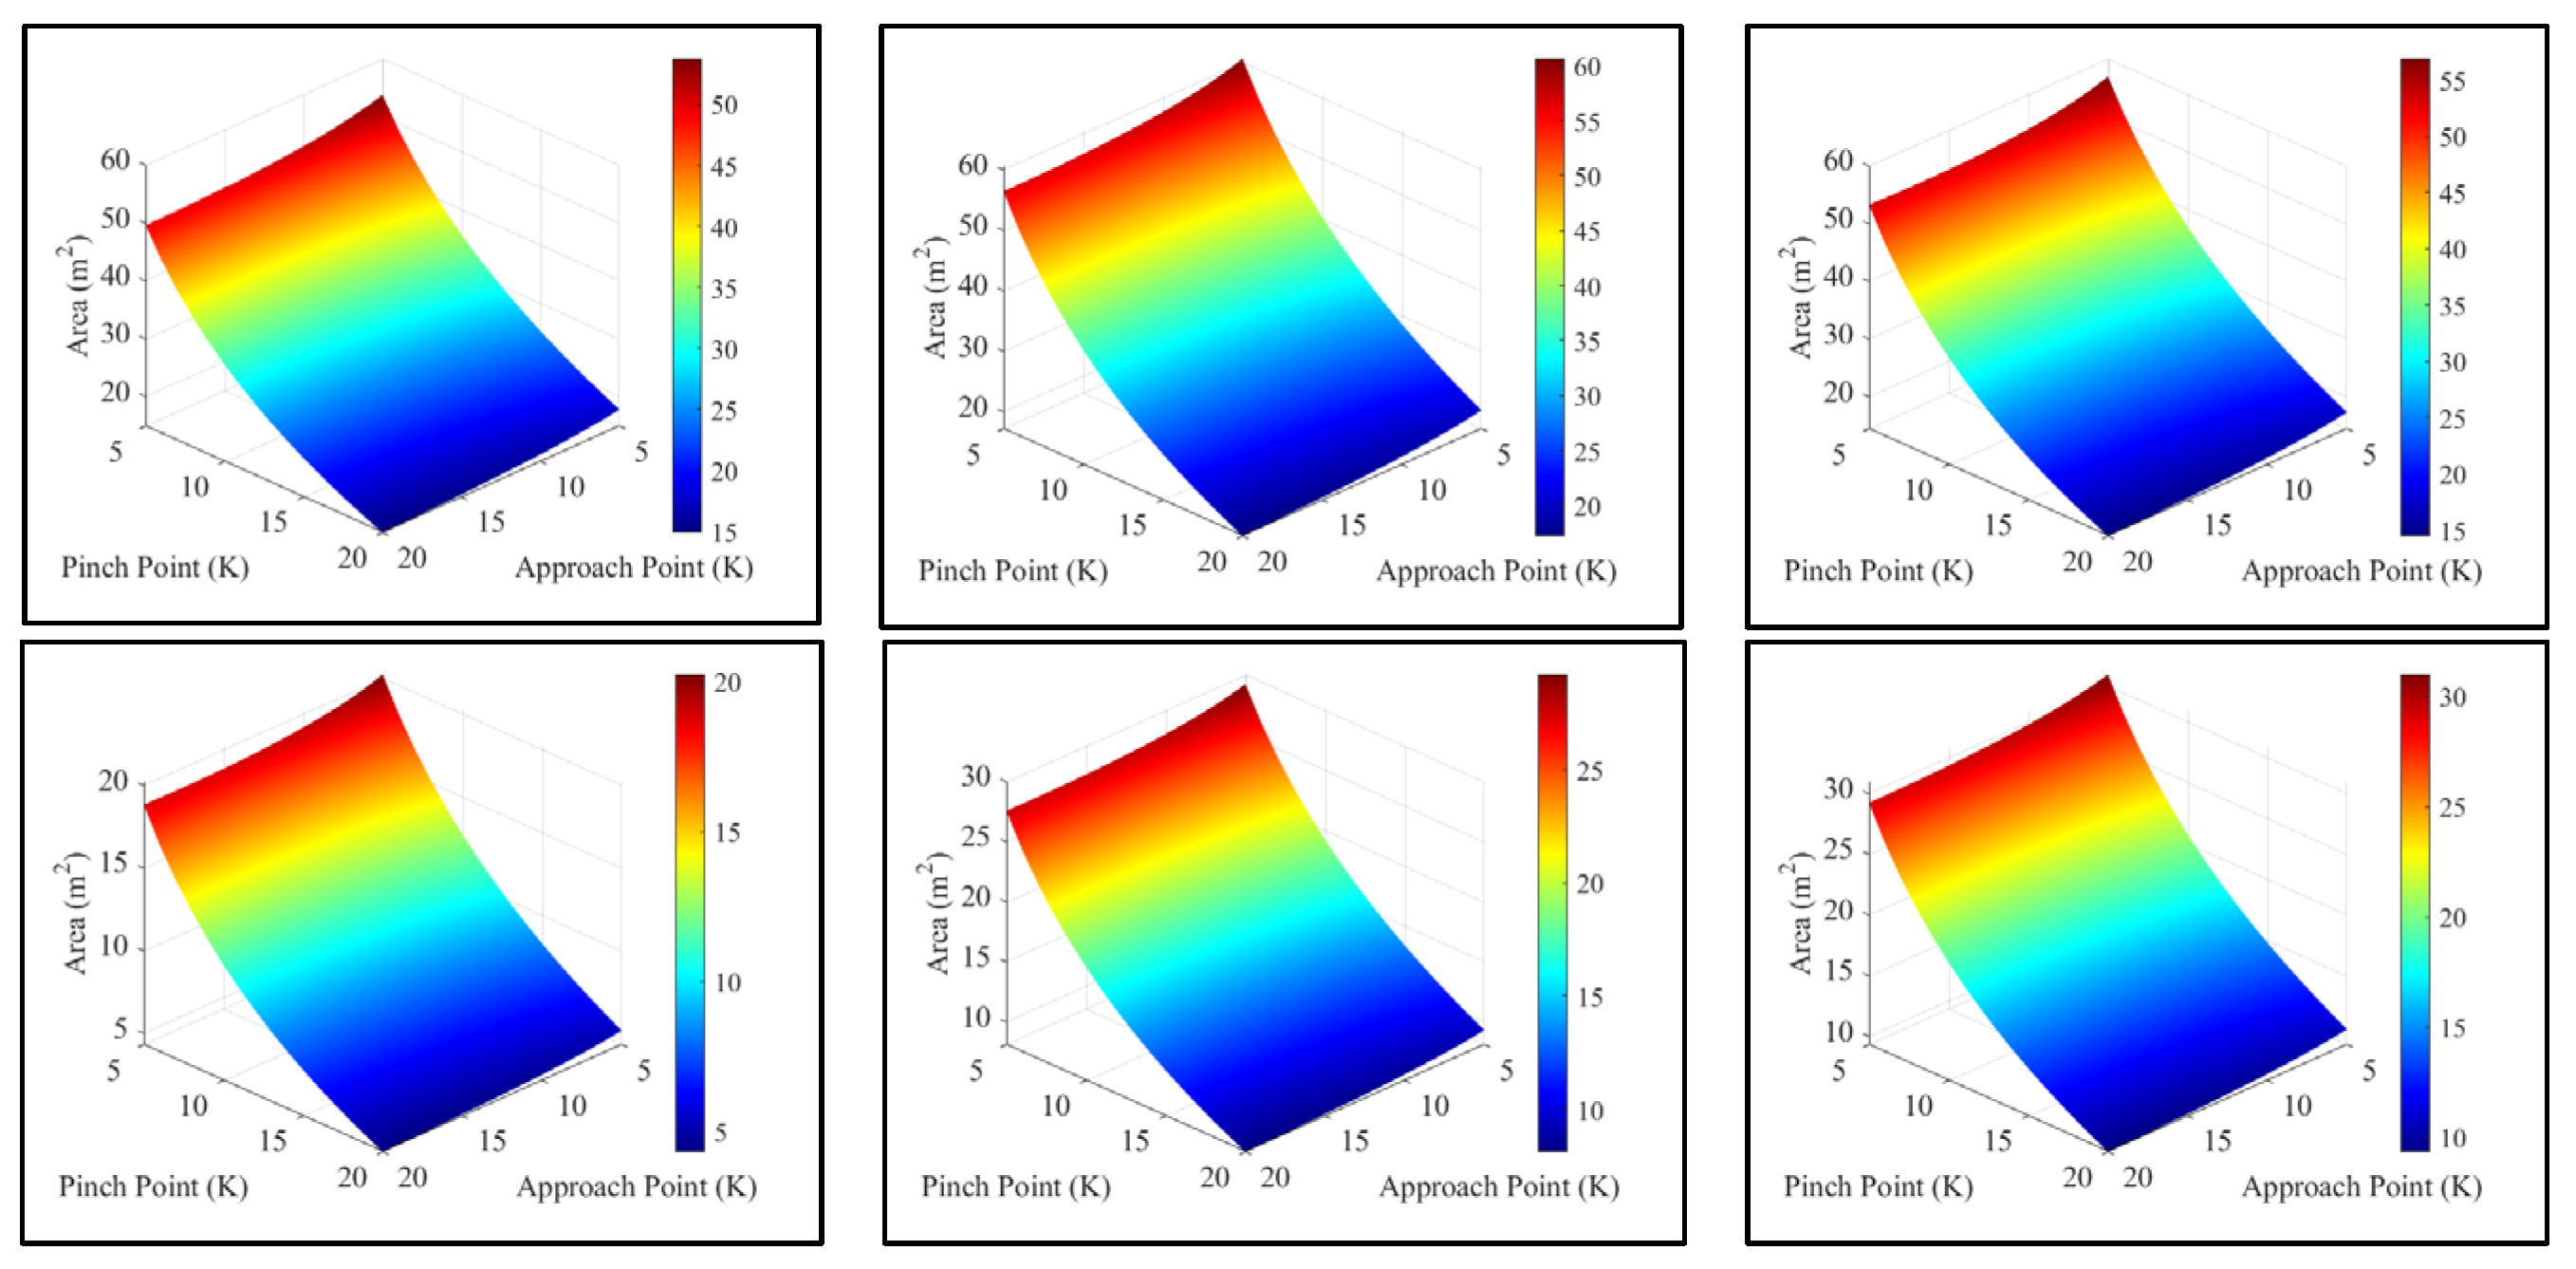
Variation in the pinch point temperature difference from 5 K to 20 K, as shown in
Figure 4 where the approach point temperature difference was fixed at 15 K, revealed more prominent trends; the required heat exchanger area exhibited significantly larger differences compared to those observed for the approach point temperature difference variations. For R134a, the area required at a 5 K pinch point temperature difference was 49.95 m
2, and the largest heat transfer area of 56.71 m
2, again, corresponded to R1234ze(E). Consistently with other trends, Propane (R290) required the smallest heat transfer area of 18.85 m
2 under the same conditions. At the pinch point temperature difference of 20 K, the area required for R134a dropped to 15.35 m
2, marking a substantial reduction of 34.59 m
2 (69.26%). R1234ze(E) showed the greatest overall reduction in area, from 56.71 m
2 to 17.67 m
2, a change of 68.85%. Propane (R290) exhibited the smallest required area, decreasing from 18.85 m
2 at a 5 K pinch point temperature difference to 4.44 m
2 at 20 K—a 76.47% heat transfer area reduction. This represents a 20.18 m
2 smaller change in area compared to R134a, highlighting Propane’s overall low area requirement but relatively high sensitivity to pinch point variation. Data indicates that the pinch point temperature difference has a notable impact on the required heat exchanger area compared to the approach point temperature difference. The larger area differentials observed across the working fluids reinforce the dominant role of pinch point temperature difference constraints in determining heat exchanger sizing. This is further demonstrated by trends shown in
Figure 5 for all working fluids.
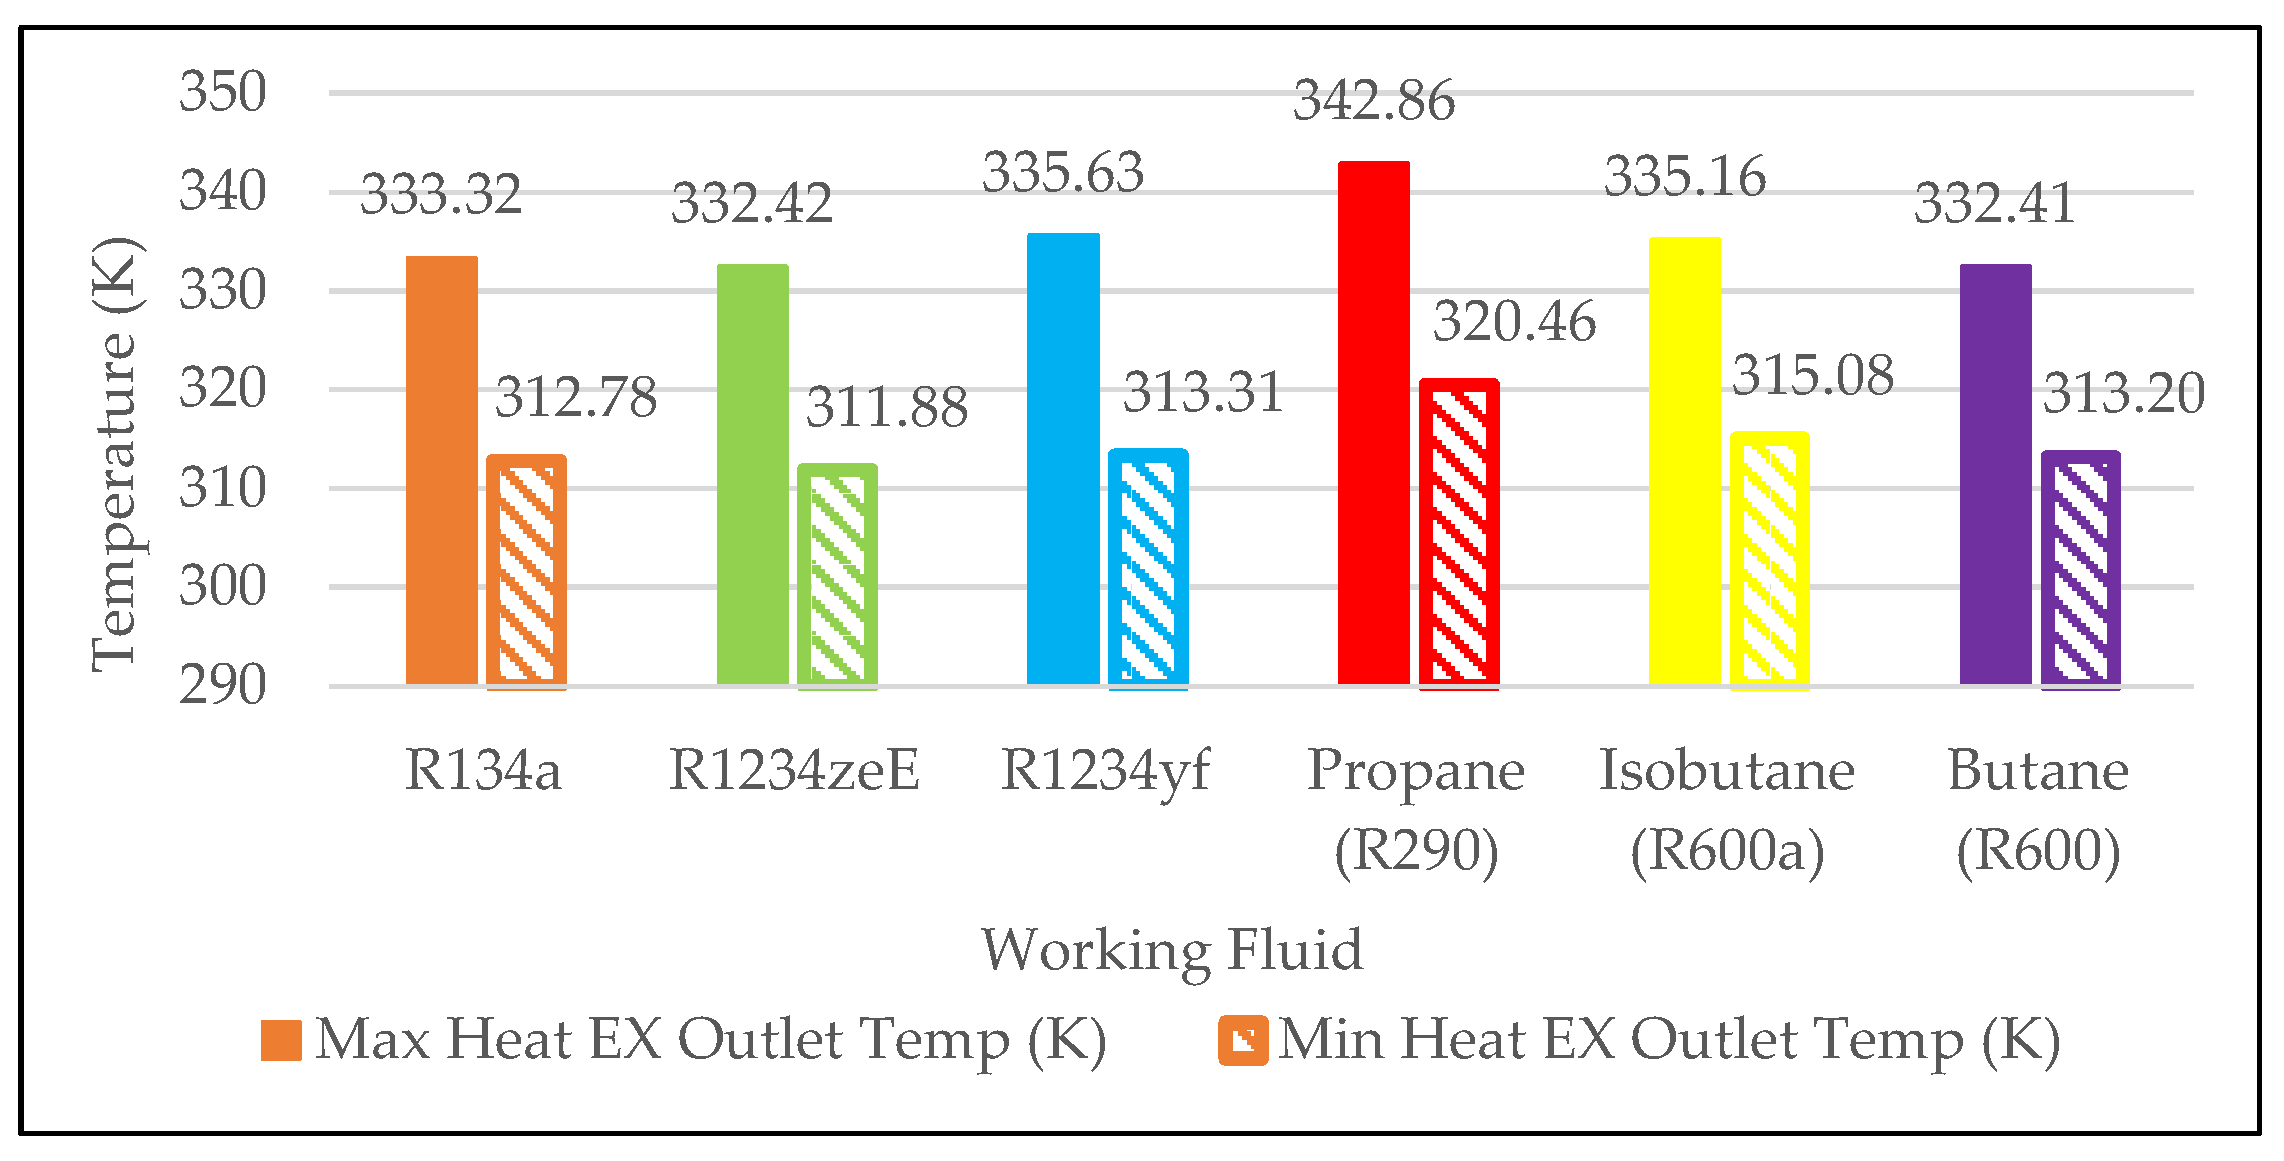
Variation in the temperatures of the heat transfer fluids at the heat exchanger outlet across different combinations of pinch and approach point temperature differences are shown in
Figure 6. The highest outlet temperatures occurs at a 20 K pinch point temperature difference and 5 K approach point temperature difference, while the lowest is observed at a 5 K pinch point temperature difference and 20 K approach point temperature difference. At a 20 K pinch point temperature difference and 5 K approach point temperature difference, R134a reaches an outlet temperature of 333.32 K. The highest outlet temperature recorded among all fluids under these conditions is 342.86 K for Propane (R290), which is 9.54 K higher than R134a. The lowest outlet temperature for this condition is observed for Butane (R600) at 332.41 K, only 0.91 K lower than R134a. Conversely, with a 5 K pinch point temperature difference and 20 K approach point temperature difference, R134a has the lowest outlet temperature of 312.78 K. Propane (R290) again achieves the highest outlet temperature at 320.46 K, 7.68 K more than R134a, while R1234ze(E) shows the lowest outlet temperature at 311.88 K, just 0.90 K less than R134a. The overall difference in the outlet temperature for R134a across all pinch and approach temperature difference combinations is 20.54 K (6.16% reduction), while Propane experiences the greatest change of 22.40 K (6.53% decrease), 1.86 K more than R134a. The smallest drop is seen in outlet temperature for Butane (R600), with a change of 19.21 K (5.78% decrease), 1.33 K less than R134a.
As the approach point temperature difference varies from 5 K to 20 K, as shown in
Figure 7, the outlet temperature of the heat transfer fluid changes from 326.81 K at the 5 K approach point temperature difference to 326.06 K at an approach point temperature difference of 20 K when R134a is employed (for a fixed pinch point temperature difference of 15 K). At a 5 K approach point temperature difference, the highest temperature of heat transfer fluid was 335.63 K when Propane was used, 9.04 K higher than R134a, while R1234ze(E) records the lowest temperature at 325.93 K, just 0.89 K lower. At a 20 K approach point temperature difference, Propane cycle continues to exhibit the largest temperature at the outlet of the heat exchanger of 334.95 K, 8.89 K higher than R134a, and for R1234ze(E) the lowest temperature was 325.15 K, 0.91 K lower than R134a. The temperature change for R134a in this case was 0.75 K, a minor 0.23% decrease from its largest temperature, with R1234yf showing the largest drop of 1.13 K (0.34%).
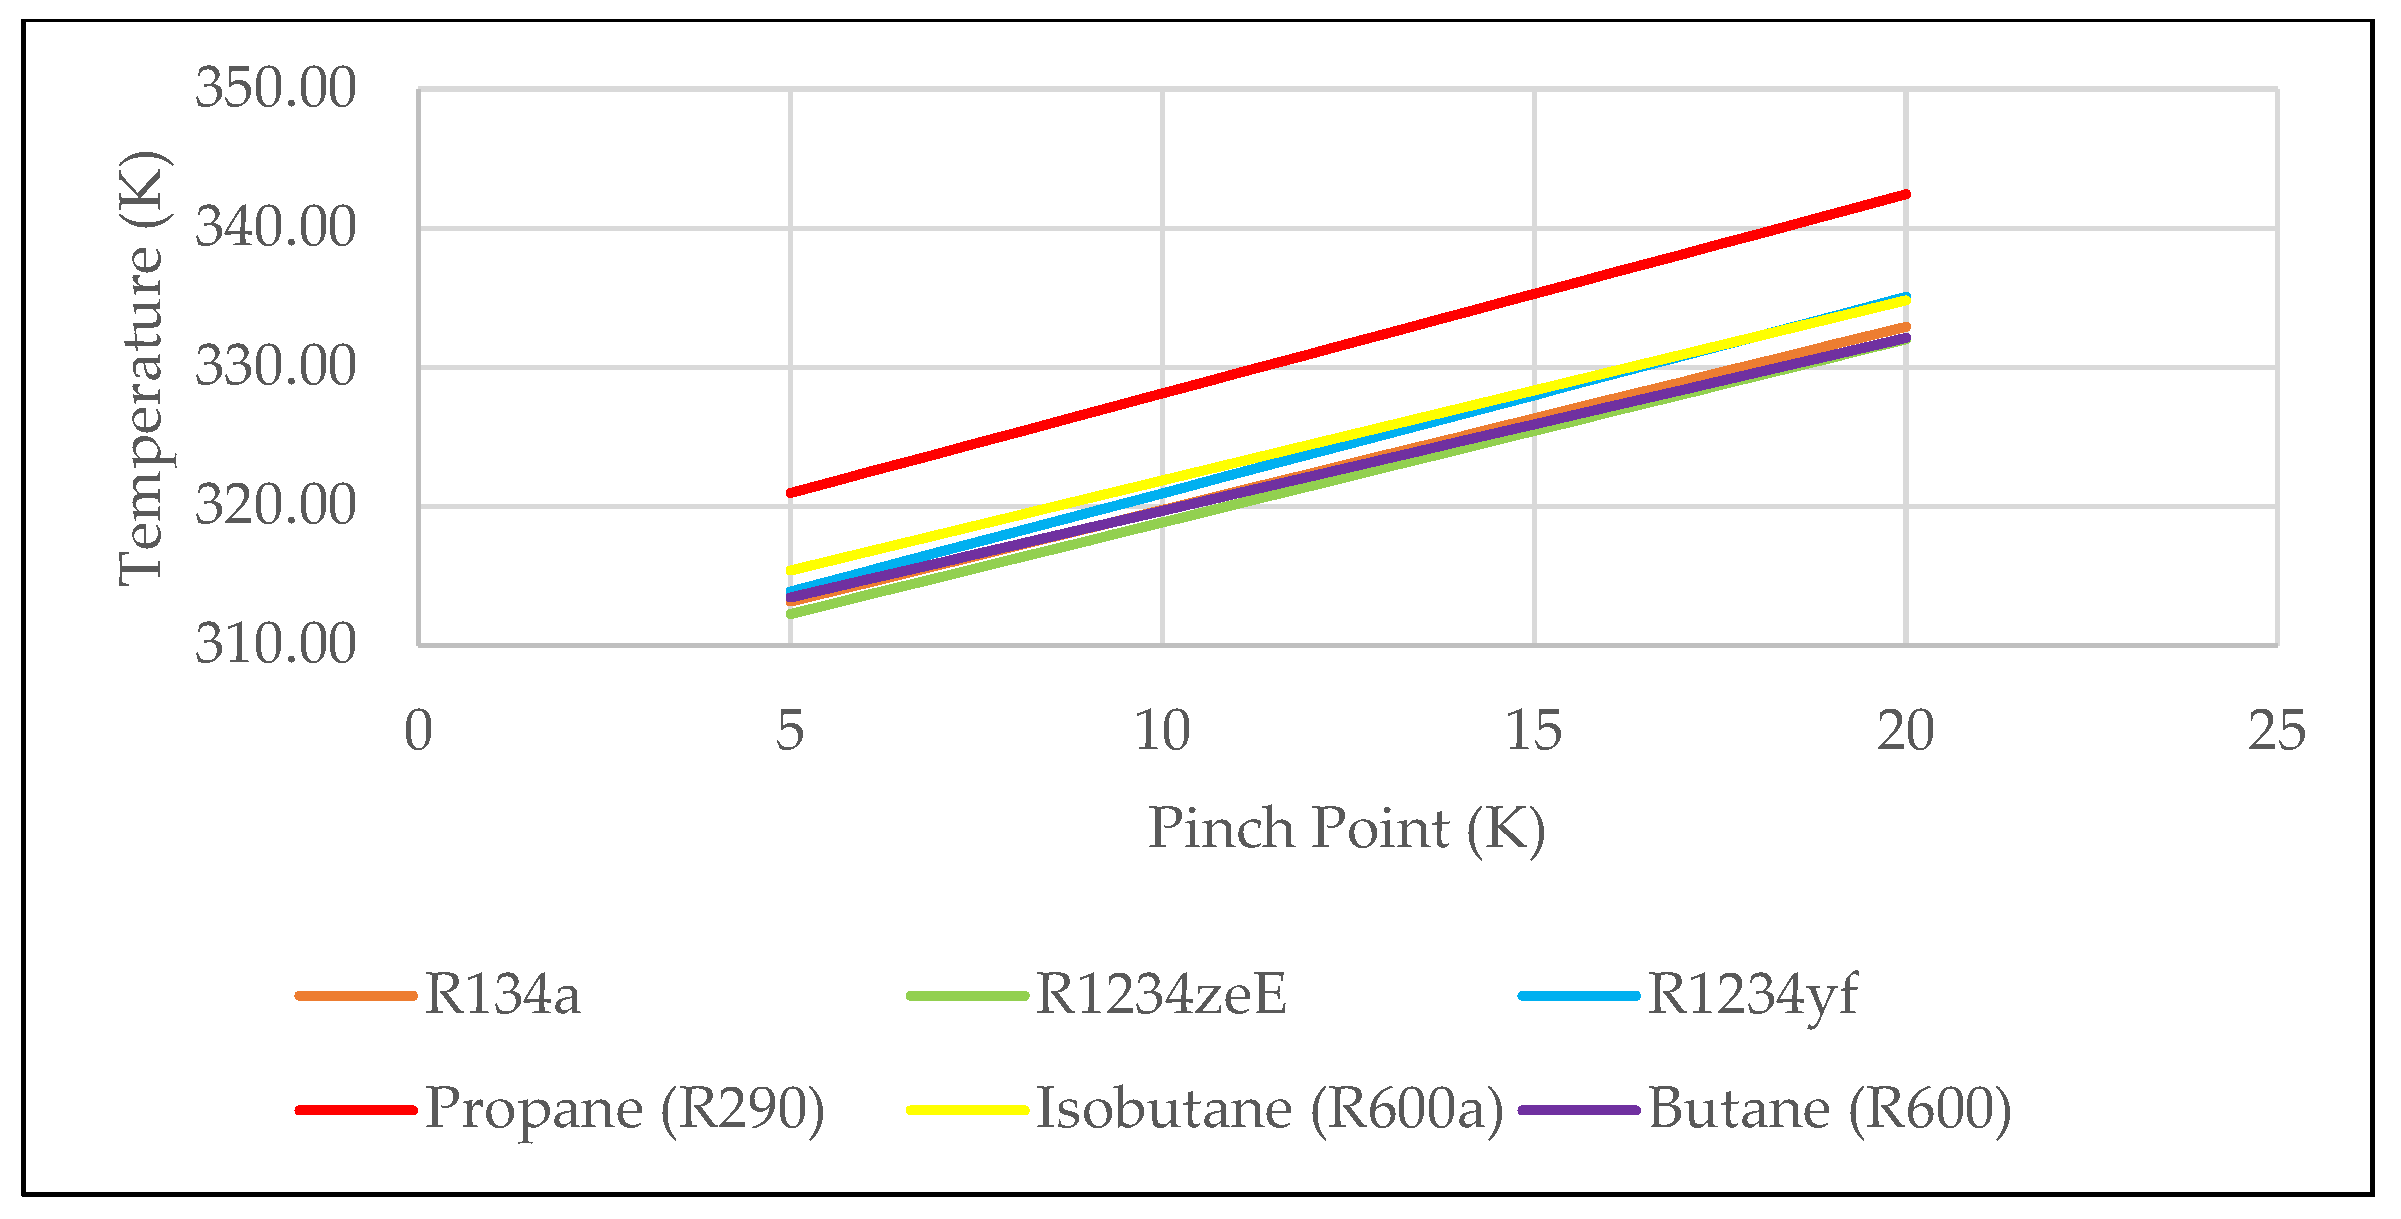
In contrast to approach point temperature difference variation, varying the pinch point temperature difference had a significantly greater impact on the temperature of the working fluid at the outlet of the heat exchanger, as evidenced by the steeper gradient observed in
Figure 8. With the approach point temperature difference fixed at 15 K, increasing the pinch point temperature led to higher outlet temperatures across all working fluids. For R134a, the outlet temperature at a pinch point temperature difference of 5 K was 313.14 K. The highest outlet temperature at this pinch point temperature difference was recorded for Propane (R290), at 320.96 K, which was 7.82 K higher than R134a. In contrast, the lowest outlet temperature at this condition was observed for R1234ze(E), at 312.25 K, which was 0.89 K lower than R134a. When the pinch point temperature difference increased to 20 K, R134a’s outlet temperature rose to 332.92 K, marking an increase of 19.78 K (6.32% higher at the pinch point temperature difference increase of 5 K). Propane (R290) again had the highest outlet temperature at this condition, reaching 342.44 K, which represented a 21.48 K change (6.69%). The lowest outlet temperature at this pinch point temperature difference was recorded for R1234ze(E) at 332.01 K, which is 0.91 K lower than R134a. Nevertheless, this represented a 19.75 K (6.33%) increase from 5 K pinch point temperature difference. The smallest overall increase in outlet temperature across the pinch point temperature difference range was observed for Butane (R600), which rose from 313.45 K at a 5 K pinch point temperature difference to 332.12 K at a 20 K pinch point temperature difference, a total increase of 18.67 K (5.95%). Overall, the data confirm that the pinch point temperature difference has a greater influence on the outlet temperature of the heat transfer fluid than the approach point temperature difference, which induces only minor variations. Pinch point temperature difference dictates the extent and effectiveness of heat utilization across the heat exchanger.
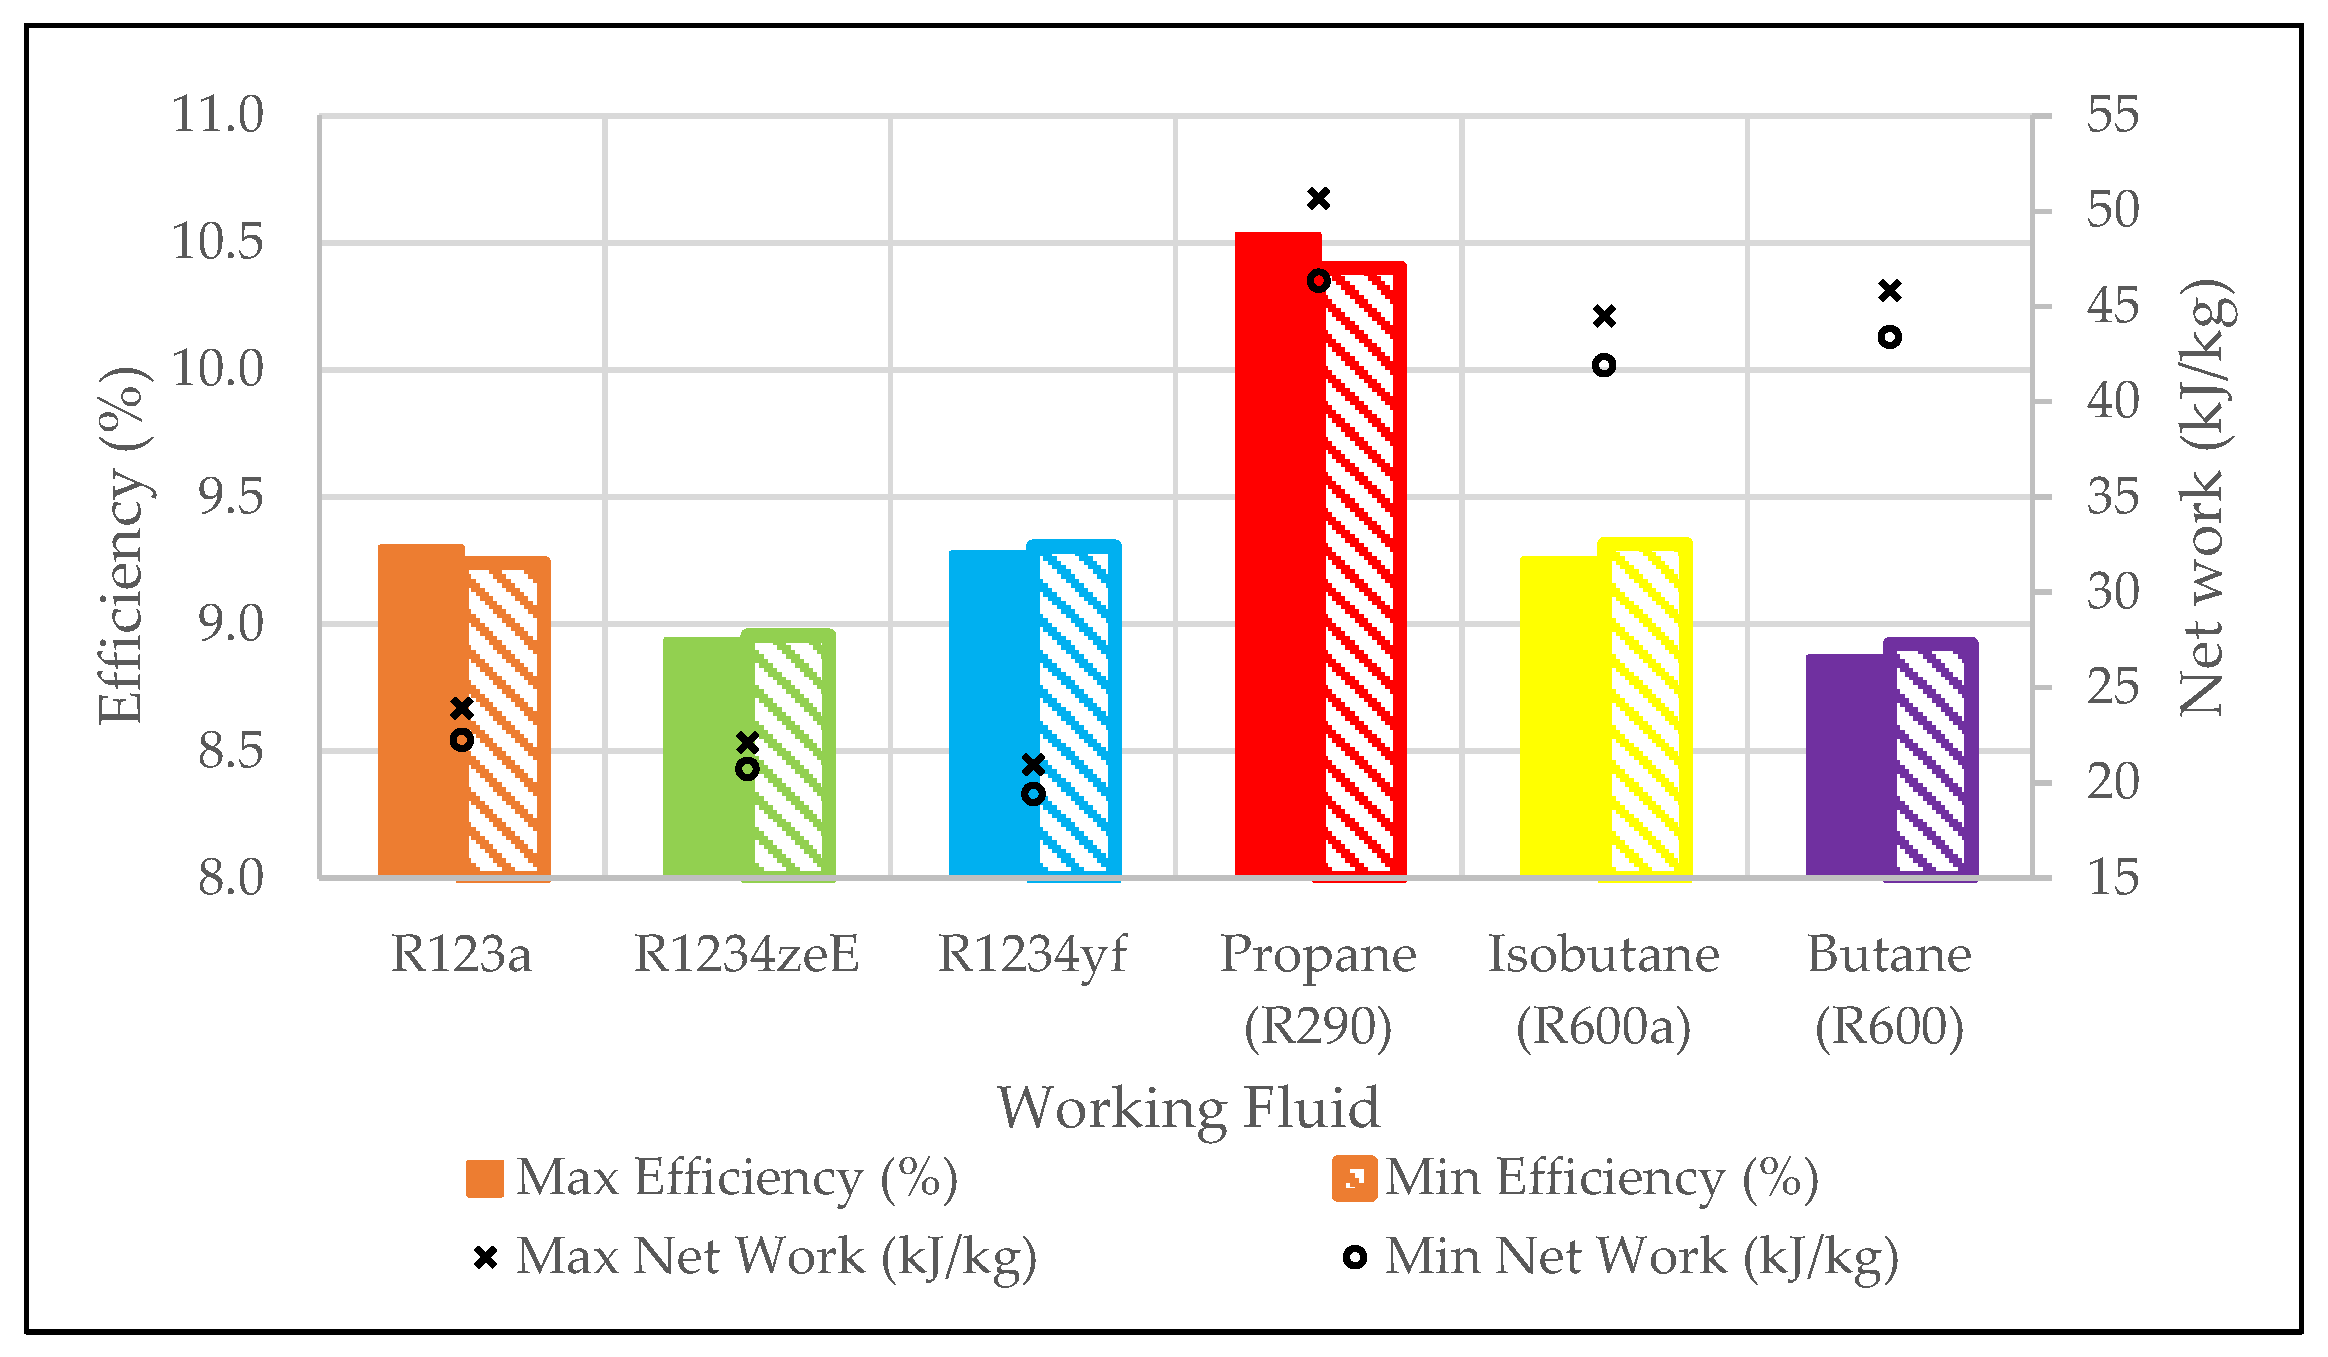
Figure 9 shows the maximum and minimum efficiencies achieved for the different fluids. R134a and Propane demonstrated lower efficiency at an approach point temperature difference of 20 K, while the other fluids achieved maximum efficiency at an approach point temperature of 5 K.
The efficiency for R134a cycle was 9.3% at the approach point temperature difference of 20 K and marginally lower when the approach point temperature difference was 5 K. The highest overall efficiency is achieved with Propane (R290) at an approach point temperature difference of 5 K reaching 10.53%, 1.23% more efficient than R134a at the same approach point. The difference in efficiency for Propane (R290) is a reduction of 0.13%, which is 0.07% more than the equivalent change for R134a. Only R134a and Propane demonstrated lower efficiency at higher approach point temperature difference. The lowest overall efficiency is achieved by Butane (R600), where at an approach point temperature difference of 5 K the efficiency was 8.87%, 0.44% lower than R134a at the same approach point temperature difference. However, at an approach point temperature difference of 20 K, Butane (R600) efficiency increases to 8.92%. The difference between the largest and smallest efficiency at an approach point temperature difference of 5 K is for Propane and Butane (R600) where Butane (R600) reached 1.67% lower efficiency, exhibiting the largest difference in efficiency variation with the approach point temperature difference.
Figure 9 also illustrates the net work for each working fluid as a function of highest and lowest approach point temperature differences. At an approach point temperature difference of 5 K, net work of R134a was calculated to be 23.91 kJ/kg. The highest net work at this condition was produced by Propane (R290), which reached 50.66 kJ/kg, representing an increase of 26.75 kJ/kg compared to R134a. The lowest net work was observed for R1234yf, with a value of 20.96 kJ/kg, which was 2.95 kJ/kg lower than that of R134a. With the approach point temperature difference of 20 K, the net work of R134a decreased to 22.25 kJ/kg, resulting in a total reduction of 1.66 kJ/kg (6.95%). Propane continued to exhibit the highest net work at this condition, with a value of 46.34 kJ/kg, with a margin of 24.09 kJ/kg over R134a. The total change in net work for Propane across the two approach point temperature difference values was 4.32 kJ/kg (8.53% decrease), which is 2.66 kJ/kg more than the reduction experienced by R134a. R1234yf again had the lowest net work at an approach point temperature difference of 20 K, with a value of 19.41 kJ/kg, 2.84 kJ/kg lower than R134a. The change in net work for R1234yf was 1.55 kJ/kg (7.39% decrease), slightly less than the reduction for R134a by 0.11 kJ/kg. The smallest reduction in net work across the tested range of approach point temperature differences was observed for R1234ze(E), which decreased from 22.10 kJ/kg at 5 K to 20.72 kJ/kg at 20 K (6.25% decrease). These results suggest that the approach point temperature difference and, by extension, the maximum operating temperature of the cycle—has the most pronounced effect on Propane (R290), and the least impact on R1234ze(E). Notably, although the thermal efficiency trends varied across working fluids as the approach point temperature difference increased, the net work consistently decreased for all fluids with increasing approach point temperature differences. While Propane (R290) and R134a efficiency slightly decreased as the approach point temperature difference decreased, all other fluids showed a slight increase in efficiency.
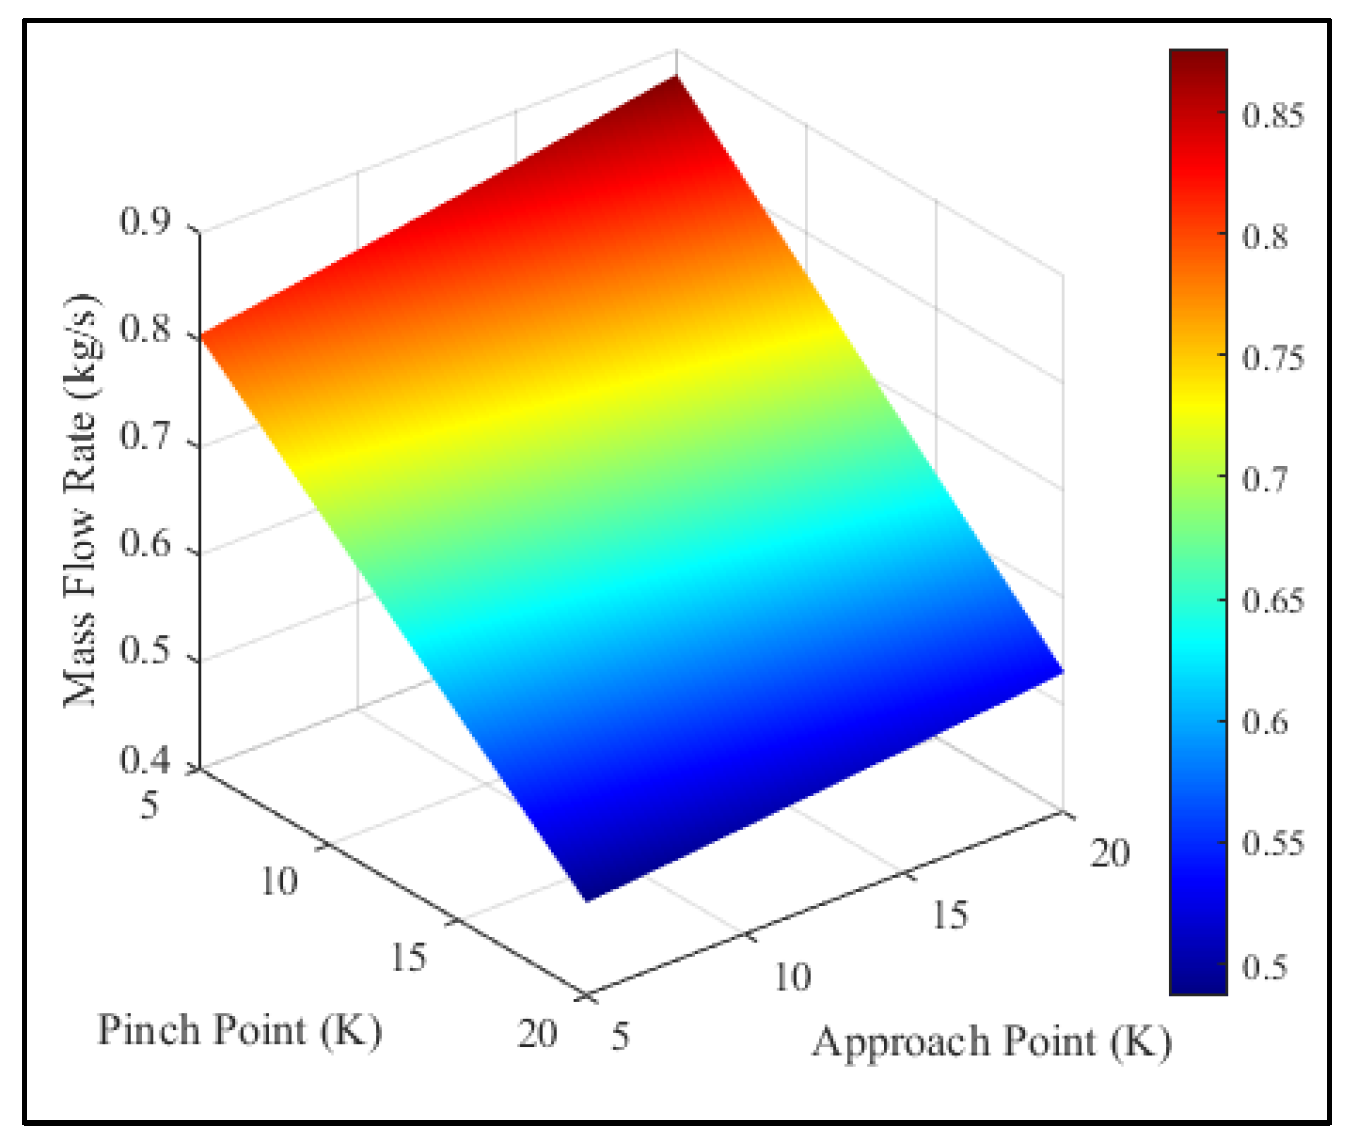
The mass flow rate variation with different pinch point and approach point temperature differences has a direct effect on the rate of heat input necessitated by the system for each working fluid, and consequently on the rate of heat output, pump and turbine power, and ultimately the total net power.
Figure 10 illustrates this trend for R134a, though the same pattern applies to all working fluids. The highest mass flow rate for R134a, 0.88 kg/s, occurs at an approach point temperature difference of 20 K and a pinch point temperature difference of 5 K (
Figure 11). Conversely, the lowest mass flow rate, 0.49 kg/s, is observed at an approach point temperature difference of 5 K and a pinch point temperature difference of 20 K. The graph shows a clear trend: the mass flow rate increases as the approach point temperature difference increases, but decreases as the pinch point temperature difference increases, consistently across all working fluids.
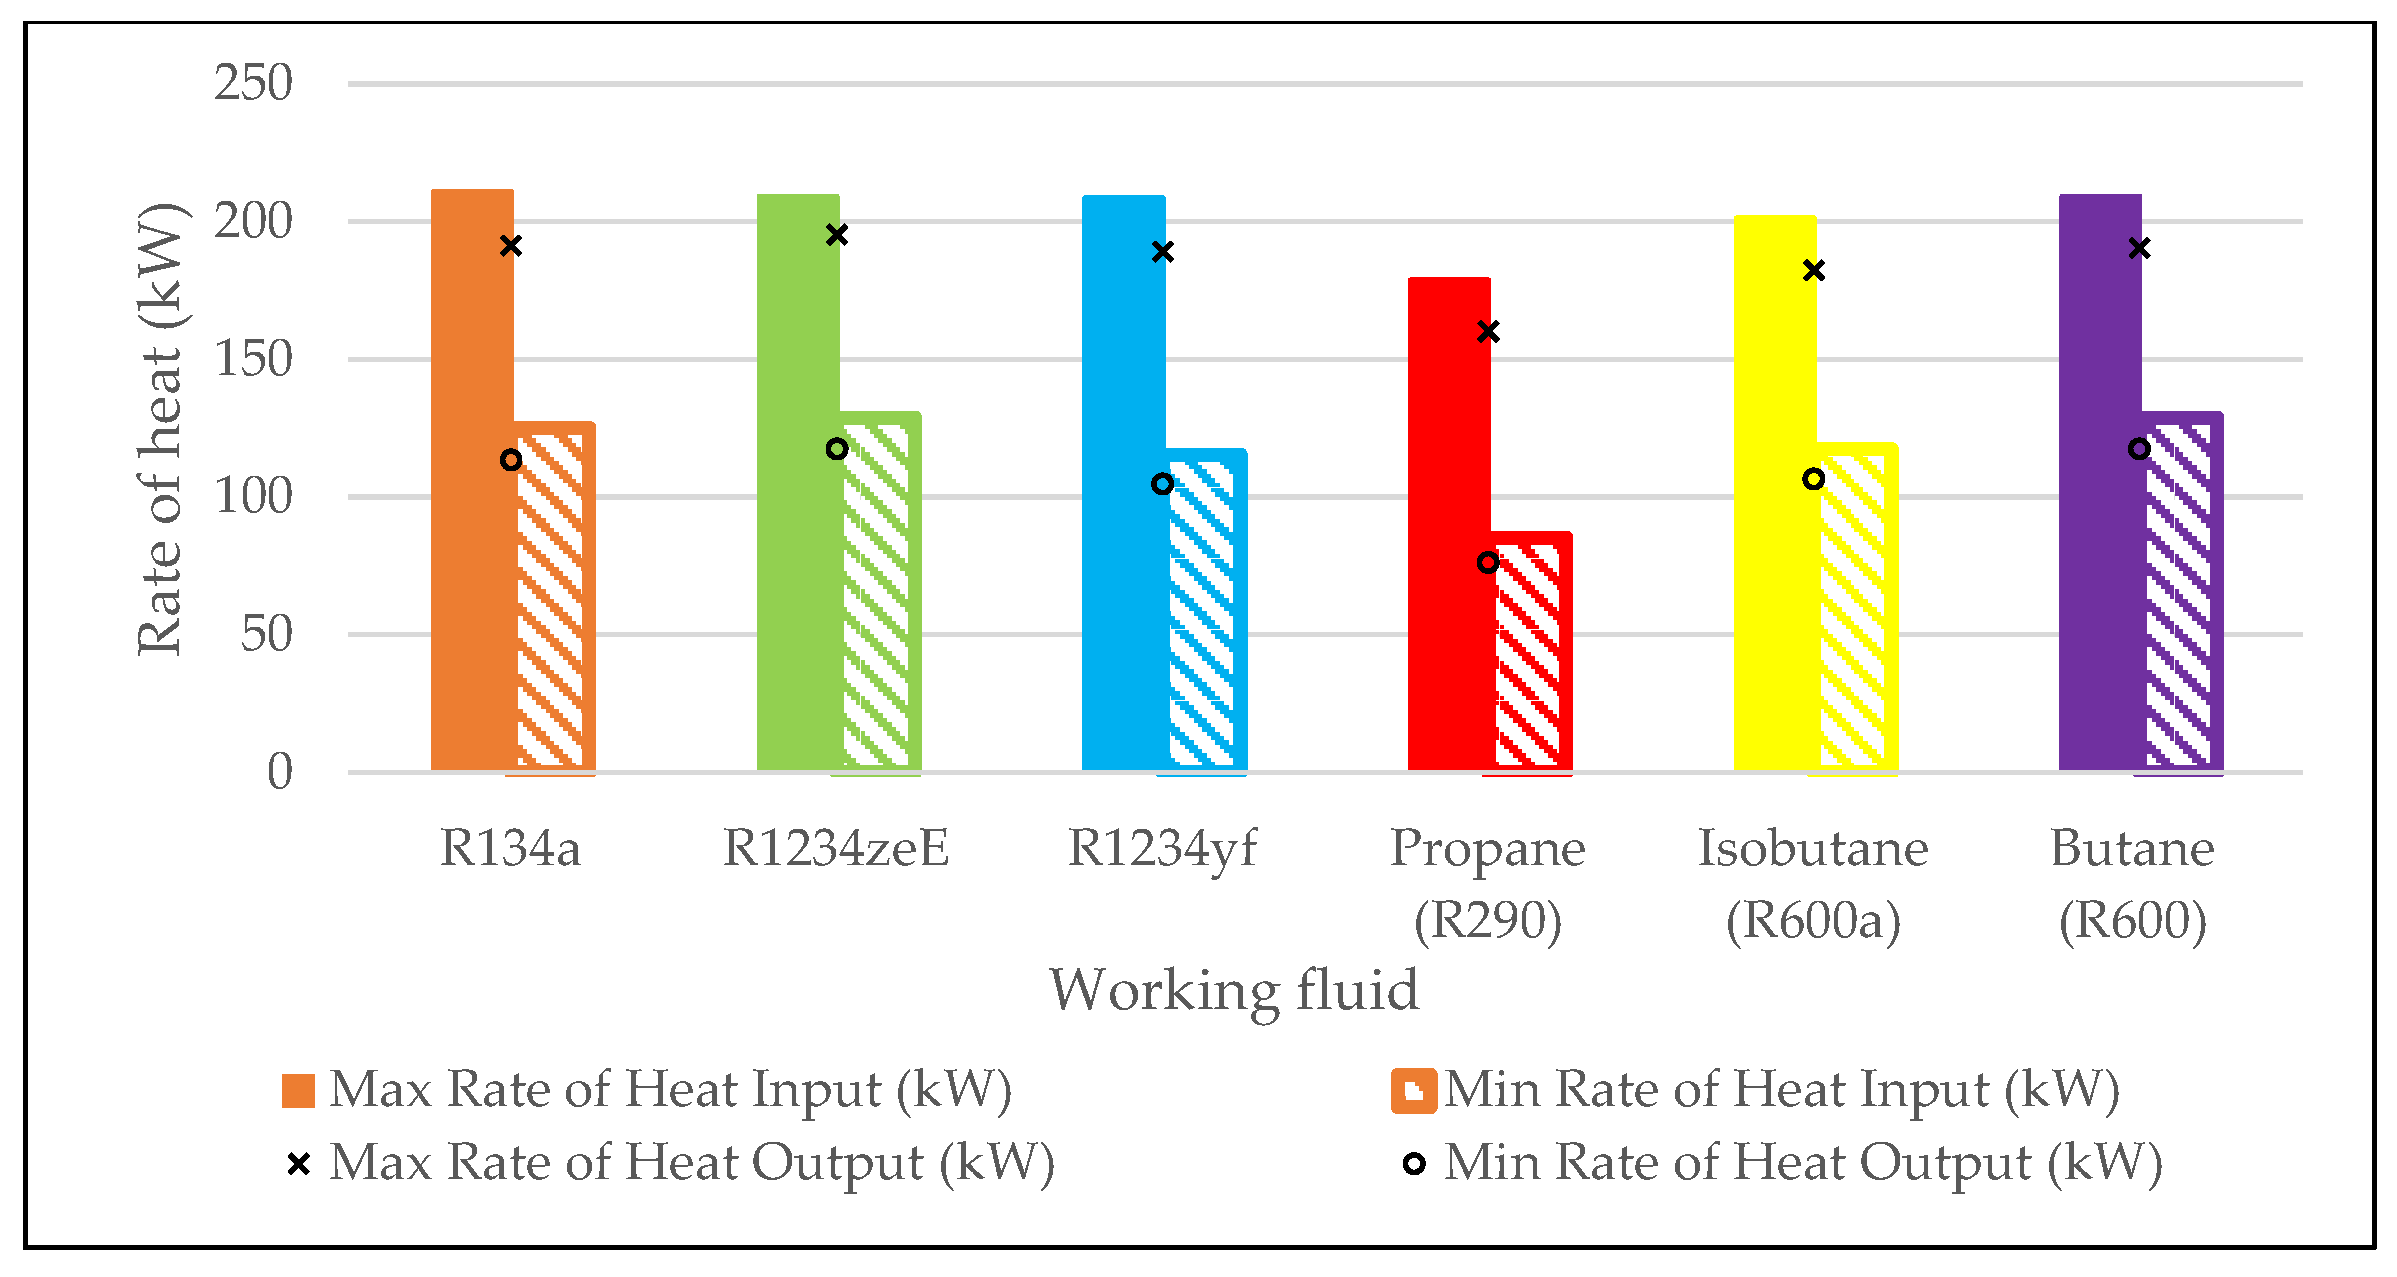
The rate of heat input and output rate follow the same trend as the mass flow rate, varying with the pinch point and approach point temperature differences. The highest rate of heat input for each working fluid occurs at a pinch point temperature difference of 5 K and an approach point temperature difference of 20 K, where mass flow is also at its peak. As shown in
Figure 12, R134a has the highest rate of heat input at 210.92 kW, while Propane (R290) has the lowest at 178.83 kW, 32.09 kW lower. Conversely, the lowest rate of heat input occurs at a pinch point temperature difference of 20 K and an approach point temperature difference of 5 K, for R134a, an 85.84 kW (40.7%) change. Butane (R600) has the highest minimum rate of heat input at 128.88 kW at this point, 3.79 kW higher than R134a, whereas an equivalent value for Propane (R290) was 85.13 kW, 39.95 kW lower than R134a. The greatest difference between the max and min rate of heat input was for Propane (R290) a 93.7 kW variation (52.4%), a 7.86 kW greater reduction than R134a. For Butane (R600) it changes from 209.15 kW to 128.88 kW, an 80.28 kW reduction (38.38%), 5.56 kW smaller reduction than R134a.
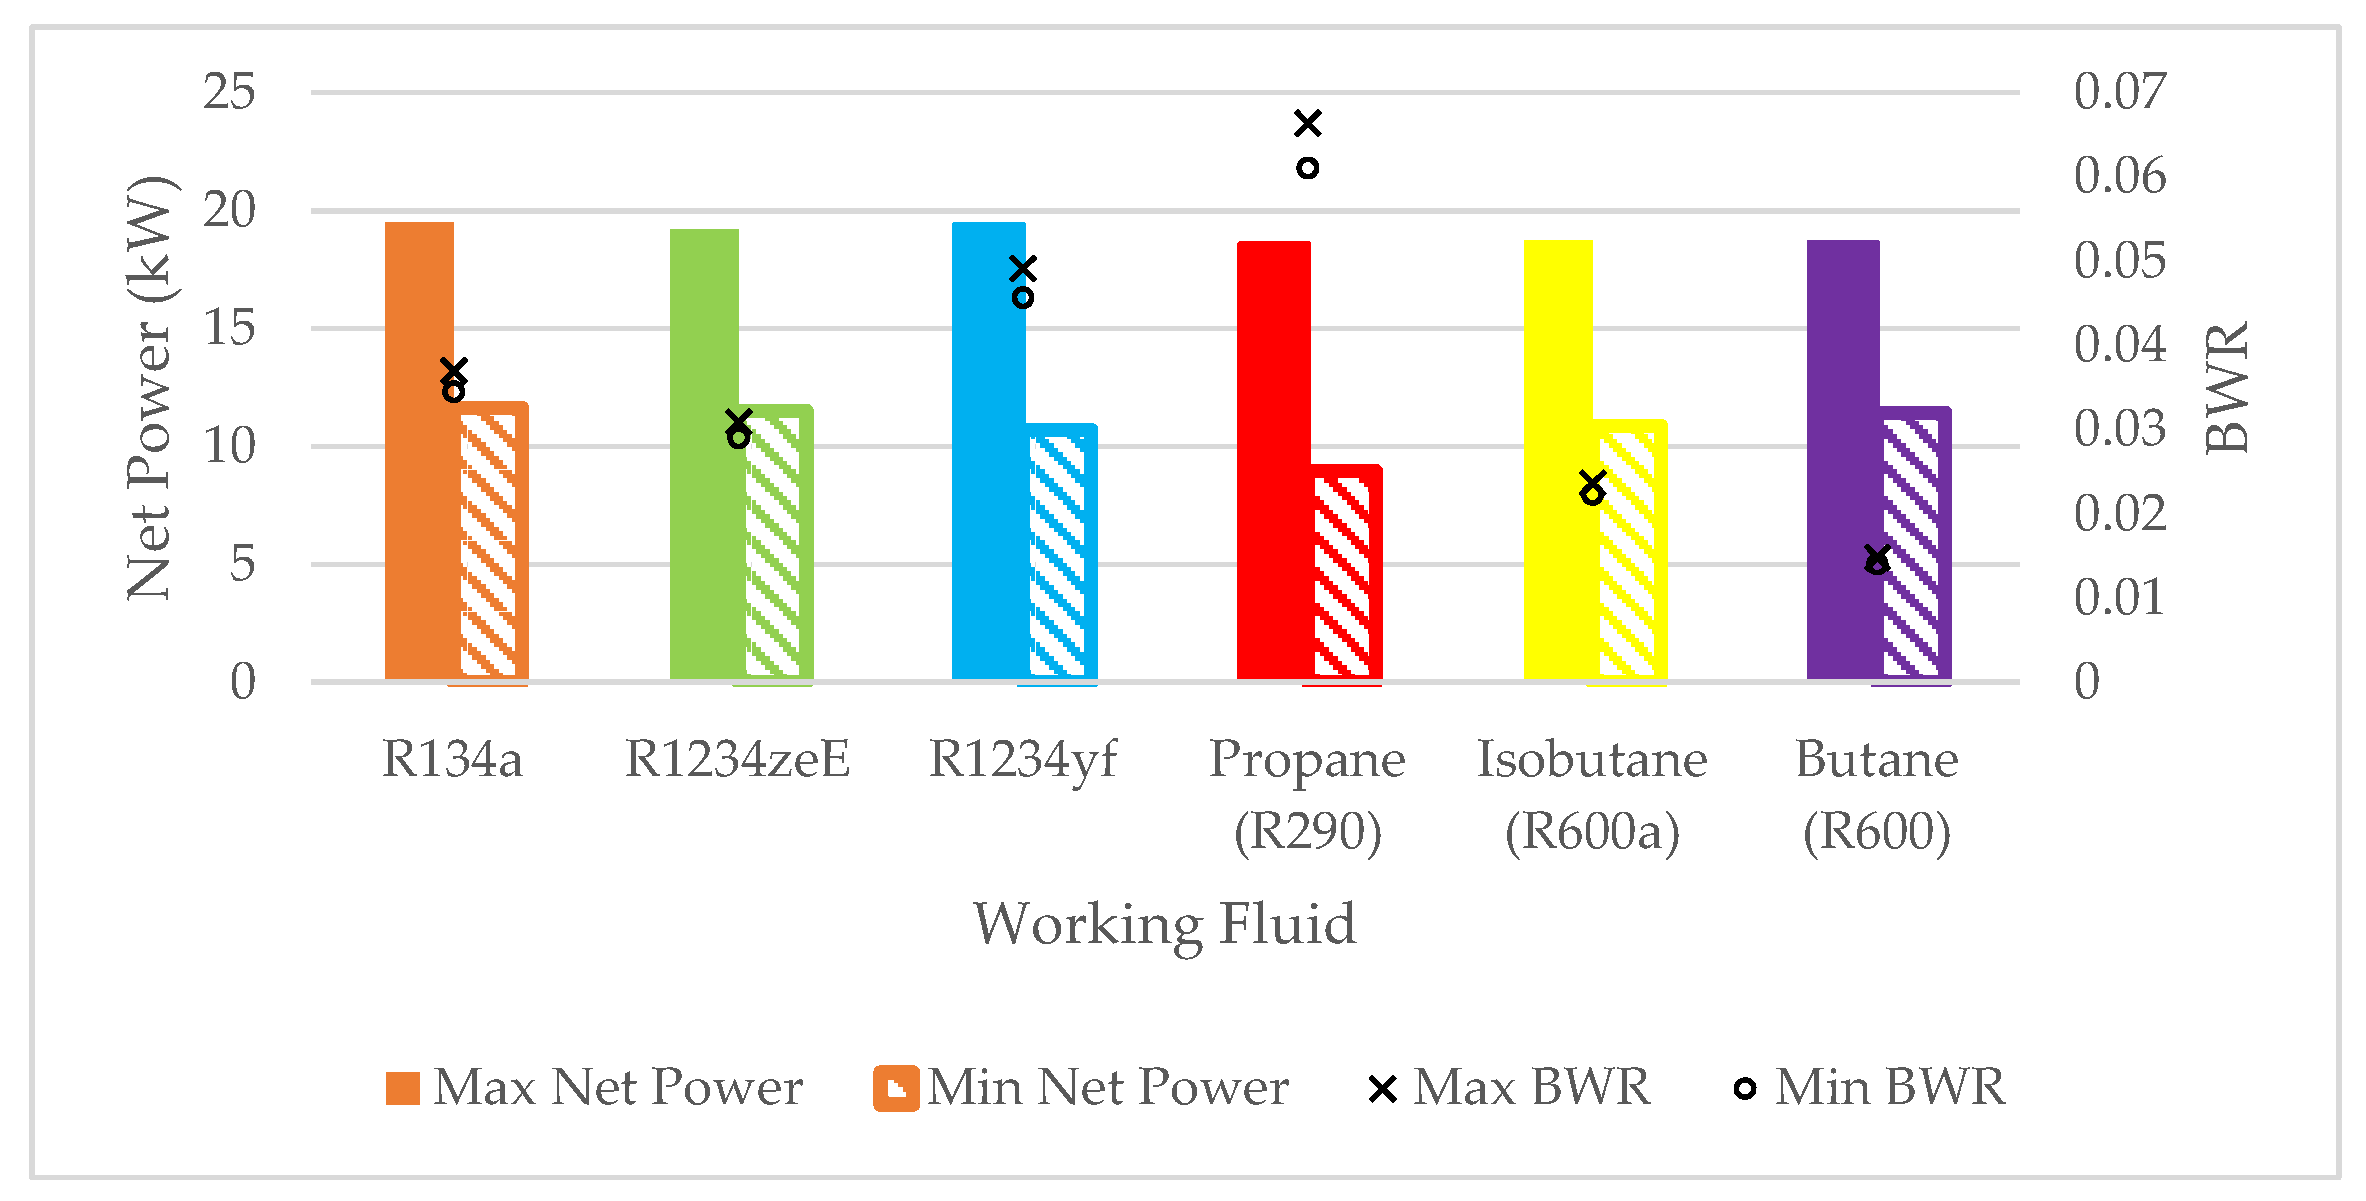
The maximum net power, turbine power, and pump power for all working fluids were obtained when the pinch point and approach point temperature differences were 5 K and 20 K, respectively. Under these conditions, R134a produced the highest net power of 19.49 kW, as seen in
Figure 13, the greatest power of all the working fluids assessed. The lowest net power at the same temperature differences was observed for Propane (R290), with a value of 18.60 kW—representing a 0.89 kW reduction compared to R134a. When the pinch point and approach point temperature differences were reversed to 20 K and 5 K, net power of R134a decreased to 11.64 kW, a drop of 7.85 kW (40.29%). Propane (R290) again exhibited the lowest net power at these settings, generating 8.97 kW, which is 2.67 kW less than that of R134a, and a total reduction of 9.63 kW (51.78%)—the largest reduction between maximum and minimum net power, 1.78 kW greater than R134a. The smallest reduction in net power was for Butane (R290), which decreased from 18.66 kW at a pinch point temperature difference of 5 K and an approach point temperature difference of 20 K to 11.43 kW at the opposite setting of 20 K and 5 K, representing a reduction 0.62 kW less than R134a.
The trend was similar for turbine power. At a pinch point temperature difference of 5 K and an approach point temperature difference of 20 K, R134a reached a turbine output of 20.24 kW. However, the highest turbine power under these conditions was recorded for R1234yf, with a value of 20.42 kW, which was 0.18 kW higher than R134a. The lowest turbine output was observed for Butane (R600), which produced 18.94 kW—1.30 kW less than R134a. When the pinch and approach temperature differences were altered to 20 K and 5 K, R134a had the highest turbine power at 12.05 kW under these minimum conditions, showing an 8.18 kW or 40.44% reduction from its maximum turbine power. Propane (R290), in contrast, had the lowest turbine power at 9.55 kW, which was 2.50 kW below that of R134a and also a 10.37 kW (52.06%) reduction from its highest turbine power of 19.92 kW. This was the largest change in turbine power and 2.19 kW larger than R134a’s change. Butane (R290) dropped to 11.59 kW under these altered temperature differences from its original 18.94 kW, showing a 7.35 kW (38.79%) reduction—0.85 kW smaller than R134a’s decrease and the smallest change in turbine power seen across all working fluids.
Pump power requirement followed a comparable pattern. The highest pump power for all working fluids occurred at the 5 K pinch point temperature difference and 20 K approach point temperature difference. For R134a, the pump power was 0.75 kW. Propane (R290) recorded the highest value overall, with a pump power of 1.32 kW, which was 0.57 kW more than that of R134a. The lowest pump power at these settings was seen in Butane (R600), with a value of 0.28 kW, or 0.47 kW less than R134a. When the pinch and approach point temperature differences were changed to 20 K and 5 K, R134a’s pump power decreased to 0.42 kW—a reduction of 0.33 kW (44.43%) from its maximum value. Propane (R290) again had the highest pump power at 0.58 kW under these minimum conditions, which was 0.74 kW (55.9%) lower than its own maximum but still 0.17 kW higher than R134a. This was the largest change in pump power recorded. The lowest pump power overall was observed for Butane (R600), with a value of 0.16 kW, 0.12 kW (42.01%) lower than its maximum and 0.26 kW below that of R134a in the same conditions. This represented the smallest change in pump power recorded.
The Back-Work Ratio (BWR), calculated as the ratio of pump power to turbine power, followed logically from these power trends, is also displayed in
Figure 13. It was highest at an approach point temperature difference of 20 K and lowest at 5 K, with the pinch point temperature difference having no influence on this ratio due to the linear increase in both pump and turbine power. Due to its comparatively high pump power, Propane (R290) exhibited the largest BWR at both approach point temperature difference settings, while Butane (R600), which consistently had the least pump power, showed the smallest BWR in all cases.
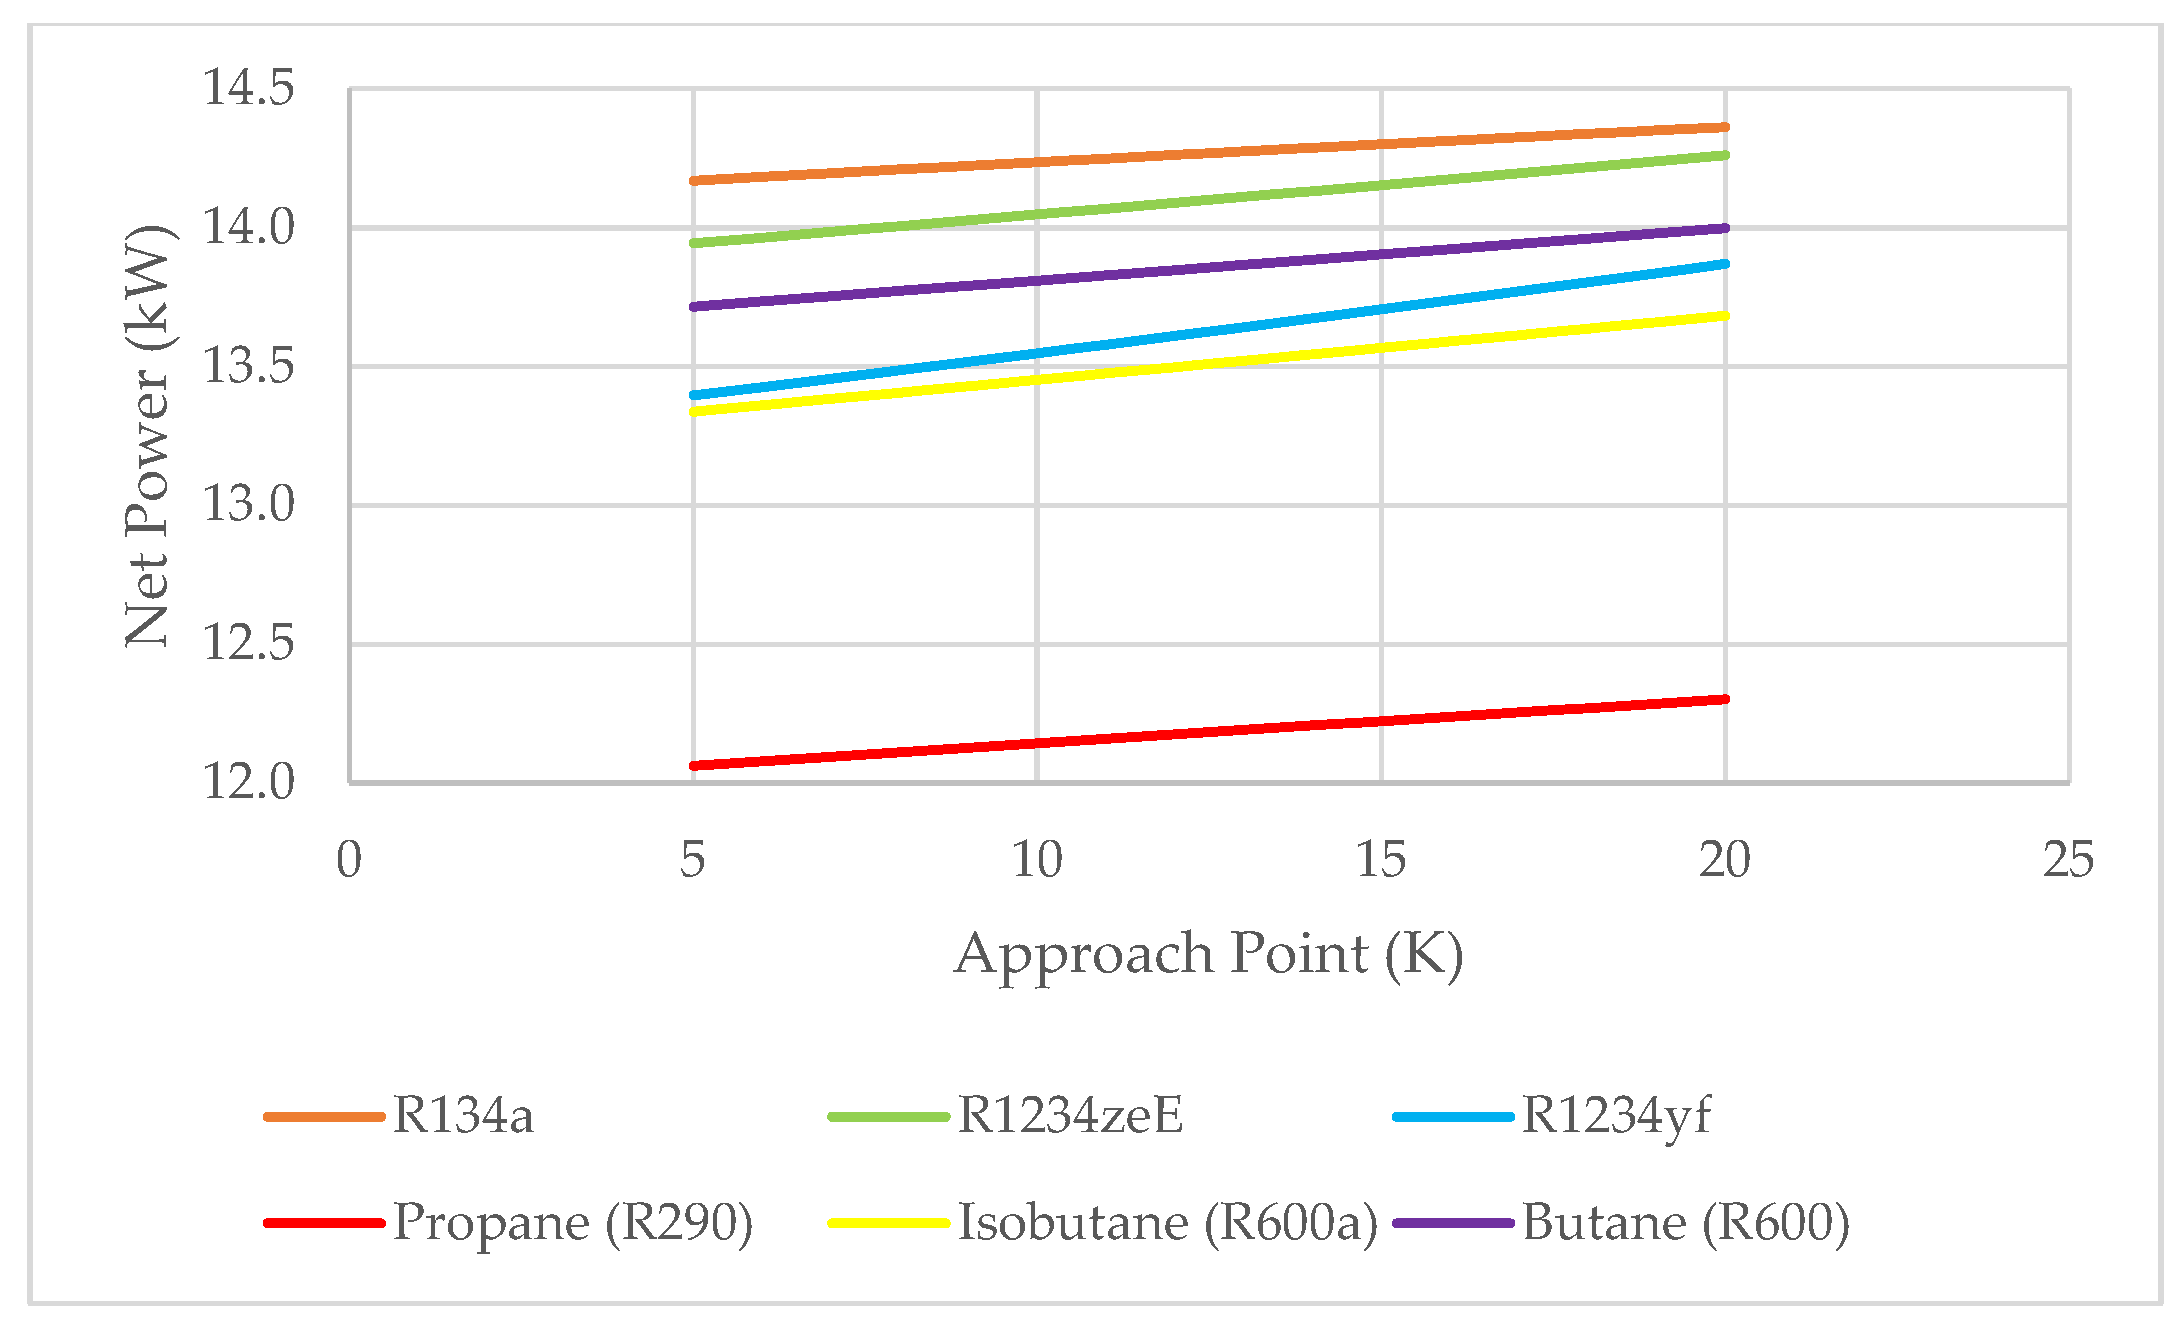
For a fixed pinch point temperature difference of 15 K, the net power for R134a increased from 14.17 kW at a 5 K approach point temperature difference to 14.36 kW at a 20 K approach point temperature difference, as seen in
Figure 14—an increase of 0.19 kW (1.36%), which is also the smallest increase across the range of approach point temperature differences. The most significant increase at this fixed pinch point temperature difference is for R1234yf, which rises from 13.4 kW at an approach point temperature difference of 5 K to 13.87 kW at 20 K—an increase of 0.47 kW (3.54%), which is 0.28 kW more than R134a. At the same fixed pinch point temperature difference of 15 K and an approach point temperature difference of 5 K, Propane had the lowest net power of 12.06 kW, 2.11 kW lower than R134a. At the same pinch point temperature difference and a 20 K approach point temperature difference, Propane’s net power was 12.3 kW, 2.06 kW below R134a, showing an increase of 0.24 kW across the range—0.05 kW greater than R134a’s increase.
At a fixed approach point temperature difference of 15 K, R134a’s net power decreases from 19.4 kW at a 5 K pinch point temperature difference to 11.75 kW at 20 K, a reduction of 7.66 kW or 39.47% as seen in
Figure 15. Propane again recorded the lowest net power at both these points—18.48 kW at a 5 K pinch point temperature difference, 0.92 kW less than R134a, and 9.09 kW at 20 K, 2.66 kW less—representing a decrease of 9.39 kW (50.83%), which is 1.73 kW more than R134a’s drop. The smallest change in net power across the pinch point temperature difference range was observed for Butane (R600), which decreased from 18.53 kW (0.87 kW less than R134a) at a pinch point temperature difference of 5 K to 11.59 kW (0.16 kW less than R134a) at 20 K—a drop of 6.94 kW (37.48%), which is 0.71 kW smaller than R134a’s decrease.
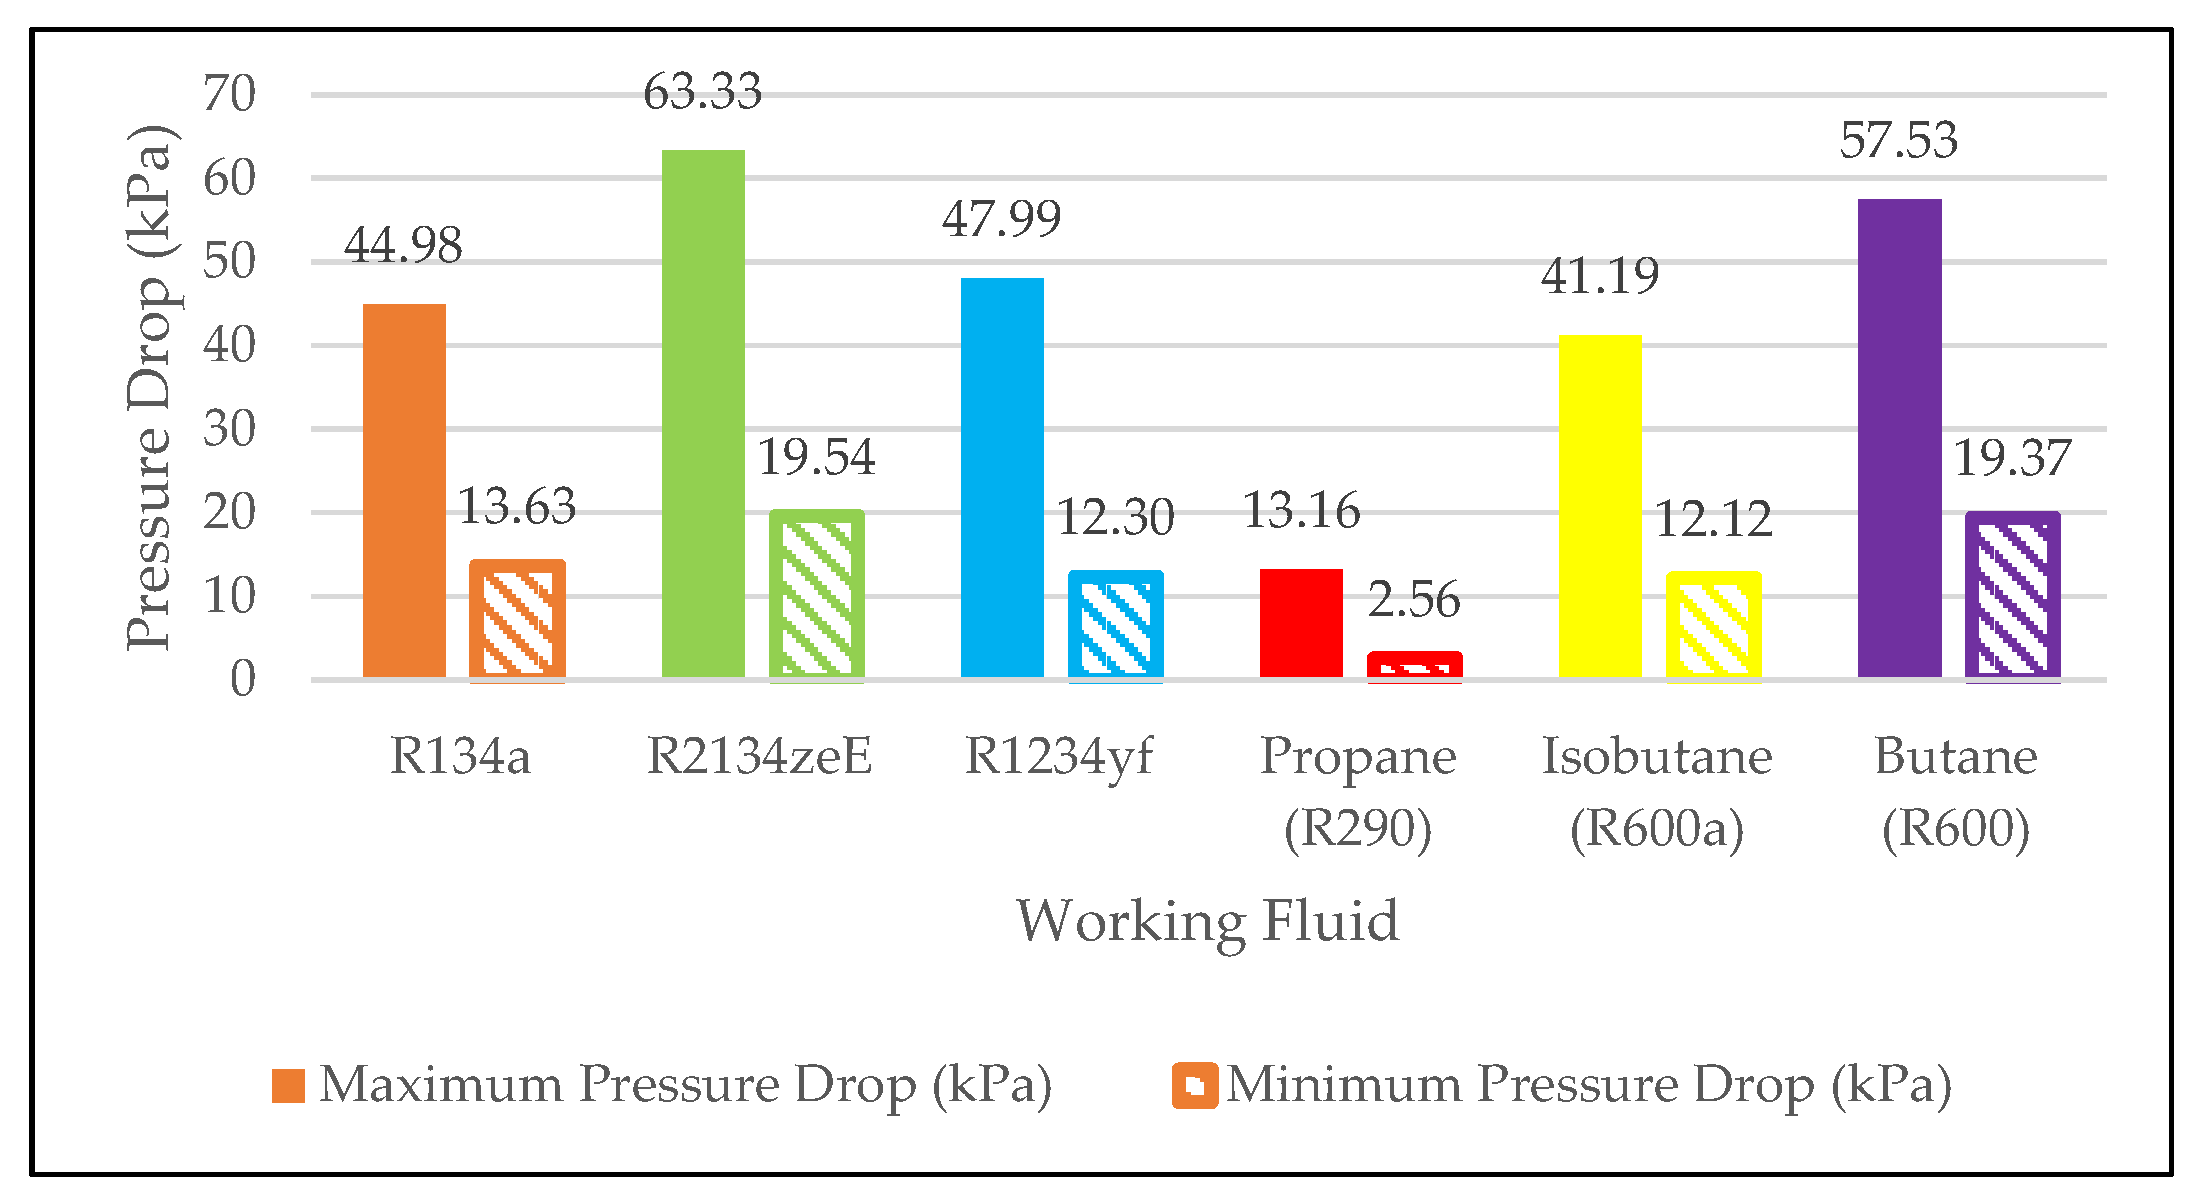
The maximum pressure drop for each working fluid occurred under a 5 K pinch point temperature difference and a 20 K approach point temperature difference, as seen in
Figure 16. For R134a, this was 44.98 kPa (3.68% of its maximum pressure of 1223.8 kPa). R1234ze(E) exhibited the highest pressure drop, at 63.33 kPa (6.98% of its maximum pressure of 907.7 kPa), 18.35 kPa higher than R134a. In contrast, Propane (R290) had the lowest pressure drop, at 13.16 kPa (0.68% of its maximum pressure of 1928.9 kPa), 31.82 kPa lower than R134a. The minimum pressure drops occurred under the opposite condition—20 K pinch point temperature difference and 5 K approach point temperature difference. R134a recorded 13.63 kPa (1.11% of its maximum pressure), giving it a range of 31.35 kPa between maximum and minimum values, which is 69.7% decrease in pressure drop from the maximum and minimum values. R1234ze(E) again had the highest value, 19.54 kPa (2.15% of its maximum pressure), which was 5.92 kPa higher than R134a. Its overall variation was 43.79 kPa—12.43 kPa, greater than that of R134a. Propane once more had the lowest drop, at 2.56 kPa (0.13% of its maximum pressure), 11.07 kPa below R134a, with a total range of 10.6 kPa—20.75 kPa less than that of R134a.
When the pinch point temperature difference was fixed at 15 K, the pressure drop exhibited a non-linear increase with a rising approach point temperature difference, as shown in
Figure 17. At an approach point temperature difference of 5 K, R134a experienced a pressure drop of 20.33 kPa (1.66% of its maximum pressure of 1223.8 kPa), while R1234ze(E) recorded the highest drop at 28.85 kPa (3.18% of its maximum pressure of 907.7 kPa), 8.53 kPa greater than R134a. In contrast, Propane (R290) had the lowest pressure drop at 4.63 kPa (0.24% of its maximum pressure of 1928.9 kPa), which was 15.69 kPa lower than R134a. As the approach point temperature difference increased to 20 K, with the pinch point temperature difference still fixed at 15 K, R134a’s pressure drop rose to 23.97 kPa (1.96% of its maximum pressure). R1234ze(E) again showed the largest drop at 34.12 kPa (3.76%), 10.14 kPa higher than R134a, while Propane remained the lowest at 5.75 kPa (0.3%), 18.23 kPa below R134a. The total pressure drop variation for R134a across these two approach point values was 3.65 kPa, equivalent to a 17.93% increase, with R1234ze(E) showing the greatest variation at 5.26 kPa—1.62 kPa higher than R134a—and Propane the least, at 1.11 kPa, which was 2.53 kPa lower than R134a.
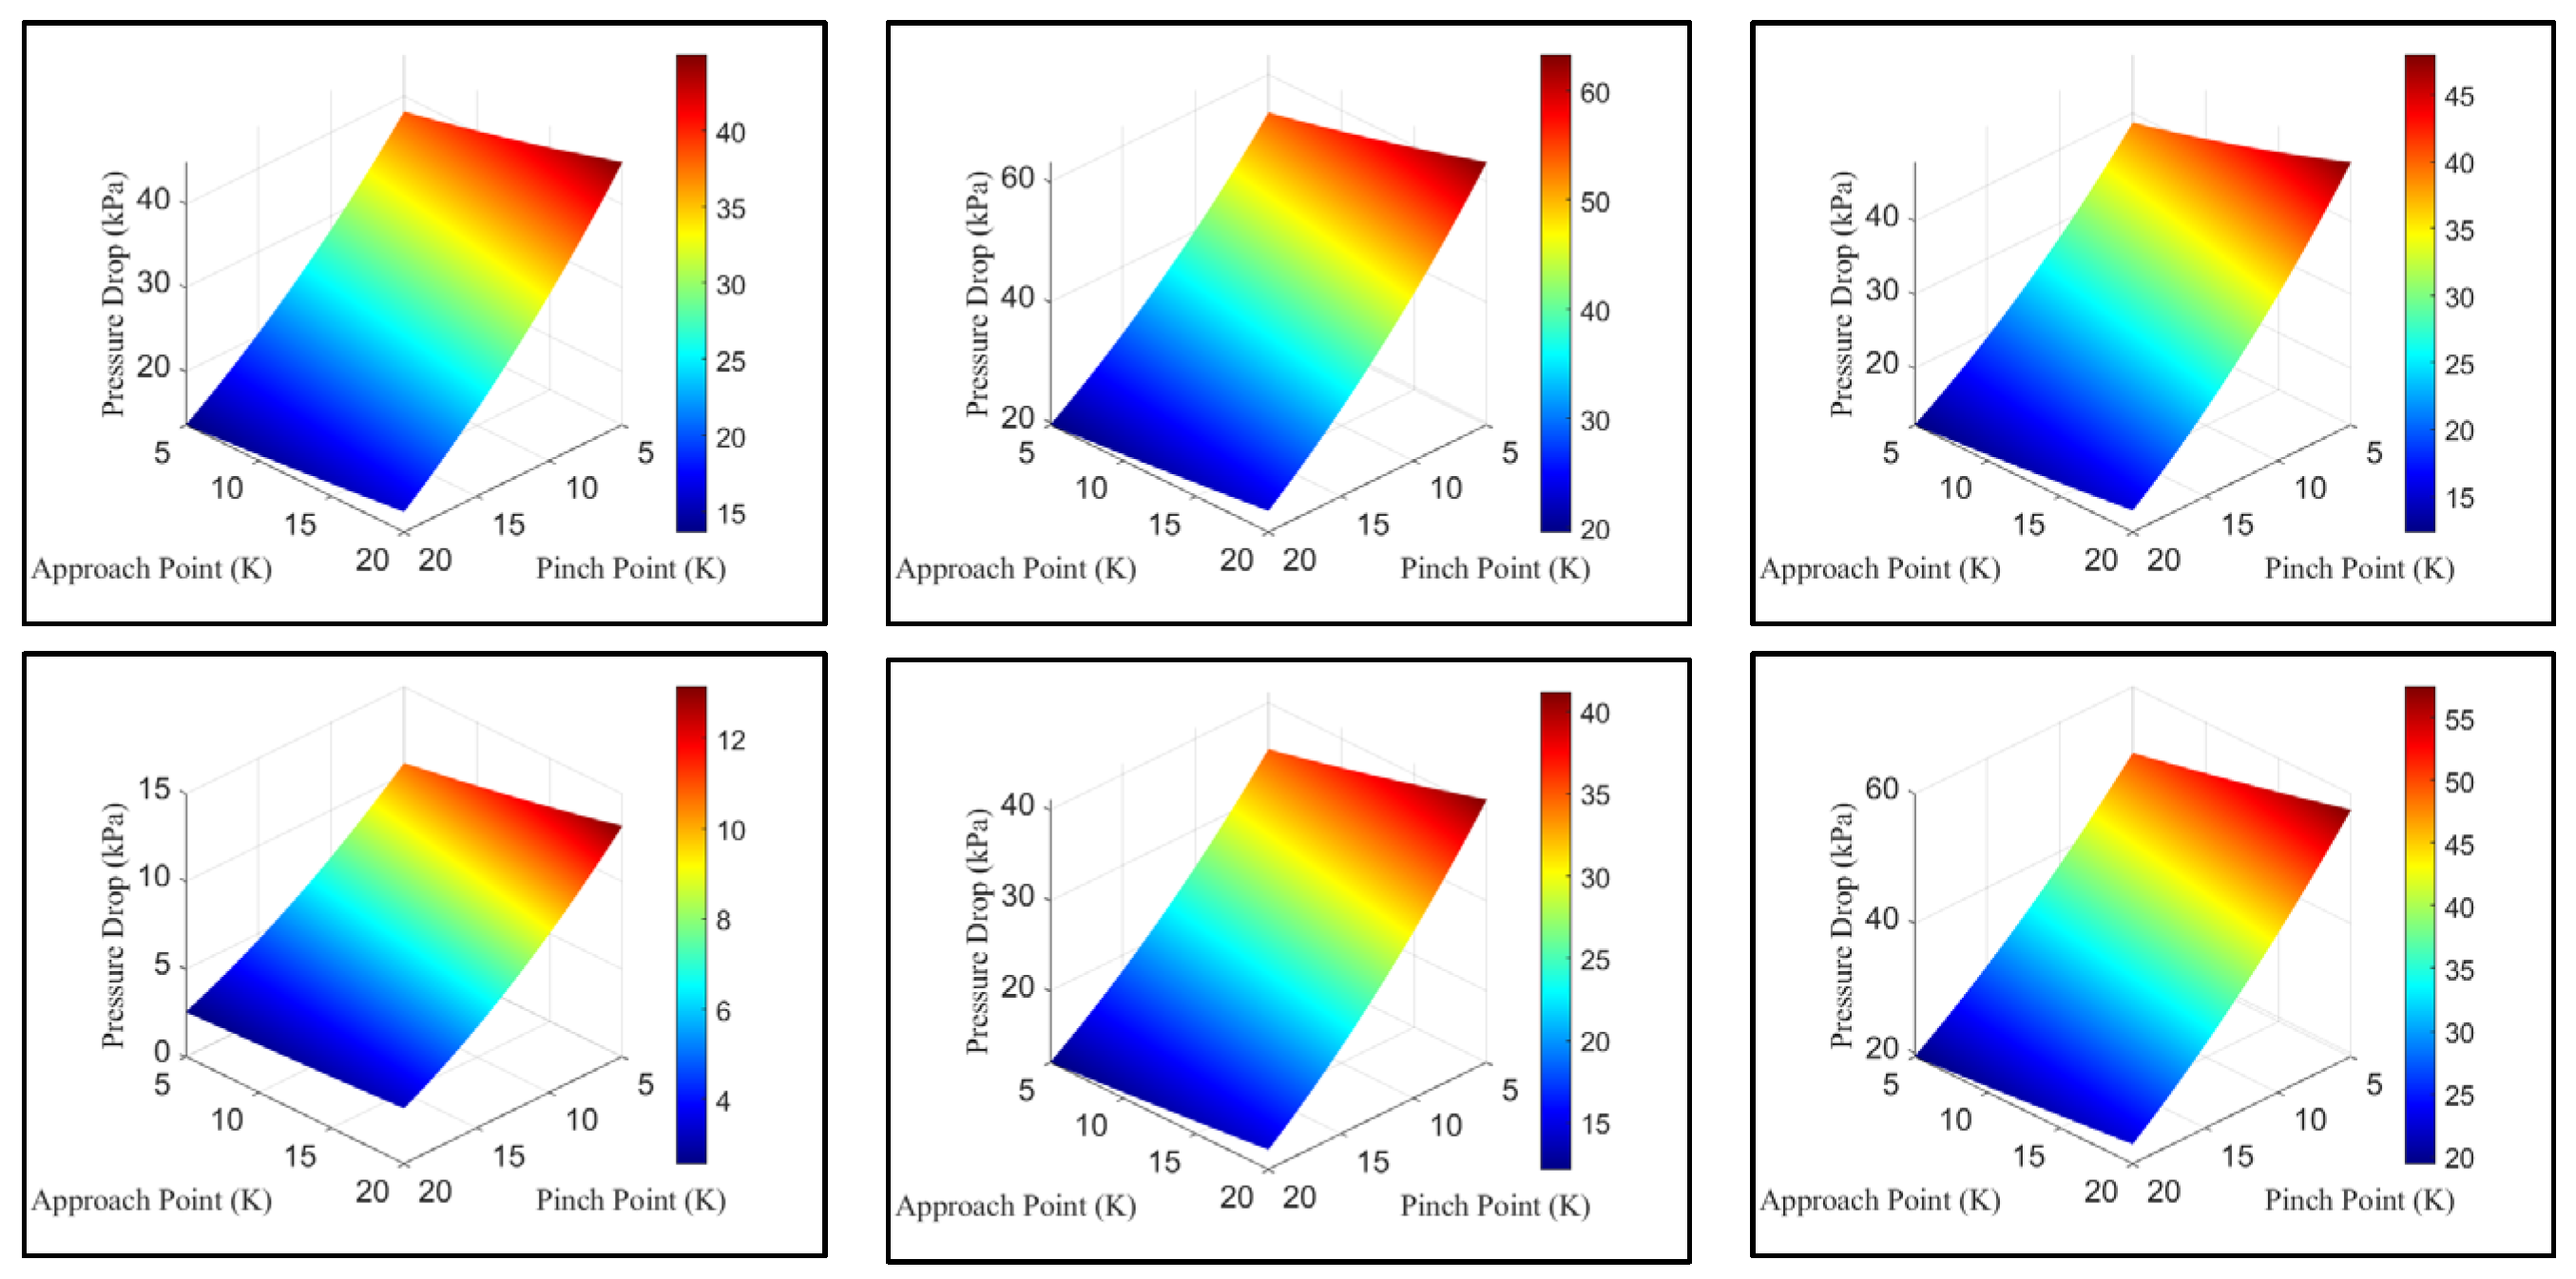
In contrast, when the approach point temperature difference was fixed at 15 K and the pinch point temperature difference was varied, the pressure drop showed a non-linear decrease with an increasing pinch point temperature difference, resulting in a more significant impact on pressure drop than when varying the approach point, as seen in
Figure 18. At a pinch point temperature difference of 5 K, R134a recorded a pressure drop of 42.42 kPa (3.47% of its maximum pressure), while R1234ze(E) again showed the highest value at 59.75 kPa (6.58% of its maximum pressure), 17.33 kPa higher than R134a. Propane remained the lowest at this point, dropping by 12.21 kPa (0.63%), which was 30.21 kPa less than R134a. When the pinch point temperature difference increased to 20 K, R134a’s pressure drop decreased to 15.19 kPa (1.24%), with R1234ze(E) still exhibiting the highest value at 21.82 kPa (2.4%), 6.63 kPa more than R134a, and Propane again the lowest at 2.94 kPa (0.15%), 12.24 kPa below R134a. The total pressure drop variation for R134a across the two pinch point temperature difference values was 27.23 kPa, reflecting a 64.2% decrease, while R1234ze(E) had the largest variation at 37.93 kPa—10.7 kPa more than R134a—and Propane had the smallest at 9.26 kPa, which was 17.97 kPa less than R134a. When fixing the pinch point temperature difference, changes in approach point temperature difference led to modest, non-linear increases in pressure drop. In comparison, varying the pinch point temperature difference while keeping the approach point temperature difference fixed resulted in much larger changes, showing that the system is more sensitive to pinch point variations. Across all cases, R1234ze(E) consistently had the highest pressure drops and variation, while Propane (R290) had the lowest, highlighting clear differences in how each fluid responds to changes in thermal conditions. Variation in the pressure drop with pinch point and approach point temperature difference is given for all fluids in
Figure 19.
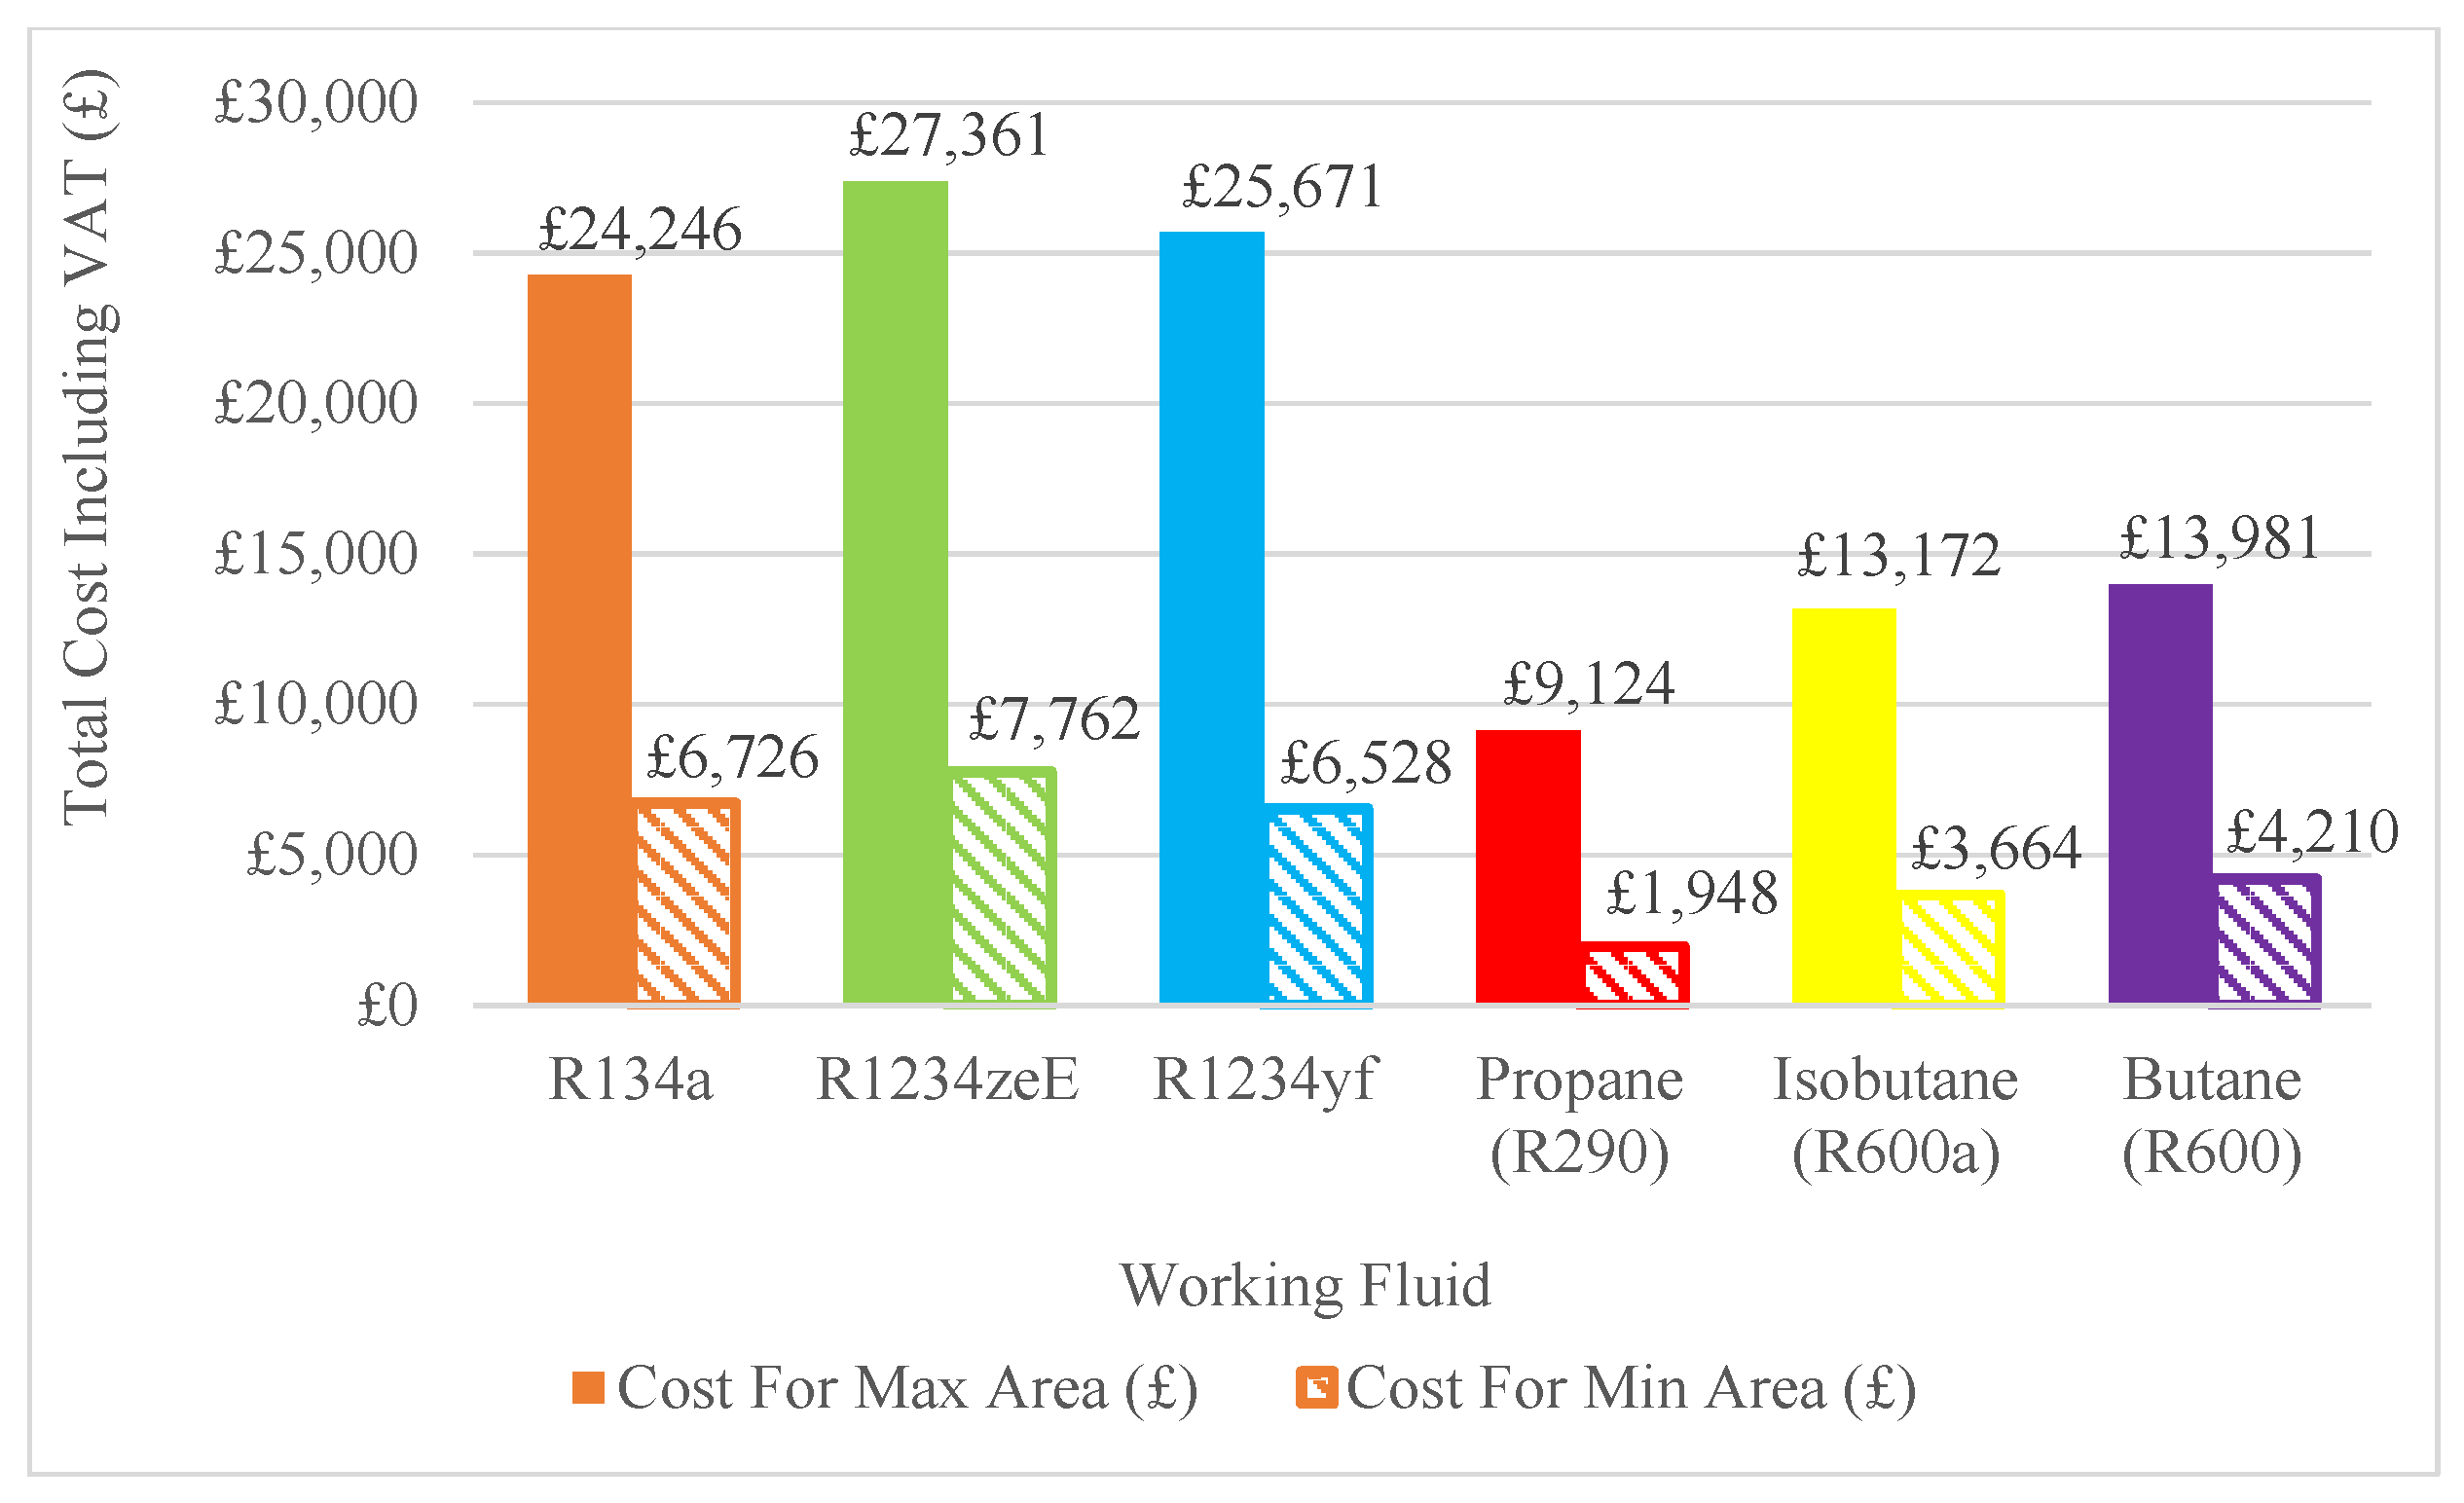
Based on a price per square meter of USD 500 [
27] and a currency exchange rate of 1.33 dollars to pounds (April 2025), the estimated price for the heat exchanger was calculated as GBP 375.94/m
2 excluding VAT, increasing to GBP 451.13/m
2 with the addition of 20% VAT. As the pricing is based on the surface area, the largest required area corresponds to the highest cost and the smallest area to the lowest cost, as shown in
Figure 20.
For R134a, the estimated cost for the minimum required area (14.91 m2) was GBP 6726.21, while for the maximum required area (53.74 m2), it was GBP 24,245.84, representing a 260.47% increase in cost due to the greater area. Among the fluids considered, R1234ze(E) had the highest estimated cost for the minimum area, requiring 17.21 m2 and costing GBP 7762.44, which was GBP 1036.23 more expensive than R134a. In contrast, Propane (R290) had the lowest cost for the minimum required area, needing only 4.32 m2 and costing GBP 1947.92, making it GBP 4778.27 cheaper than R134a.
For the maximum required area, R1234ze(E) again had the highest cost, at GBP 27,361.25, GBP 3115.41 more than R134a. Propane (R290) remained the least expensive option, at GBP 9124.46, GBP 15,121.38 lower than the maximum cost for R134a.


