Article

Experiment and Simulation of the Non-Catalytic Reforming of Biomass Gasification Producer Gas for Syngas Production

1
State Key Laboratory of Coal Conversion, Institute of Coal Chemistry, Chinese Academy of Sciences, Taiyuan 030001, China
2
University of Chinese Academy of Sciences, Beijing 100049, China
3
Department of Chemical and Biomolecular Engineering, Lehigh University, B336 Iacocca Hall, 111 Research Drive, Bethlehem, PA 18015, USA
*
Authors to whom correspondence should be addressed.
Energies 2025, 18(11), 2945; https://doi.org/10.3390/en18112945
Submission received: 8 May 2025 / Revised: 30 May 2025 / Accepted: 1 June 2025 / Published: 3 June 2025
(This article belongs to the Special Issue Advanced Clean Coal Technology)

Abstract

Among biomass gasification syngas cleaning methods, non-catalytic reforming emerges as a sustainable and high-efficiency alternative. This study employed integrated experimental analysis and kinetic modeling to examine non-catalytic reforming processes of biomass-derived producer gas utilizing a synthetic tar mixture containing representative model compounds: naphthalene (C10H8), toluene (C7H8), benzene (C6H6), and phenol (C6H5OH). The experiments were conducted using a high-temperature fixed-bed reactor under varying temperatures (1100–1500 °C) and equivalence ratios (ERs, 0.10–0.30). The results obtained from the experiment, namely the measured mole concentration of H2, CO, CH4, CO2, H2O, soot, and tar suggested that both reactor temperature and O2 content had an important effect. Increasing the temperature significantly promotes the formation of H2 and CO. At 1500 °C and a residence time of 0.01 s, the product gas achieved CO and H2 concentrations of 28.02% and 34.35%, respectively, while CH4, tar, and soot were almost entirely converted. Conversely, the addition of O2 reduces the concentrations of H2 and CO. Increasing ER from 0.10 to 0.20 could reduce CO from 22.25% to 16.11%, and H2 from 13.81% to 10.54%, respectively. Experimental results were used to derive a kinetic model to accurately describe the non-catalytic reforming of producer gas. Furthermore, the maximum of the Root Mean Square Error (RMSE) and the Relative Root Mean Square Error (RRMSE) between the model predictions and experimental data are 2.42% and 11.01%, respectively. In particular, according to the kinetic model, the temperature increases predominantly accelerated endothermic reactions, including the Boudouard reaction, water gas reaction, and CH4 steam reforming, thereby significantly enhancing CO and H2 production. Simultaneously, O2 content primarily influenced carbon monoxide oxidation, hydrogen oxidation, and partial carbon oxidation.

1. Introduction

Amid escalating energy security challenges and intensifying global climate instability, there is a growing need to develop and utilize renewable energy [1]. Biomass gasification, a process of biomass conversion into syngas (mixture of CO and H2), holds promise due to its high energy efficiency, adaptability to various feedstocks, and excellent operation flexibility [2]. Producer gas, which is defined as the primary product of biomass gasification, contains syngas, CH4, CO2, H2O, light hydrocarbons, and tar and serves as a precursor for a wide range of downstream energy conversion processes. However, the purification of producer gas remains a major challenge that hinders its commercialization and broader adoption [3].
Various methods for producer gas purification have been developed and can primarily be categorized into three main types: (i) non-catalytic reforming that converts tar into a gaseous mixture primarily composed of syngas and gaseous hydrocarbons [4,5], (ii) catalytic cracking that decomposes tar and light hydrocarbons into H2 and CO [3,6], and (iii) tar is removed from producer gas using mechanical devices [7]. The majority of studies on producer gas purification have primarily concentrated on the catalytic cracking of tar, attributed to the high energy efficiency and carbon conversion rate of catalytic cracking [3,6]. Meanwhile, because of its simplicity and maturity, mechanical removal remains the most adopted method for producer gas purification in industrial applications. However, catalytic and mechanical methods are both hindered by limitations such as short catalyst lifespan, low carbon conversion rates, and significant secondary pollution, which have spurred increasing interest in non-catalytic reforming [8,9,10].
Temperature and equivalence ratio (ER) of oxygen to producer gas are the most significant factors influencing non-catalytic reforming. Experimental results indicate that under steam reforming conditions, the tar content in the fixed-bed biomass gasification producer gas was reduced by 90% at 1200 °C, compared to that of 600 °C [11]. In an entrained flow reactor with an H2O/C ratio of 0.5 and an excess air ratio of 0.25, the CO and H2 production increased by 70% with a temperature increase from 1000 °C to 1350 °C [12]. Specifically, at 1350 °C, soot content decreased notably, and tar almost disappeared. In a fixed-bed reactor, the addition of oxygen can hinder soot production and accelerate tar reduction [13]. In the partial oxidation reforming experiments of volatile components from biomass pyrolysis in a fixed-bed reactor conducted by Su et al., an ER of 0.34 is identified as the critical point where tar and soot were minimized, and syngas production reached its maximum [9]. However, a higher ER can lead to the combustion of valuable components such as H2 and CO [12,14,15,16,17]. Until now, the effects of temperature and ER on the non-catalytic reforming of biomass gasification producer gas have not been systematically studied. Investigating the reforming process of producer gas under varying temperatures and ER could significantly enhance understanding of this process.
Process simulation is an important tool to support the understanding of the experimental data and optimization of biomass gasification processes. Simulations of biomass bubbling fluidized bed gasification using process design tools analyzed the key modeling steps in simulated biomass gasification [18]. Segmenting the biomass gasification into combustion, gasification, and pyrolysis parts in the simulation could effectively predict the gasification product distribution. Tar formation was more likely to occur under low ER and low-temperature conditions. Martínez et al. constructed a kinetic model of 29 reactions and simulated the hydrogen production from the gasification of oil sludge mixed with biomass [19]. The study showed that at ER = 0.37 and a minimum temperature of 1300 °C, the hydrogen content was 34.7%, yielding 2.49 Nm3 H2/kg oil sludge. Champion et al. simulated the gasification process using a kinetic model containing 15 reactions and 14 simulated components using Maxwest software, achieving good predictive results [20]. Benzene, toluene, phenol, and naphthalene were used as tar model components, and the cracking behavior in a partial oxidizing atmosphere was studied through experiments and CFD simulations [9,10]. O2 was found to promote the conversion of tar and non-condensable gases, with an optimal ER of 0.34. Additionally, Eri et al. conducted CFD-based simulations of biomass fluidized bed gasification using a multi-component, multi-step kinetic model [21]. The results showed that the model effectively aids in predicting and understanding the biomass gasification process. The pre-exponential factor significantly depends on the reaction conditions. The existing kinetic model parameters for biomass gasification in the literature are primarily suited for low-temperature conditions ranging from 700 °C to 1100 °C. However, applying these parameters to simulations under high-temperature conditions between 1200 °C and 1500 °C could lead to substantial discrepancies. Therefore, further optimization of the kinetic model parameters, in conjunction with experimental data, is necessary.
Although numerous researchers have conducted simulations on biomass gasification, comprehensive studies on the reactions of tar, soot, and light hydrocarbons in the partial oxidation reforming of producer gas at high temperatures are still scarce [10]. Therefore, it is imperative to systematically study the influence patterns of temperature and O2 on the producer gas reforming and to develop reliable kinetic models. In this study, a high-temperature fixed-bed reactor system was built, and the products collected were analyzed using GC and GC-MS to elucidate the influence of the operating temperature and ER on the distribution of components in reforming products. Using those data, an apparent kinetic model was developed to simulate the non-catalytic reforming. Simulations were found in good agreement with the experimental results, showing the high fidelity of this model.

2. Materials and Methods

2.1. Materials

The tar composition primarily depends on gasification conditions and contains complex constituents and trace-level concentrations [22]. To ensure the stability and precision of the experiment, a research approach proposed by Srinivas et al. [23] was adopted utilizing model tar compounds. Based on the tar composition data reported by Evans et al. [24], the selected model tar components and their corresponding real substances were as follows: (a) C6H5OH, represented oxygenates; (b) C6H6, corresponded to benzene in the tar; (c) C7H8, represented toluene, xylene and single-ring aromatics; and (d) C10H8 represented two-ring, three-ring, and higher aromatic hydrocarbons found in the tar. The modeling composition of the producer gas is provided in Table 1. Among the components, C6H6, C7H8, C10H8, and C6H5OH are used as tar model compounds.

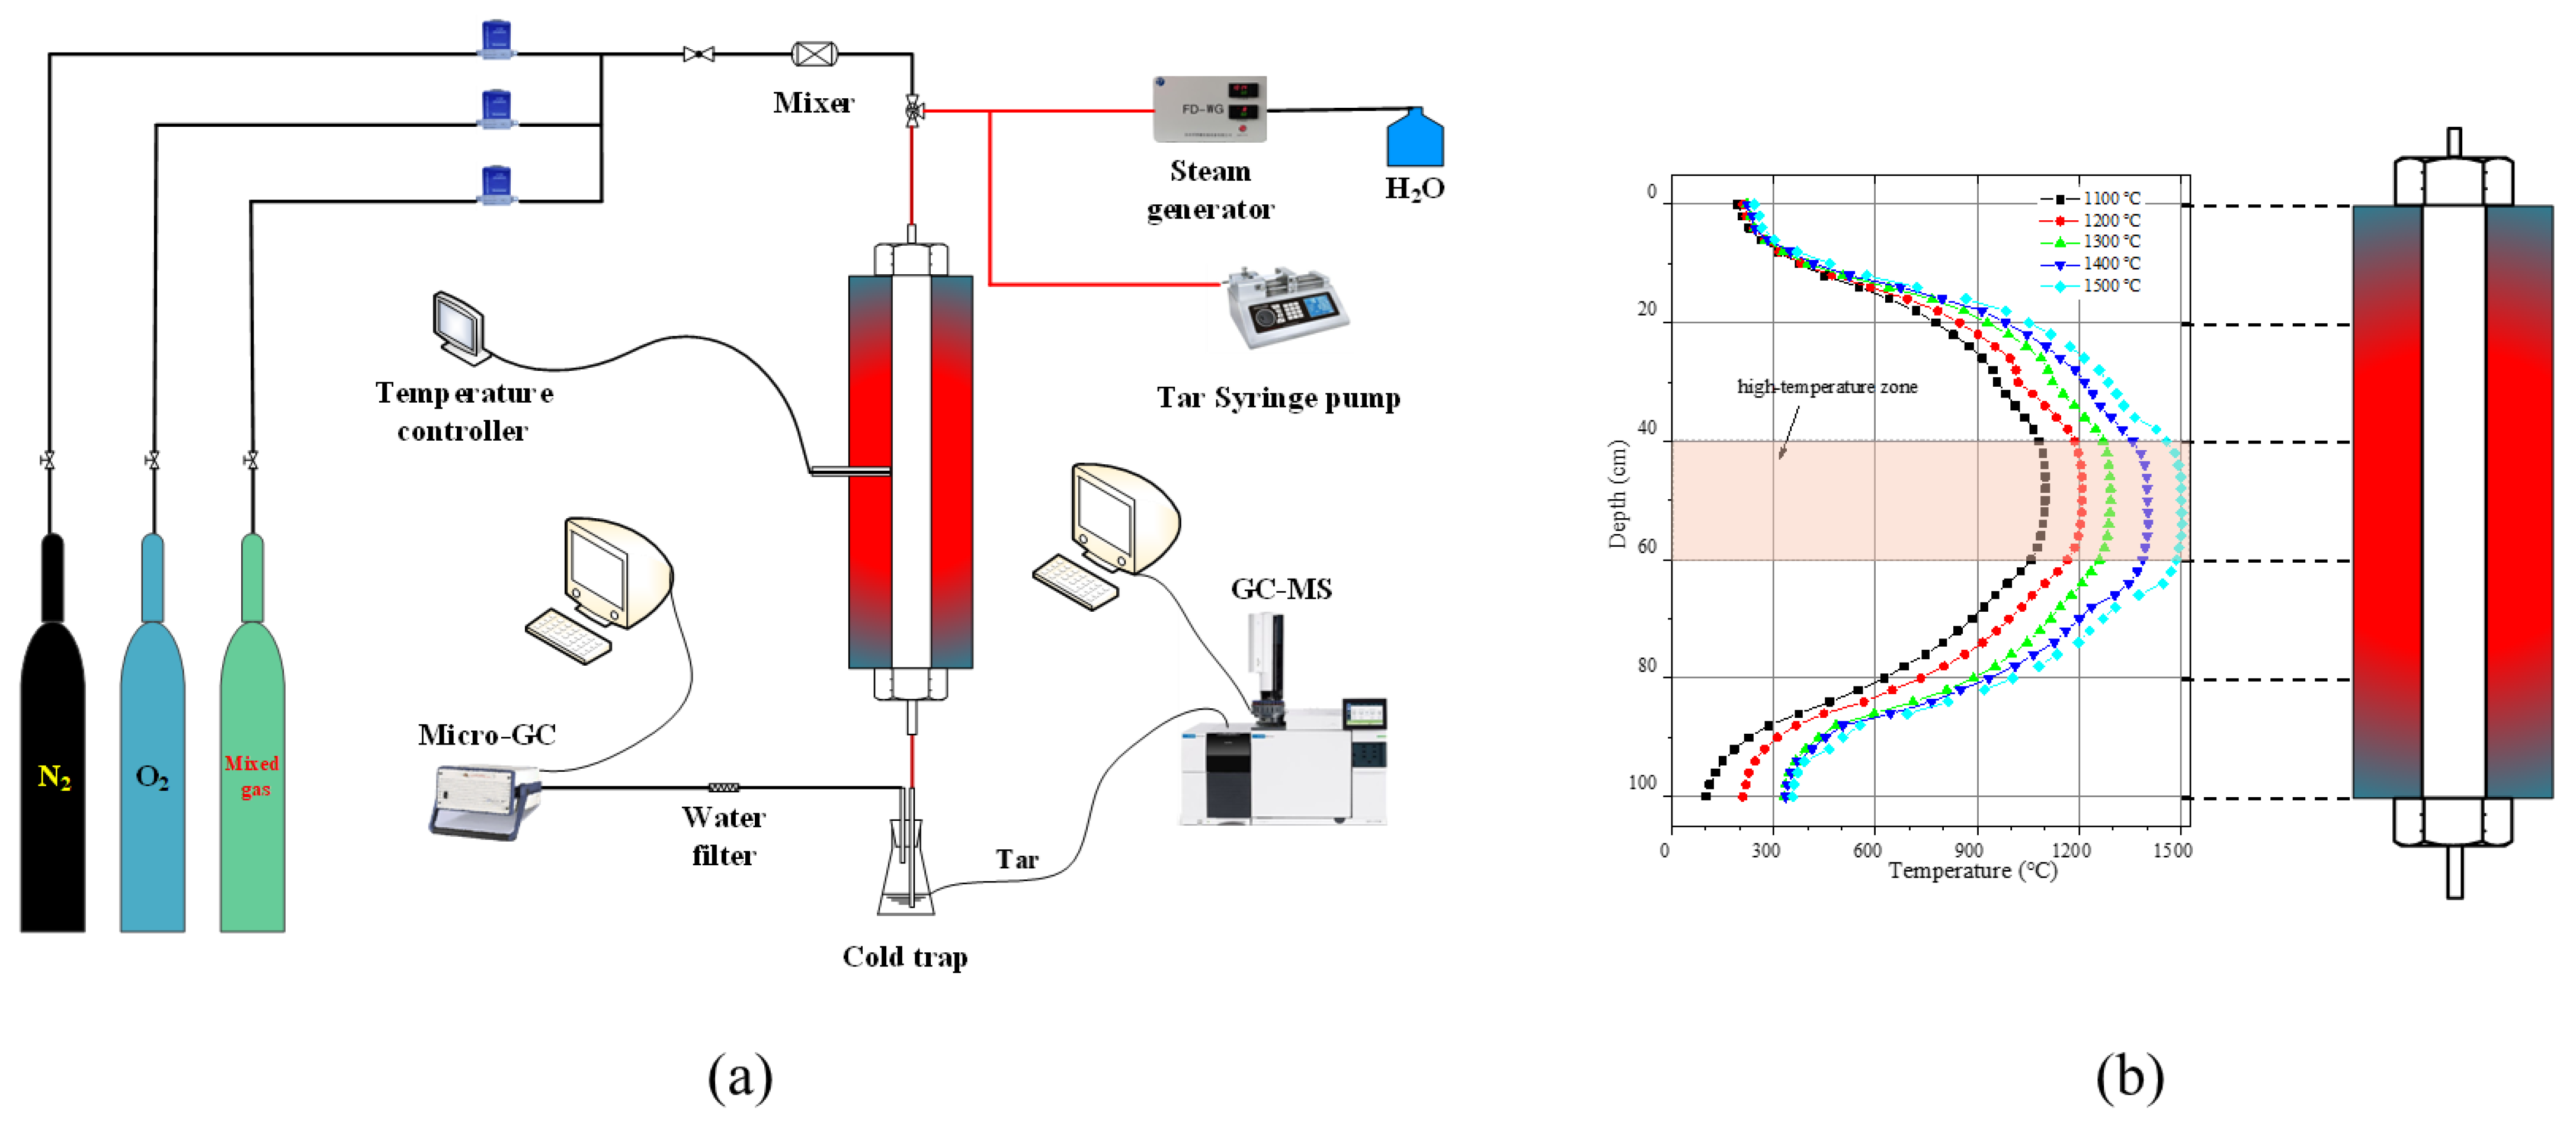
2.2. Experimental Setup and Procedure

The investigation of the non-catalytic simulated producer gas reforming was conducted in a high-temperature fixed-bed reactor, as depicted in Figure 1a. The reaction system was comprised of a fixed-bed reactor, temperature controller, mass flow controllers, steam generator, tar syringe pump, product collection unit, gas chromatography, and gas chromatography–mass spectrometer. The main body of the reactor consists of a corundum tube (outer diameter: 20 mm, wall thickness: 1.5 mm), and its temperature profile along the reactor depth is illustrated in Figure 1b. In the experiments, these compounds were heated to their liquid state and introduced into the reactor in fixed proportions using a syringe pump, allowing precise regulation of the tar input rate. The inflow of simulated producer gas into the reactor can be adjusted by controlling the flow ratio of mixed gas, steam, and tar. An electric heating furnace controls the temperature in the high-temperature reforming zone. A cold trap is connected immediately after the fixed-bed reactor, and the interconnecting piping is kept as short as possible. After each trial, liquid-phase products and soot generated during the reaction were collected using a cold trap, separated using a separating funnel and rotary evaporator, and then analyzed for tar components using a gas chromatography–mass spectrometer. Gaseous products were collected using gas bags and analyzed via gas chromatography.
In a typical experiment, the temperature in the high-temperature reforming zone was raised to the target temperature under an N2 atmosphere at a flow rate of 50 mL/min. Subsequently, the N2 flow was stopped, and O2 and producer gas were introduced into the reactor in a specific ratio using a residence time of 0.01s. The reaction lasted for 5 h to collect a sufficient amount of product. Thereafter, the introduction of O2 and producer gas into the reactor was stopped, and an inert atmosphere was maintained using N2. Finally, the products adhering to the inner wall of the reactor were collected and analyzed together with those captured in the cold trap, thereby ensuring an experimental mass balance of 94.57% of better.
After the reaction, the concentrations of gas-phase components, such as CO and H2, were measured using gas chromatography (GC-950, Haixin, China). The reactor, piping, and cold trap were cleaned three times using high-performance liquid chromatography (HPLC)-grade dichloromethane, and the products (mainly soot and tar) were separated by filtration to isolate the respective components. Then, a gas chromatography–mass spectrometer (GC-MS, QP-2010, Shimadzu, Japan) was employed to analyze the organic components in the tar. Each sample was introduced with a 1 mL injection volume, and helium was the carrier gas with a flow rate of 3 mL/min. The temperatures of the front inlet and ion sources were maintained at 280 and 250 °C, respectively. The chromatographic peaks were qualitatively determined using the self-contained NISTMS detection card.

2.3. Modeling and Numerical Methods

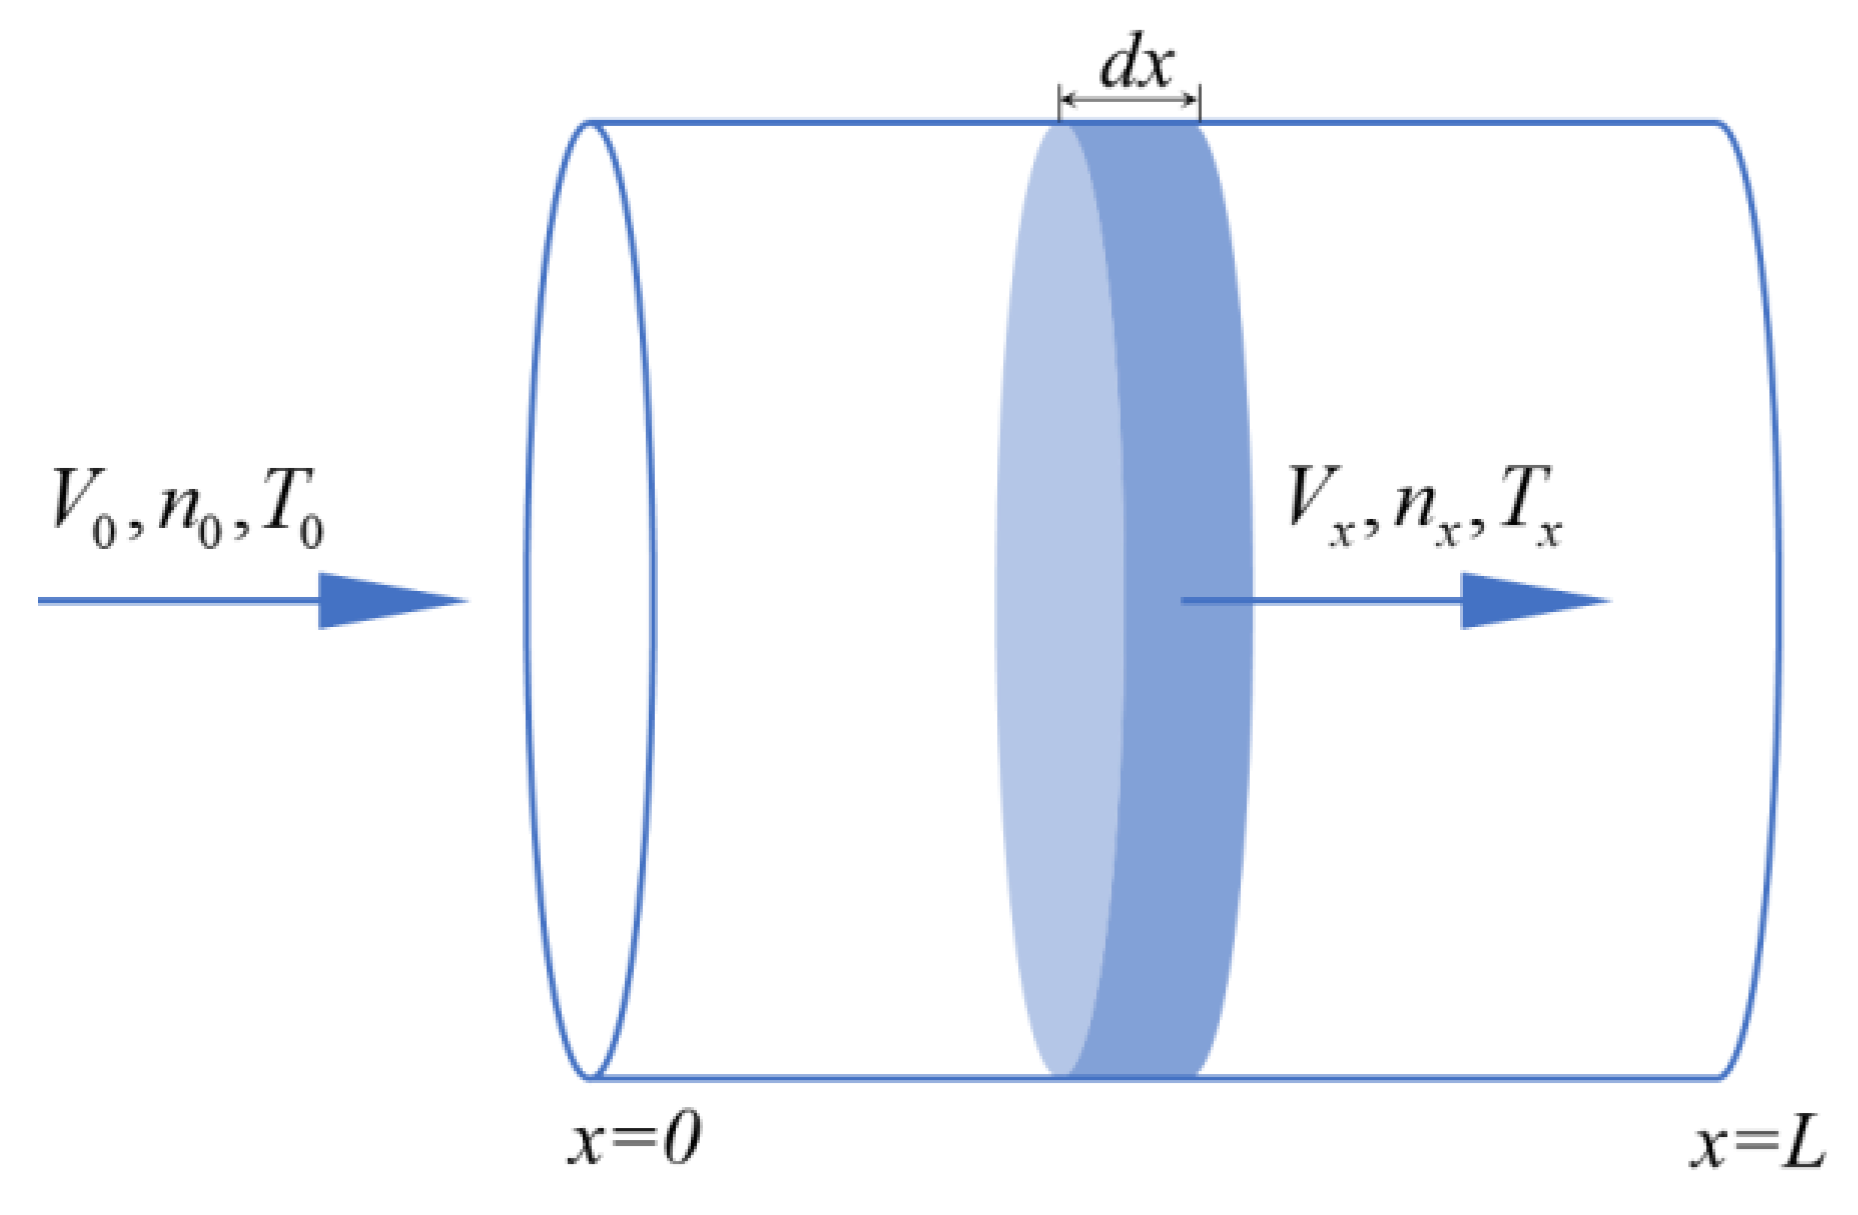
2.3.1. Ideal Plug Flow Reactor Modeling and Optimization

An ideal plug flow reactor model was employed to simulate the reaction process since the reactor diameter is sufficiently small. Moreover, as the temperature throughout the reactor exceeds 200 °C, all reactants exist in the gaseous state. Therefore, the ideal gas state Equation (1) was employed to characterize the state of reactants at various points within the reactor.
P V = n R T
Thus, the state of each point within the reactor conforms to the following Equation (2):
V x = V 0 n x T x n 0 T 0
where
V0, n0, T0—the initial volumetric flow rate (m3/s), molar flow rate (mol/s), and temperature (K);
Vx, nx, Txthe volumetric flow rate (m3/s), molar flow rate (mol/s), and temperature (K) at depth x.
According to the definition of reaction rate, the concentration differential equation for component A was calculated using Equation (3)
d C A d x = S V x i v i , A r i
where
CA—the molar concentration of component A (mol/m3);
S—the cross-sectional area of the reactor (m2);
vi,A—the reaction coefficient of substance A in reaction i;
ri—the rate of reaction i (mol‧m−3‧s−1).
The computational model for the ideal plug flow reactor is illustrated in Figure 2.
The assumptions adopted during the simulation are outlined as follows:
(1)
Within the reactor, there is no axial back-mixing, and the state (temperature, composition, flow rate, etc.) is a function of the axial position alone, with no radial distribution;
(2)
All gaseous compounds have ideal gas behavior;
(3)
The thermal effect of the reactions has a negligible effect on the temperature profile along the reactor depth;
(4)
Pressure was uniform inside the reactor;
(5)
Soot is considered a gas-phase component in the reaction;
(6)
The process was in a steady state;
(7)
Tar composition was assumed to be C6H6, C6H6O, C7H8, and C10H8;
(8)
Arrhenius kinetics were considered for each reaction.
The kinetic model used to describe the reforming process includes the reactions listed in Table 2. The model primarily considers the following components: H2, CO, O2, CO2, CH4, H2O, C2H4, C2H6, C6H6, C7H8, C6H6O, C10H8, N2, and soot. The key reactions encompass oxidation reactions (R1–R4), reforming reactions (R5–R8), tar cracking reactions (R13–R16), and other reactions (R9–R12). The initial model was primarily constructed based on kinetic data reported in the literature.
After the initial construction of the model, the reaction rate constants were directly adopted from those developed by [18,19,25]. Since the initial model was based on low-temperature conditions, it is essential to optimize these rate constants for application under high-temperature. In a previous work [27], it was found that the multi-objective genetic algorithm was a feasible methodology for optimizing the pre-exponential factors in detailed mechanisms. To optimize the initial kinetic model, NSGA-III, developed by Deb et al. [28], is utilized in this study for the automated refinement of pre-exponential factors in the initial kinetic model, within predefined boundaries ranging from Ki,0/10 to Ki,0 × 10, where Ki,0 represents the original pre-exponential factor of the i-th reaction. By introducing a reference point strategy, NSGA-III achieves global optimality while maintaining a high convergence rate. In this work, both plug flow reactor modeling and optimization based on the NSGA-III algorithm were executed using Python 3.10.2.

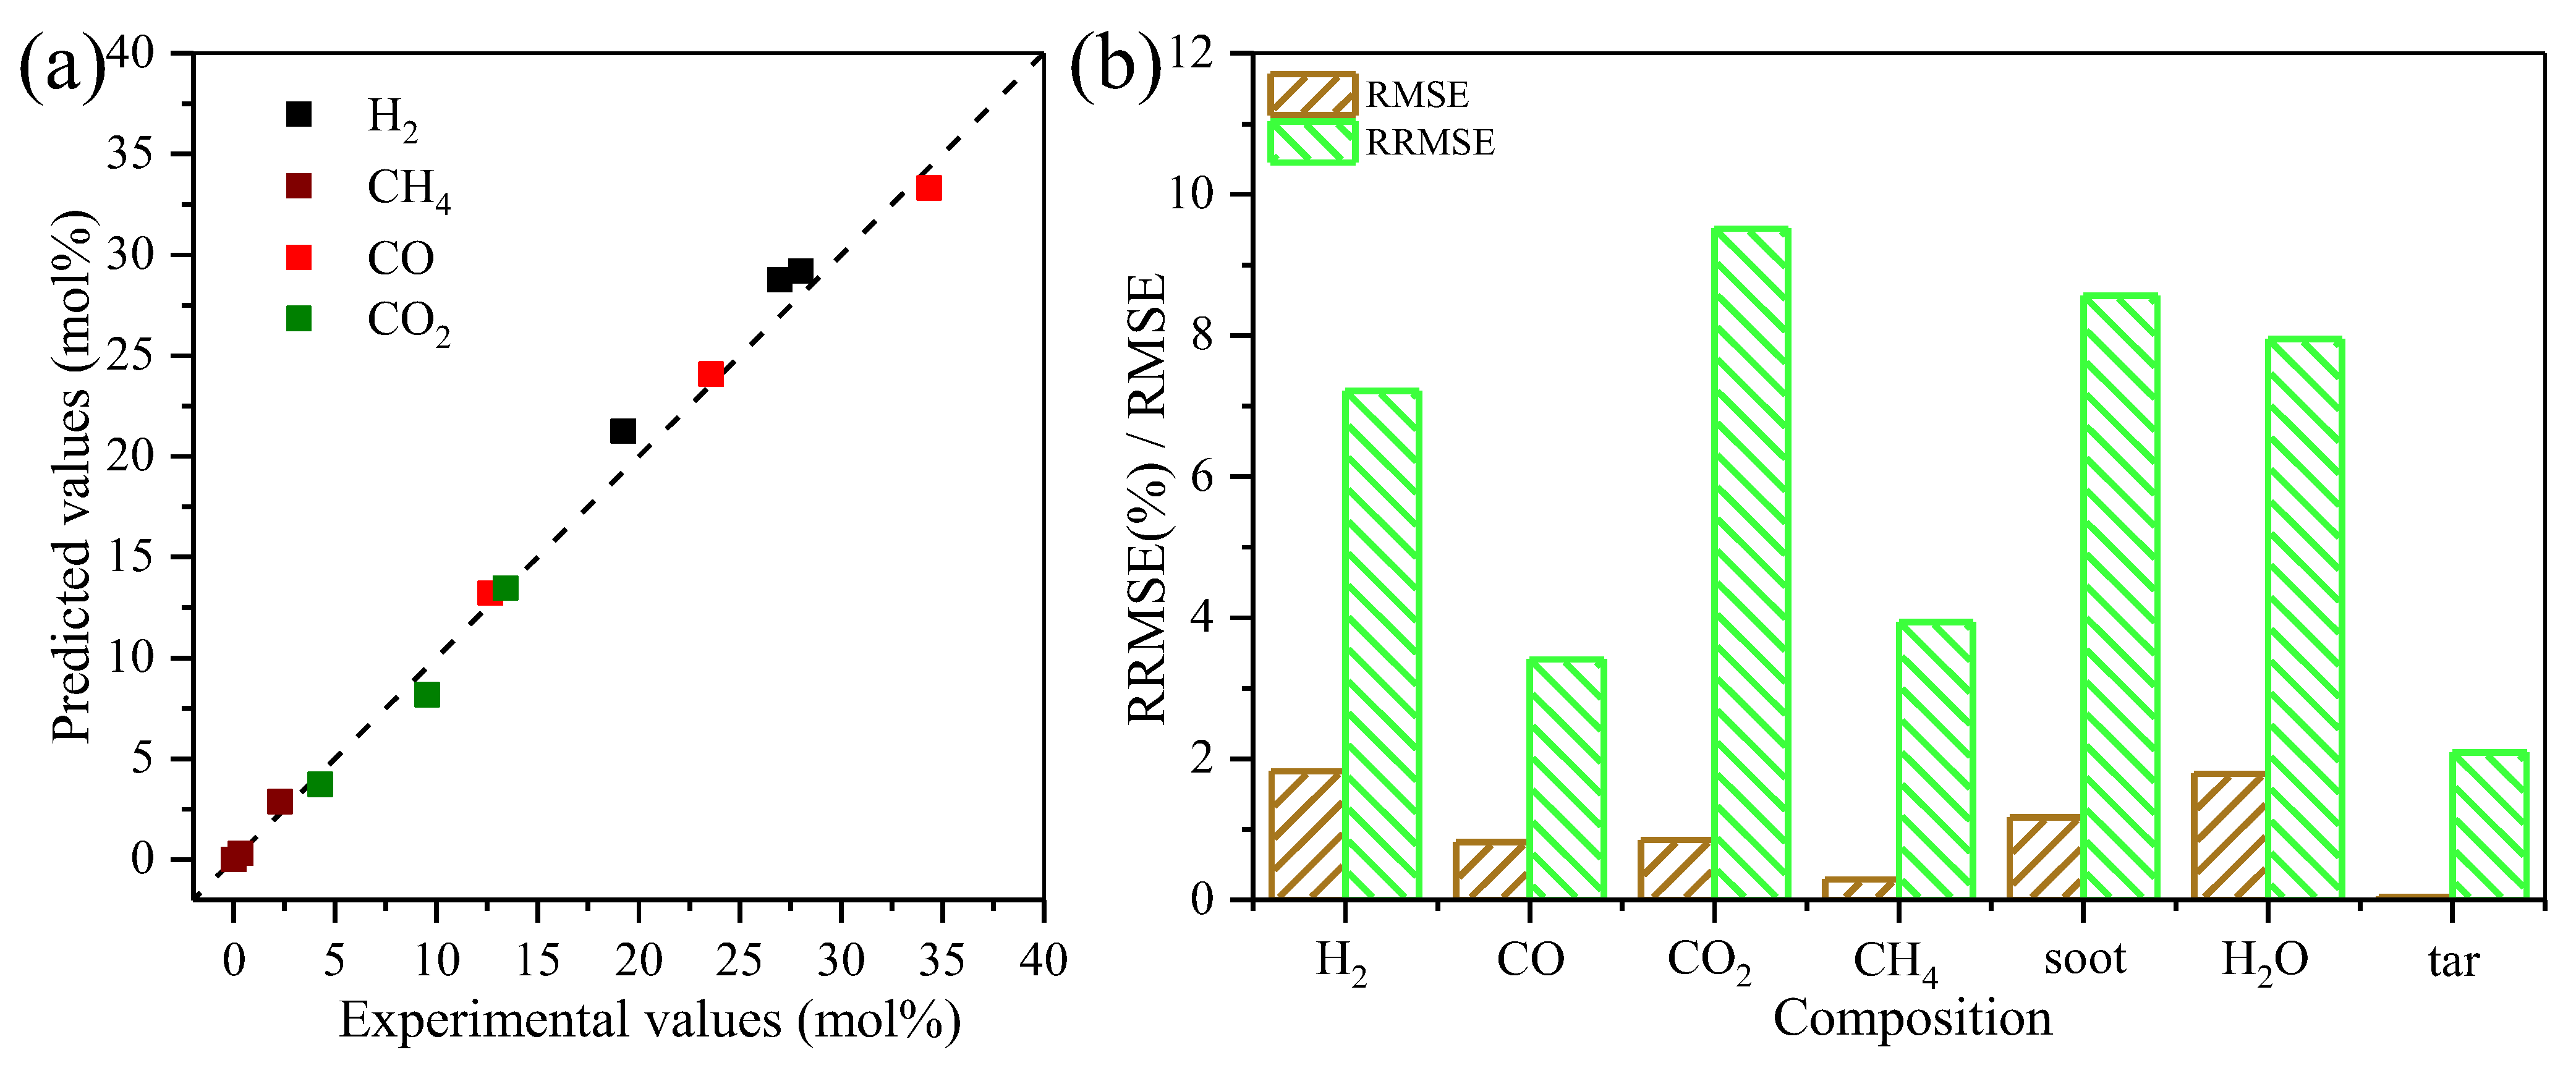
2.3.2. Data Evaluation

The equivalence ratio (ER) was used to measure the amount of O2, which is defined as the ratio of actual O2 to producer gas and stoichiometric O2 to producer gas. The value of ER can be calculated using Equation (4)
E R = R A / R a c t u a l R A / R s t c h = R O 2 / R a c t u a l R O 2 / R s t c h
where R O 2 / R a c t u a l represents the actual O2/producer gas in moles per mole of producer gas and R O 2 / R s t c h represents the stoichiometric O2/producer gas in moles per mole of producer gas. According to the data in Table 1, R O 2 / R s t c h in this experiment is 0.6088.
HHV (Higher Heating Value) refers to the heat released per unit mole of a fuel when it is completely combusted and the water vapor is condensed. It is commonly used to measure the energy content of a fuel, including the latent heat of vaporization of water vapor. It can be calculated from Equation (5)
H H V g = Y H 2 H H V H 2 + Y C O H H V C O + Y C H 4 H H V C H 4
where Yi (i = CO, H2, CH4) is the mole fraction of CO, H2, and CH4, respectively. The HHVi is the higher heating value of CO, H2, and CH4, specifically H H V H 2 , H H V C O and H H V C H 4 are 13.2 MJ/Nm3, 13.1 MJ/Nm3, and 41.2 MJ/Nm3.
RMSE is commonly used to measure the predictive error of a model. A smaller RMSE value for a model indicates more accurate predictions. RMSE can be calculated as follows:
R M S E = 1 n i = 1 n ( y exp , i y s i m , i ) 2
where n is the number of data; yexp,i represents the experimental measurement value of data i; ysim,i represents the experimental measurement value of data i.
RRMSE is calculated by dividing RMSE by the average value of measured data. Model accuracy is considered excellent when RRMSE < 10%, and good if 10% < RRMSE < 20% [29].
R R M S E = 1 n i = 1 n ( y exp , i y s i m , i ) 2 1 n i = 1 n y exp , i × 100 %

2.3.3. Sensitivity Analysis

Sensitivity analysis is a method employed to assess the impact of parameter variations within a model on its output. In this study, local sensitivity analysis is utilized to evaluate the extent to which a specific reaction influences the overall output of the kinetic model. This evaluation can be computed using the following formula:
Y i x j Δ Y i Δ x j = Y i ( x j + Δ x j ) Y i ( x j ) Δ x j
where xj denotes the j-th perturbed parameter and refers to the alteration factor of the j-th reaction; Yi represents the i-th physical quantity under investigation, specifically referring to the concentration of the i-th component in this context.

3. Results and Discussion

3.1. Effect of Reaction Temperature on the Model Producer Gas Reforming

This section analyzed the impact of temperature on reforming products. As previously mentioned, temperature is a crucial parameter that influences the reforming. Given that reforming involves a multitude of endothermic and exothermic reactions, adjusting the reforming temperature serves as a significant way to optimize product quality. According to Le Chatelier’s principle, endothermic reactions favor high temperatures. Therefore, at high temperatures, the process predominantly drives the water gas reaction ( C + H 2 O C O + H 2 ) and the Boudouard reaction ( C + C O 2 2 C O ).
The product composition (the mole fraction of H2, CO, CO2, H2O, CH4, and soot) at different temperatures in non-catalytic reforming at ER = 0.20 is shown in Figure 3. It was observed that soot is a significant byproduct generated during the reforming. Specifically, as the reaction temperature increases from 1100 °C to 1500 °C, the soot content sharply decreases from 11.91% to 0.01%. However, it is reported that with increasing temperature, there is a gradual augmentation in the production of soot, reaching its peak at 1200 °C, subsequently followed by a gradual decline [12]. It is noteworthy that the steam/carbon molar ratio and excess air ratio were 0.5 and 0.25, respectively; however, the concentrations of oxidizing gases in this study were relatively high. Consequently, one potential explanation for the disparities could be attributed to the fact that as the temperature rose in our experiments, soot interacted with an abundant supply of oxidizing gases.
Increased temperature significantly enhances the generation of H2 and CO. As depicted in Figure 3, with the temperature rising from 1100 °C to 1500 °C, the proportions of H2 and CO increased from 19.23% to 28.02% and from 12.67% to 34.35%, respectively. Meanwhile, the fractions of CO2, CH4, and H2O decreased by 68.23%, 99.9%, and 23.78%, respectively. Elevating temperatures accelerate the endothermic reaction rates, specifically the Boudouard reaction ( C + C O 2 2 C O ) and water gas reaction ( C + H 2 O C O + H 2 ), leading to an increase in the production of H2 and CO [18,30]. Qin reported that in the fluidized bed gasification of wood and straw, the temperature elevation promotes the dry reforming reactions between hydrocarbons (predominantly CH4 with minimal amounts of C2H4 and C3H8) and CO2, subsequently augmenting the production of H2 and CO [12]. In this experiment, the only hydrocarbon present in the products is CH4. Increased temperatures accelerated the Boudouard reaction, water gas reaction, and dry reforming of CH4, resulting in an increase in the generation of CO and H2 at high temperatures.
The conversion rates of CH4 and tar are the primary indicators for assessing the reforming effectiveness. In this experiment, the temperature-dependent pattern of CH4 and tar conversion rates is illustrated in Figure 4a. As depicted in the graph, with the temperature increase from 1100 °C to 1500 °C, the conversion rates of CH4 and tar increase from 39.07% to 99.99% and from 99.40% to 99.99%, respectively. CH4 is more resistant to conversion than tar due to its more stable chemical structure. The impact of temperature on tar content and gas HHV during reforming at an ER of 0.20 is presented in Figure 4b. As the temperature rose from 1100 °C to 1500 °C, the HHV increased from 4.97 MJ/Nm3 to 7.91 MJ/Nm3. The HHV is solely influenced by the content of CO, H2, and CH4 [8]. As shown in Figure 3, although the temperature increase leads to a decrease in CH4 content, there is a substantial increase in H2 and CO content, resulting in the HHV increase along with the reaction temperature rising. The tar content is one of the crucial indicators affecting the syngas application. Excessive tar content can restrict the syngas application scenarios. As depicted in Figure 4b, it can be observed that the tar content decreased from 1.69 g/Nm3 to 0.03 g/Nm3 while the temperature increased from 1100 °C to 1500 °C. The primary cause of this phenomenon is the promotion of tar reforming and cracking reactions at higher temperatures [31,32].

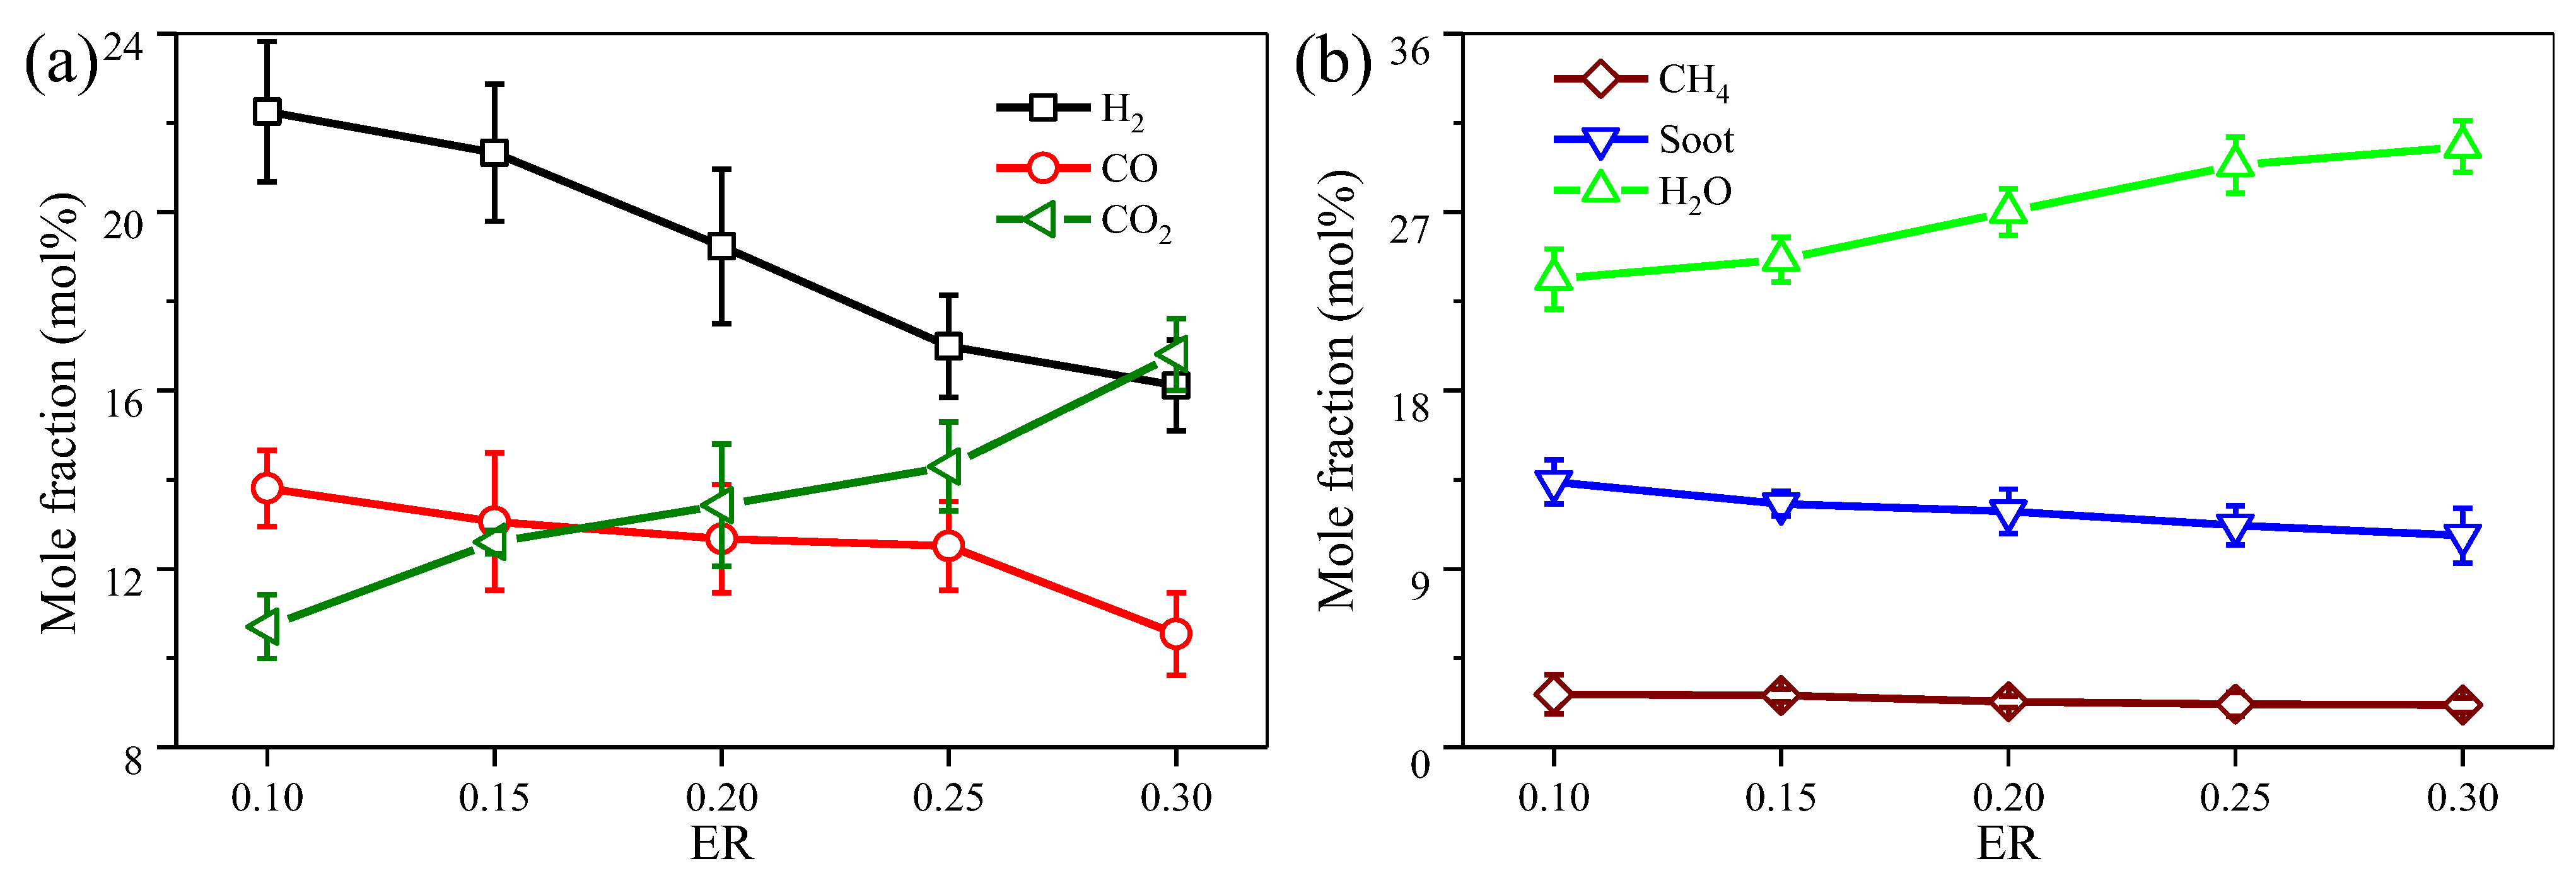
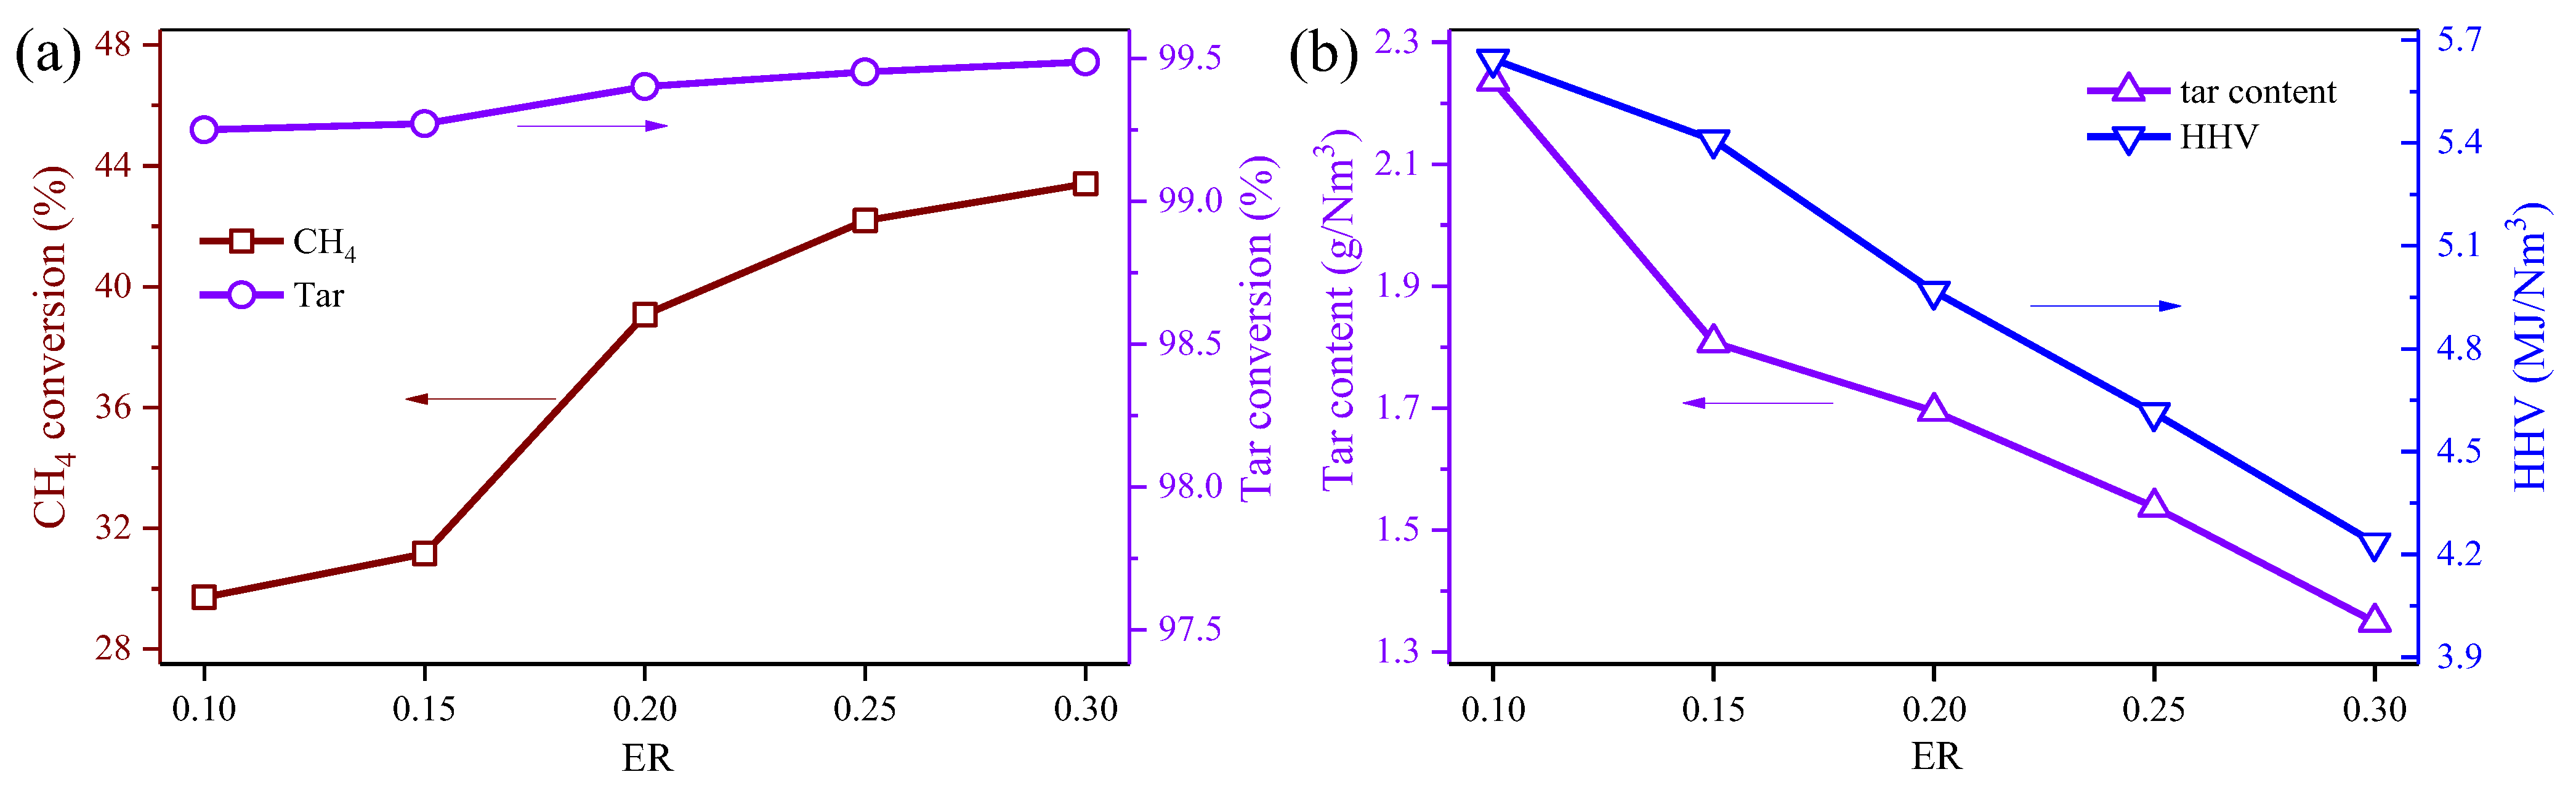
3.2. Effect of ER on the Medel Producer Gas Reforming

ER constitutes one of the primary variables in producer gas reforming. When separating both variables, e.g., ER and temperature, it was observed that a high ER encourages the extent of oxidation reactions of soot, H2, and CO [12]. According to Kuo et al. [33], the ER range employed in this study spans from 0.10 to 0.30. Figure 5 illustrates the gas composition obtained from the high-temperature fixed-bed experiments conducted at 1100 °C under varying ER.
An increase in O2 noticeably leads to the consumption of H2 and CO. As depicted in Figure 5a, when the equivalence ratio (ER) was elevated from 0.10 to 0.30 at 1100 °C, the H2 and CO concentrations exhibited a decrease, declining from 22.25% to 16.11% and from 13.81% to 10.54%, respectively. Concurrently, the concentration of CH4 decreased from 2.68% to 2.13%. In contrast, the concentrations of CO2 and H2O increased from 10.70% to 16.81% and from 23.62% to 30.29%, respectively. These results agree with those obtained from other authors, either in circulating flow [14] or entrained flow bed gasifier [12]. In the experiments conducted by Lapuerta et al. [14], the reduction in H2 and CO concentrations may be attributed to the introduction of a significant amount of N2 into the system, as air was used to supply O2. However, in the present study, the oxidation reactions of H2, CO, and CH4 are likely the predominant factors contributing to this phenomenon [13]. This experiment demonstrated that O2 significantly consumes H2 and CO, owing to the relatively high introduction of O2. Consequently, for CH4 and soot, the dilution effect of introducing O2 exerts a substantial influence. Conversely, for H2 and CO, the oxidation reactions with O2 emerge as the primary reason for their reduced concentration. As presented in Figure 5b, it becomes evident that the increase in ER from 0.10 to 0.30 is associated with a decline in soot content, reducing from 13.38% to 10.68%. This phenomenon is primarily attributed to the enhanced combustion of soot or soot precursors in the presence of O2 [12]. In this experiment, the content of soot decreased as the ER increased. One plausible explanation is that the introduced O2 undergoes an oxidation reaction with soot. As the added O2 proportion rises, the soot content gradually diminishes.
The impact of ER variations on CH4 and tar conversion is illustrated in Figure 6a. The CH4 and tar conversion increased as the ER rose. Specifically, during the transition from an ER of 0.10 to 0.30, the CH4 conversion rate enhanced from 30% to 43%, while the tar conversion increased from 99.2% to 99.5%. In comparison to Figure 4a, ER has a less pronounced effect on CH4 and tar conversion rates when contrasted with temperature. This phenomenon can be attributed to two factors. Firstly, the higher H2 concentration in the reactants may result in the initial consumption of H2 upon the introduction of O2. Secondly, substances like tar possess more stable carbon–carbon (C-C) and carbon–hydrogen (C-H) bonds, leading to lower activation energy for oxygen ions to react with hydrogen gas [12]. The impact of ER on tar content and gaseous HHV is depicted in Figure 6b. With the increase in ER from 0.10 to 0.30, the tar content decreased from 2.2 g/Nm3 to 1.4 g/Nm3. Concurrently, the HHV decreased from 5.7 MJ/Nm3 to 4.2 MJ/Nm3. The increase in ER converted combustible components such as H2, CO, and CH4 in the products into CO2 and H2O, subsequently lowering the HHV of the products [15].

3.3. Calibration and Evaluation of the Kinetic Model

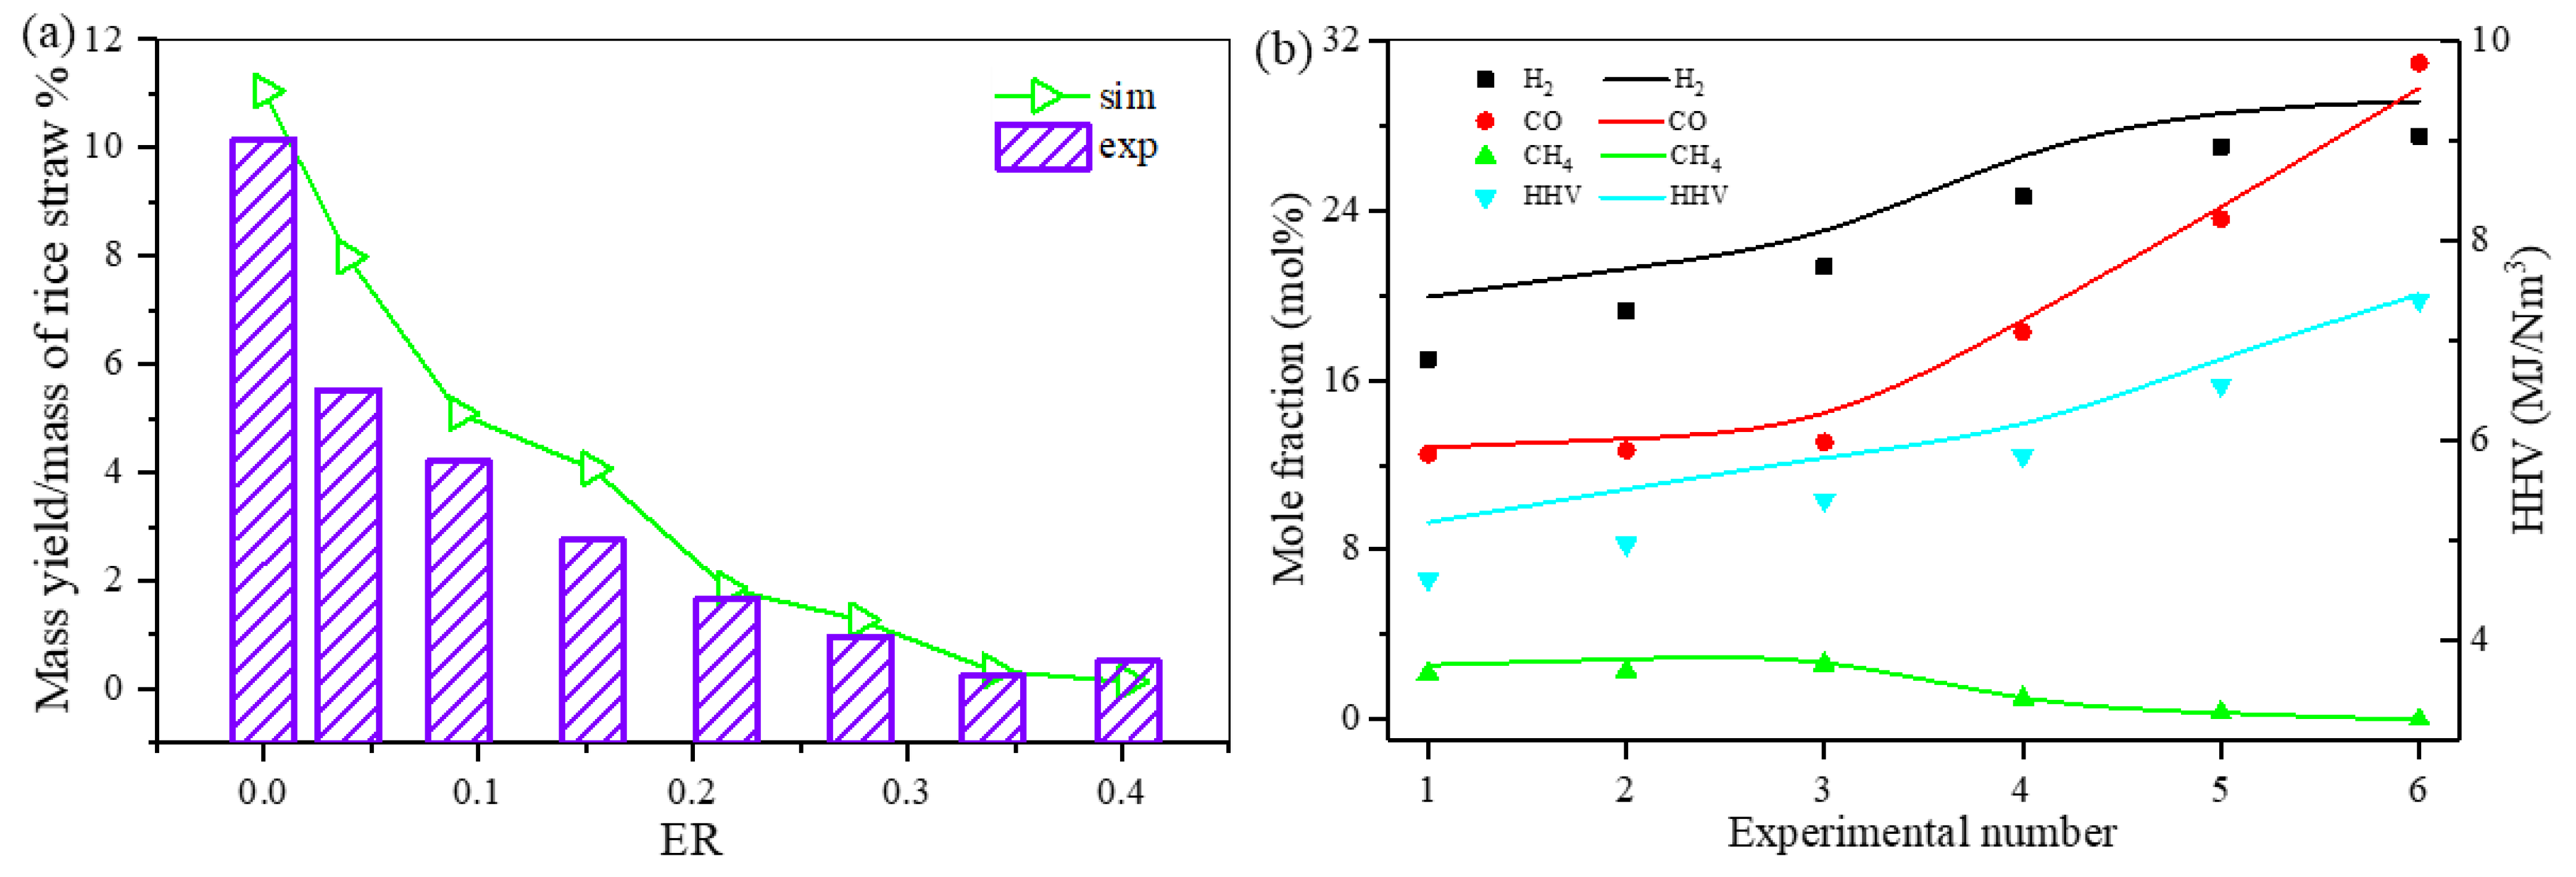
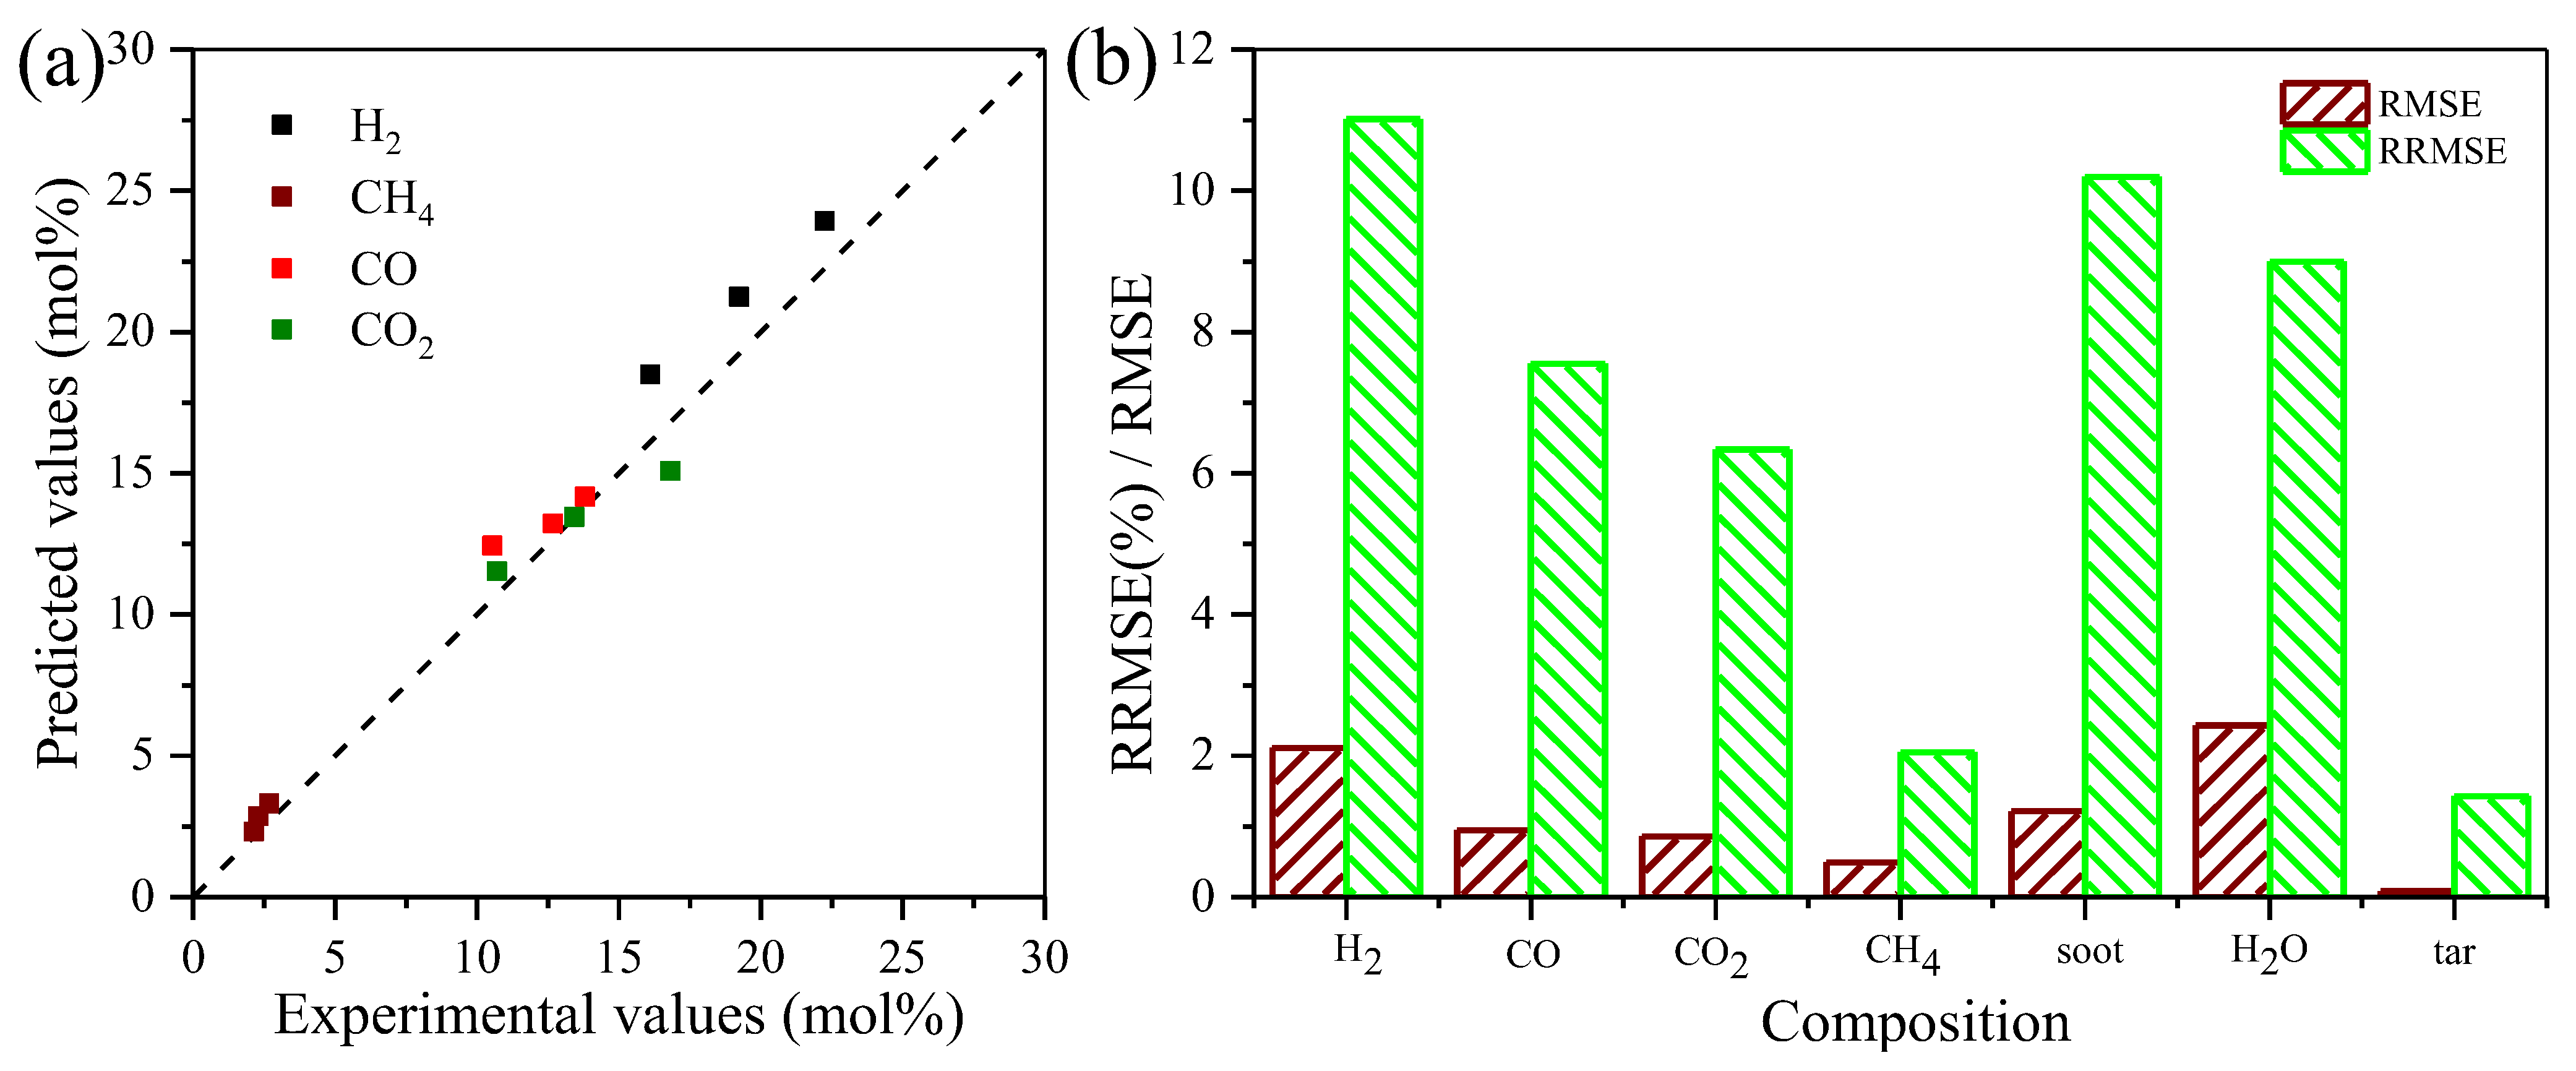
3.3.1. Kinetic Model Calibration and Validation

Model validation is critical in scientific research to assess the predictive capability of a model by comparing its predictions to experimental data. The kinetic model employed in this study is a development of various kinetic models proposed by different scholars. It is essential to enhance its predictive capability by optimizing and adjusting the rate constants within the kinetic model. Additionally, given the significant influence of the reaction conditions on the pre-exponential factor, it is reasonable to consider adjusting it as well, especially since the same reaction may exhibit varying pre-exponential factors under different operating conditions [34,35]. In this study, the pre-exponential factor of the kinetic model was adjusted using the parameter optimization method proposed by Niu et al. [27] resulting in the final model parameters presented in Table 3.
The model was validated by comparing it with experimental data from Su et al. [9], as illustrated in Figure 7 below. The experiments were conducted in the pyrolysis unit to obtain a continuous and stable stream of pyrolysis gas. Subsequently, the pyrolysis gas was subjected to non-catalytic reforming at a temperature of 900 °C in a tube reactor. Overall, the simulation results of the kinetic model align well with the experimental tar data, as depicted in Figure 7. It is worth noting that when the ER is 0.029 and 0.153, the simulated values are higher than the predicted values are higher than the predicted values. The potential reason for this disparity is using C6H6O in the simulation as a substitute for oxygen-containing components present in real tar, such as m-Cresol and 3-methyl, among others. However, these oxygen-containing components are more reactive than C6H6O, leading to the phenomenon where the predicted results are higher than the simulated results. Meanwhile, the simulation results of the kinetic model and validation with withheld experimental data are shown in Figure 7b. As shown in the figure, experiments 1–3 were conducted at 1100 °C with ER of 0.25, 0.20, and 0.15, respectively, while experiments 4–6 were performed at ER = 0.20 with temperature of 1200 °C, 1300 °C, and 1400 °C. It was found that the model can accurately predict the trends of H2, CO with temperature and ER variations.

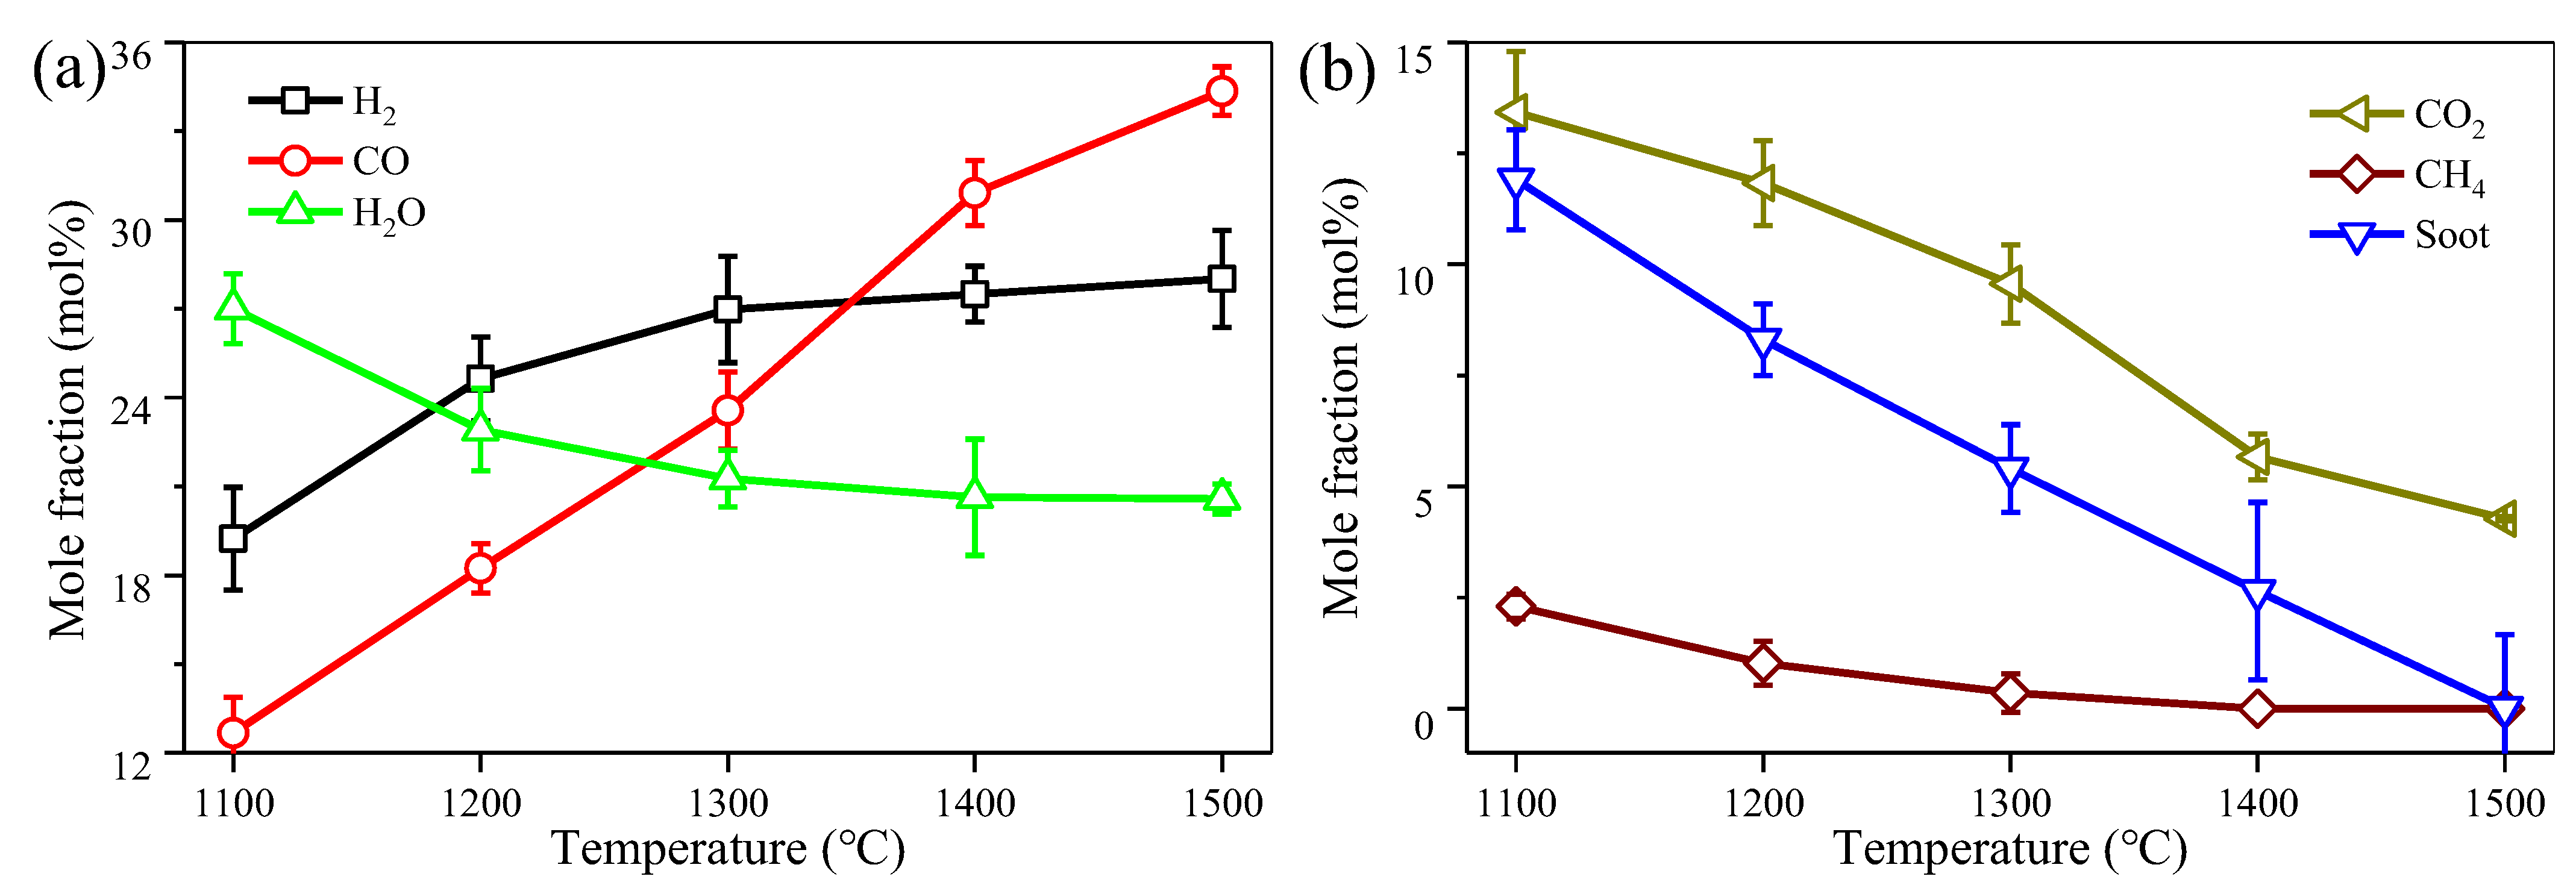
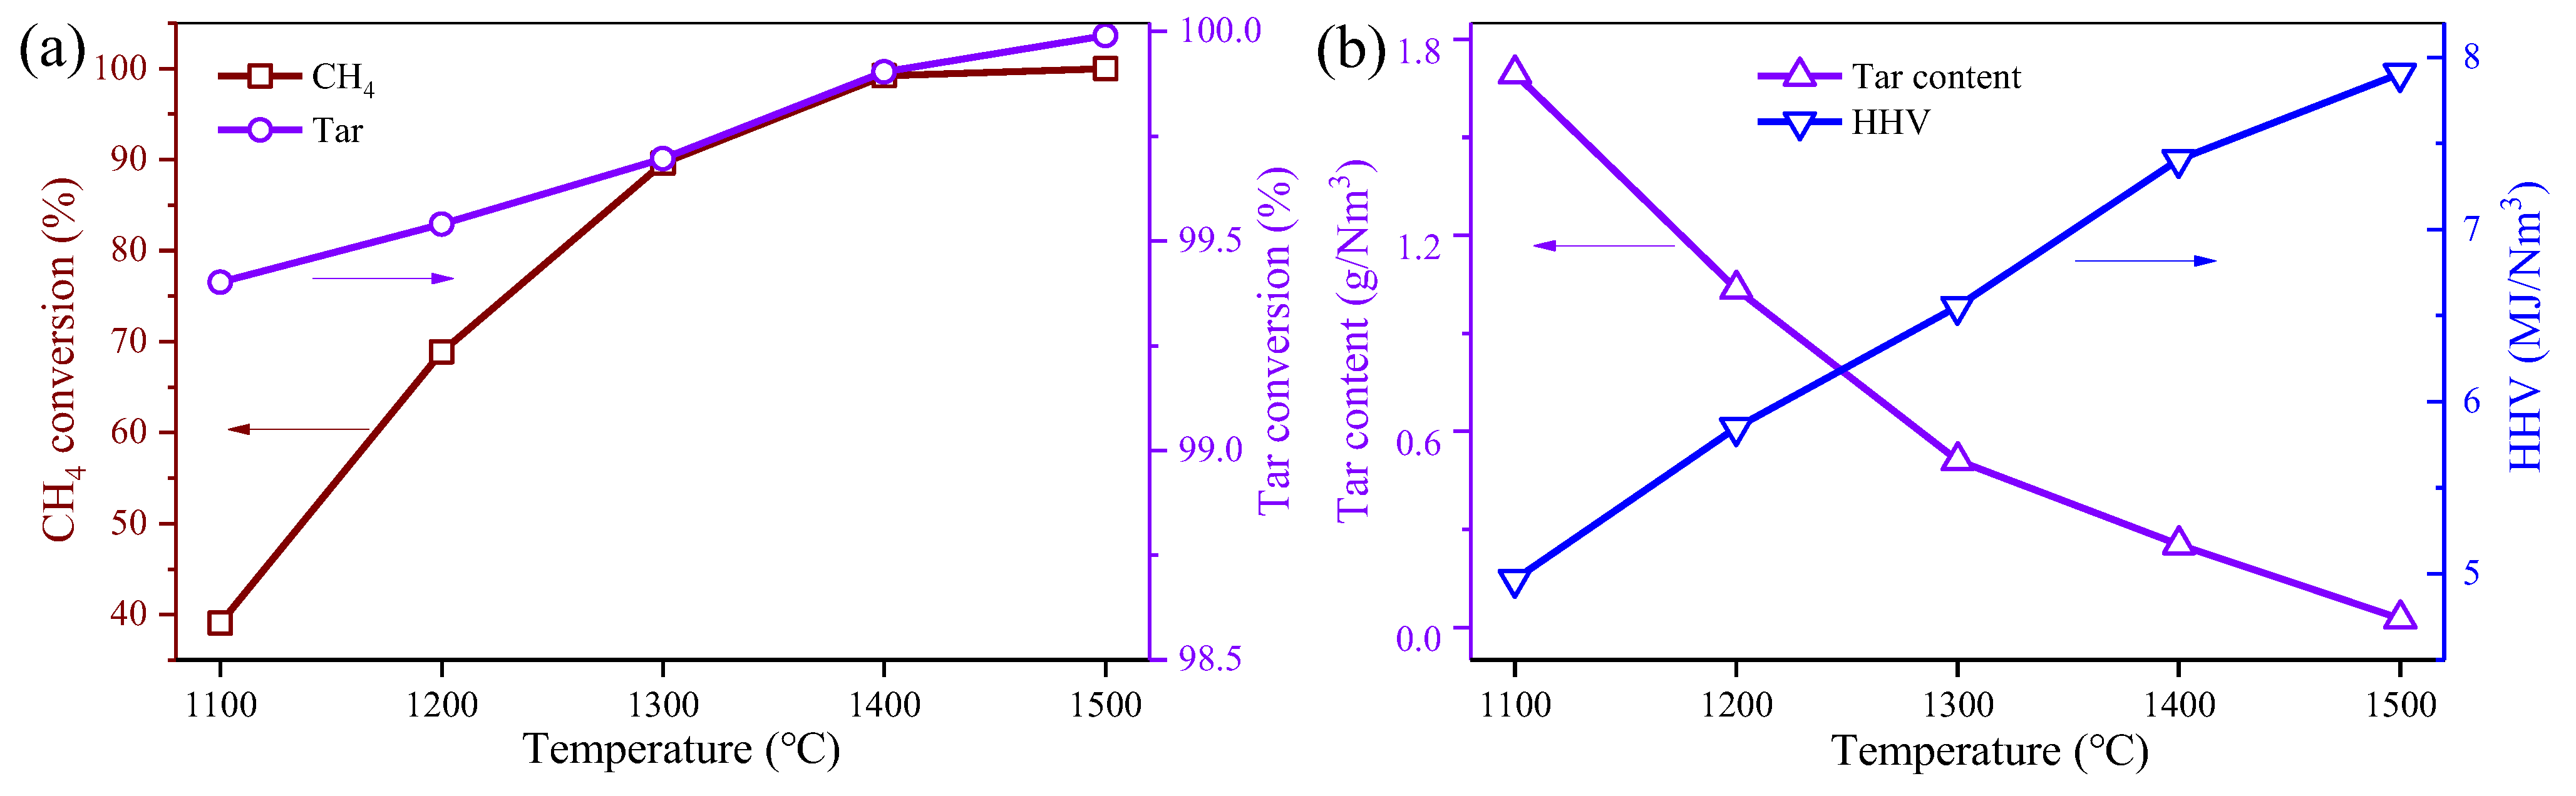
3.3.2. Evaluation of the Effect of Temperature on the Model Producer Gas Reforming

This section presents the results of the kinetic model, followed by a comparison with experimental results. Subsequently, an analysis combining simulation and experimental findings is conducted to ascertain the primary pathways through which temperature influences the reforming.
Figure 8a shows the comparison between kinetic model simulation results and experimental data. The deviation between kinetic results and experimental data was quantified using the RMSE and RRMSE. Figure 8b displays the RMSE and RRMSE for each product compound. It is observed that the simulation results using the kinetic model agree well with the experiment, with a small RMSE of 1.82 for H2, 0.82 for CO, 0.85 for CO2, 0.29 for CH4, 1.17 for soot, 1.78 for H2O, and 0.05 for tar. In order to assess the relative magnitudes of simulation errors and experimental values, the computation yields RRMSE values of 7.21% for H2, 3.41% for CO, 9.52% for CO2, 3.94% for CH4, 8.56% for soot, 7.95% for H2O, and 2.09% for tar.
HHV serves as a crucial metric for assessing the heating capacity of fuels. Figure 9a illustrates a comparison between simulated and experimental results depicting the impact of temperature on the crucial components’ content and HHV. The overall trend predicted by the model for product composition aligns with the experimental results. However, discrepancies were noted in the simulation results, particularly with the H2 content and the HHV of the product, which are higher than the experimental data. The primary reason for this deviation is attributed to the fact that HHV is calculated based on the H2 content, and the main contributing factor to this bias is the overestimation of H2 in the simulation.
This work conducted a sensitivity analysis to examine the variations induced by temperature in each component and evaluate the specific impact of temperature on the content of different components. At a temperature of 1300 °C and an ER of 0.20, the specific sensitivity coefficients for each component are illustrated in Figure 9b. H2 and CO exhibited a positive response to the changes in temperature. In other words, the H2 and CO concentrations would significantly increase with the temperature elevation. Similarly, it can be inferred that an increase in temperature can significantly reduce the CO2, CH4, H2O, and soot concentrations. Based on Figure 9b, the influence of temperature on the tar content appears to be relatively weak. One potential explanation for this phenomenon could be the instability of the chemical structure of tar components, leading to nearly complete conversion at 1300 °C. Consequently, an increase in temperature at this stage may not significantly alter the tar content.
Drawing on the kinetic model and the preceding findings, this behavior may be elucidated by the fact that the Boudouard reaction C + C O 2 2 C O , water gas reaction C + H 2 O C O + H 2 , and CH4 steam reforming C H 4 + H 2 O C O + 3 H 2 are all endothermic. An increase in temperature promotes the product generation. In contrast, the water–gas shift reaction is exothermic, and it is favored at low temperatures. Therefore, the trade-off between reactions can explain the behavior observed, as the increase of H2 and CO concentration with temperature.

3.3.3. Evaluation of the Effect of ER on the Model Producer Gas Reforming

This section contrasts the disparities between simulated outcomes and experimental results under various ER. It mainly compares the predictive capabilities of kinetic models for the reformation process as ER undergoes variations. Finally, an analysis is conducted on the potential impact of ER variations on reaction pathways.
Figure 10a compares the simulation results from the kinetic model with experimental data. The disparity between the kinetic model results and the experimental data is quantified using RMSE and RRMSE. Figure 10b illustrates the RMSE and RRMSE values for each individual product. Notably, the predictive performance of the model for variations in ER is not as accurate as its predictive performance for temperature variations. From Figure 10b, the kinetic model exhibits the highest prediction errors for H2, soot, and H2O, with their respective RMSE values being 2.11, 1.21, and 2.43. Correspondingly, their RRMSE values are 11.01%, 10.20%, and 9.00%.
Figure 11a illustrates the disparities between model-predicted and experimental values for H2, CO, and CH4 content, as well as the HHV of the products under varying ER. The model predictions for H2 and HHV are significantly higher than the experimentally measured data. Additionally, when ER is set at 0.30, there is also an elevated error in the prediction of CO. The graph indicates that the model shows minimal prediction deviation for CO and CH4. Consequently, the overestimation of HHV is primarily attributed to the notably higher model-predicted values of H2. The overestimations of H2 concentrations, when compared to experimental results, are commonly observed in thermodynamic and kinetic studies [18,36]. A potential reason could be that both Puig’s and the present research utilized ideal reactor models without accounting for gas diffusion processes during the reaction. Consequently, the overestimation of H2 may stem from the omission of diffusion in the actual reaction, leading to an accelerated reaction rate in the model.
At 1300 °C, ER = 0.20, and a residence time of 0.005 s, the sensitivity analysis results for the variations in ER on the concentrations of different components are depicted in Figure 11b. H2 and soot exhibit the maximum negative sensitivity coefficients to the increase in ER, while CO2 and H2O demonstrate the highest positive sensitivity coefficients to ER escalation. This implies that, under these conditions, elevating the ER significantly promotes the conversion of H2 and soot into CO2 and H2O. CO, CH4, and tar exhibit the minimum negative sensitivity coefficients, with the sensitivity coefficients of CH4 and tar aligning with experimental results. However, the sensitivity coefficient of CO is relatively small, and a potential reason for this discrepancy could be the chosen residence time of 0.005 s, as the reaction between CO and O2 might commence after the 0.005 s timeframe.
Combining the sensitivity analysis and previous experimental findings, we ascertain that elevating the ER in the reforming system primarily enhances the progression of oxidation reactions. The key oxidation reactions in the reforming include CO oxidation ( C O + 1 2 O 2 C O 2 ) and hydrogen oxidation ( H 2 + 1 2 O 2 H 2 O ). Upon observing experimental phenomena, the reduction of soot in the product is associated with increased ER in the reforming system. Two potential reasons account for this phenomenon. Firstly, introducing O₂ inhibits the soot formation. Secondly, O₂ consumes the intermediate soot through the reaction 1.25 C + O 2 0.5 C O + 0.75 C O 2 . The ER elevation facilitates the reaction driving CH₄ consumption ( C H 4 + 1 2 O 2 C O + 2 H 2 ).

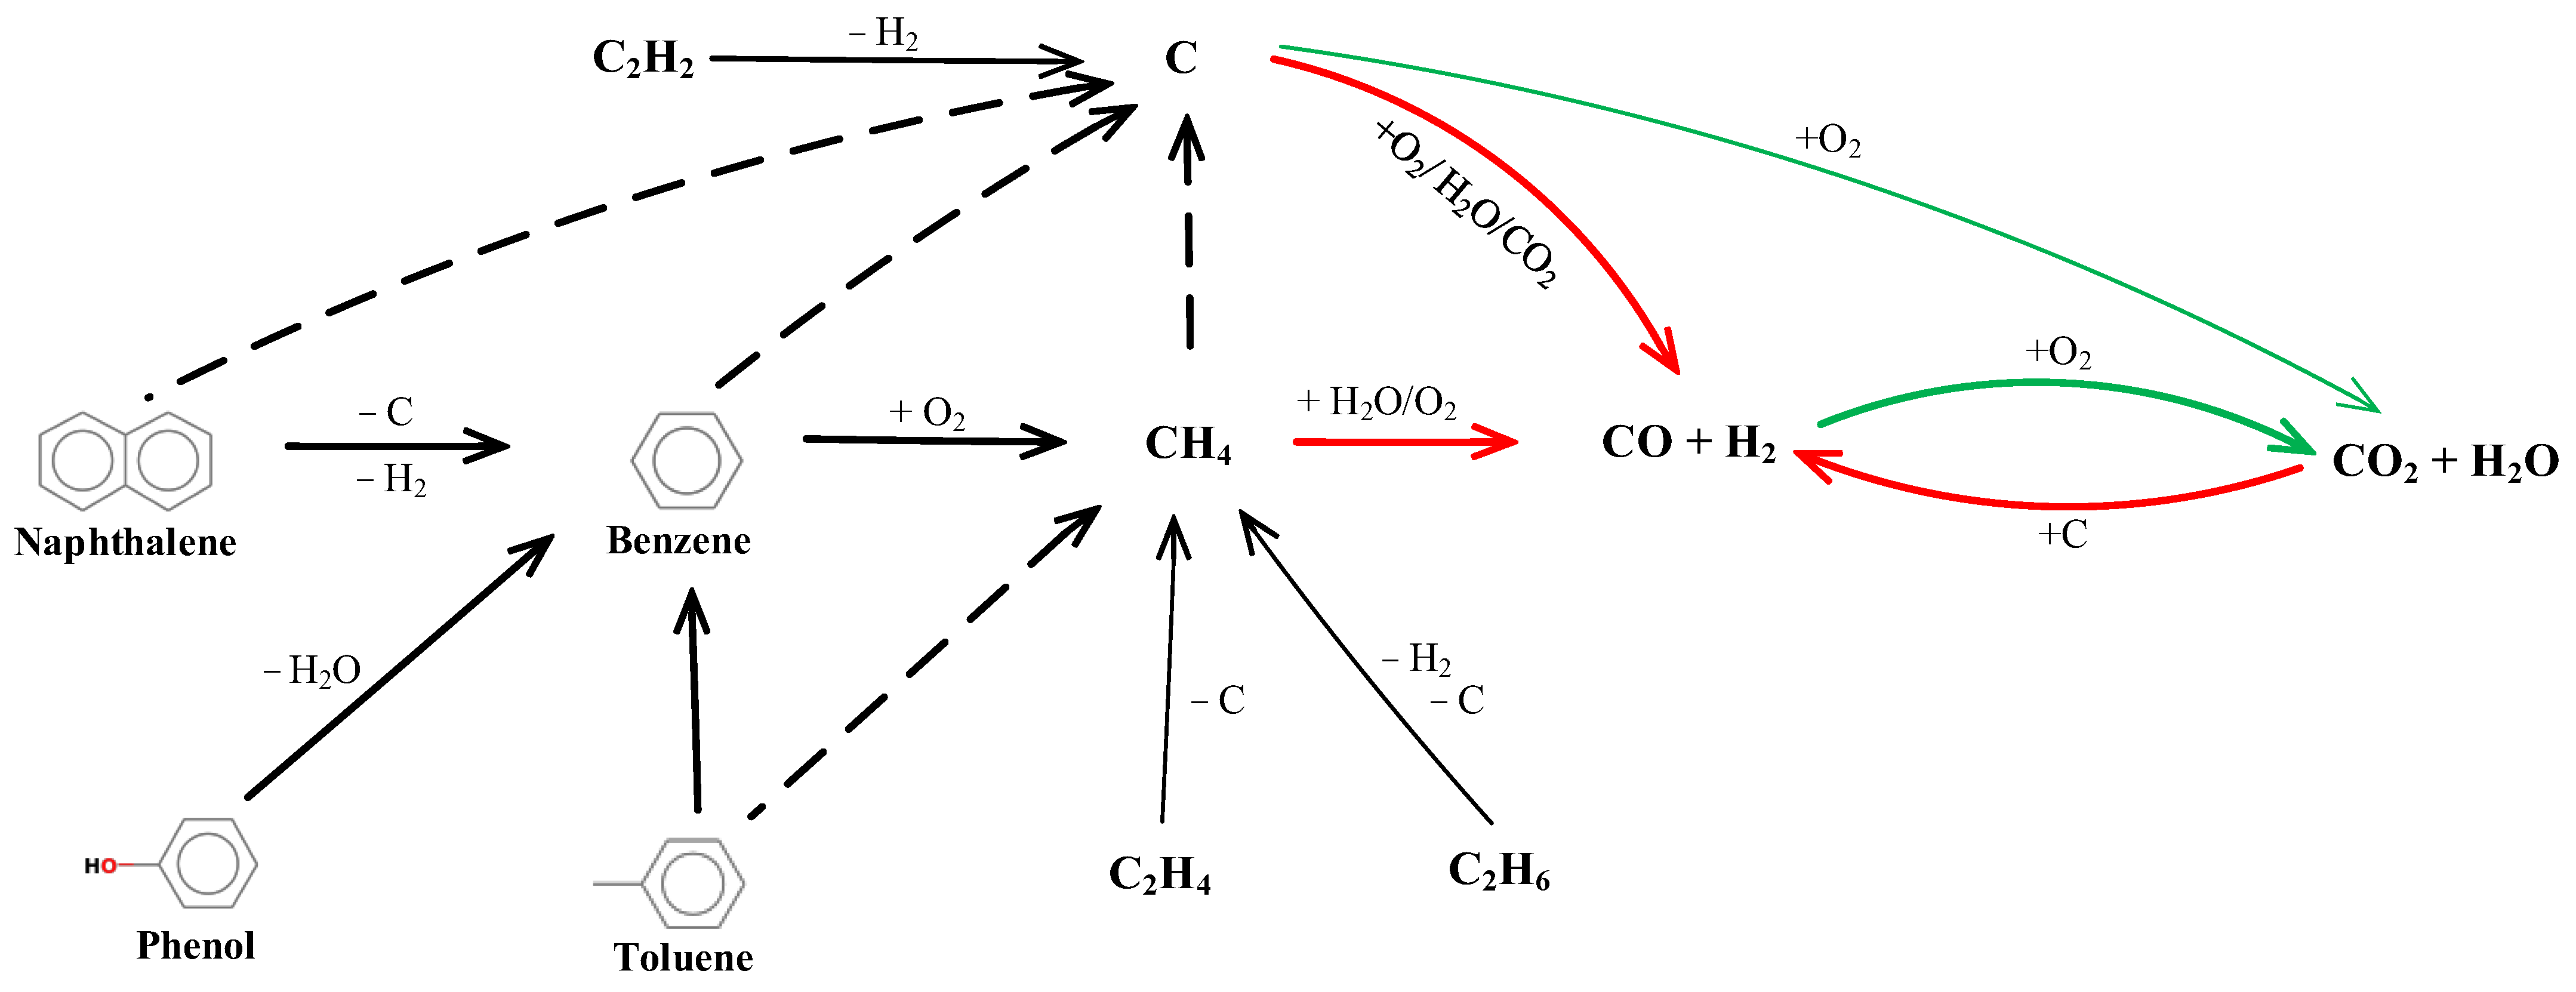
3.4. Proposed Reaction Pathways

Based on the simulation and experimental results, an illustrative schematic of the reaction pathway for non-catalytic reforming of biomass gasification producer gas is depicted in Figure 12. In which, solid lines represent primary products, while dashed lines indicate secondary by-products.
This study utilized C10H8, C7H8, C6H5OH, and C6H6 as model tar compounds. Naphthalene was a challenging component to convert within tar and represented tertiary tar. During the reforming, its primary products included benzene, methane, soot, and hydrogen. A typical reaction is represented by R14: C 10 H 8 9 C + 0.1 C 6 H 6 + 0.4 C H 4 + 2.9 H 2 . Additionally, typical reactions involving C7H8, C6H5OH, and C6H6 are as follows: R12: C 7 H 8 + H 2 C 6 H 6 + C H 4 , R13: C 6 H 6 O C O + 0.4 C 10 H 8 + 0.15 C 6 H 6 + 0.1 C H 4 + 0.75 H 2 , and R15: C 6 H 6 + 2 H 2 O 1.5 C + 2.5 C H 4 + 2 C O [5,19,30].
Raising the temperature not only increases the molecular collision frequency, thereby enhancing the chemical reaction rate, but also promotes endothermic reactions. As indicated by the red pathways in the diagram, elevating the reaction temperature significantly accelerates the methane steam reforming reaction, water gas reaction, and Boudouard reaction. These reactions notably facilitate the production of CO and H2. Increasing the oxygen content significantly promotes the oxidation reactions of soot, CO, and H2. These oxidation reactions include soot oxidation, CO oxidation, and H2 oxidation, as indicated by the green pathways in Figure 12. These reactions notably lead to an increase in the CO2 and H2O concentrations while decreasing the CO and H2 concentrations. Consequently, this results in a reduction in the HHV of the products.
Catalytic tar reforming, while a prominent research focus, demonstrates discernible limitations relative to its non-catalytic counterpart, as evidenced by the Ni-Cu/Mg/Al catalyst system implemented in steam reforming applications [37]. The dry gas composition of H2 and CO in the product was 55.26% and 32.03%, respectively. In contrast, in this study, under non-catalytic conditions at 1300 °C and ER = 0.20, the dry gas composition of H2 and CO was 40.81% and 32.69%. Increasing the temperature to 1500 °C at the same ER of 0.20, the H2 and CO composition rose to 43.50% and 49.50%, respectively. It is noteworthy that the Ni-Cu/Mg/Al catalyst has a limited lifespan of only 80 min. Moreover, the catalytic reforming products still contained 1.65% CH4 content gradually increased with time. In contrast, non-catalytic reforming at 1400 °C completely converts CH4.While higher reforming temperatures might be considered a disadvantage of non-catalytic reforming compared to catalytic reforming, this challenge proves surmountable through strategic thermal integration schemes optimizing energy recuperation. Moreover, non-catalytic systems demonstrate superior tar conversion efficiency, achieving more comprehensive molecular decomposition of complex hydrocarbons.
The substantial tar and hydrocarbon cantent inherent in biomass gasification producer gas imposes constraints on low-temperature non-catalytic reforming process, resulting in incomplete molecular decomposition of these complex aromatic structures. Demol et al. [10] proposed the reforming of wood gasification producer gas at 1100 °C and ER = 0.25 resulted in a product containing 5.1% CH4, 6.52 g/Nm3 of tar, with CO and H2 concentrations of 15.9% and 27.6%, respectively. Similarly, Su et al. [9] investigated the reforming of rice straw gasification producer gas at 900 °C and ER = 0.21. Their results indicated significant amounts of CH4 (11.1%) and tar (80 g/Nm3) in the product gas. Although the hydrogen yield exceeded 50%, 4 kg of rice straw generated noly 0.9 Nm3 of gas. According to experimental results, at a temperature of 1500 °C and ER of 0.20, CH4, soot and other hydrocarbons can be completely convertrd into CO and H2. Therefore, ensuring an ER of 0.20 and maintaining a peak temperature above 1500 °C within the reformer is essential for the effective conversion of hydrocarbons and tar in the producer gas into CO and H2.

4. Conclusions

The non-catalytic reforming of biomass gasification producer gas was carried out through a high-temperature fixed-bed reactor. Simultaneously, an apparent kinetic model was developed to simulate the reforming process using a plug flow reactor model under the experimental conditions. A comparative analysis of experimental data and computationally derived values were presented to validate the kinetic model and assess the impact of ER and temperature on the product composition, including H2, CO, CH4, CO2, H2O, soot, and tar for different components, as the temperature or ER varies, the maximum RMSE and RRMSE between the model predictions and experimental values were 2.43 and 11.01%, respectively. This indicates that the model is adept at predicting the reaction effectively. Elevating temperature notably accelerates endothermic reactions, such as the Boudouard reaction, water gas reaction, and CH4 steam reforming. This leads to a significant increase in CO and H2 concentrations; increasing the temperature from 1100 to 1500 °C could increase CO from 12.67% to 34.35% and increase H2 from 19.23% to 28.02%, while reducing H2O, CO2, and other byproduct concentrations, thereby substantially enhancing the HHV of the products. On the other hand, elevating the ER primarily promotes the oxidation reactions of CO, H2, soot, and other gas-phase components. This significantly elevates the CO2 and H2O concentrations while reducing the content of H2 and CO, increasing ER from 0.10 to 0.20 could lead CO and H2 declining from 22.25 to 16.11% and from 13.81% to 10.54%, and resulting in a decrease in the HHV of the products. Throughout the reforming, benzene serves as a key intermediate in the conversion of aromatic compounds, such as naphthalene, phenol, and toluene. The soot generated during the reforming primarily originates from naphthalene, benzene, and CH4.

Author Contributions

Conceptualization, J.Z. and Y.F.; methodology, J.Z.; validation, G.C. and Z.B., H.C., D.H. and C.L.; formal analysis, Y.W. and G.C.; investigation, Y.W.; resources, J.Z.; data curation, Y.W. and G.C.; writing—original draft preparation, Y.W.; writing—review and editing, G.C. and J.B.; supervision, J.Z. and Y.F.; project administration, C.L.; funding acquisition, C.L. and Y.F. All authors have read and agreed to the published version of the manuscript.

Funding

This work is financially supported by the Strategic Priority Research Program of the Chinese Academy of Sciences (No. XDA29050600).

Data Availability Statement

Dataset available on request from the authors.

Conflicts of Interest

The authors declare no conflict of interest.

References

  1. International Renewable Energy Agency. Available online: https://www.irena.org/Publications/2024/Jul/Renewable-energy-statistics-2024 (accessed on 7 May 2025).
  2. Mtshali, B.; Kassim, A.; Sibanda, S.; Workneh, T. Characterization of South African Woody and Non-Woody Invasive Alien Plant Species for Sustainable Bio-Oil Production. Energies 2025, 18, 1919. [Google Scholar] [CrossRef]
  3. Kim, S.; Yoon, S.; Zulqarnain; Yoo, J.; Im, H.; Kim, S.; Chun, D.; Choi, H.; Lim, J. Steam Reforming of High-Concentration Toluene as a Model Biomass Tar Using a Nickel Catalyst Supported on Carbon Black. Energies 2025, 18, 327. [Google Scholar] [CrossRef]
  4. Talero, G.; Kansha, Y. Atom economy or product yield to determine optimal gasification conditions in biomass-to-olefins biorefinery. Chem. Eng. Res. Des. 2023, 199, 689–699. [Google Scholar] [CrossRef]
  5. Wang, Y.; Zhang, J.; Liang, W.; Cao, G.; Li, C.; Zhao, J.; Fang, Y. Kinetic Analysis of Biomass Gasification Coupled with Non-Catalytic Reforming to Syngas Production. J. Fuel Chem. Technol. 2023, 51, 921–929. [Google Scholar]
  6. Errekatxo, A.; Ibarra, A.; Gutierrez, A.; Bilbao, J.; Arandes, J.M.; Castaño, P. Catalytic deactivation pathways during the cracking of glycerol and glycerol/VGO blends under FCC unit conditions. Chem. Eng. J. 2017, 307, 955–965. [Google Scholar] [CrossRef]
  7. Anis, S.; Zainal, Z.A. Tar reduction in biomass producer gas via mechanical, catalytic and thermal methods: A review. Renew. Sustain. Energy Rev. 2011, 15, 2355–2377. [Google Scholar] [CrossRef]
  8. Tian, Y.; Du, J.; Luo, Z.; He, D.; Ma, W.; Zhou, X.; Liang, S.; Yuan, L. Kinetic study on biomass gasification coupled with tar reforming for syngas production. Biomass Convers. Biorefinery 2023, 14, 28377–28385. [Google Scholar] [CrossRef]
  9. Su, Y.; Luo, Y.; Chen, Y.; Wu, W.; Zhang, Y. Experimental and numerical investigation of tar destruction under partial oxidation environment. Fuel Process. Technol. 2011, 92, 1513–1524. [Google Scholar] [CrossRef]
  10. Demol, R.; Ruiz, M.; Schnitzer, A.; Herbinet, O.; Mauviel, G. Experimental and modeling investigation of partial oxidation of gasification tars. Fuel 2023, 351, 128990. [Google Scholar] [CrossRef]
  11. Wongchang, T.; Patumsawad, S.; Fungtammasan, B. An analysis of wood pyrolysis tar from high temperature thermal cracking process. Energy Sources Part A Recovery Util. Environ. Eff. 2013, 35, 926–935. [Google Scholar] [CrossRef]
  12. Qin, K.; Lin, W.; Jensen, P.A.; Jensen, A.D. High-temperature entrained flow gasification of biomass. Fuel 2012, 93, 589–600. [Google Scholar] [CrossRef]
  13. Ahrenfeldt, J.; Egsgaard, H.; Stelte, W.; Thomsen, T.; Henriksen, U.B. The influence of partial oxidation mechanisms on tar destruction in TwoStage biomass gasification. Fuel 2013, 112, 662–680. [Google Scholar] [CrossRef]
  14. Lapuerta, M.; Hernández, J.J.; Pazo, A.; López, J. Gasification and co-gasification of biomass wastes: Effect of the biomass origin and the gasifier operating conditions. Fuel Process. Technol. 2008, 89, 828–837. [Google Scholar] [CrossRef]
  15. Sittisun, P.; Tippayawong, N.; Pang, S. Biomass gasification in a fixed bed downdraft reactor with oxygen enriched air: A modified equilibrium modeling study. Energy Procedia 2019, 160, 317–323. [Google Scholar] [CrossRef]
  16. Martínez, J.D.; Silva Lora, E.E.; Andrade, R.V.; Jaén, R.L. Experimental study on biomass gasification in a double air stage downdraft reactor. Biomass Bioenergy 2011, 35, 3465–3480. [Google Scholar] [CrossRef]
  17. Jaojaruek, K.; Jarungthammachote, S.; Gratuito, M.K.; Wongsuwan, H.; Homhual, S. Experimental study of wood downdraft gasification for an improved producer gas quality through an innovative two-stage air and premixed air/gas supply approach. Bioresour. Technol. 2011, 102, 4834–4840. [Google Scholar] [CrossRef]
  18. Puig-Gamero, M.; Pio, D.T.; Tarelho, L.A.C.; Sánchez, P.; Sanchez-Silva, L. Simulation of biomass gasification in bubbling fluidized bed reactor using aspen plus®. Energy Convers. Manag. 2021, 235, 113981. [Google Scholar] [CrossRef]
  19. Martínez González, A.; Silva Lora, E.E.; Escobar Palacio, J.C.; Almazán del Olmo, O.A. Hydrogen production from oil sludge gasification/biomass mixtures and potential use in hydrotreatment processes. Int. J. Hydrogen Energy 2018, 43, 7808–7822. [Google Scholar] [CrossRef]
  20. Champion, W.M.; Cooper, C.D.; Mackie, K.R.; Cairney, P. Development of a chemical kinetic model for a biosolids fluidized-bed gasifier and the effects of operating parameters on syngas quality. J. Air Waste Manag. Assoc. 2013, 64, 160–174. [Google Scholar] [CrossRef]
  21. Eri, Q.; Peng, J.; Zhao, X. CFD simulation of biomass steam gasification in a fluidized bed based on a multi-composition multi-step kinetic model. Appl. Therm. Eng. 2018, 129, 1358–1368. [Google Scholar] [CrossRef]
  22. Milne, T.A.; Evans, R.J.; Abatzaglou, N. Biomass Gasifier “Tars”: Their Nature, Formation, and Conversion; National Renewable Energy Laboratory: Golden, CO, USA, 1998. [Google Scholar]
  23. Srinivas, S.; Field, R.P.; Herzog, H.J. Modeling Tar Handling Options in Biomass Gasification. Energy Fuels 2013, 27, 2859–2873. [Google Scholar] [CrossRef]
  24. Evans, R.; Knight, R.; Onischak, M.; Babu, S. Development of Biomass Gasification to Produce Substitute Fuels; Pacific Northwest Lab.: Richland, WA, USA, 1988. [Google Scholar]
  25. Kondratiev, V. Determination of the rate constant for thermal cracking of methane by means of adiabatic compression and expansion. In Symposium (International) on Combustion; Elsevier: Amsterdam, The Netherlands, 1965; pp. 319–322. [Google Scholar]
  26. Schulz, G.; Klotz, H.D.; Spangenberg, H.J. Reaktionsmodell zur Bruttokinetik der Pyrolyse von Methan im Stoßwellenrohr bei Temperaturen von 1800 K bis 2500 K. Z. Für Chemie 1985, 25, 88–92. [Google Scholar] [CrossRef]
  27. Niu, B.; Jia, M.; Xu, G.; Chang, Y.; Xie, M. Efficient Approach for the Optimization of Skeletal Chemical Mechanisms with Multiobjective Genetic Algorithm. Energy Fuels 2018, 32, 7086–7102. [Google Scholar] [CrossRef]
  28. Deb, K.; Jain, H. An Evolutionary Many-Objective Optimization Algorithm Using Reference-Point-Based Nondominated Sorting Approach, Part I: Solving Problems With Box Constraints. IEEE Trans. Evol. Comput. 2014, 18, 577–601. [Google Scholar] [CrossRef]
  29. Despotovic, M.; Nedic, V.; Despotovic, D.; Cvetanovic, S. Evaluation of empirical models for predicting monthly mean horizontal diffuse solar radiation. Renew. Sustain. Energy Rev. 2016, 56, 246–260. [Google Scholar] [CrossRef]
  30. Jess, A. Mechanisms and kinetics of thermal reactions of aromatic hydrocarbons from pyrolysis of solid fuels. Fuel 1996, 75, 1441–1448. [Google Scholar] [CrossRef]
  31. Zubair Yahaya, A.; Rao Somalu, M.; Muchtar, A.; Anwar Sulaiman, S.; Ramli Wan Daud, W. Effects of temperature on the chemical composition of tars produced from the gasification of coconut and palm kernel shells using downdraft fixed-bed reactor. Fuel 2020, 265, 116910. [Google Scholar] [CrossRef]
  32. Yahaya, A.Z.; Somalu, M.R.; Muchtar, A.; Sulaiman, S.A.; Wan Daud, W.R. Effect of particle size and temperature on gasification performance of coconut and palm kernel shells in downdraft fixed-bed reactor. Energy 2019, 175, 931–940. [Google Scholar] [CrossRef]
  33. Kuo, P.-C.; Wu, W.; Chen, W.-H. Gasification performances of raw and torrefied biomass in a downdraft fixed bed gasifier using thermodynamic analysis. Fuel 2014, 117, 1231–1241. [Google Scholar] [CrossRef]
  34. Harris, S.; Elliott, L.; Ingham, D.; Pourkashanian, M.; Wilson, C. The optimisation of reaction rate parameters for chemical kinetic modelling of combustion using genetic algorithms. Comput. Methods Appl. Mech. Eng. 2000, 190, 1065–1090. [Google Scholar] [CrossRef]
  35. Elliott, L.; Ingham, D.; Kyne, A.; Mera, N.; Pourkashanian, M.; Wilson, C. A novel approach to mechanism reduction optimization for an aviation fuel/air reaction mechanism using a genetic algorithm. J. Eng. Gas Turbines Power 2006, 128, 255–263. [Google Scholar] [CrossRef]
  36. Pio, D.; Tarelho, L. Empirical and chemical equilibrium modelling for prediction of biomass gasification products in bubbling fluidized beds. Energy 2020, 202, 117654. [Google Scholar] [CrossRef]
  37. Gao, N.; Salisu, J.; Quan, C.; Williams, P. Modified nickel-based catalysts for improved steam reforming of biomass tar: A critical review. Renew. Sustain. Energy Rev. 2021, 145, 111023. [Google Scholar] [CrossRef]
Figure 1. The schematic of the experimental apparatus (a) and the temperature profile along the reactor depth (b).
Energies 18 02945 g001
Figure 2. Ideal plug flow reactor model.
Energies 18 02945 g002
Figure 3. Effect of temperature on: (a) the content of H2, CO, and H2O in the products; (b) the content of CH4, CO and soot in the products. In non-catalytic reforming at ER = 0.20.
Energies 18 02945 g003
Figure 4. (a) Maior species conversion; (b) HHV and tar content during producer gas reforming at varying temperature.
Energies 18 02945 g004
Figure 5. Effect of ER on the product composition in non-catalytic reforming at 1100 °C. Effect of ER on: (a) the content of H2, CO, and CO2 in the products; (b) the content of CH4, H2O and soot in the products. In non-catalytic reforming at 1100 °C.
Energies 18 02945 g005
Figure 6. (a) Major species conversion; (b) HHV and tar content during producer gas reforming at varying ER.
Energies 18 02945 g006
Figure 7. (a) Comparison of simulation data with experimental tar mass yield from rice straw pellet gasification; (b) comparison of simulated data with withheld data in this study.
Energies 18 02945 g007
Figure 8. (a) Comparison of experimental results with model predictions; (b) RMSE and RRMSE for different components at various temperatures (T = 1100 °C, 1300 °C, and 1500 °C, ER = 0.20).
Energies 18 02945 g008
Figure 9. (a) Comparison of gas quality between the kinetic model (trendline) and experimental results (acatter plots) at various temperatures; (b) Sensitivity analysis of product composition under 1300 °C, ER = 0.20, and t = 0.005 s).
Energies 18 02945 g009
Figure 10. (a) Comparison of experimental results with model predictioins; (b) RMSE and RRMSE for different components at various temperatures (T = 1300 °C, ER = 0.10, 0.20, and 0.30).
Energies 18 02945 g010
Figure 11. (a) Comparison of gas quality between the kinetic model (trendline) and experimental results (scatter plots) at various ER; (b) Sensitivity analysis of product composition under 1300 °C, ER = 0.20, t = 0.005 s.
Energies 18 02945 g011
Figure 12. Simplified reaction pathway of the producer gas reforming.
Energies 18 02945 g012
Table 1. Composition of biomass gasification producer gas [24].
CompositionContent/mol.%CompositionContent/mol.%
CO6.83C2H60.38
CO215.29C2H40.20
H210.01C6H61.67
H2O40.02C7H80.15
N220.68C10H82.15
CH46.22C6H5OH0.10
Table 2. Typical reactions and kinetic expressions considered in reforming.
ReactionRate Expression (mol‧m−3·s−1)Ref.Reaction Number
Total   oxidation   of   CO :   C O + 1 2 O 2 C O 2 r = k · e E a R T [ C O ] [ O 2 ] 0.25 [ H 2 O ] 0.5 [18](1)
Hydrogen oxidation: H 2 + 1 2 O 2 H 2 O r = k · e E a R T [ H 2 ] [ O 2 ] [18](2)
Partial   oxidation   of   C :   1.25 C + O 2 0.5 C O + 0.75 C O 2 r = k · T · e E a R T [ C ] [ O 2 ] 1.2 [19](3)
Partial   oxidation   of   CH 4 :   C H 4 + 1 2 O 2 C O + 2 H 2 r = k · e E a R T [ C H 4 ] 0.5 [ O 2 ] 1.25 [18](4)
Water   gas :   C + H 2 O C O + H 2 r = k · e E a R T [ C ] [ H 2 O ] 0.1 [19](5)
Water gas   shift :   C O + H 2 O C O 2 + H 2 r = k · e E a R T [ C O ] [ H 2 O ] [20](6)
Steam   reforming   of   CH 4 :   C H 4 + H 2 O C O + 3 H 2 r = k · e E a R T [ C H 4 ] [ H 2 O ] [19](7)
Boudouard   reaction :   C + C O 2 2 C O r = k · e E a R T [ C ] [ C O 2 ] 0.1 [18](8)
Thermal   cracking   of   CH 4 :   C H 4 C + 2 H 2 r = k · e E a R T [ C H 4 ] [25](9)
Thermal   cracking   of   C 2 H 2 :   C 2 H 2 2 C + H 2 r = k · e E a R T [ C 2 H 2 ] [26](10)
Thermal   cracking   of   C 2 H 4 :   C 2 H 4 C + C H 4 r = k · e E a R T [ C 2 H 4 ] [25](11)
Thermal   cracking   of   C 2 H 6 :   C 2 H 6 C + C H 4 + H 2 r = k · e E a R T [ C 2 H 6 ] [25](12)
Thermal   cracking   of   tar :   C 7 H 8 + H 2 C 6 H 6 + C H 4 r = k · e E a R T [ C 7 H 8 ] 1 [ H 2 ] 0.5 [23](13)
C 6 H 6 O C O + 0.4 C 10 H 8 + 0.15 C 6 H 6 + 0.1 C H 4 + 0.75 H 2 r = k · e E a R T [ C 6 H 6 O ] [18](14)
C 10 H 8 9 C + 0.1 C 6 H 6 + 0.4 C H 4 + 2.9 H 2 r = k · e E a R T [ C 10 H 8 ] 1.6 [ H 2 ] 0.5 [18](15)
C 6 H 6 + 2 H 2 O 1.5 C + 2.5 C H 4 + 2 C O r = k · e E a R T [ C 6 H 6 ] 1.3 [ H 2 O ] 0.2 [23](16)
Table 3. Kinetic parameters of the reactions.
ReactionOptimized Value
kEa (J/mol)
R11.40 × 10121.80 × 105
R25.20 × 10131.25 × 105
R32.26 × 10121.50 × 106
R41.11 × 10142.02 × 105
R54.32 × 1061.59 × 105
R62.28 × 1031.26 × 104
R75.94 × 1081.25 × 105
R82.08 × 1071.35 × 105
R93.27 × 1092.63 × 105
R104.57 × 10101.72 × 105
R111.92 × 10101.59 × 105
R123.07 × 10153.00 × 105
R136.20 × 10153.50 × 105
R141.05 × 1091.00 × 105
R152.71 × 10152.47 × 105
R166.97 × 10223.28 × 105
Disclaimer/Publisher’s Note: The statements, opinions and data contained in all publications are solely those of the individual author(s) and contributor(s) and not of MDPI and/or the editor(s). MDPI and/or the editor(s) disclaim responsibility for any injury to people or property resulting from any ideas, methods, instructions or products referred to in the content.

