1. Introduction
The energy and environmental crisis provides a challenge for food and beverage producers, increasing energy costs and reducing profit margins. Increasingly stringent wastewater discharge standards and regulations impart a large cost of operation for companies not equipped to properly treat their own wastewater. One potential solution to achieve these standards is to have an on-site wastewater treatment facility, which recovers renewable energy from organic waste that can reduce operating expenses (OPEX).
Conventional anaerobic digestion (AD) systems are not commercially feasible for smaller on-site treatment, partially due to their large size with long treatment times (20–60 days), low operational stability, susceptibility to active biomass washout, low biogas yield, and lengthy periods of acclimatisation that increase system start-up time [
1]. AD systems are also highly sensitive to fluctuating organic loading rates (OLRs), which are a regular occurrence at small and medium enterprise (SME) food and beverage manufacturing sites. Alternatives such as aerated wastewater treatment technologies, including activated sludge, dissolved air floatation (DAF), and membrane aerated bioreactors, are very energy-intensive.
Microbial electrolysis cells coupled to AD (MEC-AD), also known as electromethanogenic reactors (EMR), have been demonstrated to be an effective way of treating organic-rich wastewater and producing an energy-rich biogas product [
2]. Microbial electrolysis cells (MECs) in their most simplistic form consist of an anode and a cathode, both hosting microbial biofilms that act as biocatalysts. This approach improves treatment performance compared to traditional AD systems by immobilising bacterial biomass and optimising conditions for the active biomass [
3,
4]. From an electrochemical perspective, the anode catalyses the breakdown of organics, releasing electrons that are then utilised in the hydrogen evolution reaction, electromethanogenesis, and hydrogenotrophic methanogenesis at the cathode.
Often, electroactive methanogenic species capable of direct interspecies electron transfer (DIET) are found at the anode in high relative abundance, directly utilising metabolites from the hydrolysis and acetogenic phases of anaerobic digestion without the need for the cathode [
5]. A cathode potential of between −0.4 and −1.3 V (relative to a standard hydrogen electrode (SHE)) is applied to surpass the minimum hydrogen evolution potential of −0.4 V and encourage the selection of appropriate microbial communities. Because of the protective environment of the electrode biofilm, the microbial biomass responsible for waste treatment and biogas production is protected from stresses such as low waste pH, low hydraulic retention time (HRT)-related washout, and variable waste quality that would normally inhibit AD systems and reduce their treatment performance. EMRs offer performance benefits, with research demonstrating increased operational stability and 1.7 times higher energy production through increased gas yields and higher methane concentration than in AD [
6,
7].
Using EMRs for wastewater treatment has demonstrated the acceleration of substrate removal in comparison to AD, indicating the potential applicability for the treatment of any commercial waste streams already used for AD [
7]. EMRs present opportunities to push parameters such as hydraulic retention time and OLRs due to the architecture of EMRs and biofilm-based catalysis [
8]. Reducing the hydraulic retention time required for treatment allows smaller bioreactors to be used, reducing capital expenditure (CAPEX) and decreasing time for return on investment. Biofilm-based technologies have been shown to withstand the high shear and flowrates that planktonic or sludge-based technologies cannot due to reduced microbial washout and a modified microbial community [
9].
Further understanding the performance differences between AD and MEC-ADs will allow for the identification of the commercial applications of the technology. The increased performance of MEC-AD systems compared to AD is well documented; however, performance differences found in the literature are mainly based on small-scale reactors. Bo et al. [
6] reported carbon recovery rates that were 24–230% higher, chemical oxygen demand (COD) removal rates 130–300% higher, and CH
4 yield 55–56% higher than AD reactors with a 180 mL reactor size. Song et al. [
10] found similar results, finding that biogas methane content and volatile solid removal was much higher than typically reported in AD at hydraulic retention times as low as 5 days, well below the acceptable lower bound of HRT in AD treating brewery wastewater (8 to 15 days). Zhao et al. [
11] utilised 500 mL reactors and found that gas production at its peak was 11.7 times higher than in an AD control reactor. It was also observed that at the end of the experiment, the residual volatile fatty acid (VFA) concentration was 12.3 times higher in the AD control, indicating a much faster rate of organics removal in the MEC-AD reactor. At a 1 L scale, Molognoni et al. [
12] observed a 25–82% higher CH
4 production rate than in control AD.
Attempts to scale MEC-AD reactors have been made but have failed to reach commercially viable volumes and treatment rates necessary for implementation. An 800 L pilot-scale reactor was coupled with an up-flow anaerobic sludge blanket (UASB) reactor to enhance the treatment of Fisher-Tropsch wastewater [
13]. The MEC system reduced the amount of alkali solution required to maintain optimum pH of the UASB influent and allowed for maintenance of methane yield and pollutant removal at lower HRTs.
A 1000 L pilot-scale reactor was tested by Cusick et al. [
14] running on winery wastewater. They found that there was a reasonable relationship between the performance of small-scale MECs and this scaled-up version in terms of current density. It was noted that the start-up of this pilot was slow (60 days) compared to 30 mL reactors used in the lab, but this was likely due to low acetate levels, improper inoculum, low temperatures, and pH. This confirms the need for proper online VFA monitoring through biosensing and the development of reactor inoculum.
It is crucial to understand whether these performance increases are consistently maintained at pilot-scale reactors and to understand methods that preserve the improved performance over AD from small to pilot-scale. A commercial-scale reactor of 3600 L (working liquid volume) was therefore commissioned at a brewery to investigate the feasibility of a commercial-scale MEC-AD system for treating brewery wastewater.
2. Materials and Methods
2.1. Situation
The pilot-scale reactor and on-site laboratory was situated at Hepworth and Co Brewing Company (Sussex, UK). Hepworth currently produce 150,000 L of wastewater per week, which is removed by a bulk liquid tanker. This comes with great financial cost (GBP 125,000 per annum) and carbon emissions associated with the road transport and treatment of the brewery wastewater.
2.2. Pilot Reactor and Electrode Design
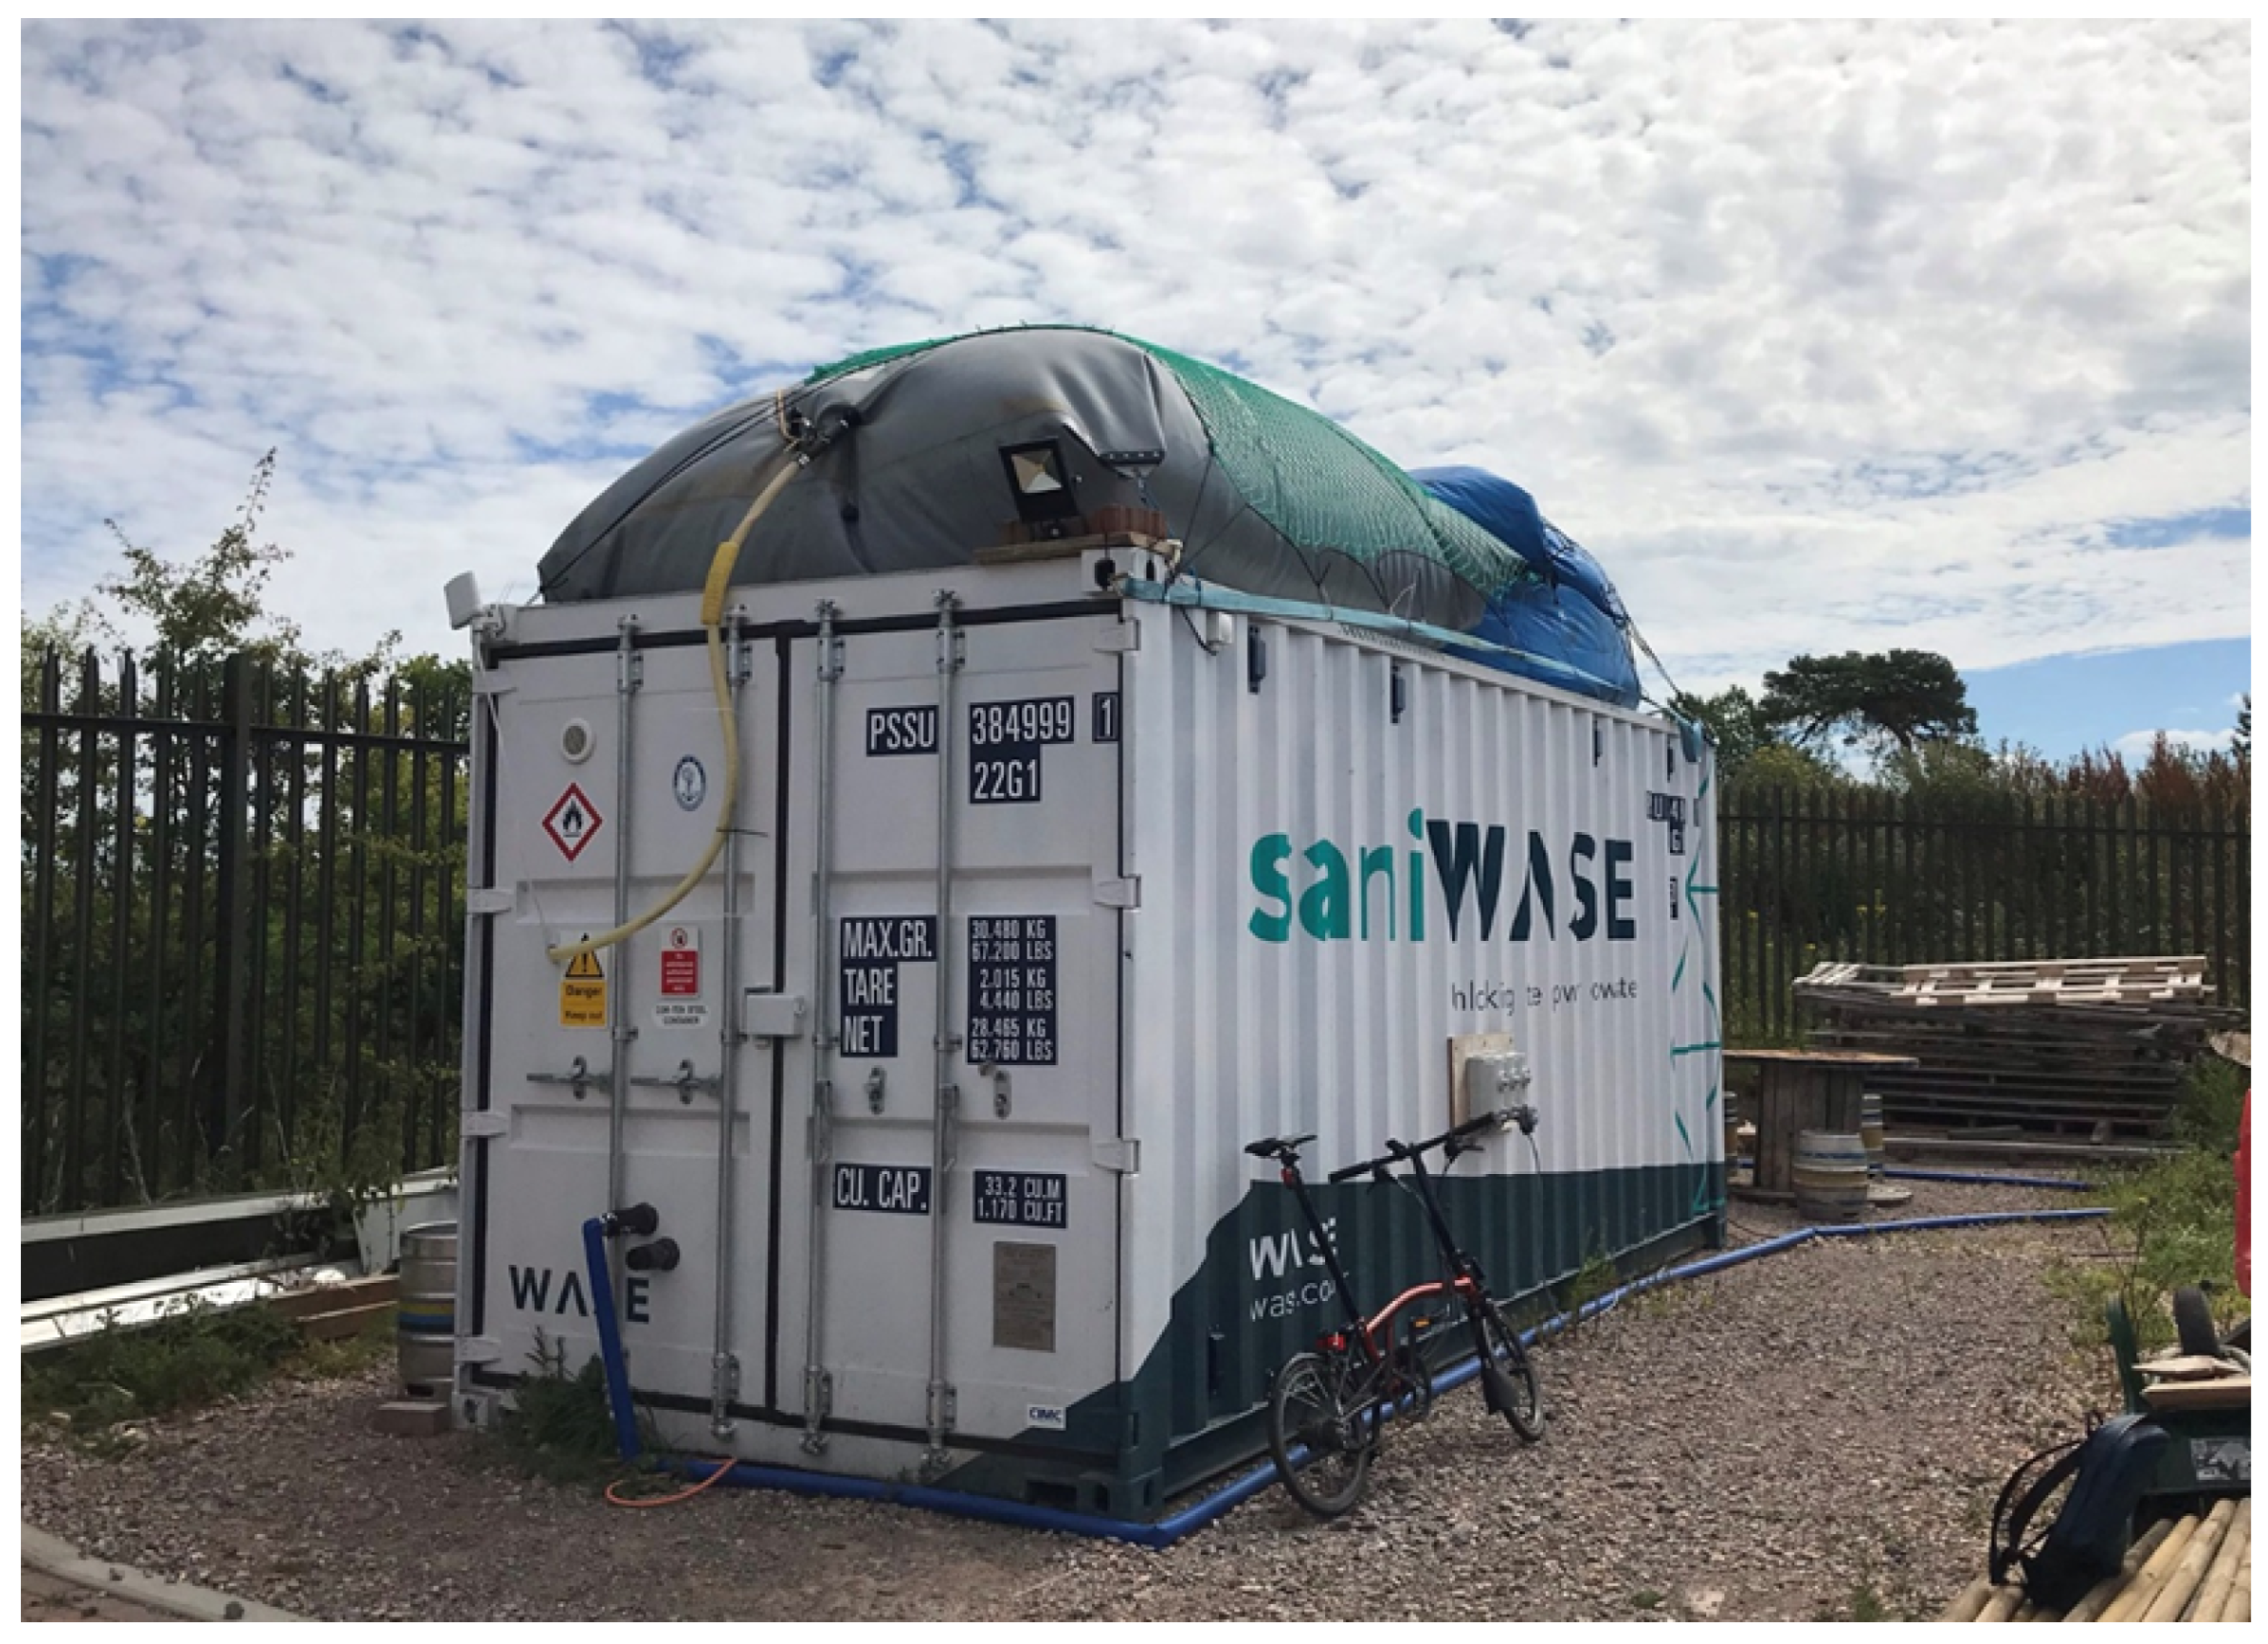
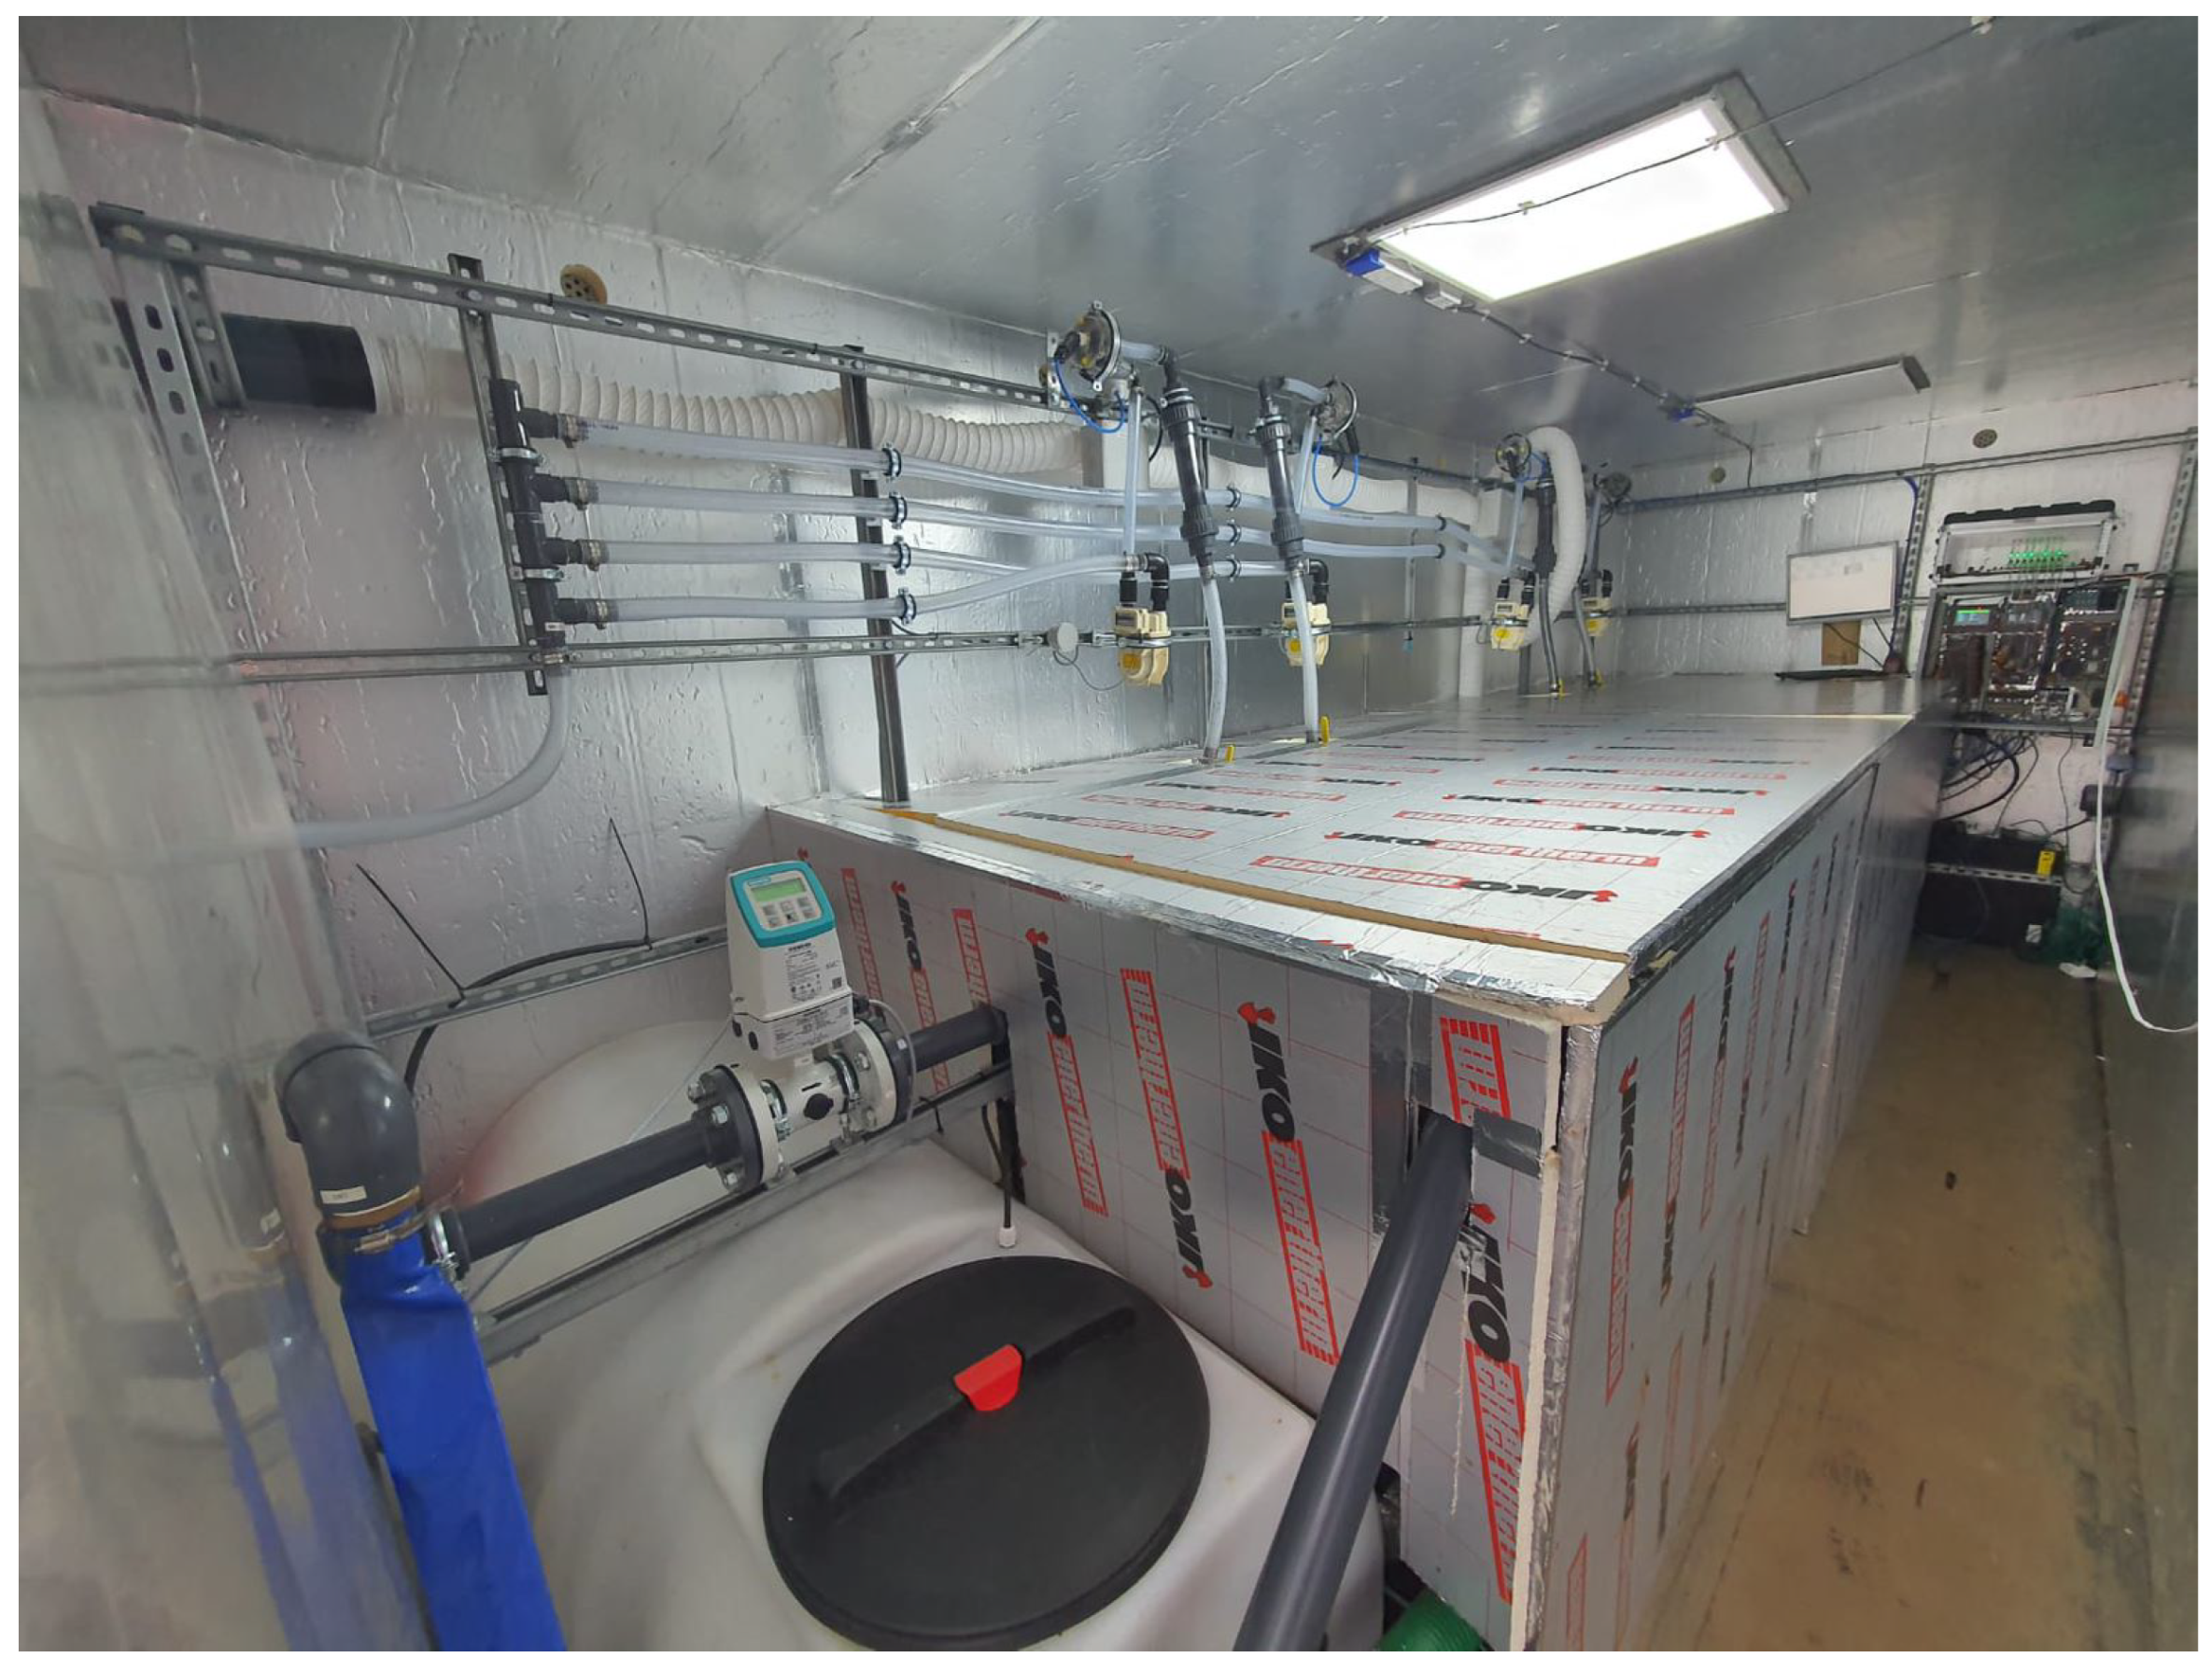
Four 1000 L (actual capacity) international bulk containers (IBC) were situated inside an insulated 20 ft shipping container and utilised as the reactor vessels of the system (
Figure 1 and
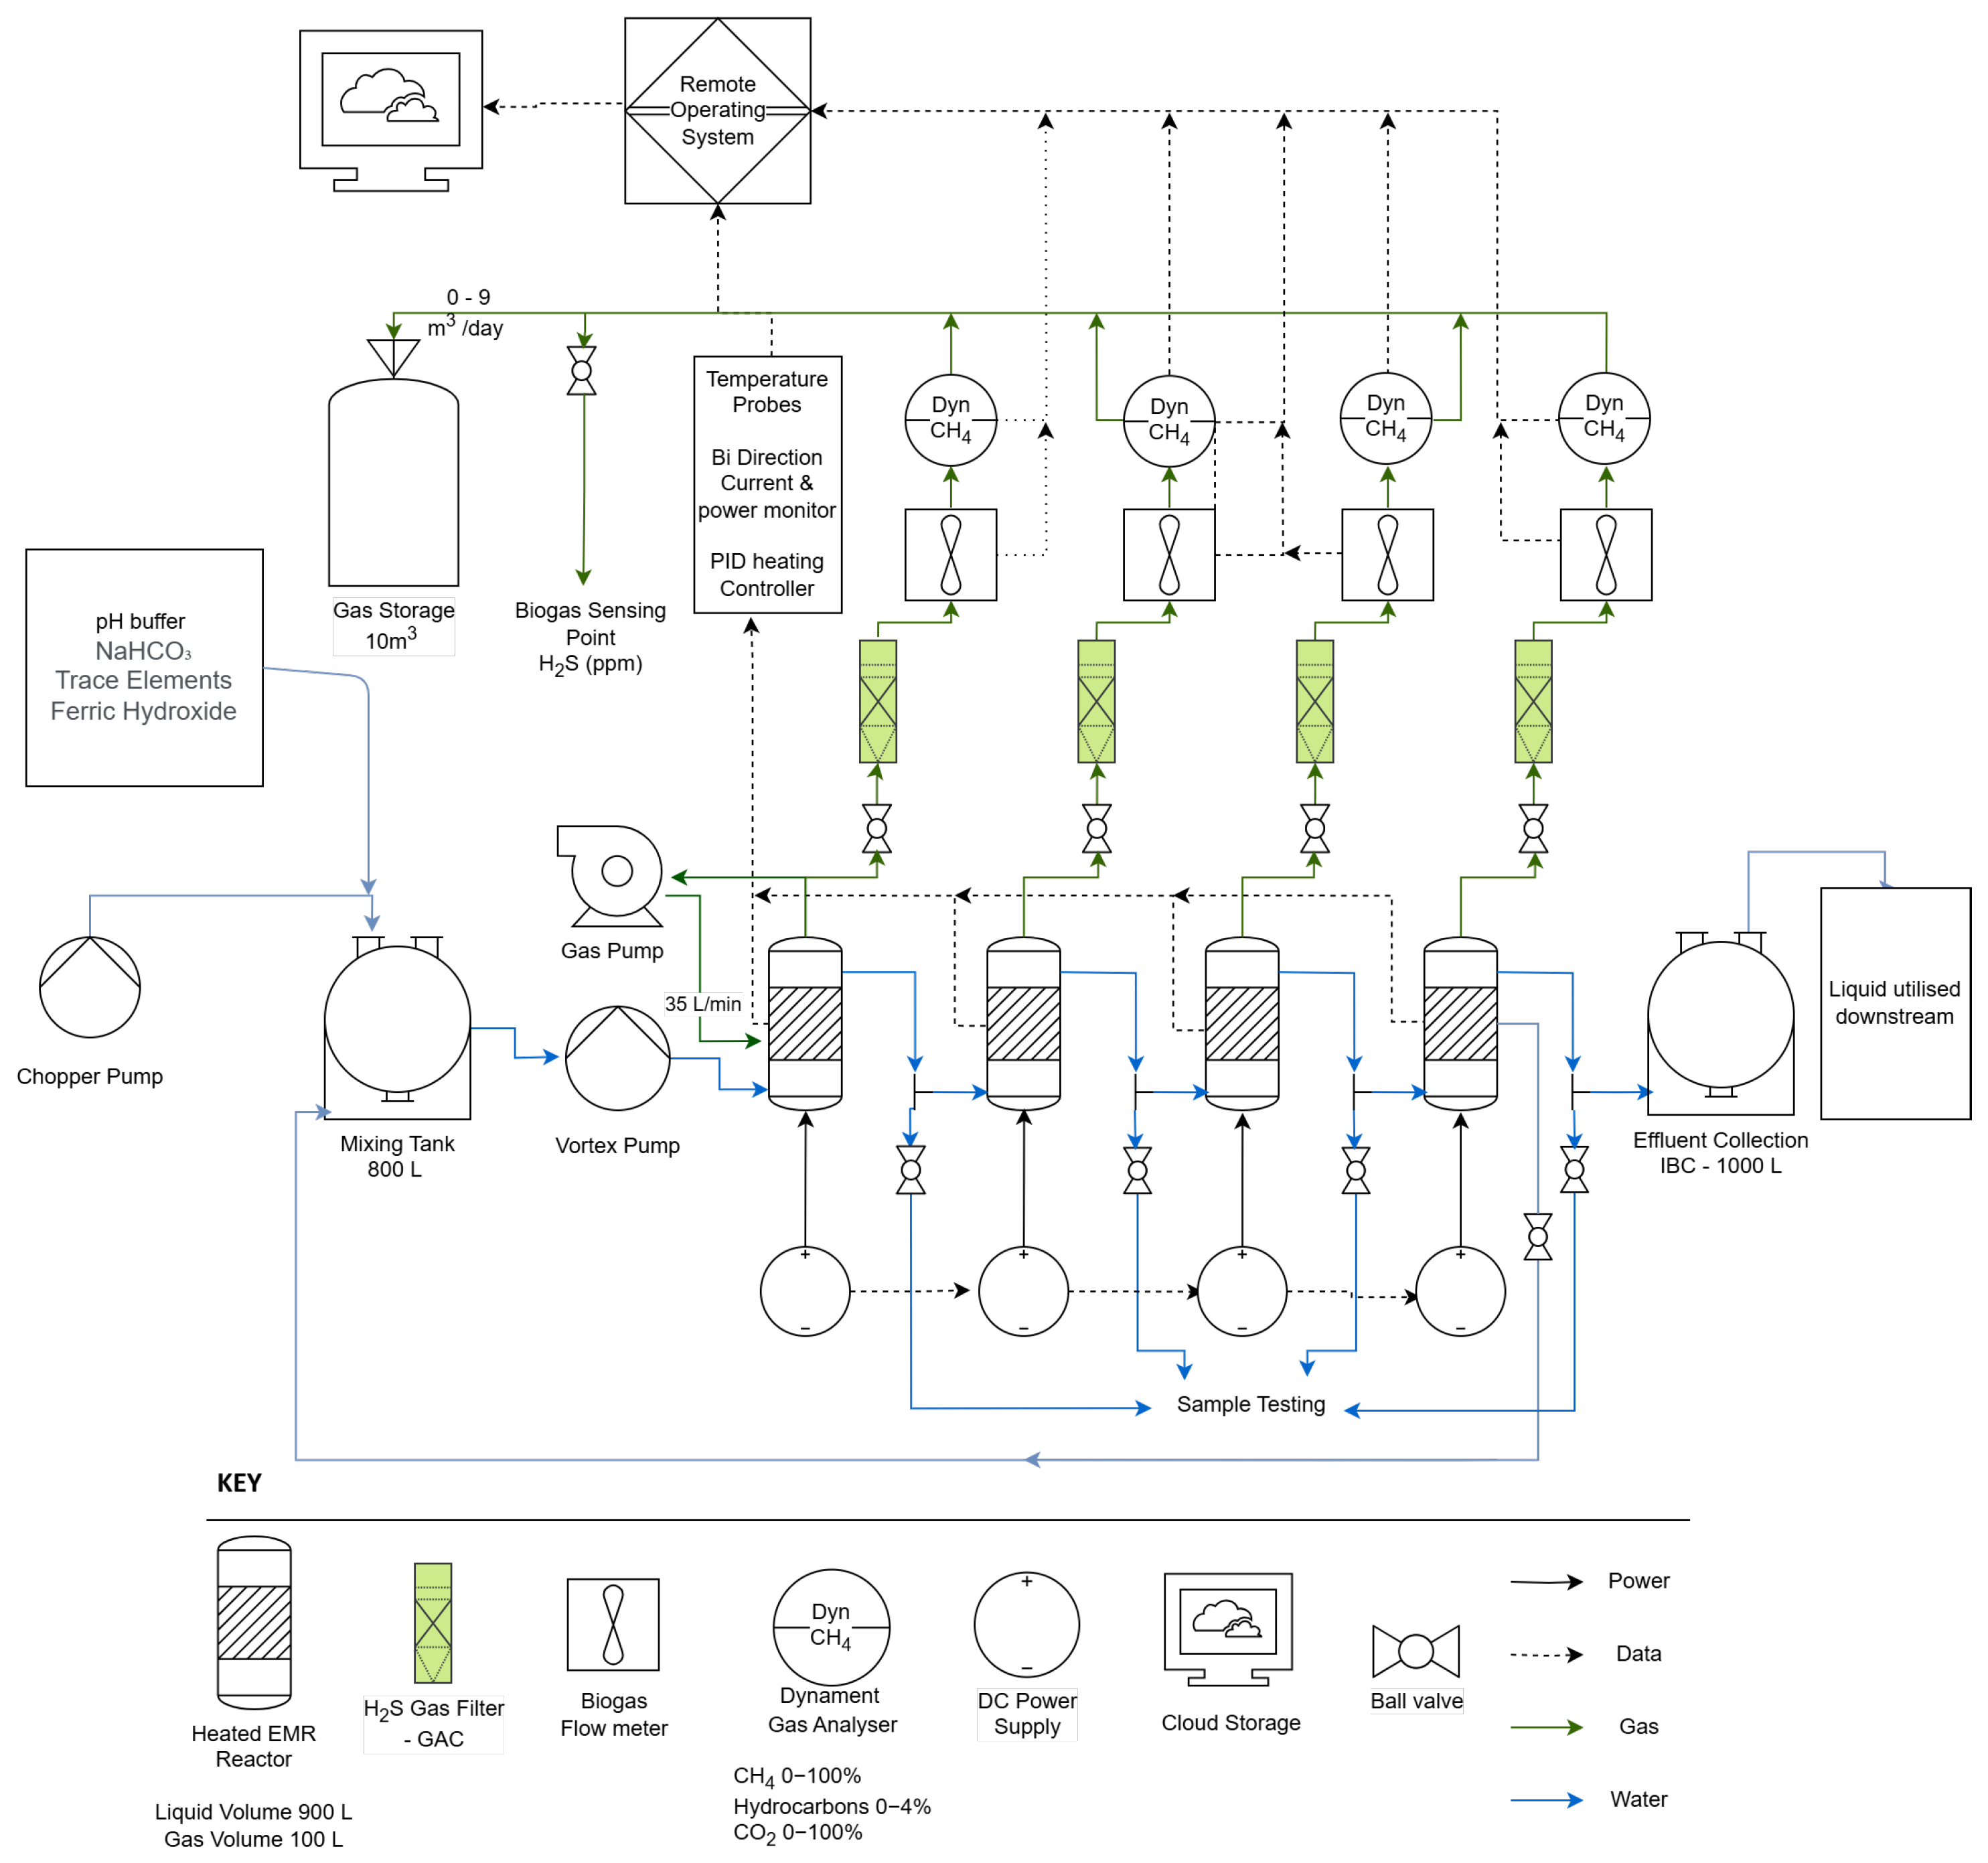
Figure 2). Each IBC was individually heated with thermostatically controlled heating jackets with 600 W heating power. Each vessel had 4 liquid sampling ports, situated at the bottom, high, mid, and low points of the active reactor volume. An 800 L equalisation tank was used for the storage, metering, and feeding of brewery wastewater to the reactor vessels. Each IBC contained 8 electrode modules. The electrodes were held in position on an ABS injection moulded framework that connected each individual electrode to a titanium bus bar. A titanium reference wire connected to the cathode allowed for the measurement of voltage at the module, enabling the detection and compensation of voltage drop. The assembled electrode modules were inserted into the reactor and arranged in a 3 × 2 × 3 grid. Three strips of plastic immobilised the electrode modules, preventing them from falling over. Electrodes were maintained at 0.6–1 V cell potential by connecting the cathode to the negative terminal and anode to the positive terminal of a digital logging power supply (NGP800, Rohde and Schwarz, Munich, Germany). Each vessel was connected to one of four channels on the power supply.
2.3. Reactor Start-Up
Prior to the start of the brewery trial, the pilot system was operated for 6 months on simulated brewery wastewater comprised of molasses as a wet testing/commissioning method to validate hardware and acclimation stage for the biomass. As part of this wet testing, the reactor was initially inoculated with 500 L of primary digestate from Arla Foods (Hemel Hempsted, UK). Once on site at the brewery, to the start of operations of the brewery and refresh the microbial inventory, the reactor was seeded with 50 L of primary digestate from a thermophilic reactor (Staples Vegetables, Boston, UK) and 50 L from a mesophilic reactor (Wappingthorn Farm, Steyning, UK), both digesting energy crops. The digestates were screened using a 10 mm mesh sieve to remove large particulates. This was fed to the system before feeding of brewery wastewater to reduce stress to the microorganisms.
2.4. Experimental Design
The aim of the experiment was to discover the maximum stable loading rate for the test system. In order to do this, the feed rate of the system was progressively increased as long as the fluchtige organische sauren/totales anorganisches carbonat ratio (FOS/TAC) (Nordmann Method) was within safe bounds, below approximately 0.5. Additionally, other process indicators such as food/mass ratio (F/M) and effluent settleable solids (SS) were used to indicate the causes of process upset [
16]. Any change in effluent total suspended solid concentrations would indicate biomass washout was taking place. Stable operation was defined as the system displaying stationary indicators such as FOS/TAC, pH, effluent quality, and biogas composition over three or more hydraulic retention times. Hydraulic retention time was controlled and OLR was allowed to fluctuate according to the strength of the wastewater provided by the brewery as part of their normal operation.
2.5. Reactor Operation
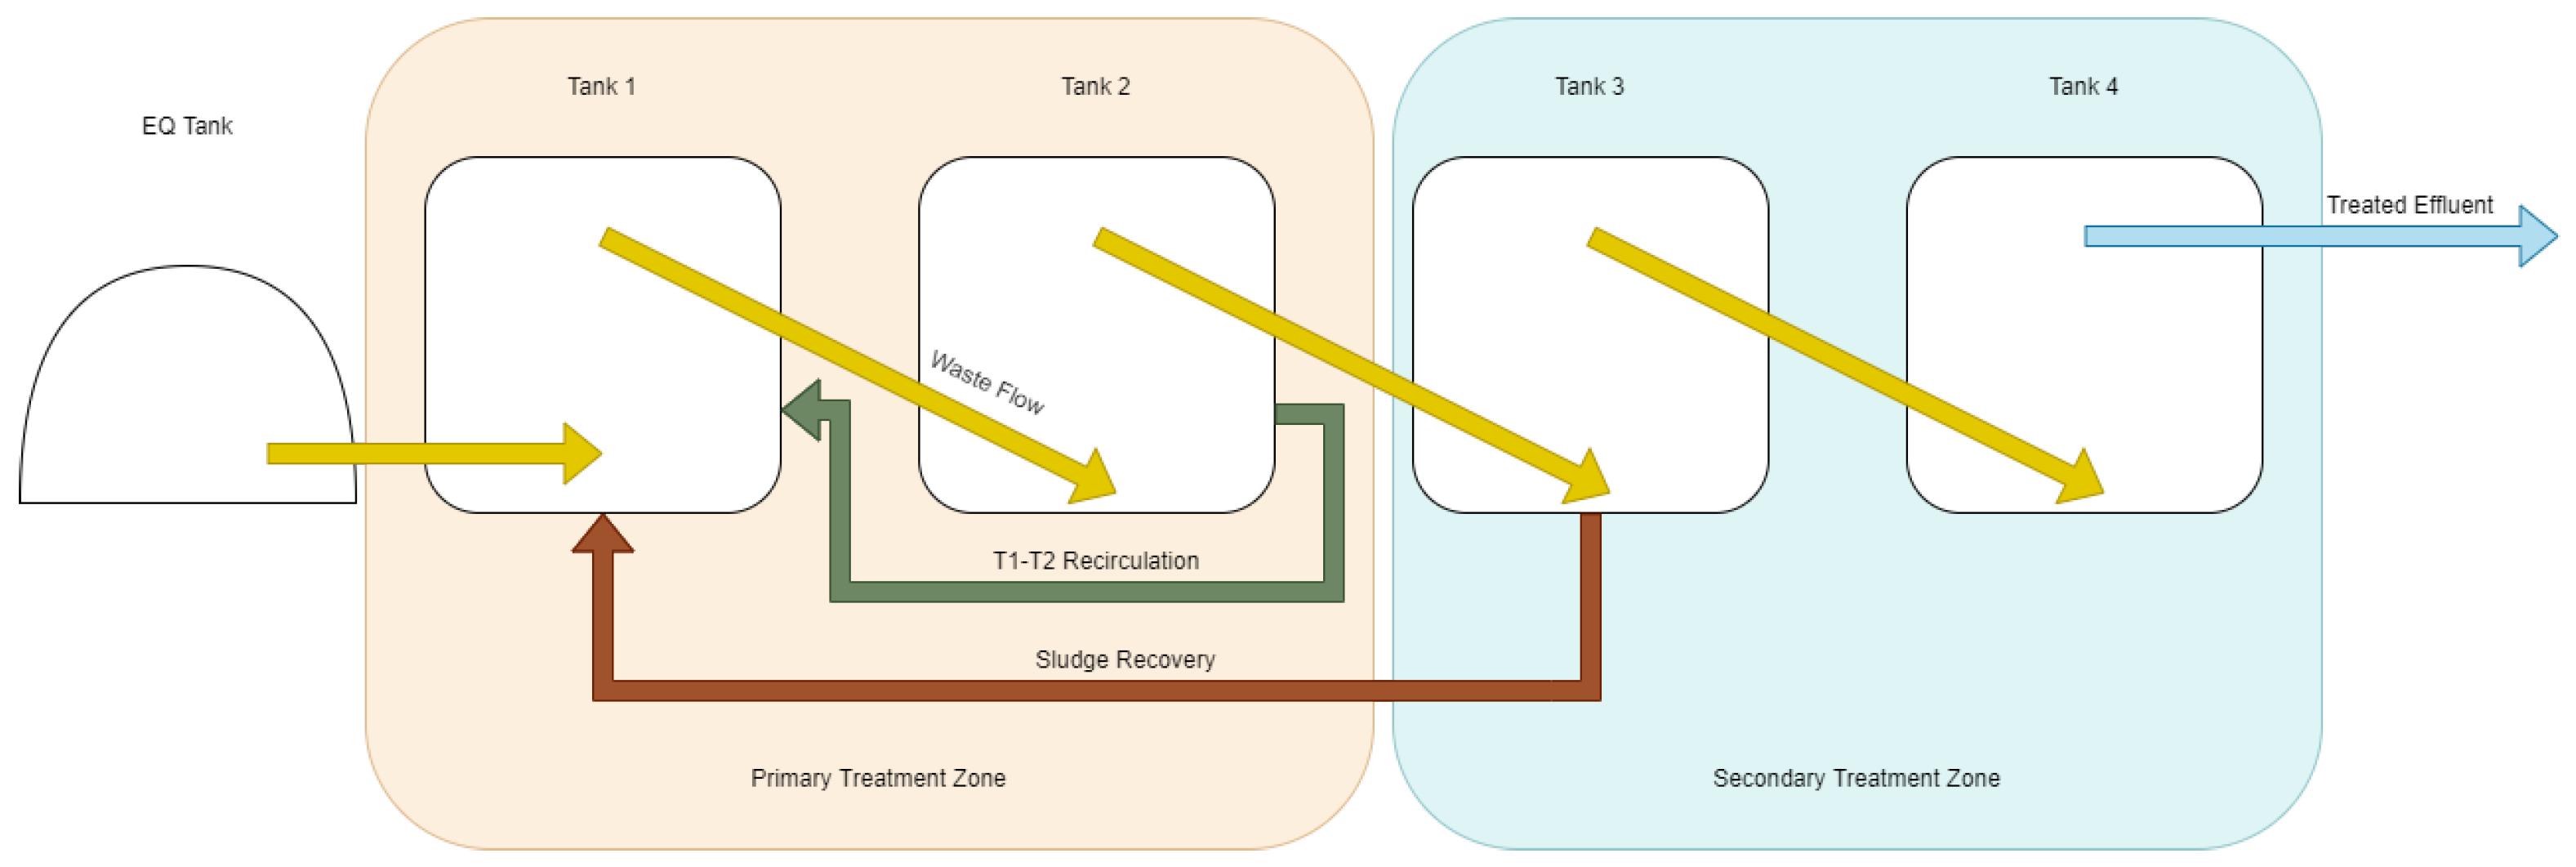
Wastewater was pumped on a timer-based system from the Hepworth wastewater holding vessel to the internal equalisation tank of the test system. Additives such as trace elements and ferric hydroxide were dosed at this point. Wastewater was then pumped from the internal equalisation tank into a distribution manifold in the bottom of the T1 ((Tank 1) primary reactor) at a determined feeding rate. As wastewater was added, digestate flowed from the top of each reactor over a gravity weir to the bottom of the next reactor in a cascade, allowing for the decoupling of hydraulic and solid retention time and facilitating control of the position of active biomass in the reactor. Sludge recirculation was carried out with a peristaltic pump (AMP-16D, Boyser Pumps, Barcelona, Spain) from the bottom of each vessel to simulate the recovery of solids from a settlement step that would form part of a commercial system and to hold biomass in the primary treatment vessel of the system. The block flow diagrams for this operation are available in
Figure 3 and
Figure 4. This sludge recirculation enabled the use of a high flowrate (low HRT) operation without washing out settleable biomass. The produced biogas was held in two bags, measuring 6 m
3 and 4 m
3, on top of the shipping container, which facilitated the storage and flaring of excess biogas to a water heater or stove. Mixing was provided by gas recirculation from the headspace, bubbled through four lances placed at the bottom of the reactors. A gas pump with a flowrate of approximately 35 L/min was utilised and operated in synchronicity with feeding schedules. The gas mixing would operate for only 5 min after every feeding event, allowing for settlement in order to reduce washout before the next feeding event. As the reactor is a sequential design consisting of four vessels, the OLR of the system would be based on the primary treatment zone. With the acidic and rapidly degradable brewery wastewater, sequential or series treatment is not required to improve hydrolysis, as noted in some studies [
17,
18]. Initially, the primary treatment zone was classified as the first two of the 4 tanks (
Figure 3). This was intended to prevent pickling and inhibition of the anaerobic digestion process that would be caused by the first vessel experiencing the organic load that a continuous stirred tank reactor (CSTR) four times its size would experience. This separation of treatment zones was created by recirculating waste between the two vessels at at intervals of 5 min on, 5 min off at a flowrate of approximately 50 L/min (reduced from 239 L/min rated flow of the centrifugal pump). This resulted in 36 m
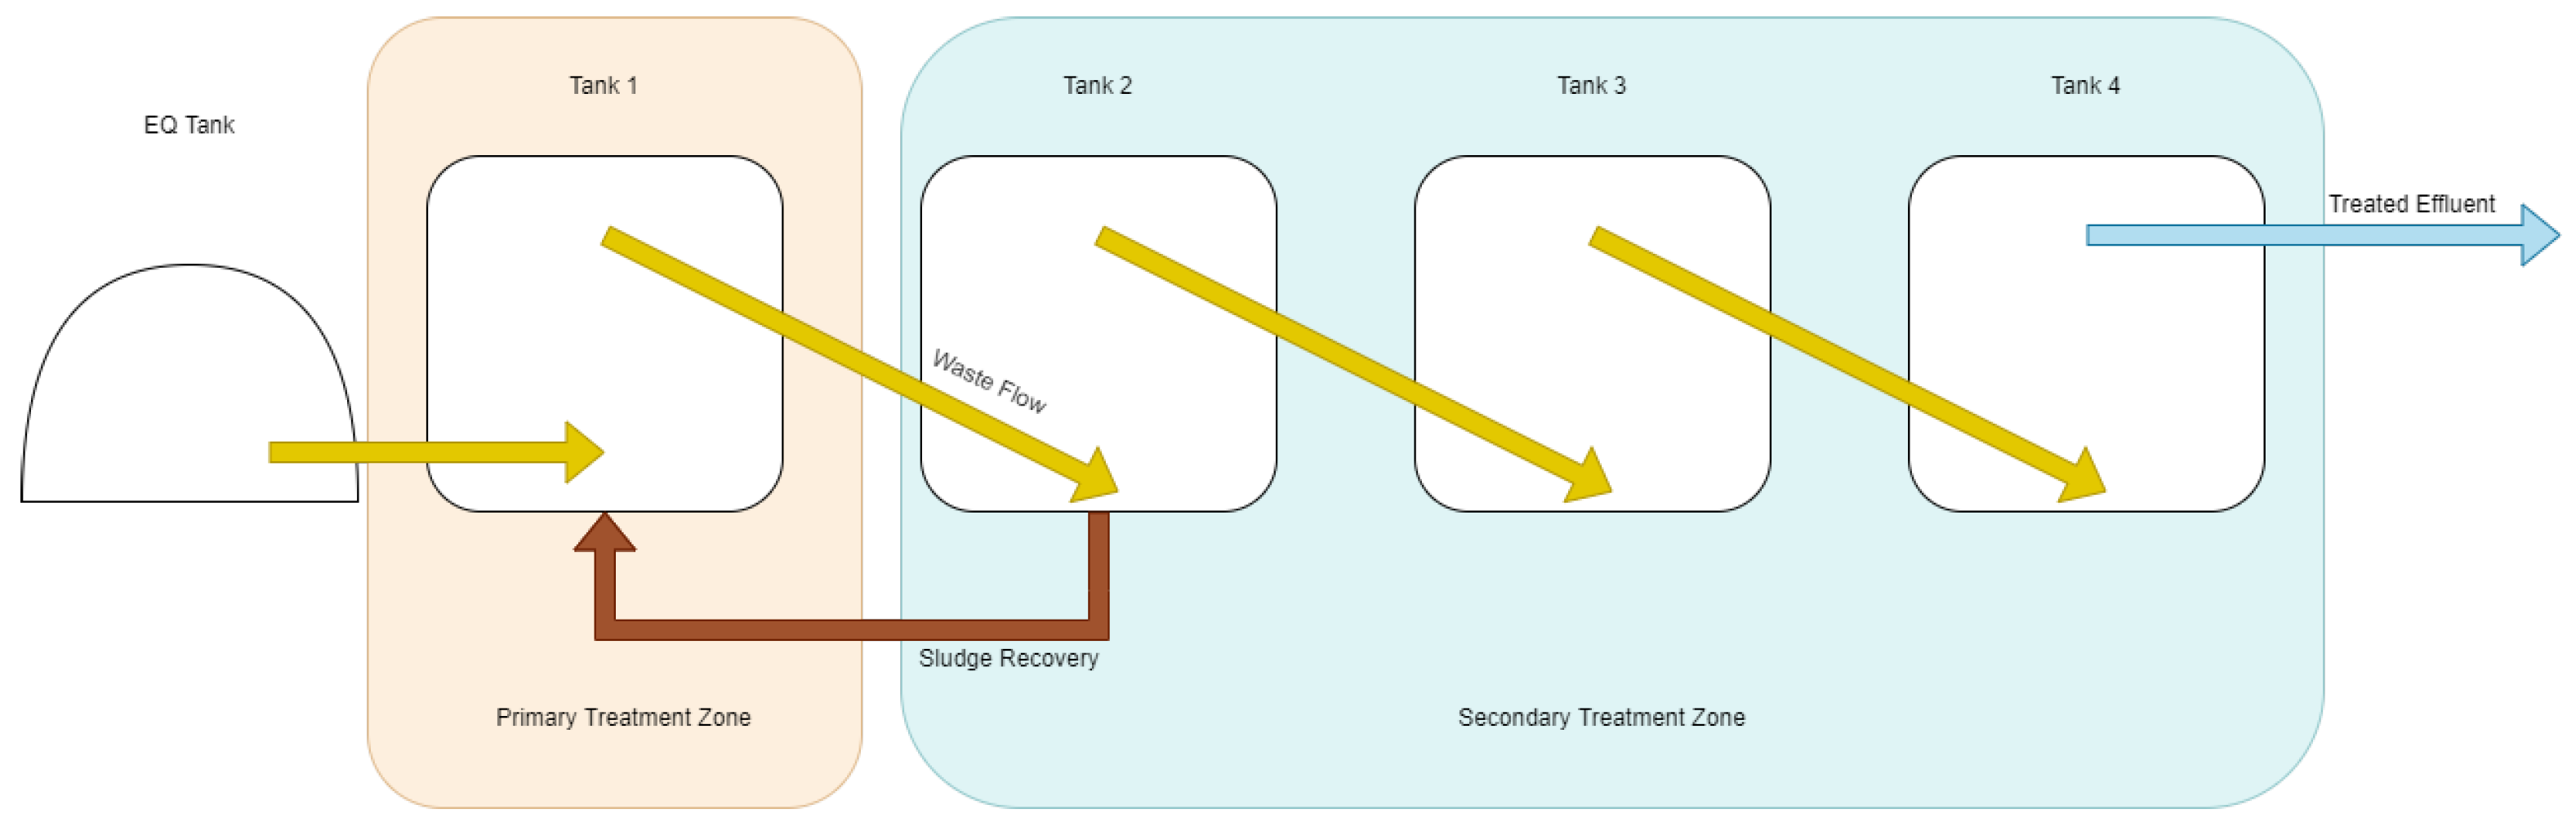
3 of flow per day, or 20 full recirculations of the two tanks per day. This method was discontinued after the first phase of the experiment. Sludge recovery (second-phase recirculation) was performed for 15% of each day. This resulted in 200 L of sludge from the 1st tank in the secondary phase (T3 initially, then from T2 in the later phase visible in
Figure 4) being recirculated to T1 per day.
For the first 71 days of operation, this scheme was operated, but recirculation with the centrifugal pump was found to be insufficient to ensure that the conditions in T2 matched T1. This may have been due to the flow being lower than initially measured due to cavitation and gas accumulation in the centrifugal pump head, causing foaming and the pump to lose prime during its duty period. Additionally it is noted that high shear conditions of centrifugal pumps can cause damage to microbial flocs, reducing their activity [
19].
For the second phase of operation (days 71 to 161) the primary treatment zone was reduced to one vessel to more accurately simulate a large-scale reactor with a single tank primary treatment zone. This would allow us to identify if the staged design was limiting the performance of the system and identify a maximal OLR in a single vessel primary treatment zone. For this, the recirculation pump was removed, and sludge recovery was moved from T3 to T2. This enabled the primary function of the secondary treatment zone to be settlement, sludge recovery, and effluent polishing.
During the phases of operation, samples were taken from each tank in the primary zone as well as after the first tank of the secondary zone to simulate the design of a commercial scale system with fewer vessels that would be more suited to treating simplistic brewery wastewater than a multistage system.
2.6. Sampling Procedures
Samples were collected on a daily basis from the system. A total of 1 L of digestate was sampled from each sampling port and discarded to flush the sampling port before taking 250 mL for analysis. Samples were taken from the storage equalisation tank and each reactor in the system. Sampling for microbial community analysis was carried out in order to gain insight into the composition of the biofilms and biomass inside the reactor. Samples were taken from anode and cathode biofilms, settled sludge, a floating ‘crust’ layer within the reactor, and the inoculum used in reseeding of the system. Samples of approximately 2 g were collected by cutting out a section of each electrode and mechanically debriding the biofilm using bead beating. Deoxyribonucleic acid (DNA) was isolated using a GenElute Soil DNA Isolation Kit (Sigma Aldrich, Gillingham, UK), and the quality of extraction was verified for purity based on the A260/A280 ratio and quantified with a NanoDrop spectrophotometer (Thermo Fisher Scientific, Waltham, MA, USA). The 16s V4 region was amplified using 515F-806R primers (515F-GTGCCAGCMGCCGCGGTAA and 806R-GGACTACHVGGGTWTCTAAT). Samples were then analysed using 16s rRNA amplicon profiling using Illumina–Next Generation Sequencing, conducted by Novogene (Cambridge, UK).
2.7. Analytical Procedures
The chosen analysis package consisted of pH, FOS / TAC (Nordmann), Total Solids (TS), Total Suspended Solids (TSS), Settleable Solids (SS) [
20] and Chemical Oxygen Demand (COD) analysis (COD Cuvette tests, 014 and 514, Hach Lange, Manchester, UK). Due to site restrictions, VS measurements could not be performed. Electrochemical analyis was carried out using PalmSens EMStat (PalmSens, Houten, NL) alongside Ag/AgCl reference electrodes and stainless steel counter electrodes. The electrodes for electrochemical analyses were added prior to the measurement to prevent fouling of the reference. Gas flow and composition was measured both online and offline and verified with a RASI700BIO Biogas Analyser (EIUK, Daventry, UK). Reactor vessels were connected to diaphragm gas flowmeters (Durecom KG2P, MWA Technology, Birmingham, UK) and Dynament Platinum Infrared gas analysers (Dynament, Mansfield, UK). Biogas was passed through a granular activated carbon column prior to the infrared gas analyser to increase the life expectancy of the sensor. However, these were saturated towards the end of the experiment, and online gas quality measurements were relied on less heavily on in favour of more accurate offline methods (
Figure 5). Biogas samples for offline analysis were collected from the sampling ports of each individual vessel in the gas outlet line prior to the gas flowmeter and scrubbers. Another sampling port was situated at a gas manifold, which allowed for sampling of the finished gas mixture that was a combination of the gases from all vessels. All analyses were carried out on-site to enable same-day results and to avoid either sample storage or transport.
3. Results and Discussion
3.1. Start-Up
After a month-long period of inactivity due to set up and integration delays with the brewery infrastructure, the system was started up by feeding 480 L of brewery wastewater and completely recirculating the contents of the four vessels for 2 h. This resulted in a OLR for the first week of startup of 1.6 kgCOD/m
3/day. Gas production was detected immediately, indicating the microbial consortia were still viable after storage. In contrast to Cusick et al. [
14], no acetate or supplemental carbon sources were required to encourage the start-up of the reactor. This is likely because the brewery wastewater is higher in strength and has higher VFA concentrations when fresh.
3.2. Brewery Wastewater Influent Characteristics
Hepworth collects all high-strength liquid waste and tank bottoms in a large vessel after settling out diatomaceous earth and some yeast solids. Due to tankering activities and routine changes in brewery output, the waste tank was often at a low fill level that reduces the effectiveness of the tank as an equalisation step, increasing the variability of the wastewater. Over the course of the experiment, the average wastewater strength was 15,833 ± 4335 mg/L COD, with the periodic maximum variation being the highest at 32,948 mg/L and lowest at 9073 mg/L. The total solids in the wastewater were on average 1.02% ± 0.38%. In conventional AD, variability in this scale can cause foaming and shock to the system, causing VFA overload [
21]. The pH of the brewery wastewater varied between pH 4.2 and 5.4 with an average of 5.2. After buffering with 4 g/L sodium bicarbonate, the wastewater fed to the system varied between pH 5.3 and 7, with an average value of 6.29.
3.3. Temperature
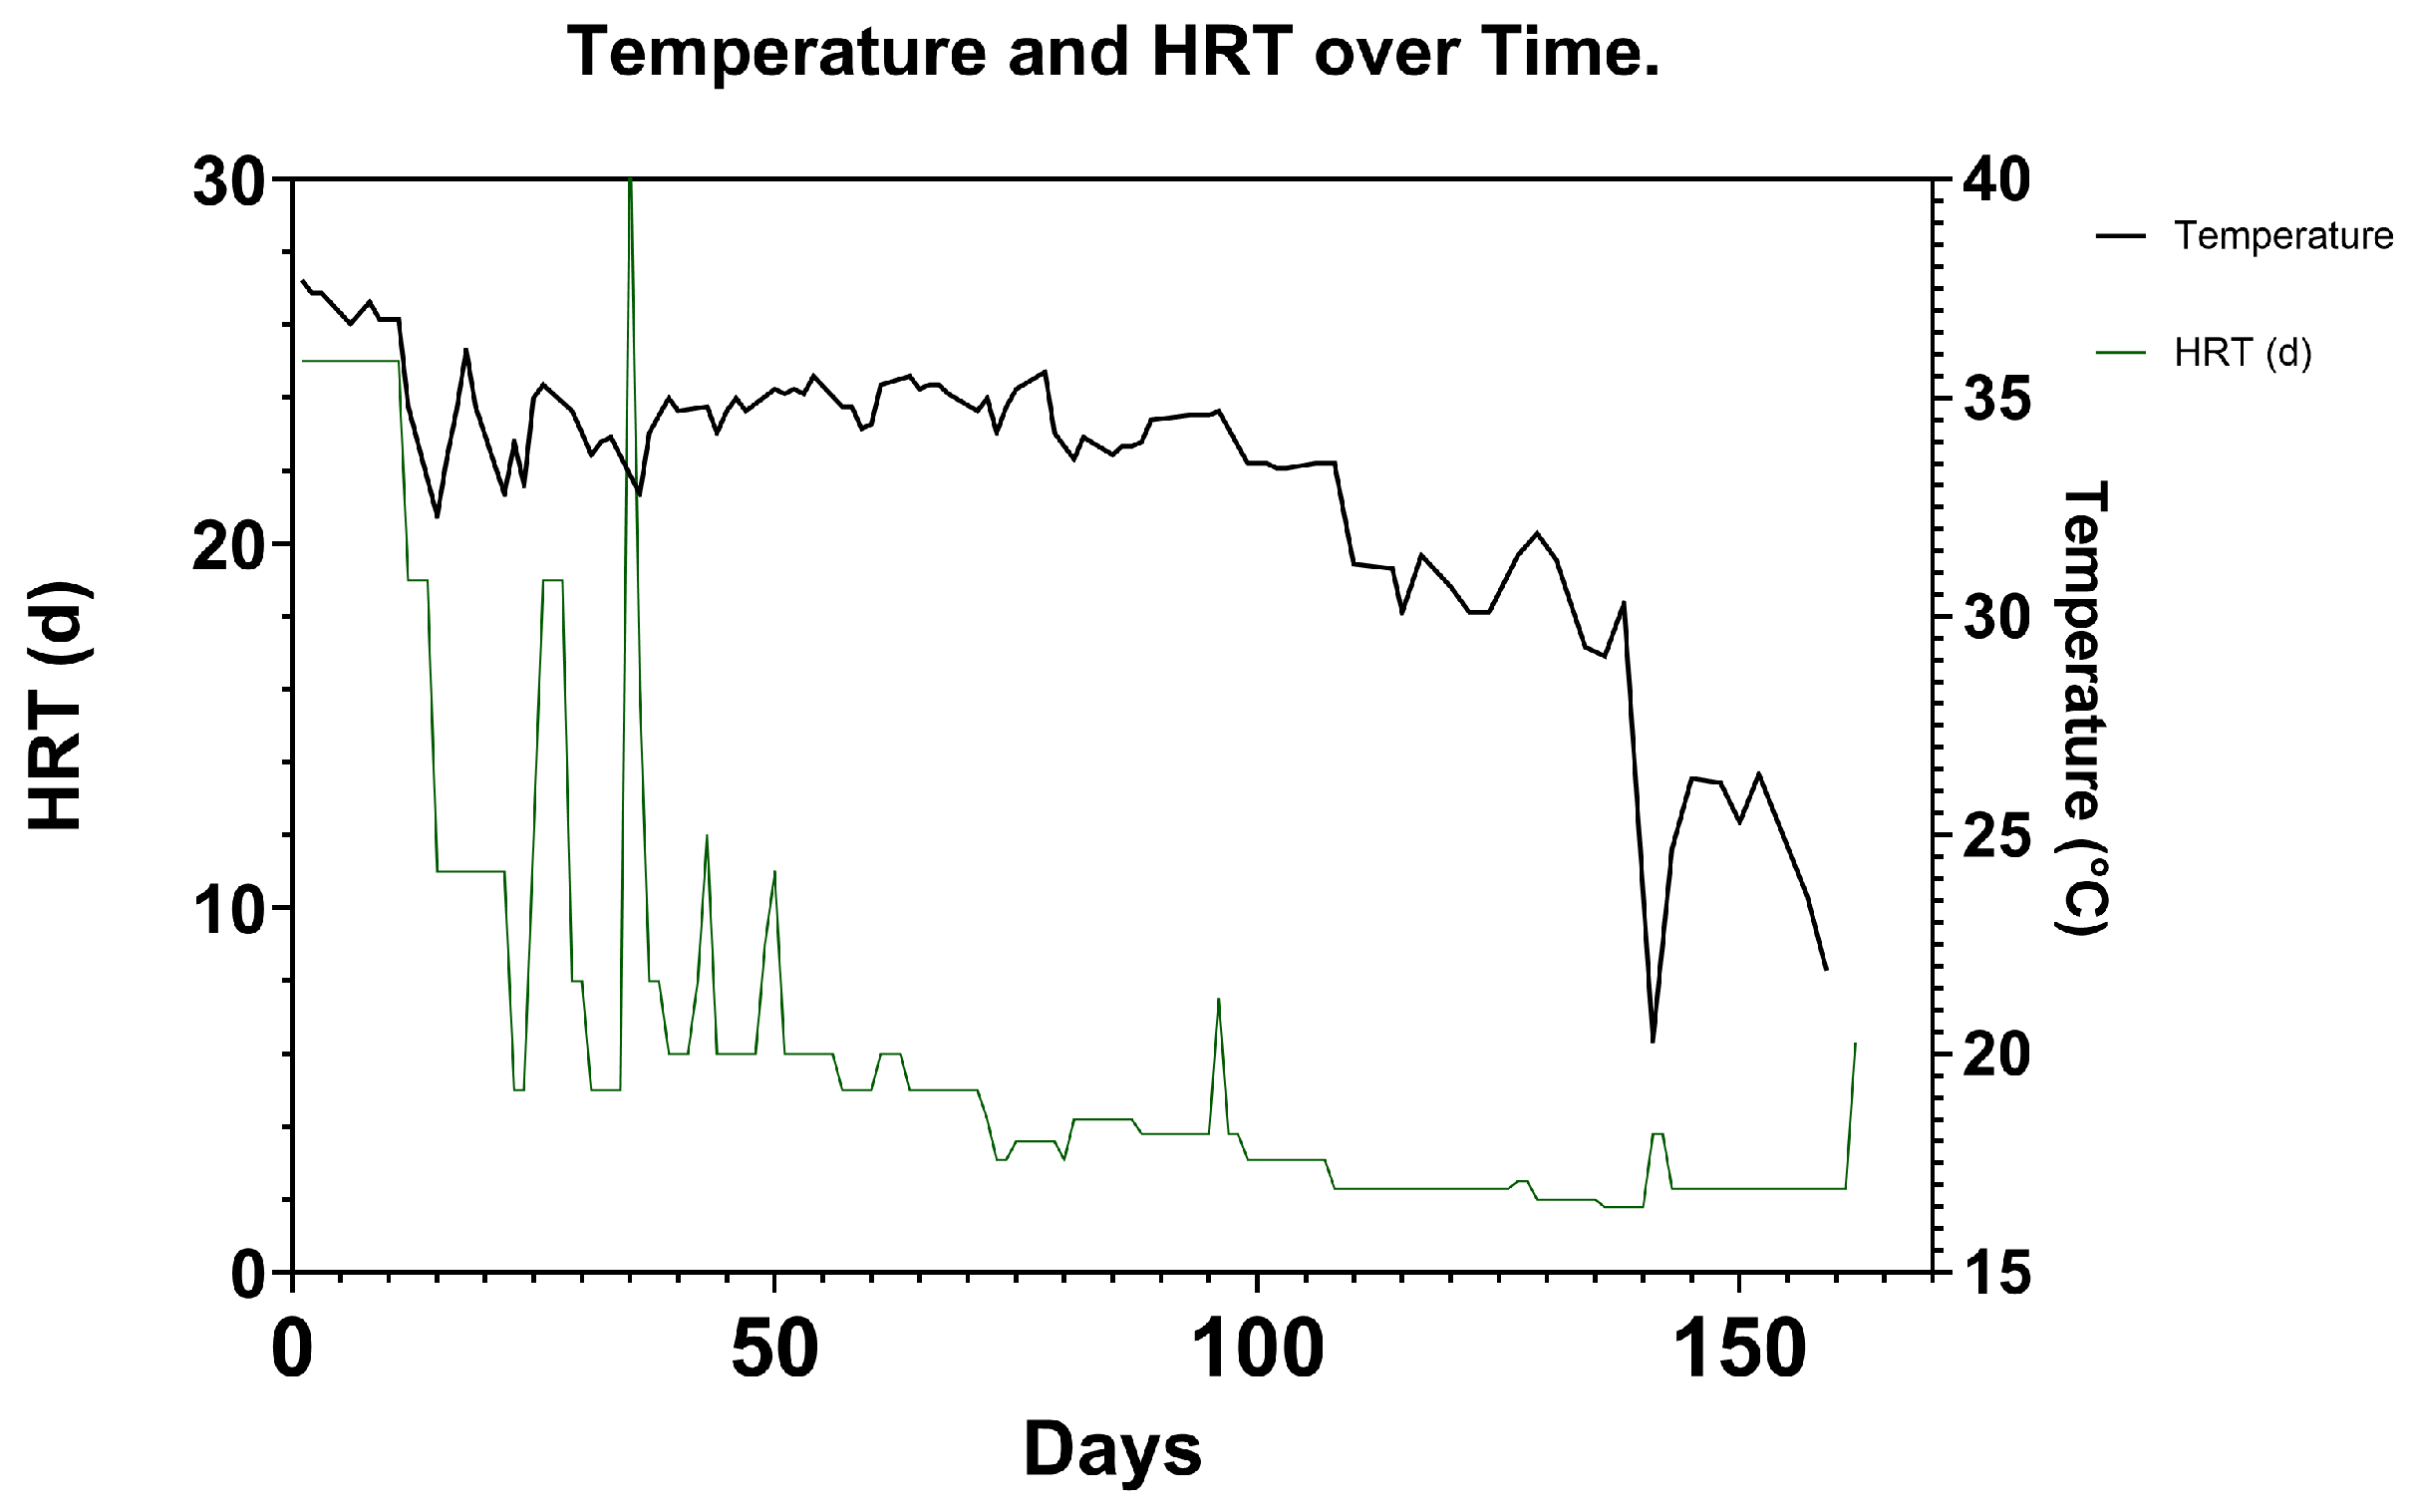
Temperature was maintained at an average of 34 ± 3.3 °C over the course of the experiment (
Figure 6). When the flowrate was low in the first stages of the experiment, temperature was maintained more effectively to the target of 35 °C. As the flowrate was increased, the fitted heating jacket was unable to maintain the set temperature as effectively. This, coupled with seasonal decreasing environmental temperatures, caused the temperature to average 27.6 ± 3.6 °C over the last 40 days. Despite this temperature decrease, the reactor was able to operate at relatively high OLR of on average
. This suggests that the electromethanogenic process may be tolerant of low-temperature mesophilic operation and possibly psychrophilic operation, but the extent to which yield can be maintained at lower temperatures in MEC-AD is not fully appreciated. Further research should seek to investigate this [
22,
23]. After the main experimental goals were achieved, the heating was reduced and the system was allowed to reduce to an average of 26.2 ± 3.4 °C over a 30 day period. Over this period, the system achieved a methane yield per COD removed of 0.367 m
3 CH
4/kgCOD removed, which is lower than the average of 0.449 m
3 CH
4/kgCOD removed over the whole period. The conversion efficiency of organics to methane is maintained above that of the typically quoted theoretical average for AD of 0.35 m
3 CH
4/kgCOD removed. This may be due to the recovery and utilisation of CO
2 from the biogas, as it is recirculated via gas mixing and can be combined with hydrogen produced at the electrodes or the degradation of organics found in a sludge layer that it was not possible to account for due to imperfect homogeneity of the reactor at scale. This has also been observed in the treatment of sewage sludge in an MEC-AD, observing 368–479 mL CH
4/g COD removed [
10].
3.4. Electrochemical Analysis of Electrodes
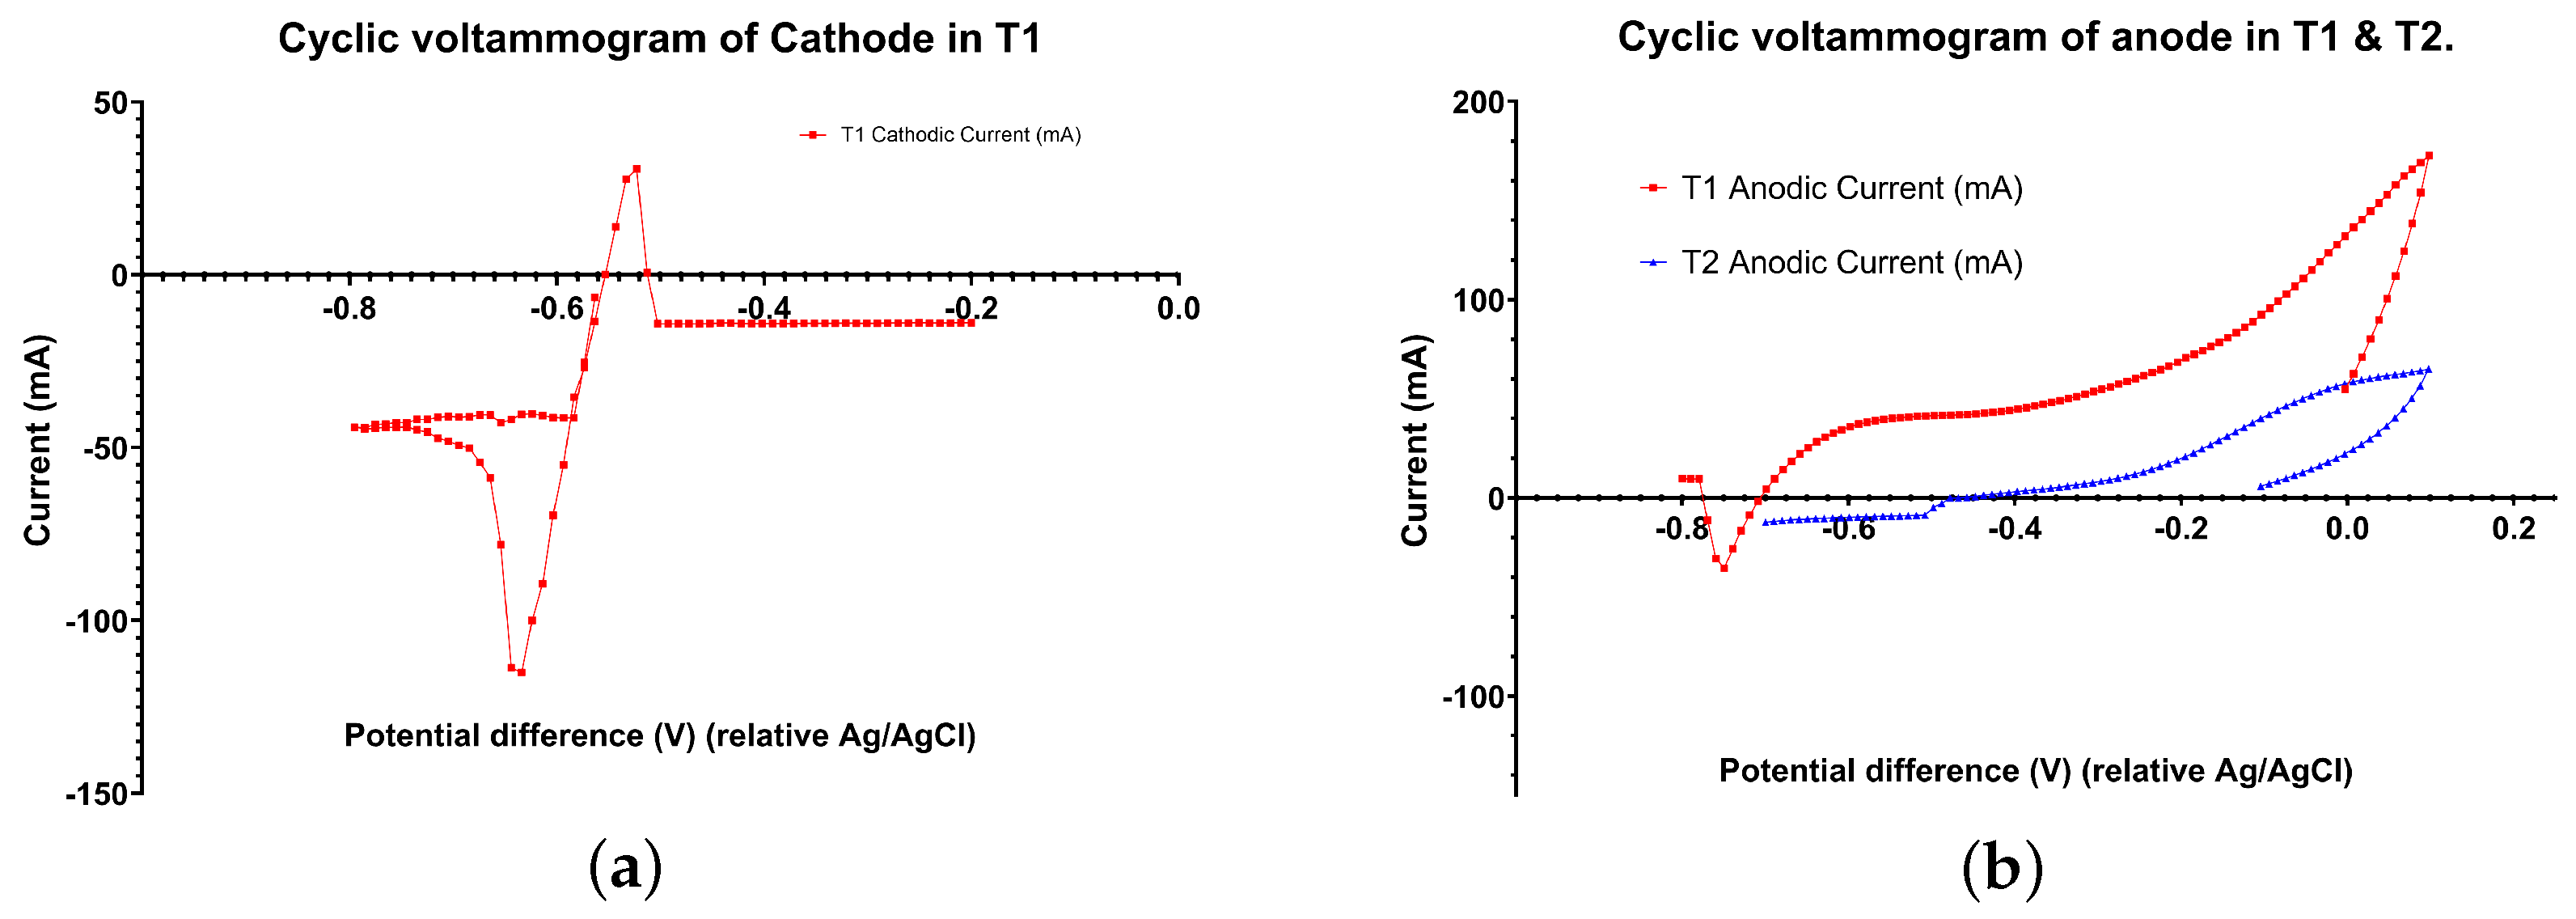
Electrochemical analyses of the electrodes in T1 and T2 were carried out to identify redox activity. Cyclic Voltammetry (CV) revealed the proof of electrode-assisted anaerobic digestion processes for methane production. Both the CVs were recorded under a slow scan rate (5 mV/s)for a single electrode module. Anodic CV shows the oxidation of organic compounds (i.e., acetate), which can be enhanced by exoelectrogens or syntrophic acetate-oxidizing (SAO) consortia on the electrode. The standard redox potential of CO
2 and acetate is approximately −0.29 V, which matches the peak observed in T1 (
Figure 7b). Cyclic voltammograms showed higher catalytic current in T1 due to higher organic content/loading compared to T2. T1’s current range was limited, as it reached the max capacity of the potentiostat current range (overflow current). The peak current was five times higher in T1 than in T2 due to higher substrate availability in T1 (
Figure 7b). This insight analysis correlates well with reactor performances in terms of high biogas production at T1 compared to T2. The shift in the redox potential range for T1 was negative compared to T2, which could have been due to Ag/AgCl reference electrode drifts caused by contamination from the reactor contents (
Figure 7a) [
24]. The cathodic CV reflects the biocathode’s ability to catalyse electromethanogenesis via direct electron transfer (DET-mediated electromethanogenesis) while reducing CO
2 as a sole carbon source. Also, the involvement of hydrogen-evolving reactions in electromethanogenesis is not ruled out, as H
2 is also generated at the same redox potential zone of 0.05–0.4 V.
3.5. Current Generation
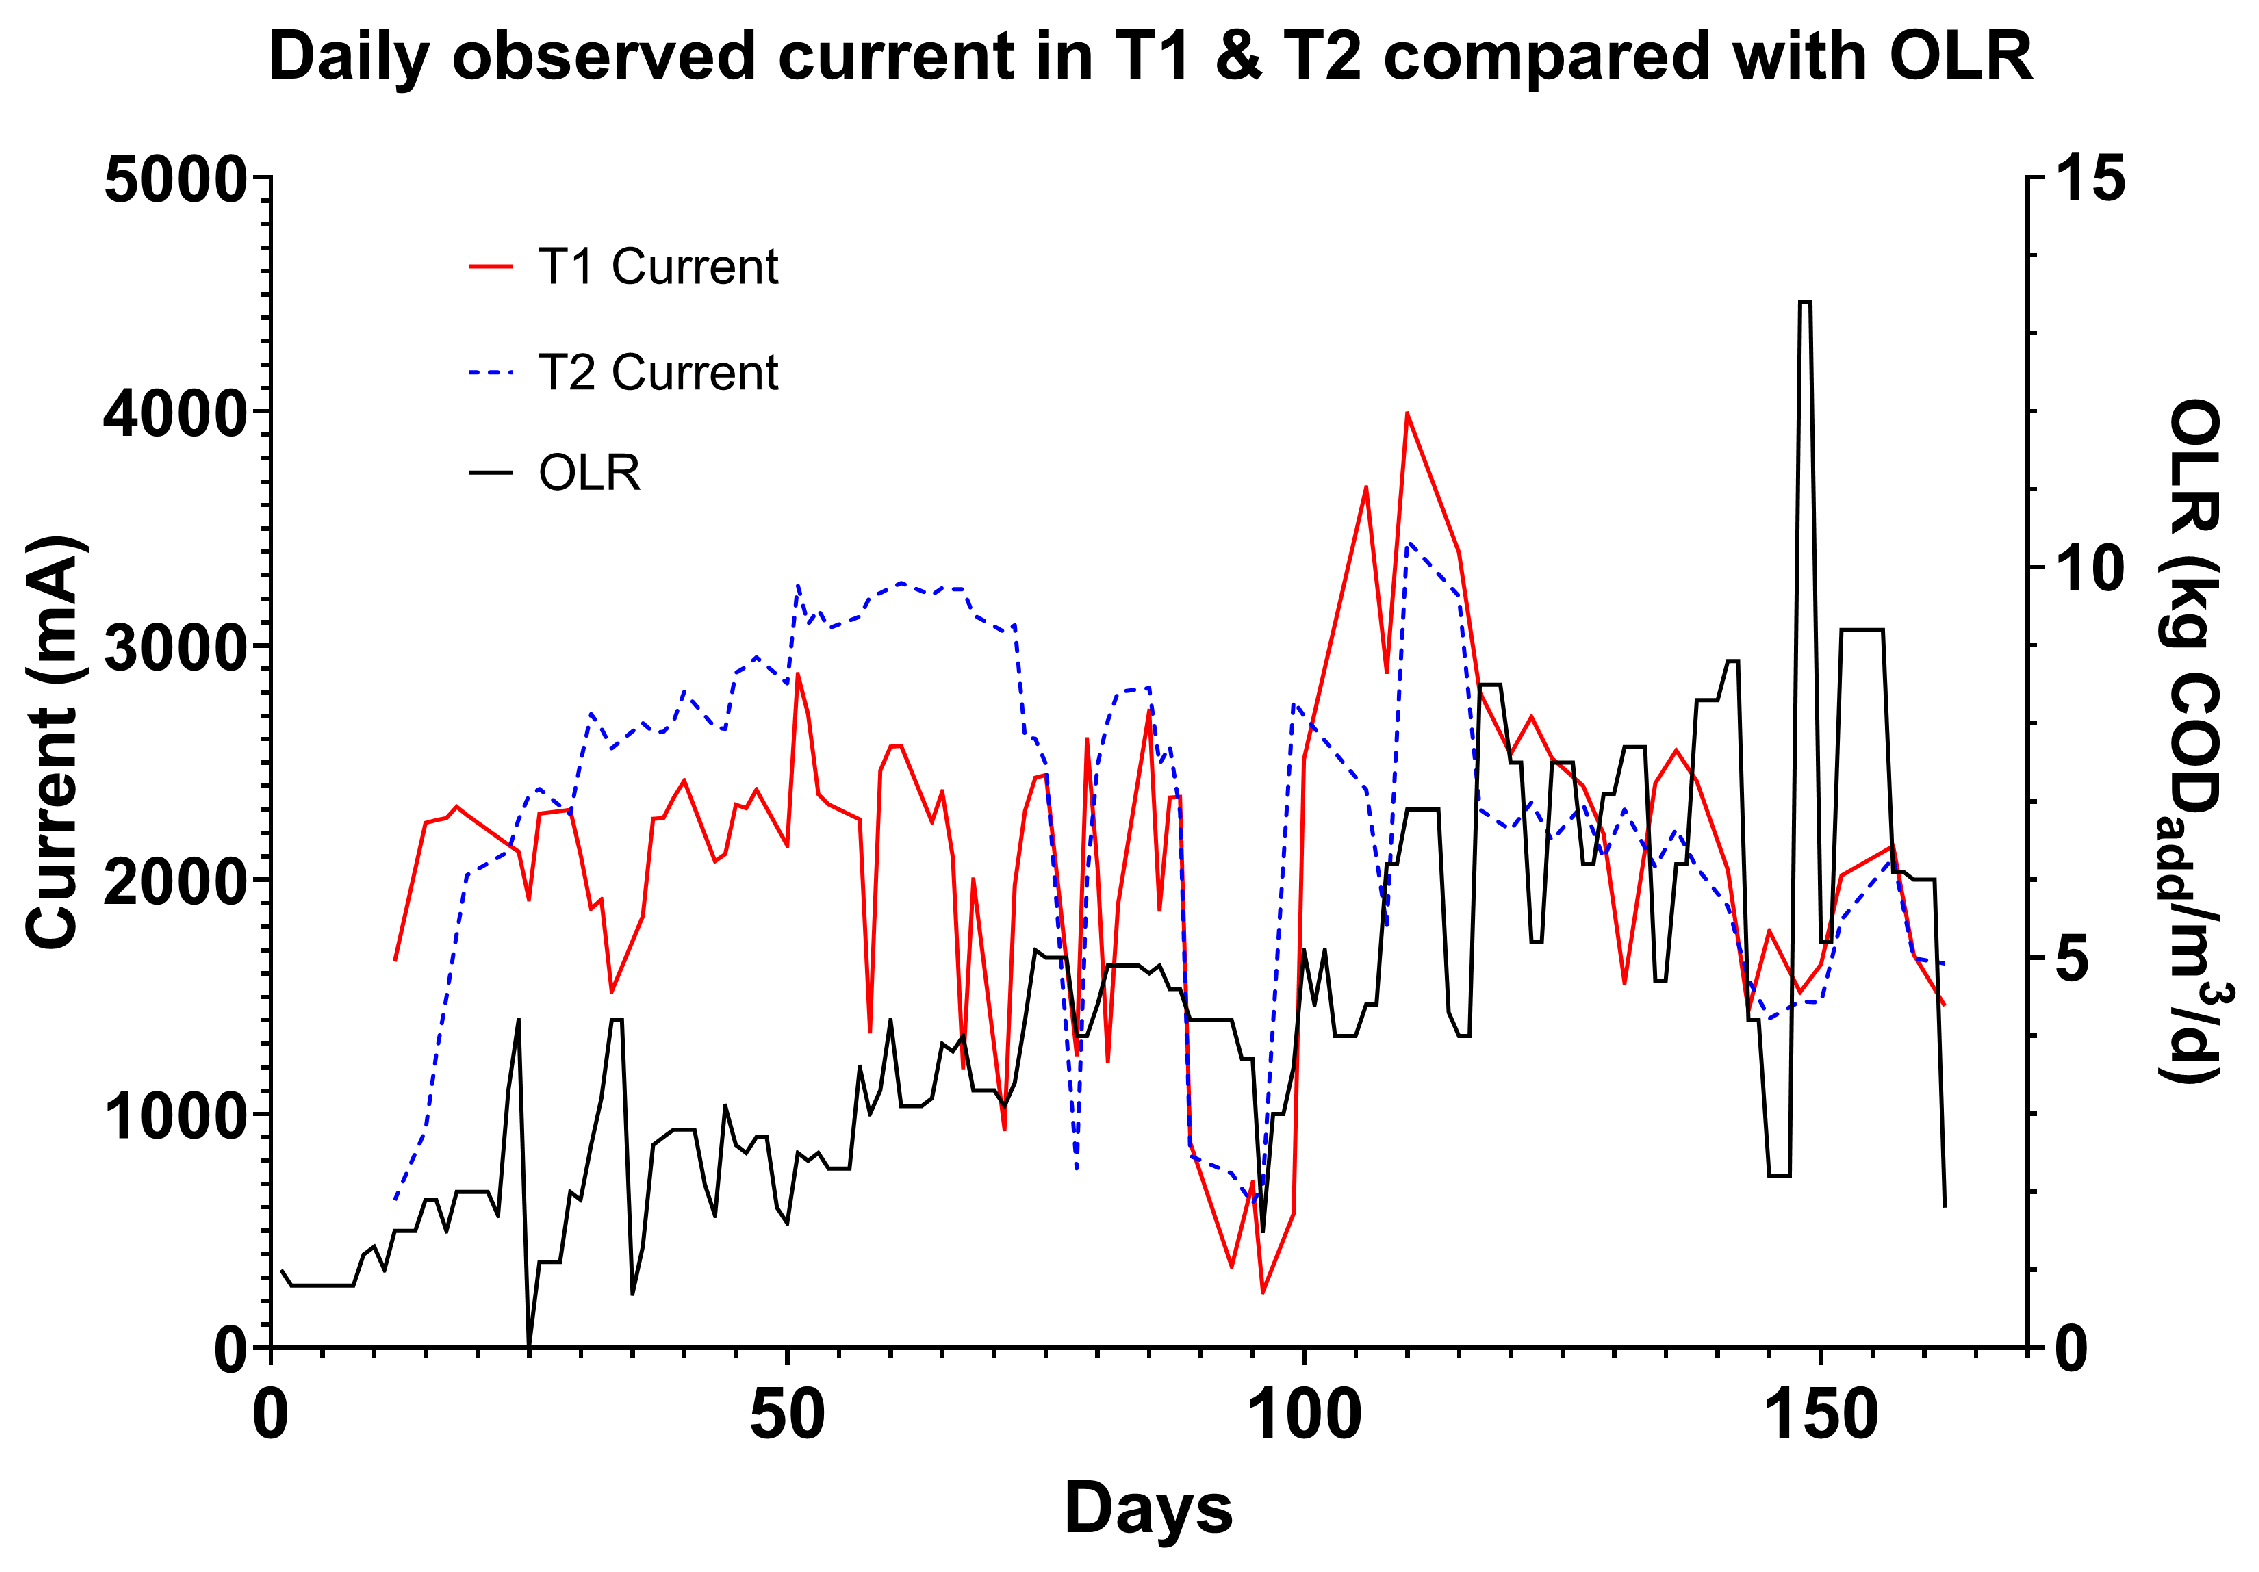
Electrode current generation was measured in T1 and T2, and performance was generalised across all electrodes in order to integrate with the logging power supply. The current measured was responsive to the OLR of the system. T1 exhibited the highest variation due to its initial exposure to fresh wastewater, whereas T2 processed wastewater that had undergone preliminary treatment, resulting in reduced OLRs. This was especially visible in the first 100 days of operation in the low loading rate phase of the trial (
Figure 8). In the first 100 days, the current measured in tank one varied with fluctuations in OLR. When OLR increased rapidly, current often dipped. This occurred most visibly on days 24, 34, 43, and 59. This may have been due to an influx of dissolved electron acceptors in the wastewater, or due to microbial shock caused by the increase in organics. This is useful for detecting variations in waste strength or characteristics.
Between days 50 and 100, the system exhibited more variability in current at higher OLRs, approximately
, indicating consistent stress. A clear response in the monitored T1 and T2 currents was observed around day 90 during a decrease in OLR. Subsequently, when the OLR was increased after this feeding pause, there was a significant rise in the T1 current response. By day 115, the OLR stabilised at over
, resulting in less fluctuation in the current associated with OLR. This stability might be attributed to the microbial consortia becoming more acclimatised to high-strength wastewater or the microbial biofilm improving its function as a sensor due to a reduction in hydraulic retention time (HRT) [
25]. This change might have caused alterations in the biofilm structure, such as electrode scarification or enhanced mass transfer.
It is also important to note that in this period, we can see a reduction in current that aligns with a drop in temperature, continued as the HRT was reduced. This is supported by the temperature results detailed in
Figure 6.
Further research employing feature analysis techniques should be conducted to elucidate the relationship between current and OLR, incorporating pH, temperature, and Volatile Fatty Acid (VFA) concentration and biogas quality as supportive metadata.
3.6. COD Removal—Wastewater Treatment
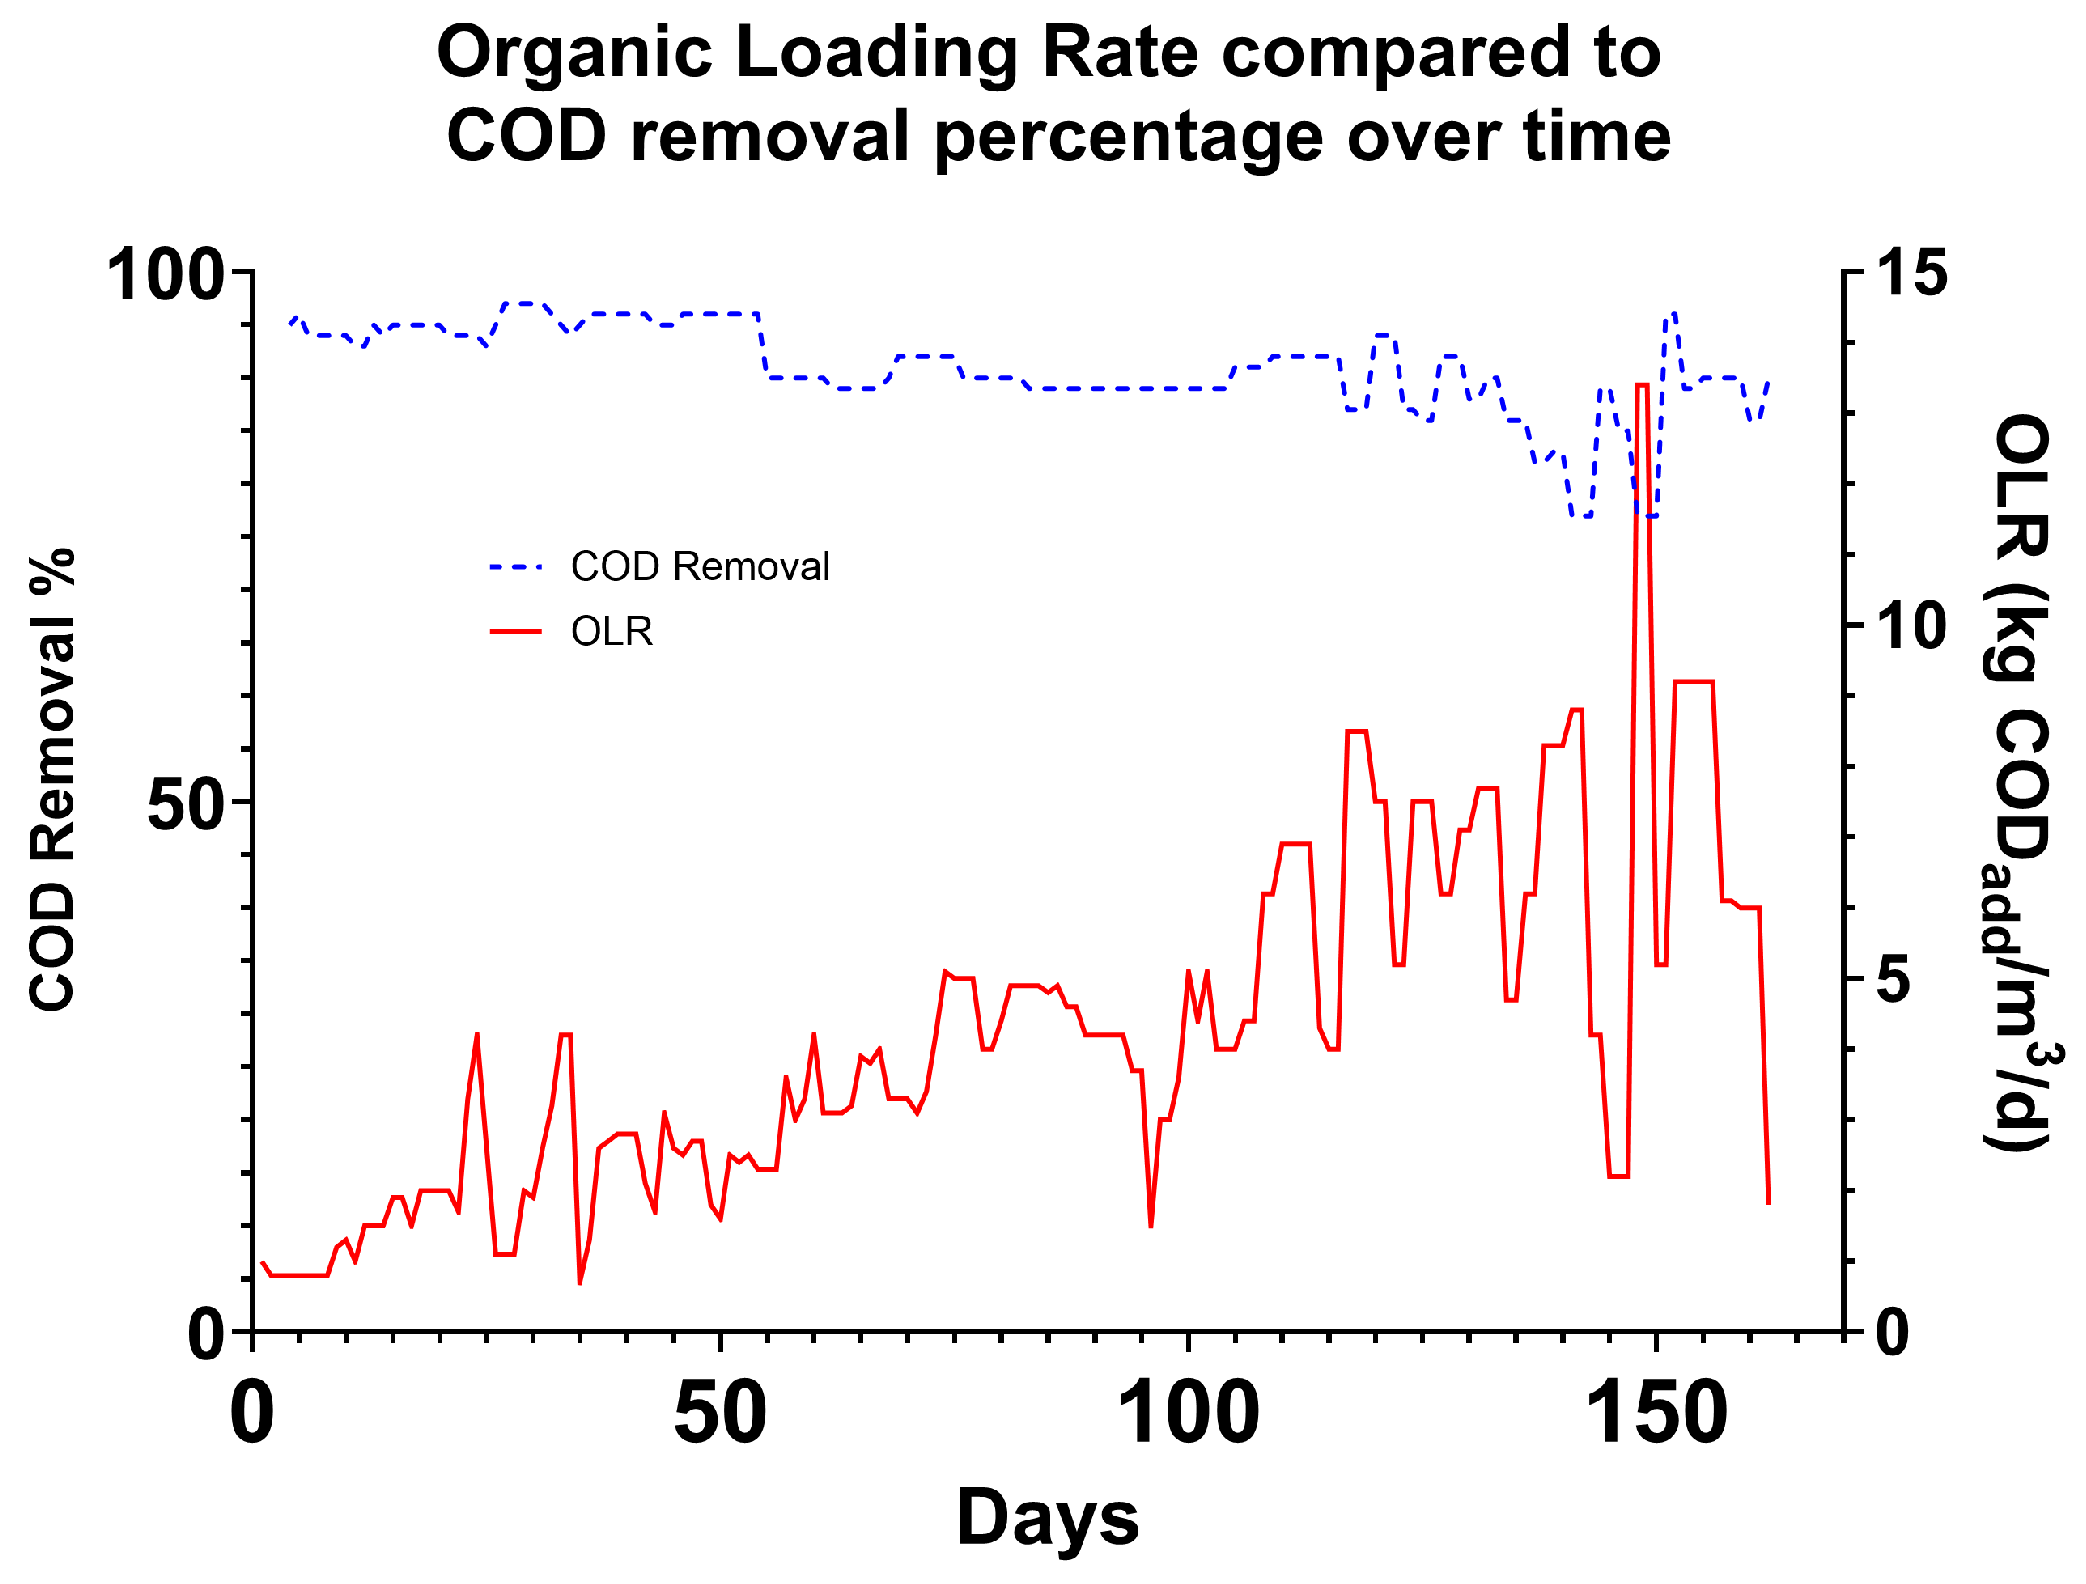
Wastewater treatment was determined by comparing the COD of fresh wastewater to that of the wastewater after treatment, as sampled from a top sample port of the required vessel that is classified as the effluent point. In phase 1, this was T3, and in phase 2, it was T2. This, in part, was to allow for the contribution of suspended biosolids to be removed, as the first tank of the secondary treatment zone performs settlement of waste for sludge recovery. The average COD removal over phase two was 88% (ranging from 95% to 77%). In the first vessel, the average COD removal was 65%.
Figure 9 shows the stability and maintenance of effluent quality throughout the trial despite the increasing OLR. The quality of the brewery wastewater produced by Hepworth varies daily due to normal brewery process activities. Despite this large variation, the treatment effectiveness is not significantly affected, demonstrating the robustness of the system (
Figure 10). As OLR increases over the course of the experiment by approximately 500%, effluent COD content only decreases by 10%. This indicates that as the system matures and the biofilm becomes more established, treatment performance improves, resulting in increased treatment capacity [
26]. The volumetric treatment rate (VTR) of the primary treatment vessel during the two periods of highest stable loading (day 108 to 126 and day 143 to 161) were 4.3 kgCOD removed/m
3/d and 4.8 kgCOD removed/m
3/d, respectively. This is higher than the previous highest value in a pilot-scale reactor (36 L working volume) of 3.81 kgCOD removed/m
3/d achieved by Leicester et al. [
8]. The sCOD of T1 was approximately double that of T2 (2329 mg/L vs. 1250), whereas the tCOD of T1 was approximately three times higher than T2 (4890 mg/L vs. 1745 mg/L). Additionally, T1 had higher TSS (0.4% vs. 0.19%) and TS (0.83% vs. 0.45% ww) compared to T2. This demonstrates that settlement in T2 removes approximately 50% of the solids from solution and that those solids could represent 1/3 of the COD in T1. Discharge targets at the effluent point were set at 300 mg/L biochemical oxygen demand (BOD). Through external lab testing by NRM (Cawood, Bracknell, UK) (
Supplementary Material File S2) of effluent samples, the BOD was measured at eight points over the study, and a typical BOD/COD ratio was calculated as 0.32 to allow for extrapolation of BOD from COD values where BOD was not measured. In the first period of 2.3 days HRT, the effluent strength was 426.9 mg/L BOD, and in the second period, it was 516.5 mg/L. This could be further reduced by a tertiary treatment step in a commercial system, such as aeration, dissolved air floatation, or a lamellar settler. Settlement of the effluent would allow the BOD to be reduced well below discharge limits. Using the same ratio to calculate BOD from sCOD, the average effluent sBOD was 174 mg/L. The COD of the individual tanks is available in
Supplementary Material File S2.
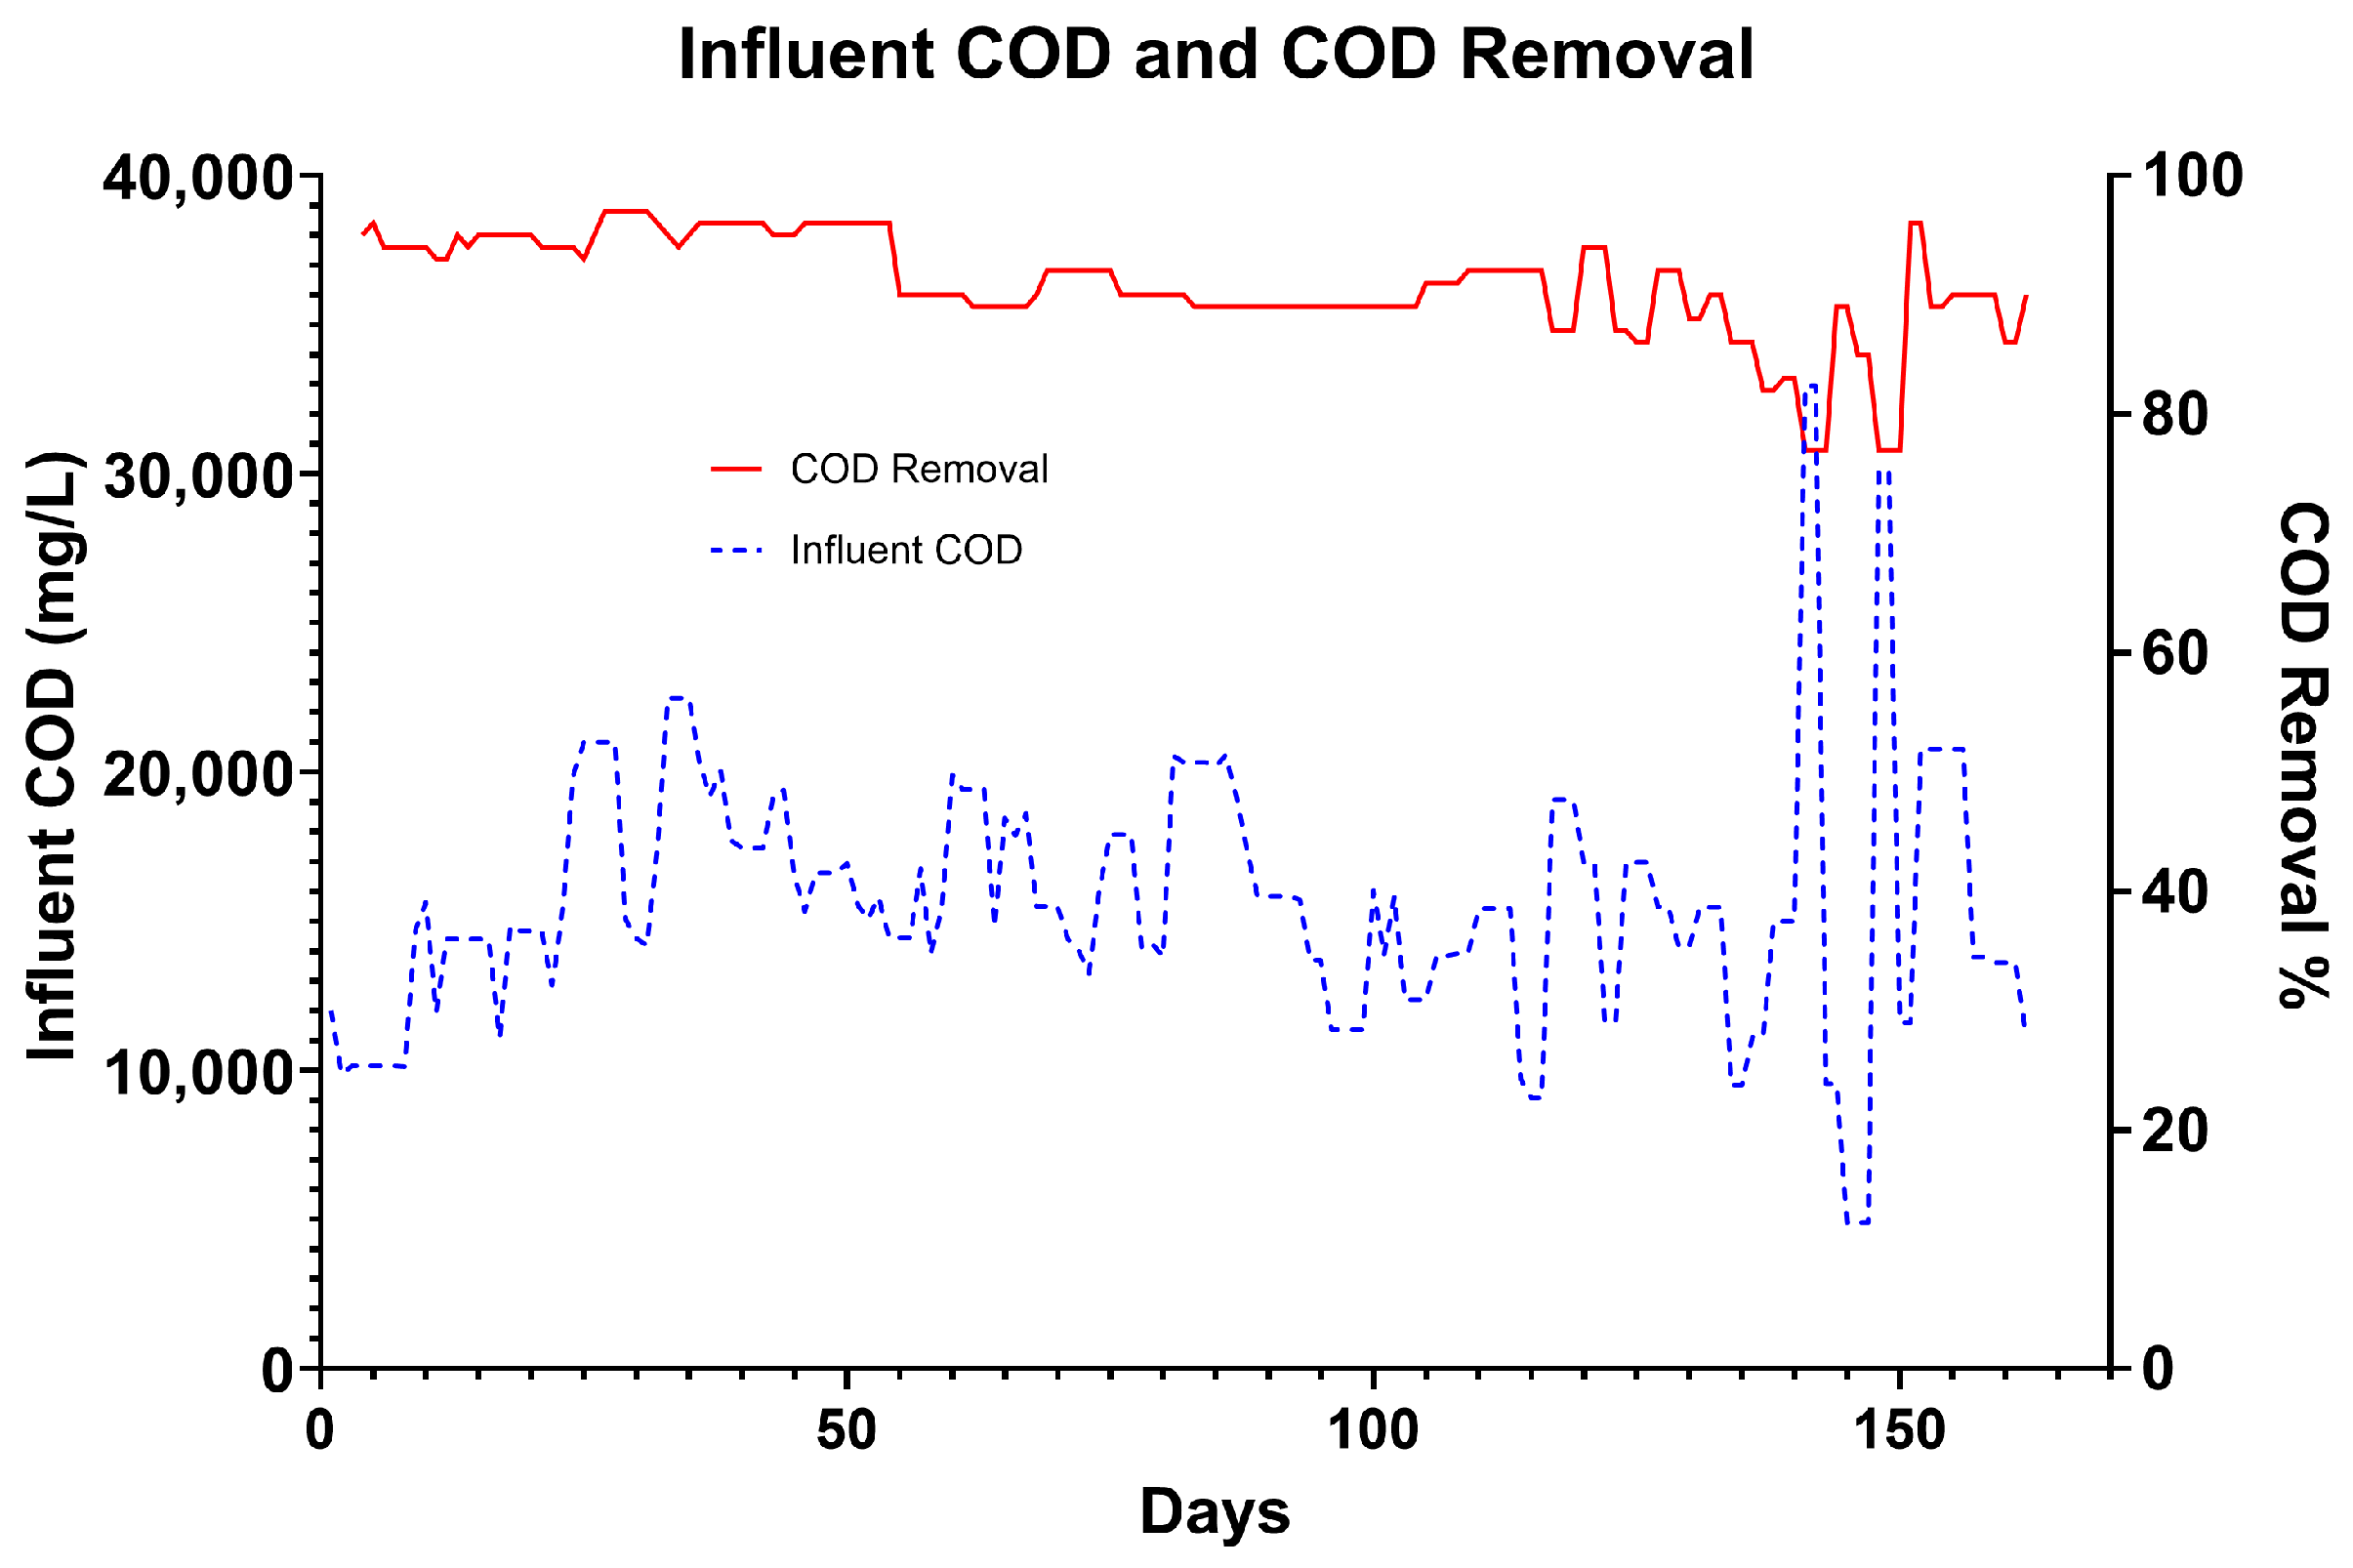
3.7. Stability in Response to Changing Influent Strength
Due to fluctuations in the strength of brewery wastewater, the OLR of the system varied as flowrate and HRT were kept constant. The specifications of a commercial system must account for these fluctuations in order to maintain a stable process. During the trial, COD removal never decreased below 77%, despite up to 245% day-over-day variability in waste strength (
Figure 10). This is likely due to microbes immobilised on the electrode surface being protected from extreme conditions, allowing them to metabolise organics at a high rate [
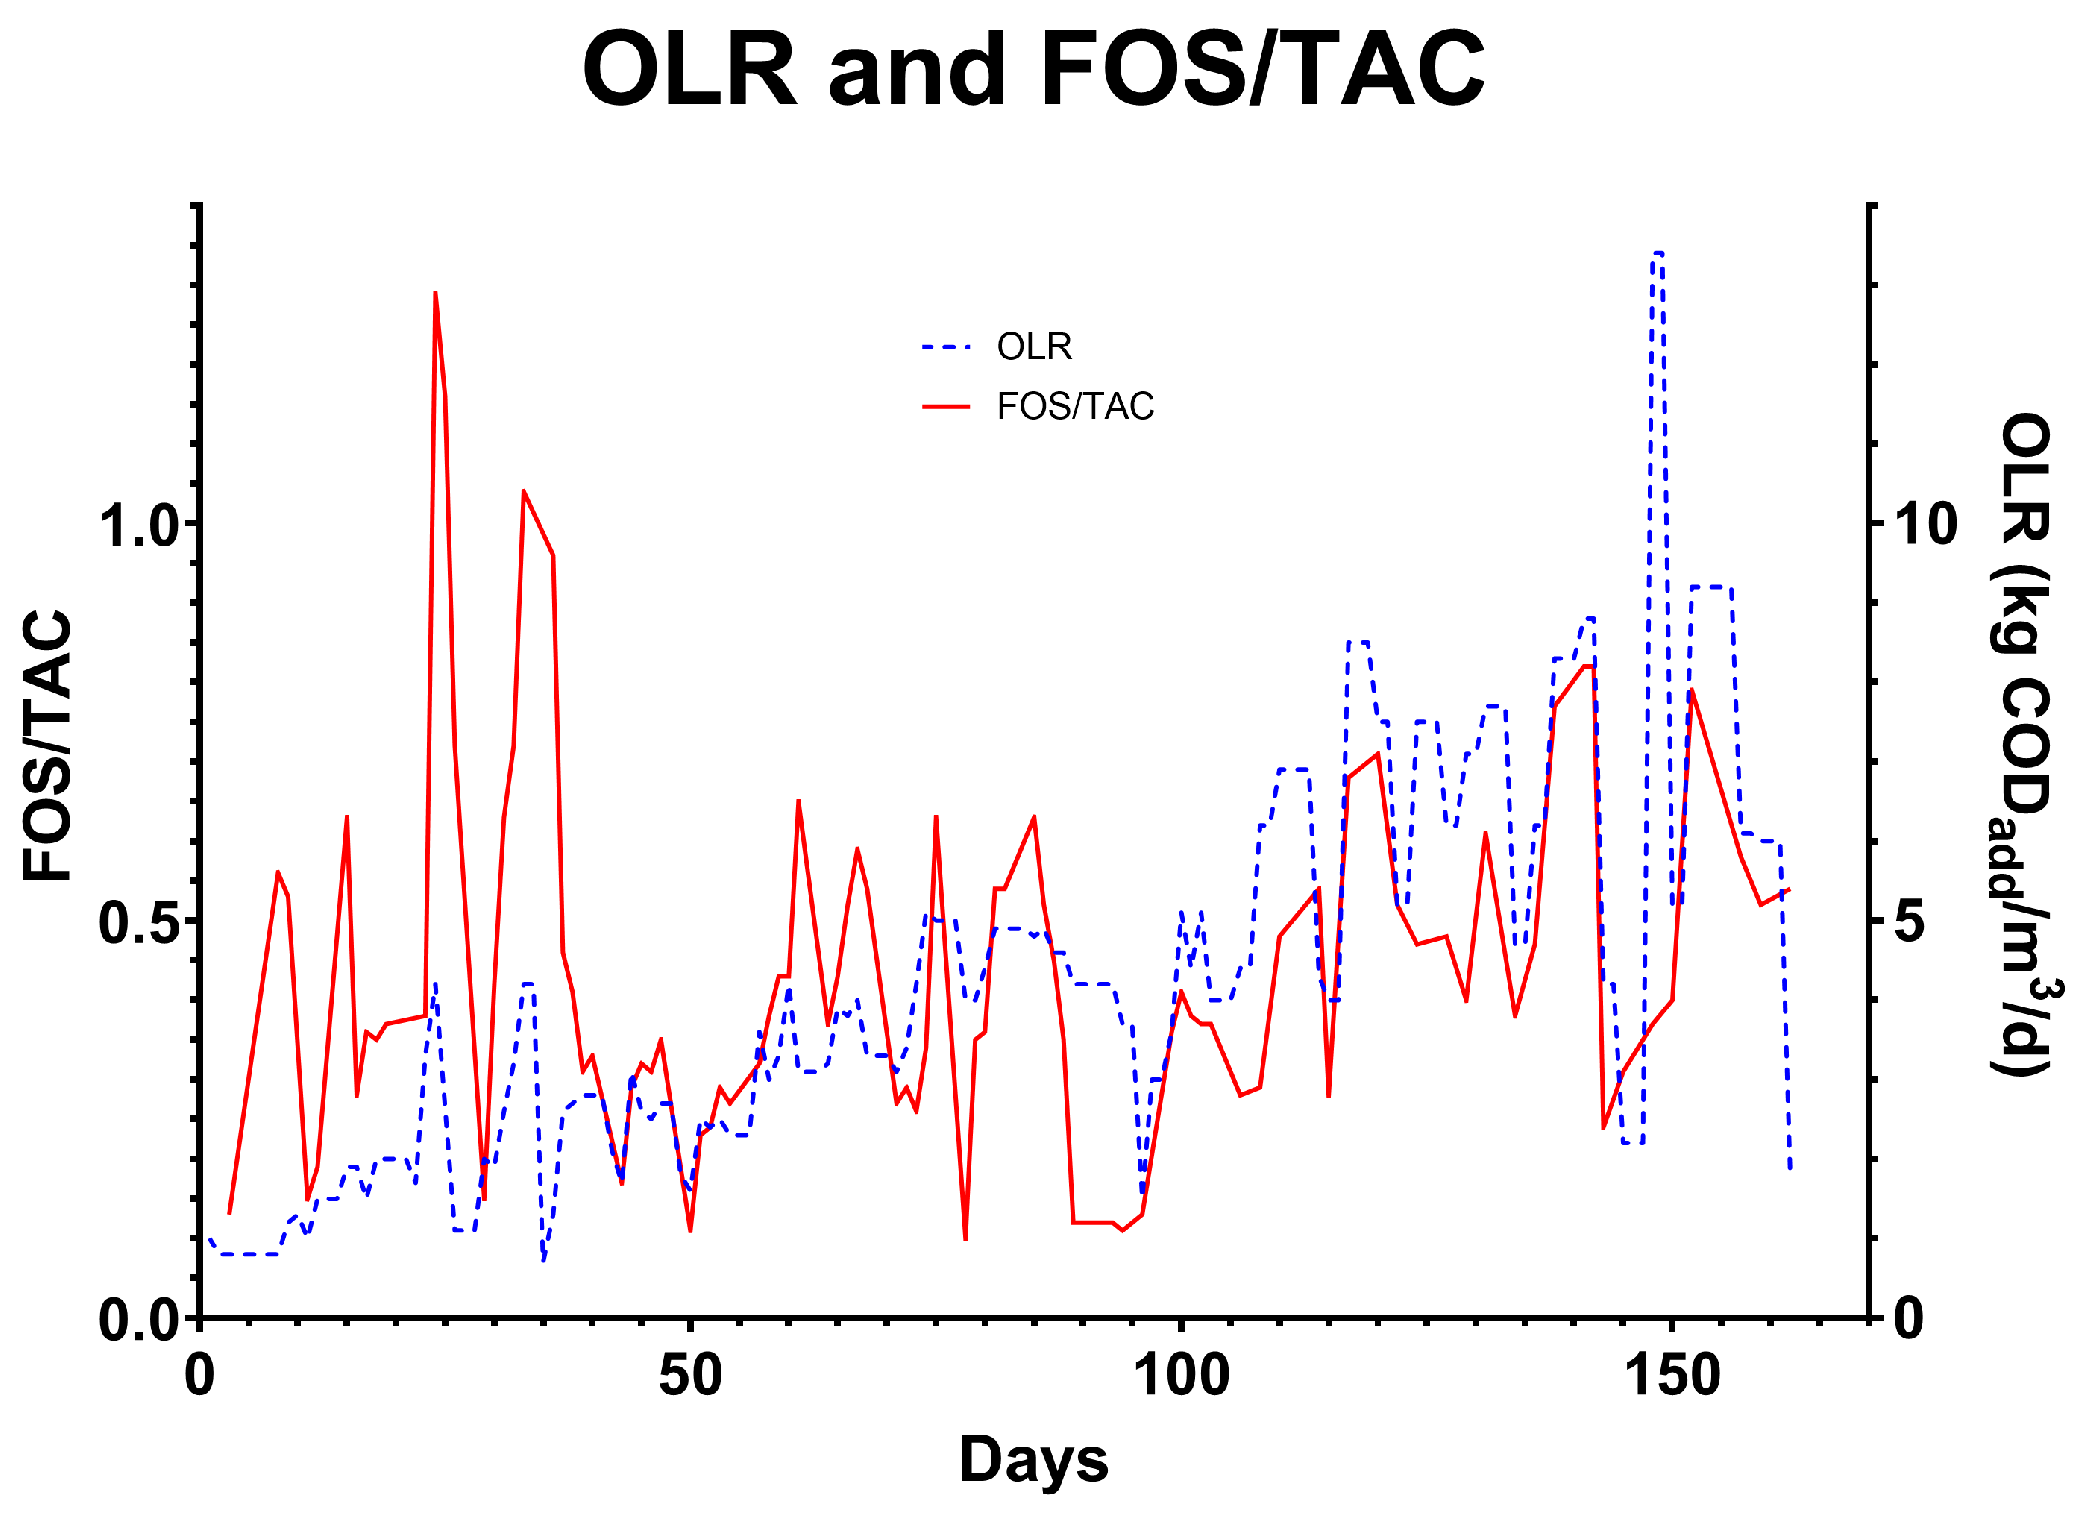
27]. The system was able to handle these periodic fluctuations over a number of days without failure, even when the OLR was above what was considered within the normal stable range. In conventional AD, variability of this scale can cause foaming and shock to the system, causing VFA overload. As the system matured, the microbial consortia was able to utilise VFAs at a higher rate, resulting in maintenance of a stable average FOS/TAC despite increased OLR (
Figure 11). The test system was able to operate at elevated FOS/TAC levels without a significant reduction in performance, allowing the system to operate at extreme loading rates for short periods of time as waste strength fluctuates (
Figure 12). At Hepworth’s brewery, process-related wastewater strength changes typically never lasted more than 2 days before reverting to the mean. With more proper waste equalisation techniques, this variation could be further reduced. In the initial 40 days of the trial, solid recirculation was less effective than in the later periods, as the rate of recirculation and amount of solids in the secondary phase were too low.
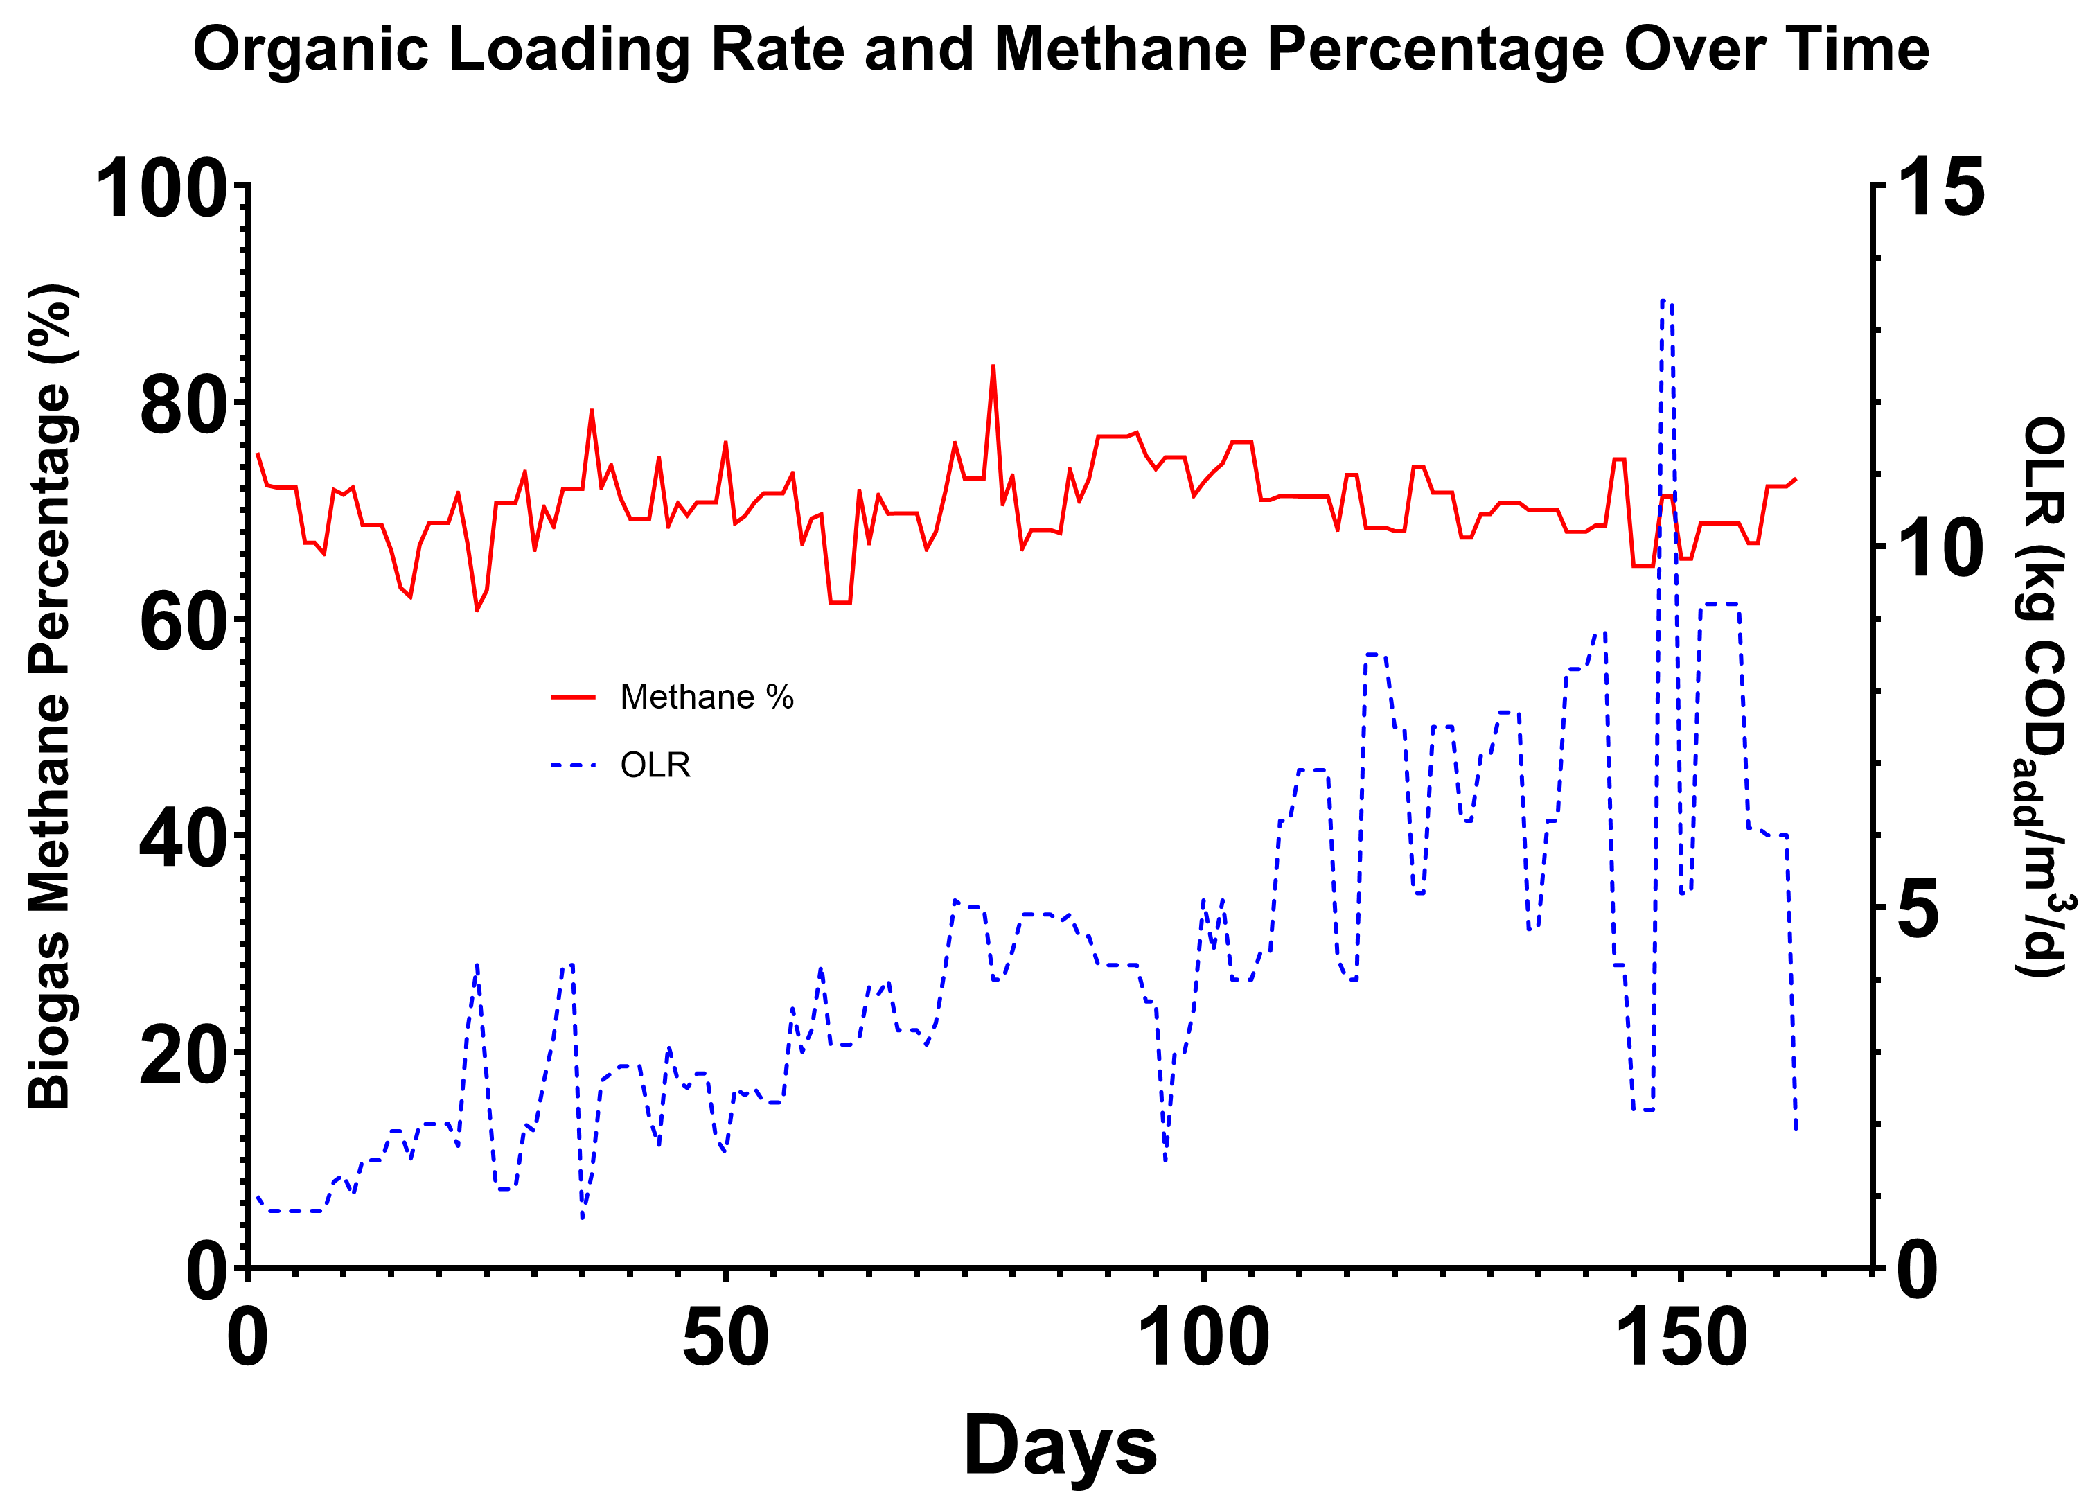
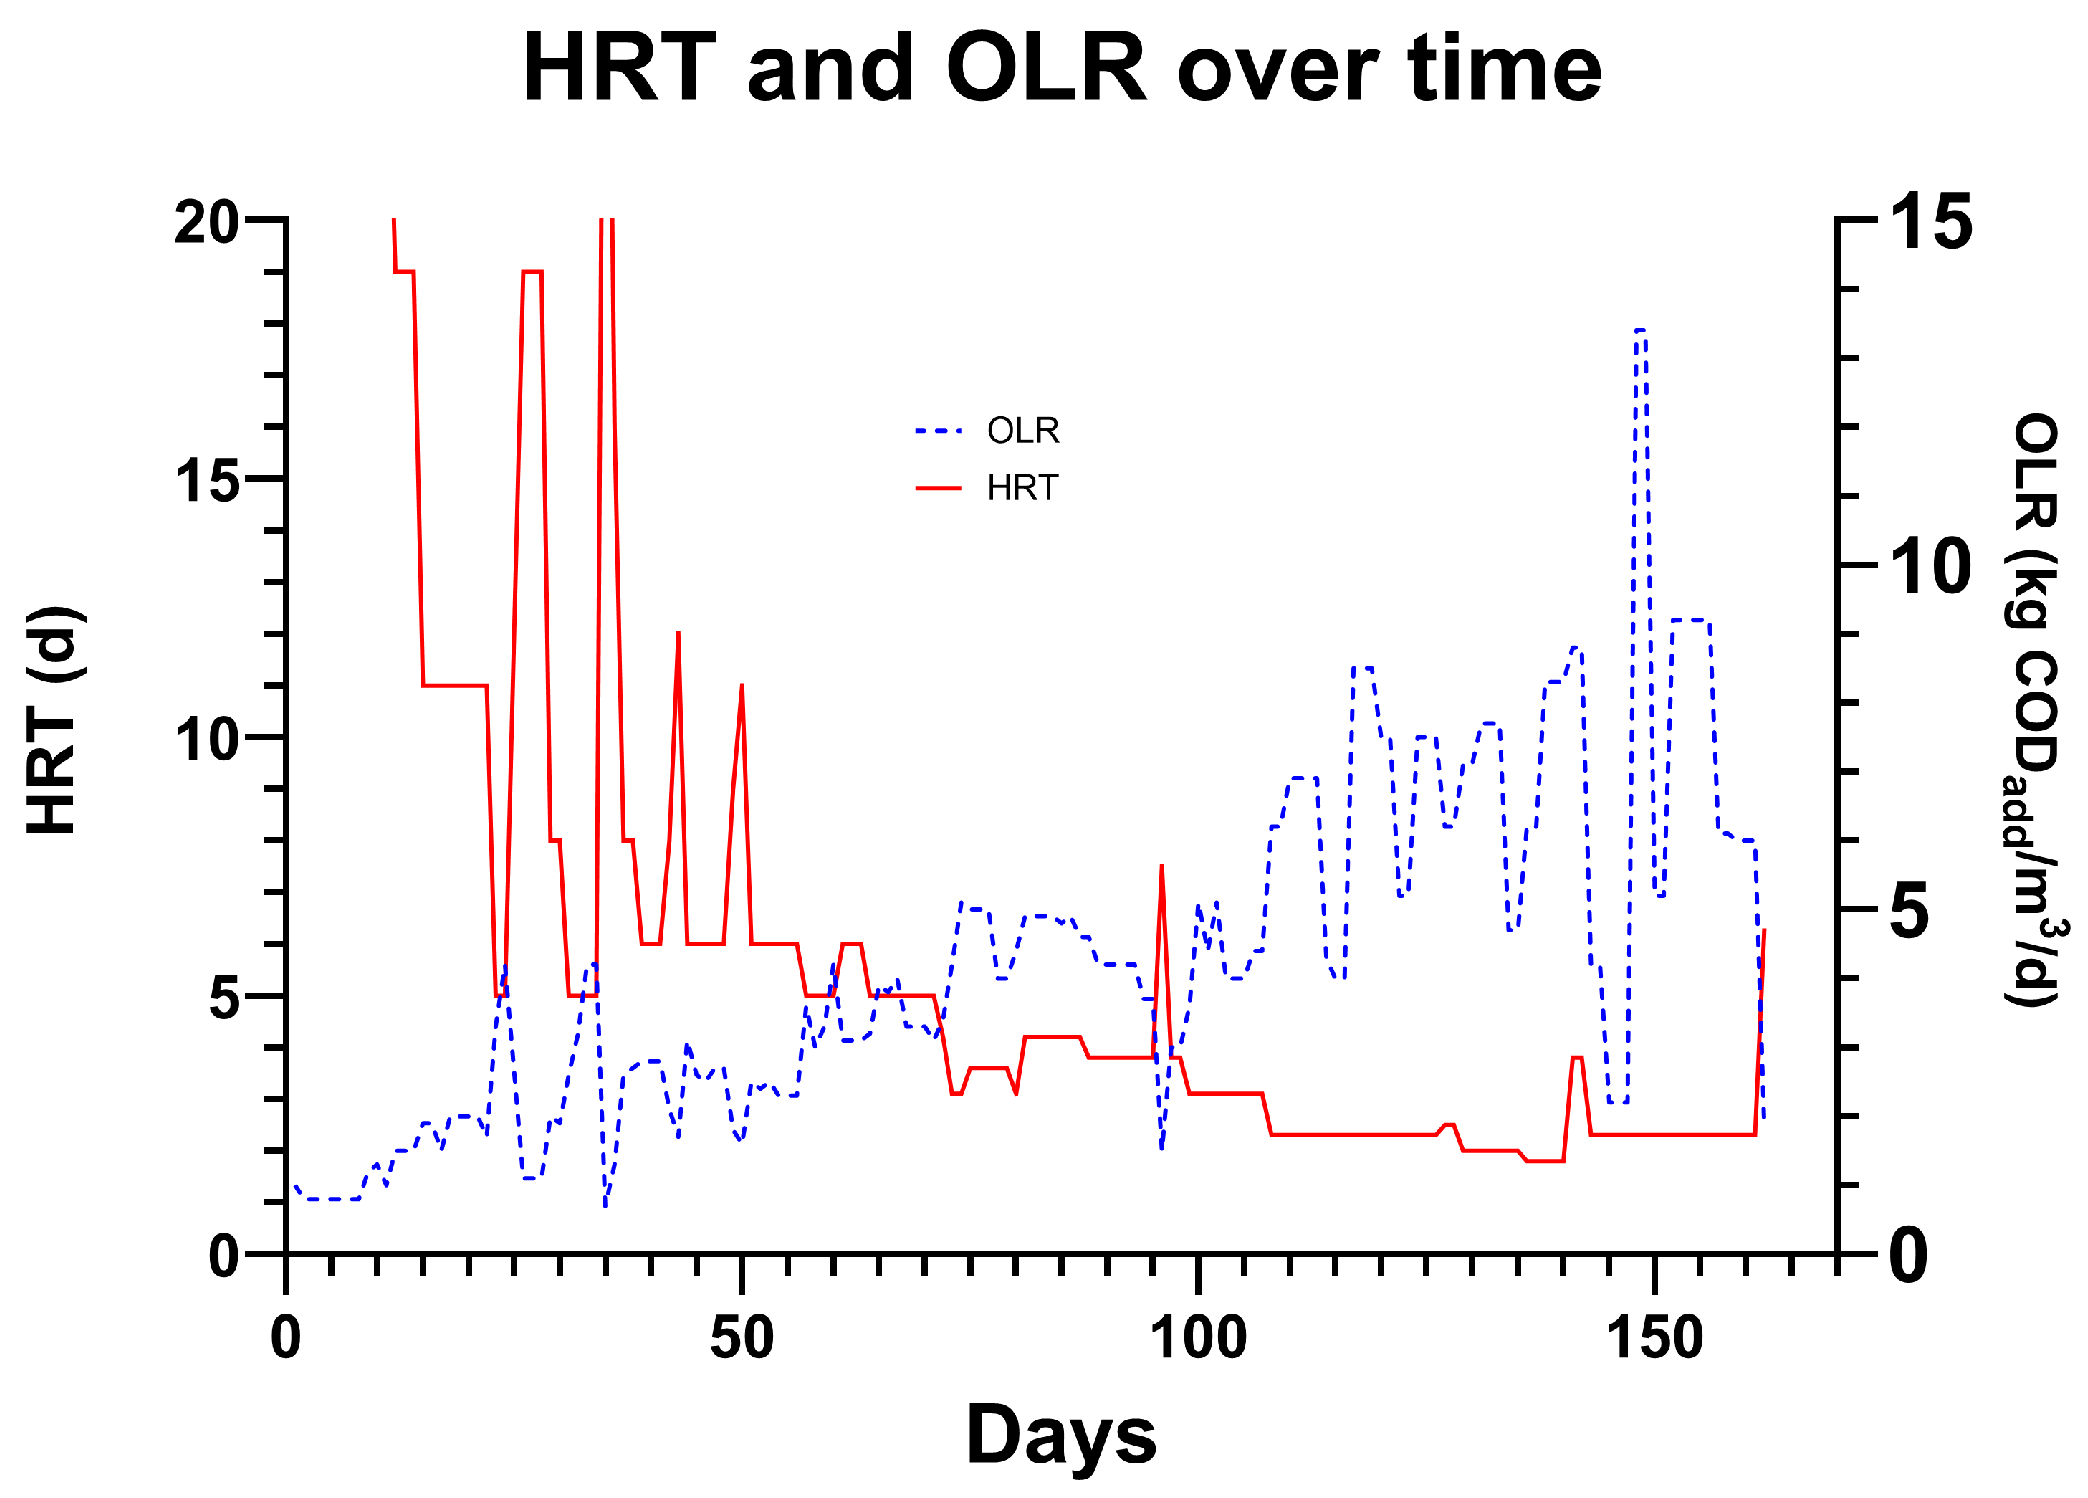
3.8. HRT and OLR
Over the course of the trial, the HRT was reduced from 16 days to 2.3 days with stable operation and a 12-day period operating between 2.3 and 1.8 days (days 129–140). Over the 12 days, the average HRT was 1.9 days, and the OLR was 7.23 kgCOD/m
3/day (
Figure 13). FOS/TAC increased from 0.4 to 0.8 over this period due to VFA accumulation from 971 mg/L to 1751 mg/L. This increase could be due to a number of reasons, which could be mitigated in further experimentation. For example, the temperature during this period averaged 31.3 °C, which is lower than the overall average of 34.1 °C, reducing the rate at which methanogens can utilise VFAs for methane production. It is reasonable to suggest that stability may have been possible if the temperature had been maintained. Some evidence for washout was observed as the SS captured from the top port of T1 decreased when compared to the period of 2.3 d of retention time prior, from 192 mL/L to 135 mL/L, indicating a lower amount of solids in the vessel. This was confirmed by a decrease in the SS being captured in the bottom of T2, decreasing from 443 mL/L to 263 mL/L. With a better biosolid settlement system such as a lamellar settler, or optimisations to process controls such as biogas mixing rates and sludge recirculation rates, it may be possible to achieve stable operation at 1.9 d HRT or below. In
Figure 13, the relationship between OLR and hydraulic retention time can be observed. The OLR is seen to gradually increase from 0.6 to 6 kgCOD/m
3/day by the end of the experimental period, with peaks as high as 13.4 being observed for 2 days. The average OLR over the two 19-day periods of stable operation at 2.3d HRT (days 108 to 126 and 143 to 162) were 6.6 and 6.7 kgCOD/m
3/day, respectively. Comparing this to the next largest trial conducted by Cusick et al. [
14], this is at least 4× higher than the stable OLR range of 0.76 kg sCOD/m
3/day when allowing for the typical ratio of 2:1 tCOD to sCOD found in this study. Several more recent studies have been published at pilot scales, but none have been larger than 1000 L or have focused on producing methane as opposed to hydrogen [
28,
29,
30]. This focus on hydrogen has reduced the impact of the reactors due to reduced energy positivity and effluent quality due to the need to inhibit and protect the cells from becoming methanogenic. Furthermore, ref. [
14] was the only pilot-scale study to examine treatment wastewater from the food and beverage industry at scale, with most others focusing on low strength domestic wastewater (up to 4.3 g/L COD) with comparatively low energetic content. The influent in the [
14] trial was diluted to keep it in the 0.7–2 g/L sCOD range, which is much lower than that used in the Hepworth trial system (8–30 g/L tCOD). This meant that the average stable OLR of the [
14] system was between 0.7 and 2 kg sCOD/m
3 reactor volume/d, which could be between 2 and 6× lower than the maximum stable OLR observed in this study (approx. 6.75 kg tCOD/m
3/d) depending on the sCOD/tCOD ratio.
3.9. Biogas Production
The average level of methane observed in biogas was 70.3 ± 4.2%, compared to 56% from a United Kingdom Accreditation Service (UKAS)-accredited laboratory Biochemical Methane Potential (BMP) analysis of the wastewater by NRM. This showed a 15% increase in methane concentration, improving the energy density of the biogas product. This enables compatibility for integration with products such as steam boilers and CHP engines or injection of less intensive biogas polishing. Yields of 0.486 m
3 CH
4/kg of COD removed were achieved and 0.266 m
3 CH
4/kg of COD added, equating to an average of 65.4 kWh/m
3 of wastewater treated. Biogas quality from all phases of the reactor was measured to be higher at 72.9 ± 3.26%, and a yield of 3.2 m
3 CH
4/kg of COD was added, signifying a relatively small increase in total yield of 0.054 m
3 CH
4. As in the COD removal, the majority of methane production occurred in the primary phase. These yields can be achieved by an efficient and well-operated AD system, but those systems rarely operate at the same rate as the test system. AD systems typically have a HRT of between 8 and 40 days depending on feedstock characteristics, and the EMR test system achieved stability at 2.3 days. The COD yield per kg of COD removed may be influenced by a lack of homogeneity in the vessel, where the sample port may have been in the floating sludge layer, meaning COD removal would have been underestimated. It has been observed, however, that higher than ‘theoretical’ methane yields per COD (approximately 0.35 m
3 CH
4/kgCOD) can be achieved by MEC AD systems, possibly due to electro-fermentation of CO
2 and H
2 or the use of alcohols as substrates [
31,
32]. Tartakovsky et al. [
33] noted that yield per COD be apparently elevated by the contribution of electrolytically provided H
2, resulting in a yield of 0.45 L/gCOD, though it was noted that it was not exclusively COD that was contributing to this.
The wastewater quality was independently verified for BMP, and compositional analysis was performed (
Supplementary Material File S1). From the 28-day BMP assay on brewery wastewater (labelled Liquid Effluent), a maximum methane percentage of 56% was achieved, as well as a BMP of 4 L CH
4/kg wet weight. The yield per total solids (dry weight) was 484 L CH
4/kg dry weight. Gas production largely plateaued after 11 days. At the time of this sample, waste TS was 0.73% of wet weight.
During the first phase of the experiment (T1 and T2 primary), an average yield of 4.7 ± 2.1 L CH4/kg wet weight was achieved, with an average HRT of 8.1 ± 3.9 days. In the second phase (T1 primary)—during the first 19 d period of 2.3 d HRT operation (8 full cycles between days 108 to 126), where temperature averaged 31 ± 1.1 °C—yields averaging 3.8 ± 0.64 L CH4/kg wet weight and 531 ± 17 L CH4/kg dry weight were achieved, representing a 9.7% increase in BMP yield by dry weight. Wastewater TS for this period was 0.83 ± 0.21% of wet weight.
In a second 19-day period of 2.3 d HRT (day 143 to 161), an average methane yield of 3.3 ± 0.85 L CH4/kg wet weight and 382 ± 8 L CH4/kg dry weight was achieved over an average temperature of 25 ± 2.2 °C. This 19.4% decrease in temperature resulted in a 10.8% and 28.1% decrease in methane yield by wet and dry weight, respectively. This suggests that the system was acclimated to higher temperatures and may benefit from the maintenance of temperatures around 35 °C.
Over the entire second phase (days 72 to 161), an average of 3.9 ± 1.1 L CH4/kg wet weight was achieved, with an average HRT of 2.7 ± 0.9 days. Similarly, the methane yield per TS in this phase was 436 ± 18 L CH4/kg dry weight, only 9.9% less at 2.7 days than after 10 days in the BMP.
This demonstrates the capability of the system to achieve close to the theoretical maximum methane yield after 28 days in only 2.7 days. If the gas production from T2 is included, the yield is maintained at 4.8 ± 1.6 L CH4/kg wet weight at an average HRT of 5.5 ± 2 days. This allows for the prediction of the most efficient HRT in terms of maximum gas production, informing system design with mass and energy balance. It may be more efficient to operate at lower HRT in order to reduce the size of the system, reducing CAPEX at the expense of energy recovery.
3.10. Energy Recovery
Over the entire trial, approximately 456,000 L of biogas was produced, resulting in 320,000 L of methane. This resulted in a total energy recovery of 3.3 MWh. During the period of peak stable HRT (2.3 days) and OLR, an average of yield of 0.43 ± 0.16 CH4/kg COD removed was achieved, equating to 39 kWh/m3 WW per day recovered in the primary vessel alone. The energy cost of powering the electrodes was 19.5 kWh, equating to 0.59% of the total energy recovered. This parasitic energy draw was insignificant compared to the benefits afforded by the improved performance of the system in terms of operability and stability improvements. The total energetic cost of running the trial was approximately 3.7 MWh, so the trial system was not energy positive. The system was not optimised for energy efficiency, and heating was the main cost. In order to ensure strict safety standards for the prevention of explosive environments, the air inside the trial system was constantly extracted, increasing the duty cycle and power required to heat the influent waste, which was at ambient environmental temperature. Heating jackets were placed around the outside of the IBC containers, which meant that approximately 40% of the thermal energy was dissipated, heating the air inside the container rather than the vessel. To heat a 400 L volume of water from 15 °C to 35 °C over a day, it would take 9.3 kWh of energy. In the trial system, approximately double that value was used. By improving the efficiency of the heating system alone, energy positivity could be achieved. With a jacket with a heating power of 600 W, the system can maintain a constant temperature at a HRT of 2.3 days (400 L per day) if it is 65% efficient. If the heating system was 95% efficient, a heating power of approximately 400 W would be required. In a commercial system, the whole volume of the shipping container or chosen vessel may be occupied by liquid, so no heat loss can occur due to extracted air. This will significantly improve the energy efficiency of the system. Effluent heat recovery could also allow for preheating of influent waste. As warm, treated wastewater leaves the system, it is passed through a heat exchanger to warm the fresh wastewater, recovering thermal energy. This could increase the influent temperature by approximately 10 °C, further halving the energy requirement for heating to 4.7 kWh, meaning a heating power of 200 W is required to maintain 35 °C in the trial system. Further work will be carried out in order to improve the energy efficiency of the heating system in later trials, demonstrating energy-positive operation.
3.11. Microbial Community Analysis
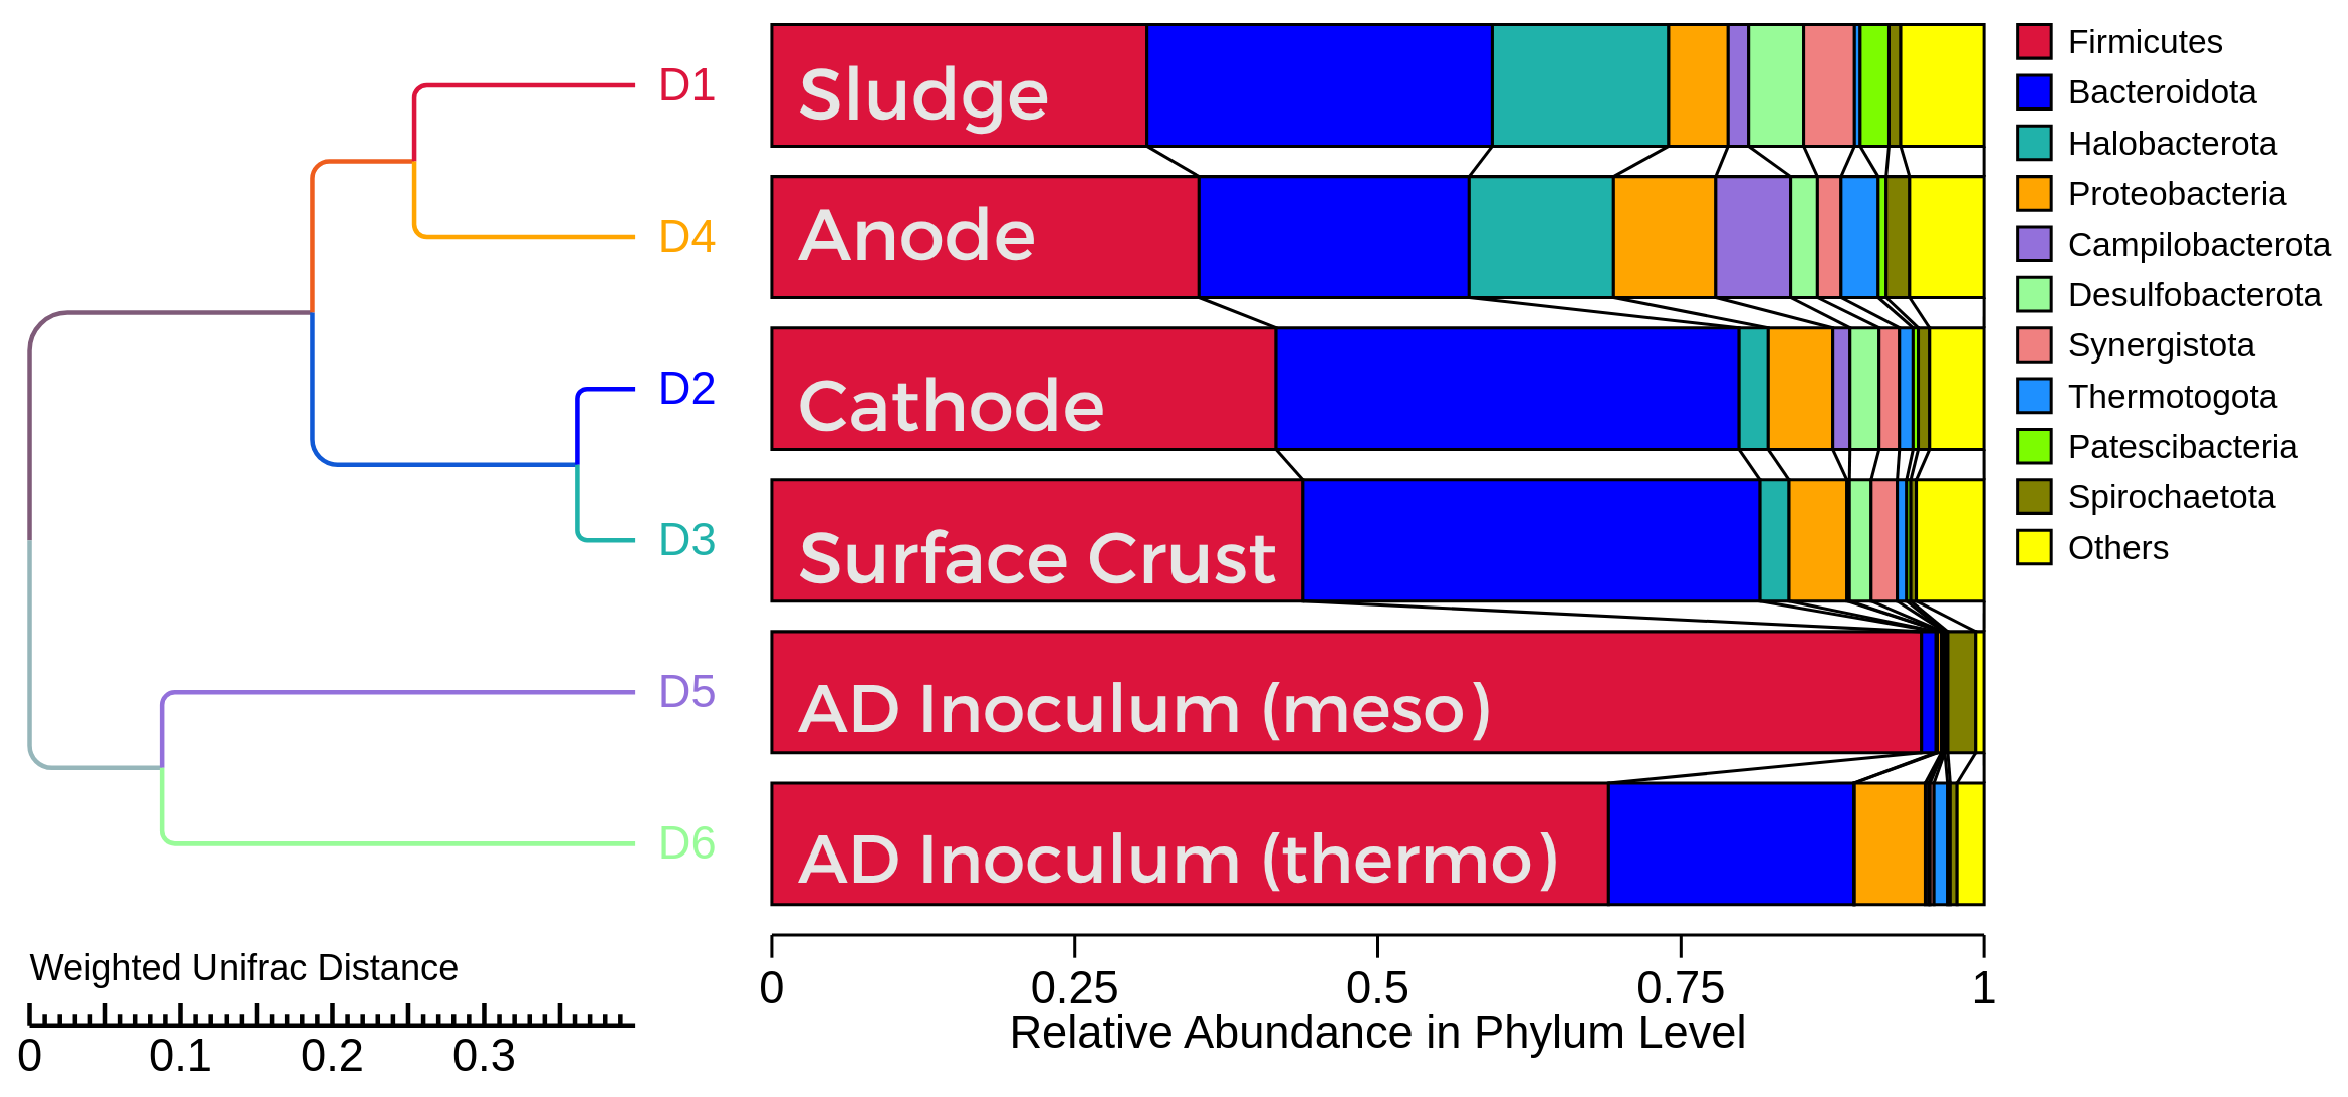
Microbial community analysis provided insight to the location and identity of key microorganisms in the reactor. A sample was taken at the start of the experiment to determine which microorganisms were present in the reactors.
Figure 14 shows the relative abundance of microorganisms at the Phylum level in each sample. It was noted that the anode and sludge samples contained significantly more
Methanosaeta spp. than the cathode and surface crust samples. This was an intriguing result, as methanogenesis in a microbial electrolysis cell is catalysed at the cathode. This may be a result of the high surface area and biofilm compatibility of the anode, as well as the environment for DIET that is provided on the surface. Methanogens such as
Methanothrix soehngenii that can only utilise acetate as an energy source as opposed to carbon dioxide and hydrogen may find a niche, scavenging acetate from acetate-fermenting bacteria on the anode.
Methanosarcina spp. such as
M. barkeri and
M. horonobensis have been shown to be capable of DIET and therefore may also prefer to exchange electrons from other microbes compared to the anode [
34].
Species from the phylum Proteobacteria include commonly reported synergistic exoelectrogens such as
Geobacter sulfurreducens. Proteobacteria were found in the highest abundance on the anode, suggesting that these microbes are selected for in the anodic environment and are participating in electron transfer at this site. The presence of
Geobacter spp. is shown to improve methane yield in AD systems; therefore, it may also play a role in improved performance of MEC-ADs [
35].
3.12. Scalability of the EMRs and Applicability at Scale
The trial system was not inhibited by variations in influent COD of more than 100% day-over-day, reducing the chances of system upset in response to changing parameters in the brewing process. Management of this level of feedstock variation usually requires operators to carry out daily analysis to monitor and change operational parameters accordingly to maintain stable operation. With this waste stream (avg. 16,000 mg/L COD), we have observed stable performance at hydraulic retention times of 2.3 days and an OLR of up to 8 kg COD/m3/d). Despite large variations in feedstock COD strength, the EMR COD removal remains stable at an average of 93 ± 4%. This enables the accurate specification of secondary treatment systems and confidence that effluent quality limits will be achieved. No material degradation of the electrodes was observed when modules were inspected. The electrode modules in the test system were exposed to wastewater for 2 years by the end of the investigation in December 2022. As winter approached, the capacity of the heating system to heat the reactors to 35 °C was reduced, resulting in a 40-day period of operation at or below 30 °C. A small reduction in biogas yield occurred, suggesting that the electromethanogenic process may be tolerant to operation at reduced temperatures compared to conventional AD, reducing the energetic cost of heating the reactors and improving return on investment for customers in some scenarios where the cost of heating waste may be prohibitive to energy positivity. The use of a single vessel primary treatment zone will allow for more simplistic process control to be transferred to a commercial scale system with a similar design. This will remove the need to install large baffles and pipework in a commercial system and reduce the need to accurately specify stage volumes in order to optimise each stage of a reactor. This is especially important when dealing with variable-strength wastes such as those found in the food and beverage industry. In order to treat the total daily output of the brewery at 21,428 L per day with a retention time of 2.3 days, a single 40 ft shipping container system would be required, resulting in an approximately 53 m3 working volume. This is a feasible footprint and treatment solution for a brewery such as Hepworth’s, requiring a simplistic tertiary treatment step such as a lamella clarifier to prepare the effluent for reed bed discharge.


 ,
, 
