Review

Grid-Forming Converter Fault Control Strategy and Its Impact on Relay Protection: Challenges and Adaptability Analysis

1
Power System Security and Operation Key Laboratory of Sichuan Province, State Grid Sichuan Electric Power Research Institute, Chengdu 610041, China
2
State Key Laboratory of Advanced Electromagnetic Technology, School of Electrical and Electronic Engineering, Huazhong University of Science and Technology (HUST), Wuhan 430074, China
3
State Grid Panzhihua Power Supply Company, Panzhihua 617067, China
4
State Grid Liangshan Power Supply Company, Liangshan 610072, China
*
Author to whom correspondence should be addressed.
Energies 2025, 18(11), 2933; https://doi.org/10.3390/en18112933
Submission received: 9 April 2025 / Revised: 20 May 2025 / Accepted: 22 May 2025 / Published: 3 June 2025
(This article belongs to the Special Issue Renewable Energy System Technologies: 2nd Edition)

Abstract

:
As the proportion of new energy generation continues to rise, power systems are confronted with novel challenges. Grid-forming converters, which possess voltage source characteristics and can support the grid, typically employ a VSG control strategy during normal operation to emulate the behavior of synchronous generators. This approach enhances frequency response and system stability in modern power systems. This review article systematically examines two typical fault control strategies for grid-forming converters: the switching strategy and the virtual impedance strategy. These different control strategies result in distinct fault response characteristics of the converter. Based on the analysis of fault control strategies for grid-forming converters, this study investigates the impact of the converter’s fault response characteristics on overcurrent protection, pilot protection, distance protection, and differential protection and investigates and prospects corresponding countermeasures. Finally, through simulation modeling, the fault response characteristics under different control strategies and their effects on protection are verified and analyzed. Focusing on grid-forming converters, this paper dissects the influence of their fault control strategies on relay protection, providing strong support for the wide application and promotion of grid-forming converters in new types of power systems.

1. Introduction

The vigorous promotion of new energy generation to replace traditional fossil fuel-based power generation and the development of a new type of power system with an increasing proportion of new energy have become the core tasks of the power industry transformation [1]. However, after the large-scale integration of new energy into the grid, the power system exhibits characteristics of “low inertia” and “weak damping”, which seriously threaten the stability and reliability of the power system. The introduction of the concept of “grid-forming control” has brought new ideas to solving this problem [2]. This review article aims to provide a comprehensive analysis of the impact of grid-forming converter fault control strategies on relay protection. It follows a rigorous logical structure of “control strategy—fault characteristics—protection impact—countermeasure recommendations” to integrate cutting-edge research findings that are currently scattered across various publications.
Although grid-forming converters have demonstrated significant potential in addressing the integration of new energy sources, they rapidly switch to fault control strategies during power system faults to maintain basic system operation and ensure the safety of power electronic devices. The impact of the corresponding fault response characteristics on relay protection is not yet clear. Also, the strategies to address these impacts need further investigation.
The grid-forming converters primarily controlled by Virtual Synchronous Generator (VSG) control [3] have been the focus of existing research, particularly regarding their fault current-limiting characteristics. The current-limiting strategies employed by grid-forming converters can generally be divided into two main categories: direct methods and indirect methods. The direct current-limiting method centers on precisely controlling the reference value of the current upon detecting a grid fault. In the studies mentioned in references [4,5], grid-forming converters switch from the conventional voltage source mode to a current source mode during faults, feeding out 1.2–1.5 times the rated current and synchronizing with the grid using a Phase-Locked Loop (PLL). This method requires high stability of grid voltage and performs poorly in weak grid environments. References [6,7] propose switching the VSG control to current control during grid faults and adding virtual impedance to suppress fault currents and ensure equipment safety. Both methods alter the voltage source characteristics of grid-forming converters during faults, losing their voltage support capability and making them unable to operate in islanded conditions.
The indirect current-limiting method primarily restricts the voltage reference value or introduces virtual impedance to limit the current, thereby ensuring that the converter maintains its voltage source characteristics. For the method that limits the voltage reference value, the output voltage can be calculated based on the equivalent impedance, voltage deviation value, and current before the fault, which indirectly suppresses the fault current. However, during asymmetrical faults, the instantaneous voltage amplitude calculated based on the formula can be affected by oscillatory components [8]. Compared to the voltage-limiting method, the current-limiting control strategy using virtual impedance is slightly delayed in the initial stage of a fault due to the control bandwidth limitations, and its fault response characteristics are similar to those of the voltage-limiting method [9]. In practical applications, once the output current exceeds a preset threshold, virtual impedance is introduced. This virtual impedance can be a constant value or dynamically adjusted proportionally based on changes in current, with the aim of limiting the current by reducing the reference voltage. Generally, the larger the virtual impedance, the more pronounced the current-limiting effect. However, excessively large virtual impedance may also lead to system instability.
Currently, there is limited research on the impact of grid-forming converter fault characteristics on relay protection and the countermeasures of existing relay protection. Reference [10] provided a comprehensive review of overcurrent limiting strategies in grid-forming inverters, highlighting the challenges posed by limited fault current amplitudes and the need for improved protection schemes. Their work underscores the importance of understanding the fault characteristics of grid-forming converters to enhance the adaptability and reliability of relay protection systems. Reference [11] discusses the existing fault control strategies and characteristics of grid-forming converters but lacks specific improvement measures for different protections. Reference [12] elaborates on the modeling methods and applications of grid-forming converters but only analyzes the challenges faced by overcurrent protection without discussing protective countermeasures or development directions. Reference [13] investigates the control strategies of voltage source converters (VSCs) under unbalanced grid faults but does not analyze the impact of fault response characteristics on relay protection. This paper focuses on grid-forming converters controlled by VSG and analyzes the two most commonly used fault control strategies, namely the switching control strategy and the virtual impedance control strategy. It discusses the fault response characteristics of grid-forming converters under these two control strategies, investigates their impact on existing relay protection, and proposes corresponding protection countermeasures. This provides strong support for the research, development, and operation of protection systems after the integration of grid-forming converters into the power grid. The main contributions of this paper can be summarized as follows:
  • In-depth Analysis of Fault Control Strategies for Grid-Forming Converters: Conducted an in-depth analysis of the switching strategy and virtual impedance strategy for grid-forming converters, clarifying the differences in their principles and fault characteristics.
  • Synthesis of Protection Impact Mechanisms: The article synthesizes existing research on the impact of converter fault response characteristics on various types of relay protection, identifying common themes and gaps in the literature.
  • Investigated and prospected protection countermeasures: In response to the identified impact mechanisms, investigated and prospected countermeasures for different types of relay protection to enhance their adaptability and reliability.
  • Developed a simulation verification model: Utilized PSCAD to build models to verify the fault characteristics of converters under different fault strategies, providing empirical support for the theoretical findings.

2. Control Strategies for Grid-Forming Converter

2.1. The Control Strategy of the Grid-Forming Converter During Normal Operation

The control block diagram of the conventional VSG-controlled converter is illustrated in Figure 1. It primarily consists of outer-loop and inner-loop control sections. The active power loop and reactive power loop in the outer control simulate the primary frequency regulation, swing equation, and excitation control of a synchronous generator, respectively. These loops control the reference values of the internal voltage phase and amplitude. The reference values are then processed through dual-loop voltage and current control to generate the modulation wave.

2.2. Fault Strategies and Fault Characteristics of Grid-Forming Converter

2.2.1. Switching Strategy

The switching strategy refers to the control strategy where grid-forming converters switch from voltage source converters to current source converters under grid faults. For the converter, directly limiting the current value to a certain level causes it to switch directly from a voltage source to a constant current source. At this point, the power output is the product of the constant current value and the voltage value at the point of common coupling, with the voltage magnitude and phase angle being uncontrolled. As a result, the power output from the inverter becomes uncontrollable. This leads to power imbalance and loss of synchronization between the converter and the grid. Consequently, a backup PLL is required during the fault period to maintain synchronization. The following example illustrates this fault strategy using a photovoltaic power station.
When the measured voltage falls below the threshold, a fault condition is detected, and the converter switches from VSG control to current control mode. The phase voltage and line voltage at the measurement point are compared, and the per-unit value of the peak of the minimum voltage is calculated, U m i n p e a k . The threshold can be set at 0.9, meaning that when U m i n p e a k is less than 90% of the nominal voltage, a fault state is indicated.
During the low voltage ride-through period, due to the requirement for reactive current to support grid voltage, the inverter should first output the corresponding reactive current as specified in Equation (1), with the remaining current capacity utilized to support active power.
I q r e f * 1.5 ( 0.9 U g ) I N 0.2 U g 0.9 I q r e f * 1.05 I N U g < 0.2 I q r e f * = 0 U g > 0.9
U g is the per-unit value of the grid-connected point voltage of the new energy source, I N is the rated grid-connected current, and I q r e f * is the reference value of reactive current.
The PLL plays a crucial role in the control system of photovoltaic inverters. However, when the grid voltage experiences asymmetry, the accuracy of this control strategy is compromised. The negative sequence components caused by asymmetrical faults can further deteriorate the performance of the PLL and may even cause it to fail. Thus, when an asymmetrical fault occurs in the grid, the sequence components of the electrical quantities should be separated to perform phase locking, as illustrated in the phase-locked loop flowchart shown in Figure 2. F d + , F q + , F d , and F q represent the positive and negative sequence components in the dq-axis coordinate system, ω 0 is the fundamental angular frequency, θ is the positive sequence electrical phase angle, and the integral component employs a Voltage-Controlled Oscillator (VCO).
To prevent the converter from being damaged by overcurrent, a current-limiting protection strategy is commonly employed. This strategy can be described by Equation (2).
I q r e f = m i n ( I m a x , I q r e f * ) I d r e f = m i n ( I m a x 2 I q r e f 2 , I d r e f )
where I d r e f and I q r e f have the same signs as I d r e f and I q r e f * , respectively. I d r e f is the output d-axis current from the voltage control loop, I d r e f and I q r e f are the current reference values after considering the current-limiting strategy, and I m a x is the maximum allowable current amplitude.
The control block diagram of the switching strategy is shown in Figure 3.

2.2.2. Virtual Impedance Control Strategy

Under the switching strategy, when a fault occurs, the inverter switches to grid-following mode and operates as a current source, thereby losing its grid-forming capability. In this mode, the output current of the inverter is controlled to track the preset fault current. Additionally, a backup PLL is required to maintain synchronization between the inverter and the grid. However, the PLL is unable to function effectively under weak grid conditions and during voltage sags. Furthermore, operating as a current source during a fault leads to a shift in the fault power angle curve. This reduces the overlap area between the converter’s steady-state operation and the fault power angle curve, making it more difficult to return to the pre-fault operating point [12].
Considering the inherent drawbacks of the switching strategy, some scholars have proposed using virtual impedance for current limiting, which restricts the current by limiting the reference voltage. In the dq-axis coordinate system, the voltage drop through resistance and inductance is given by Equations (3) and (4).
ν d = R i d ω L i q
ν q = R i q + ω L i d
The virtual impedance consists of two parts: transient virtual impedance and current-limiting virtual impedance. Based on the forms of Equations (3) and (4), the voltage drop due to transient virtual impedance can be derived, as shown in Equations (5) and (6).
ν d , V I = R V I 0 i o d s / ( s + ω c , h p f ) ω L V I 0 i o q s / ( s + ω c , h p f )
ν q , V I = R V I 0 i o q s / ( s + ω c , h p f ) + ω L V I 0 i o d s / ( s + ω c , h p f )
where ω c , h p f is the cutoff frequency of a first-order high-pass filter. R V I 0 and L V I 0 are the transient virtual resistance and transient virtual inductance, respectively. i o d and i o q are the d- and q-axis current components output by the converter through an LC filter.
During a fault, when the output current amplitude of the converter exceeds the threshold, the control strategy introduces additional current-limiting virtual impedance. The total virtual impedance consists of the transient virtual impedance ( R V I 0 and L V I 0 ) plus the current-limiting virtual impedance ( Δ R V I and Δ L V I ), as shown in Equation (7). The expressions for Δ R V I and Δ L V I are given in Equations (8) and (9).
R V I = R V I 0 + Δ R V I , L V I = L V I 0 + Δ L V I
Δ R V I = m a x k p , R v i i L d 2 + i L q 2 I t h r e s h , 0
ω Δ L V I = Δ R V I ( Δ X / R )
where k p , R v i and Δ X / R are the current limiting virtual resistance proportional gain and current limiting virtual impedance X/R ratio, respectively. I t h r e s h is the current threshold, and i L d and i L q are the d- and q-axis current components output by the converter without passing through the LC filter, as shown in Figure 4. The current component i L d q is used in Equation (8) instead of i o d q for amplitude comparison because using i o d q would lead to increased oscillations.
The current limiting virtual resistance proportional gain k p , R v i can increase the virtual impedance, thereby reducing the magnitude of the steady-state current. However, this may lead to instability in the grid-forming converter. For example, when k p , R v i is increased from 0.1 to 0.4, the converter experiences transient instability, as shown in Figure 5.
For current limiting during faults, the transient virtual impedance voltage drop is attenuated due to the time constant of the high-pass filter, rendering the transient virtual impedance ineffective. If the virtual impedance voltage drops, it will not limit the current; hence, the current-limiting virtual impedance is not passed through a high-pass filter. The final expressions for the virtual impedance voltage drop are given by Equations (10) and (11), and the control strategy block diagram is shown in Figure 6 [14].
ν d , V I = R V I 0 i o d s / ( s + ω c , h p f ) ω L V I 0 i o q s / ( s + ω c , h p f ) + Δ R V I i o d Δ ω L V I i o q
ν q , V I = R V I 0 i o q s / ( s + ω c , h p f ) + ω L V I 0 i o d s / ( s + ω c , h p f ) + Δ R V I i o q + Δ ω L V I i o d
To address the impact of rapid changes in output impedance during faults on the reliability of relay protection, reference [15] proposed a protection-compatible fault-ride-through control method. This method effectively mitigates the dynamic changes in source behavior during faults by dynamically adjusting the power control of distributed energy resources, thereby maintaining the reliability of incremental-based supervisory elements. Similar to the virtual impedance control strategy, this approach dynamically adjusts control strategies to cope with dynamic changes during faults.

2.2.3. Fault Response Features

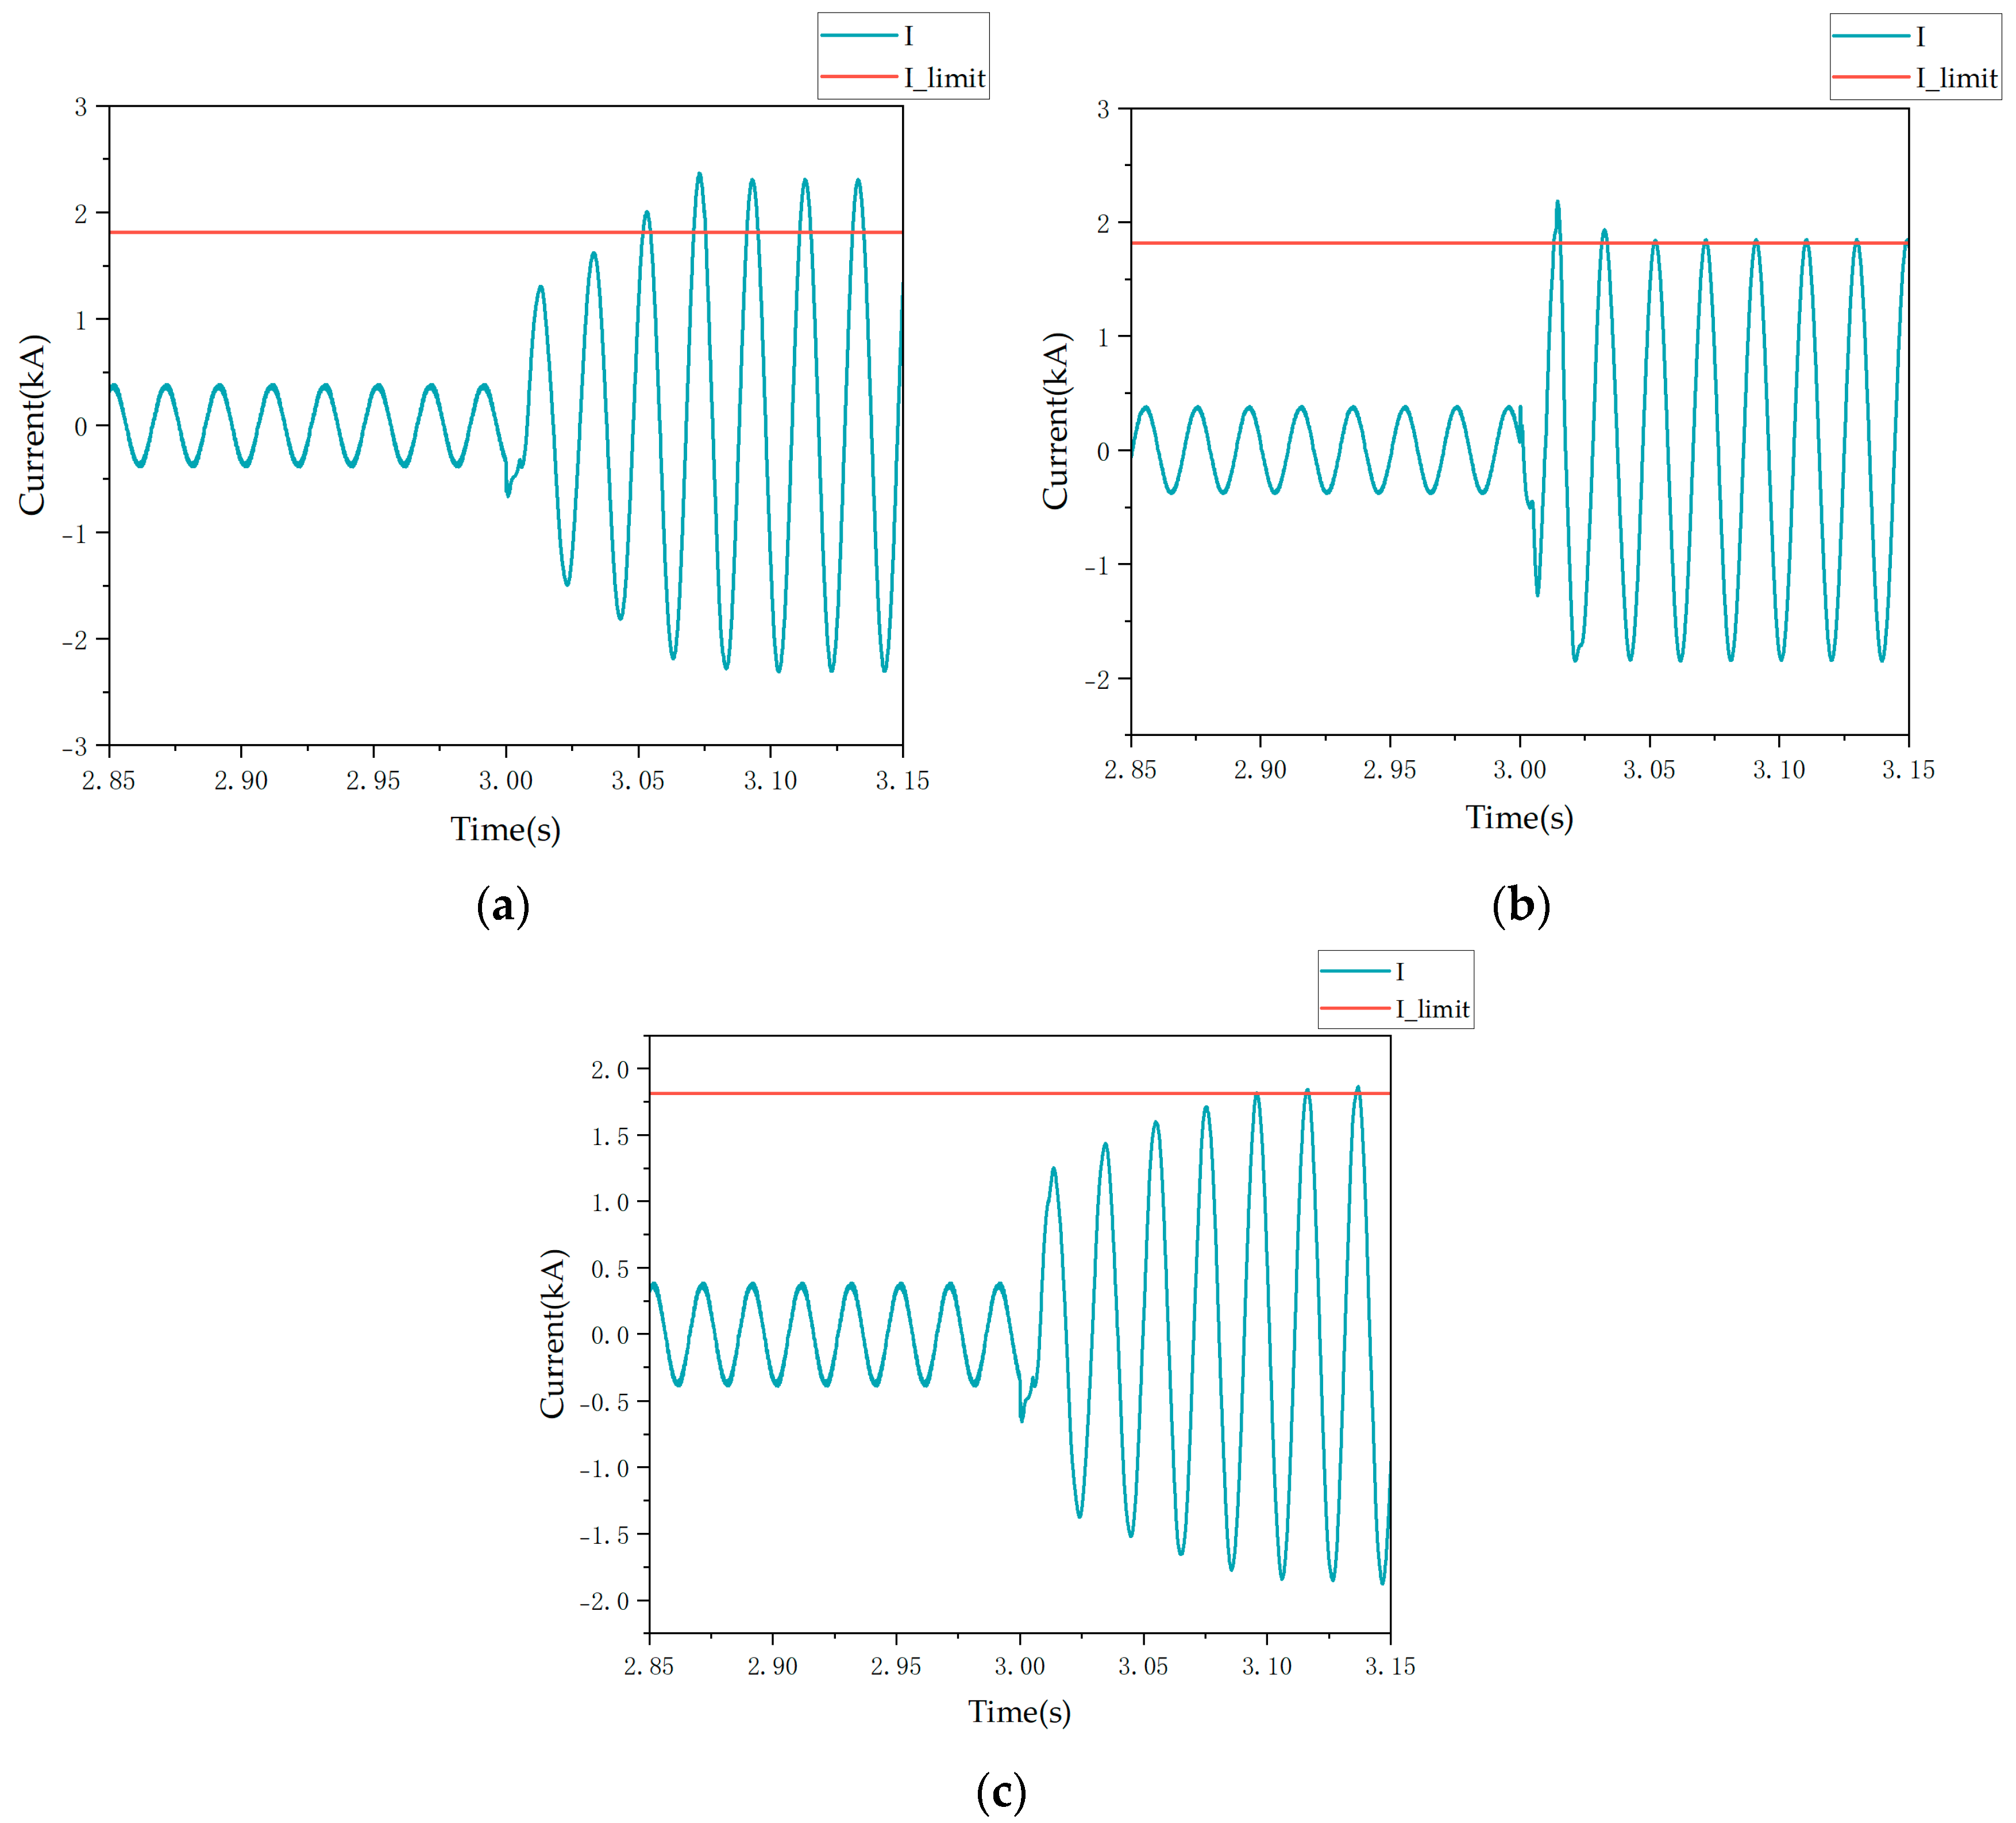
  • Amplitude limitation. Regardless of the fault strategy employed during a fault, the fault current of the converter is suppressed due to the inherent characteristics of the converter itself. The short-circuit current level that a grid-forming converter can withstand is between 1 and 2 pu [13]. In the short term, inverters that comply with IEEE 1547 [16] and UL 1741 [17] standards generate fault currents approximately two to five times the rated current within 1 to 4.25 ms [18].
  • Negative sequence currents induce additional losses in the power electronic devices of the converter. These losses subsequently lead to overheating and potential damage, ultimately shortening the converter’s life cycle. The method for suppressing negative sequence currents is shown in Equation (12).
    i d * = i q * = 0
    In the equation, i d * and i q * represent the reference values of the negative sequence currents on the d-axis and q-axis, respectively.
  • Low-Voltage Ride-Through (LVRT) characteristics. When a short-circuit fault in the grid causes a voltage dip and if the fault strategy is a switching strategy, the reactive current I q r e f * injected by the new energy source into the grid should satisfy Equation (1). This would maintain voltage stability and provide reactive power support during grid voltage dips.
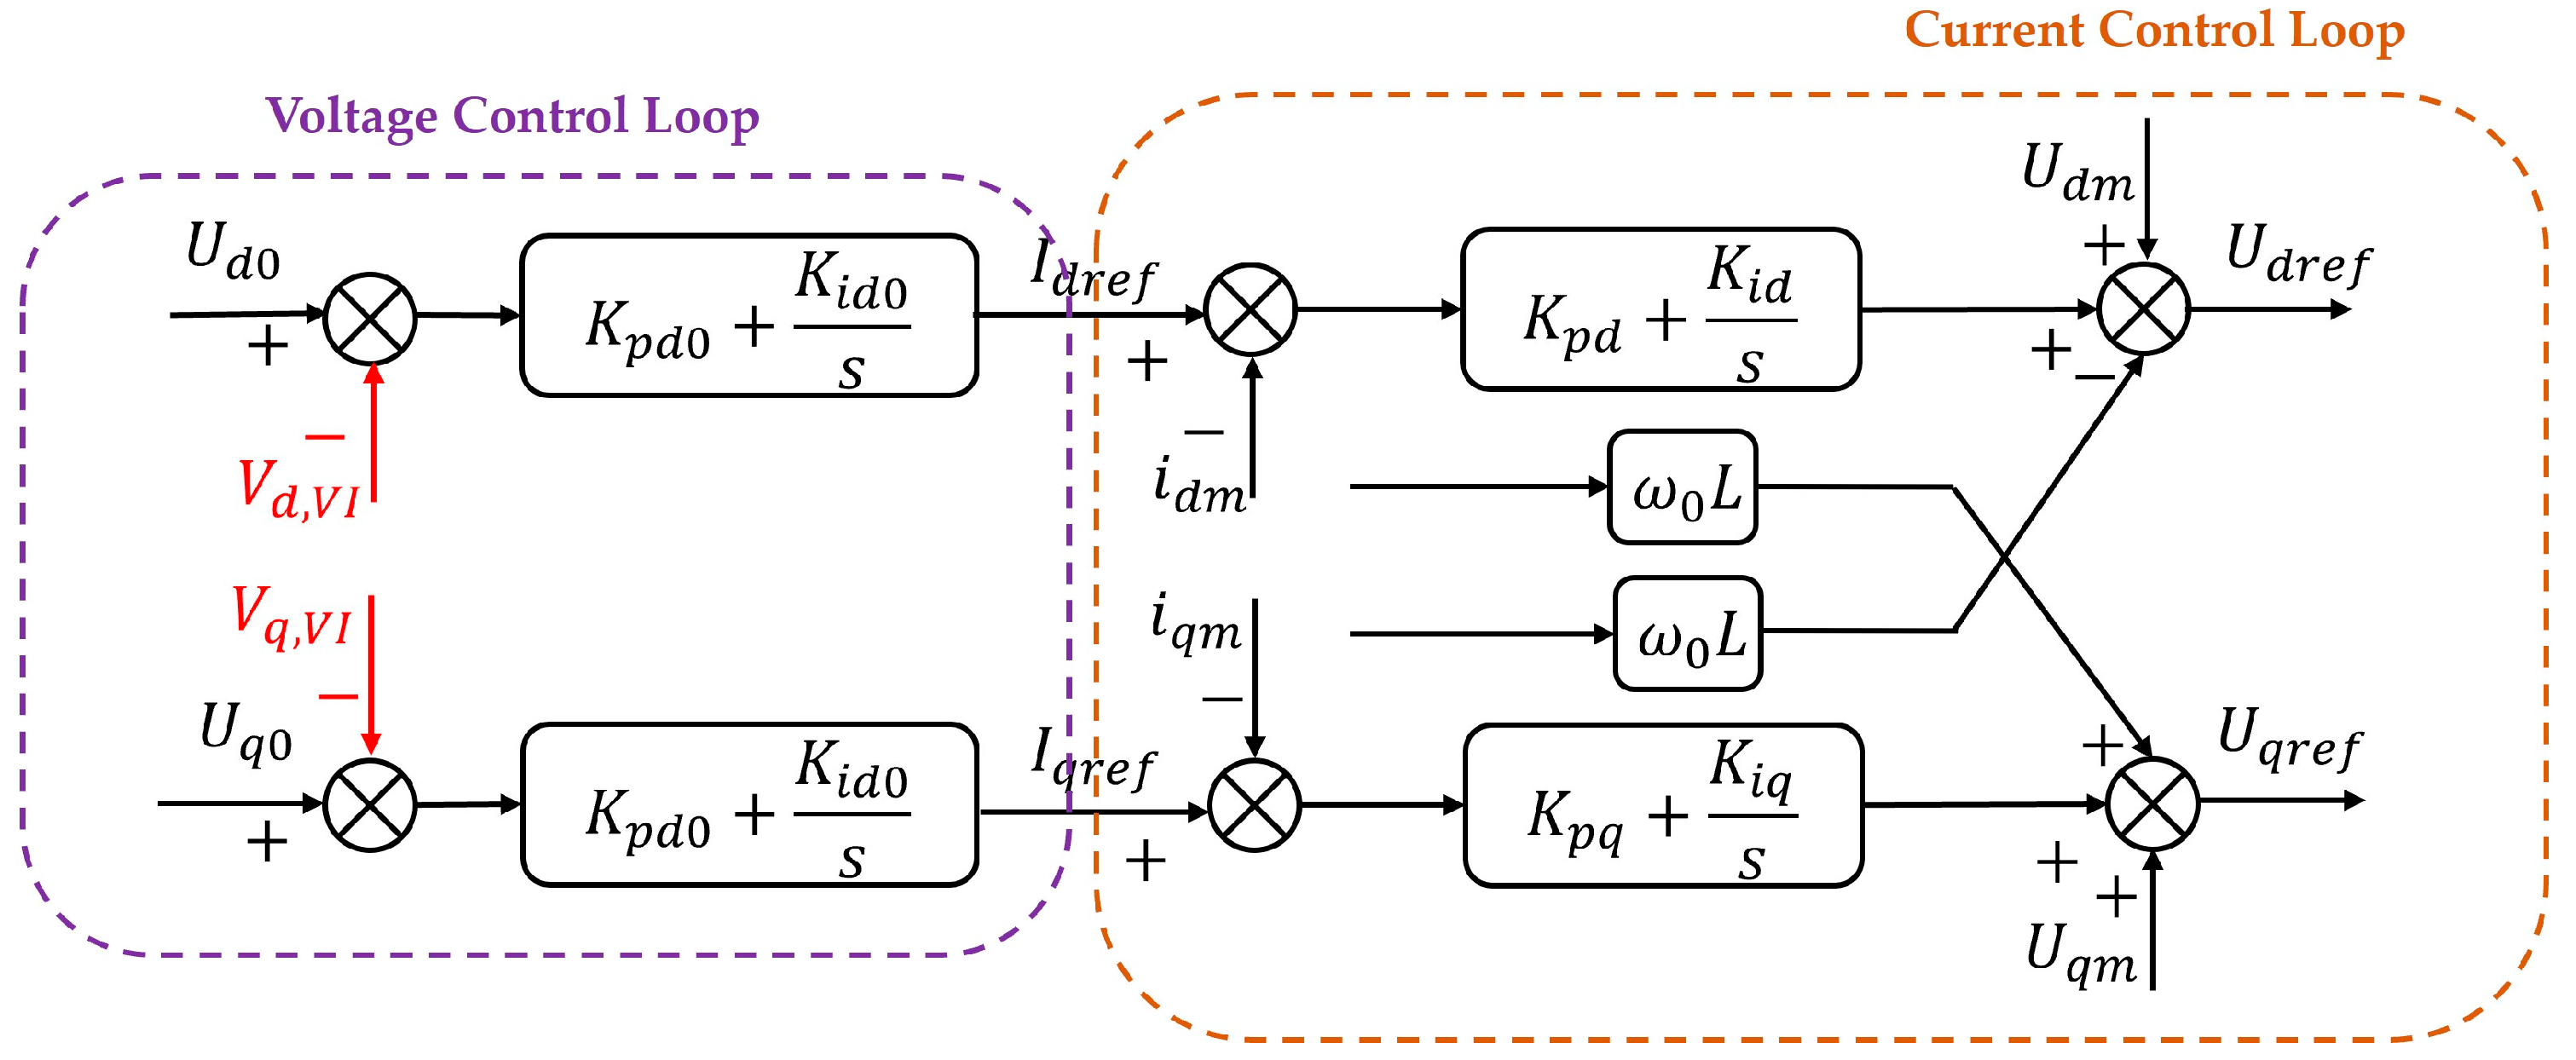
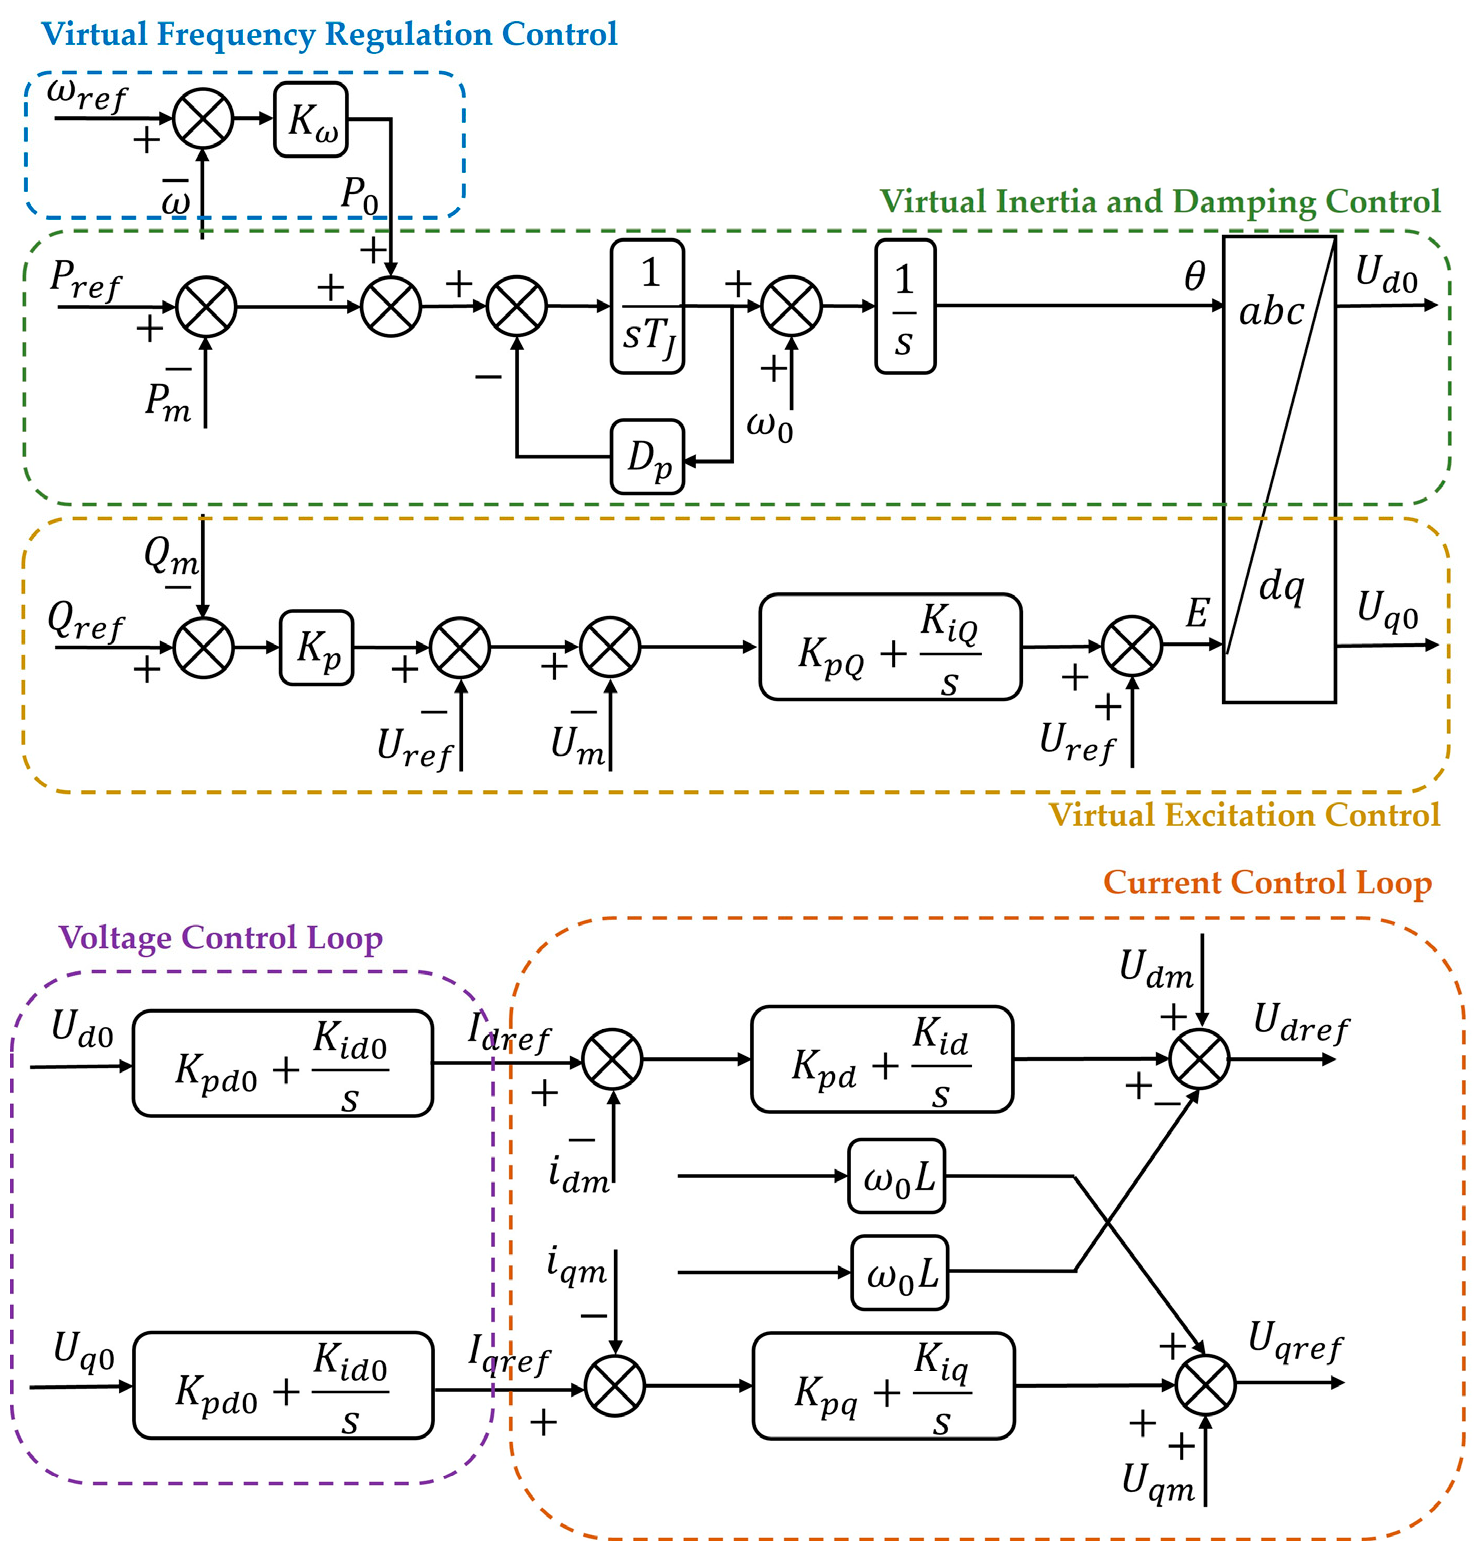
  • Voltage source characteristics. VSG control regulates the output voltage through virtual excitation control; it also introduces virtual inertia and damping components and employs voltage closed-loop control. The system continuously monitors the output voltage, compares it with the reference value, and adjusts the inverter’s switching state via the controller to compensate for voltage deviations, thereby ensuring stable output voltage. Under the virtual impedance strategy, only the outer-loop voltage reference value is altered, while the voltage source characteristics remain unchanged, as shown in Figure 7.
    Figure 7. Dual-loop voltage and current control diagram after adding virtual impedance.
    Figure 7. Dual-loop voltage and current control diagram after adding virtual impedance.
    Energies 18 02933 g007
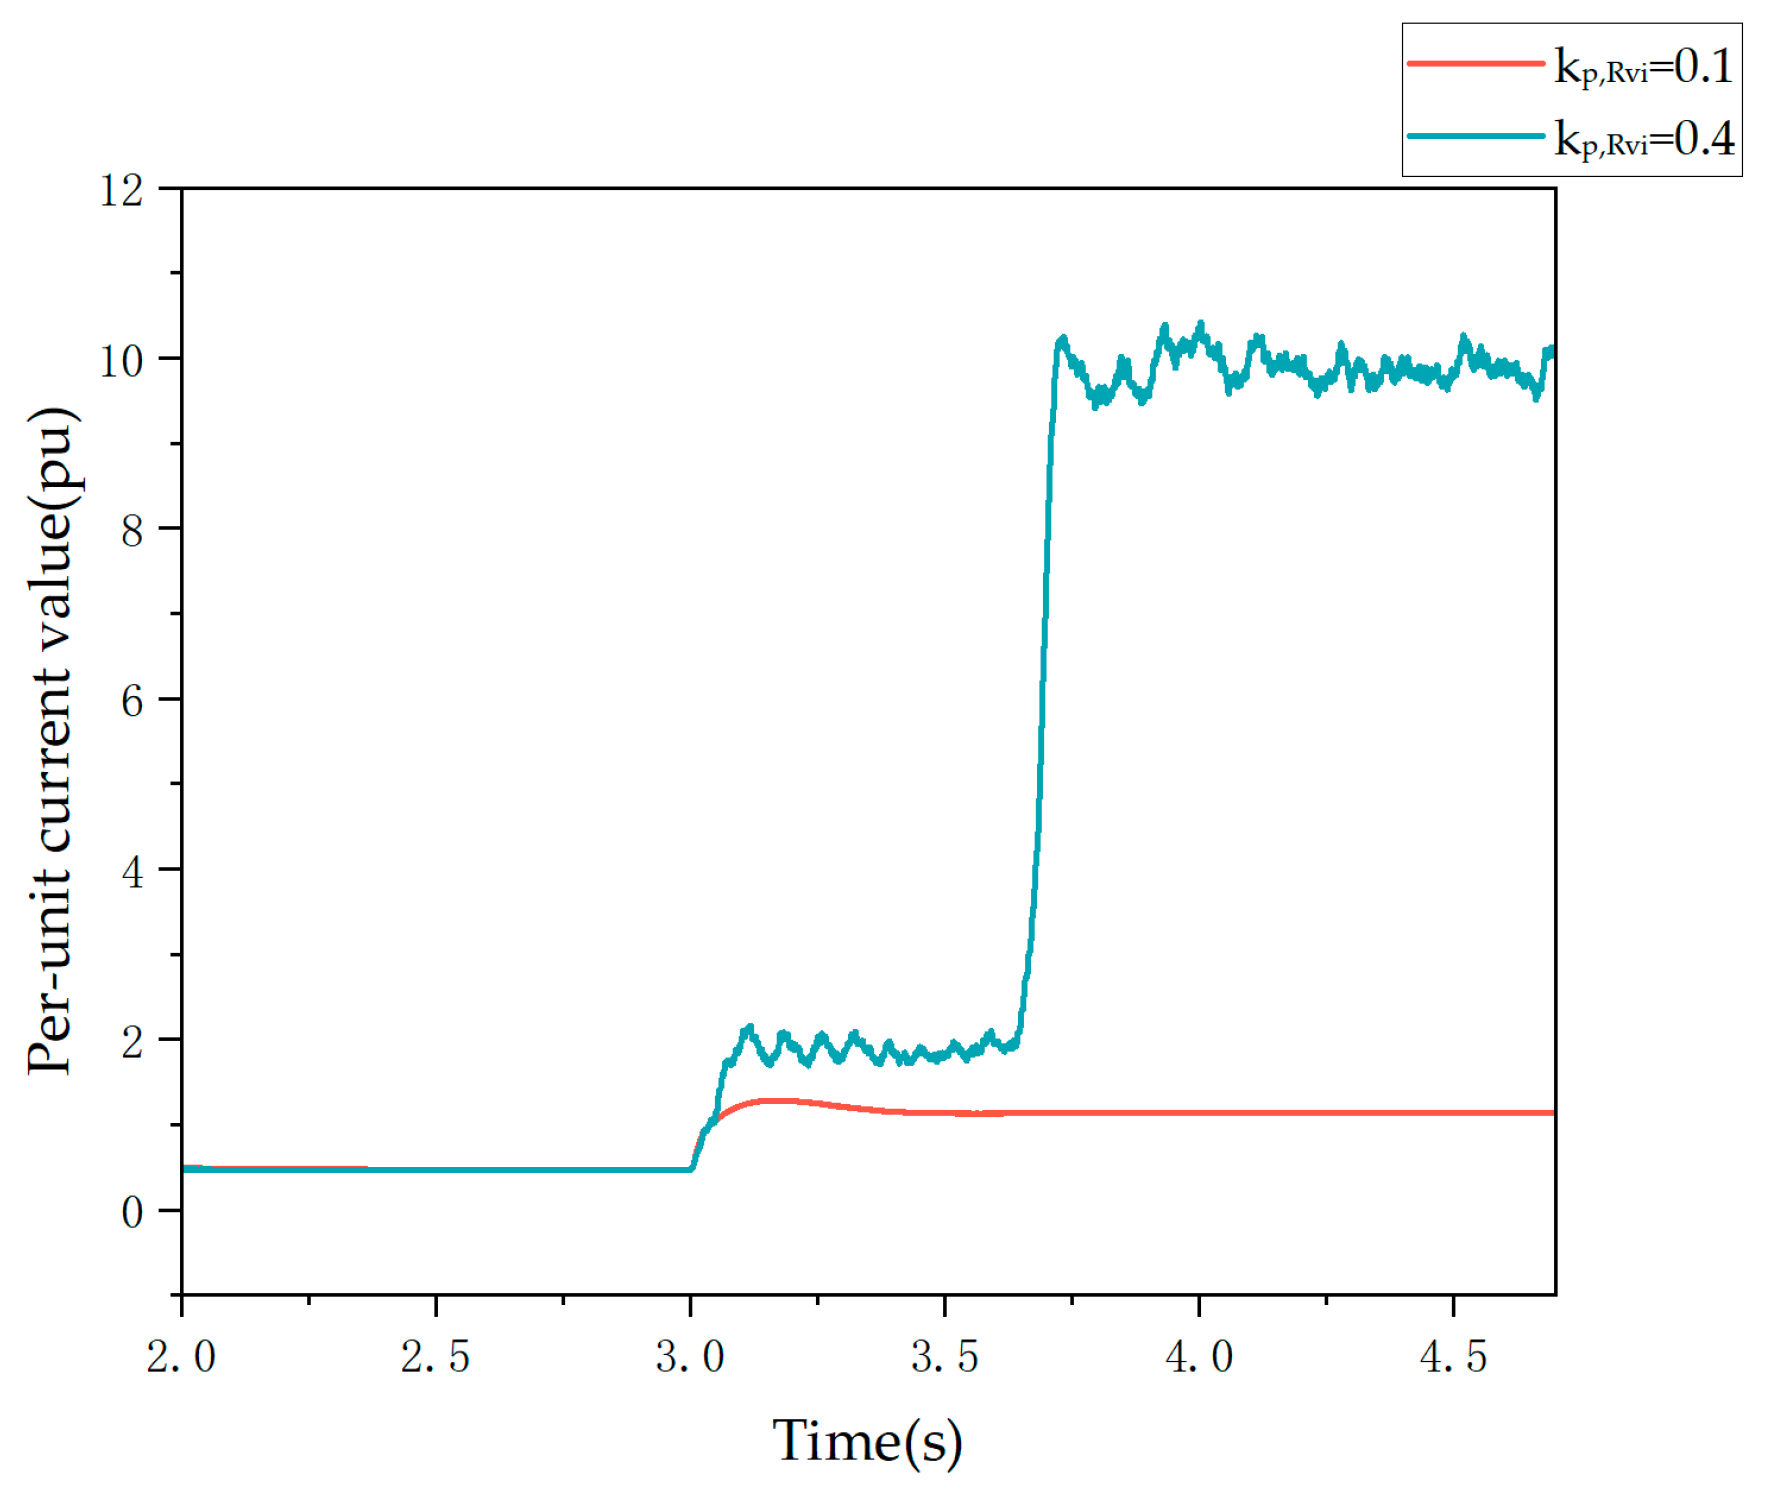
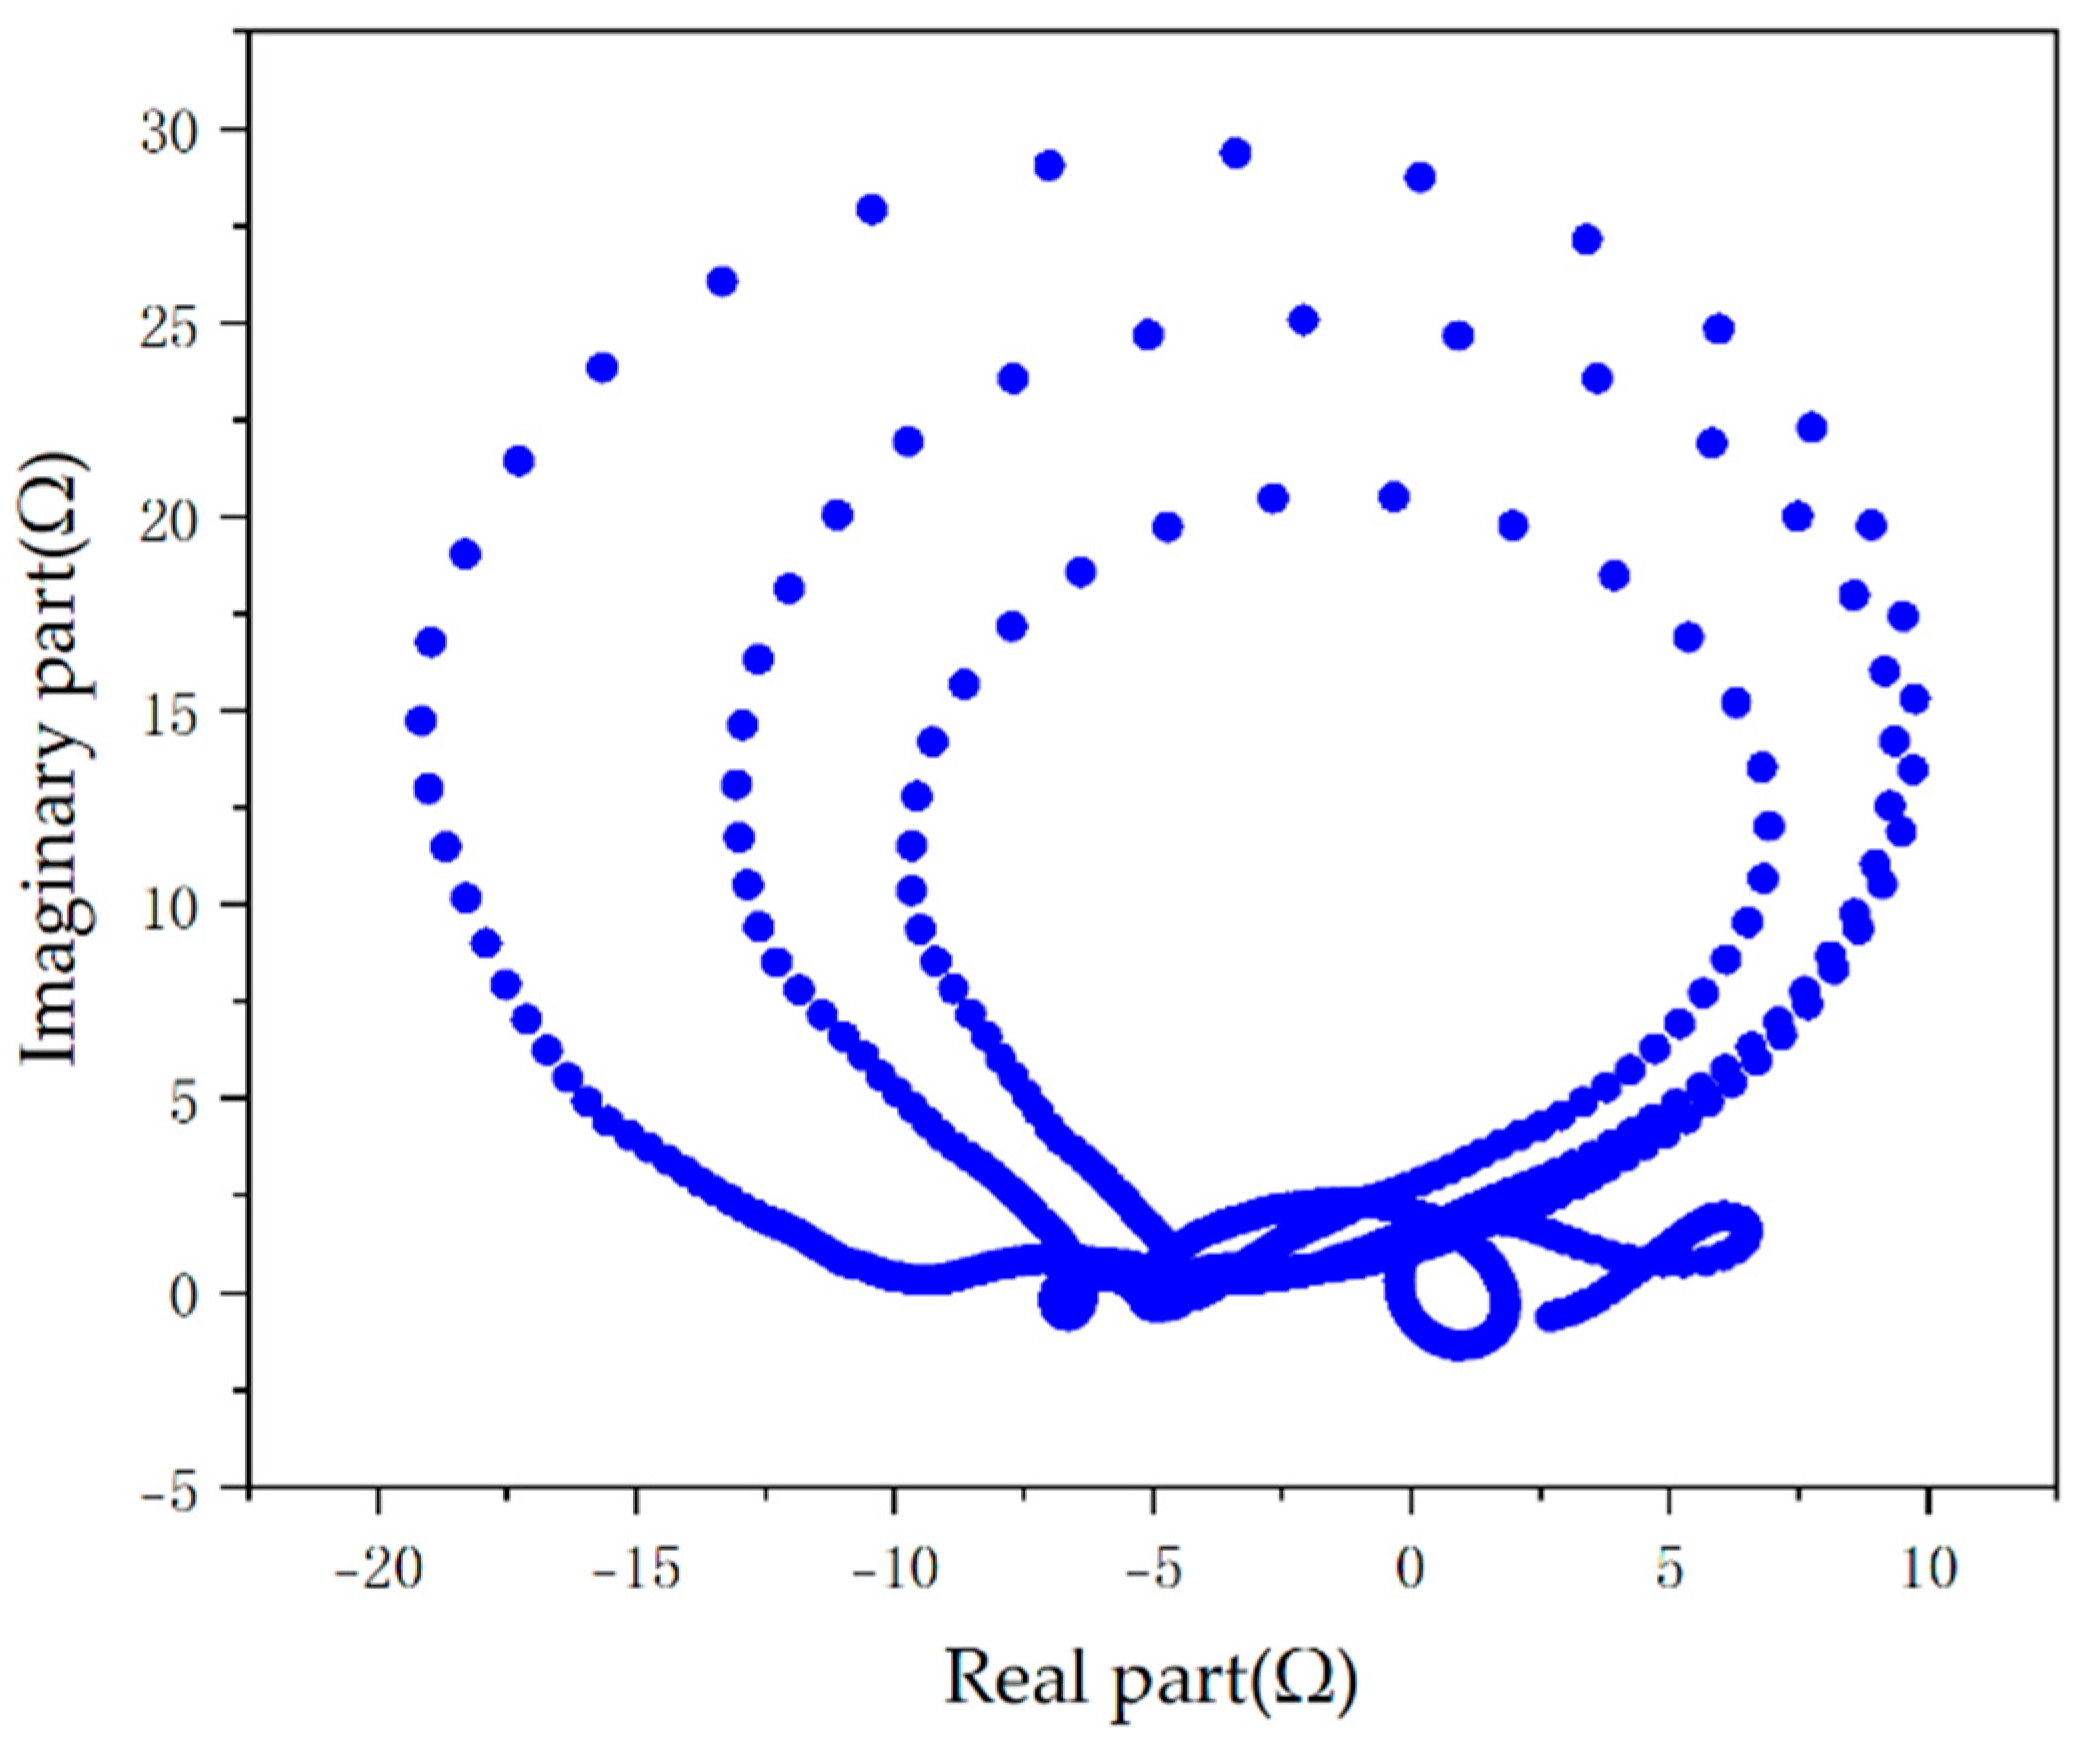
  • Nonlinear impedance. Under the virtual impedance strategy, the adaptively varying virtual impedance value implies that the power source side is no longer a linear impedance. The operation of protection devices will be affected by the Thevenin equivalent issue of the backside power source.
  • Frequency offset. The switching strategy, due to the lag effect of the PLL tracking the abrupt phase angle and the PI regulation, can cause the problem of the system frequency deviating from the power frequency.
For the sake of simplicity in calculation, it is assumed that the phasor value of the line current at the fundamental frequency is represented by Equation (13).
i 1 = I 1 s i n ω 1 t + φ 1
In traditional relay protection, the number of samples per cycle at the fundamental frequency is N, and the sampling frequency is a fixed value. Due to the influence of its fault characteristics, the fault signal frequency of grid-forming converters deviates from the power frequency. As a result, the number of samples within one cycle is no longer N, which significantly affects traditional protection devices.
Assume the expression for the non-power frequency sinusoidal current signal is represented by Equation (14).
i ( t ) = s i n μ ω 1 t + φ
In the equation, μ = ω / ω 1 is referred to as the signal frequency offset coefficient; ω represents the actual frequency; ω 1 is the angular frequency of the fundamental component of the current.
Using the full-cycle Fourier algorithm, the amplitude and phase angle of the fundamental frequency phasor in Equation (14) are given by Equation (15).
I = 2 s i n ( ω T ) ω 1 T ( 1 λ 2 ) × ( μ 2 + 1 ) ( μ 2 1 ) c o s [ 2 ( φ 0 + 2 n ω T N ) ] I = t g 1 [ μ tan ( φ 0 + 2 n ω T N ) ] .
In the equation, φ 0 represents the phase angle of the initial sampling point.
From the equation, it can be seen that when the signal frequency offset coefficient μ is not equal to 1, the amplitude and phase angle of the fundamental frequency phasor extracted using the Fourier power frequency algorithm are variables, fluctuating according to certain patterns.
Compared to the switching strategy, the virtual impedance strategy can improve the frequency offset characteristics. At the initial moment of a fault, the fault control strategy introduces virtual transient impedance. After entering the fault steady state and once the high-frequency components have decayed completely, the transient impedance becomes zero, which helps to mitigate the impact of frequency offset.

3. The Impact of Grid-Forming Converters on Relay Protection

3.1. Overcurrent Protection

Overcurrent protection relies on the characteristic that short-circuit currents are greater than normal operating currents. It achieves fault detection by monitoring the magnitude of currents in each line.
The setting value of the traditional overcurrent protection Zone I is shown in Equation (16).
I D Z I = K k I d m a x ( 3 )
In the equation, K k is the reliability factor, taken as 1.3; I d m a x ( 3 ) is the maximum three-phase short-circuit current at the end of the line.
New energy sources are connected to the grid through grid-forming converters. Influenced by the fault control strategy, the maximum fault current is 1.2 times the rated current [13]. Consequently, in the event of a three-phase fault within a certain range near the protection installation, the fault current is 1.2 times the rated current, rendering I d m a x ( 3 ) practically meaningless. The characteristic curve of the time-limited overcurrent protection is approximately a straight line; hence, the Overcurrent Protection Zone I cannot function properly. The Overcurrent Protection Zone II, which is coordinated with Zone I, also fails to operate normally. The Overcurrent Protection Zone III can serve as a backup protection through its operating delay, but it also faces the issue of insufficient sensitivity [19].
When new energy sources are connected to the grid, to prevent power electronic devices from being damaged due to overheating, their control strategies all include negative sequence suppression and zero sequence suppression [7]. This makes the new energy sources appear as open circuits in the negative and zero sequence networks. Specifically, the negative sequence current suppression control strategy of the grid-connected converter can make the negative sequence loop on the new energy side approximately open, not providing negative sequence current during faults. This situation changes the negative sequence current distribution in the grid, thereby affecting the protection principles based on negative sequence current and voltage to varying degrees.
Moreover, if the effect of zero and negative sequence suppression is unstable [20], it will also bring uncertainty to the distribution of zero and negative sequence currents in the network, thereby affecting the performance of zero and negative sequence protection.
As shown in Figure 8a, in a two-terminal network topology with a new energy source, the built-in negative sequence suppression control strategy on the new energy side blocks the path for negative sequence current flow. This prevents the effective formation of a negative sequence loop. In this scenario, the negative sequence protection device at QF2 lacks sufficient negative sequence current excitation. It struggles to meet the operating threshold conditions. This affects its reliable operation. In contrast, the T-junction network structure shown in Figure 8b provides a new current path for fault currents through the system-side connection. During asymmetrical faults, the system side outputs a significant amount of negative sequence current due to its strong short-circuit capacity. Meanwhile, the negative sequence network on the new energy side exhibits a high-impedance open-circuit state. It is largely unaffected by the control characteristics of the new energy side. Under these conditions, the protection devices QF1 and QF2 can accurately sense changes in fault characteristics. They meet the protection criteria and operate correctly.

3.2. Pilot Protection

Pilot protection is characterized by high sensitivity, strong reliability, strong anti-interference capability, the ability to achieve full-line fast operation, and a wide range of applicability. It can quickly and accurately determine the fault section, thereby isolating the faulty part rapidly in the event of a fault to ensure the stable operation of the power grid. A common transient direction criterion is shown in Equation (17).
Positive   Direction :   270 ° > arg Δ U ˙ Z r Δ I ˙ > 90 ° Negative   Direction :   90 ° > a r g Δ U ˙ Z r Δ I ˙ > 90 °
In the formula, Z r represents the positive-sequence, negative-sequence, and zero-sequence simulated impedances in the positive-sequence fault component, negative-sequence, and zero-sequence direction criteria. Δ U ˙ represents the positive-sequence sudden change, negative-sequence, and zero-sequence voltages. Δ I ˙ represents the positive-sequence sudden change, negative-sequence, and zero-sequence currents.
Pilot protection measures fundamental frequency components, which are computed in real time using the full-cycle Fourier algorithm. This algorithm effectively filters and mitigates the impact of decaying DC components during faults. However, fault waveforms often exhibit non-power frequency characteristics, and frequency offsets can cause traditional calculation methods to yield current phasors that fail to accurately represent the true fault features. Consequently, this results in significant errors in the directional element calculations, specifically in a r g Δ U ˙ Z r Δ I ˙ , which can lead to protection failure or misoperation, thereby compromising the reliability of the protection system. Taking the practical application scenario of the switching strategy as an example, the spectrum is obtained by performing spectral analysis on the system signal using the Fourier algorithm, as shown in Figure 9. The analysis reveals that among the various frequency components, the 55.11 Hz component has the highest proportion, indicating a significant frequency offset compared to the standard 50 Hz power frequency. This abnormal offset directly interferes with the accuracy of protection algorithms designed based on power frequency quantities. When analyzing the fault at the beginning of the line, the angle range of A after the fault is calculated using the Fourier algorithm, and the results show that it falls within the interval of −179° to −178° (see Figure 10). The operating criterion of the pilot directional protection requires that this angle meet specific conditions to trigger the protection action when a fault occurs in the positive direction. Due to the frequency offset causing deviations in the calculated results, the angle range of A fails to meet the operating criterion for a fault in the positive direction. This ultimately leads to the potential failure of the pilot directional protection to operate, severely affecting the rapid response and reliable isolation of faults in the power system.

3.3. Distance Protection

Distance protection determines whether a fault occurs within the protection zone by measuring the impedance ( Z m ) from the protection installation location to the short-circuit point. It compares the measured impedance with the preset setting impedance using methods such as compensation, polarization quantities, and parameter estimation.
As shown in Figure 11, Z M and Z N represent the impedance values measured by the distance relays located on the grid side and the new energy side, respectively. In actual power system operation, the occurrence of a short-circuit fault typically involves the generation of transition resistance. Taking a fault on a transmission line as an example, the measured impedances detected by the distance relays on the renewable energy side and the system side are given by Equations (18) and (19), respectively.
Z M = Z M K + 1 + I ˙ N A I ˙ M A R g
Z N = Z N K + 1 + I ˙ M A I ˙ N A R g
From Equation (19), the characteristic of limited fault current amplitude I ˙ N A means that the transition resistance has a smaller impact on the measured impedance on the system side. When a fault occurs within the protection zone, the probability of the system-side distance protection failing to operate is reduced. For Equation (18), since the magnitude of I ˙ M A / I ˙ N A is very large, the additional impedance value ( 1 + I ˙ M A / I ˙ N A ) R g on the N side is also very large. The nature of the additional impedance is determined by the phase angle of I ˙ M A / I ˙ N A . Under the switching strategy, the phase angle of the short-circuit current on the new energy side is controlled and time-varying. Hence, the phase angle of I ˙ M A / I ˙ N A may vary between 0° and 360°. When the phase angle of I ˙ M A / I ˙ N A is between 0° and 180°, the additional impedance manifests as a large inductive impedance, making the renewable energy side distance protection prone to fail to operate when a fault occurs within the protection zone; when the phase angle of I ˙ M A / I ˙ N A is between 180° and 360°, the additional impedance manifests as a large capacitive impedance, making the renewable energy side distance protection prone to malfunction when a fault occurs outside the protection zone [21].
Moreover, recent studies have shown that the fault control strategies of grid-forming converters have a significant impact on the performance of distance protection. For example, when a fault control strategy based on virtual impedance is employed, distance protection demonstrates better performance in fault phase selection, accurate impedance measurement, and stability of impedance measurement [19,22,23,24]. This indicates that the virtual impedance strategy has advantages in maintaining the performance of distance protection.
However, for power frequency fault component distance protection, the working voltage is given by Equation (20).
Δ U ˙ o p = Δ I ˙ ( Z s + Z s e t )
where Z s e t is the setting impedance of the protection, and Z s is the impedance of the backside system. When a fault occurs in the new energy source, a virtual impedance is added. Let R 0 + j ω 1 L 0 be the impedance of the new energy source during normal operation, and the virtual impedance added during a fault is given by Equation (7). With the presence of frequency offset characteristics, the backside impedance during a fault is shown in Equation (21).
Z S = ( R 0 + R V I ) + j ( μ ω 1 L 0 + ω L V I )
The virtual impedance acts as a nonlinear impedance for 1–3 cycles after a fault occurs, affecting the accurate calculation of Z S and thereby influencing the correctness of the power frequency fault component distance protection. The system-equivalent impedance Z S , solved based on the Fourier algorithm, exhibits significant time-varying characteristics within the first 1–2 cycles after a fault. As shown in Figure 12, the impedance trajectory is in a dynamic evolution process, making it difficult to precisely define the operating characteristics of the power-frequency fault component distance protection. From the perspective of protection principles, the measured impedance is influenced by both the transition resistance and the fault location. When the transition resistance is high or the fault point is near the boundary of the protection range, the measured impedance may distort and fall outside the protection operating zone, causing the protection to fail to operate. Conversely, if the combination of transition resistance and fault location causes the measured impedance to shift into the operating zone, it will trigger a false operation of the protection. This uncertainty seriously threatens the reliability and selectivity of distance protection actions.
Additionally, due to the frequency offset characteristics, the accuracy of phasor calculations is compromised, which also significantly impacts distance protection. Similarly, the reliability of directional elements based on transient direction criteria is greatly affected. Reference [25] analyzed the impact of grid-forming converters on distance protection elements, noting that frequency deviations during faults can significantly affect the performance of protection schemes. Their work underscores the need to address frequency offset issues in fault control strategies.

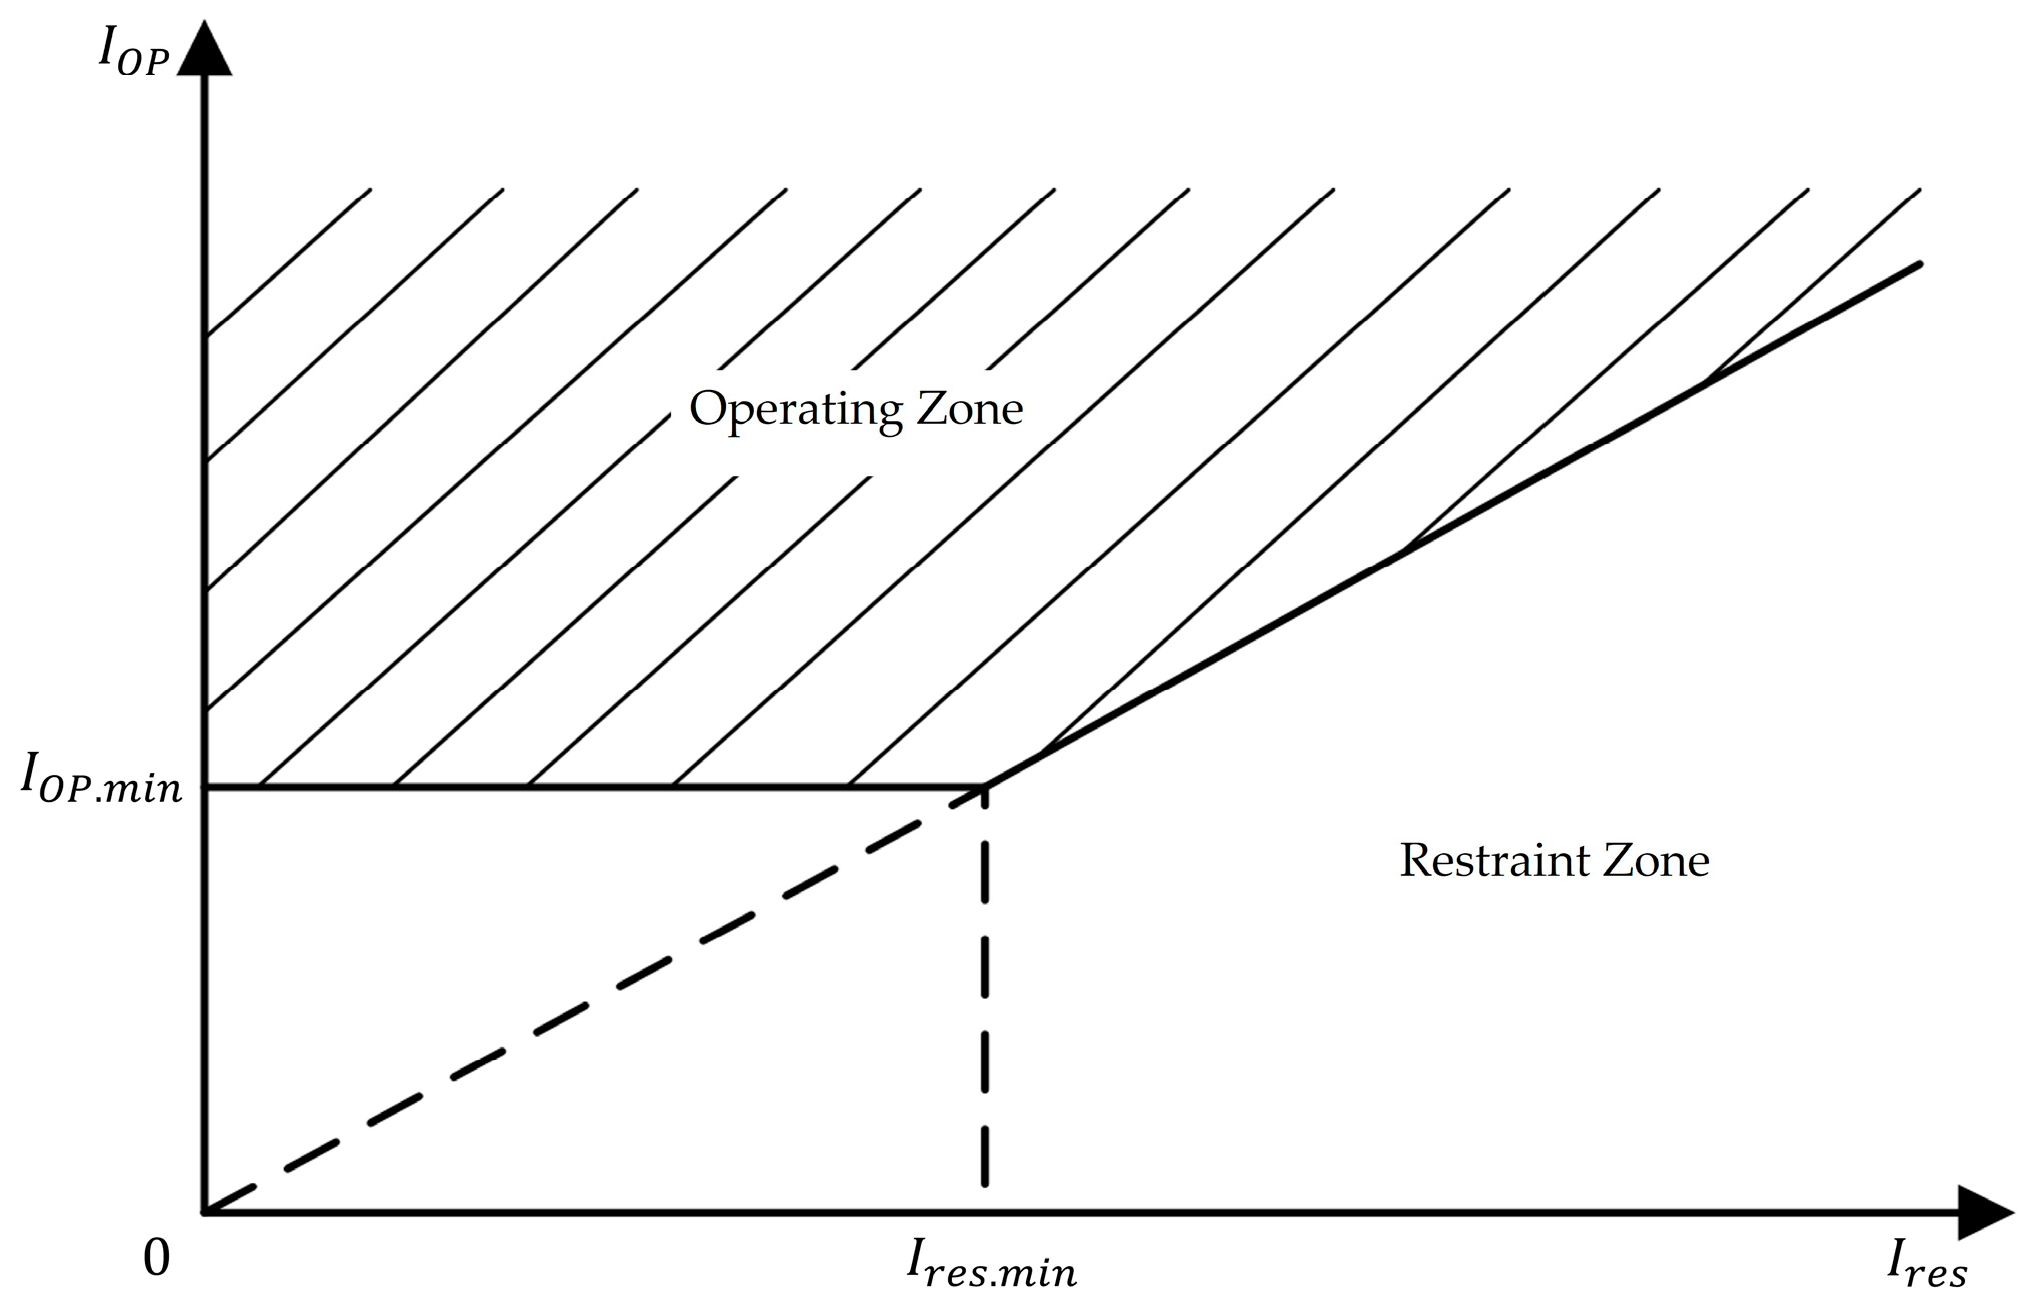
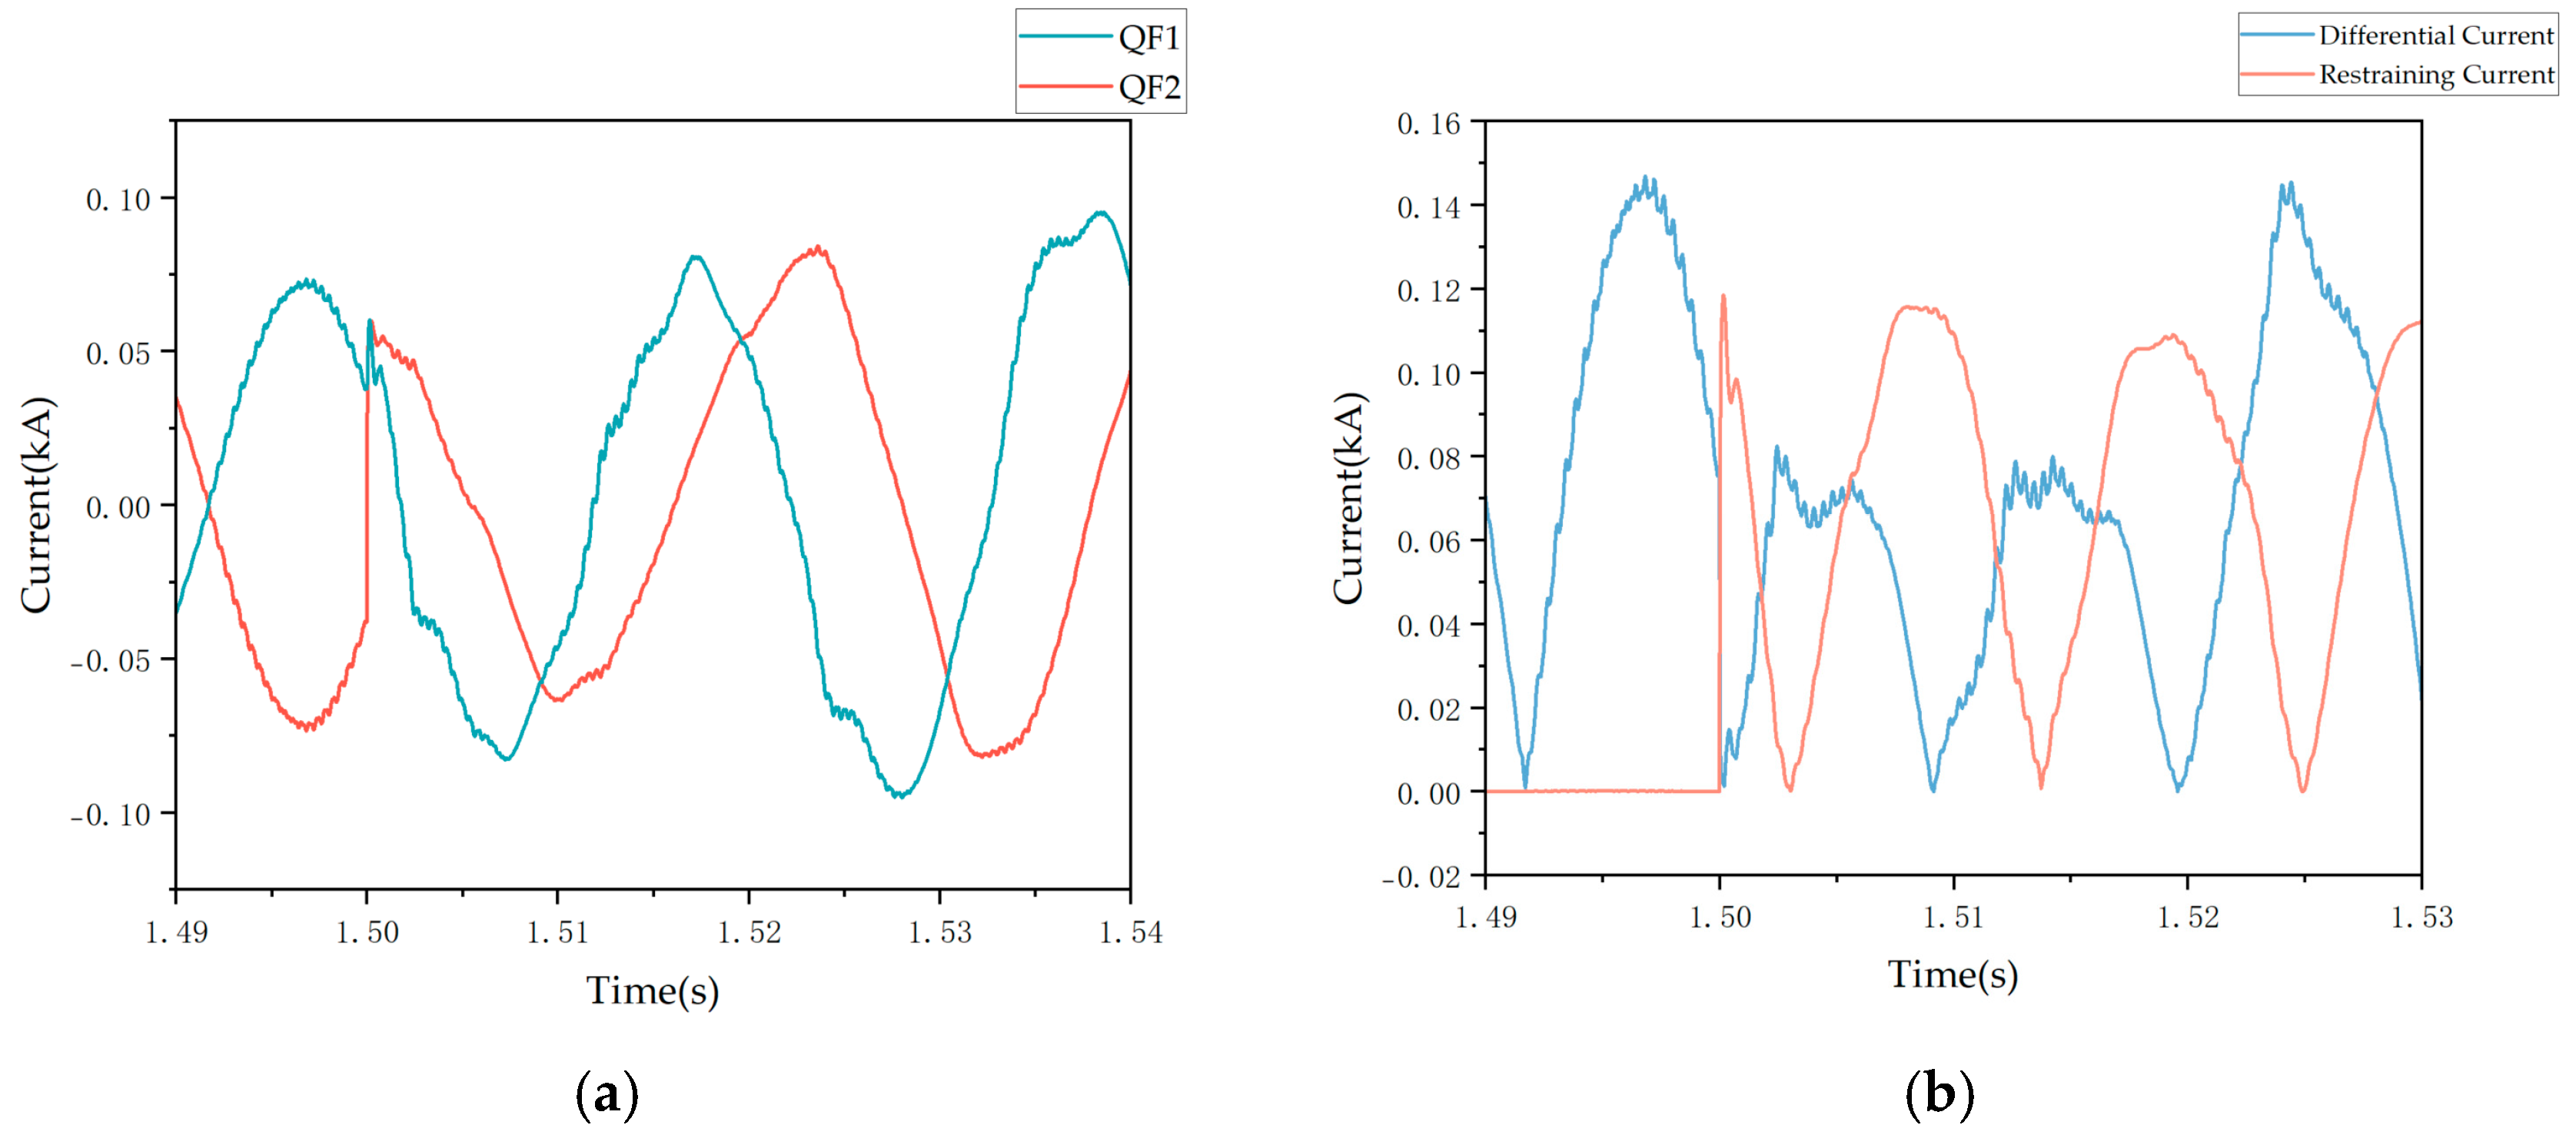
3.4. Differential Protection

When line MN is operating normally or when a short circuit occurs outside the protected line, the magnitudes of the currents on both sides are equal, and their directions are opposite, satisfying the condition I ˙ M + I ˙ N = 0 . When a short circuit occurs inside the line, the fault currents flowing through both sides of the transmission line are in the positive direction, and I ˙ M + I ˙ N = I ˙ D (where I ˙ D is the short-circuit current). Utilizing the characteristic that the currents on both sides are almost in phase during an internal short circuit and almost out of phase during an external short circuit, the phase difference of the currents on both sides can be compared to form a current phase comparison differential protection. The typical protection criterion is shown in Equation (22).
I ˙ m + I ˙ n K I ˙ m I ˙ n I ˙ m + I ˙ n I o p 0
In the equation, K is the restraining coefficient, which can be chosen between 0 and 1; I o p 0 is a very small threshold value used to overcome the influence of measurement errors and other factors. The differential restraining characteristic is illustrated in Figure 13.
After a fault occurs, the new energy side will employ a switching current-limiting control strategy to restrict the fault current to below 1.2 times the rated current. However, this action can cause the short-circuit current to decrease, potentially falling below the differential threshold value, which leads to insufficient sensitivity of the differential protection. This, in turn, affects the rapid and accurate detection and removal of faults, which is detrimental to the stable operation of the power system. Moreover, the differential threshold setting is determined by sensor measurement errors and cannot be further reduced.
Furthermore, in the initial stage of a fault, the phase of the fault current is affected by the PLL and PI control. The diversity of fault types and differences in fault locations can lead to varying degrees of voltage drop at the point of common coupling, thereby causing corresponding changes in the magnitudes of the d-axis and q-axis components. Particularly in the very beginning of a fault, these complex changes can lead to instability in the phase of the fault current. Traditional phasor differential protection, which uses the Fourier algorithm to calculate the currents on both sides, is similarly affected by frequency offset.
After the virtual impedance control strategy is activated, during the transition phase, the relationship between voltage and current at the point of common coupling becomes nonlinear, distinct from when the virtual impedance is not used. This particular nonlinear relationship increases the risk of incorrect operation of current differential protection following the activation of virtual impedance control [11].
As shown in Figure 14, when Load 1 is operating under heavy load conditions, the system operating current is already at a high level. Under these conditions, if an internal fault occurs, the increment of the fault current will be “diluted” by the presence of the heavy load current. Specifically, the current flowing through QF2 during the fault, compared to the heavy load current under normal operation, has a limited change in magnitude. This results in the fault current detected by QF1 and QF2 being similar in value, making it difficult to form a significant current difference, as shown in Figure 15a. In the working mechanism of differential protection, the relationship between the magnitude of the differential current and the restraining current is the key basis for determining whether to operate. Since the fault currents detected by QF1 and QF2 are similar, the calculated differential current is significantly reduced, while the restraining current remains relatively large. Ultimately, as shown in Figure 15b, the differential current is less than the restraining current, failing to meet the operating condition of the differential protection. This leads to the differential protection device failing to operate, severely affecting the system’s ability to quickly isolate faults.

4. Countermeasures for Relay Protection

4.1. Overcurrent Protection

To adapt overcurrent protection to the fault characteristics of grid-forming converters, corresponding improvements need to be made in protection strategies and design. The limited fault current amplitude and dynamic response characteristics of grid-forming converters differ from those of traditional generators, posing challenges to conventional overcurrent protection. To enhance the adaptability of overcurrent protection in the application of grid-forming converters, the following countermeasures can be adopted:
Given the limited change in fault current amplitude of grid-forming converters, the operating characteristic of time-limited overcurrent protection is a straight line, which results in a loss of selectivity. However, when faults occur at different locations along the line, the fault voltage measured at the protection installation varies. Therefore, a low-voltage element can be introduced to achieve selectivity in protection. Protection is triggered when the fault current exceeds the threshold value. Additionally, the compensated voltage, commonly used in distance protection, can be incorporated. By comparing the phase of the compensated voltage with that of the measured voltage, it is possible to determine whether a fault is within or outside the protected zone.
Inverse-time protection characteristics refer to a type of protection where the operating time of the protection device is inversely related to the magnitude of the fault current. That is, the greater the fault current, the shorter the operating time of the protection device; conversely, the smaller the fault current, the longer the operating time. Consequently, inverse-time overcurrent protection can be used to isolate faults, sacrificing some speed for the sake of correctness in operation. However, most circuit breakers in current power grids use definite-time overcurrent protection. Introducing inverse-time overcurrent protection may lead to difficulties in coordination between upstream and downstream protections. Due to the different operating time characteristics of inverse-time and definite-time overcurrent protections, it may result in a disordered sequence of protection operations, with upstream protection operating before downstream protection, thereby expanding the outage area and affecting the power supply reliability of the power system. Thus, when introducing inverse-time overcurrent protection, it is necessary to fully consider the coordination with existing definite-time overcurrent protections and to carefully design and debug to ensure the coordination and reliability of the entire power system protection.
An adaptive overcurrent protection scheme based on power angle limitation can also be considered to enhance the adaptability and stability of overcurrent protection. This scheme automatically limits the output current during grid faults by constraining the power angle rather than directly limiting the current reference value while maintaining the system’s stability. This method does not require additional fault detection or adjustment of control parameters, making it highly practical and reliable [26].

4.2. Pilot Protection

The virtual impedance does not alter the voltage source characteristics of grid-forming converters. This characteristic allows them to operate without relying on a PLL for phase adjustment, thereby enhancing the system’s independence and stability and improving frequency offset characteristics. Additionally, the virtual impedance includes transient virtual impedance, which is activated when high-frequency components appear in the current. This transient virtual impedance can effectively improve the system’s frequency offset characteristics during faults.
Frequency and voltage are intrinsically and closely linked. By finely adjusting voltage through a virtual impedance, frequency stability can be indirectly enhanced. Furthermore, the introduction of virtual impedance increases the system’s damping. In the operation of a power system, power fluctuations are inevitable. The introduction of virtual impedance increases the system’s damping, which can effectively mitigate frequency oscillations caused by these power fluctuations. When the system experiences load changes or other disturbances, virtual impedance enables a smoother dynamic response, preventing significant frequency fluctuations due to such interferences.

4.3. Distance Protection

The operating characteristic of the positive-sequence voltage polarization and memory voltage polarization measuring elements during a forward fault is an offset circle, which has a much larger diameter. This results in a stronger ability to withstand transition resistance compared to directional impedance, thereby mitigating the impact of the limited fault current amplitude of grid-forming converters. Meanwhile, the operating characteristic of these elements during a reverse fault is a throw-up circle. When considering the effect of transition resistance during a reverse fault, the likelihood of the impedance vector falling into the operating area is also reduced. Therefore, the impact on distance protection with positive-sequence voltage polarization and memory voltage polarization is relatively minor.
Time-domain distance protection can be utilized to quickly clear faults and mitigate the impact of new energy integration on distance protection. Time-domain distance protection is not affected by frequency offset, and the calculation of the measured inductance value using the least squares method can also avoid the influence of ground resistance [27]. Moreover, the protection method based on time-domain analysis proposed by [28] can detect and classify faults by evaluating the match between line voltage and current measurements and the Bergeron equations, and it locates faults through an optimization problem. This method is robust to changes in line parameters and sampling times, effectively addressing the dynamic behavior and fault current limitation issues after the integration of new energy sources.
However, in practical applications, this method is susceptible to harmonics. Filtering, which is inevitably influenced by control loops, including PI regulation, does not yield ideal results, thereby affecting the accuracy of time-domain distance protection.

4.4. Differential Protection
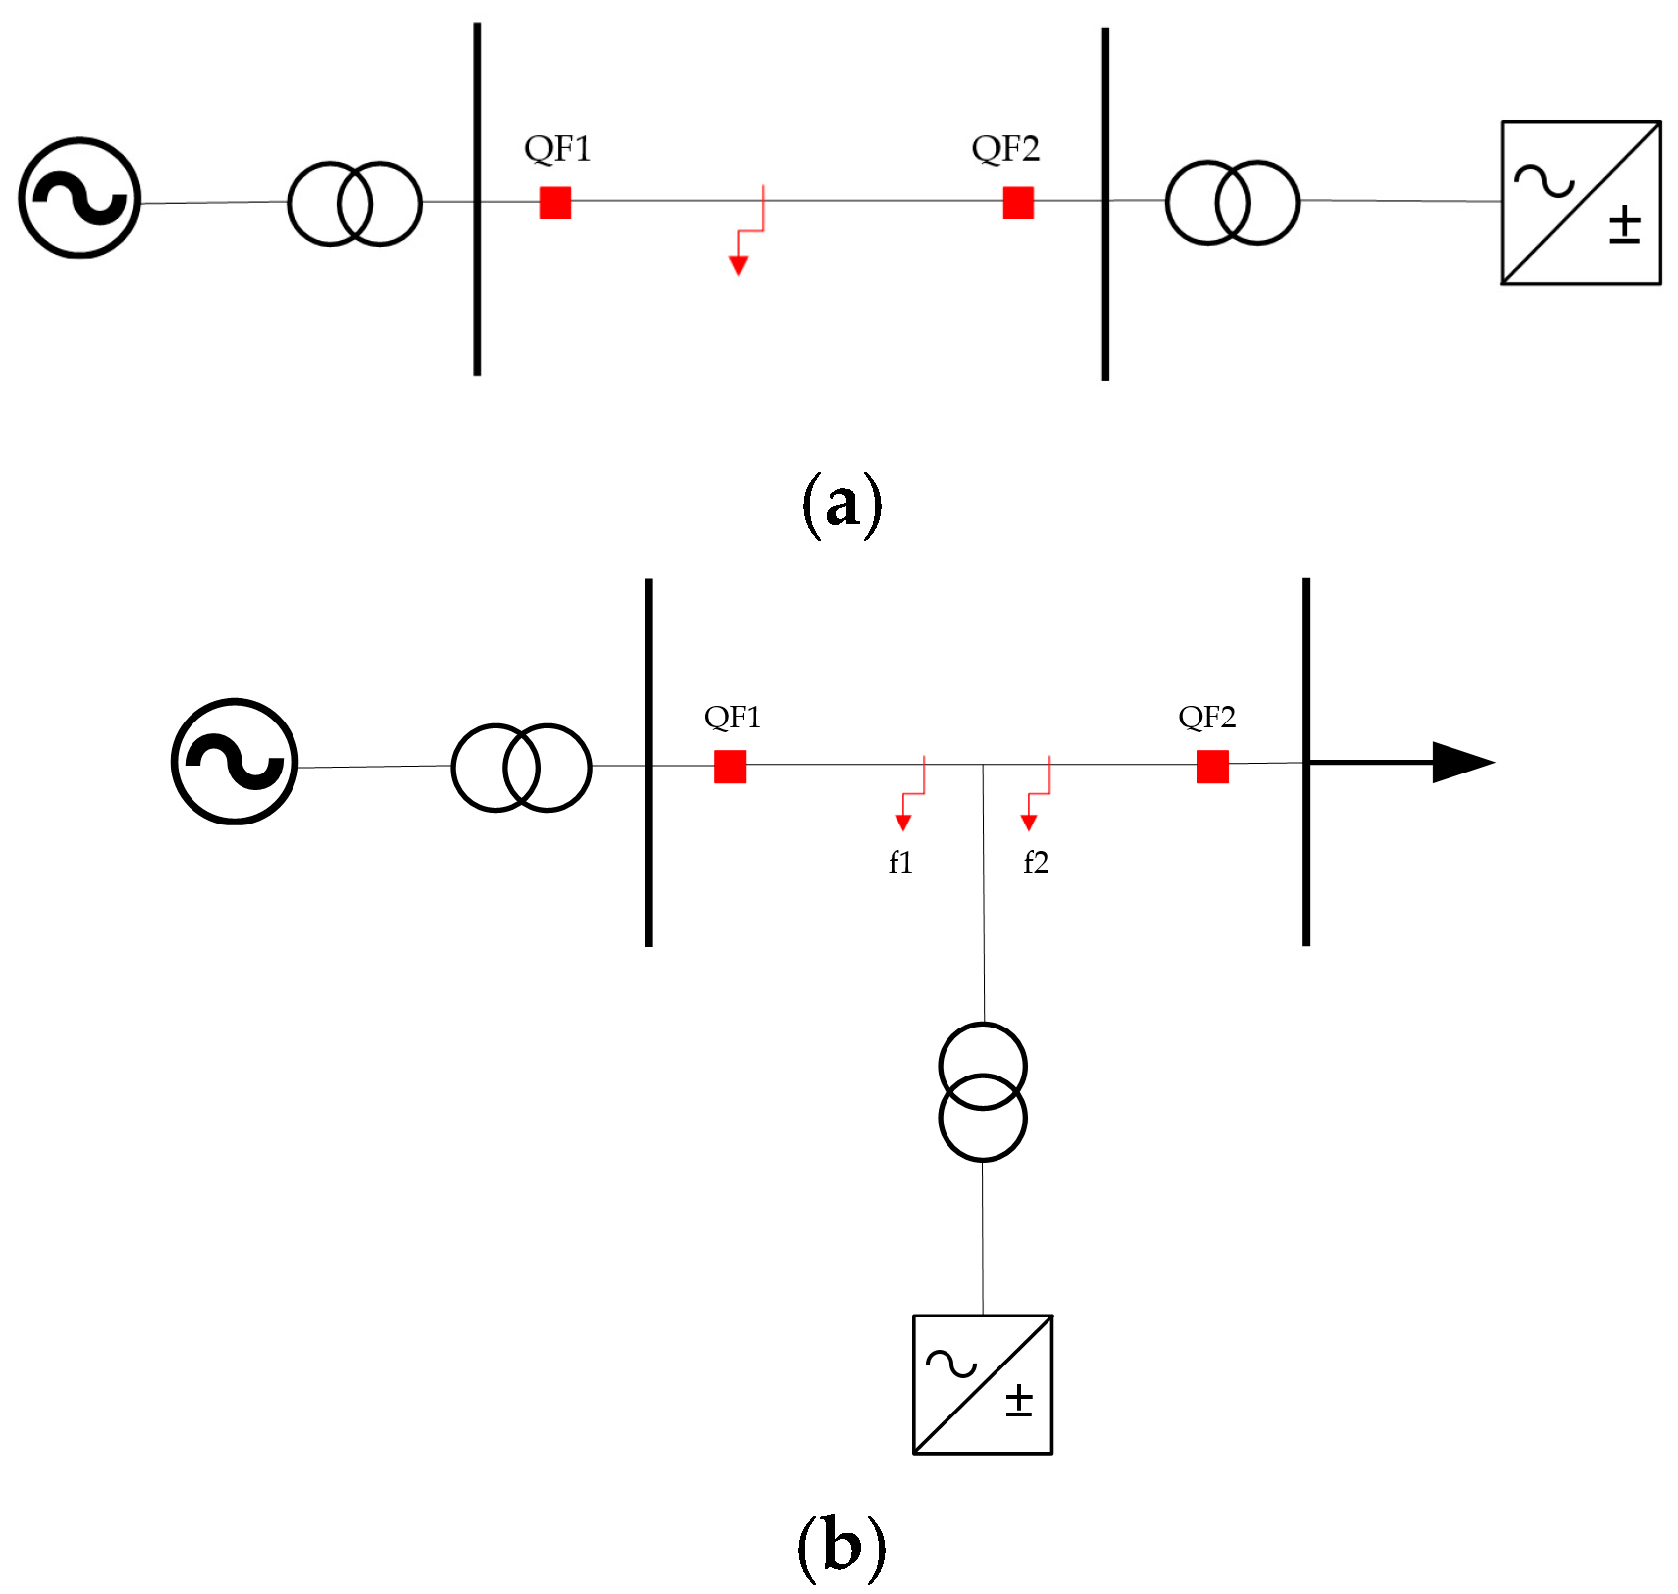
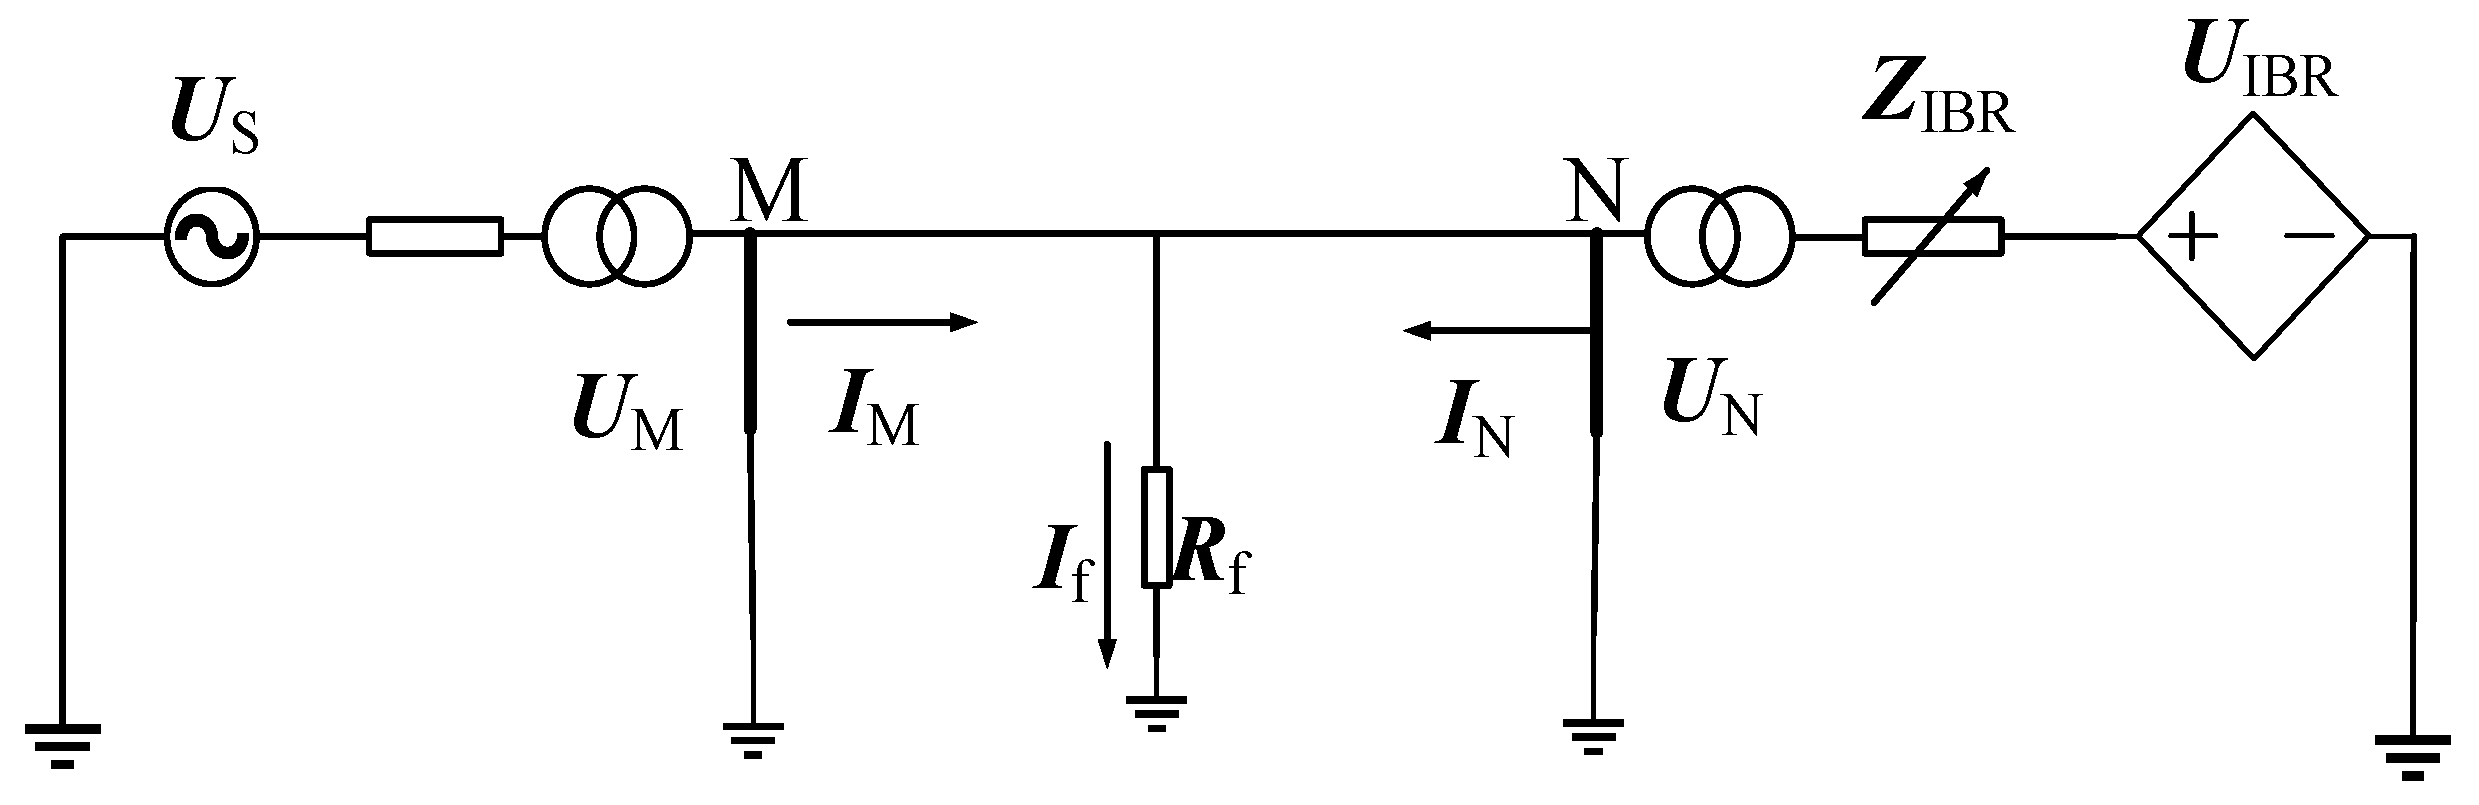
When a grid fault occurs, new energy sources feed currents that exhibit non-power frequency fault characteristics with frequency offset. In common current phasor differential protection, the effective value of the current is calculated using the Fourier algorithm. When the signal frequency is offset, the calculated power frequency phasor amplitude and phase will fluctuate with the initial phase and sampling time and thus cannot accurately reflect the phase relationship of the current. Thus, using sampling values based on time-domain quantities to form differential protection can avoid the influence of frequency offset. However, the selection of sampling points needs to consider the actual situation, and thus, a reasonable sampling method should be chosen. At the same time, there is currently a lack of international standards for small current measurement errors. The setting of the differential current threshold value is based on transformer errors [29], lacking a basis for setting. An adaptive strategy can be considered, which dynamically and intelligently adjusts the threshold value based on real-time operating data and system conditions, thereby compensating for the setting difficulties caused by the lack of international standards and effectively enhancing the precision and reliability of relevant protection and control aspects in the power system.

5. Case Studies

A simulation model of a new energy source connected to the grid through a grid-forming converter, as shown in Figure 16, was built in PSCAD. The simulation parameters are shown in Appendix A, Table A1. The fault characteristics of the grid-forming converter under different fault strategies were verified.

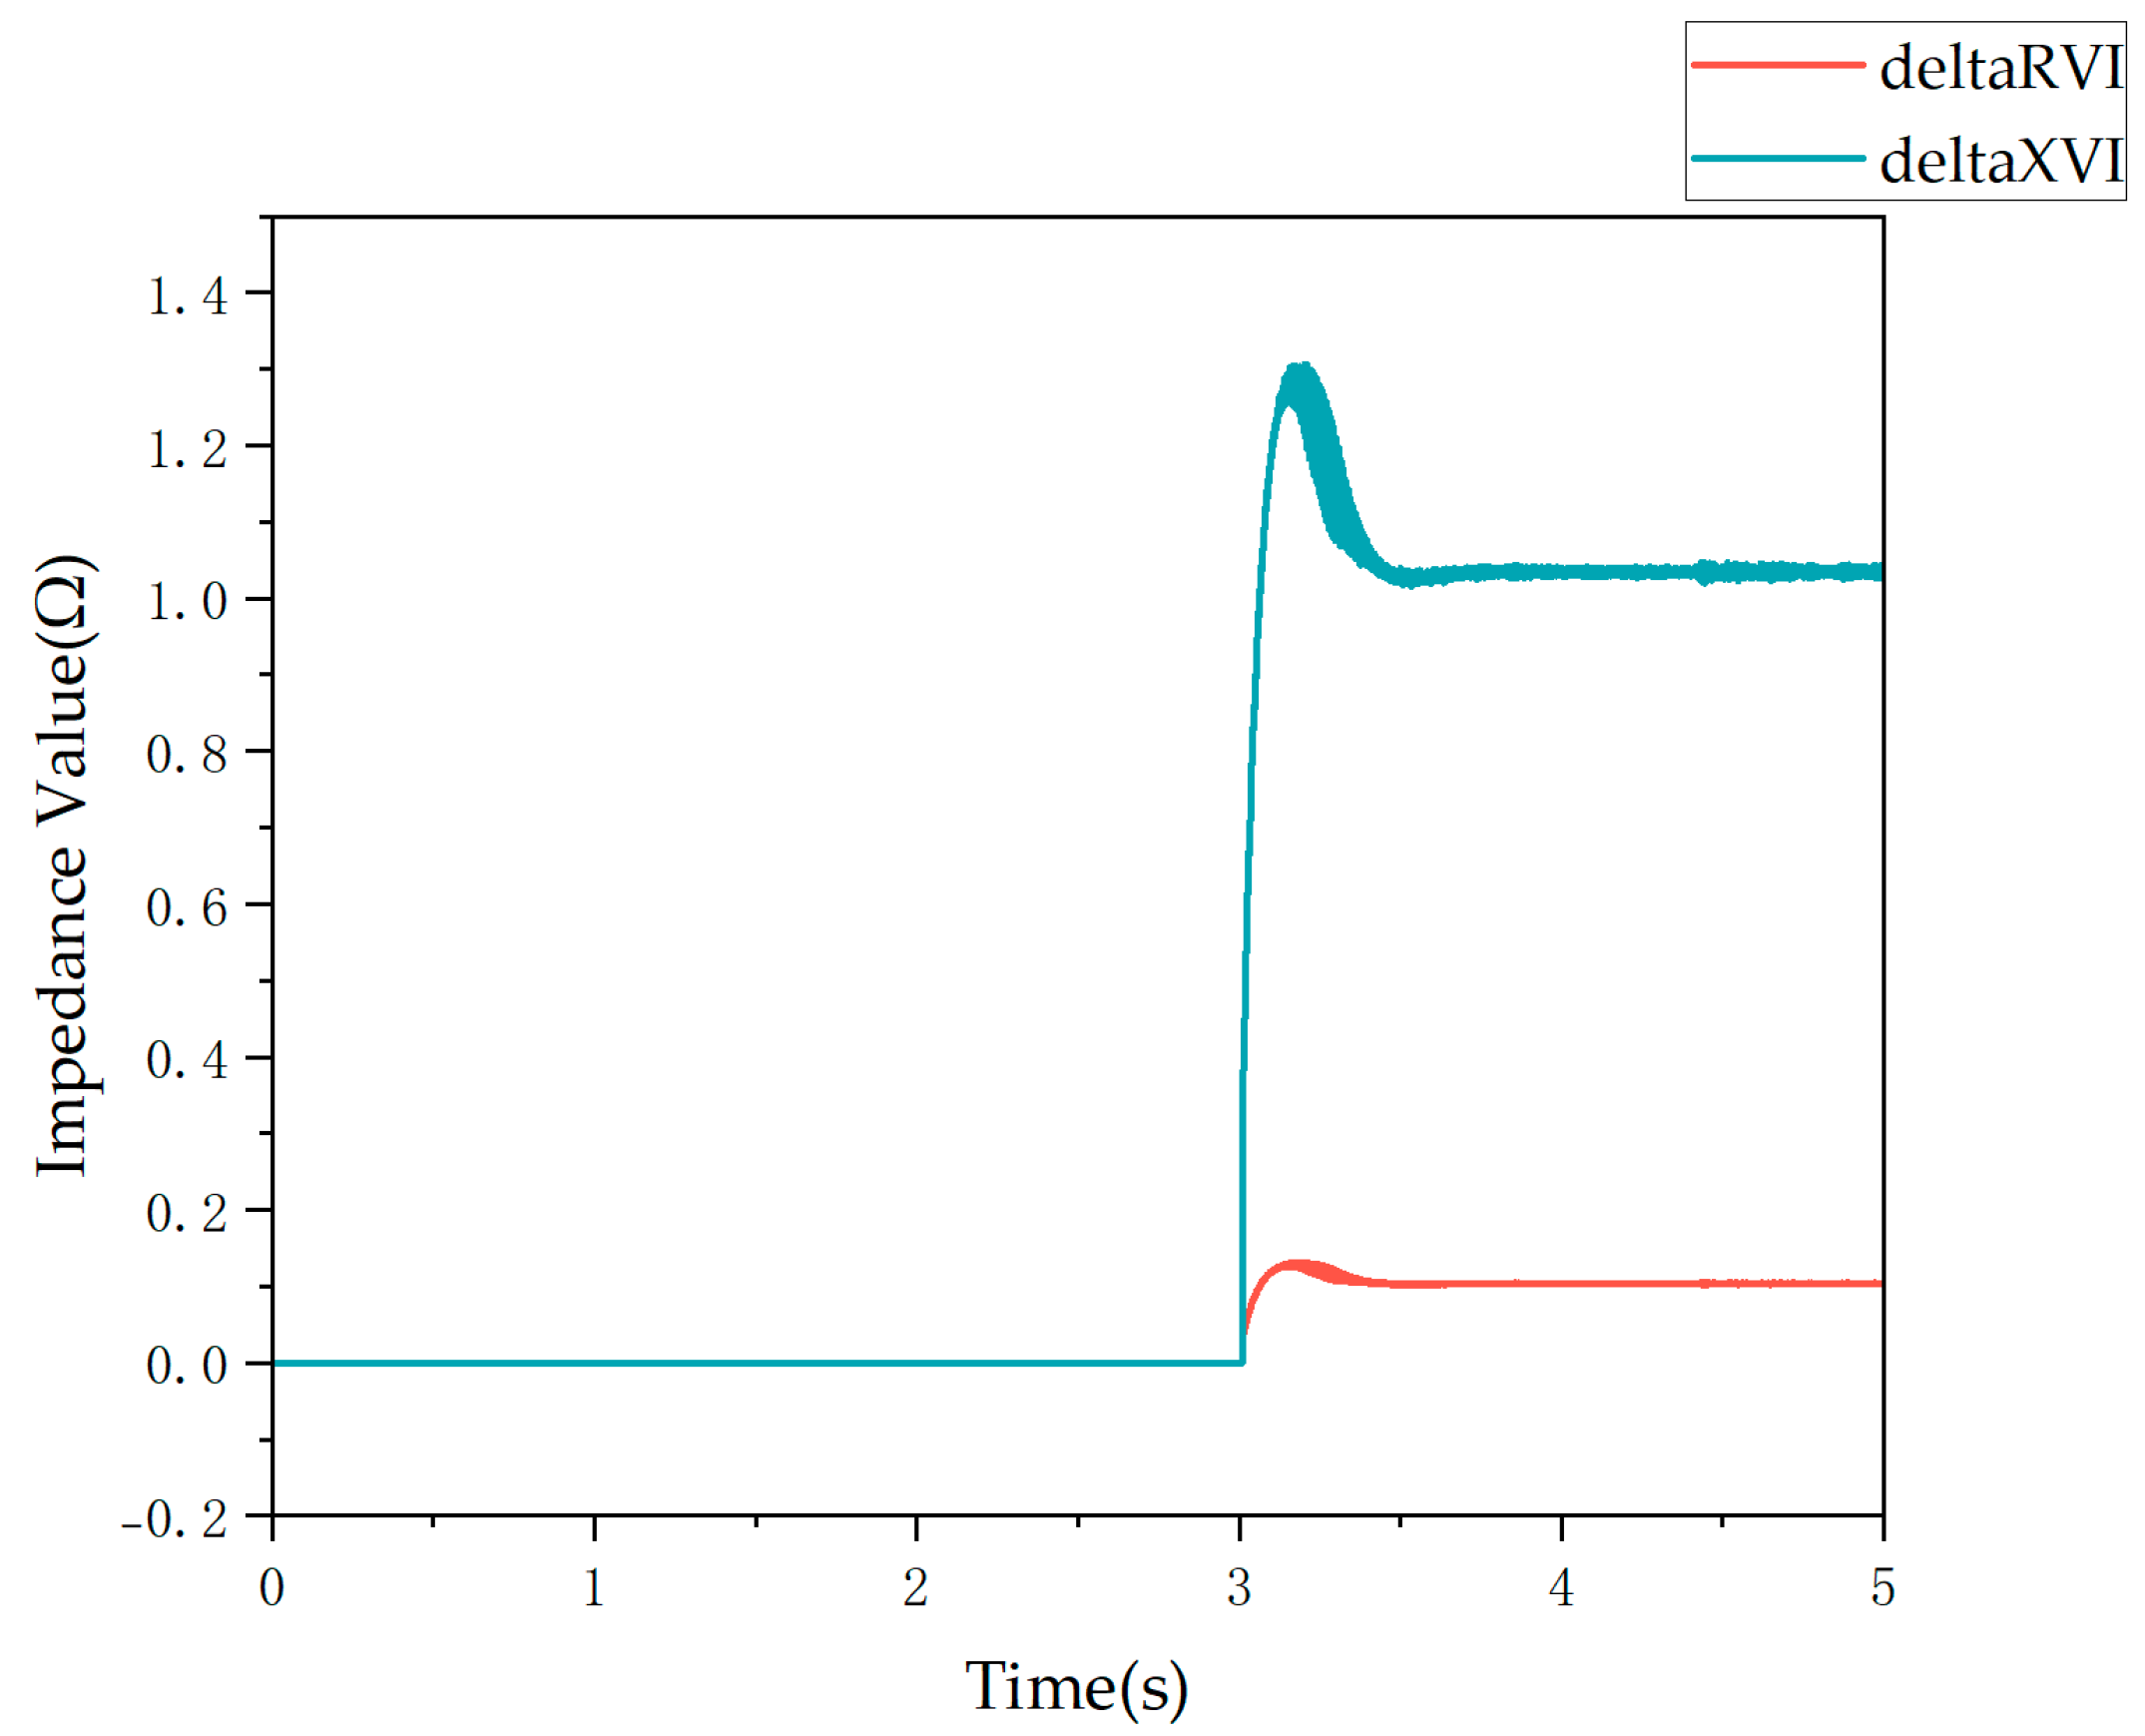
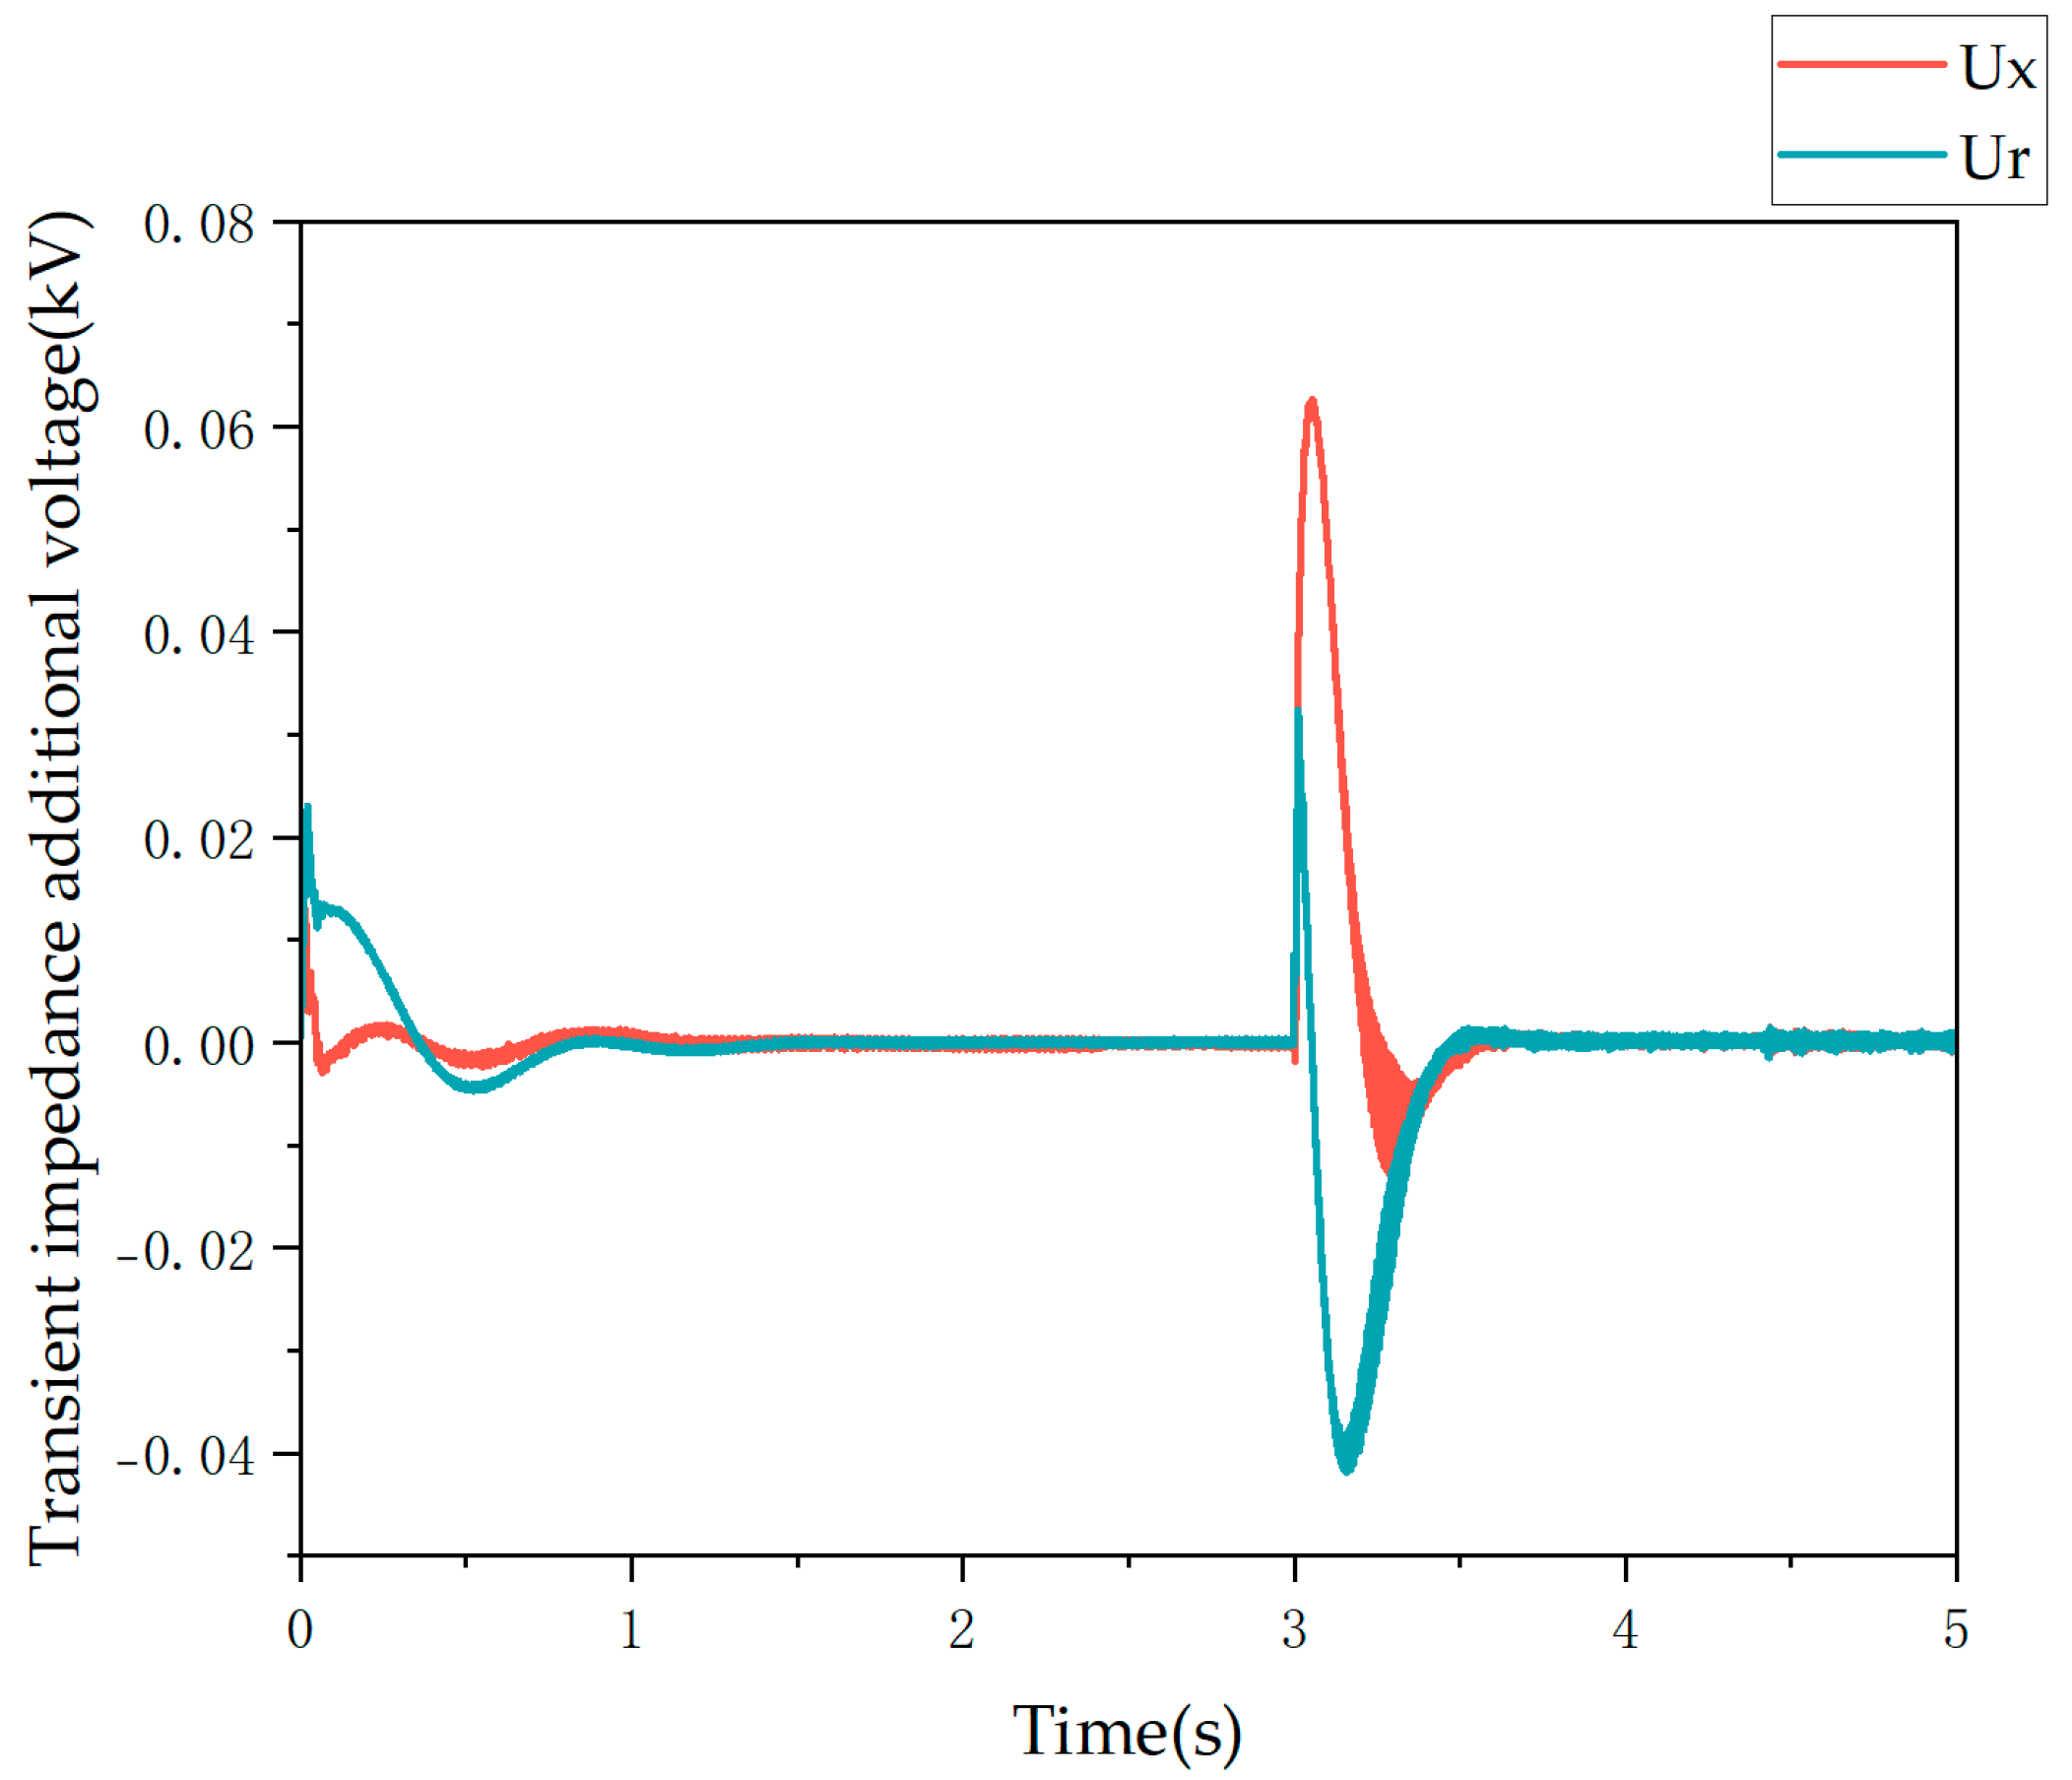
5.1. Nonlinear Impedance

Based on the principle of the virtual impedance strategy introduced in Section 2.2.2, a simulation model for the virtual impedance strategy was built with the following control parameters: I t h r e s h = 1 , R V I 0 = 0.07 , X V I 0 = 0.07 , Δ X / R = 8 , and ω c , h p f = 4 π   r a d / s . At t = 3 s, a three-phase symmetrical fault is introduced at the end of the line. With the converter current limit set at 1.2 per unit [12], the waveforms of the additional virtual resistance and additional virtual reactance can be obtained, as shown in Figure 17.
From Figure 17, it can be seen that the adaptive virtual impedance acts as a nonlinear impedance during the fault period, which affects the use of the superposition theorem and thereby impacts the correctness of the relay protection operation.

5.2. Amplitude Limitation

The effectiveness of different current-limiting strategies was verified by comparing the current waveforms under no control strategy, switching control strategy, and virtual impedance control strategy. A system simulation model was built, with a fault set to occur at the end of the line, a fault resistance value of 0.1 Ω, and a fault occurrence time of t = 3 s. The simulation results are shown in Figure 18.
From the simulation results, it can be seen that both control strategies achieve current-limiting effects. However, under the switching control strategy, the converter current can only be limited to 1.2 pu. This is because, under the switching strategy, the voltage source characteristic of the grid-forming converter changes to a current source characteristic, which can only output a constant current value. Additionally, due to the strategy switch, there is a significant surge current in the grid-forming converter at the moment of fault under the switching strategy. Under the virtual impedance control strategy, the magnitude of the limited current can be adjusted by regulating the current limiting virtual impedance X/R ratio, offering a more flexible strategy adjustment. What’s more, the virtual impedance strategy is equivalent to introducing virtual resistance and reactance when the current deviates from the rated value without changing the voltage source characteristic of the grid-forming converter. There is also no substantive strategy switch, and the introduction of virtual impedance reduces the surge current. Therefore, the current waveform is smoother when a fault occurs.

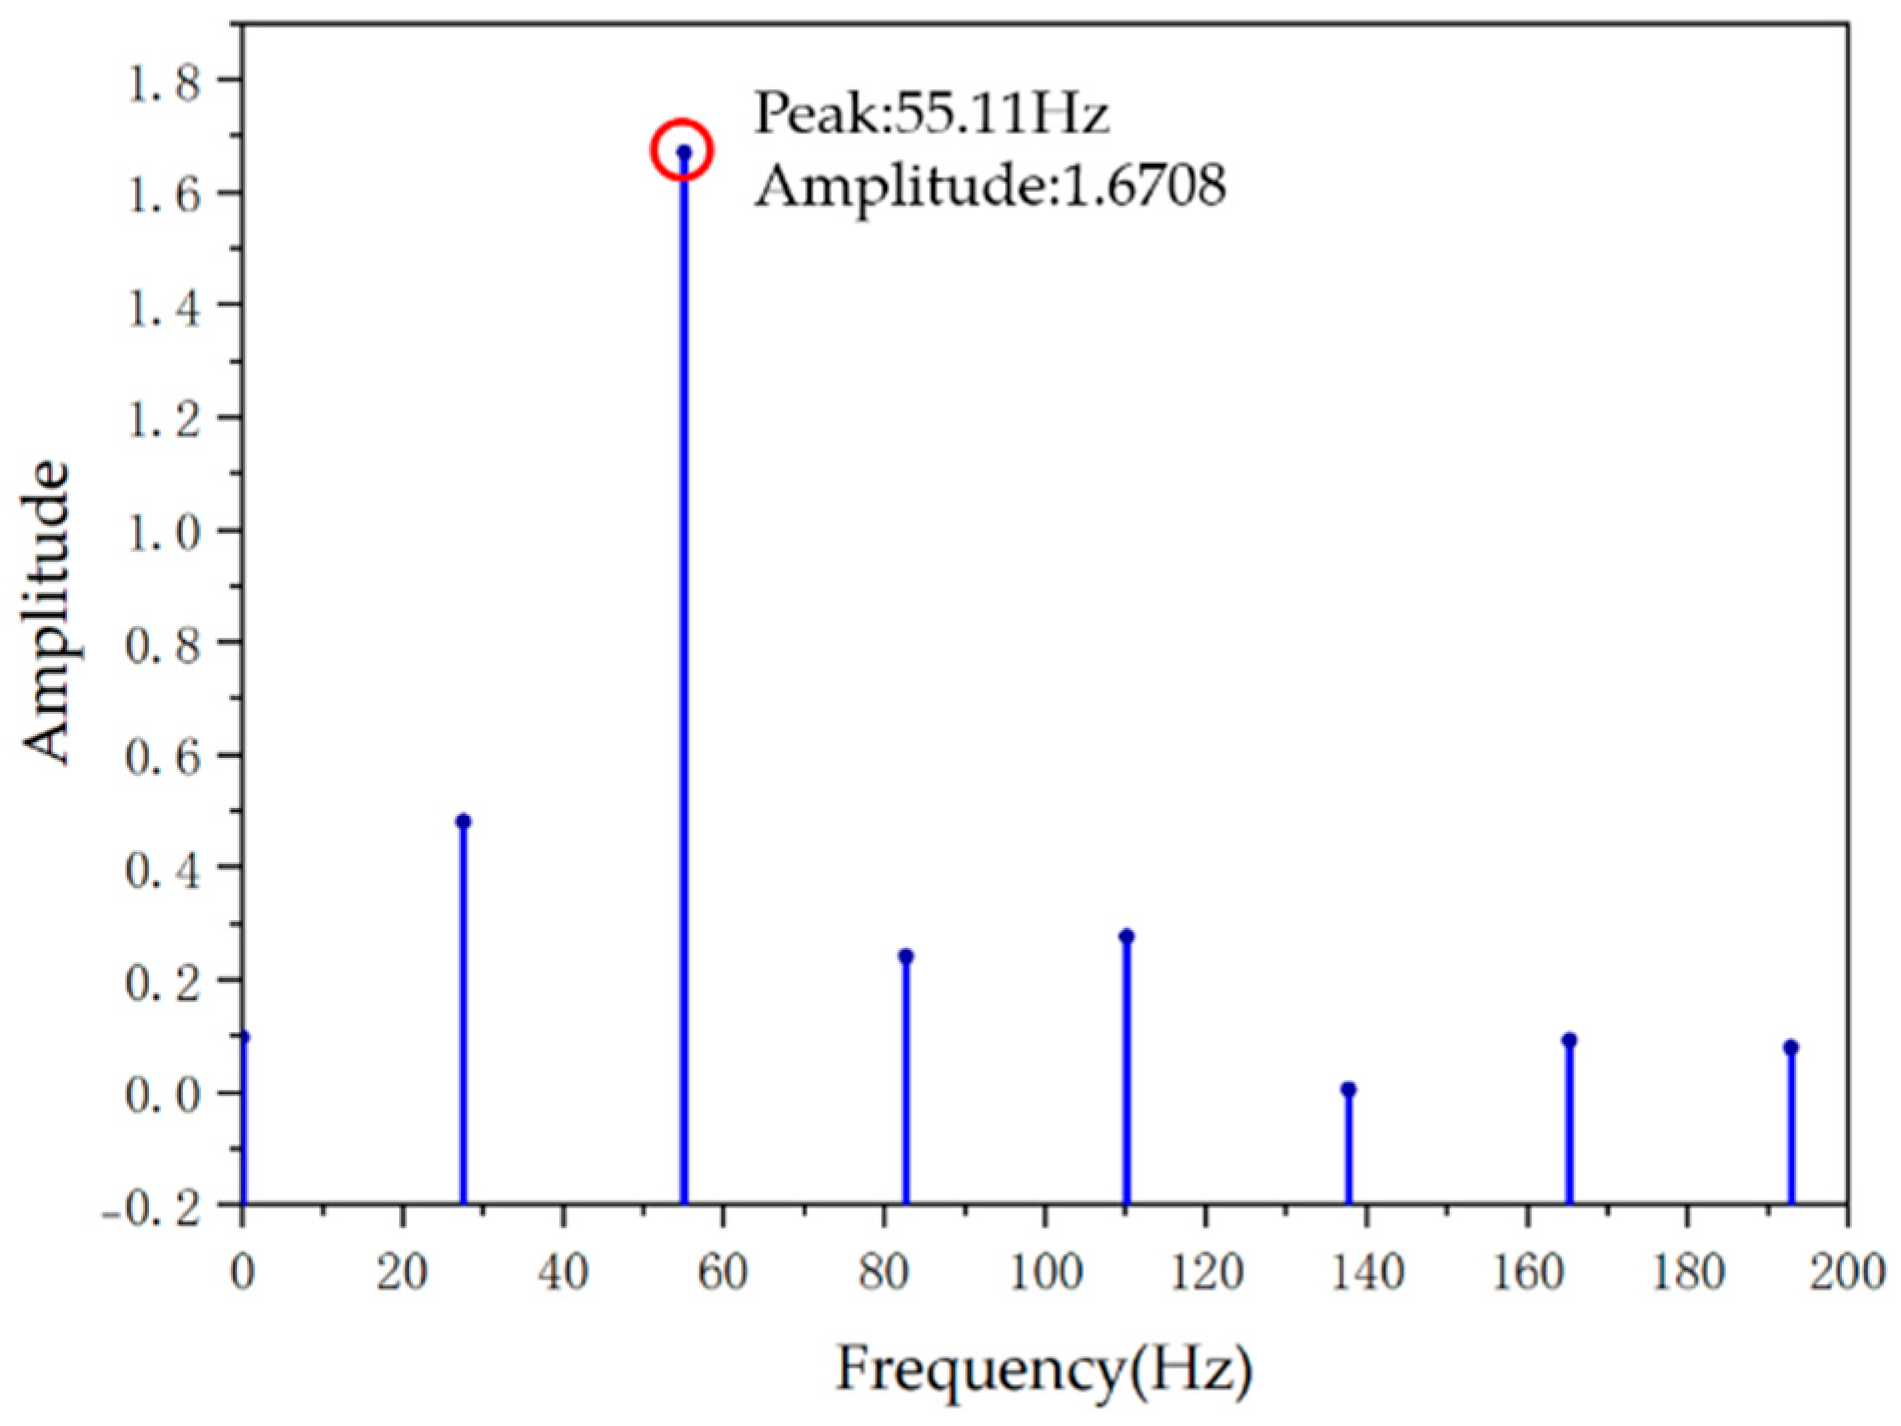
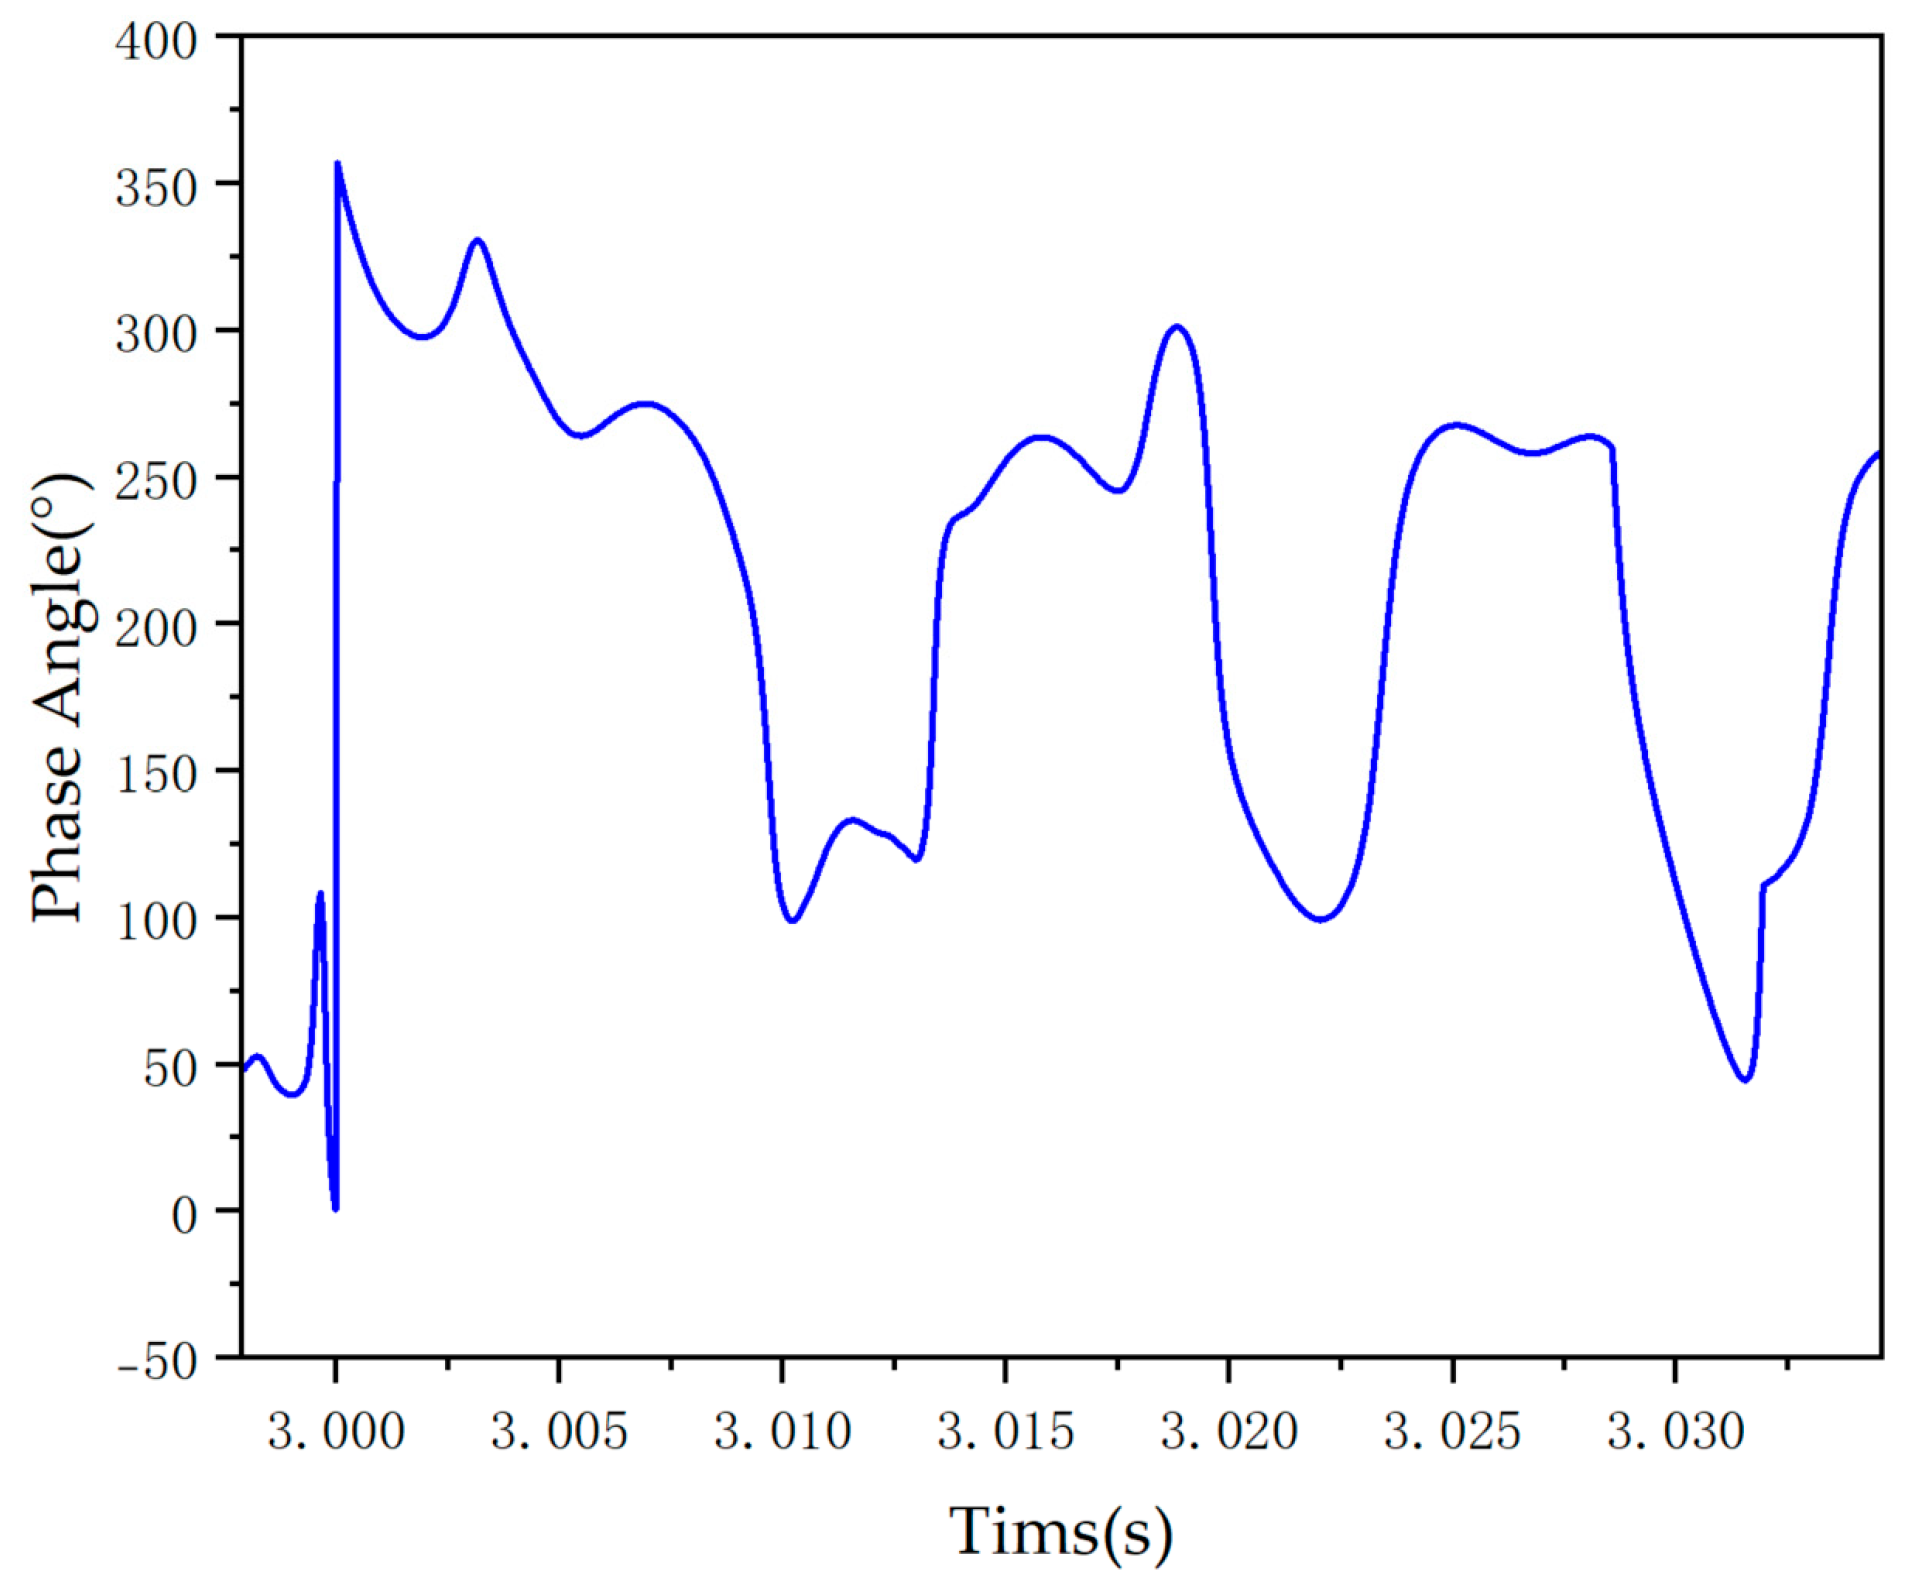
5.3. Frequency Offset

By comparing the period duration of the current waveform for one to two cycles after t = 3 s, the degree of frequency offset under the switching strategy and the virtual impedance strategy can be observed. As shown in Figure 19, the period durations for the first and second cycles after a fault under the switching strategy are 17 ms and 19 ms, respectively, while under the virtual impedance control strategy, the period durations for the first and second cycles after a fault are 19 ms and 21 ms, respectively. Given that the system frequency is 50 Hz and the power frequency period is 20 ms, it is evident that the virtual impedance strategy, due to its voltage source characteristics, lacks a PLL and has transient virtual impedance, which can improve the frequency offset characteristics during faults. Observing the additional voltage generated by the transient impedance in Figure 20, it is clear that the transient impedance only comes into play when frequency oscillations occur. After t = 3 s, when the system enters a fault state, the transient impedance becomes zero as the high-frequency components gradually decay and disappear. This indicates that the transient impedance can effectively improve the system’s frequency offset characteristics by timely intervention and withdrawal when the system frequency is offset, thereby ensuring the stable operation of the system.

6. Conclusions

Grid-forming inverters can simulate the behavior of traditional synchronous machines, providing autonomous voltage and inertia support, and are an essential pathway for achieving high-proportion new energy grid integration. This paper investigates different fault control strategies of grid-forming converters and clarifies their fault response characteristics after being connected to the grid. It also analyzes the impact of these fault characteristics on traditional relay protection and draws the following conclusions:
  • Both fault strategies exhibit negative sequence suppression and limited amplitude fault characteristics. However, the virtual impedance strategy results in a smoother current waveform during faults, without surge currents, and offers a more flexible adjustment of fault current. The switching strategy causes frequency offset, which the virtual impedance strategy can mitigate while maintaining the voltage source characteristic, although it introduces nonlinear impedance on the renewable energy side.
  • The limited amplitude of fault current renders Overcurrent Protection Zones I and II inoperative and reduces the sensitivity of Zone III, while zero and negative sequence suppression strategies affect the performance of zero and negative sequence current protection. The non-power frequency characteristics of the fault waveform from grid-forming converters mean that the current phasors calculated using the traditional full-cycle Fourier algorithm do not reflect the true fault characteristics, leading to significant errors in directional element calculations and thus affecting the reliability of pilot protection. The limited fault current amplitude and changes in short-circuit current phase angle make distance protection on the renewable energy side prone to failure or misoperation while reducing the probability of failure on the system side. The nonlinearity and frequency offset characteristics of virtual impedance affect the accuracy of power frequency fault component distance protection. The switching current-limiting control strategy destabilizes the phase of fault current, and the virtual impedance control strategy introduces a nonlinear relationship between voltage and current at the point of common coupling, both of which increase the risk of incorrect operation of differential protection.
Finally, countermeasures for overcurrent, pilot, distance, and differential protections have been investigated and prospected. Through simulation, the fault characteristics under different control strategies have been verified, providing important references for power systems with high-proportion new energy integration.

Author Contributions

Methodology, J.Y. and W.C.; validation, H.W., W.D. and Z.W.; formal analysis, J.Y., W.C., Z.Z. and Z.W.; investigation, X.L., Z.J., W.D. and W.Z.; resources, Z.J., W.D. and Z.W.; data curation, J.Y. and Z.Z.; writing—original draft preparation, J.Y. and W.C.; writing—review and editing, J.Y. and W.C.; supervision, X.L. and W.Z.; project administration, X.L., W.Z., H.W. and Z.J.; funding acquisition, W.C. All authors have read and agreed to the published version of the manuscript.

Funding

This work was supported in part by the Science and Technology Project of the State Grid Sichuan Electric Power Company under Grant 521997230003.

Institutional Review Board Statement

Not applicable.

Informed Consent Statement

No applicable.

Acknowledgments

Thanks to the Science and Technology Project of State Grid Sichuan Electric Power Company.

Conflicts of Interest

Authors Xiaopeng Li, Wenyue Zhou, Hao Wang, Zhenchao Jiang were employed by the Power System Security and Operation Key Laboratory of Sichuan Province, State Grid Sichuan Electric Power Research Institute. Author Wei Dai was employed by the company State Grid Panzhihua Power Supply Company. Author Zhongqing Wang was employed by the company State Grid Liangshan Power Supply Company. The authors declare that this study received funding from State Grid Sichuan Electric Power Company. The remaining authors declare that the research was conducted in the absence of any commercial or financial relationships that could be construed as a potential conflict of interest.

Abbreviations

The following abbreviations are used in this manuscript:
VSGVirtual Synchronous Generator
PLLPhase-Locked Loop
VCOVoltage-Controlled Oscillator
PIProportional Integral
LVRTLow-Voltage Ride-Through

Appendix A

Table A1. The main parameters of simulation.
TypeParameter NamesValues
PV1Rated Capacity4 MVA
Base frequency50 Hz
DC Bus Rated Voltage/Capacitance0.67 kV/10,000 μF
LCL filter Valve-Side Inductance 0.15 × 10 3 H
LCL filter Valve-Side Inductance and Grid-Side Inductance 0.03 × 10 3 H
LCL filter Resistance0.1 Ω
LCL filter Capacitance400 μF
Frequency droop slope50
Damping coefficient20
Moment of inertia0.84 kg·m2
Voltage droop slope0.1
Reactive power–voltage loop PI Parameters0.02 pu/0.2 pu
Inverter Voltage Loop PI Parameters0.4 pu/0.1 pu
Inverter Current Loop PI Parameters2 pu/0.006 pu
Nominal virtual resistance0.0707 pu
Nominal virtual inductance0.0707/(2π50) pu
Current limiting max current setting1.2 pu
Current limiting threshold1 pu
Virtual resistance current limiting proportional gain0.1 pu
Current limiting virtual impedance X/R ratio10
PV2Rated Capacity2 MVA
DC Bus Rated Voltage/Capacitance0.82 kV/10,000 μF
RLC Filter Parameters0.1 ohm/150 μH/400 μF
LCL filter Valve-Side Inductance 0.15 × 10 3 H
LCL filter Valve-Side Inductance and Grid-Side Inductance 0.03 × 10 3 H
LCL filter Resistance0.1 Ω
LCL filter Capacitance400 μF
PLL PI Parameters50 pu/0.0001 pu
Transmission LineLine 1/2/3/4/5 length1 km
Positive sequence resistance0.02 Ω/km
Positive sequence inductance1.273 mH/km
Positive sequence capacitance0.351 μF/Km
Zero sequence resistance2.0 Ω/km
Zero sequence inductance1.019 μH/km
Zero sequence capacitance1 μF/Km
TV1Three-Phase Transformer Capacity4.2 MVA
Winding #1 TypeY
Winding #2 TypeDelta
Voltage transformation ratio0.27 kV/35 kV
TV2Three-Phase Transformer Capacity6 MVA
Winding #1 TypeDelta
Winding #2 TypeY
Voltage transformation ratio35 kV/110 kV
TV3Three-Phase Transformer Capacity6 MVA
Winding #1 TypeY
Winding #2 TypeY
Voltage transformation ratio0.27 kV/35 kV
Load1Load size0.5 MW
Load2Load size1.7 MW
Simulation EnvironmentSampling rates24 kHz
Solution time step41.667 μs

References

  1. Guo, X.; Liu, Y.; Yu, W.; Xing, Z.; Zheng, H.; Liang, Y.; Yuan, Y.; Xu, Q. Analysis and Improvement Method of Over Current Direction Element in Doubly-Fed Wind Farm. In Proceedings of the 2024 3rd Asia Power and Electrical Technology Conference (APET), Shanghai, China, 15–17 October 2024; pp. 701–707. [Google Scholar]
  2. Jalali, A.; Farahani, E.; Delac, M.; Modi, N. Impact of Grid-Forming Inverters on Frequency Control of a Grid with High Share of Inverter-Based Resources. In Proceedings of the CAIRNS International Symposium, Cairns, Australia, 4–7 September 2023; pp. 1–13. [Google Scholar]
  3. Jongudomkarn, J.; Liu, J.; Ise, T. Virtual synchronous generator control with reliable fault ride-through ability: A solution based on finite-set model predictive control. IEEE J. Emerg. Sel. Top. Power Electron. 2019, 8, 3811–3824. [Google Scholar] [CrossRef]
  4. Bottrell, N.; Green, T.C. Comparison of current-limiting strategies during fault ride-through of inverters to prevent latch-up and wind-up. IEEE Trans. Power Electron. 2013, 29, 3786–3797. [Google Scholar] [CrossRef]
  5. Lin, X.; Zheng, Y.; Liang, Z.; Kang, Y. The suppression of voltage overshoot and oscillation during the fast recovery process from load short-circuit fault for three-phase stand-alone inverter. IEEE J. Emerg. Sel. Top. Power Electron. 2020, 9, 858–871. [Google Scholar] [CrossRef]
  6. Wang, H.; Zhang, Q.; Wu, D.; Yan, B.; Zhang, J. Advanced current-droop control for storage converters for fault ride-through enhancement. IEEE J. Emerg. Sel. Top. Power Electron. 2019, 8, 2461–2474. [Google Scholar] [CrossRef]
  7. Li, Z.; Chan, K.W.; Hu, J.; Or, S.W. An adaptive fault ride-through scheme for grid-forming inverters under asymmetrical grid faults. IEEE Trans. Ind. Electron. 2021, 69, 12912–12923. [Google Scholar] [CrossRef]
  8. Etemadi, A.H.; Iravani, R. Overcurrent and overload protection of directly voltage-controlled distributed resources in a microgrid. IEEE Trans. Ind. Electron. 2012, 60, 5629–5638. [Google Scholar] [CrossRef]
  9. Denis, G.; Prevost, T.; Debry, M.S.; Xavier, F.; Guillaud, X.; Menze, A. The Migrate project: The challenges of operating a transmission grid with only inverter-based generation. A grid-forming control improvement with transient current-limiting control. IET Renew. Power Gener. 2018, 12, 523–529. [Google Scholar] [CrossRef]
  10. Peralta, C.L.; Villegas Pico, H.N. Impact of grid-forming converters on distance elements based on the x and m calculations. In Proceedings of the 2024 IEEE Texas Power and Energy Conference (TPEC), College Station, TX, USA, 12–13 February 2024; pp. 1–6. [Google Scholar]
  11. Peng, F.; Gao, H.; Guo, Y.; Fang, Y.; Song, H.; Luo, R.; Xu, B. A Review of Fault Ride-through Control Strategies of Grid-forming Inverter-based Resources and the Influence on Protection. Power Syst. Technol. 2024, 48, 3673–3685. [Google Scholar]
  12. Rathnayake, D.B.; Akrami, M.; Phurailatpam, C.; Me, S.P.; Hadavi, S.; Jayasinghe, G.; Zabihi, S.; Bahrani, B. Grid Forming Inverter Modeling, Control, and Applications. IEEE Access 2021, 9, 114781–114807. [Google Scholar] [CrossRef]
  13. Jia, J.; Yang, G.; Nielsen, A.H.; Jia, J.; Yang, G.; Nielsen, A.H. A review on grid-connected converter control for short-circuit power provision under grid unbalanced faults. IEEE Trans. Power Deliv. 2017, 33, 649–661. [Google Scholar] [CrossRef]
  14. Paquette, A.D.; Divan, D.M. Virtual impedance current limiting for inverters in microgrids with synchronous generators. IEEE Trans. Ind. Appl. 2014, 51, 1630–1638. [Google Scholar] [CrossRef]
  15. Li, Y.; Wu, H.; Wang, X. A Protection-Interoperable Fault Ride-Through Control for Grid-Forming Inverters. arXiv 2025, arXiv:2504.21592. [Google Scholar]
  16. IEEE Std 1547™-2018; IEEE Standard for Interconnection and Interoperability of Distributed Energy Resources with Electric Power Systems. IEEE: New York, NY, USA, 2018.
  17. Underwriters Laboratories (UL) UL 1741; Standard for Inverters, Converters, Controllers, and Interconnection System Equipment for Use with Distributed Energy Resources. Underwriters Laboratories Inc.: Northbrook, IL, USA, 2020.
  18. Keller, J.; Kroposki, B. Understanding Fault Characteristics of Inverter-Based Distributed Energy Resources; National Renewable Energy Lab. (NREL): Golden, CO, USA, 2010. [Google Scholar]
  19. Bu, M.; Zhang, J.; Zhou, H.; Zheng, T. Improved Fault Ride-Through Control Strategy for Grid-Forming Inverters to Enhance Adaptability of Distance Protection. In Proceedings of the 2024 3rd Asia Power and Electrical Technology Conference (APET), Fuzhou, China, 15–17 November 2024; pp. 361–366. [Google Scholar]
  20. Li, Z.; Zhu, Y.; Hu, C.; Tan, H.; Weng, H.; Li, Z. Optimal negative sequence current suppression strategy without phase-locked loop based on the control of clustered new energy power stations. IET Gener. Transm. Distrib. 2023, 17, 4248–4257. [Google Scholar] [CrossRef]
  21. Fang, Y.; Jia, K.; Yang, Z.; Li, Y.; Bi, T. Impact of inverter-interfaced renewable energy generators on distance protection and an improved scheme. IEEE Trans. Ind. Electron. 2018, 66, 7078–7088. [Google Scholar] [CrossRef]
  22. Liu, D.; Hong, Q.; Khan, M.A.U.; Dyśko, A.; Alvarez, A.E.; Booth, C. Evaluation of grid-forming converter’s impact on distance protection performance. In IET Conference Proceedings CP800; The Institution of Engineering and Technology: Stevenage, UK, 2022; Volume 2022, pp. 285–290. [Google Scholar]
  23. Baeckeland, N.; Venkatramanan, D.; Dhople, S.; Kleemann, M. On the distance protection of power grids dominated by grid-forming inverters. In Proceedings of the 2022 IEEE PES Innovative Smart Grid Technologies Conference Europe (ISGT-Europe), Novi Sad, Serbia, 10–12 October 2022; pp. 1–6. [Google Scholar]
  24. Johansson, H.; Xing, Q.; Taylor, N.; Wang, X. Impacts of grid-forming inverters on distance protection. IET Gener. Transm. Distrib. 2025, 19, e13354. [Google Scholar] [CrossRef]
  25. Baeckeland, N.; Chatterjee, D.; Lu, M.; Johnson, B.; Seo, G.-S. Overcurrent limiting in grid—Forming inverters: A comprehensive review and discussion. IEEE Trans. Power Electron. 2024, 39, 14493–14517. [Google Scholar] [CrossRef]
  26. Huang, L.; Wu, C.; Zhou, D.; Blaabjerg, F. A power-angle-based adaptive overcurrent protection scheme for grid-forming inverter under large grid disturbances. IEEE Trans. Ind. Electron. 2022, 70, 5927–5936. [Google Scholar] [CrossRef]
  27. Li, B.; Liu, J.; Wang, X.; Zhao, L. Fault studies and distance protection of transmission lines connected to DFIG-based wind farms. Appl. Sci. 2018, 8, 562. [Google Scholar] [CrossRef]
  28. Peralta, C.L.; Pico, H.N.V. A time-domain protection approach for AC transmission systems with grid-forming resources. IEEE Trans. Instrum. Meas. 2023, 73, 9000318. [Google Scholar] [CrossRef]
  29. Wang, L.; Cheng, L.; Hu, Y. Action Behavior Analysis of Current Transformer Position and Dead-zone Fault Protection. Sichuan Electr. Power Technol. 2022, 45, 40–44. [Google Scholar]
Figure 1. VSG control overall block diagram.
Energies 18 02933 g001
Figure 2. Phase-Locked Loop flowchart.
Energies 18 02933 g002
Figure 3. The control block diagram of the switching strategy.
Energies 18 02933 g003
Figure 4. Output Current Diagram.
Energies 18 02933 g004
Figure 5. Comparison of per-unit current values under different k p , R v i conditions.
Energies 18 02933 g005
Figure 6. Virtual impedance control strategy diagram.
Energies 18 02933 g006
Figure 8. Fault network topology diagram. (a) Two-terminal network. (b) T-junction network.
Energies 18 02933 g008
Figure 9. Spectrum diagram.
Energies 18 02933 g009
Figure 10. Phase angle variation diagram.
Energies 18 02933 g010
Figure 11. Equivalent model of the power system fault.
Energies 18 02933 g011
Figure 12. Impedance trajectory diagram of Zs.
Energies 18 02933 g012
Figure 13. Differential restraining characteristic.
Energies 18 02933 g013
Figure 14. Fault network topology diagram.
Energies 18 02933 g014
Figure 15. Current waveform diagram. (a) Waveform diagram of phase current through the circuit breaker. (b) Waveform diagram of differential current and restraining current.
Energies 18 02933 g015
Figure 16. Simulation model topology diagram.
Energies 18 02933 g016
Figure 17. Virtual resistance and virtual reactance waveform diagram.
Energies 18 02933 g017
Figure 18. Current waveform plots for different control strategies: (a) no control strategy; (b) switching control strategy; (c) virtual impedance control strategy.
Energies 18 02933 g018
Figure 19. Current waveform plots: (a) switching control strategy; (b) virtual impedance control strategy.
Energies 18 02933 g019
Figure 20. Transient impedance additional voltage.
Energies 18 02933 g020
Disclaimer/Publisher’s Note: The statements, opinions and data contained in all publications are solely those of the individual author(s) and contributor(s) and not of MDPI and/or the editor(s). MDPI and/or the editor(s) disclaim responsibility for any injury to people or property resulting from any ideas, methods, instructions or products referred to in the content.

