Abstract
Under extremely low-head conditions, the performance and stability of pump-turbine units are strongly influenced by the flow distortion caused by variations in guide vane opening. In this study, a pump-turbine model—representative of a domestic pumped storage power station—was investigated through a combination of experimental observations and three-dimensional unsteady numerical simulations employing the SST k-ω turbulence model. The analysis focused on characterizing the variations in turbulence kinetic energy, pressure pulsations, and impeller force fluctuations as the guide vane opening was altered. The results reveal that, with increasing guide vane opening, the turbulence kinetic energy within the impeller region is notably reduced. This reduction is primarily attributed to a decrease in energy losses along the suction surfaces of the blades and within the straight pipe section of the tailwater tunnel. Simultaneously, pressure pulsations were detected at multiple locations including the volute inlet, the blade-free zone, downstream of the conical pipe, and along the inner surface of the shaft tube. While most regions experienced a decline in pressure pulsation intensity with larger openings, the bladeless zone exhibited a significant increase. Moreover, force analysis at four distinct guide vane settings indicated that an opening of 41 mm resulted in relatively uniform fluctuations in the impeller forces. This uniformity suggests that an optimal guide vane configuration exists, which minimizes uneven stress distributions and enhances the operational stability of the pump-turbine under extremely low-head conditions. These findings offer valuable insights for the design and operational optimization of pump-turbine systems in pumped storage power stations.
1. Introduction
Pumped storage has emerged as a mature and efficient energy storage technology, garnering increasing global attention and widespread deployment in recent years. The advancement of smart grid systems has further expanded the operational flexibility of pumped storage units, enabling them to respond dynamically to variable electricity demands and renewable energy fluctuations. In this evolving energy landscape, pump-turbines—the core components of pumped storage systems—are now required to operate across a much broader range of conditions than originally intended in their design [1,2,3]. Among these expanded operating regimes, particular attention has been drawn to what are referred to as abnormal operating conditions—states that deviate significantly from nominal design parameters. These conditions commonly involve extremely low hydraulic head (typically below 30% of the rated value), unsteady or distorted inflow caused by rapid grid-induced load adjustments or upstream turbulence, partial load operations characterized by small or asymmetric guide vane openings, and frequent transitions between pump and turbine modes, especially under flexible grid control. These atypical operating modes introduce complex, unsteady flow behaviors that are fundamentally different from those observed under stable design conditions.
While numerous studies have investigated pump-turbine performance under medium and high head conditions, the hydrodynamic characteristics associated with extremely low-head and transient operations remain insufficiently understood. This is particularly true with respect to unsteady hydraulic responses, including pressure pulsations, fluctuating force loads, and localized turbulence intensity—factors that have critical implications for machine efficiency, vibration, and operational reliability. Given the increasing frequency of such conditions in modern grid environments, a deeper understanding of flow behavior and force characteristics under abnormal operating scenarios has become essential for future pumped storage system design and optimization.
In recent years, with the advancement of low-head hydraulic resource development, research on pump-turbine performance under low-head conditions has steadily increased, forming several distinct research directions. One major focus has been the startup process and its associated pressure pulsations [4,5,6]. For example, Zhang Zhibing et al. [7] examined the startup process at low-head, emphasizing pressure pulsations in the volute and guide vane–runner regions along with internal flow characteristics. Similarly, Chen Huixiang et al. [8] investigated startup processes by analyzing pressure pulsation characteristics in the guide vane and tailwater pipe regions and identifying their underlying causes. In parallel, Zheng Yang et al. [9] evaluated the hydraulic performance of pumped storage plants with wide head variation under low-head conditions, while Wang Yinsong et al. [10] performed numerical simulations incorporating PID control to correlate internal flow evolution with external performance changes. Li Yonggang [11] further explored how startup intervals and hydraulic interference between sequentially starting units affect the transition process, and Zhu Haifeng et al. [12] experimentally verified that pre-opening guide vanes can effectively address low-head grid connection issues.
Another important research avenue has been the development of analytical and numerical methods to predict and optimize pump-turbine behavior. Mao Xiuli, Zheng Yuan, and colleagues [13] derived an approximate calculation formula for the throughput capacity of pump-turbines in low-head pumped storage plants, while Qin Dige [14] investigated the co-optimization of turbine design and dynamic load characteristics under varying operational loads. Additional studies have addressed the internal flow and pressure pulsation mechanisms in ultra-low-head turbines. Sun Jie et al. [15] identified that dynamic-static interference between the runner and tailwater pipe is a primary cause of pressure pulsations, and Guo Junxun et al. [16] demonstrated that reducing guide vane oscillation speed significantly improves the flow between movable vanes, thereby enhancing no-load stability. Yu Zhifeng [17] applied entropy generation theory to reveal that, although viscous and turbulent dissipation are generally balanced, turbulent dissipation losses dominate under partial load conditions. Moreover, Zhu Qiang et al. [18] conducted numerical simulations that linked vortex characteristics in blade passages to pressure pulsation frequencies. Finally, studies by Byeon S. S., Boo J. H., and Park J. Y. [19], Chen S., He Z., and Zhou Z. [20], Song, H. et al. [21], and Wang W., Wang X., and Wang Z. [22] have further expanded our understanding of flow characteristics and transient processes in small turbines, large low-head pumping stations during shutdown, ultra-low-head open-channel turbines, and no-load conditions, respectively.
Although existing studies have made progress in analyzing pump-turbine behavior under low-head conditions [7,8,9,10,11], most have focused on simplified or single-condition scenarios, such as fixed guide vane openings or steady-state assumptions. These approaches, while valuable, do not fully capture the dynamic interactions and flow instabilities that occur under ultra-low-head and variable-throttle conditions, which are increasingly common in modern grid applications. Moreover, challenges in experimental repeatability and boundary control under such conditions have limited the availability of validated multi-condition datasets. Therefore, this study aims to address these gaps by numerically investigating the internal unsteady flow characteristics of a pump-turbine under multiple ultra-low-head scenarios and throttle settings. The findings are expected to provide engineering-relevant insights for improving efficiency, stability, and structural safety during off-design operation.
2. Experimental Study
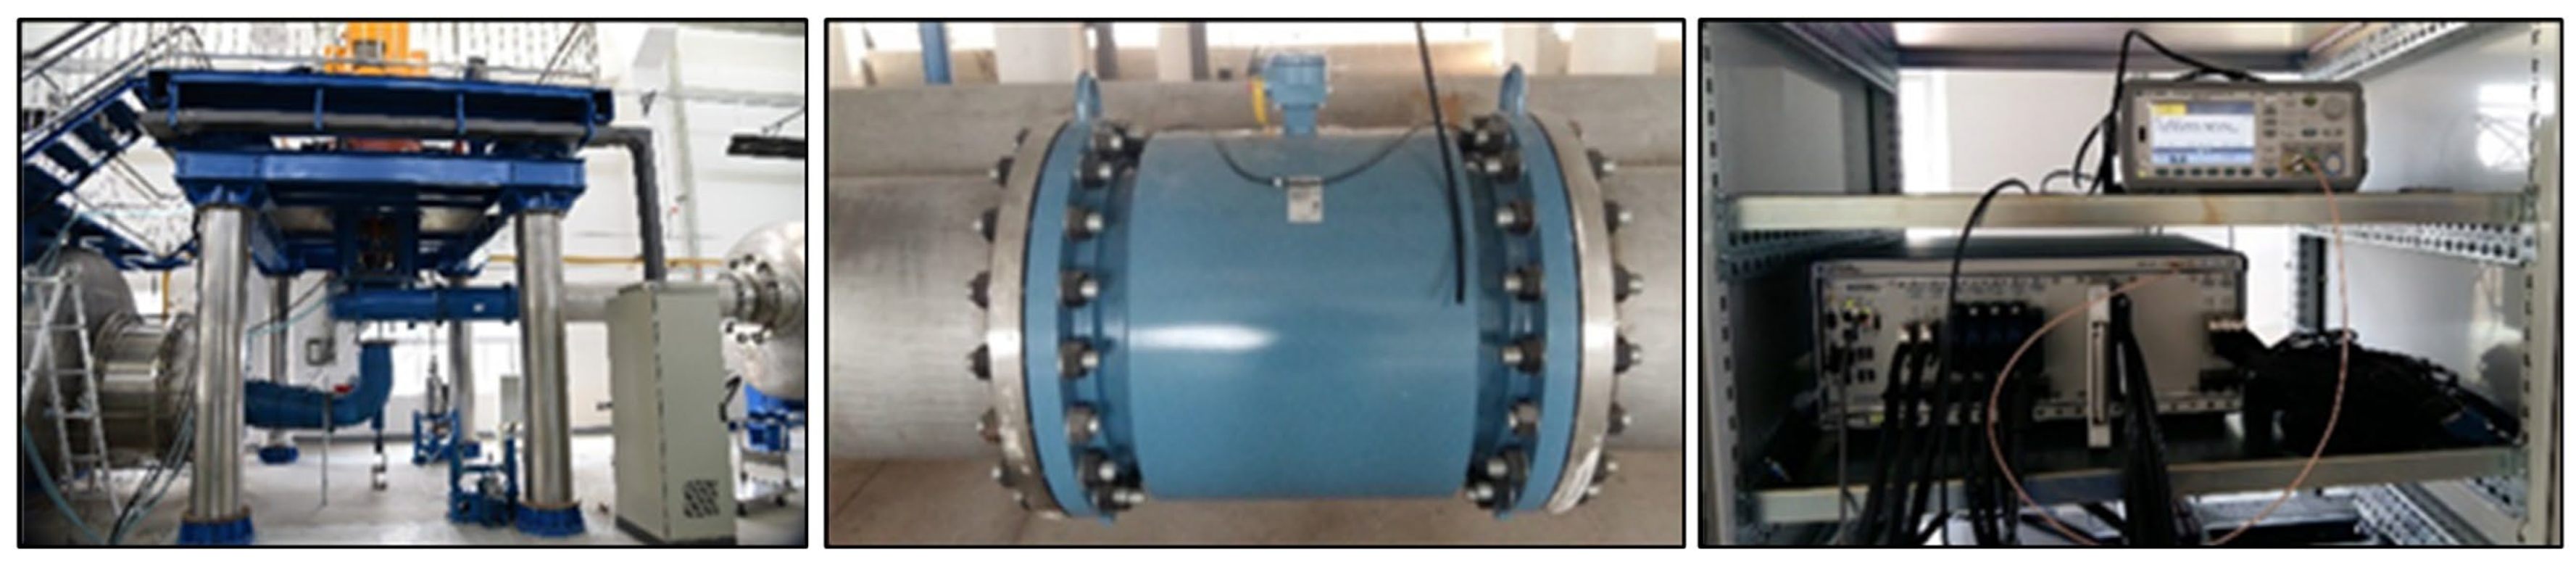
The power station examined in this study comprises an upper reservoir, a diversion accident gate well, an upper penstock, a pump-turbine unit, a tailwater pipe gate chamber, a pressure regulation chamber, a lower pipeline, a tailwater pipe maintenance gate well, a lower reservoir, valves, and other ancillary components. The system is designed with a rated head of 190 m, a rated speed of 350 r/min, and a rated power of 250 MW, while an abnormal low-head condition is defined at 160 m. The experimental test rig employed is a closed-loop, bidirectional operating system, and its acceptance tests were conducted in compliance with IEC 60193, IEC 609, and other relevant standards. In this experimental test of the pump-turbine, a series of high-precision test equipment was used to measure key parameters and analyze the performance of the equipment. The pressure sensor uses a Honeywell 26PC Series (accuracy ±0.25%) to accurately measure the fluid flow, and an Endress Hauser Proline 300 (±0.5% accuracy) is used to record the flow data at the inlet and outlet to ensure the accuracy of the flow rate under experimental conditions. PCB Piezotronics 352C33 (accuracy ±1% measurement) and Bruel & Kjaer 4371 (accuracy ±1% measurement) vibration sensors were used to evaluate vibrations in the operation of the pump-turbine and ensure smooth operation of the equipment. Key parameters of the test rig are listed in Table 1 [23], and the layout of the experimental platform is depicted in Figure 1 [23].

Table 1.
Parameters of test-bed. (Adapted from [23]).

Figure 1.
Test platform of pump-turbine. (Adapted from [23]).
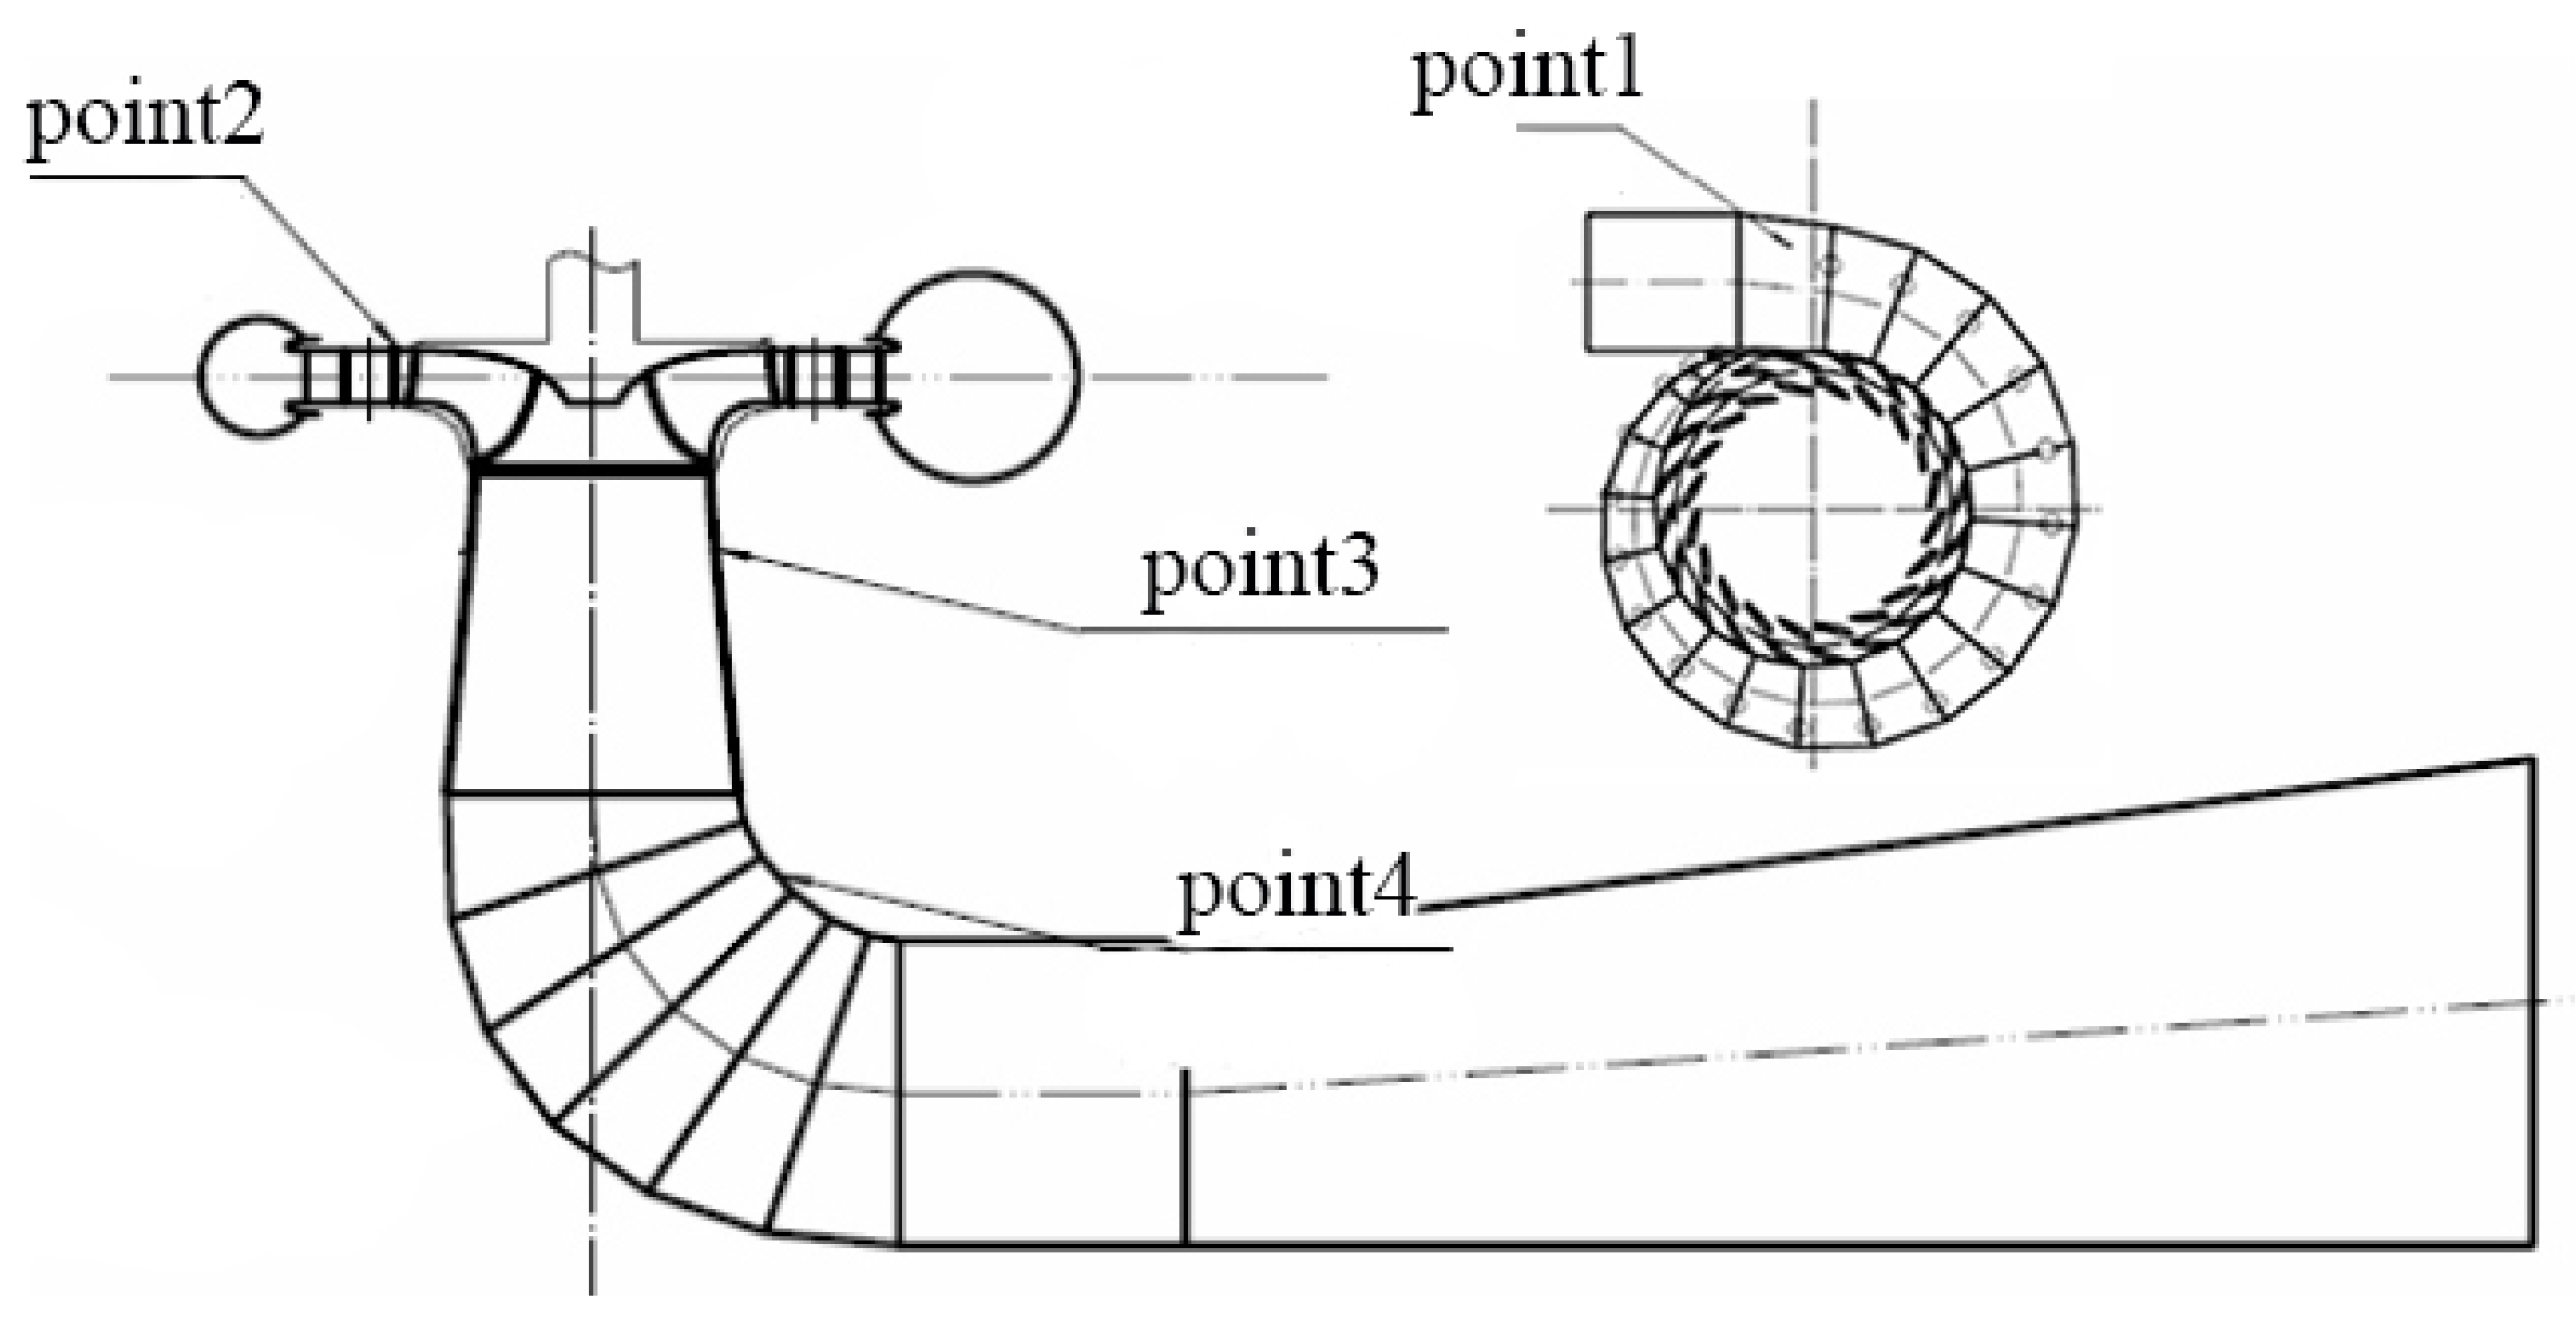
During the experiments, measurements of rotational speed, flow rate, and pressure pulsations were obtained using an electromagnetic flowmeter, a speed-torque meter, and a pressure pulsation sensor, respectively. These measurements were performed under four distinct guide vane openings characterized by the linear displacement at the trailing edge (A0 = 29 mm, 33 mm, 37 mm, and 41 mm). Pressure pulsation data were collected at critical locations including the volute inlet, the clearance zone (between the guide vanes and the runner), downstream of the conical pipe, and along the inner surface of the shaft tube. The detailed distribution of the pressure measurement points is shown in Figure 2, and the corresponding experimental data are summarized in Table 2 [23]. In the table, n11 represents the unit speed, and Q11 represents the unit flow.

Figure 2.
Pressure fluctuation monitoring points schematic diagram.
Table 2.
Experimental data.
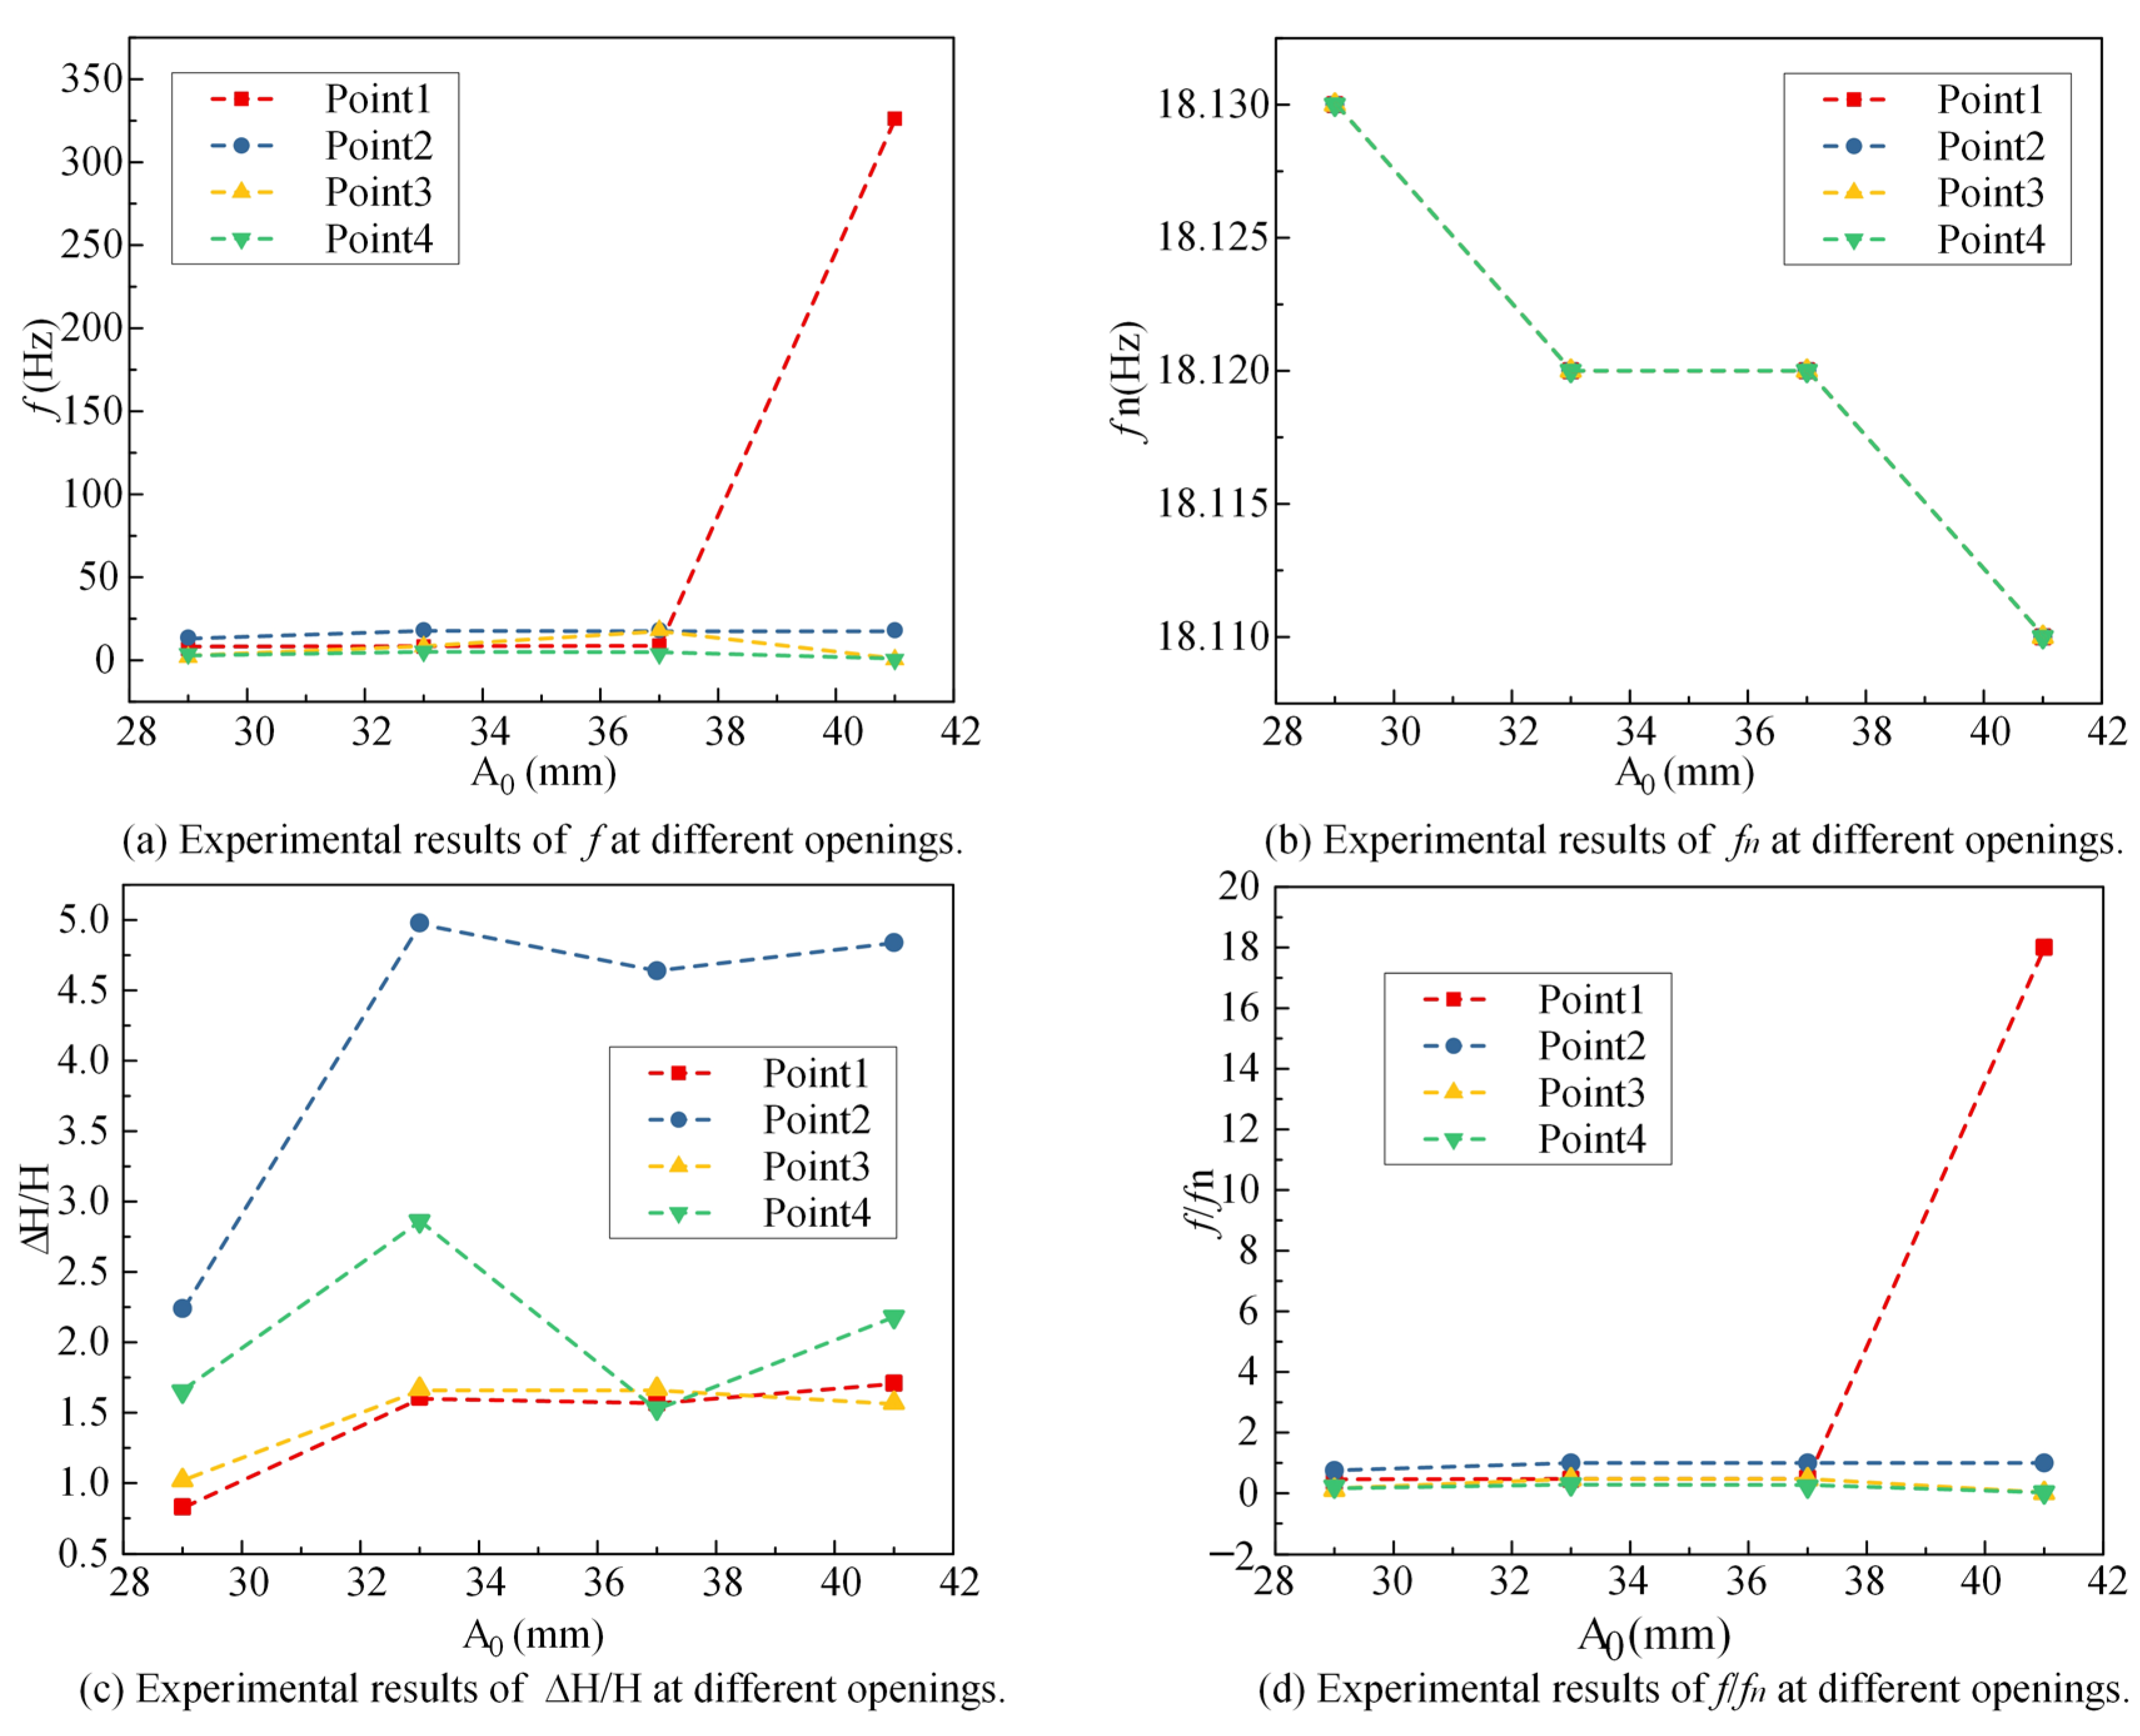
Based on the corresponding experimental data, the experimental result plots for f, fn, ∆H/H, f/fn under guide vane openings of A0 = 29 mm, A0 = 33 mm, A0 = 37 mm, and A0 = 41 mm were generated, as shown in Figure 3. With the increase in blade opening, the flow rate Q11 increased from 0.665 m3/s to 0.941 m3/s, indicating that the expansion of the guide vane opening effectively increased the flow rate, and although the overall flow rate was stable under the large opening, the low-frequency pulsations of point3 and point4 showed that the influence of large-scale vortex structures such as the tailpipe vortex belt was enhanced. Due to the uncertainty of the experiment, the experimental data presented in this study are averaged by multiple measurements to ensure a certain accuracy.

Figure 3.
Experimental results of pressure fluctuations at different openings.
Although experimental research is fundamental to both scientific inquiry and engineering practice, it is subject to several inherent limitations. The design, execution, and analysis of experiments are time-intensive, particularly when repeated trials are required to ensure the reliability of the results. In practical settings, experiments may be influenced by uncontrollable variables and environmental factors, and current measurement technologies may not always capture all necessary parameters. To address these limitations, this study incorporates numerical simulations to complement the experimental investigations, enabling a comprehensive analysis of the pump-turbine characteristics under low-head conditions for the four different guide vane opening scenarios.
3. Numerical Simulations
3.1. Numerical Calculation Method
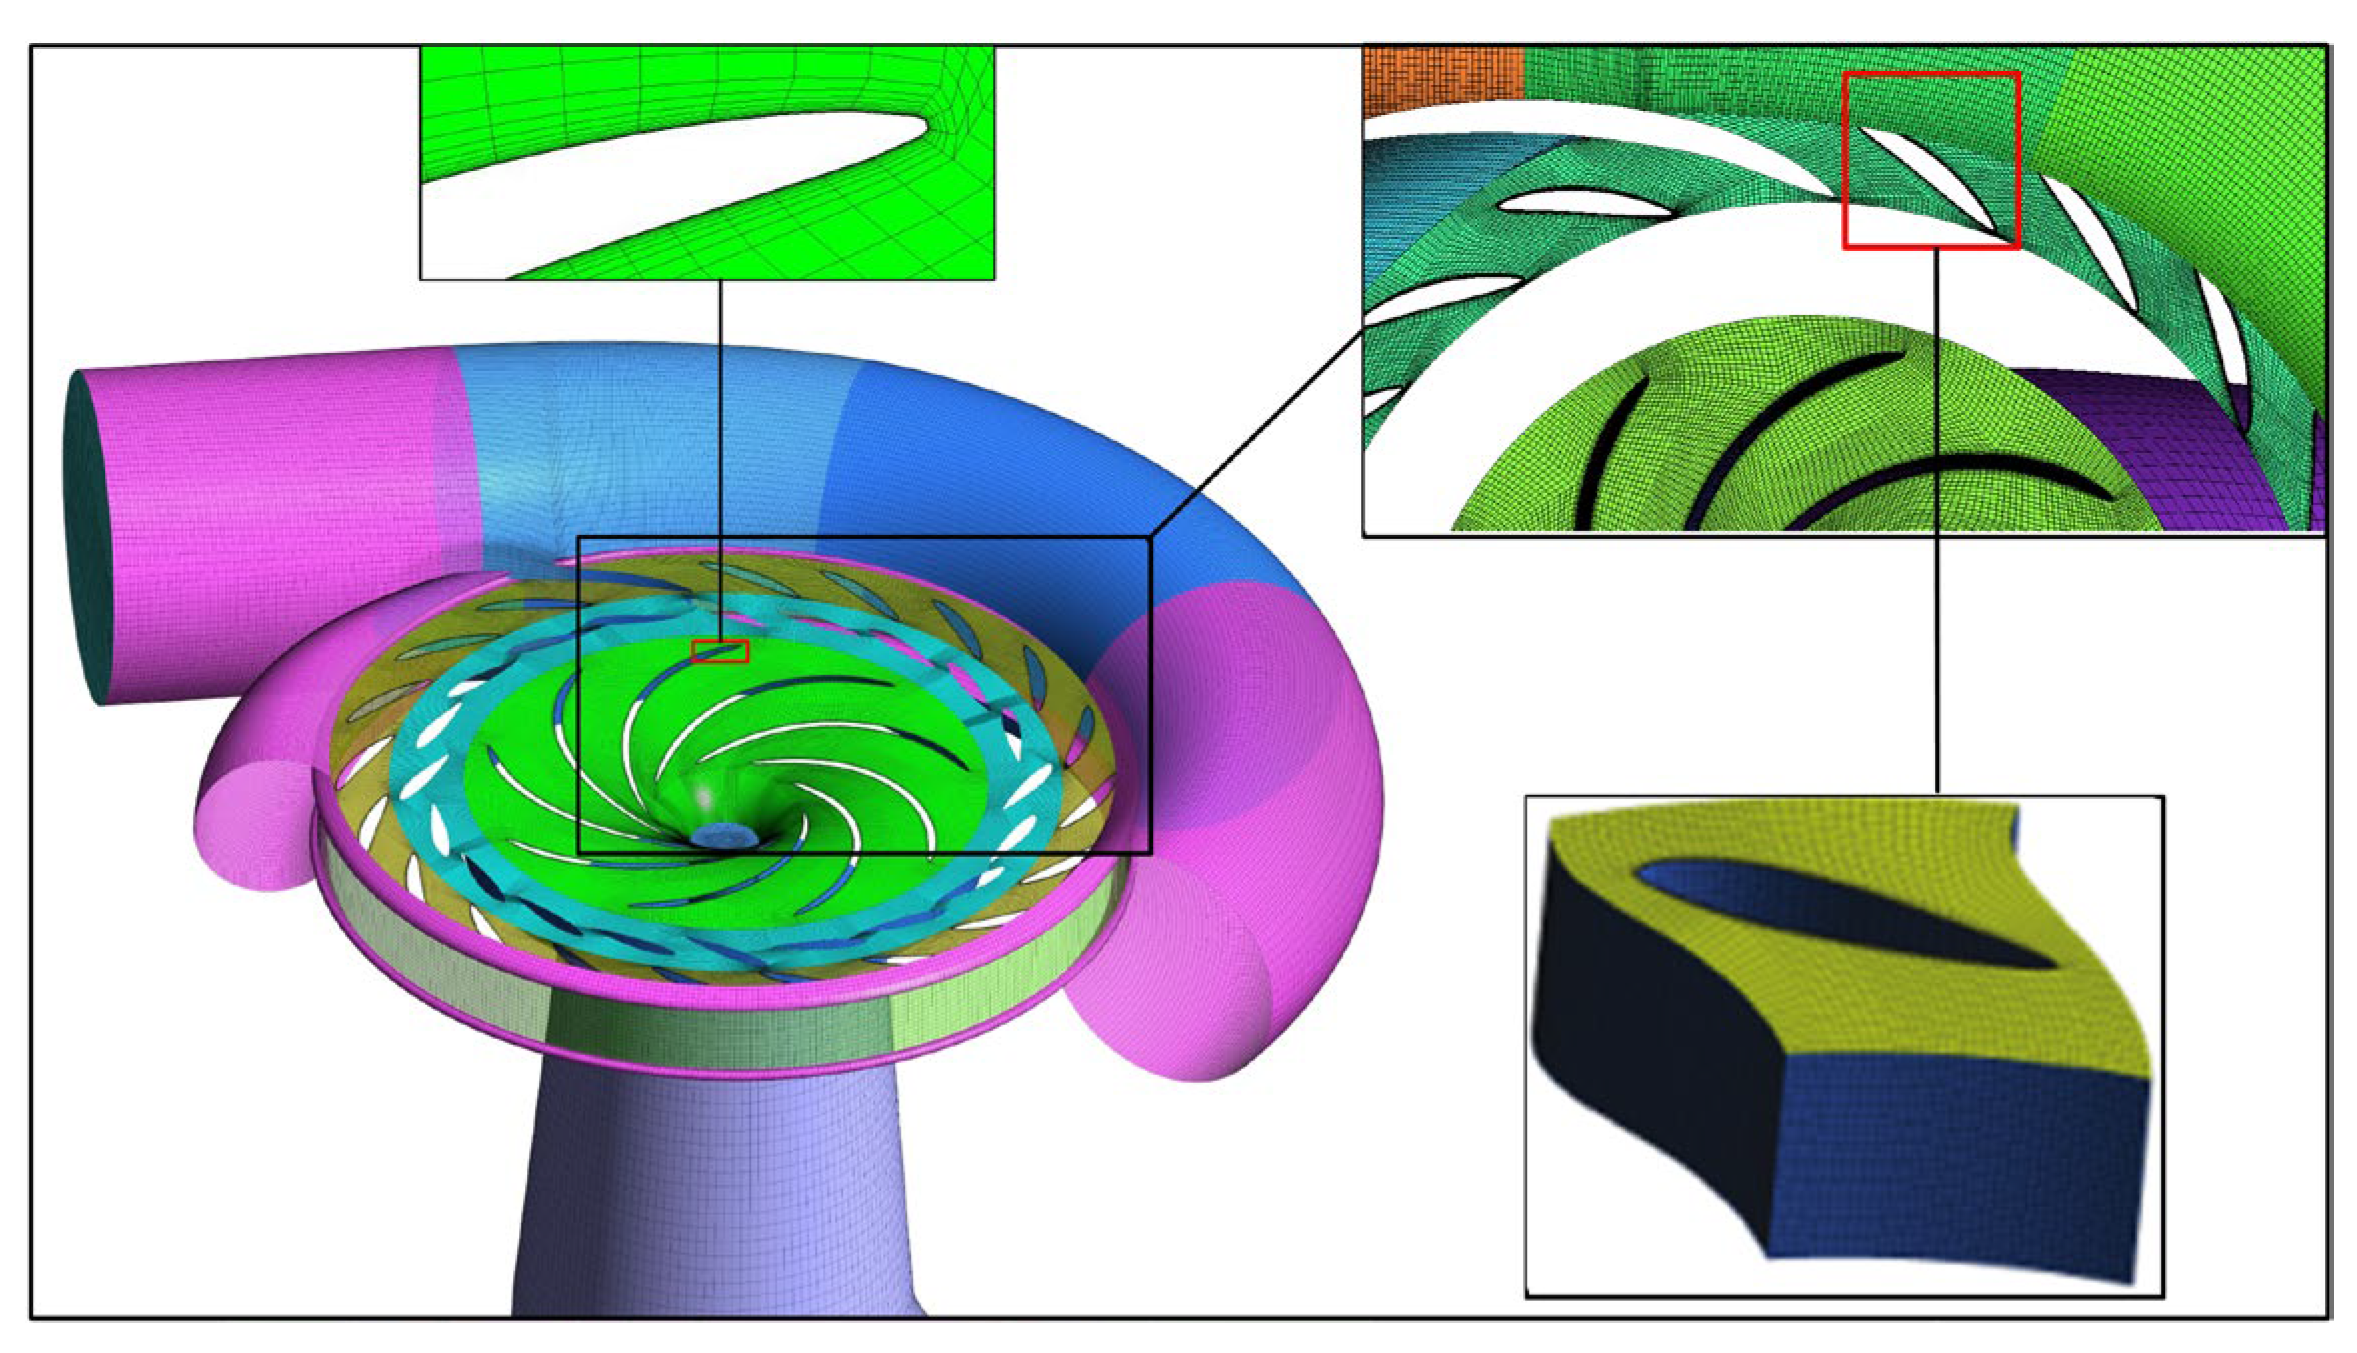
This study examines a pump-turbine model representative of a pumped storage power station. The full flow passage comprises five primary components: the volute, fixed guide vanes, movable guide vanes, runner, and tailrace. The geometric parameters of the model are listed in Table 3 [23], and its structural configuration is depicted in Figure 4 [23]. The pressure condition at the free exit boundary, set to standard atmospheric pressure (101,325 Pa).
Table 3.
The geometry parameters of the pump-turbine. (Adapted from [23]).
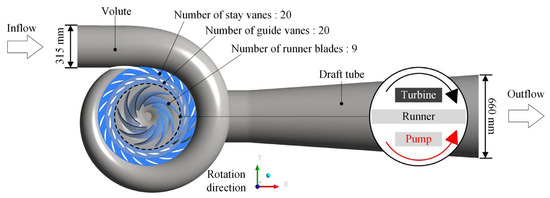
Figure 4.
Profile of pump-turbine. (Adapted from [23]).
Due to the complex flow behavior in multi-guide vane and multi-blade passages, the SST k-ω turbulence model was selected for its demonstrated accuracy and robustness in simulating flows in intricate geometries [24,25,26].
In the equations, ρ represents the fluid density; k denotes the turbulent kinetic energy; ω is the specific dissipation rate; ui represents the components of the mean velocity; Gk is the production term of turbulent kinetic energy k due to the mean velocity gradients; Gω refers to the source term in the ω equation; Гk and Гω represent the effective diffusion terms for k and ω, respectively; Dω is the cross-diffusion term; Sk and Sω are user-defined source terms; and Yk and Yω represent the dissipation terms for k and ω, respectively. is the local time rate of change in turbulent kinetic energy. It represents how the turbulent kinetic energy at a fixed point in space changes over time. is the convection term of turbulent kinetic energy. It represents the transport of turbulent kinetic energy due to the mean flow velocity. is the diffusion term of turbulent kinetic energy. It represents the transport of turbulent kinetic energy due to turbulent fluctuations themselves and molecular viscosity.
The numerical simulations were performed using ANSYS Fluent 2023 software, which is widely used for computational fluid dynamics (CFD) simulations. The time step size was selected based on previous studies, ensuring that the simulation captured the relevant flow dynamics without compromising the accuracy of pressure pulsations or force analysis. The time step size of 3° per rotation was found to be adequate based on a series of validation studies, where the results showed that further reduction in the time step did not significantly affect the pressure fluctuations or force distribution. In particular, the pressure pulsations and load analyses showed only marginal changes when the time step was reduced by 1° or 2°, confirming that the 3° step size is a reasonable compromise between computational cost and simulation accuracy, the average Courant number was calculated for the unsteady simulation and was found to be approximately 3. The convergence criterion is that the root-mean-square residuals for the continuity and momentum equations must be less than 10−6.
3.2. Mesh Schematic and Verification of Mesh Independence
To improve the simulation’s accuracy in capturing the near-wall flow behavior, a boundary layer mesh was implemented in the numerical calculations. The mesh comprises 10 layers, with the first layer adjacent to the wall set to a thickness of 0.01 mm. Figure 5 illustrates the computational grid for the pump-turbine model [23]. To assess the accuracy of the wall treatment and ensure that turbulence near the wall is properly resolved, the average y+ values for each subdomain are listed in Table 4.
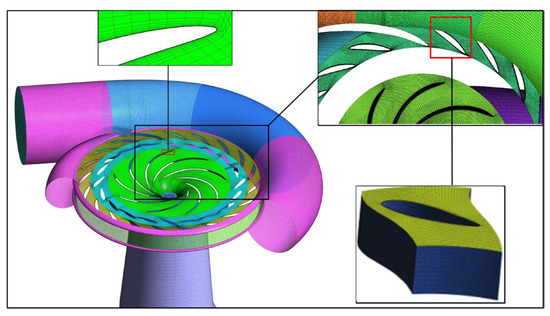
Figure 5.
Grid of the pump-turbine model. (Adapted from [23]).
Table 4.
Statistics of average y+ values in different regions.
In this study, four different guide vane openings were examined to assess their impact on the internal flow characteristics and overall performance of the pump-turbine. During the mesh generation process, only the grid in the vicinity of the movable guide vanes was modified for each opening, while the rest of the computational domain retained a consistent mesh topology. To balance computational cost and analysis accuracy, the guide vane opening of 33 mm, which corresponded to an operating point with optimal hydraulic performance, was selected for the grid independence study.
For this operating condition, efficiency was chosen as the primary evaluation parameter. A series of six mesh configurations with increasing grid densities were generated, and simulations were performed under the same boundary conditions. As shown in Figure 6, the results indicate that once the total number of grid cells exceeded 5.75 million, the variation in calculated efficiency remained within 4%, suggesting acceptable convergence, demonstrating the flow’s well-organized behavior under this mesh resolution [23].
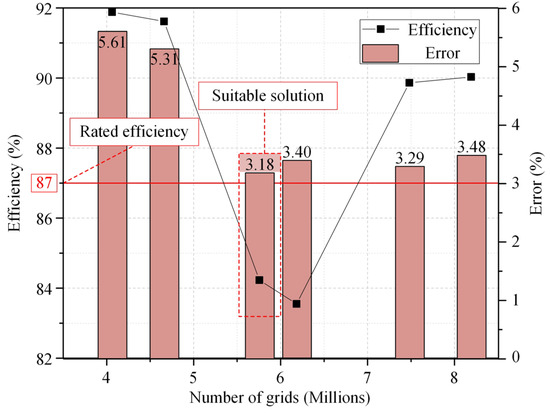
Figure 6.
Grid dependence detection. (Adapted from [23]).
Based on these findings, a grid comprising approximately 5.8 million elements was adopted for all subsequent simulations. This configuration was deemed sufficient to capture the essential flow features with high fidelity while maintaining a practical balance between computational accuracy and resource efficiency.
3.3. Experimental–Numerical Validation
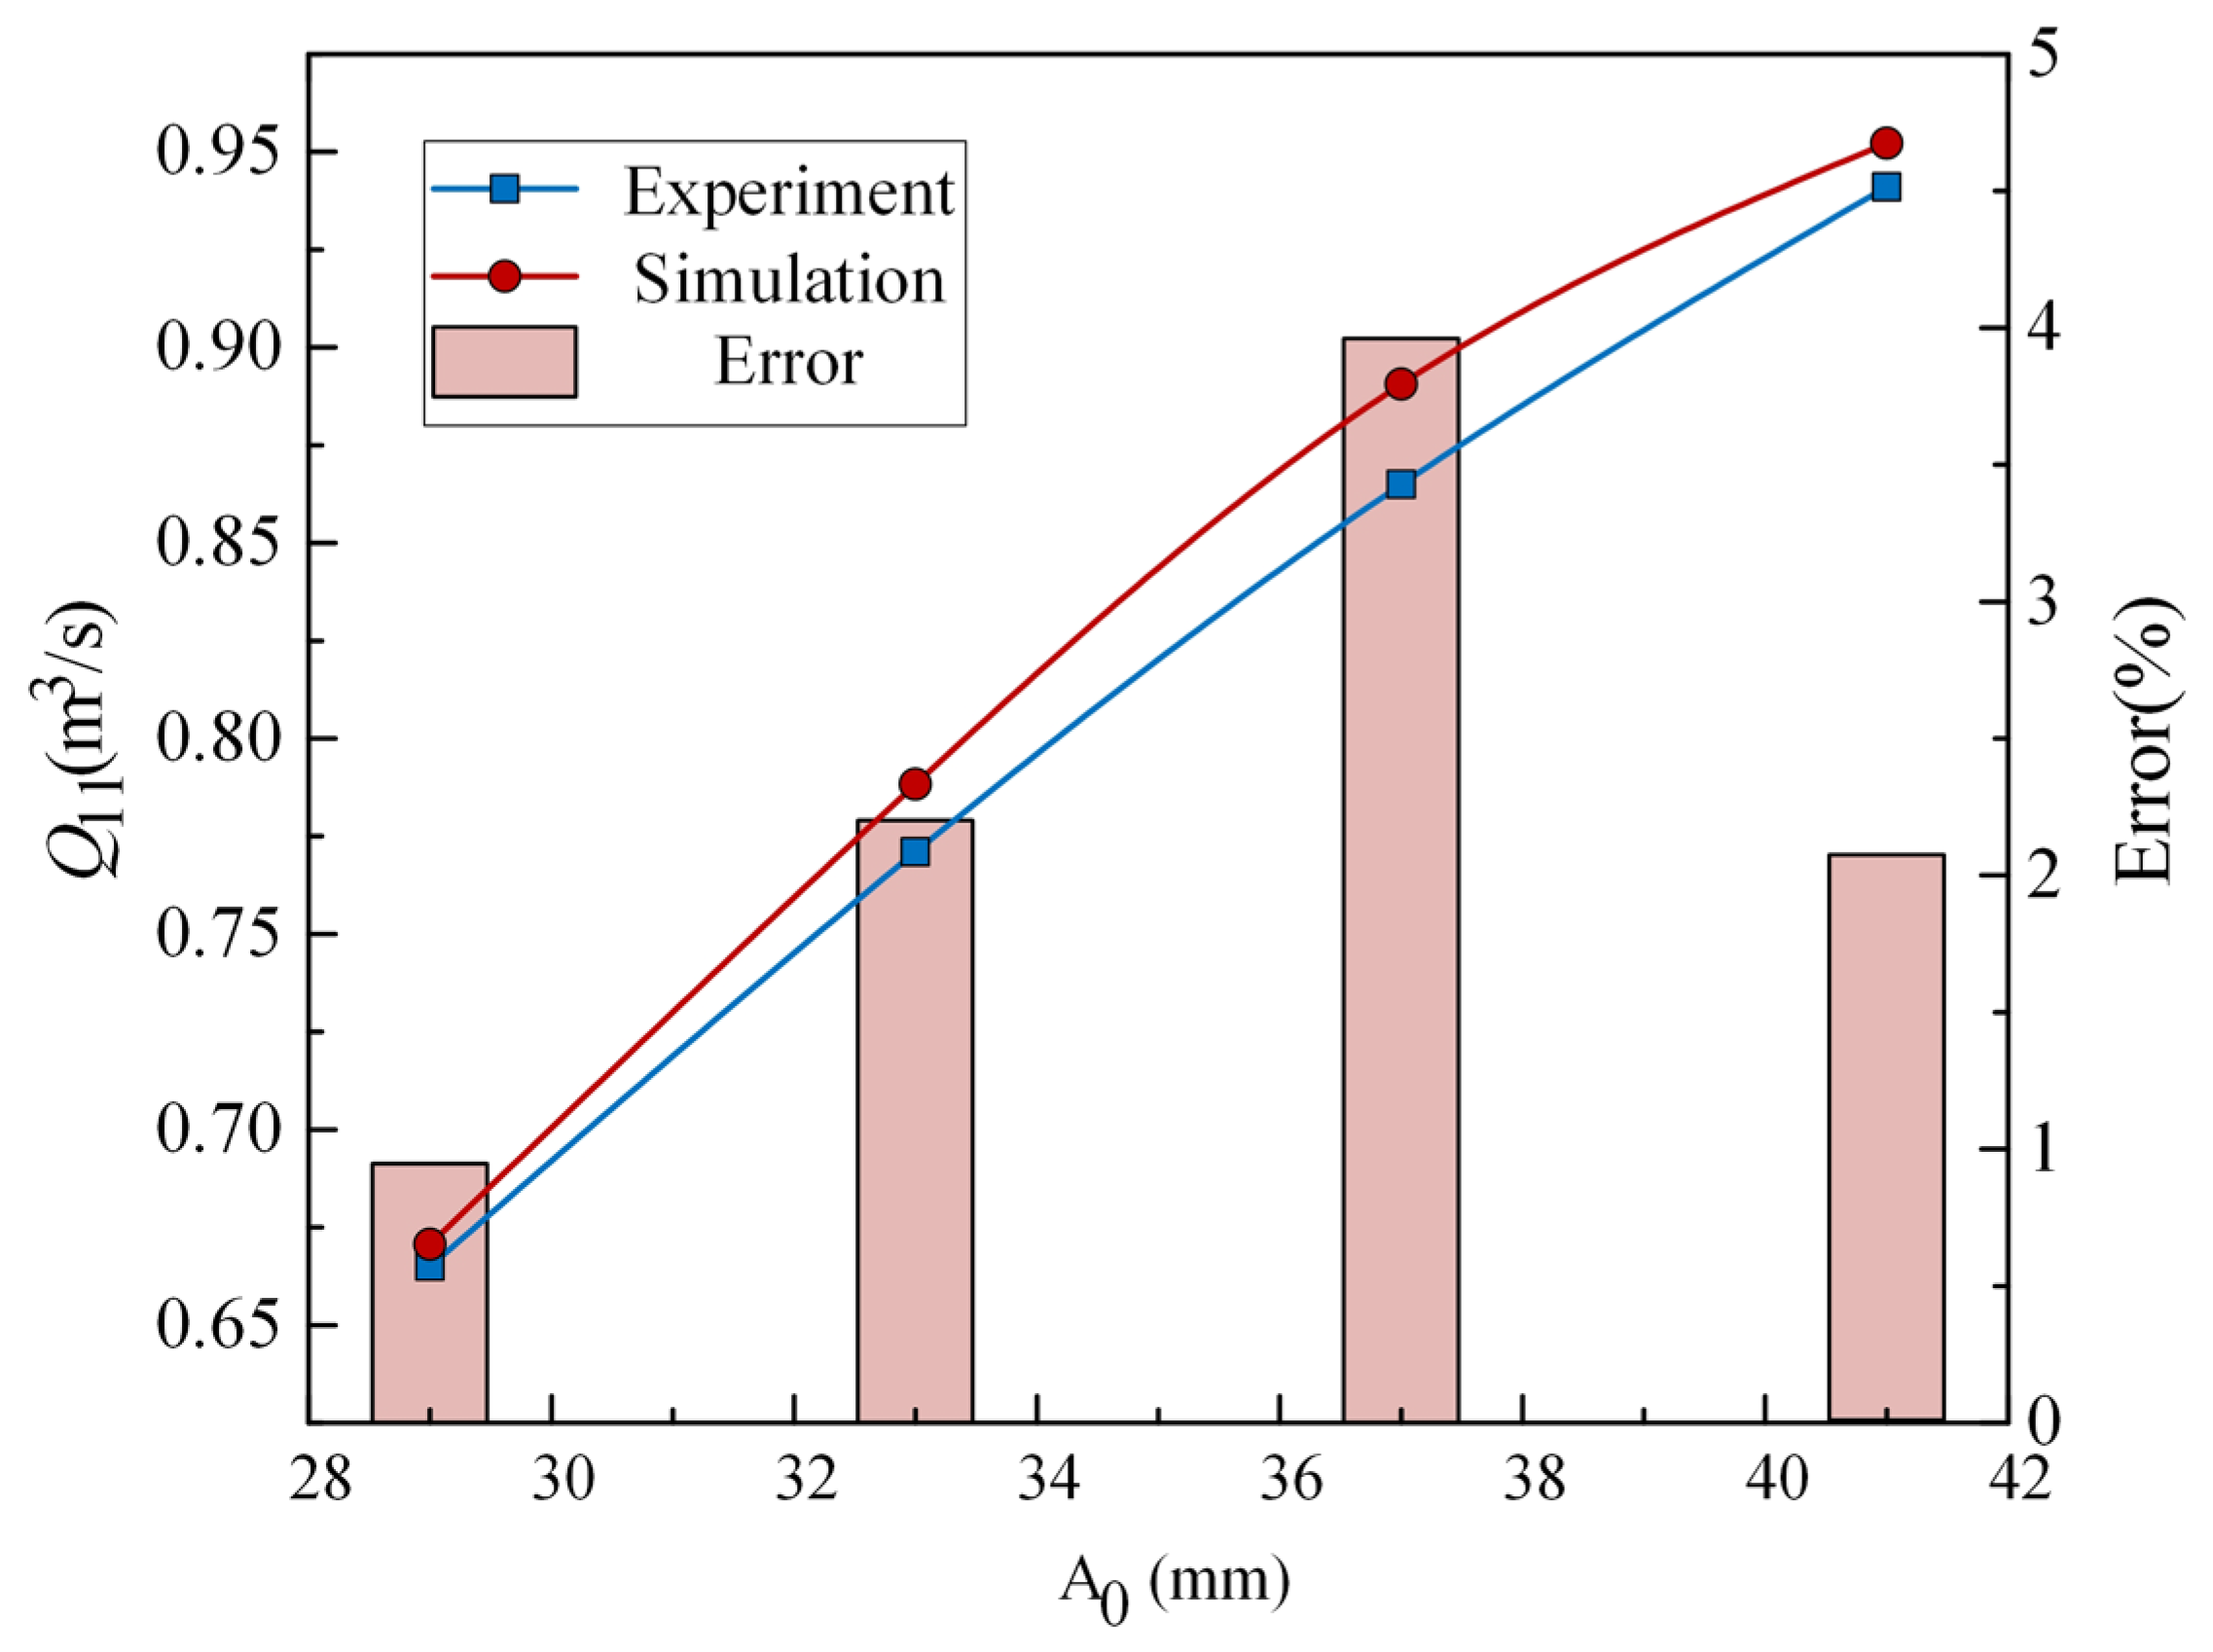
Numerical calculations were performed using the validated model grid, and the simulation results were compared with experimental data summarized in Table 2. In particular, the parameter Q11 was computed using Equation (3). Figure 7 presents a comparison between the experimental and numerical curves of Q11 as a function of the guide vane opening (A0).
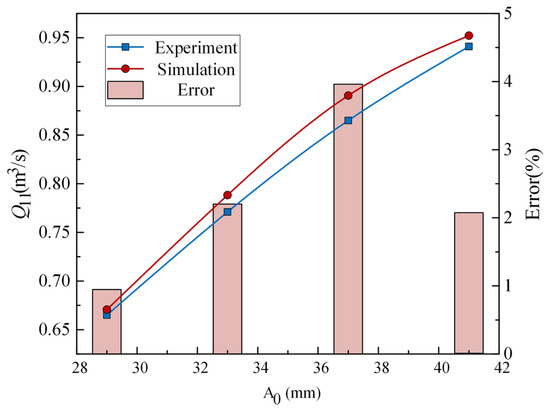
Figure 7.
Comparison of experimental and simulated values.
The results reveal that the relative error between the experimental data and simulation outcomes does not exceed 5%, which is within an acceptable error range. This close agreement confirms the reliability and accuracy of the numerical simulations conducted in this study.
4. Numerical Calculation Results and Analysis
4.1. Turbulent Kinetic Energy Analysis Under Low-Head Conditions
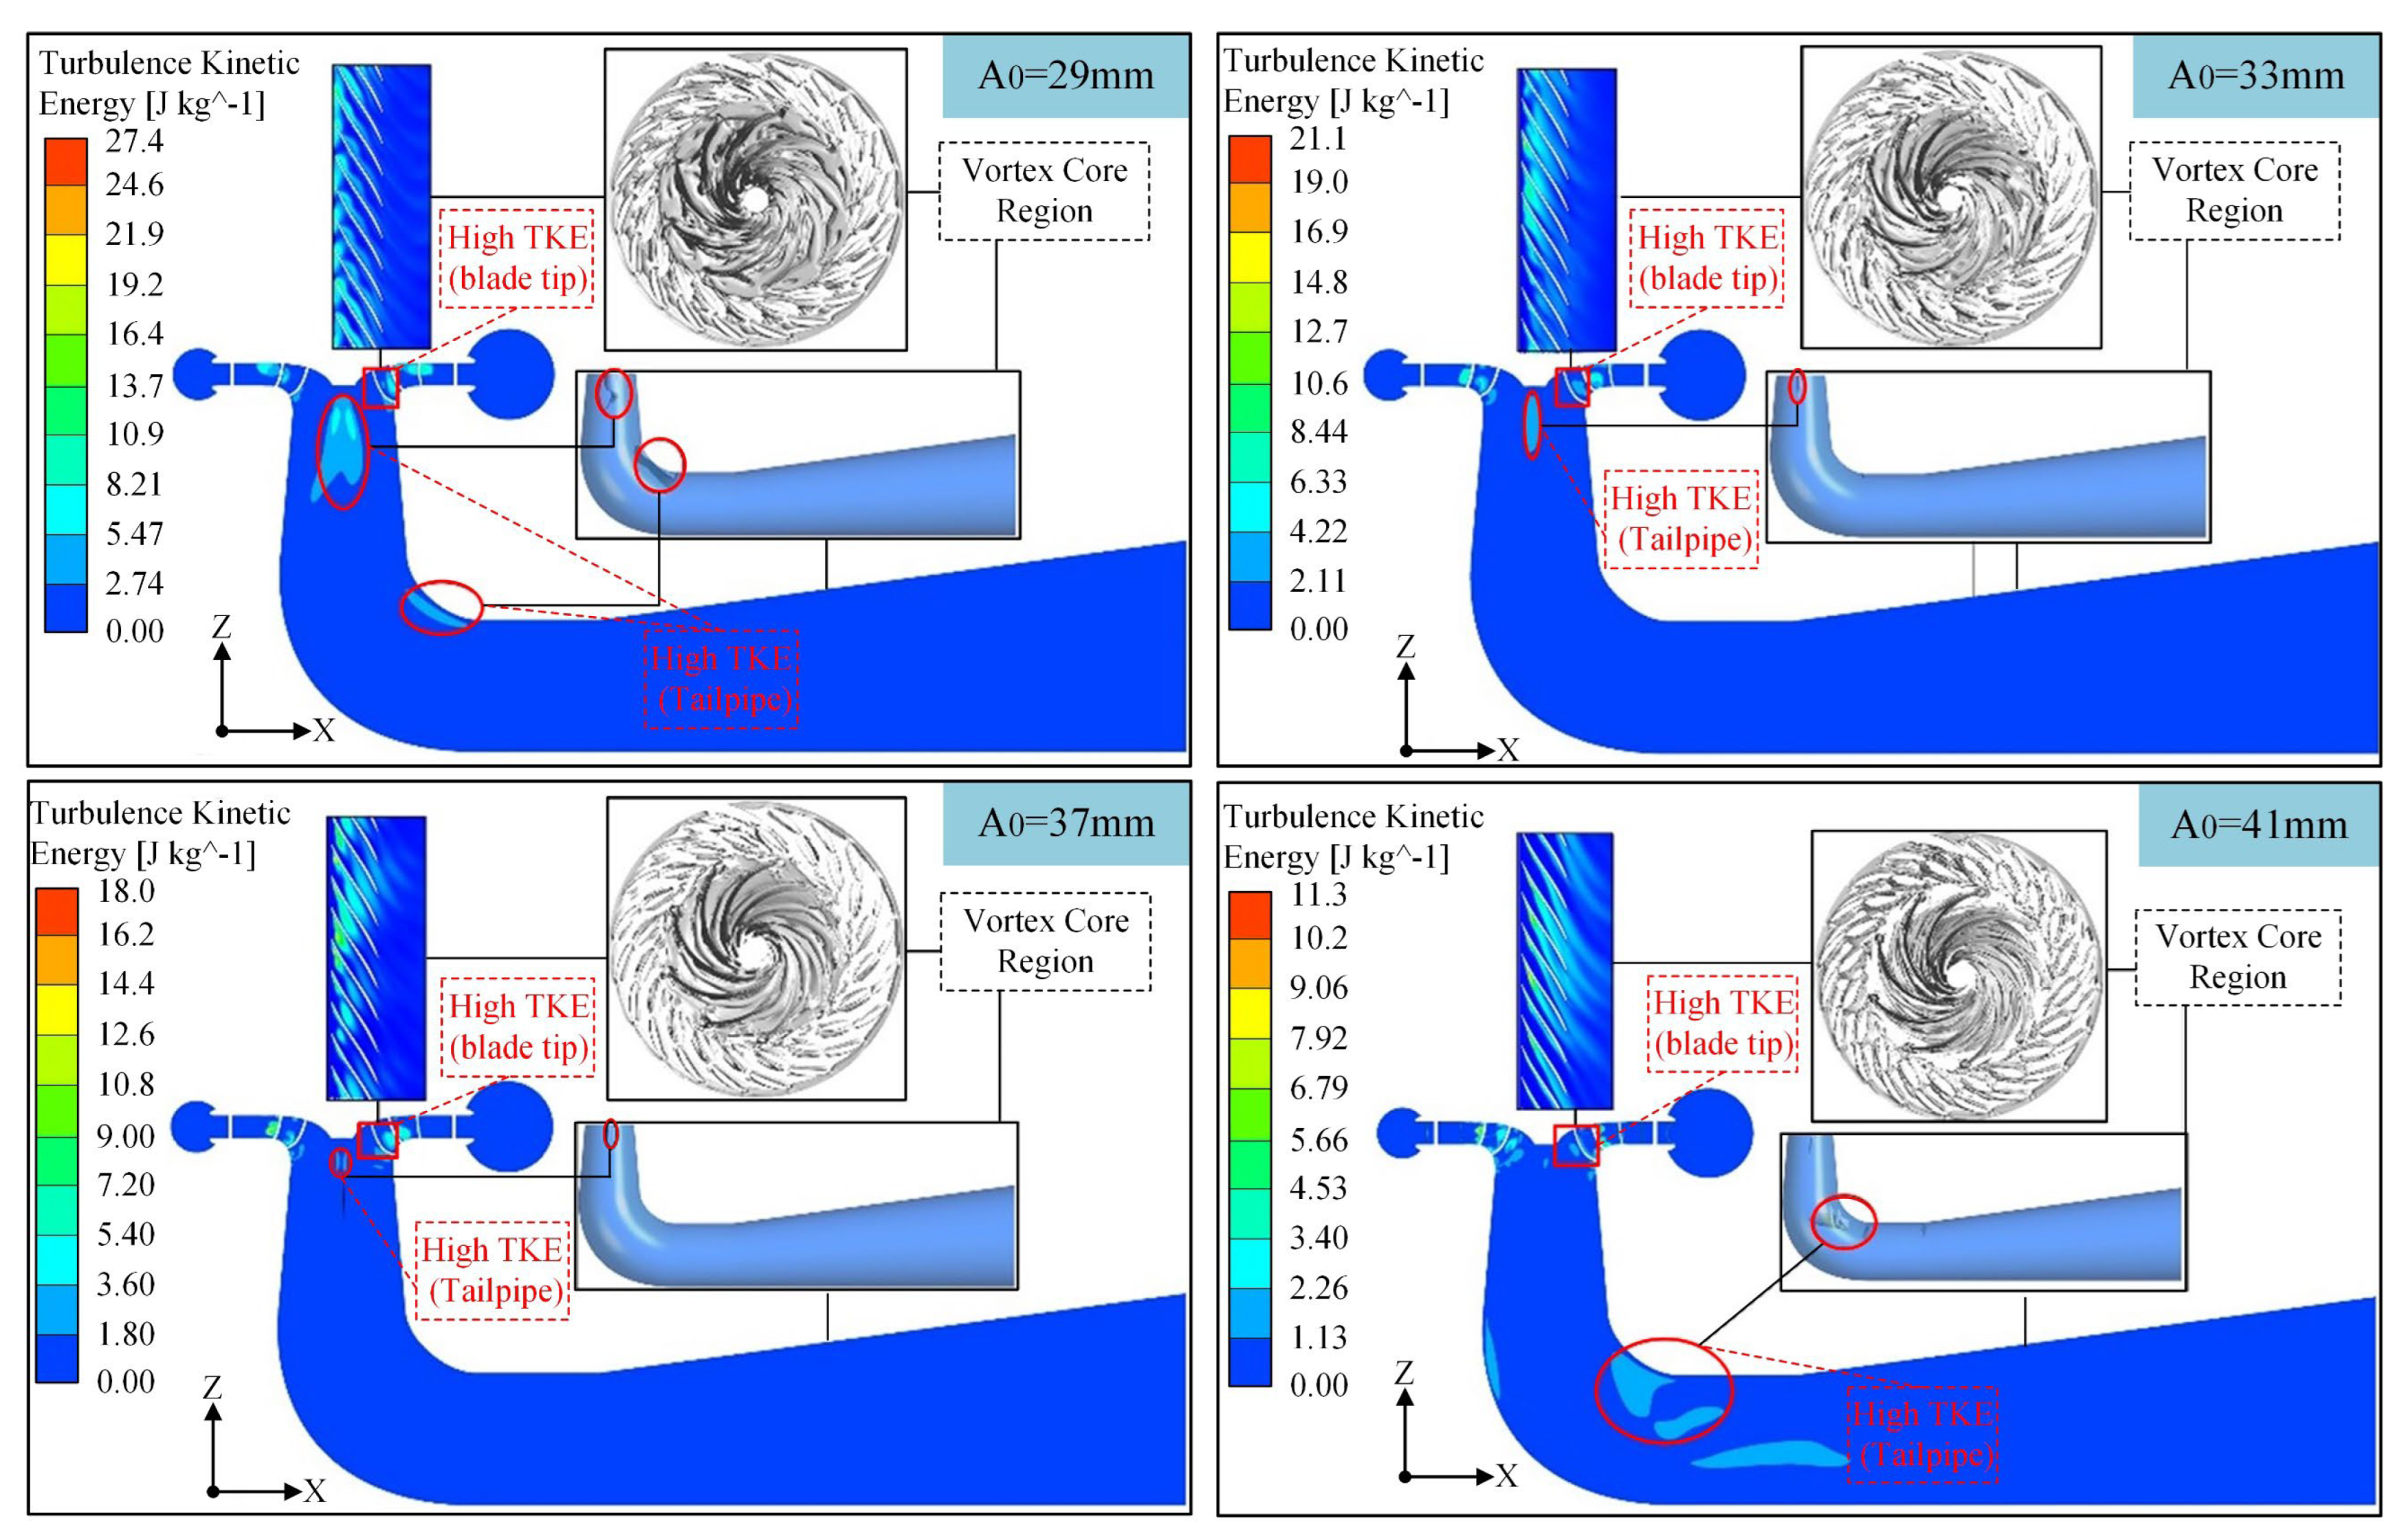
Analyzing turbulent kinetic energy (TKE) is essential for understanding energy distribution and transfer within fluid flows, as it reveals key aspects of the turbulent structure, including vortex formation. Such analysis is instrumental in identifying and mitigating energy losses due to turbulence, which in turn aids in predicting pressure fluctuations and vibrations. These insights are crucial for developing control strategies that minimize the adverse impacts of turbulence on equipment performance and environmental noise. Furthermore, a detailed TKE analysis facilitates the design of more effective experiments by guiding the selection of measurement points and sensor placements to obtain high-quality data. In this study, TKE distributions under abnormal low-head conditions are examined for different guide vane openings, as illustrated in Figure 8.

Figure 8.
Turbulent kinetic energy distribution.
As shown in Figure 8, the TKE is predominantly concentrated in the runner region and within the cone and shaft sections of the tailrace pipe. Specifically, the maximum TKE values decrease with increasing guide vane opening: 27.365 J/kg for A0 = 29 mm, 21.111 J/kg for A0 = 33 mm, 18.010 J/kg for A0 = 37 mm, and 11.318 J/kg for A0 = 41 mm. This trend indicates that larger guide vane openings are associated with a continuous reduction in maximum TKE, suggesting a corresponding decrease in energy losses due to turbulence.
A closer examination of the runner blade passage reveals that the TKE is mainly concentrated on the suction side of the blades, particularly near the blade outlet and tip. Analysis of the vortex core distribution confirms that these regions, especially near the blade tip on the suction side, are the primary locations of vortex formation. These vortex cores contribute to localized flow instability and distortion, thereby elevating the TKE in these regions. Moreover, the blade tip is a critical zone for rotor–stator interactions; the resulting flow distortions further amplify local turbulence levels.
In the tailrace pipe, the presence of the draft cone induces the formation of a distinct vortex band in the cone section during operation. The TKE distribution in this area closely mirrors the vortex core distribution, indicating that the unstable flow in the cone and shaft sections is primarily responsible for the elevated TKE. The vortex flows generated in these regions contribute to increased energy dissipation, which can lead to higher mechanical impacts and vibrations.
In summary, the analysis indicates that under abnormal low-head conditions, an increase in guide vane opening results in a reduction in the maximum turbulent kinetic energy. This observation suggests that larger guide vane openings can effectively decrease energy losses due to turbulence, thereby potentially reducing pressure fluctuations and mitigating vibration-induced impacts on the system.
4.2. Pressure Fluctuation Analysis Under Low-Head Conditions
Under low-head operating conditions, the turbulent kinetic energy (TKE) distribution (Figure 8) reveals that high TKE is primarily concentrated in the runner region as well as in the cone and shaft sections of the tailrace pipe. This concentration results from the unstable flow conditions characteristic of abnormal low-head operations, where the formation of vortices increases local energy dissipation, leading to elevated impacts and vibrations.
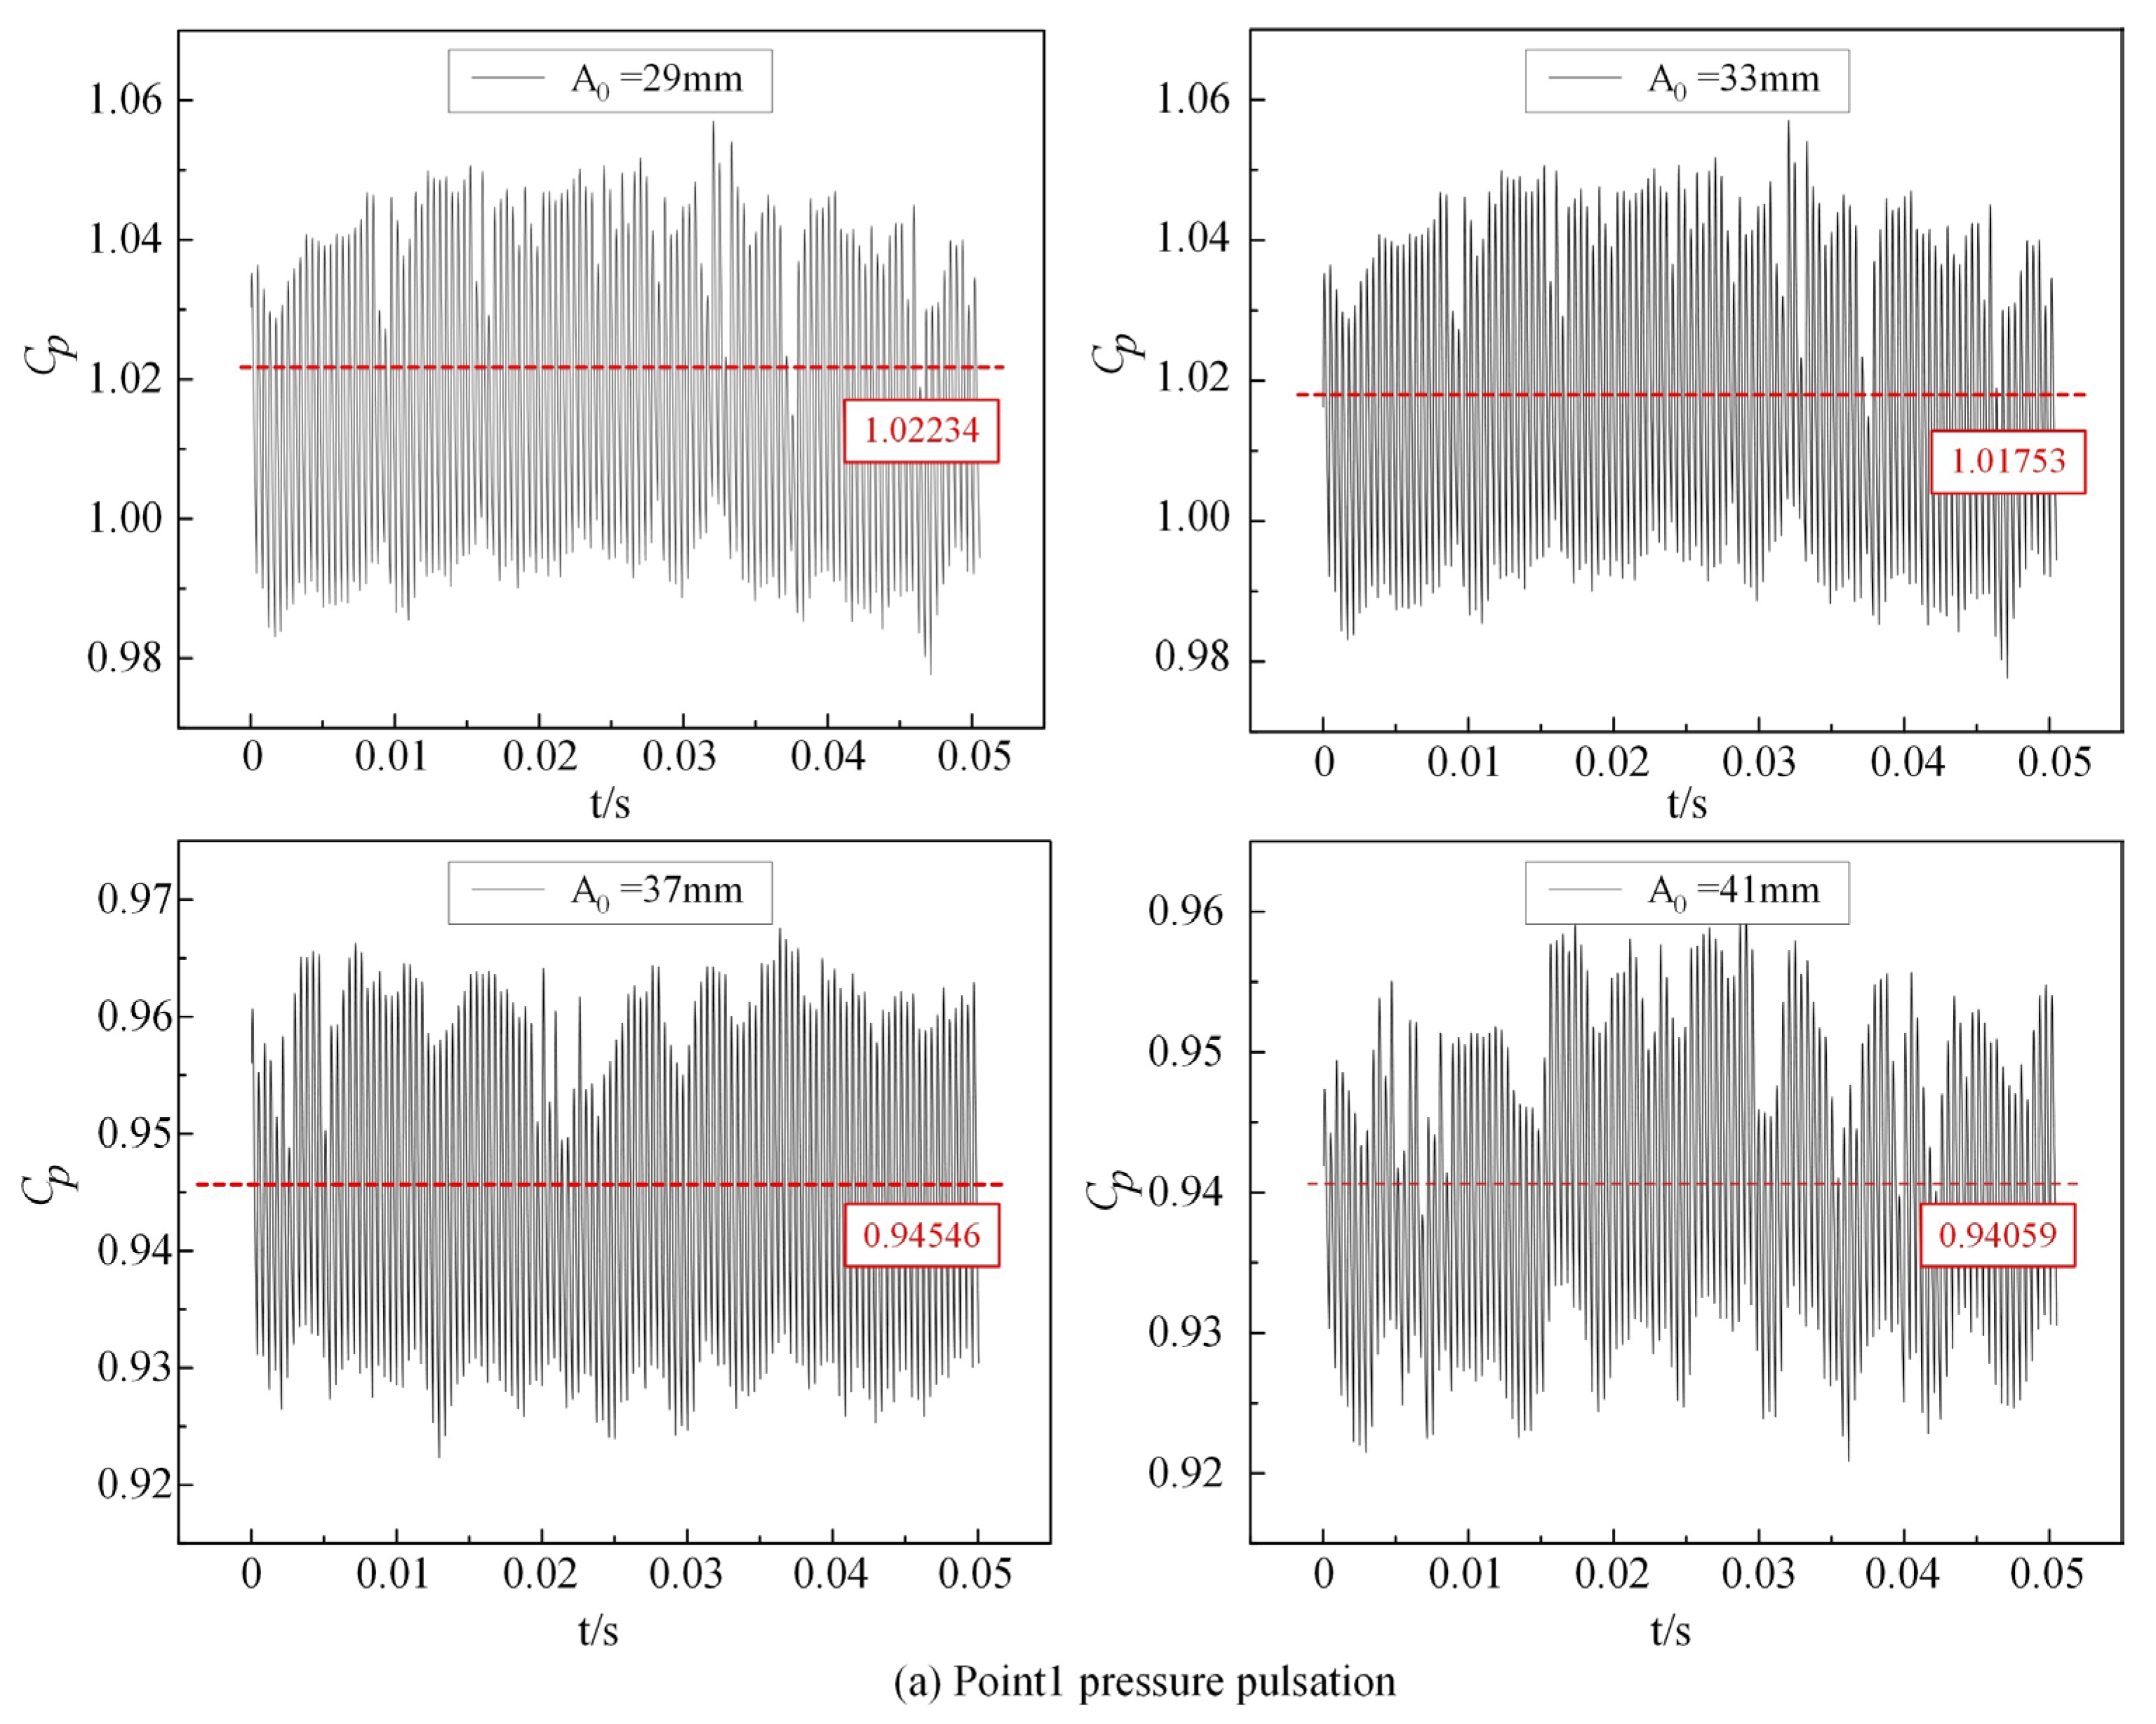
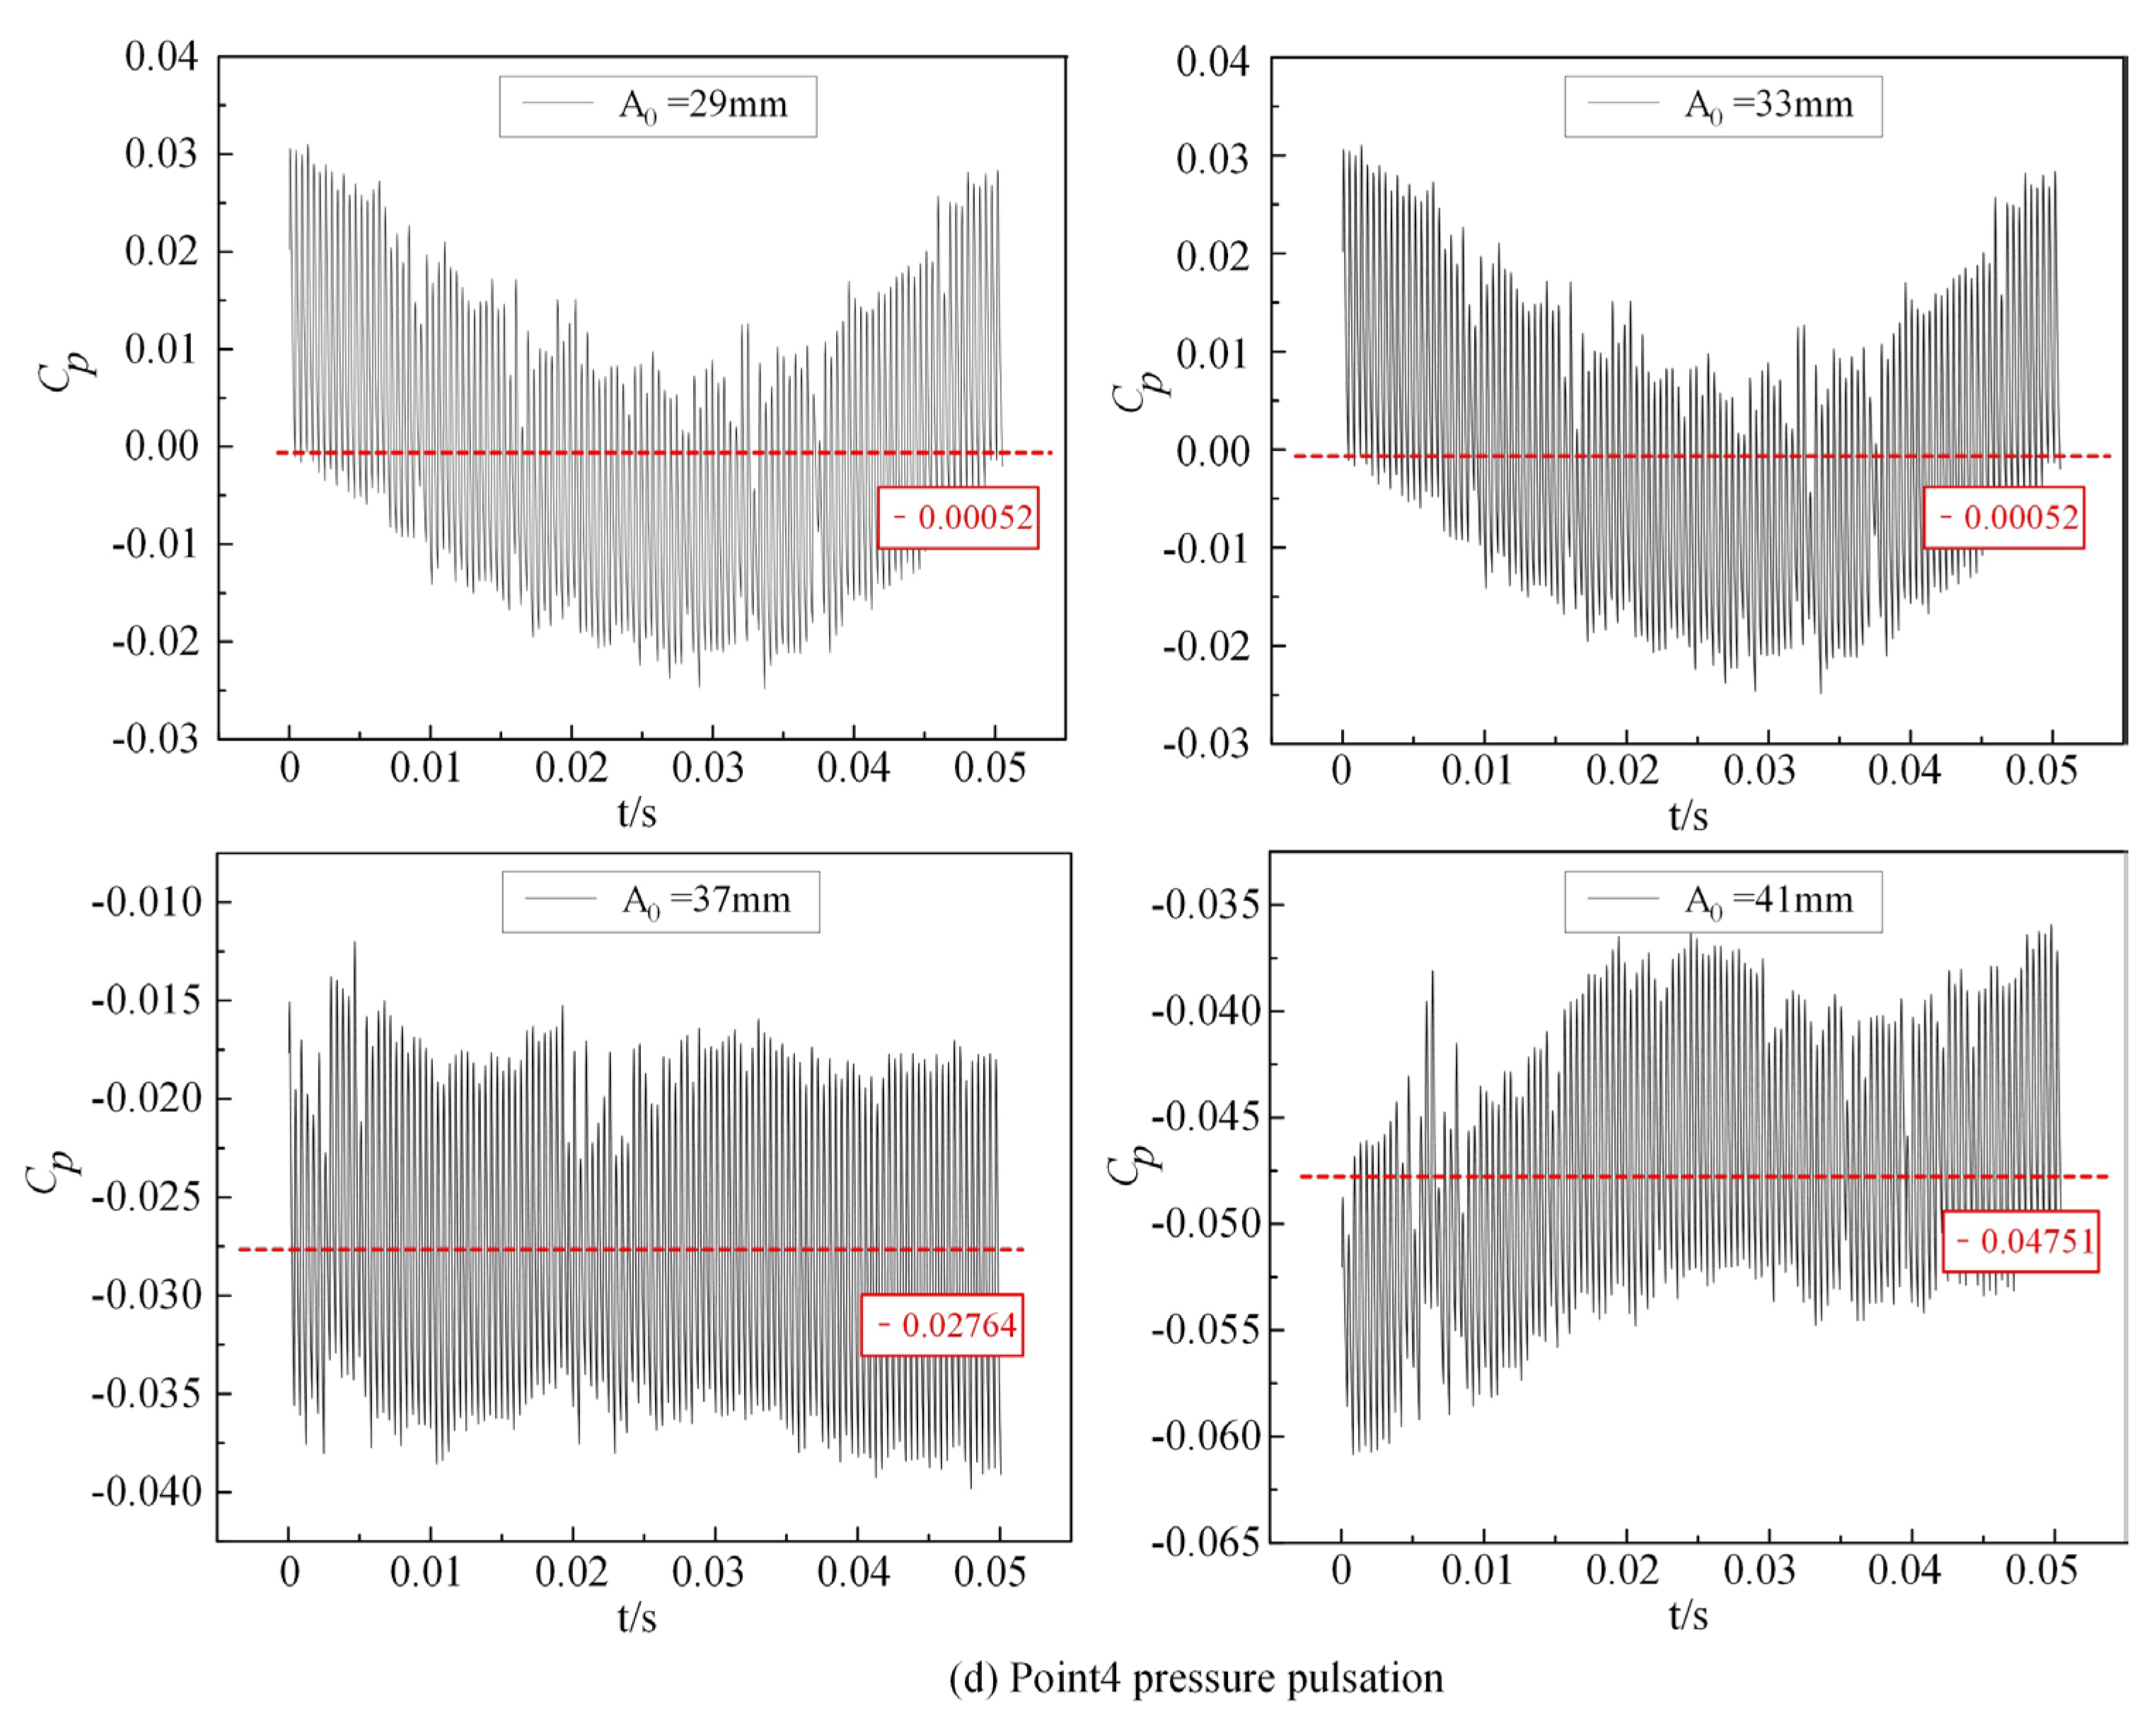
To further investigate these vibrations, pressure fluctuation measurements were conducted at monitoring points corresponding to the experimental setup (Figure 9). In order to quantitatively describe the pressure pulsation behavior of the internal flow field under these conditions, a dimensionless pressure pulsation coefficient, CP, is introduced. This coefficient characterizes the temporal fluctuations in pressure, providing a robust metric for assessing the influence of turbulent instabilities on the pump-turbine performance.
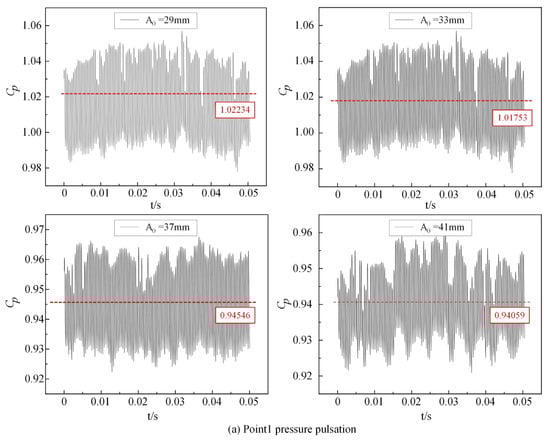
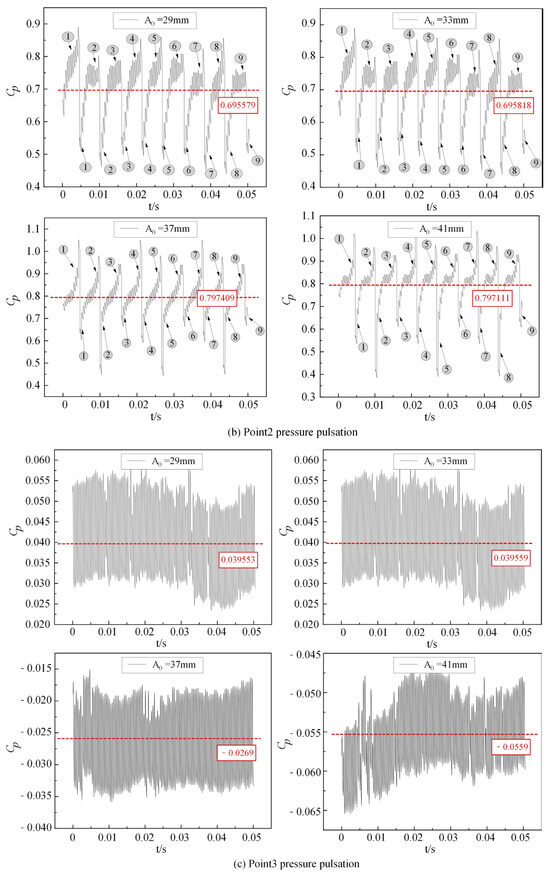
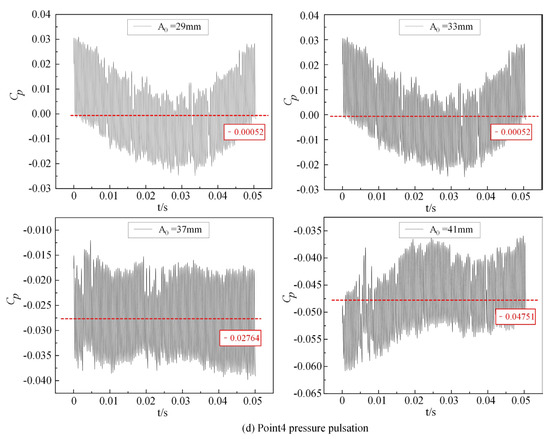
Figure 9.
Pressure pulsation distribution.
From Figure 9, the pressure pulsation coefficient (CP) measurements at the volute inlet (Figure 9a) and the blade-free zone (areas of flow that are not directly affected by the blades) (Figure 9b) clearly show the influence of varying guide vane openings. At the volute inlet, when A0 = 29 mm and A0 = 33 mm, the average CP is approximately 1.02234 and 1.01753, with a fluctuation range of about 0.08. As the guide vane opening increases to 37 mm and 41 mm, the average CP decreases to around 0.94546 and 0.94059, respectively, with the fluctuation range reducing to 0.05 and 0.04. In contrast, at the blade-free zone, the average CP is about 0.6956 with a peak-to-valley difference of roughly 0.45 for A0 = 29 mm and A0 = 33 mm; however, for A0 = 37 mm and A0 = 41 mm, the average CP increases to approximately 0.797, with the peak-to-valley difference rising to around 0.60885 and 0.65065, respectively. These results indicate that while the volute inlet experiences a reduction in both the average pressure pulsation coefficient and its variability with increasing guide vane opening, the blade-free zone exhibits an increase in both the average CP and its amplitude, reflecting heightened flow instability in that region.
Figure 9c,d present the pressure fluctuation characteristics at the downstream cone section (panel Figure 9c) and the inner side of the shaft tube (panel Figure 9d). In the downstream cone section, both the average CP and its fluctuation range consistently decrease as the guide vane opening increases, indicating improved flow stability and reduced energy dissipation. Similarly, within the shaft tube, the pressure pulsation trend initially shows a decrease followed by an increase for A0 = 29 mm and A0 = 33 mm, but for larger guide vane openings, both the average CP and its variation range steadily decline. This behavior confirms that the regions downstream of the cone and inside the shaft tube are less affected by pressure fluctuations when the guide vane opening is increased, further suggesting a reduction in flow instability and related vibrational impacts.
In summary, under abnormal low-head operating conditions, the pump-turbine exhibits significant pressure fluctuations in several key regions, including the volute inlet, the blade-free zone, the downstream cone section, and the inner side of the shaft tube. Notably, variations in guide vane opening markedly influence these pressure pulsations. Among the evaluated regions, the blade-free zone experiences the most intense fluctuations, while the inner side of the shaft tube shows the least variability. In the blade-free zone, the pressure fluctuations follow a regular pattern, with the number of peaks and valleys corresponding directly to the number of runner blades. This behavior is attributed to flow instabilities caused by rotor–stator interference during the rotation of the runner blades, which induces unstable flow from the runner inlet to the blade-free zone. As the guide vane opening increases, both the average pressure pulsation coefficient and the peak-to-valley amplitude in the blade-free zone also increase, reflecting enhanced flow instability. In contrast, the downstream cone section and the inner side of the shaft tube demonstrate relatively minor fluctuations that further decrease with larger guide vane openings, indicating improved flow stability in these regions.
4.3. Runner Force Analysis Under Low-Head Conditions
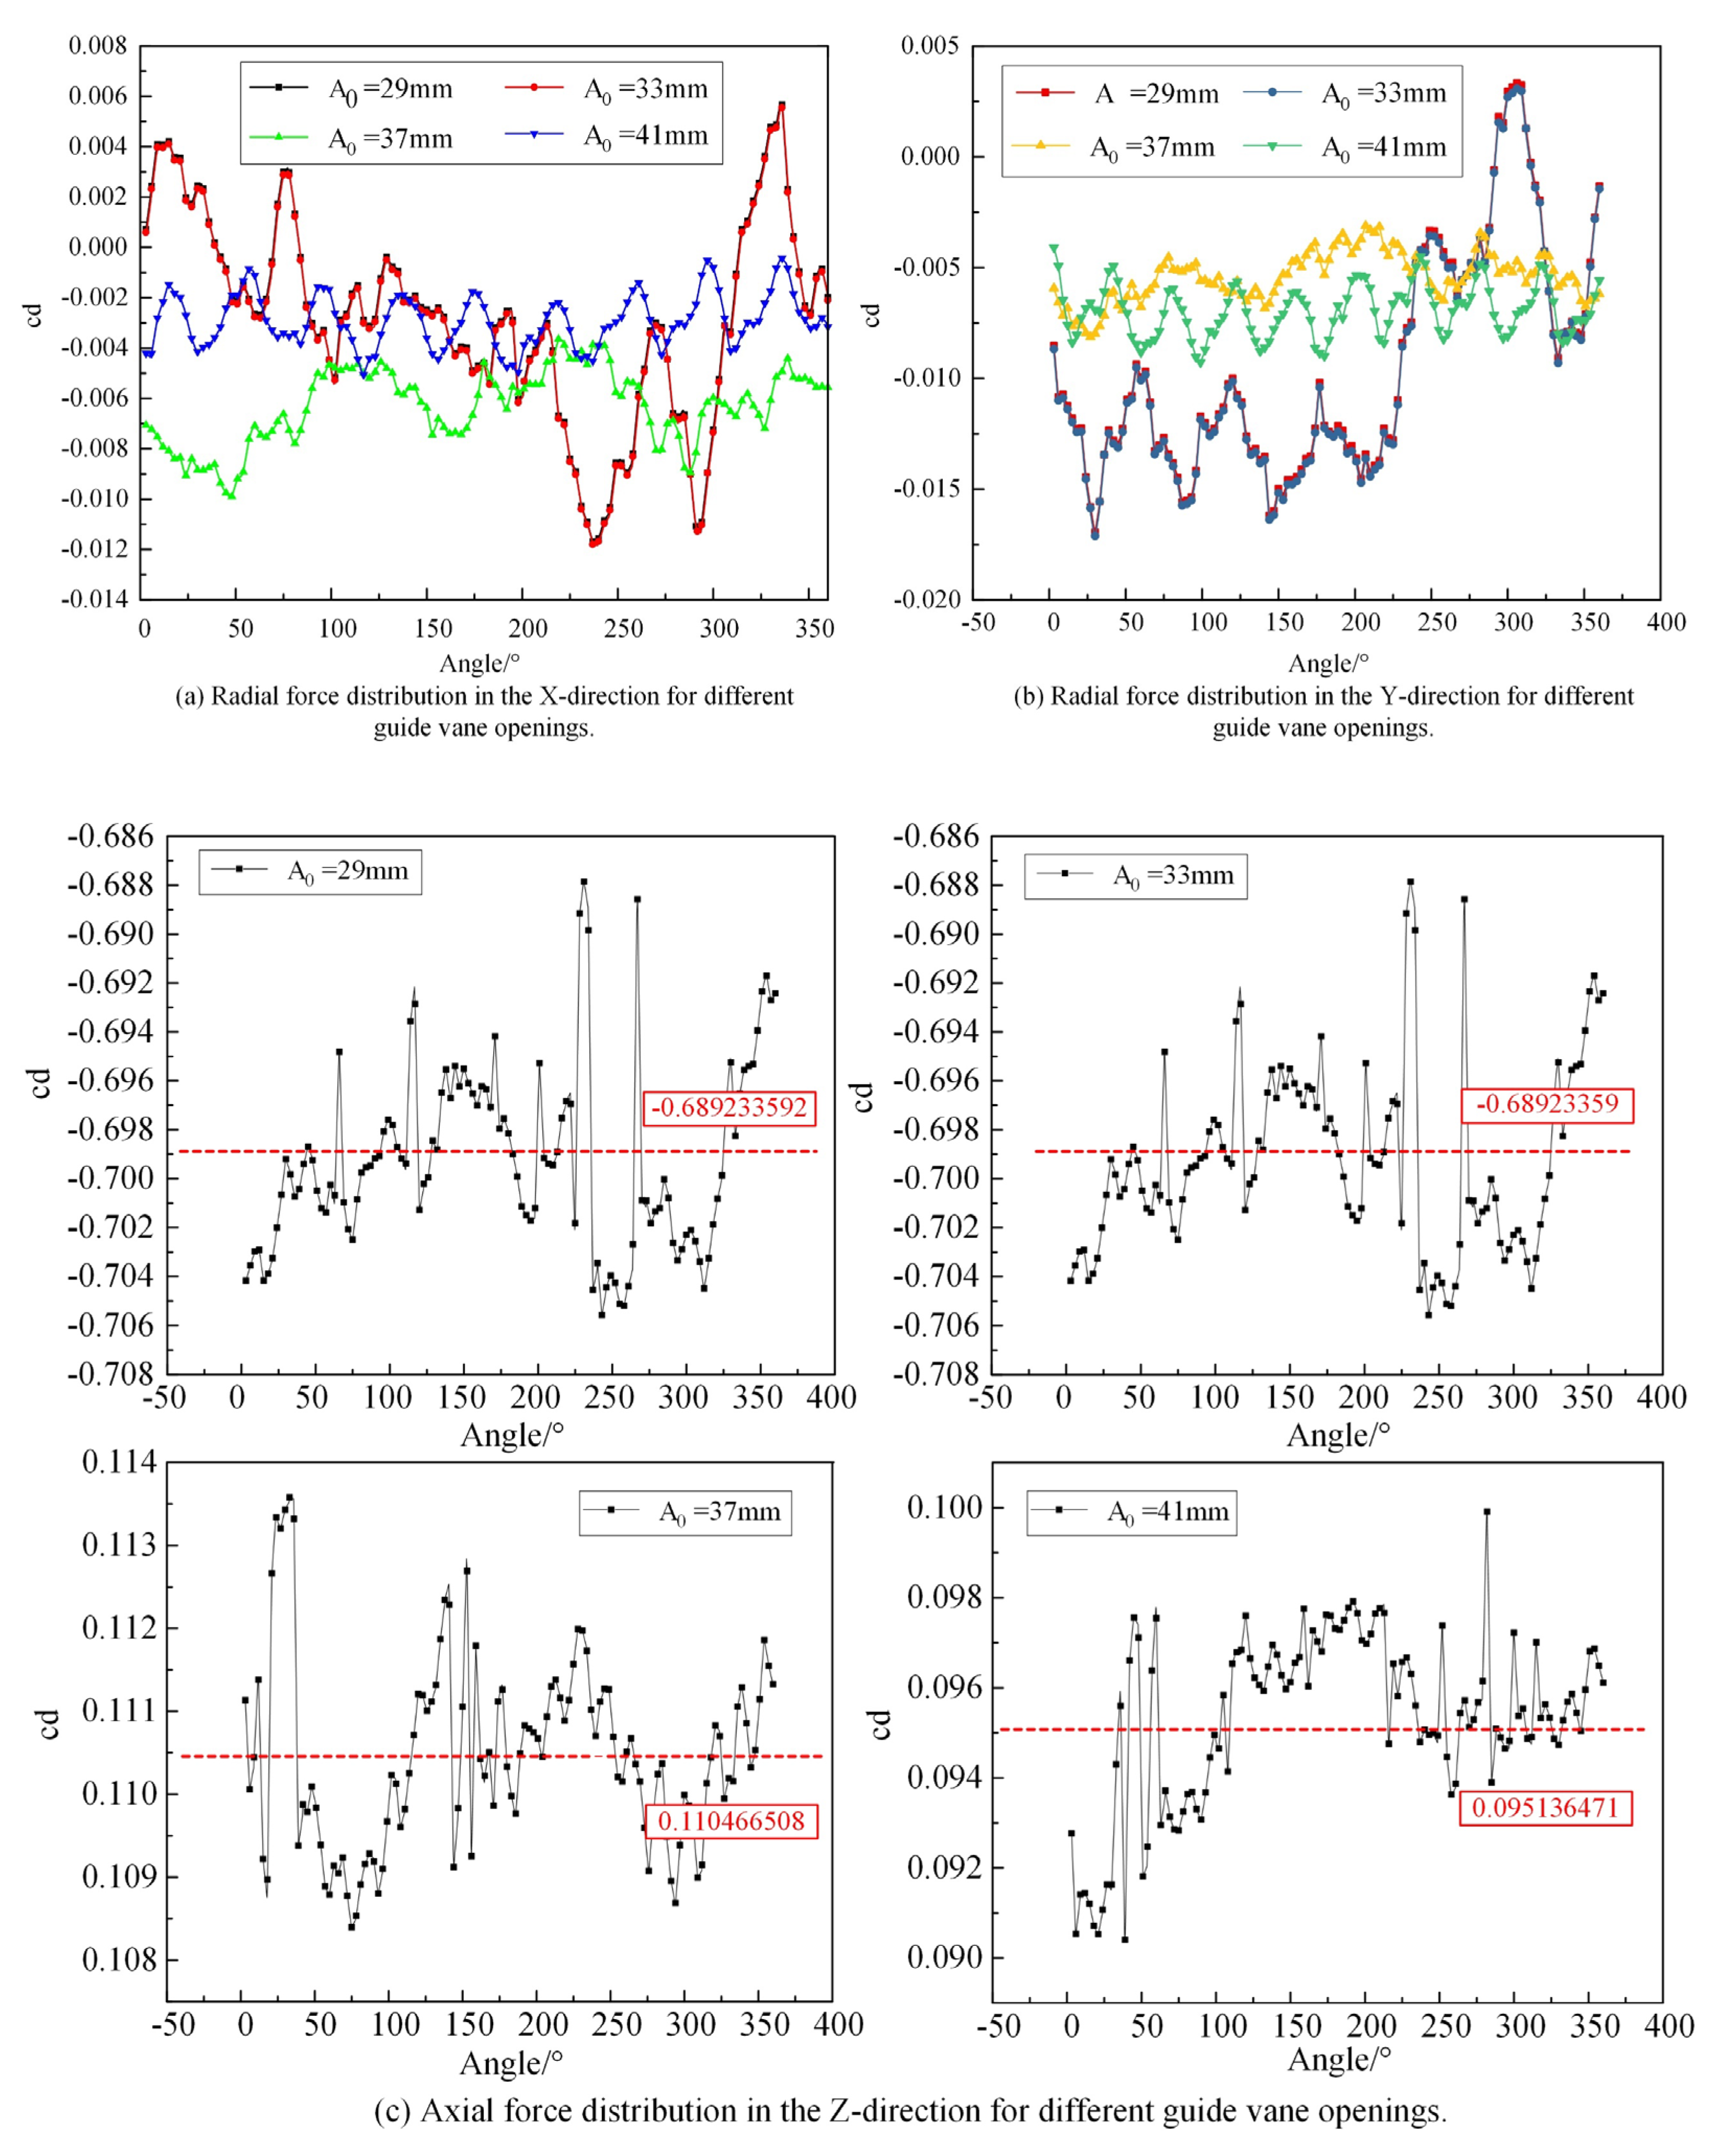
The complex internal flow variations in the runner passages under abnormal low-head conditions lead to flow distortion within the runner. This distortion generates passage vortices, which not only cause energy losses but also result in vibrations within the internal flow passages. These vibrations impact the hydrodynamic forces acting on the runner. Therefore, during numerical simulations, the radial and axial forces in the X, Y, and Z directions were recorded throughout a complete revolution of the runner, as shown in Figure 10. To enable meaningful comparison under different guide vane openings, the non-dimensional force coefficient cd was used, defined as follows:
where F is the instantaneous force, ρ is the fluid density, U is the characteristic flow velocity, and A is the reference area.
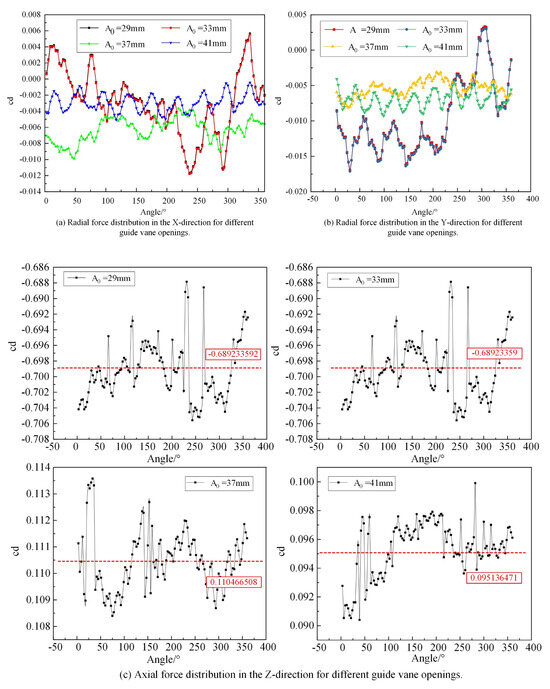
Figure 10.
Vorticity distribution of runner.
Under abnormal low-head conditions, complex flow variations in the runner passages induce significant flow distortions and vortex formations, leading to both energy losses and flow-induced vibrations. These vibrations directly affect the forces acting on the runner. To quantify this effect, numerical simulations were performed to monitor the radial and axial forces in the X, Y, and Z directions over a full rotation of the runner. The corresponding force coefficients were recorded, as shown in Figure 10. In Figure 10a, the radial force in the X direction is relatively stable at guide vane openings of A0 = 29 mm and 33 mm, while larger fluctuations occur at A0 = 37 mm and 41 mm. The maximum radial force coefficient in the X direction appears at A0 = 29 mm and 33 mm, with the minimum observed at 37 mm and an intermediate value at 41 mm, which also exhibits the smallest fluctuation range. The periodic peaks and valleys correspond to the number of runner blades. Similarly, Figure 10b shows that the radial force in the Y direction exhibits consistent behavior at A0 = 29 mm and 33 mm, while for A0 = 37 mm and 41 mm, more pronounced fluctuations occur during the latter half of the cycle—with the A0 = 41 mm case displaying the smoothest trend and minimal variation. In Figure 10c, the axial force in the Z direction demonstrates significant fluctuations at all guide vane openings, with the number of peaks and valleys matching the number of blades; however, the amplitude of these fluctuations is smallest at A0 = 41 mm.
Overall, the analysis indicates that under abnormal low-head conditions, variations in guide vane opening substantially influence the forces on the runner due to induced flow distortions and uneven loading. The resulting periodic force fluctuations, which mirror the blade configuration, are most pronounced at lower guide vane openings. Notably, at A0 = 41 mm, the runner experiences more uniform force fluctuations, suggesting that this setting minimizes the impact of flow-induced vibrations. Therefore, to achieve a stable and uniformly loaded runner under low-head operating conditions, it is recommended to operate with a guide vane opening of A0 = 41 mm.
5. Conclusions
Based on experimental data and unsteady numerical simulations conducted under abnormal low-head conditions, the influence of guide vane opening variations on the pump-turbine’s performance was systematically investigated. The following conclusions can be drawn from the analysis:
- (1)
- Turbulent kinetic energy (TKE) is generated in both the runner and the tailrace pipe during operation at different guide vane openings. In the runner, TKE is predominantly concentrated on the suction side of the blades, whereas in the tailrace pipe it is mainly distributed along the straight pipe section. Notably, as the guide vane opening increases, the TKE decreases, indicating that a larger opening under abnormal low-head conditions reduces energy losses in both the runner and tailrace pipe regions.
- (2)
- Significant pressure fluctuations were observed at the volute inlet, blade-free zone, downstream of the cone, and on the inner side of the shaft tube. The blade-free zone exhibits the most pronounced fluctuations, following a regular pattern with the number of peaks and valleys corresponding to the number of runner blades. This phenomenon is attributed to rotor–stator interference that induces considerable flow distortion and enhances energy transfer variability. In contrast, pressure fluctuations in the downstream cone and shaft tube regions are relatively small and tend to decrease with increasing guide vane opening.
- (3)
- The analysis of the runner forces reveals that variations in guide vane opening markedly affect the force distribution on the runner. At a guide vane opening of A0 = 41 mm, the force fluctuations are more uniform, with the periodic peaks and valleys matching the number of runner blades. This suggests that operating at A0 = 41 mm under abnormal low-head conditions yields a more stable and balanced loading on the runner.
Overall, the study demonstrates that increasing the guide vane opening under low-head conditions can effectively reduce turbulent energy losses and pressure fluctuations—especially in regions outside the blade-free zone—and achieve a more uniform force distribution on the runner. Therefore, for enhanced operational stability and reduced mechanical stress, a guide vane opening of A0 = 41 mm is recommended.
Author Contributions
X.C., Data Curation, Writing—Original Draft and Resources; Q.L., Funding Acquisition, Supervision and Writing—Review; L.X., Data Curation; S.Z., Methodology; M.C., Visualization; T.H., Formal Analysis. All authors have read and agreed to the published version of the manuscript.
Funding
National Natural Science Foundation of China (52066011); Jiuquan Vocational Technical College doctoral fund project (2024XJBXM01).
Data Availability Statement
The original contributions presented in the study are included in the article, and further inquiries can be directed to the corresponding author.
Acknowledgments
The authors would like to thank the anonymous reviewers and the editor for their valuable and insightful suggestions.
Conflicts of Interest
Author Lu Xin was employed by the company Tianjin Tianfa Heavy Hydroelectric Equipment Manufacturing Co., Ltd. The remaining authors declare that the research was conducted in the absence of any commercial or financial relationships that could be construed as a potential conflict of interest.
References
- Huang, Y. The Key to High Proportion of Renewable Energy Consumption Lies in Improving the Flexibility of the Power System. China Energy News, 14 July 2021. [Google Scholar]
- Qiao, Z. Discussion on the Development Issues and Countermeasures of Pumped Storage Power Stations. Hydropower New Energy 2020, 34, 34–38. [Google Scholar]
- Zhang, B.; Liu, H. Further Accelerate the Construction of Pumped Storage, Electric Vehicle Energy Storage, and Other Types of Energy Storage. China Nonferrous Met. 2024, 48. [Google Scholar]
- Li, W.; Li, Z.; Han, W.; Wang, Y.; Zhao, J.; Zhou, J. Morphologic transformation of ferrofluid during micropump driving under field control. Ann. N. Y. Acad. Sci. 2025, 1543, 194–203. [Google Scholar] [CrossRef] [PubMed]
- Zhou, W.; Ma, J.; Ma, Z.; Yu, W.; Su, H.; Gao, B. Fluid–structure interaction on the rotor-dynamic characteristics of a low-specific-speed centrifugal pump considering multi-scale fluid excitation effects. Phys. Fluids 2024, 36, 117157. [Google Scholar] [CrossRef]
- Zhou, W.; Yu, D.; Wang, Y.; Shi, J.; Gan, B. Research on the fluid-induced excitation characteristics of the centrifugal pump considering the compound whirl effect. Facta Univ. Ser. Mech. Eng. 2023, 21, 223–238. [Google Scholar] [CrossRef]
- Zhang, Z.; Yang, H.; Yang, H.; Lin, X.; Liu, H.; Zheng, Y.; Kan, K. Study on Pressure Pulsations and Internal Flow Evolution During the Low-Head Start-Up Process of Pumped-Storage Turbines. Water Resour. Hydropower Technol. (Chin. Engl.) 2024, 1–19. [Google Scholar] [CrossRef]
- Chen, H.; Liu, H.; Wang, Y.; Zhou, D.; Xu, H.; Kan, K. Analysis of Pressure Pulsations During the Low-Head Start-Up Transition Process of Pumped Storage Units. Trans. Chin. Soc. Agric. Eng. 2023, 39, 63–72. [Google Scholar]
- Zheng, Y.; Wang, X.; Meng, L.; Xue, P.; Zhang, C.; Tian, Y. Optimization of Pump Operating Conditions for Low-Head Wide-Range Pumped Storage Units. Hydropower Pumped Storage 2024, 10, 113–120. [Google Scholar]
- Wang, Y.; Zhou, D.; Chen, H.; Kan, K.; Guo, J. Hydraulic Characteristics Analysis of the Low-Head Start-Up Process of Pumped-Storage Turbines. In Proceedings of the CSEE, Lisbon, Portugal, 29–31 March 2023; Volume 43, pp. 2699–2708. [Google Scholar]
- Li, Y. Optimization of Low-Head Sequential Start-Up for Pumped-Storage Units and Predictive Control Considering Wind Power Uncertainty. Ph.D. Dissertation, Huazhong University of Science and Technology, Wuhan, China, 2021. [Google Scholar]
- Zhu, H.; Su, S. Improvement of No-Load Stability of Energy Storage Units at Low Head with Pre-Opening Guide Vanes. Hydropower New Energy 2016, 50–54. [Google Scholar] [CrossRef]
- Mao, X.; Zheng, Y.; Yu, L.; Qu, B. Approximate Calculation of the Flow Capacity for Low-Head Mixed-Flow Pumped-Storage Turbines. J. Dalian Univ. Technol. 2015, 55, 523–528. [Google Scholar]
- Qin, D. Research on Coordinated Optimization and Dynamic Load-Variation Characteristics of Low-Head Through-Flow Turbines. PhD Dissertation, Xi’an University of Technology, Xi’an, China, 2024. [Google Scholar]
- Sun, J.; Cai, J.; Jiang, B.; Han, Y.; Zhang, H.; Wu, E.; Ge, X.; Zheng, Y. Numerical Simulation of Flow Characteristics of Ultra-Low Head Two-Blade Bulb Turbines. Hydropower Energy Sci. 2022, 40, 172–175. [Google Scholar]
- Guo, J.; Zhou, D.; Chen, H.; Wang, Y. Analysis of the Impact of Guide Vane Fluctuations on the No-Load Stability of Pumped-Storage Units at Low Head. In Proceedings of the CSEE, Lisbon, Portugal, 10–12 April 2022; Volume 42. [Google Scholar]
- Yu, Z. Energy Performance Study of Low-Head Large-Flow Variable-Speed Mixed-Flow Turbines Based on Entropy Generation Theory. PhD Dissertation, Kunming University of Science and Technology, Kunming, China, 2023. [Google Scholar]
- Zhu, Q.; Gong, L.; Yuan, L.; Wu, Z. Numerical Analysis of Blade Passage Vortex Characteristics of a Low-Head Mixed-Flow Turbine. Electromech. Technol. Hydropower Stn. 2023, 46, 6–10+129. [Google Scholar]
- Byeon, S.S.; Boo, J.H.; Park, C.Y.; Kim, S.S.; Kim, Y.J. Numerical Study on the Flow Characteristics of Low Head Small Hydraulic Turbine. In Proceedings of the International Conference on Energy and Environmental Protection, Putrajaya, Malaysia, 5–6 March 2013. [Google Scholar]
- Chen, S.; He, Z.; Zhou, Z.; Pan, G.; Yan, D. Study on transient process of low water-head large pumping station while pumping off. J. Hydroelectr. Eng 2007, 5, 128–133. [Google Scholar]
- Song, H.; Xie, W.; Han, W.; Wang, S.; Huang, X.; Qiu, H.; Li, R. Study on Vibration and Failure of Transverse Flow Turbine Based on Fluid–Structure Interaction. Int. J. Struct. Stab. Dyn. 2024, 2550263. [Google Scholar] [CrossRef]
- Wang, W.; Wang, X.; Wang, Z.; Ni, M.; Yang, C. Analysis of Internal Flow Characteristics of a Startup Pump Turbine at the Lowest Head under No-Load Conditions. Mar. Sci. Eng. 2021, 9, 1360. [Google Scholar] [CrossRef]
- Chen, X.; Li, Q.; Xin, L.; Zhang, S.; Feng, L.; Han, T. Study on the influence of pre-guide vanes on the bladeless region of water pump turbine at small opening. AIP Adv. 2025, 15, 035228. [Google Scholar] [CrossRef]
- Zhang, L.; Wang, Z.; Chang, J. Flow Characteristics in the S-Shaped Region of the Full Characteristic Curve of a Mixed-Flow Pumped-Storage Turbine. Trans. Chin. Soc. Agric. Mach. 2011, 42, 9–43. [Google Scholar]
- Menter, F.R. Two-equation eddy-viscosity transport turbulence model for engineering applications. AIAA J. 1994, 32, 1598–1605. [Google Scholar] [CrossRef]
- Li, W.; Li, Z.; Han, W.; Li, D.; Yan, S.; Zhou, J. Study of The Flow Characteristics of Pumped Media in The Confined Morphology of a Ferrofluid Pump with Annular Microscale Constraints. J. Fluids Eng. 2025, 147, 021201. [Google Scholar] [CrossRef]


Disclaimer/Publisher’s Note: The statements, opinions and data contained in all publications are solely those of the individual author(s) and contributor(s) and not of MDPI and/or the editor(s). MDPI and/or the editor(s) disclaim responsibility for any injury to people or property resulting from any ideas, methods, instructions or products referred to in the content. |
© 2025 by the authors. Licensee MDPI, Basel, Switzerland. This article is an open access article distributed under the terms and conditions of the Creative Commons Attribution (CC BY) license (https://creativecommons.org/licenses/by/4.0/).