Abstract
The detection of Partial Discharge Inception Voltage (PDIV) is vital for evaluating the insulation performance of random-wound inverter-fed motor stators. However, existing research on the impact of impulse parameters on PDIV patterns and their underlying mechanisms is limited, leading to inadequate guidelines for choosing suitable impulse parameters during PDIV tests of stator insulation under impulsive conditions. This lack of understanding significantly affects the precision of the accuracy of insulation test results for inverter-fed motors. To bridge this gap, this study systematically investigated the influence of key impulse parameters, such as pulse width, dead time, and impulse frequency, on the PDIV test outcomes in enameled wire samples (enameled twisted pairs and pig-tail wires) and random-wound inverter-fed motor stators. A differential bipolar repetitive impulse voltage and a sinusoidal voltage were applied to simulate the pulse-width modulation electrical stress typically experienced by these motors. Results reveal a negative correlation between PDIV test results and pulse width, a positive correlation with dead time, and a weak correlation with impulse frequency. Furthermore, the potential fundamental mechanisms are proposed for the influence of impulse voltage parameters on PDIV characteristics by analyzing the electric field distribution and discharge processes within insulating materials when subjected to impulsive voltages. Based on the experimental conclusion, this study proposes targeted recommendations for revising the current IEC testing standards. These improvements are anticipated to refine stator insulation testing methodologies for inverter-fed motors, ultimately contributing to enhanced insulation reliability in such electric motors.
1. Introduction
In the process of transportation electrification, represented by electric vehicles, electrified railway, and increasingly electric aircraft, electric motors, as the power component, play a critical role, often referred to as the “heart” of transportation electrification equipment [1]. Although the principles of electric motors have remained unchanged for nearly 150 years, modern motors are now required to meet additional criteria such as adjustable speed, energy efficiency, and high power density. This is particularly true for transportation electrification drive systems, where the power density requirements of motors are even more stringent. For instance, the power-to-weight ratio of electric vehicle drive motors is nearly 7 kW/kg; in the future, to achieve the electrification of aircraft, the power density of aircraft drive motors may need to reach 10 kW/kg [2].
To enhance power density, various measures can be taken, including adopting motors with higher rotational speeds, utilizing better magnetically conductive materials, and optimizing motor design. If increasing the motor speed is chosen to boost power density, it becomes necessary to optimize the motor drive design by employing higher frequencies and switching bandwidths. This approach helps to reduce switching losses and further enhance power density. In electric vehicles, motor speeds are often designed to exceed 20,000 r/min.
For many years, due to the low operating voltage of most small motors (less than 800 V), round -been widely adopted technically in the industry. In recent years, driven by the escalating demand for power density and higher operating voltages, numerous electric-drive manufacturers have started adopting flat-wire motors. This shift is motivated by the fact that, while flat-wire motors offer distinct advantages over traditional random-wound motors, such as higher slot fill factors. However, they also present certain challenges compared to traditional round-wire motors. These challenges include (1) increased costs, primarily due to the complexity of the production lines, which can significantly burden companies transitioning from random-wound motor production; (2) higher power losses at elevated frequencies, influenced by the skin effect and proximity effect, which can negatively impact motor efficiency; (3) extended winding ends resulting from welding processes, posing limitations in specific industrial applications.
Conversely, traditional random-wound motors, typically utilizing round wires, exhibit certain strengths. Despite having lower slot fill factors than flat-wire motors, their end windings can be designed to be shorter and more compact. Furthermore, the maturity of production lines for random-wound motors allows companies to seamlessly integrate them into the manufacturing of electric-vehicle motors. In an effort to optimize costs, some suppliers and original equipment manufacturers in the electric-vehicle sector have opted to use a flat-wire motor as the primary drive, while employing a random-wound motor as the auxiliary drive. This approach is advantageous given that the auxiliary motor operates at lower speeds during most operating cycles.
To enhance the power density and energy conversion efficiency of power electronic devices, third-generation wide-bandgap-power semiconductor devices, represented by silicon carbide and gallium nitride, have found widespread use in electric-drive systems. Compared to traditional IGBTs, silicon carbide-based third-generation wide-bandgap devices often exhibit a switching frequency exceeding 20 kHz, with a rise time controlled below 100 ns. This short rise time can lead to severe overvoltage at the motor terminals and an uneven distribution of impulse voltage within the windings. As the operating voltage increases, random-wound motors with a round-wire structure are affected by the winding process, and the electrical distance of the winding wires cannot be controlled on the production line. This may result in higher voltages between phases. When this voltage exceeds the breakdown field strength of the air, partial discharge (PD) may occur [3,4]. For most round winding motors with organic insulation, the insulation system is typically a Type I insulation system. In the presence of PD activities, organic materials will experience accelerated ageing, leading to insulation breakdown.
In recent years, the International Electrotechnical Commission (IEC) has acknowledged the aforementioned issues facing the insulation systems of industrial inverter-fed motors. Through continuous efforts, relevant standards or technical specifications have been established, emphasizing the importance of conducting insulation evaluations using repetitive impulse voltages before motors are put into operation. For Type I motors, the actual operating voltage should always be less than their PDIV to ensure that no PDs occur during their entire lifespan [5].
In summary, when aiming to increase the rated voltage of random-wound motors, it is essential to design and control the insulation process to prevent PD. A crucial aspect of insulation design and verification is testing the PDIV in the motor windings using a voltage similar to that of the driver. Such tests require the use of repetitive impulse voltages similar to those generated by inverters, which are more complex than traditional DC and sinusoidal partial discharge tests. The main reasons for this complexity are (1) Power electronic impulse voltages can generate strong switching interference, which can couple with test sensors, rendering traditional testing methods (such as the coupling capacitance method and high-frequency current sensor method) ineffective; (2) After the repetitive impulse parameters are applied to the motor windings, the impact of these parameters on the PDIV results is complex. Therefore, it is essential to select appropriate impulse parameters to obtain objective PDIV test results.
Consequently, experimental and theoretical research is necessary to understand the discharge patterns of motors under repetitive impulse voltages, in order to accurately measure the PDIV of random-wound variable-frequency motors. Regarding the influence of impulse parameters on PDIV testing, existing studies have shown that a short rise time can enhance high-frequency discharge energy. Although this does not directly affect PDIV, it may influence test sensitivity when using antennas with different frequency bandwidths for discharge testing. Additionally, overvoltage oscillations caused by a short rise time may exceed the breakdown electric field ahead of time, affecting PDIV test results [6]. An increase in voltage frequency can raise the repetition rate of PD and promote their further development, but it has minimal impact on PDIV measurements [7]. Furthermore, research indicates that temperature and air pressure can also lead to variations in PDIV test results [8]. Some researchers have even found that spectroscopy measurements enhanced with nanoparticles may demonstrate greater resistance to PD [9].
However, the majority of existing research has primarily focused on twisted pairs (capacitive samples), with relatively few systematic investigations conducted on the variation patterns of PDIV in motor stator winding insulation under bipolar pulses concerning parameters such as pulse width, dead time, and frequency [10]. A significant reason for this is that experimental methods for generating repetitive impulses with adjustable voltage and impulse parameters have not been widely adopted in laboratory or industrial settings, making the PDIV testing of motor windings relatively difficult. The conventional winding testers that have been developed typically suffer from issues such as low pulse amplitude, a limited adjustable pulse range, and inadequate high-frequency detection capabilities.
Notably, there exists a significant discrepancy between the electrical stress characteristics of unipolar pulses and those actually experienced by motor stators in practical operations. Consequently, employing unipolar pulses for PDIV testing may yield inaccurate measurement results, which could subsequently lead to erroneous evaluations of motor insulation performance. Previous studies on piezoelectric ceramic samples have demonstrated that, under bipolar sinusoidal voltage application, PDs tend to occur at relatively low electric field strengths compared to unipolar field conditions. This phenomenon suggests that PD repetition rates may be significantly reduced under unipolar voltage excitation [11]. From a practical perspective, adopting conservative PDIV values obtained through bipolar pulse measurements ensures enhanced reliability in insulation system design. Additionally, the elevated PD detection sensitivity associated with higher PD occurrence frequencies under bipolar excitation facilitates the industrial implementation of PD monitoring systems, particularly when operating measurement equipment with limited precision. Therefore, it becomes imperative to design and implement a bipolar pulse-capable experimental platform for systematic investigation, enabling the derivation of PDIV variation patterns that more closely approximate actual operating conditions encountered by motor stators.
To systematically investigate how variations in frequency, pulse width, and dead time influence the measurement of PDIV in motor windings and insulation systems, this study first established a repetitive impulse voltage generator that fully simulates a pulse-width modulation inverter. This generator generates differential impulses with adjustable duty cycles and frequencies, achieving an impulse peak-to-peak voltage of up to 24 kV and an adjustable rise time between 50 and 1000 ns. By employing a full-bridge inverter structure, pulse-width modulation waveforms can be generated, fully simulating the stress applied to the driven motor by the inverter. Subsequently, both capacitive samples (made from enameled round and flat wires) and motor stator winding were used as experimental subjects to investigate the variation of PDIV under bipolar impulses with changes in pulse width and dead time. Finally, based on numerous PDIV test results from capacitive samples and motor windings, the study summarized the influence and mechanism of pulse-width modulation parameters (frequency, duty cycle, and dead time) on PDIV test results for motor windings and motor insulation. Table 1 compares existing research with current study, illustrating the limitations of existing studies. This provides valuable data and references for selecting impulse parameters in the PDIV testing of motor windings in industrial settings, ultimately enhancing the reliability of insulation performance evaluation for inverter-fed motors.

Table 1.
Comparison with previous studies.
2. Experimental Set up
2.1. Design of Repetitive Impulse Generator
The repetitive impulse generator comprises a signal generator, a high-voltage solid-state switcher, a high-voltage DC power supply, and high-voltage resistors. During the PDIV test using bipolar impulses on the sample, two sets of bridge-type chopping circuits are employed to generate impulses with the same amplitude but different phases. This allows for the formation of bipolar impulses on the tested object through differentiation, as shown in Figure 1. By varying the phase difference α between the two positive-polarity impulse square waves, the dead time of the bipolar impulses output to both sides of the sample insulation can be adjusted. The three variables studied in this experiment, as illustrated in Figure 2, satisfy the following relationship:
where Td represents the dead time, Tw denotes the pulse width, and f stands for the impulse frequency, which is the reciprocal of the period. In this experiment, the differential waveforms during the high level of C1 and C2 are referred to as positive and negative impulses, respectively.
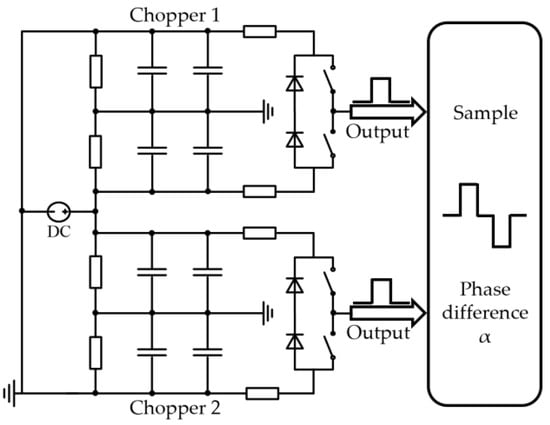
Figure 1.
Schematic diagram of the voltage generation for differential bipolar impulses.
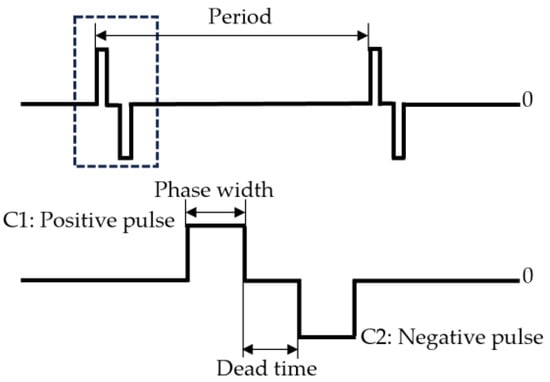
Figure 2.
Differential impulse schematic diagram.
2.2. PDIV Testing System
Although the PDIV test using sinusoidal voltage cannot fully simulate the repetitive impulse stress generated by power electronic switches, it is a relatively mature and stable method. The test results obtained under sinusoidal voltage can be compared with those obtained under repetitive impulse voltages to verify the accuracy of the latter. Therefore, a PDIV test system under sinusoidal voltage was also used for testing simple capacitive samples. The PDIV test system under sinusoidal voltage consists of a signal generator, a power amplifier, a high-speed digital oscilloscope, a coupling capacitor, a detection impedance, and a signal processor (PD-Bace), as shown in Figure 3. The sinusoidal signal input from the signal generator is amplified by the power amplifier and then output to the object under test. The discharge signal is extracted using the coupling capacitor and detection impedance, sent to the PC, and processed, and the discharge characteristics are analyzed.
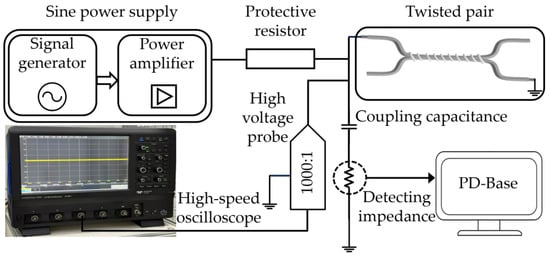
Figure 3.
PDIV test platform with sinusoidal voltages.
The PDIV test platform under repetitive impulse voltage is shown in Figure 4. The signal generator controls the chopper circuit to invert and output impulse voltage, which is then input into the motor stator winding to simulate the uneven voltage distribution caused by impulse voltage in the windings [12]. The fixed Utilizing Ultra-High Frequency (UHF) antenna is positioned approximately 10 cm from the end of the sample under test, and its output is connected to the C3 channel of a waverunner 8254 high-speed digital oscilloscope with a bandwidth of 2.5 GHz and a sampling rate of 10 GHz. Two sets of PINTECH P6018A high-voltage probes with a bandwidth of 150 MHz and a voltage division ratio of 1000:1 are utilized to extract the output signal from the repetitive impulse generator, which is then connected to the C1 and C2 channels of the oscilloscope as a synchronization signal.
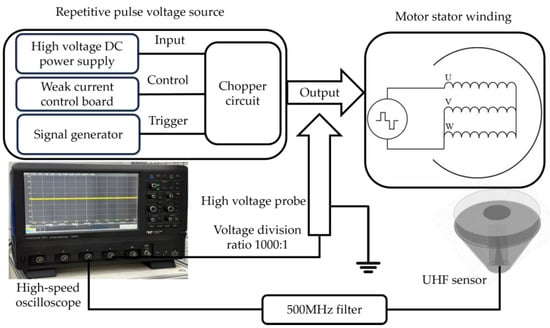
Figure 4.
PDIV test platform at repetitive impulsive voltages.
Research indicates that high-frequency inverter processes can generate significant high-frequency interference due to the rapid switching of power electronic switches [13], posing significant challenges for PDIV testing under repetitive impulse voltage conditions [14]. Therefore, optimizing sensor performance to achieve a high response in the frequency distribution region of partial discharge energy is a crucial technique for partial discharge testing under repetitive impulse voltage.
Under sinusoidal voltage, traditional coupling capacitance methods and high-frequency current sensor methods cannot be employed. This is because, when the rise time of the repetitive impulse voltage is less than 100 ns, the high-frequency interference generated by power electronic switches becomes indistinguishable from the energy of PD.
UHF methods to extract the electromagnetic waves produced during PD is a key technique for addressing the challenges of partial discharge testing under repetitive impulse voltage. However, compared to electromagnetic wave receiving sensors under sinusoidal conditions, electromagnetic wave sensors under repetitive impulses must have a better frequency response in the range of 0.5 to 2 GHz. This is because a significant amount of power electronic high-frequency interference is concentrated below 0.5 GHz, as shown in Figure 5.

Figure 5.
Schematic diagram of discharge energy and interference energy. The dashed line represents the power interference before filtering, the dotted line denotes the PD signal and the solid line indicates the overlapping region of both signals.
To address the challenge of high-frequency interference in PDIV testing under repetitive impulse voltage, we have conducted thorough research and designed a broadband Archimedes planar spiral antenna. To optimize the sensor’s performance within the 0.5 to 2.0 GHz range, we incorporated a microstrip balun for impedance matching and covered the radiation layer with a medium having a high dielectric constant, as illustrated in Figure 6. This design effectively suppresses the aforementioned high-frequency interference, ensuring the sensitivity of PDIV testing under repetitive impulse voltage. The antenna performance before and after adding the dielectric covering layer is presented in Table 2. As shown in Table 1, the antenna’s bandwidth is significantly expanded after incorporating the dielectric covering layer, with notably improved gain stability observed across the 0.4–2.0 GHz frequency range [13].
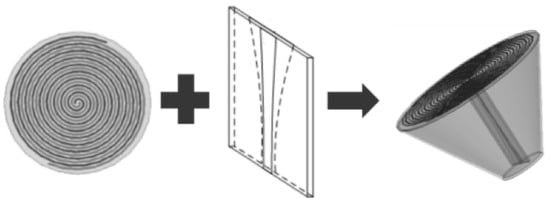
Figure 6.
UHF antenna with high gain.

Table 2.
Performance comparison of antennas.
Furthermore, in this study, we utilized a high-pass filter with a cutoff frequency of 0.5 GHz to eliminate signals in the 0 to 0.5 GHz range, thereby reducing interference signals during discharge monitoring [14]. This approach further enhances the accuracy and reliability of PDIV testing under repetitive impulse voltage conditions.
To validate the experimental setup and ensure the accurate measurement of pulse amplitude and discharge signals, a signal generator was employed to calibrate the high-voltage probe and oscilloscope. Concurrently, a vector network analyzer was utilized to calibrate the UHF antenna’s bandwidth and center-frequency radiation characteristics.
2.3. Sample Parameters
Insulated enameled twisted pairs possess a comparatively simple structure and can partially simulate the insulation conditions found in motor windings. The enameled round twisted pairs utilized in this study, illustrated in Figure 7, are created by twisting two enamel-coated round wires together. In contrast, the pig-tail shape rectangular pairs are formed by positioning two rectangular enameled wires side by side and securing them with insulating binding wire, thereby ensuring the close proximity of the insulation layers. The outer insulating layer is removed at the connection points of the enameled wires to facilitate effective electrical connection with the test circuit.

Figure 7.
Sample of enameled twisted pairs. (a) Round twisted pair, (b) pig-tail wires.
The parameters of the three-phase asynchronous motor used in this study are presented in Table 3. The motor rotor and all other non-essential components were removed, while the entire stator structure of the motor was pre-served intact as a sample for experimentation.

Table 3.
Parameters of the three-phase asynchronous motor used in this study.
2.4. Testing Method
The wiring diagram for the PDIV test of interphase insulation under differential bipolar repetitive impulse voltage is shown in Figure 8. In this setup, the neutral points of the three phases of the motor stator are connected to simulate the electrical stress on the stator interphase insulation during motor operation. The motor’s single-phase winding is connected to a positive impulse, while the other two phases are connected in parallel to a negative impulse. To prevent the premature discharge of the motor’s main insulation from interfering with the monitoring of interphase insulation discharge, the motor casing is insulated from the ground, keeping it in a floating state [15].
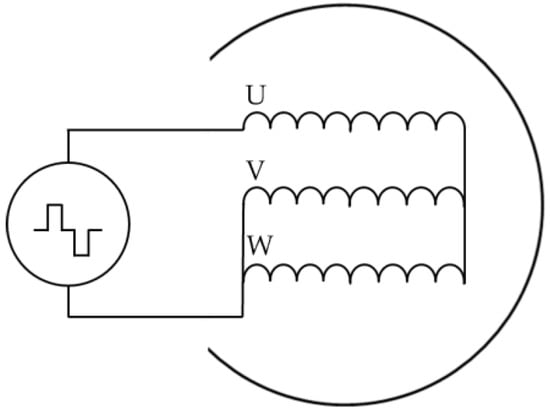
Figure 8.
Schematic diagram of differential bipolar test wiring.
Under standard atmospheric pressure, the experimental setup maintained a controlled ambient temperature of 20 °C and a relative humidity of 50%, with an impulse rise time set at 100 ns. The PDIV of the interphase insulation of the motor stator was evaluated using repeated impulse voltages. Pulse widths of 1 μs, 2 μs, and 4 μs were employed as the test parameters. For low-frequency tests, an input impulse frequency of 50 Hz was used for each experimental set, with dead times of 0, 1 μs, 10 μs, 100 μs, and 1 ms as additional variables. In contrast, high-frequency tests were conducted at an input impulse frequency of 1 kHz for each set, with dead times of 0, 1 μs, 10 μs, 100 μs, and 500 μs as the corresponding parameters. Upon detecting this discharge, the voltage increase was stopped, and the peak-to-peak voltage of the impulse signal on the oscilloscope at that moment was recorded as the measured PDIV value for the tested objects. To avoid the premature discharge of the motor windings due to a sudden voltage increase, the voltage was gradually raised at a rate of 20 V/s until the first discharge occurred. To mitigate measurement uncertainties arising from discharge stochasticity, five repeated experiments were conducted for each dataset with experimental outcomes documented systematically.
3. Twisted Pairs Test Results
Due to the complexity of motor windings, it is difficult to measure the actual voltage on the insulation when impulses are applied to the windings. Consequently, in this study, simple capacitive samples made of round and flat enameled wires are used as samples to investigate the effects of bipolar pulse-width modulation impulse parameters on insulation PDIV.
According to the procedure described in Section 2.4, differential bipolar impulses and sinusoidal voltages are applied to both ends of the samples. The PDIV values of the twisted pairs and pig-tail wires under different pulse widths and dead times are measured at low and high frequencies, as shown in Figure 9. The four colors correspond to the test results obtained under input impulses with pulse widths of 1 μs, 2 μs, and 4 μs and sinusoidal voltage, respectively. Through the application of the STDEV function, the experimental data were analyzed, revealing an average standard deviation of 0.0097 for pulse PDIV (maximum: 0.0256, minimum: 0.0049) and 0.0134 for sinusoidal PDIV (maximum: 0.0200, minimum: 0.0049). These findings demonstrate that experimental errors are tightly controlled within a narrow margin, ensuring statistically robust reliability for this investigation.
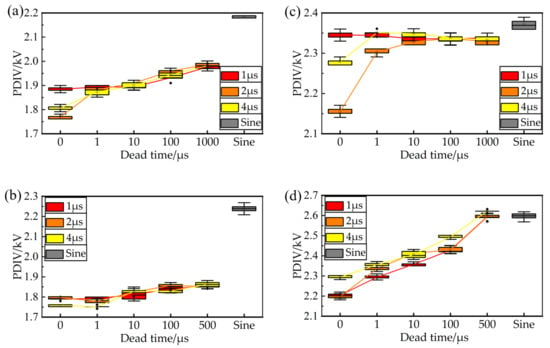
Figure 9.
Distribution of bipolar PDIV in twisted pairs and pig-tail wires. (a) Twisted pairs, 50 Hz, (b) twisted pairs, 1 kHz, (c) pig-tail wires, 50 Hz, (d) pig-tail wires, 1 kHz.
An analysis of the test results reveals that, within the dead time range of 0 to 1 ms, there is a slight upward trend in PDIV as the dead time increases. At 50 Hz and with no dead time in the differential impulse, the pulse width has a significant effect on PDIV. Nevertheless, at 1 kHz, the pulse width has a lesser impact on the PDIV of the twisted pairs. The PDIV test results under sinusoidal voltage are generally slightly higher than those under differential impulses, with a typical difference of no more than 20%.
4. Motor Stator Test Results
4.1. Discharge Spectrum
An initial analysis of the discharge signal spectrum was conducted under varying experimental conditions. A 50 Hz differential bipolar impulse was applied to the stator winding of the sample motor. The voltage was gradually increased until it reached approximately 1.1 times of the PDIV for the given experimental setup, ensuring stable insulation discharge. The spectra of PD signals were recorded for different pulse widths and dead times.
Initially, the dead time was set to 0 μs while varying the pulse width. The PD signals were captured using an oscilloscope, and the obtained data were analyzed using Fast Fourier Transform (FFT). This process yielded discharge signals and spectra for pulse widths of 1 μs and 4 μs. Subsequently, the pulse width was fixed at 1 μs, and the aforementioned steps were repeated to obtain discharge signals and spectra for dead times of 100 μs, as shown in Figure 10 and Figure 11.
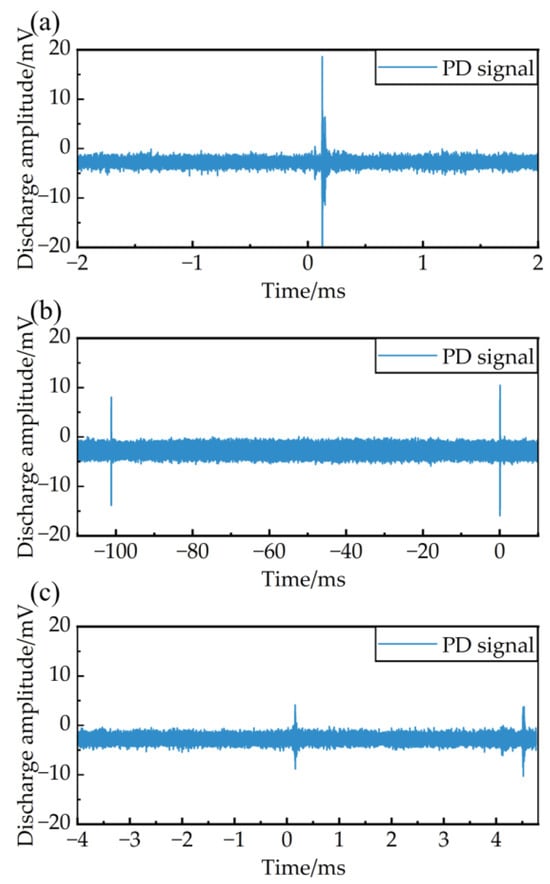
Figure 10.
PD signal with different impulse parameters. (a) Pulse width 1 μs, dead time 0, (b) pulse width 4 μs, dead time 0, (c) pulse width 1 μs, dead time 100 μs.
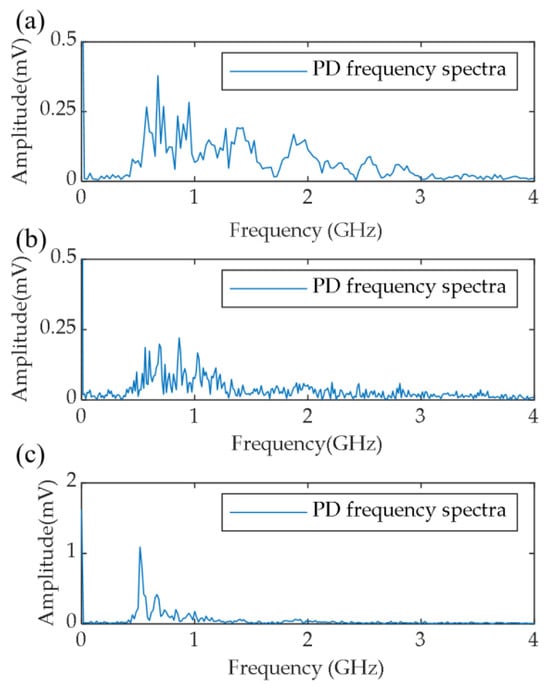
Figure 11.
PD frequency distribution with different impulse parameters. (a) Pulse width 1 μs, dead time 0, (b) pulse width 4 μs, dead time 0, (c) pulse width 1 μs, dead time 100 μs.
Upon analyzing Figure 10, when the dead time is relatively short, the discharge is concentrated at the pulse polarity reversal position. Conversely, when the dead time is prolonged, discharges occur independently at the positive- and negative-pulse regions. Upon analyzing Figure 11, it was observed that, when a differential bipolar impulse was applied, the spectrum of PD signals in the random-wound inverter-fed motor was primarily concentrated in the frequency range of 0.5 to 1.5 GHz. Additionally, with the increase in pulse width and dead time, high-frequency pulse signals exhibit a trend toward lower frequency ranges. No significant correlation has been observed between discharge amplitude and the two experimental parameters, which display a stochastic behavior. Therefore, it is essential to consider this energy distribution characteristic when conducting PDIV tests on sample motors, to facilitate the design of an optimized sensor that achieves a higher signal-to-noise ratio. As illustrated in Figure 11, the antenna equipped with a dielectric covering layer detected discharge signals with amplitudes reaching up to 30 mV near the PDIV. After implementing the 500 MHz bandpass filter, the background noise level was effectively suppressed below 5 mV. This improvement in signal-to-noise ratio indicates that the experimental apparatus exhibits high sensitivity to PD.
4.2. Motor Stator PDIV Test Results
Following the procedure described in Section 2.4, differential bipolar impulses were applied to the stator of the motor windings. The PDIV was measured at both low and high frequencies under various pulse widths and dead times, as shown in Figure 12. The three curves in different colors represent the experimental results obtained under input impulses with pulse widths of 1 μs, 2 μs, and 4 μs, respectively. Through the application of the STDEV function, the experimental data were analyzed, revealing an average standard deviation of 0.0199 for pulse PDIV (maximum: 0.0390, minimum: 0.0102). Although this deviation appears larger in comparison to the twisted pairs, it remains statistically insignificant relative to the parameter-induced variations observed in the experimental measurements, thereby substantiating the validity of our conclusions.

Figure 12.
Distribution of bipolar PDIV in interphase insulation. (a) 50 Hz, (b) 1 kHz.
It can be seen that, when the dead time remains constant, the PDIV generally decreases as the pulse width of the bipolar impulse increases. Conversely, when the pulse width remains unchanged, the PDIV of the random wound inverter-fed motor generally increases as the dead time of the bipolar impulse increases. In contrast to twisted pairs, the PDIV of the motor stator demonstrates consistent variation patterns in pulse width and dead time when operating under high-frequency conditions compared to low-frequency scenarios.
5. Discussion
5.1. Influence of Pulse Width and Frequency on PDIV
For both capacitive and motor winding samples, the PDIV decreases when the pulse width varies from 1 μs to 4 μs. Therefore, when measuring PDIV in motor windings and insulation systems using impulse voltage, this phenomenon should be carefully considered. Impulse voltage with longer pulse widths may provide more objective PDIV test results. Consequently, for PDIV tests on insulation systems and stator windings using impulse voltages, it is recommended to employ bipolar impulse voltages with a pulse width exceeding 4 μs to obtain more accurate results.
The occurrence of partial discharge (PD) requires two essential conditions: (1) the electric field strength at the discharge site must exceed the critical breakdown field strength of air, as described by Paschen’s Law, and (2) initial electrons capable of initiating electron avalanches must be present [15]. Under differential bipolar impulses, the PDIV test results for both turn-to-turn and phase-to-phase insulation decreases as the pulse width increases. This phenomenon can be explained as follows: when a short-duration impulse is applied, the high voltage level may exceed the critical breakdown voltage, but the duration may be insufficient to generate the initial electrons required to trigger electron avalanches. As a result, no PD occurs. To enhance the probability of collision ionization and the generation of initial electrons, the voltage must be further increased to initiate a discharge [16]. In contrast, when a long-duration impulse is applied, there is sufficient time for the high voltage level to excite the generation of initial electrons. Consequently, the PDIV test results exhibit a negative correlation with the pulse width.
Previous studies have suggested that an increase in voltage frequency can amplify the cumulative impact of space charges, subsequently elevating the likelihood of initial electron generation and expediting the progression of PD [17]. In the present study, experiments were carried out on two distinct capacitive samples, revealing that the influence of pulse width on the PDIV diminished under high-frequency impulses, owing to the heightened probability of exciting initial electron discharges. Nevertheless, when examining motor stator insulation, the effect of impulse frequency on the experimental outcomes was less noticeable. This discrepancy may stem from the fact that the accumulation of space charges is more pronounced on the insulation surface of capacitive samples, whereas its effect is relatively minor in inductive samples, such as motor stators. The finite element model (FEM) validation of the existing model demonstrates a high degree of consistency between the simulation results and the mechanistic explanations, aligning with spatial charge distribution patterns observed in prior numerical studies [18]. We are currently conducting FEM with the objective of developing a simulation model that more closely replicates the actual test conditions and specimen characteristics of this study, thereby enabling a rigorous validation of experimental observations through numerical simulation. Further investigation is warranted to elucidate the influence of impulse frequency on PDIV values.
For both capacitive samples and motor windings, an increase in frequency generally requires an upgrade in the capacity of the test system. As the frequency climbs, the charging and discharging currents of the pulsed power supply to the test sample inevitably escalate as well. As a result, utilizing a higher frequency may necessitate a larger pulsed power supply for the corresponding tests, inevitably complicating both industrial and laboratory testing processes. Moreover, studies have shown that, as frequency increases, it can affect the sensitivity of PD testing, as the discharge amplitude of the insulation may decrease. These reduced discharge amplitudes may be overwhelmed by residual interference from power electronics, leading to inaccuracies in PDIV test results. Consequently, conducting PDIV tests at higher frequencies presents considerable challenges [19]. Based on the findings of this paper, the influence of frequency on PDIV test results is not significant. Therefore, to ensure the sensitivity of the testing equipment, it is recommended to conduct PDIV testing under 50 Hz.
However, with the adoption of third-generation wide-bandgap-power electronic devices, the voltage frequency that insulation systems can withstand will continue to increase. Further research is essential to explore the statistical characteristics and discharge mechanisms of PD at frequencies exceeding 10 kHz or even reaching 20 kHz [20]. Future research may explore conducting PD tests at frequencies beyond the currently experimental range (>10 kHz) to analyze the magnitude and frequency-domain characteristics of discharge energy. By summarizing the variation patterns of PDIV with pulse parameters and comparing them with low-frequency-derived patterns, this approach could further validate theoretical interpretations of discharge mechanisms. Ultimately, this would facilitate the establishment of a comprehensive low-to-high frequency PDIV testing standard for industrial implementation and contribute to the improvement of IEC testing standards.
5.2. Influence of Deadtime on PDIV
Dead time is also one of the important parameters in pulse-width modulation technology. In a three-phase full-bridge inverter circuit, it is often necessary to increase the dead time to protect power electronic switches and prevent short circuits, thereby enhancing the reliability of the inverter. According to the experimental results presented in this paper, dead time increases the transition time from positive to negative impulses, and the PDIV may increase accordingly. This, to some extent, is beneficial for the reliability of the insulation system. When differential bipolar impulses are applied between phases, the voltages experienced by the main insulation and the turn-to-turn insulation are as shown in Figure 13. It is important to note that this diagram does not reflect the amplitude relationship of the voltages withstood by the three types of insulation; it can only serve as a reference for the voltage waveform. For the turn-to-turn insulation of the insulation system, the voltage that it withstands is a bipolar impulse voltage with a certain dead time, which is advantageous for the turn to turn. Based on the results obtained in this study, longer dead time leads to higher PDIV. And the length of the dead time of the impulse voltage depends on the fundamental frequency during the pulse-width modulation process. According to the findings of this study, when the dead time varies from 0 to 1000 μs, the PDIV increases significantly.
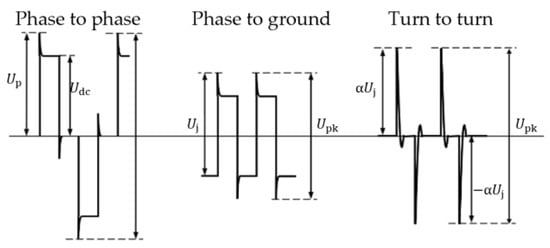
Figure 13.
Schematic diagram of voltage applied to different insulations under bipolar impulse.
Certainly, when conducting PDIV tests on windings and insulation materials, it is essential to appropriately control the dead time. This is because only a shorter dead time can yield a lower PDIV, which represents the most objective value for the inception voltage of the insulation system.
For complex motor winding structures, variations in dead time may affect the distribution of impulse voltages within the windings. We are currently investigating this aspect through simulations and experiments, and the findings will be published in a forthcoming paper.
For capacitive samples, the influence of dead time on PD can be explained based on discharge mechanisms. When the initial discharge electrons originate from air collision ionization, the discharge must satisfy the Schumann criterion [21]:
In the equation, the value of K represents an integration criterion, where an integrated value equal to or greater than K indicates the occurrence of PD. d denotes the length of the integration path along the electric field lines, while αeff is the effective ionization coefficient. When the atmospheric pressure and temperature conditions are constant, αeff depends only on the magnitude of the electric field pattern E(x). In the air gap, it can be calculated using the following equation:
where λe is the mean free path of electrons, which is related to the inter molecular distance α and the molecular density ρ. qe represents the electric charge of an electron. x represents the minimum distance traveled by an electron to initiate an electron avalanche, determined by the ionization energy W of air molecules and the electric field strength E [22]. Taking a twisted pair as an example, under the same type of sample and integration path, the integration path of the air gap electric field influenced by surface charges is shown in Figure 14. The electric field strength E in the air gap is correlated with the surface charge quantity Q(t) on the conductor’s insulation layer [23].
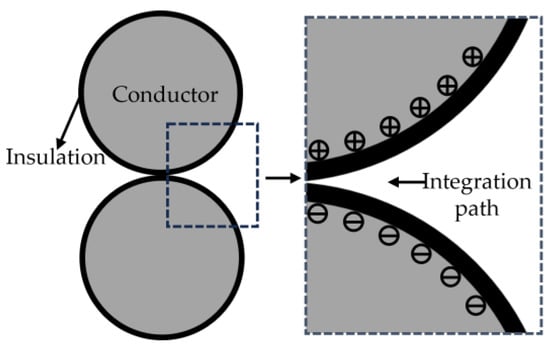
Figure 14.
Schematic diagram of surface charge affecting air gap magnetic field.
If the surface charge is accumulated on the surface of the insulation for any reason, the decay of surface charges on the insulation layer can be represented by an exponential model:
where τ is the decay time constant, which can be calculated using the following formula:
Since the insulation thickness (d), dielectric constant (εr), and volume resistivity (ρV) remain constant in experiments with the same conditions, the surface charge accumulation Q0 remains unchanged for impulses of the same amplitude. t denotes the charge decay time (also termed dead time in this context), and Q(t) represents the residual charge quantity remaining on the insulating surface after experiencing the decay period t. This indicates that the surface charge on the insulation layer depends only on the decay time after the impulse, which, in this experiment, corresponds to the dead time.
Under the influence of short dead time impulses, when a negative impulse is applied, the polarization charges that have accumulated on the insulation surface due to the preceding positive impulse have not yet fully dissipated [24]. The abrupt reversal of voltage polarity alters the electrical stress across the insulation, leading to the generation of initial discharge electrons and subsequently triggering PD [25,26,27,28]. In this scenario, the PD can be attributed to the combined effect of the falling edge of the positive impulse and the rising edge of the negative impulse. Consequently, with a short dead time, discharges tend to concentrate on either the falling edge of the positive impulse or the rising edge of the negative impulse.
When conducting experiments with longer dead time impulses, the polarization charges deposited on the insulation surface by the positive impulse have sufficient time to dissipate. It is necessary to continue increasing the voltage until the rising edge voltage of a single impulse reaches the PDIV of the sample insulation to stimulate initial electron generation. In this case, the PD can be considered as being triggered by individual impulses. Therefore, PDs occur at the rising edges of both impulses, resulting in higher PDIV measurement values.
When a sinusoidal voltage is applied to the twisted pair, the measured PDIV values are slightly higher than those under bipolar impulse conditions. This phenomenon is attributed to the prolonged polarity reversal period of the sinusoidal voltage, which allows polarization charges deposited on the insulation surface to dissipate sufficiently. The repetitive square-wave pulses contain abundant high-frequency harmonic components, which induce additional voltage superposition within insulation systems. This overvoltage effect enables partial discharge to occur at lower fundamental voltage levels due to harmonic superposition specifically at the pulse rising edges. In contrast, sinusoidal voltages only contain fundamental frequency components and lack such superposition effects, necessitating continued voltage elevation until the air gap field strength reaches a threshold sufficient to generate initial electrons and initiate the streamer-to-electron-avalanche transition process. Additionally, experimental results presented in Figure 9 demonstrate that, when the polarity reversal interval is prolonged, the effect of high-level duration on PDIV becomes negligible for capacitive samples. Therefore, although sinusoidal voltage exhibits a longer high-level duration, its PDIV value remains at a relatively elevated level.
6. Conclusions
PDIV tests were conducted on two types of enameled wires under sinusoidal voltage and differential bipolar impulses, and on a stator sample from a scattered-winding variable-frequency motor under differential bipolar impulses. The following conclusions were drawn:
- The PDIV values of both round and flat wire pairs under sinusoidal voltage are slightly higher than those under bipolar impulses, with a maximum difference of no more than 20%;
- Changes in impulse frequency have no significant effect on the PDIV test results for both the wire pair samples and the motor stator samples;
- For both the wire pair samples and the motor stator samples, the PDIV test results increase with longer dead time;
- Changes in pulse width have little effect on the PDIV of round- and flat-wire twisted pairs. However, when testing the stator of the scattered-winding variable-frequency motor, there is a trend of increasing PDIV with increasing pulse width.
In response to the absence of explicit provisions for excitation pulse voltage in the IEC standard, the following recommendations are proposed: clear specifications ought to be established for PDIV tests of Type I motors, requiring the use of bipolar pulses with pulse width more than 4 μs and dead time less than 1 μs to ensure accurate PDIV measurements.
Author Contributions
Conceptualization, P.W.; Data curation, J.C.; Formal analysis, J.C. and P.W.; Funding acquisition, P.W.; Investigation, J.C.; Methodology, J.C. and P.W.; Resources, P.W.; Software, J.C.; Supervision, P.W.; Validation, J.C. and P.W.; Visualization, J.C.; Writing—original draft, J.C.; Writing—review and editing, P.W. All authors have read and agreed to the published version of the manuscript.
Funding
National Natural Science Foundation of China, Grant/Award Number: 51977134.
Data Availability Statement
Data is contained within the article.
Acknowledgments
This work was supported by the National Natural Science Foundation of China (No. 51977134).
Conflicts of Interest
The authors declare no potential conflicts of interests.
References
- Harry, L.; Curiac, R.S. Energy conservation: Motor efficiency, efficiency tolerances, and the factors that influence them. IEEE Ind. Appl. Mag. 2012, 18, 62–68. [Google Scholar]
- Jiang, J.; Li, Z.; Li, W.; Ranjan, P.; Wei, X.; Zhang, X.; Zhang, C. A review on insulation challenges towards electrification of aircraft. High Volt. 2023, 8, 209–230. [Google Scholar] [CrossRef]
- Cavallini, A.; Montanari, G.C.; Tozzi, M. Electrical Aging of Inverer-Fed Wire-Wound Induction Motors: From Quality Control to End of Life. In Proceedings of the 2010 IEEE International Symposium on Electrical Insulation, San Diego, CA, USA, 6–9 June 2010; pp. 1–4. [Google Scholar]
- Stone, G.C.; Culbert, I. Partial Discharge Testing of Random Wound Stators During Short Risetime Voltage Surges. In Proceedings of the 2009 IEEE Electrical Insulation Conference, Montreal, QC, Canada, 31 May–3 June 2009. [Google Scholar]
- IEC 60034-27-5; Rotating Electrical Machines-Part 18-41: Partial Discharge Free Electrical Insulation Systems (Type I) Used in Rotating Electrical Machines Fed from Voltage Converters—Qualification and Quality Control Tests. International Electrotechnical Commission (IEC): Geneva, Switzerland, 2017.
- Hu, B.; Wei, Z.; You, H.; Na, R.; Liu, R.; Xiong, H.; Fu, P.; Zhang, J.; Wang, J. A Partial Discharge Research of Medium-Voltage Motor Winding Insulation Under Two-Level Voltage impulses With High Dv/Dt. IEEE Open J. Power Electron. 2021, 2, 225–235. [Google Scholar] [CrossRef] [PubMed]
- Meyer, D.R.; Cavallini, A.; Lusuardi, L.; Barater, D.; Pietrini, G.; Soldati, A. Influence of Impulse Voltage Repetition Frequency on RPDIV in Partial Vacuum. IEEE Trans. Dielectr. Electr. Insul. 2018, 25, 873–882. [Google Scholar] [CrossRef]
- Tan, H.; Cavallini, A. Dielectric properties and partial discharge endurance of thermally aged nano-structured polyimide. IEEE Electr. Insul. Mag. 2020, 36, 39–46. [Google Scholar]
- Asif, M.; Li, Q.; Liu, T.; Huang, X.; Ren, H.; Ding, Z.; Ali, Z. FTIR Analysis of Partial Discharge-initiated Polyimide Nanocomposites Degradation and Insulation Durability under High Frequency Ac Voltage Stress. In Proceedings of the 2019 IEEE International Conference on Manipulation, Zhenjiang, China, 4–8 August 2019; pp. 245–248. [Google Scholar]
- Shi, Y.; Wang, P.; Liu, X.; Cheng, C.; Guo, H.; Shakeel, A. Comparative analysis on PDIV of turn-to-turn insulation for inverter-fed motors under sinusoidal and bipolar impulsive voltage. Insul. Mater. 2022, 55, 101–106. [Google Scholar]
- Kimera, K.; Ushirone, S.; Koyanagi, T.; Hikita, M. PDIV characteristics of twisted-pair of magnet wires with repetitive impulse voltage. IEEE Trans. Dielectr. Electr. Insul. 2007, 14, 744–750. [Google Scholar] [CrossRef]
- IEC TS60034-27-5; Rotating Electrical Machines-Part 27-5: Off-Line Partial Discharge Tests on Winding Insulation of Rotating Electrical Machine During Repetitive Impulse Voltage Excitation. International Electrotechnical Commission (IEC): Geneva, Switzerland, 2017.
- Ma, S.; Wang, P.; Dong, H.; Gu, Y.; Zhou, W. Design of ultra-high frequency antenna for discharge detection under high frequency impulsive voltage conditions for inverter-fed motors insulation. High Volt. Eng. 2020, 46, 3451–3459. [Google Scholar]
- Hammarström, T.J.Å. Multilevel PWM: A tool to explore insulation PD characteristics. IEEE Trans. Instrum. Meas. 2019, 68, 4075–4084. [Google Scholar] [CrossRef]
- Cavallini, A.; Lusardi, L.; Rumi, A.; Kimura, K.; Contin, A.; Han, T. Searching for Optimal Connection Schemes for Partial Discharge Testing of Inverter-Fed Rotating Machines. In Proceedings of the 2019 IEEE Electrical Insulation Conference (EIC), Calgary, AB, Canada, 16–19 June 2019; pp. 67–70. [Google Scholar]
- Cavallini, A.; Fabiani, D.; Montanari, G.C. Power electronics and electrical insulation systems-Part 3: Diagnostic properties. IEEE Electr. Insul. Mag. 2010, 26, 30–40. [Google Scholar] [CrossRef]
- Wang, P.; Wu, G.; Luo, Y.; Zhang, Y.; Xu, H. Influence of frequency of impulsive square wave voltage on partial discharge characteristics and its mechanism. Southwest Jiaotong Univ. 2013, 48, 243–249+270. [Google Scholar]
- Parent, G.; Rossi, M.; Duchesne, S.; Dular, P. Determination of Partial Discharge Inception Voltage and Location of Partial Discharges by Means of Paschen’s Theory and FEM. IEEE Trans. Magn. 2019, 55, 7203504. [Google Scholar] [CrossRef]
- Wang, W.; Liu, Y.; He, J.; Ma, D.; Hu, L.; Yu, S.; Li, S.; Liu, J. An Improved Design Procedure for a 10 kHz, 10 kW Medium-Frequency Transformer Considering Insulation Breakdown Strength and Structure Optimization. IEEE J. Emerg. Sel. Top. Power Electron. 2022, 10, 3525–3540. [Google Scholar] [CrossRef]
- Wang, P.; Zhao, M.; Zhou, Q.; Zhang, J. The Influence of SPWM Frequency on the Endurance of Inverter-fed Motor Insulation. In Proceedings of the 2019 IEEE Conference on Electrical Insulation and Dielectric Phenomena (CEIDP), Richland, WA, USA, 20–23 October 2019; pp. 142–145. [Google Scholar]
- Lusuardi, L.; Cavallini, A.; de la Calle, M.G.; Martinez-Tarifa, J.M.; Robles, G. Insulation design of low voltage electrical motors fed by PWM inverters. IEEE Electr. Insul. Mag. 2019, 35, 7–15. [Google Scholar] [CrossRef]
- Zhao, W.; Wang, P. Measurement of partial discharge starting volt-age of aramid under power frequency sine and repetitive square wave voltage. Chin. J. Electr. Eng. 2023, 43, 2858–2867. [Google Scholar]
- Zhang, J.; Gao, F.; Cao, D.; Putson, C.; Song, C.; Chen, W.; Zhang, J. Modeling of charge transport in insulating dielectric for gas-insulated transmission line based on multiple trap levels. IEEE Trans. Dielectr. Electr. Insul. 2018, 25, 1195–1201. [Google Scholar] [CrossRef]
- Wang, W.; Lv, J.; Feng, Y.; Li, X.; Li, S. Intelligent model prediction of fluctuant increase of maximum electric field in XLPE insulation using long short-term memory network algorithm. High Volt. 2023, 8, 70–80. [Google Scholar] [CrossRef]
- He, D.X.; Xu, Z.; Liu, H.; Zang, Q.; Li, Q.; Le Roy, S.; Teyssedre, G. The Influence of Physical Parameters on Space Charge Characteristics in Cable Insulation Under AC Electric Field. IEEE Trans. Ind. Appl. 2022, 58, 59–66. [Google Scholar] [CrossRef]
- Narita, T.; Mima, M.; Miyake, H.; Tanaka, Y.; Kozako, M.; Hikita, M. Investigation for Influence of Space Charge Accumulation in Motor Winding Coating Material on Partial Discharge Inception Voltage. In Proceedings of the 2019 IEEE Conference on Electrical Insulation and Dielectric Phenomena (CEIDP), Richland, WA, USA, 20–23 October 2019; pp. 637–640. [Google Scholar]
- He, D.; Gong, W.; Xu, Z.; Geng, P.; Liu, H.; Li, Q. Space charge behaviors in cable insulation under a direct current-superimposed impulsed electric field. High Volt. 2021, 6, 426–434. [Google Scholar] [CrossRef]
- Zhang, J.; Ye, Z.; Wang, L.; Zhang, Z.; Xu, F.; Dang, W.; Matsumoto, T.; Diaham, S.; Putson, C. A passive optical fibre sensor based on Fabry-Perot interferometry for bipolar electrostatic monitoring of insulating dielectrics. High Volt. 2023, 8, 682–689. [Google Scholar] [CrossRef]
Disclaimer/Publisher’s Note: The statements, opinions and data contained in all publications are solely those of the individual author(s) and contributor(s) and not of MDPI and/or the editor(s). MDPI and/or the editor(s) disclaim responsibility for any injury to people or property resulting from any ideas, methods, instructions or products referred to in the content. |
© 2025 by the authors. Licensee MDPI, Basel, Switzerland. This article is an open access article distributed under the terms and conditions of the Creative Commons Attribution (CC BY) license (https://creativecommons.org/licenses/by/4.0/).