Article

A Study on the Hydrodynamic Excitation Characteristics of Pump and Pipeline Systems Considering the Weakly Compressible Fluid During the Pump Start-Up Condition

State Key Laboratory of Hydro-Science and Engineering, Department of Energy and Power Engineering, Tsinghua University, Beijing 100084, China
*
Author to whom correspondence should be addressed.
Energies 2025, 18(11), 2911; https://doi.org/10.3390/en18112911
Submission received: 18 April 2025 / Revised: 27 May 2025 / Accepted: 29 May 2025 / Published: 2 June 2025
(This article belongs to the Section B: Energy and Environment)

Abstract

With increasing global energy transition and environmental awareness, liquefied natural gas (LNG) is rapidly developing as an efficient and clean energy source. LNG pumps are widely used in industrial applications. This study focuses on the LNG pump and pipeline system, and it innovatively establishes a computational model based on weak compressible fluid in order to better reflect the characteristics of pressure pulsation and the flow situation. Through numerical simulations, the flow characteristics of the pump were analyzed. In addition, the flow conditions at the pipe tee were analyzed, and the attenuation patterns of pressure waves at different frequencies within the pipe were also investigated. The internal flow field of the pump was analyzed at three specific time points. The results indicate that, during the initial start-up phase, the internal flow state of the pump is complex, with significant vortices and pressure fluctuations. As the flow rate and rotational speed increase, the flow gradually stabilizes. Moreover, the pressure pulsation coefficient within the pipeline varies significantly with position.

1. Introduction

In practical engineering, the analysis of pumps under transient conditions, such as start-up and shutdown, has become increasingly important. During the start-up condition of LNG pumps, the internal flow state is complex due to changes in rotational speed and flow rate. When the pump and pipeline system is in operation, unstable flow conditions may induce abnormal pressure pulsations and vibrations [1]. Severe vibrations can lead to cracks in the flow components and, in extreme cases, cause resonance in the entire system.
Currently, many scholars, both domestically and internationally, have conducted research on the start-up process of pumps and pipelines through numerical simulations and experiments. Liu et al. [2] experimentally and theoretically studied the transient performance of centrifugal pumps under start-up conditions. Based on the balance between the transient pump head and pipeline resistance, a theoretical prediction model was established and a time-step algorithm was used to solve the pipeline balance equations. The transient time-step independence test was conducted, and the experiments showed that sufficient prediction accuracy could be achieved. Additionally, a thorough mathematical analysis of the transient head characteristics of the pump based on the pipeline balance equations was performed. Chai et al. [3] developed a synchronous experimental system consisting of a test pump, high-speed camera, and measurement sensors to capture the cavitation and vibration during the start-up process of centrifugal pumps. They found a strong correlation between cavitation and vibration, as well as that a shorter acceleration time during start-up could effectively suppress cavitation. Farhadi et al. [4] developed a mathematical model based on an approximate method to predict the performance of pumps under transient start-up conditions, and this was achieved by considering two of the most important parameters—the kinetic energy in the pipeline system and the kinetic energy of the pump (embodied in a ratio called the “effective energy ratio”). By comparing the numerical solution curves of the model with the experimental characteristic curves of TRR, it was found that the possibility of a turbine-like operation of the main cooling pump was minimal. Moreover, Fu et al. [5] experimentally and numerically studied the transient characteristics of axial flow pumps during start-up, with reasonable rotational speed settings through force coupling. The results showed that, when the rotational speed reached the rated speed, the transient impact head rose to 1.87 times the rated head. The pressure distribution on the impeller blades changed significantly. During the start-up process, a large number of vortex core regions appeared at the leading edge of the blades and in the impeller channels, first increasing and then decreasing. Elaoud et al. [6] numerically modeled the transient flow in cylindrical pipelines that is caused by centrifugal pump start-up, and this was achieved by considering two boundary conditions: the upstream end being a pump with a known motor torque and the downstream end being a reservoir with constant water level. The mathematical model was solved using the method of characteristics, revealing that the pump start-up time significantly affected the evolution of hydraulic variables. Kittredge [7] derived the differential equations of fluid motion in pumps and pipelines, as well as explored the effects of rigid and elastic fluids on fluid flow.
At present, there are few studies on the pressure pulsation of the entire pump and pipeline system under the start-up condition, and most of them have focused on the analysis of hydraulic performance. Moreover, research on the attenuation of pressure waves of compressible fluids within pipelines is relatively rare.
Therefore, this study investigated the external and internal flow characteristics of the LNG pump and pipeline system by setting up multiple pressure pulsation monitoring points on the LNG pump and pipeline. Numerical simulations were conducted based on weakly compressible fluid to analyze the external characteristics and internal flow characteristics of the pump. The flow conditions at the pipeline tee junctions were studied, and the patterns of pressure changes at different frequencies within the pipeline were analyzed. The corresponding internal flow field changes in the pump at some fluctuation characteristic points within the pipeline were also explored.

2. Numerical Simulation Method

2.1. Model Introduction

The three-dimensional computational model retained the dimensions of the LNG pump and pipeline, optimizing small components to avoid sharp corners and numerous narrow gaps [8]. The main body structure of the pump and pipeline system includes the inlet section, inducer, impeller, diffuser, outlet section, and pipeline [9,10,11]. The impeller had six blades, and the diffuser had seven blades. The fluid medium was weakly compressible liquefied natural gas, with density varying with pressure, and it was set as follows [12]:
Density = 500 1     Pressure 605,000,000 k g / m 3 .
The wave speed within the flow passage was 1100 m/s. The physical parameters of the LNG were as follows: the temperature was −163 °C, and the dynamic viscosity was 13.56 × 10⁻⁵ Pa·s. The computational domain is shown in Figure 1.

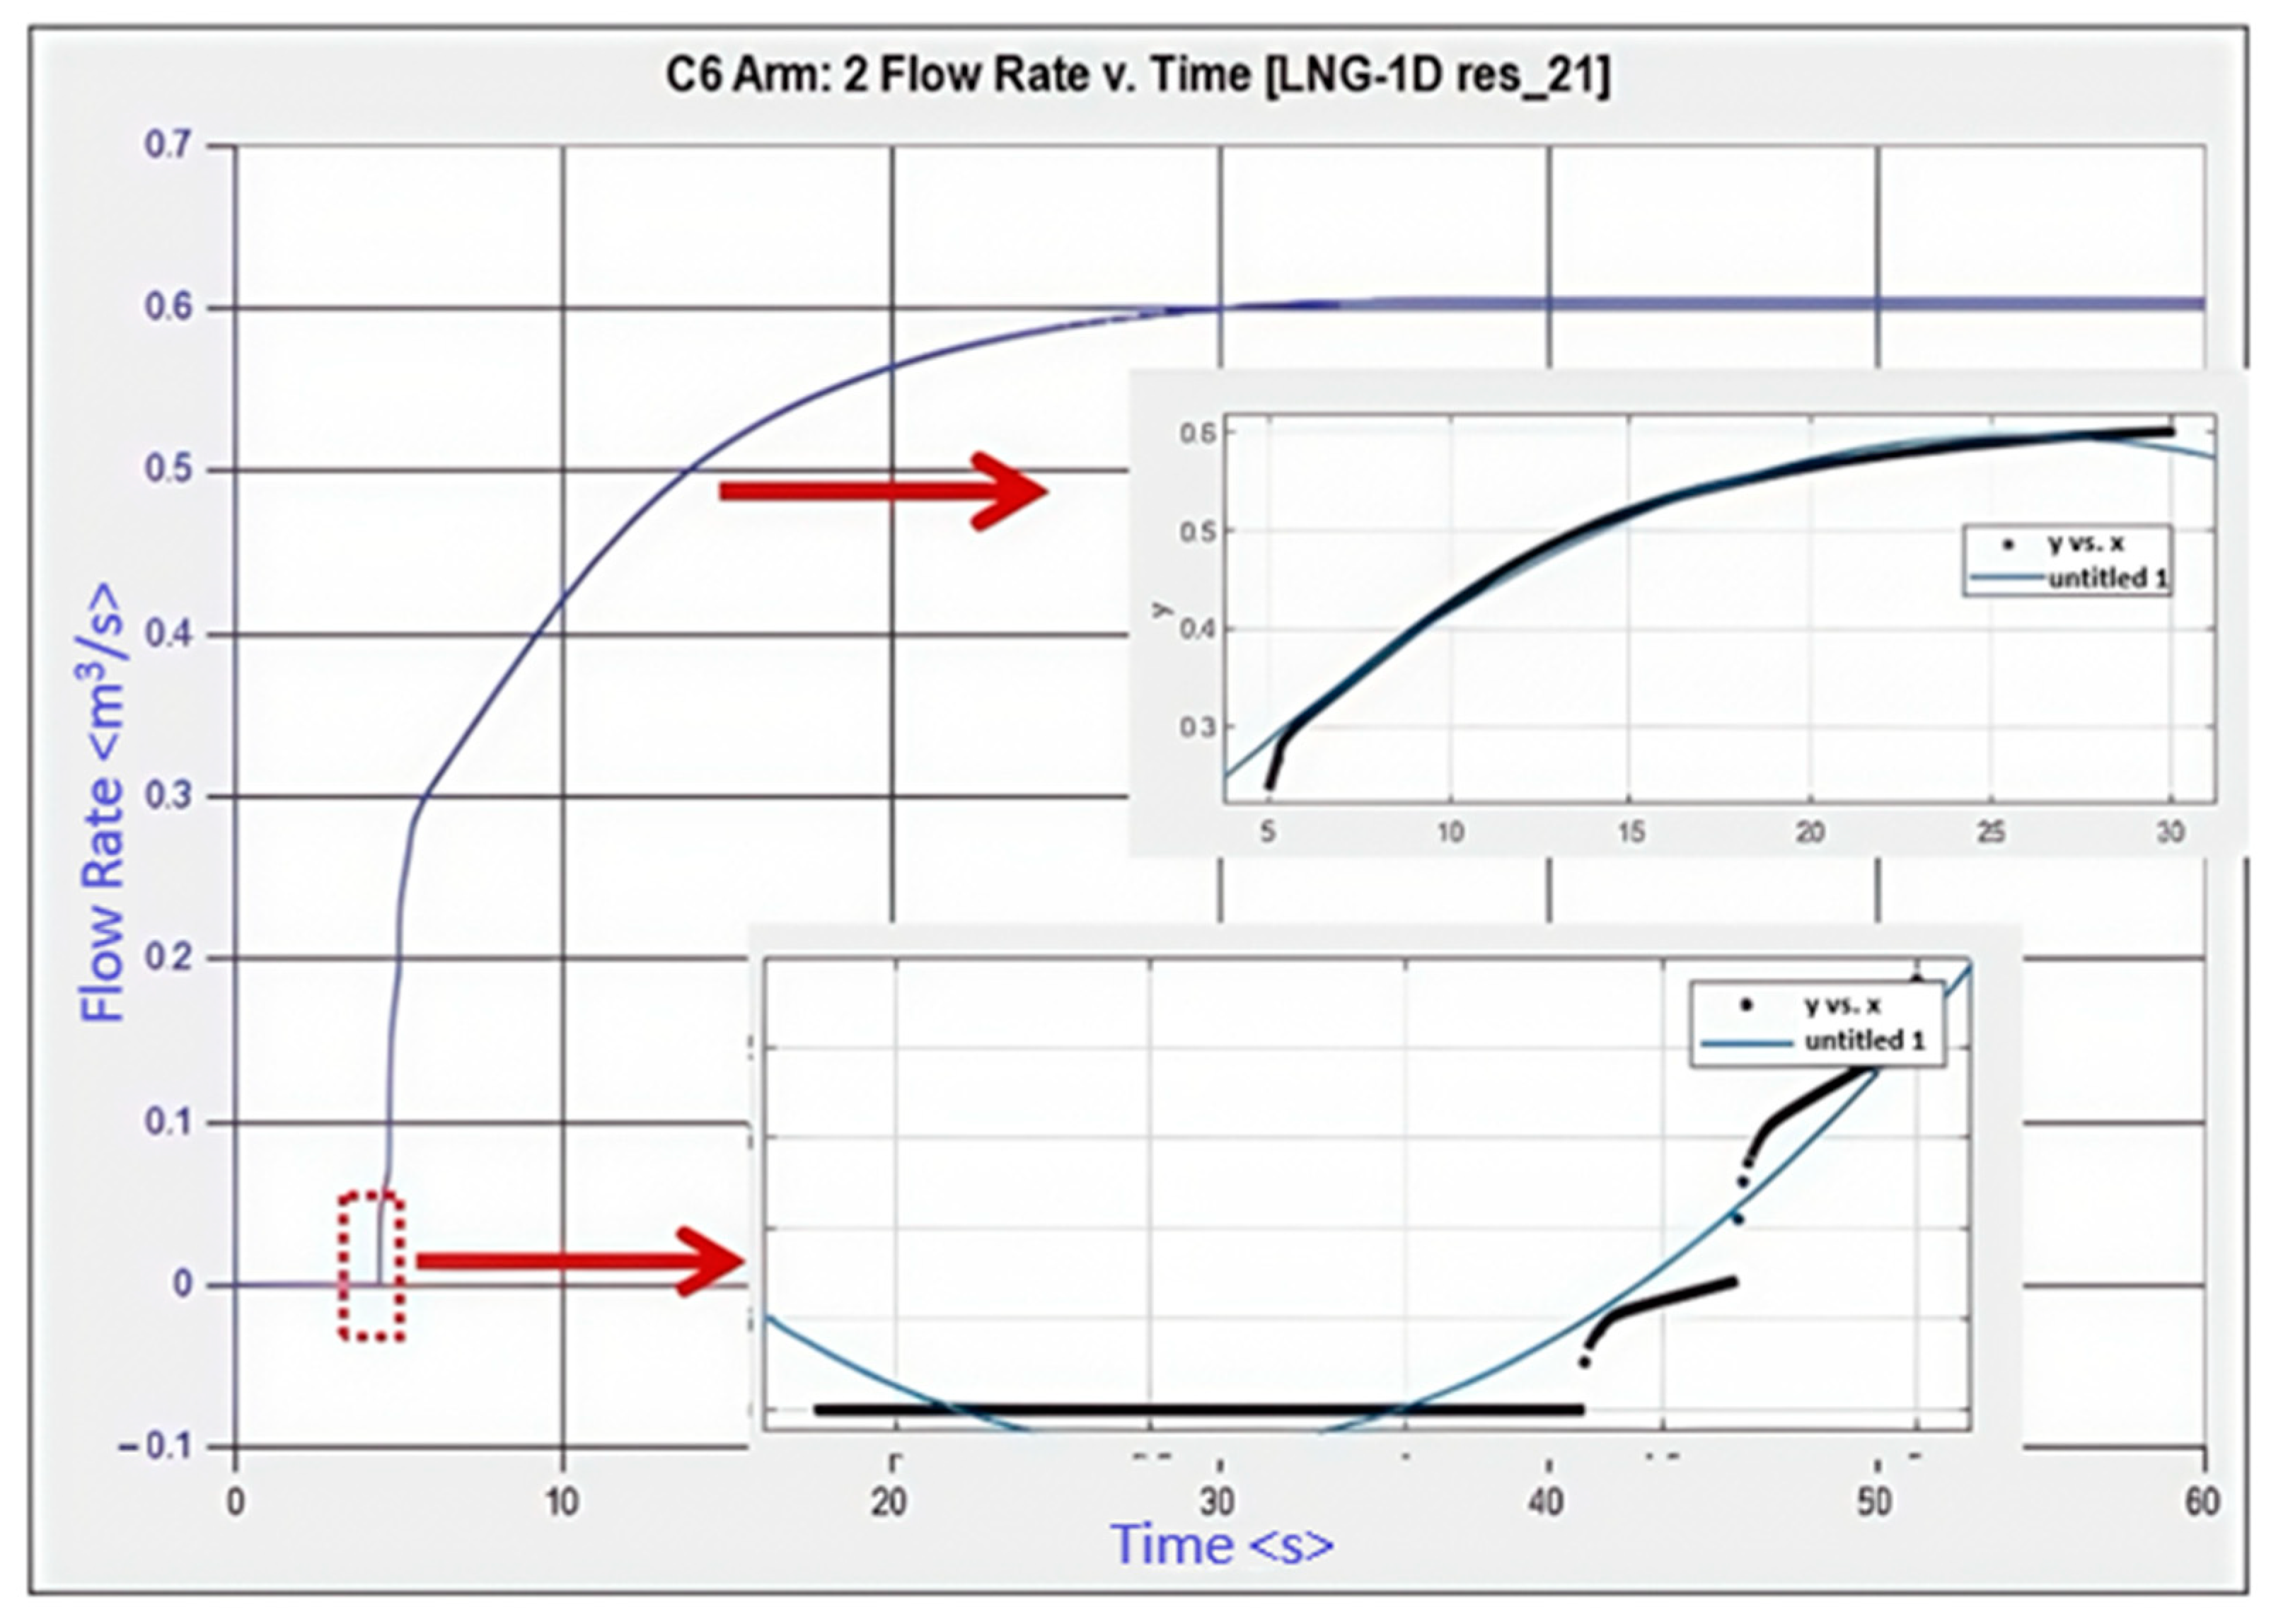
2.2. Boundary Condition Acquisition

The start-up conditions for the LNG pump included the following: (1) the outlet valve of the LNG pump was a check valve; (2) the LNG pump completed start-up within 5 s, reaching a rotational speed of 1750 r/min; and (3) the valve opening was greater than 3% before start-up, with an opening range of 18% to 25%. Based on the start-up requirements, a control flowchart for the start-up transition process was drawn, as shown in Figure 2.
When the pump started, the starting torque of the motor was not a constant value. The initial starting torque was very high, approximately 2-to-3 times the rated torque (for reduced-voltage starting), or even 8-to-10 times the rated torque (for full-voltage starting). However, as the rotational speed increased, the starting torque gradually approached the rated torque. The specific speed of the LNG pump was 98.1, and it started with the valve closed. When the pump was in the acceleration phase during start-up, the following formula was satisfied:
T e t     T h + T f = I d ω dt .
During the start-up process of the LNG pump, the sum of the hydraulic resistance torque ( T h ) and the rotor friction torque ( T f ) was proportional to the square of the pump’s rotational speed. Therefore, the total resistance torque could be expressed as follows:
T h + T f = C 1 · ω 2 .
Substituting Equation (3) into Equation (2), we obtain the following:
Δ T = T e t     C 1 · ω 2 = I d ω dt = T 0     C 2 · ω 2 .
During the start-up process, the starting torque Te(t) gradually approached the rated torque (Tp) as the rotational speed increased. It can be seen that Δ T had a linear relationship with the square of the rotational speed. This relationship has also been verified by the experiments conducted by many scholars. Therefore, the starting torque Te(t) also had a linear relationship with the square of the rotational speed. The rotational speed acceleration tended to zero as time increased. During the start-up process, the rotational speed as proportional to the square of time. When the starting torque Te(t) equaled the rated torque, n = np, the speed variation model of the pump could be obtained as follows:
n = n p     n p t p 2 t     t p 2 .
In the equation, tp is the total time for the pump start-up process (s), and np is the rated speed of the main circulation pump (r/min).
Therefore, the speed fitting formula for the LNG pump is as follows:
n t = 0.06899 t 2 + 350.5   t     0.1542 ,   0   s   <   t   <   5   s 1750 ,   t   >   5   s .
Based on the above analysis, the relationship between the rotational speed and time during the start-up process of the LNG pump was obtained, as shown in Figure 3. The real-time rotational speed of the LNG pump during start-up was used as the boundary condition for the one-dimensional and three-dimensional flow calculations within the LNG pump and the pipeline system.
A computational model, consisting of a pump, valves, and pipes, of the LNG pump and pipeline system was built using FLOWMASTER software 2021.1. The inlet liquid level was set at 5 m with an inlet pipe diameter of 0.4 m, and the outlet liquid level was set at 120 m with a pipe diameter of 0.38 m. The valve opening of the LNG pump was closed from 0 s to 2.85 s, opened from 0% to 20% between 2.85 s and 3 s, and remained at 20% from 3 s to 10 s, as shown in Figure 4. Based on Equation (6) and the one-dimensional calculation model, the variation of flow rate with time during the start-up process was calculated. The calculation results are shown in Figure 5.
The flow rate–time curve obtained during the start-up process through the one-dimensional model calculation was segmented and fitted. The mathematical fitting function for the variation of flow rate with time is as follows:
Q t = 0 ,   0   s   <   t   <   2.85   s 0.1094 t 2     0.7775   t + 1.361 ,   2.85   s   <   t   <   5   s 0.0007175 t 2 + 0.037   t + 0.1183 ,   5   s   <   t   <   10   s  

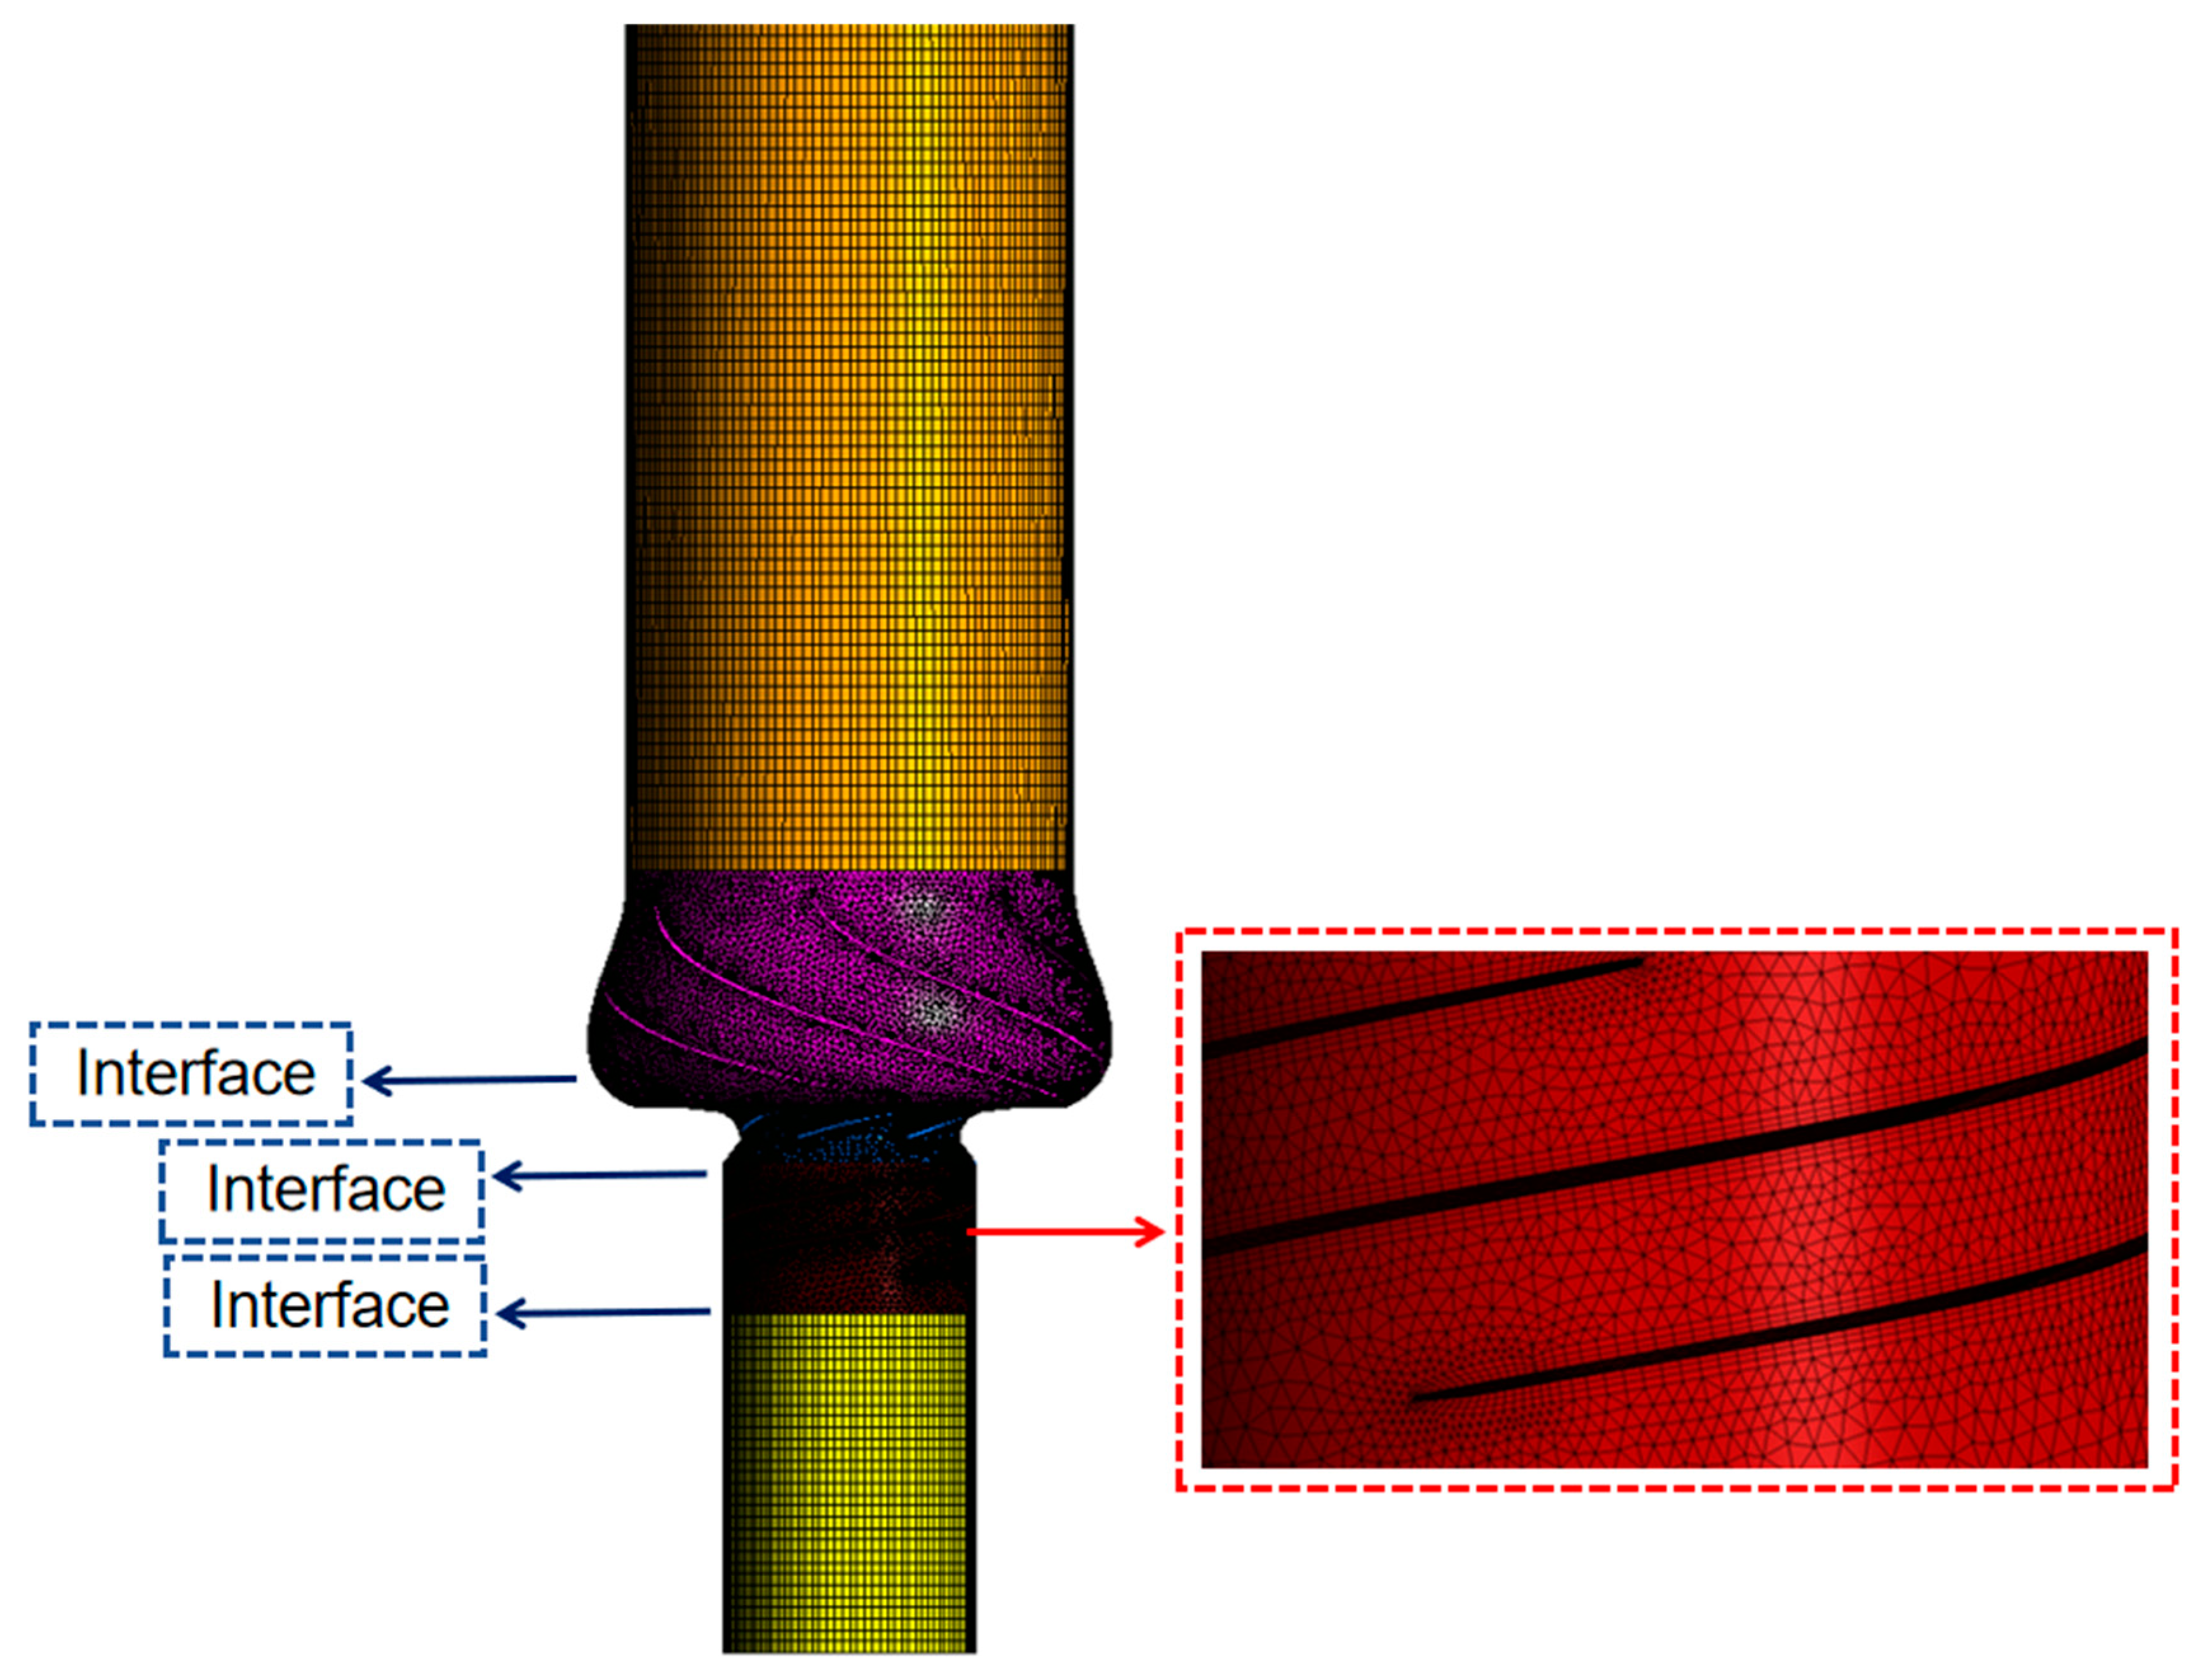
2.3. Grid and Boundary Conditions

Reynolds-averaged Navier–Stokes (RANS) and Large Eddy Simulation (LES) methods are commonly used for numerical studies [13]. Computational Fluid Dynamics (CFD) can be employed for detailed flow visualization, velocity profiles, and analysis of internal velocity and pressure fields [14,15].
The computational domain was meshed by ANSYS 2023 R1 Meshing software. The inlet and outlet sections of the LNG pump were structured grids, while the remaining parts were unstructured grids [16]. To achieve better flow effects, local refinement was applied to the inducer, impeller, and diffuser, and a three-layer boundary layer was added at the inducer blades, as shown in Figure 6. The total number of grids was 1,995,195. Among them, the number of grids for the LNG pump was 1,720,705, and the number of grids for the pipeline section was 274,490. The K-Epsilon model was used for the calculations performed in this study. The inlet of the computational domain was the bottom surface of the inlet section, and the outlet was the top of the pipeline. The pressure inlet and mass flow outlet were used as boundary conditions at the inlet and outlet, respectively. The start-up process was divided into three stages, and the mathematical models for the flow rate and rotational speed were fitted based on the computational model built with FLOWMASTER software, as shown in Table 1.

3. Results and Discussion

3.1. External and Internal Flow Characteristics of LNG Pump

In CFD calculations, the no-slip condition is applied to the walls. Under incompressible and steady-state conditions, the head of the pump is 136.59 m by the k-e model in order to demonstrate that the compressible results are credible. As shown in Figure 7a, the rotational speed followed a parabolic trend in the second stage, which is consistent with the fitted formula mentioned above. Figure 7b clearly shows that the head fluctuated significantly at the beginning of the second stage, with an amplitude reaching approximately 120 m. Between 3.0 s and 6.0 s, the baseline of the head gradually rose, with fluctuations ranging from 10 m to 40 m. From 6.0 s to 10.0 s, the baseline began to decline, with minimal fluctuations between 6.0 s and 7.3 s, and then it went into a rapid descent. Figure 7c indicates that the mass flow rate increased rapidly in a parabolic manner to 140 kg/s in the second stage and nearly linearly increased to 206 kg/s in the third stage. Figure 7d shows that the torque on the impeller fluctuated strongly at the beginning of the second stage with an amplitude of about 750 N·m. Between 6.0 s and 7.5 s, the fluctuations decreased significantly, similar to the head fluctuations. Additionally, the baseline trend of the impeller torque curve was similar to that of the mass flow rate curve.
As shown in Figure 8, at 3.0 s, the fluid was mostly gathered in the inlet section, forming a swirling state. At 5.0 s, the streamlines in the inlet section gradually smoothed out, with a noticeable contraction at the outlet. A local high-speed area appeared at the impeller outlet, and the streamlines in the outlet section were disordered, with vortex motion present. After 7.0 s, the radial velocity component in the outlet section became significantly stronger than the axial component. As the flow rate and rotational speed increased, the streamlines from the inlet section to the inducer gradually became smoother, and the flow state within the impeller improved.
According to Figure 9, at 3.0 s, the fluid had not yet entered the inducer, resulting in a relatively low overall pressure within the pump. After 5.0 s, a local low-pressure area appeared in the diffuser, which may be related to the higher streamline velocity in that region, as indicated in Figure 8. Additionally, low-pressure areas were generated in the center of the inlet section, the hub of the inducer, and the region near the hub at the impeller inlet. At 9.0 s, the low-pressure areas gradually contracted to the hub of the inducer and the region near the hub at the impeller inlet. As the flow rate and rotational speed increased, the pressure gradient within the LNG pump gradually decreased.
In this section, the external and internal flow characteristics of the LNG pump were analyzed. In terms of the external characteristics, the performance evolution of the pump during the start-up stage was demonstrated through curves of head, rotational speed, mass flow rate, and impeller torque over time. The results show that the rotational speed initially followed a parabolic trend and then stabilized at the rated speed; the head fluctuated significantly at the beginning of the start-up due to the complex internal flow field, which included the vortex regions, inlet and outlet recirculation, and secondary flows. These unstable flows altered the fluid flow resistance and pressure distribution, causing head fluctuations; the mass flow rate increased rapidly in the second stage and then linearly in the third stage; and the impeller torque fluctuations were similar to the head fluctuations, with a baseline trend close to that of the mass flow rate curve. Regarding internal flow characteristics, the flow process was presented through streamline and pressure contour maps, revealing the internal flow conditions of the pump. It was found that the flow in the initial start-up stage was gathered and disordered in the inlet section, but, as the flow rate and rotational speed increased, the flow gradually became smoother and the pressure distribution became more uniform.

3.2. Flow Characteristics and Pressure Attenuation Within the Pipeline

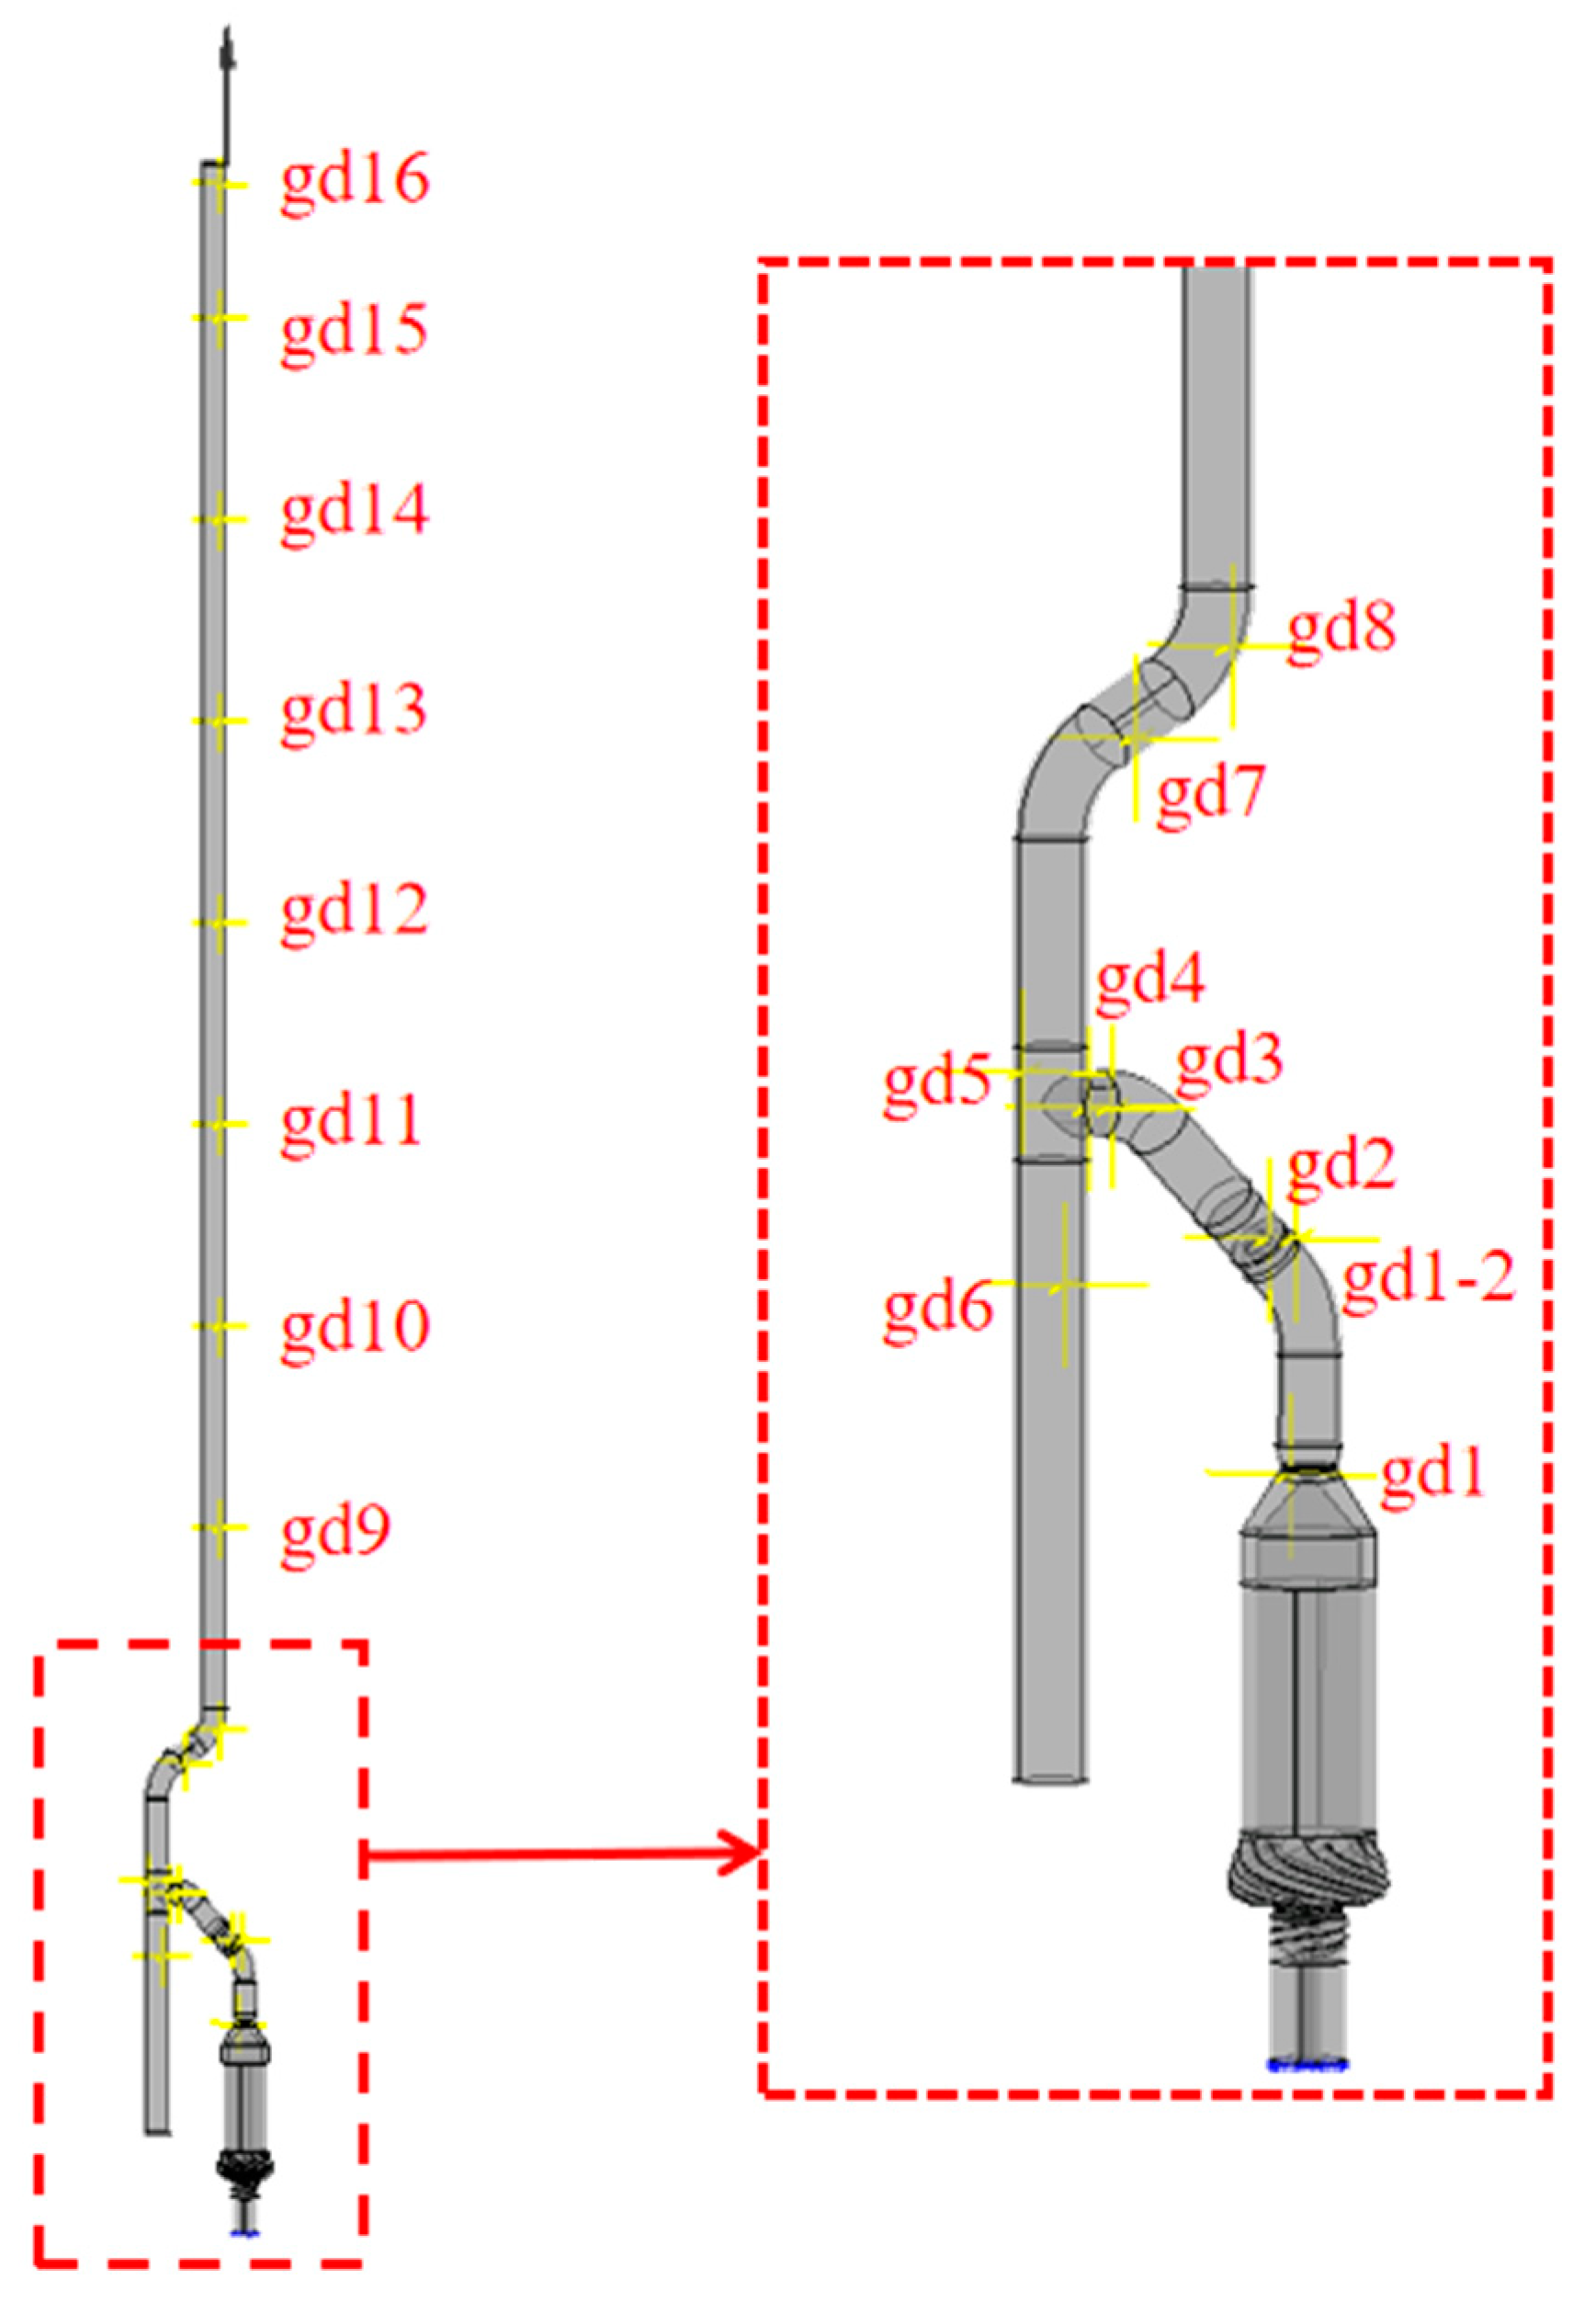
3.2.1. Monitoring Point Setup

To study the internal flow characteristics and pressure wave attenuation within the pipeline during the start-up condition, monitoring Points gd1 to gd16 were set up along the pipeline to detect pressure at different locations, as shown in Figure 10.

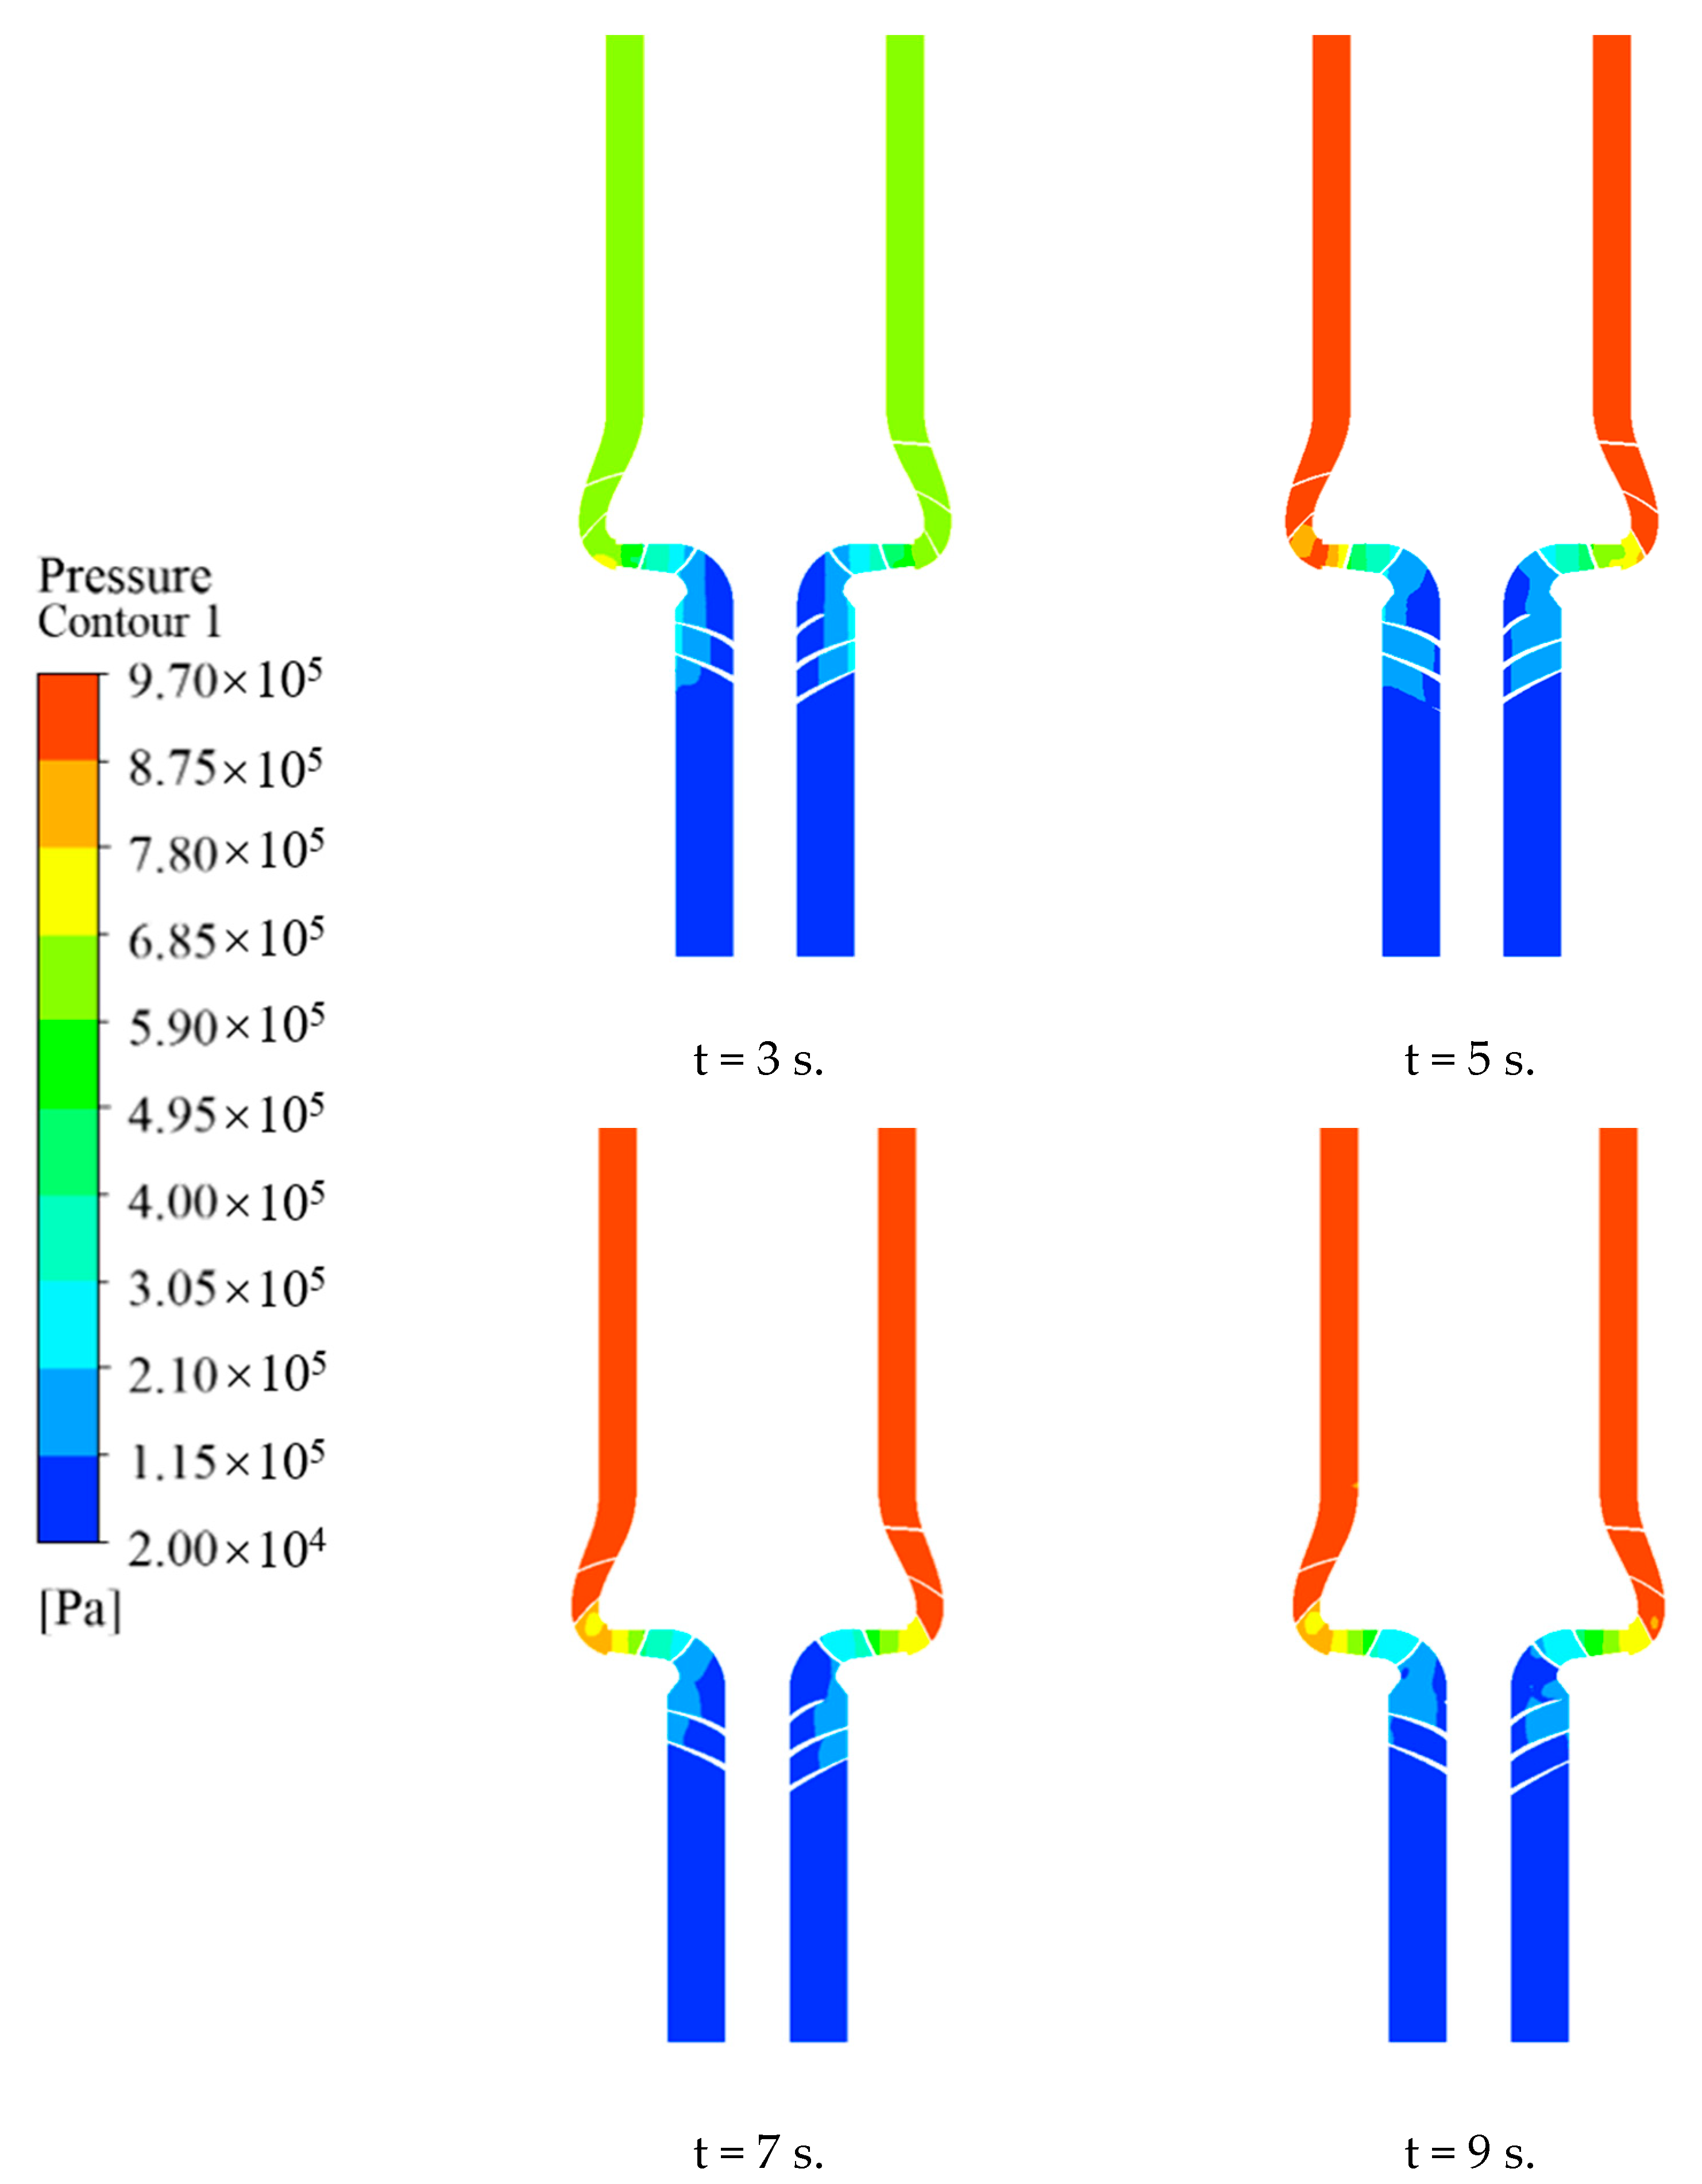
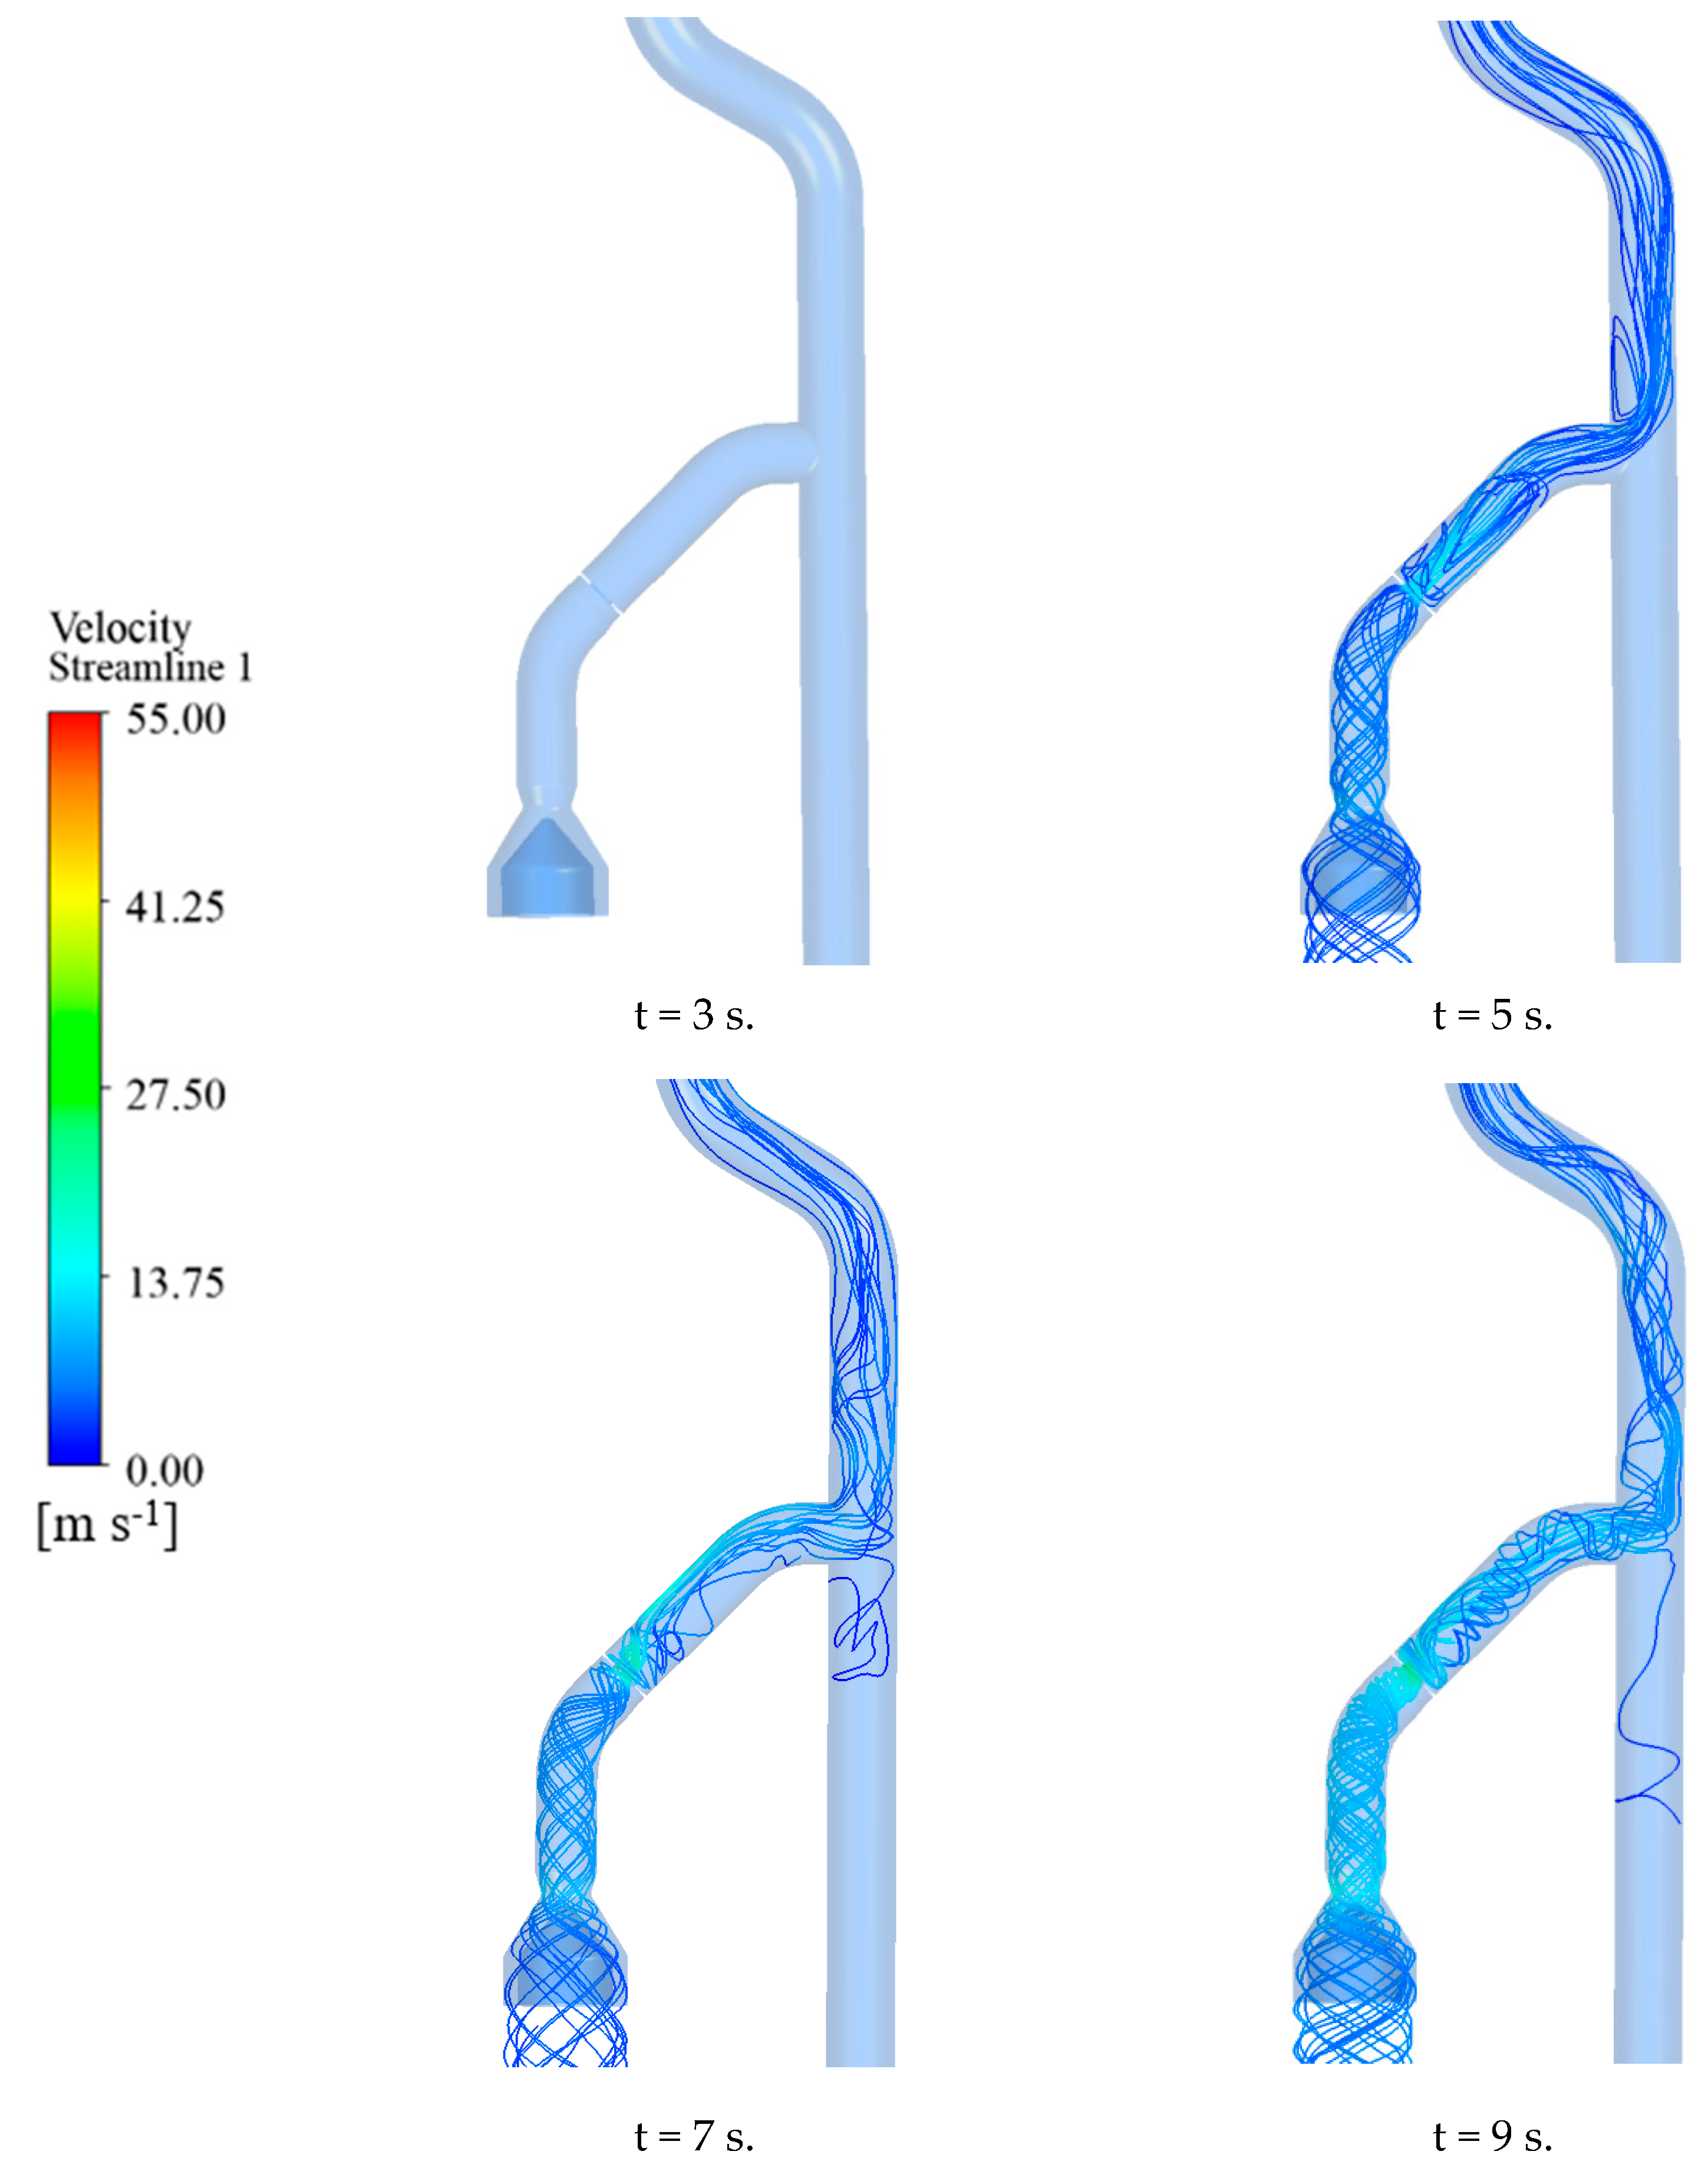
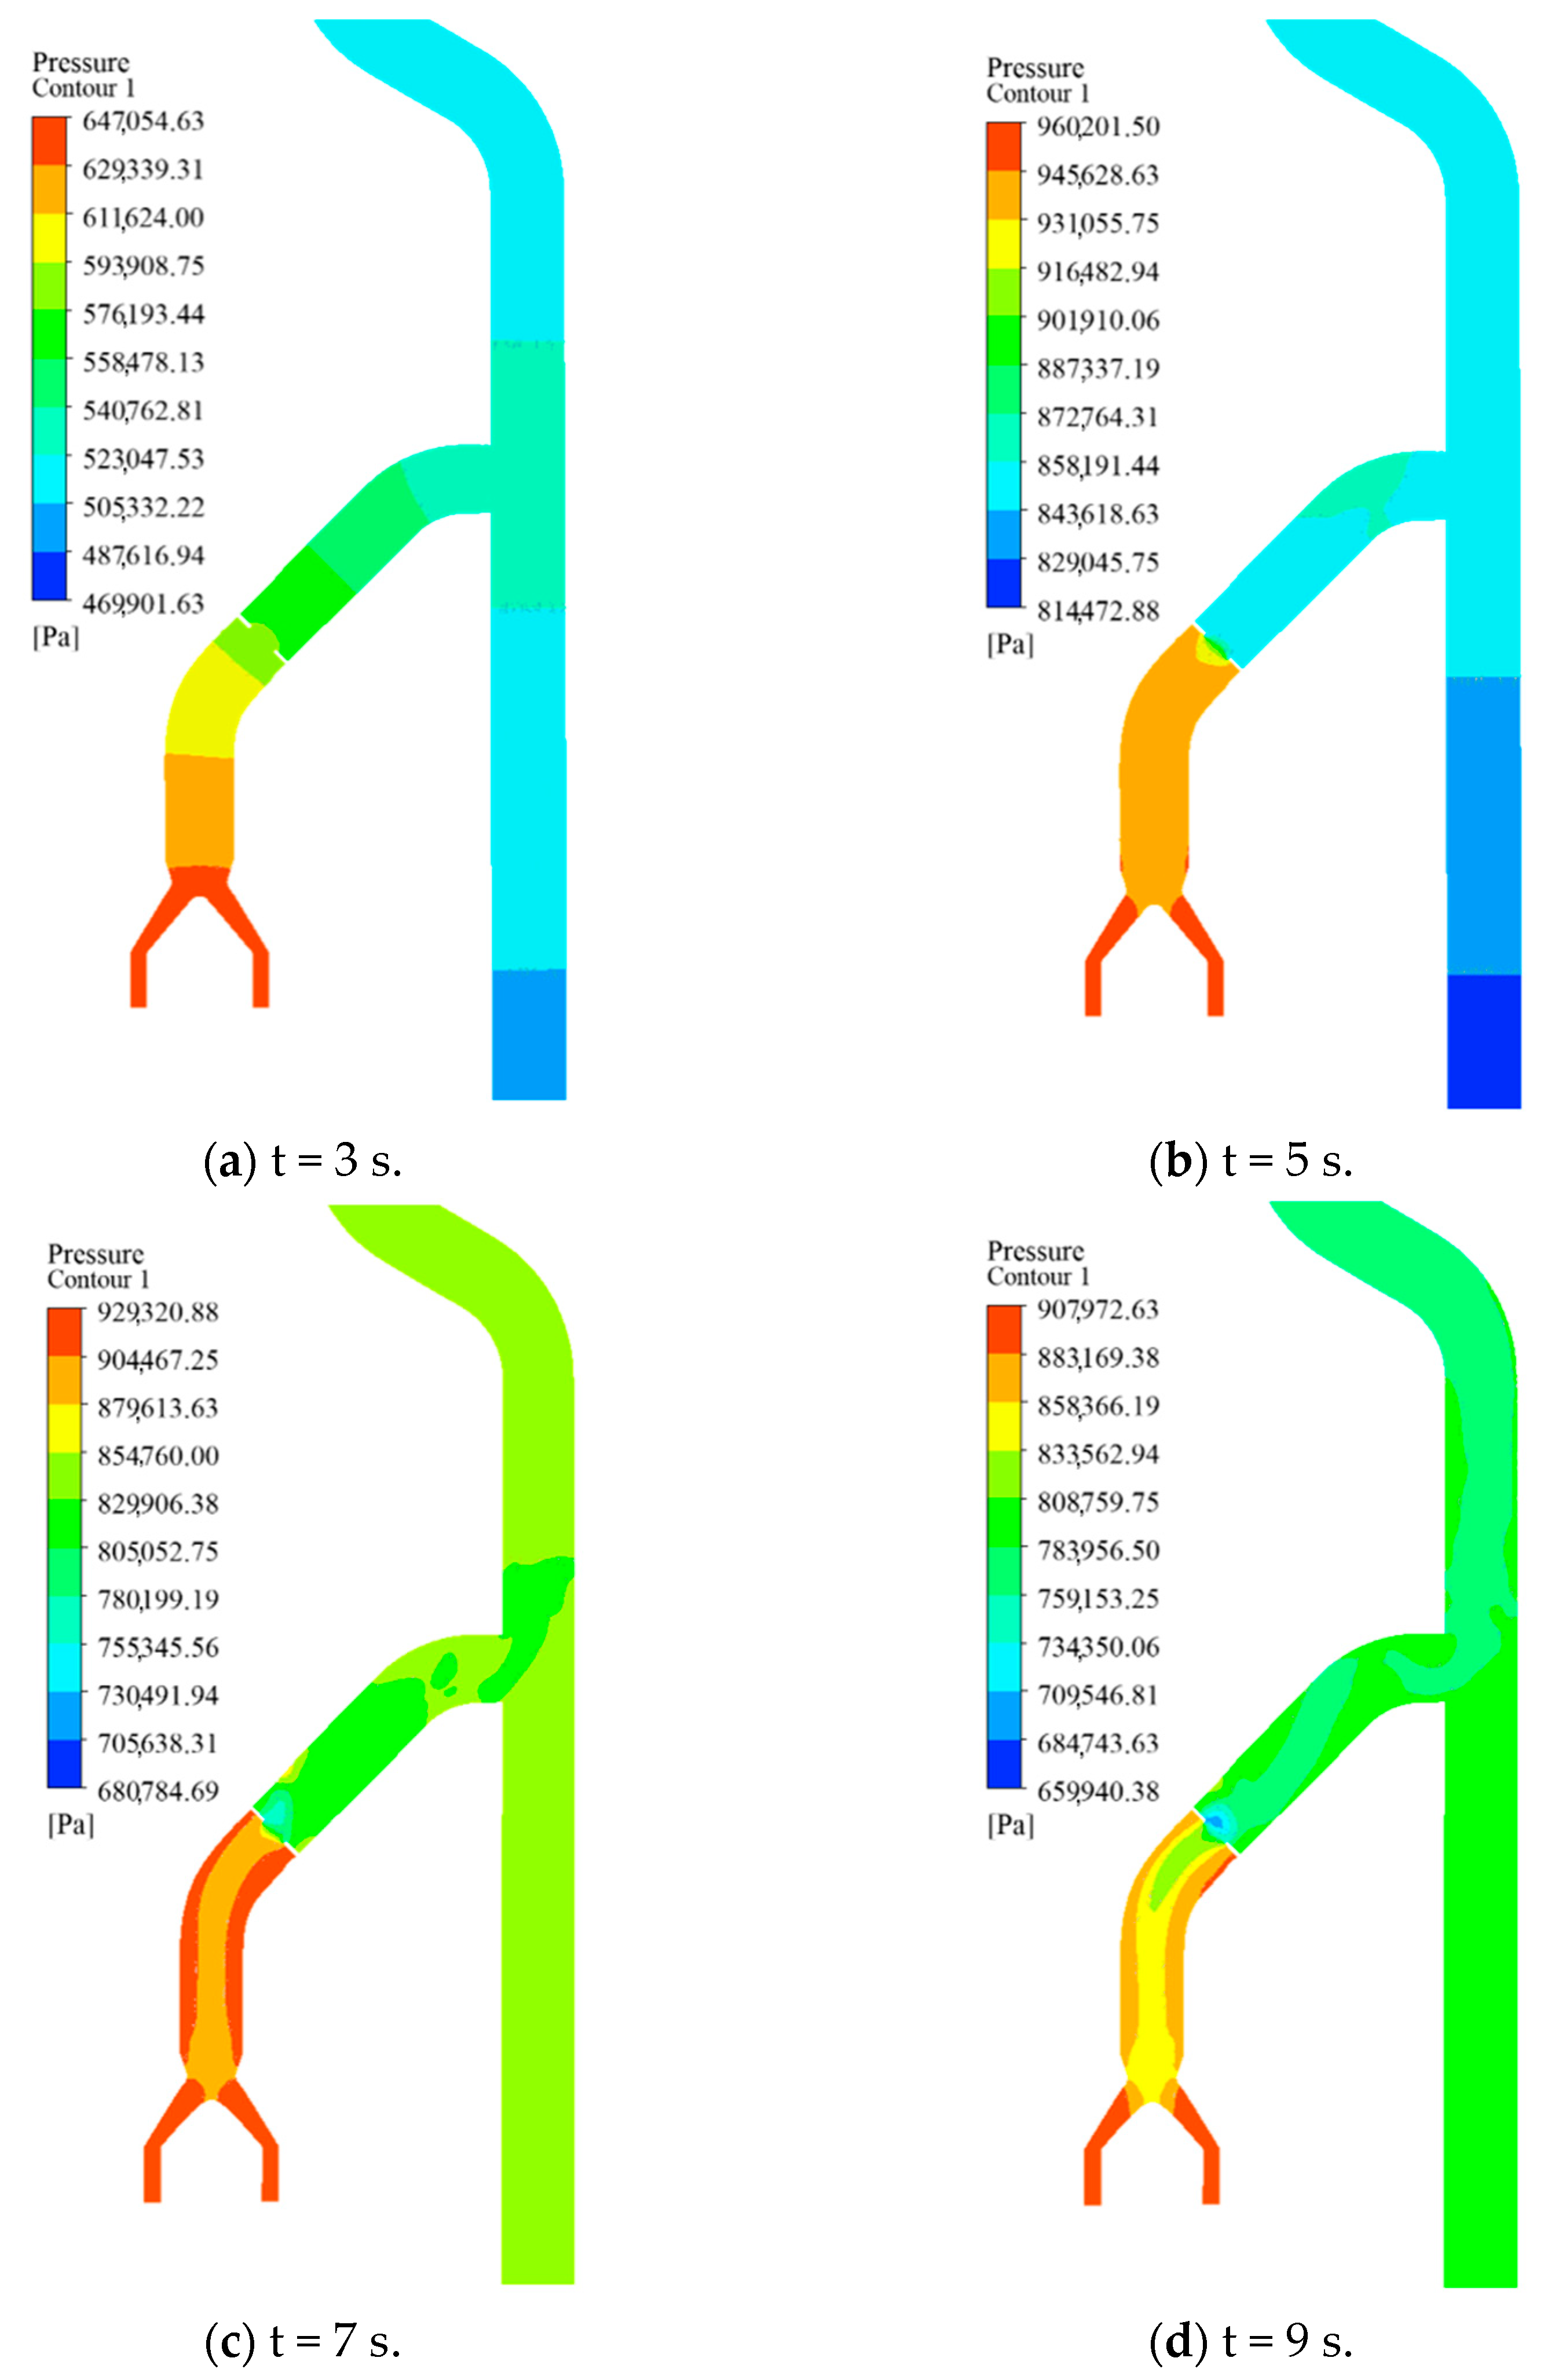
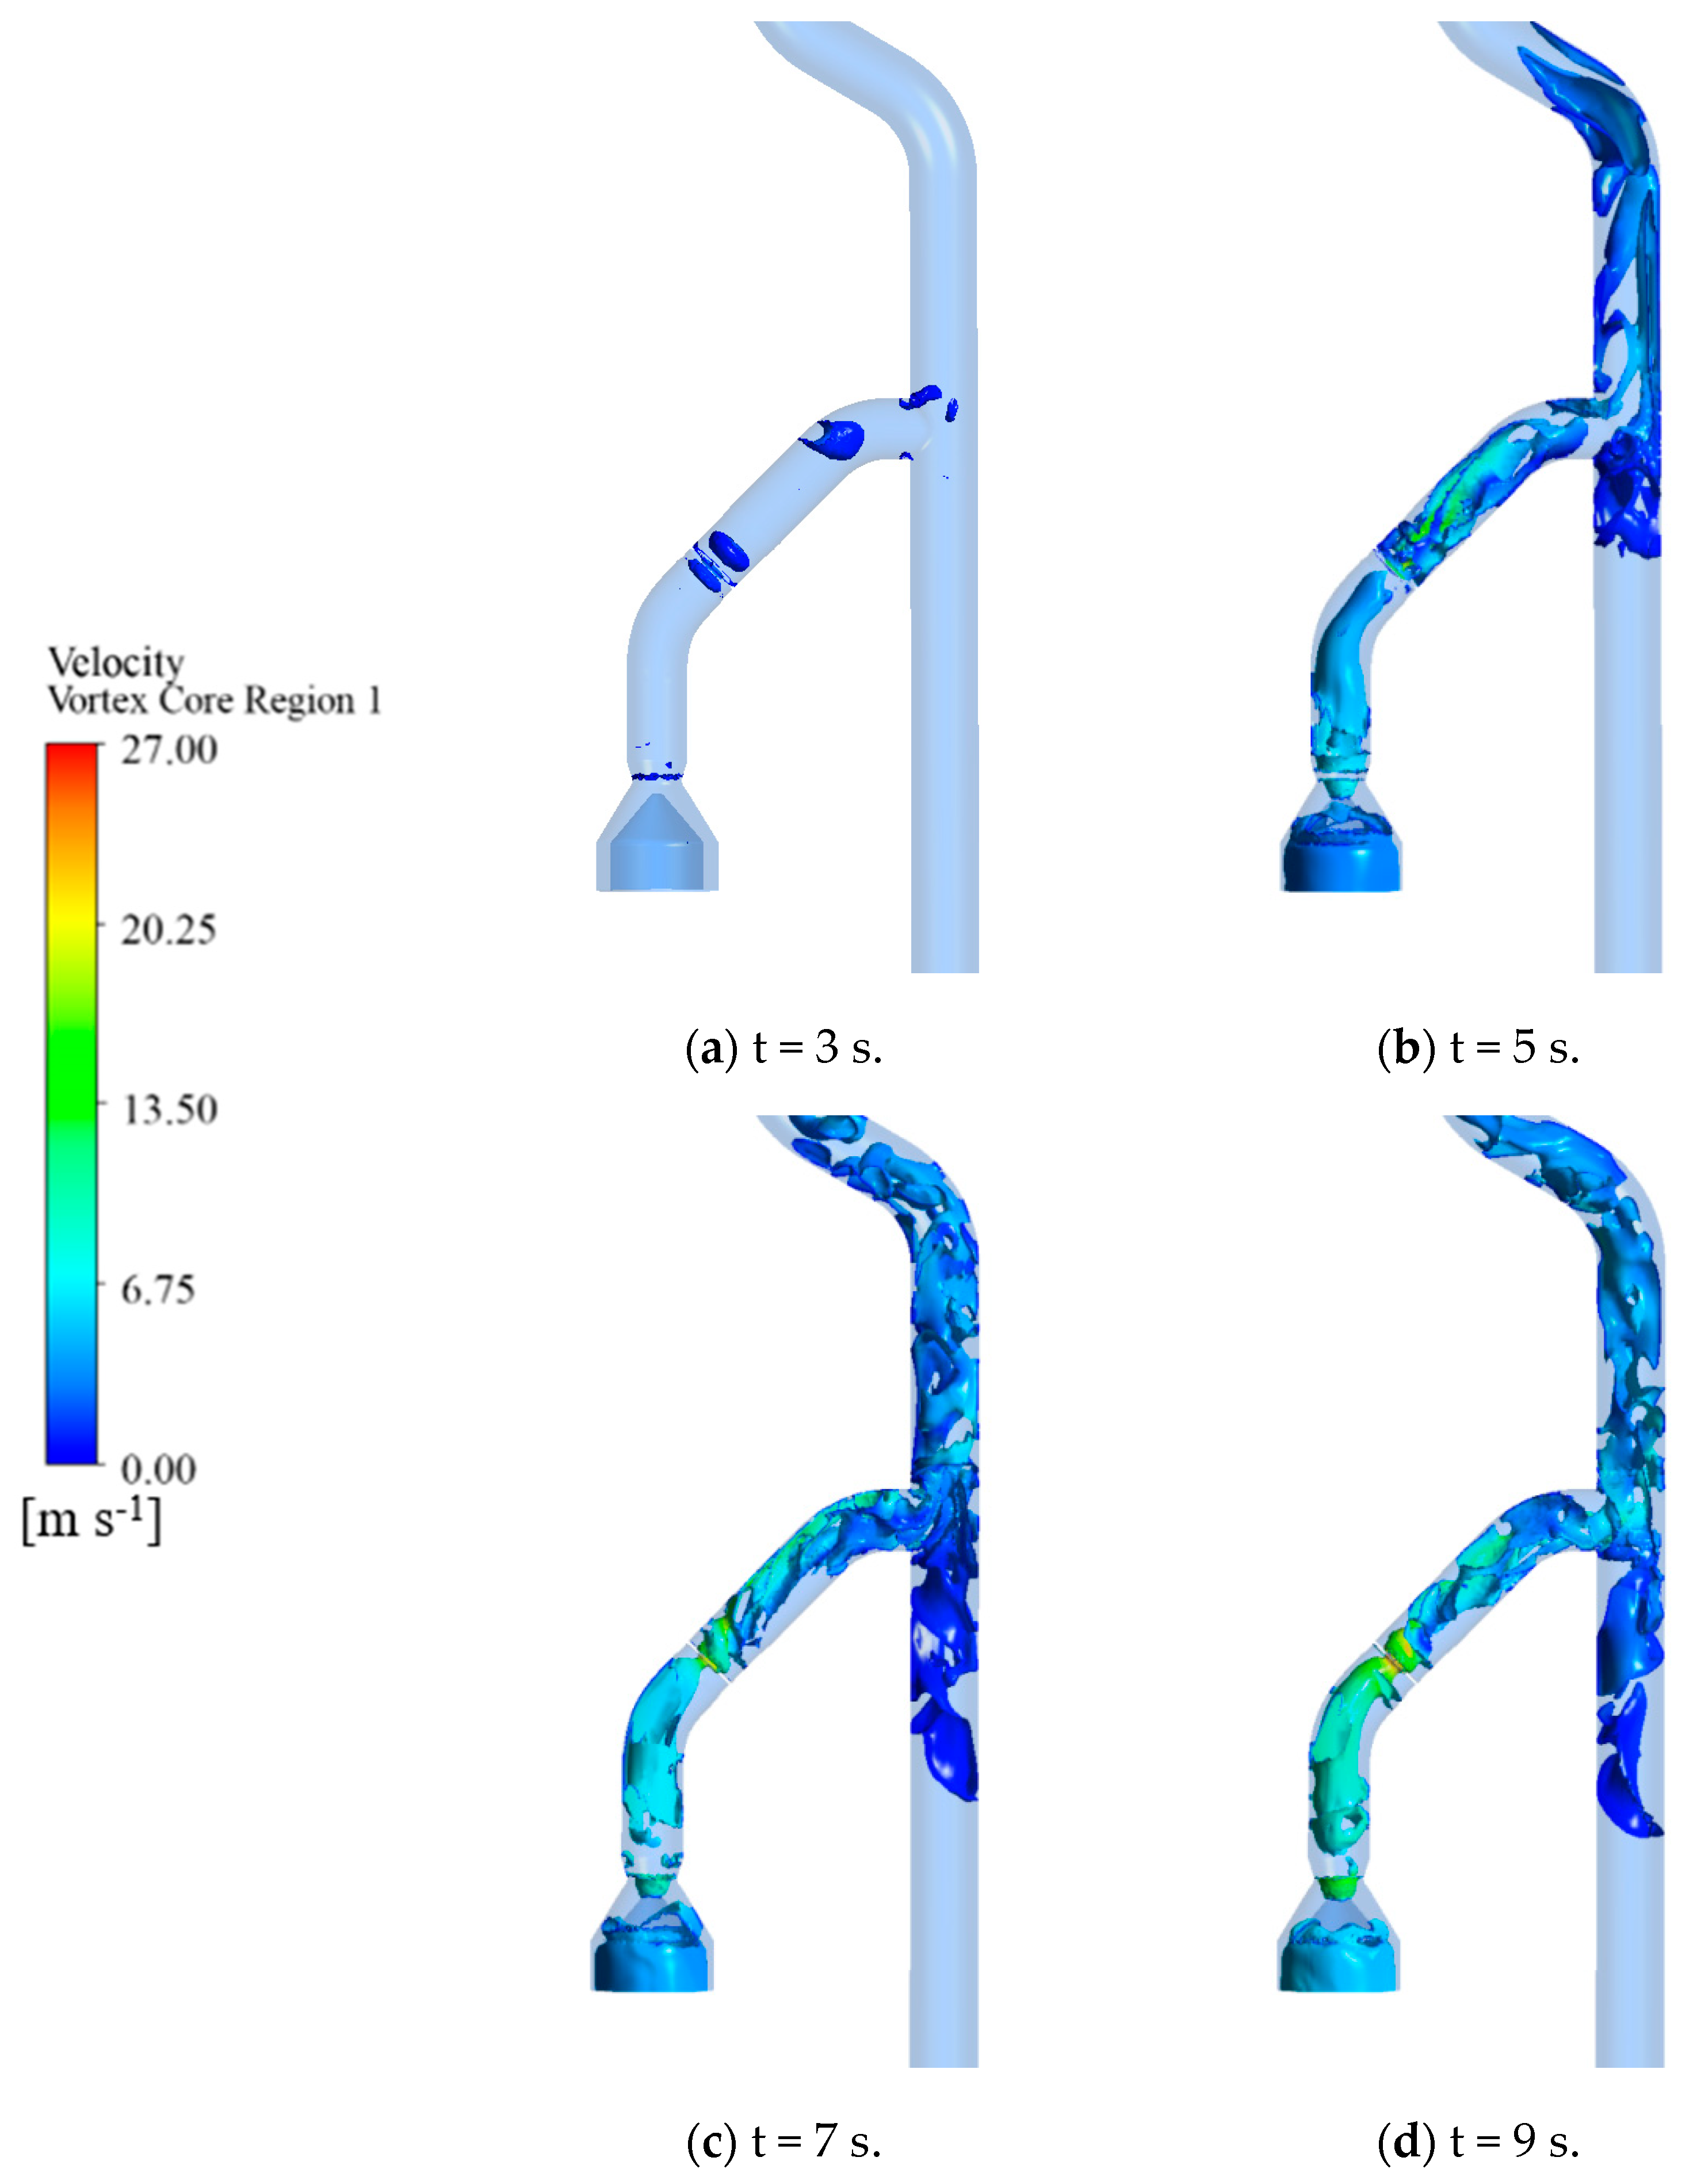
3.2.2. Flow Analysis at the Pipeline Tee Junctions

As shown in Figure 11, at 5 s, the streamlines at the tee junction were quite disordered, with noticeable vortices and recirculation at the inlet of the straight pipe, indicating unstable flow conditions. At 7 s, the streamlines from the valve downstream to the tee junction tended to converge from a dispersed spiral shape into a streamline bundle. By 9 s, a stable streamline bundle with a certain rotational component formed near the upper wall of the pipeline with a higher velocity than the surrounding spiral streamlines. A few streamlines began to appear in the lower straight pipe from 7 s, showing a tangled state.
As the rotational speed increased, the overall pressure at the tee junction tended to rise, and the pressure distribution gradually became more uniform from the valve downstream to the tee section. As Figure 12 shown, after 5 s, the local pressure in the bend was higher than the surrounding pressure, which is consistent with the characteristic of higher pressure at lower flow velocity. In the third stage, as the flow rate increased, the overall pressure within the tee pipe fluctuated. At 7 s, noticeable low-pressure areas appeared downstream of the valve and at the tee junction, corresponding to the high-speed jet positions in the streamline diagram.
The Q-criterion, widely used for vortex identification, is applicable here. When Q > 0, it indicates that rotational motion dominates, and the region is a vortex area. As shown in Figure 13, at 3.0 s, vortices with a scale of 10−2 were mainly distributed at the bend of the tee junction and the intersection with the straight pipe, with a relatively small range. As the rotational speed increased, after 5.0 s, the fluid was constrained by the geometry, generating strong shear forces, and the vortices gradually extended downstream of the tee straight pipe, with a distribution similar to the streamlines shown in Figure 11. After 7.0 s, vortices almost filled the entire tee pipe, with lower velocities. The vortex velocity at the tee junction increased significantly and gradually distributed in the lower half of the straight pipe. Combining the streamline diagram, it can be seen that the regions with disordered streamline distribution coincided with the vortex distribution, indicating that the vortex structures exacerbated flow instability.
During the start-up stage, the acceleration of the fluid at the pipeline tee junctions led to increased inertial forces, resulting in flow separation and vortex generation. As the rotational speed and flow rate increased, the flow gradually adapted to the pipeline shape, forming high-speed streamline bundles. The diffusion and concentration of vortices reflect the redistribution and dissipation of flow energy.

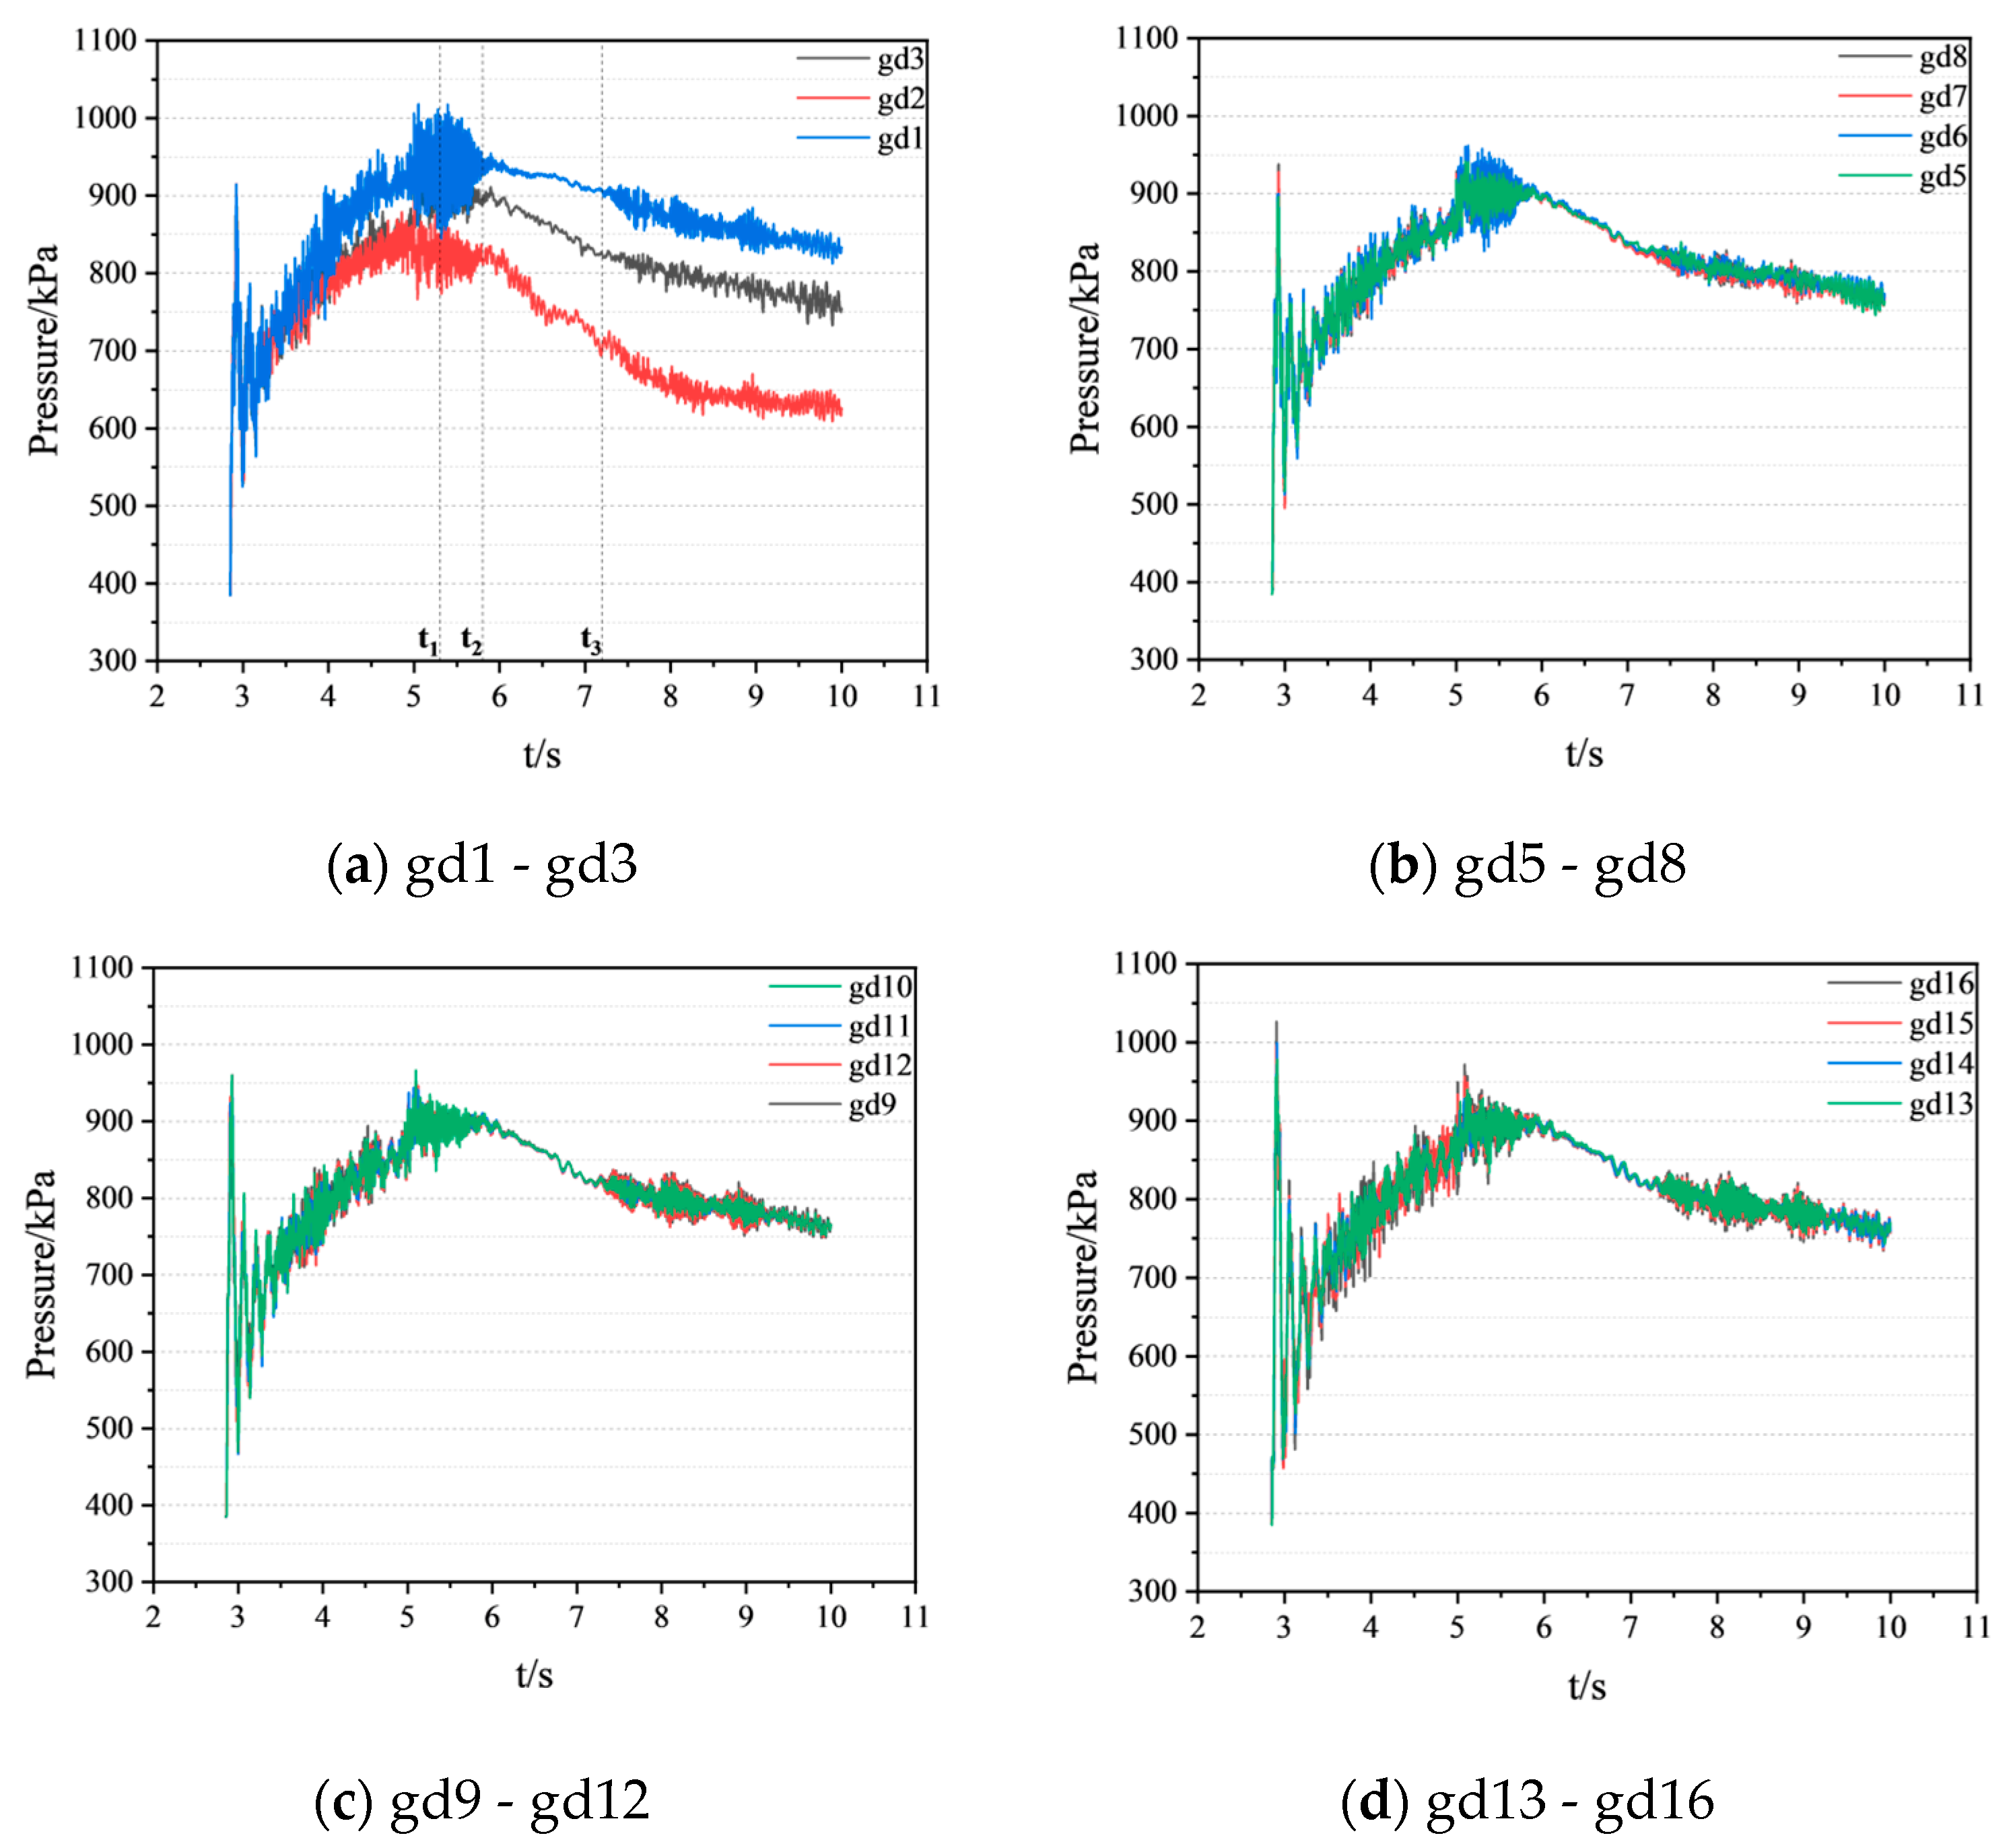
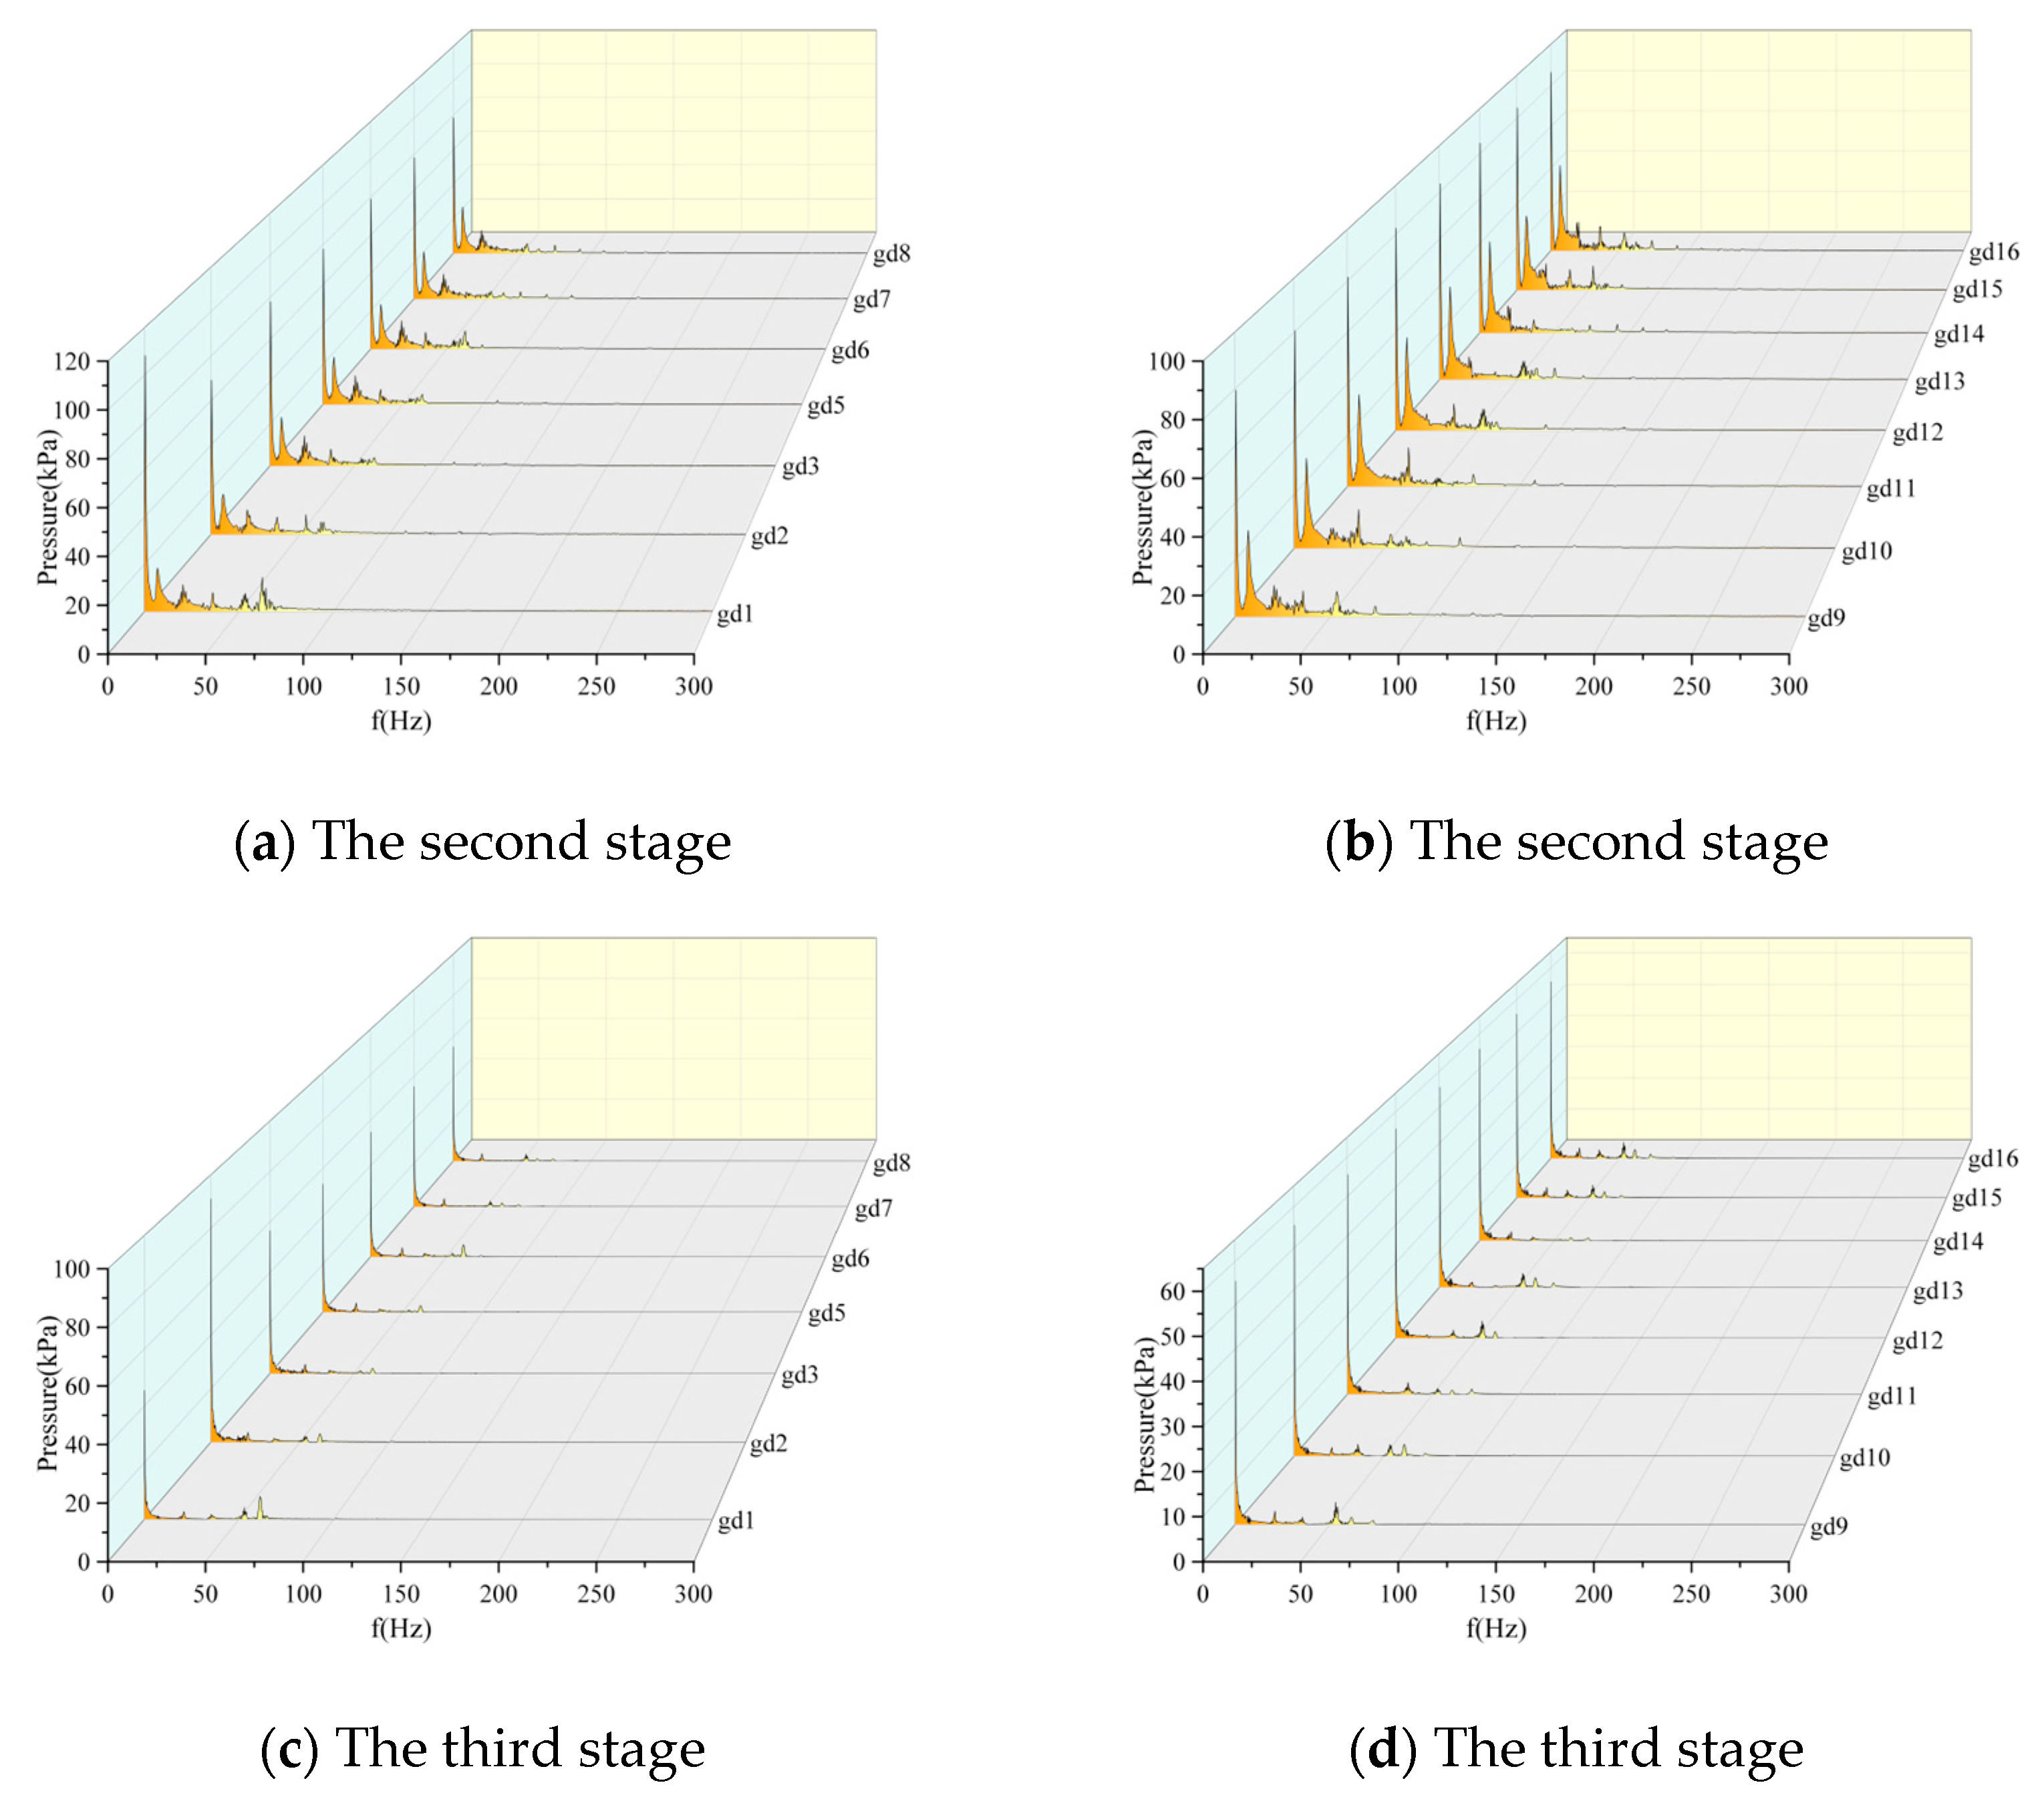
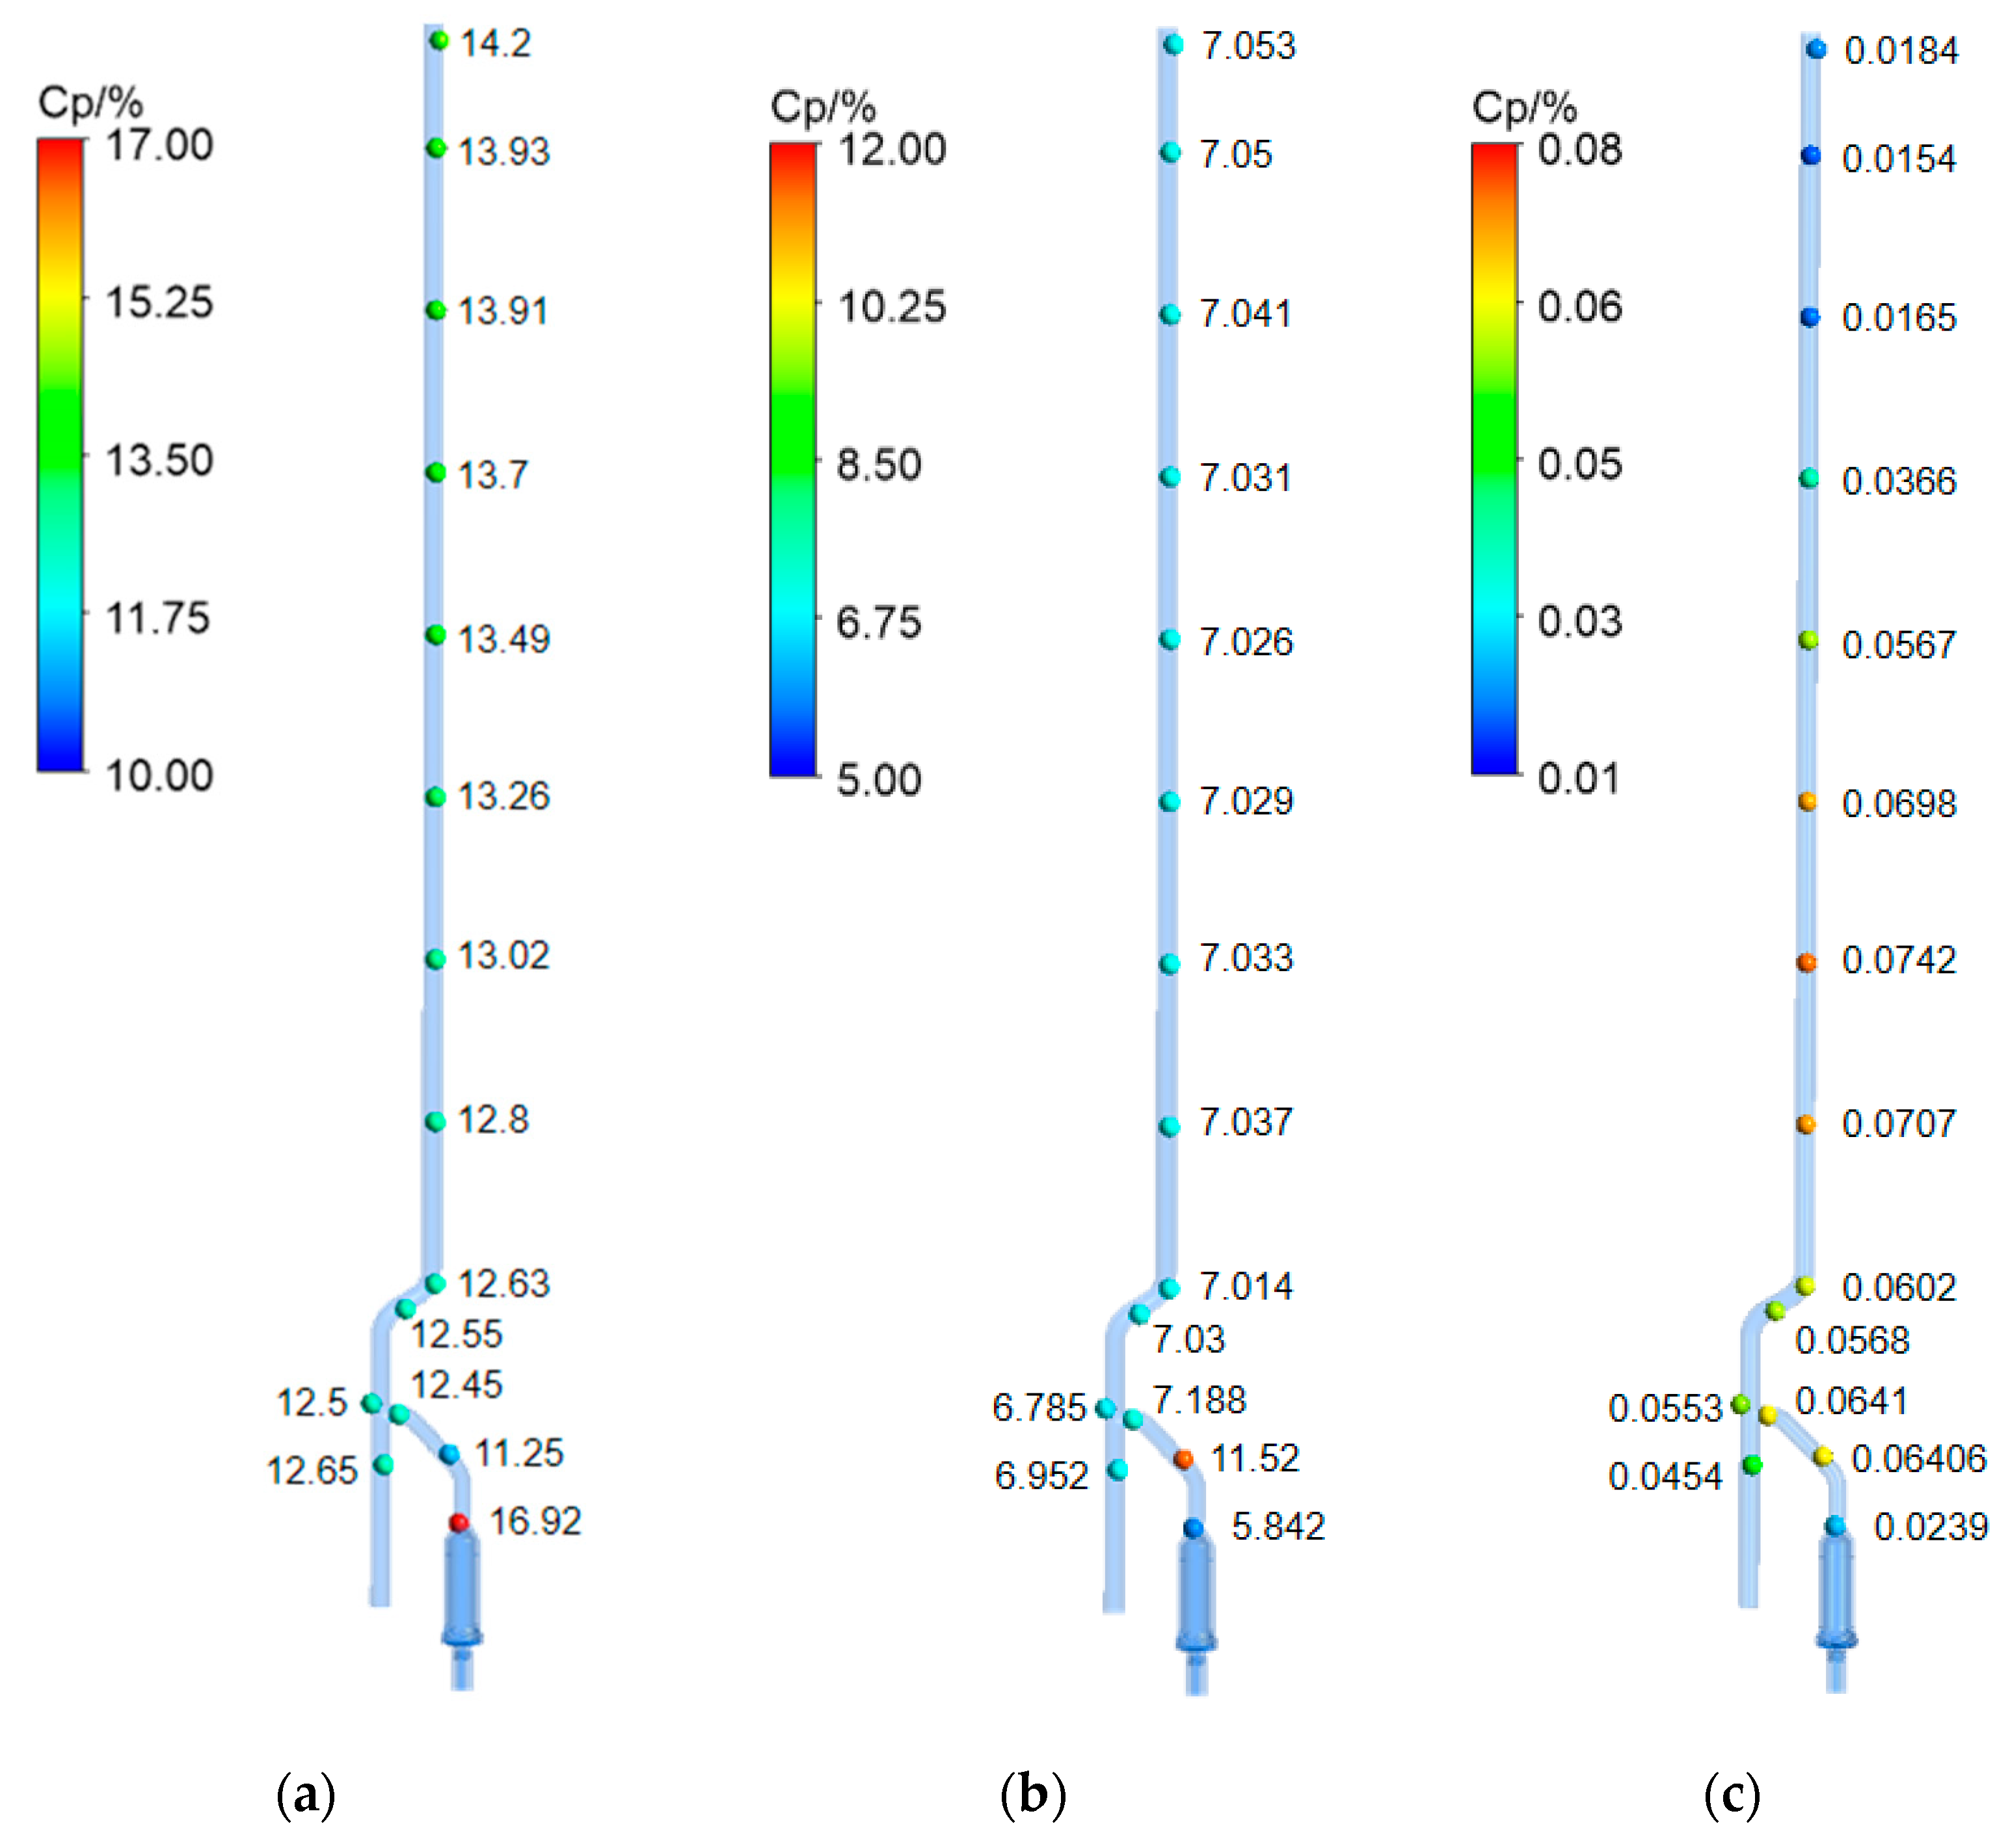
3.2.3. Pressure Wave Attenuation Within the Pipeline

Figure 14 shows the time-domain curves of the pressure pulsation at monitoring points within the pipeline during the start-up process. It can be observed that the pressure gradient in the front section of the pipeline was relatively large during start-up. For example, as shown in Figure 14a, the three monitoring points in the branch pipe showed similar trends in pressure pulsation baseline changes over time. Among them, monitoring Point gd1, located near the LNG pump outlet, had the highest pulsation amplitude. Point gd2, located at the pipeline section with a sudden reduction in radial area, had the lowest pulsation amplitude. The maximum difference between these two points occurred between 8 and 10 s. As shown in Figure 14b, Points gd5 and gd6 were located in the straight pipe section, while Points gd7 and gd8 were in the bend section. The pressure curves of these four points showed similar trends over time, but, during the period of 5 to 6 s, the former two had larger amplitudes and higher frequencies than the latter two. Figure 14c,d indicate that the pressure amplitude and phase of monitoring Points gd9 to gd16 were basically consistent. Additionally, the Positions t1, t2, and t3 in the figure represent the moments of 5.3 s, 5.8 s, and 7.2 s, respectively, which will be studied in the next section.
Figure 15 shows the frequency-domain diagrams of the pressure pulsation at the monitoring points, with Figure 15a,b representing the second stage and Figure 14c,d representing the third stage. The main frequency in the second stage was 0.465 Hz, with higher pressure values corresponding to this frequency, reflecting the characteristics of significant pressure and flow oscillations during this stage. At monitoring Points gd1 to gd7, the pressure values corresponding to the main frequency generally decreased gradually, while at Points gd8 to gd16, the pressure values increased. In the third stage, the main frequency was 0.2 Hz, with significantly lower pressure values than in the previous stage. Moreover, during the second stage, the pressure value at Point gd2 was lower than the value at Points gd1 and gd3, but it was evidently higher than them in the third stage. In the straight pipe section (from Points gd9 to gd16), the pressure values at the main frequency exhibited a characteristic of increasing progressively toward the pipe outlet.
The variation of the pressure pulsation coefficients was closely related to the flow state of the fluid, the geometric structure of the pipeline, and the boundary conditions. Figure 16 shows the changes in the pressure pulsation coefficients at specific frequencies along the pipeline, with monitoring points represented by uniformly sized spheres, and the values of the pressure pulsation coefficients (Cp) are indicated by the colors of the spheres. Figure 16a,b show the pressure pulsation coefficients corresponding to the main frequencies during the second and third stages, respectively, while Figure 16c shows the pressure pulsation coefficients corresponding to the rotational frequency during the third stage. As shown in Figure 16a, the monitoring Point gd1 located near the pump outlet had the highest pulsation coefficient. As shown in Figure 16b, the pressure coefficient at Point gd2 was significantly elevated, possibly due to the sudden reduction in flow area at this location, which caused unstable fluid accumulation. The pressure pulsation coefficients shown in Figure 16a were generally higher than those shown in Figure 16b. Additionally, Figure 16c better illustrates the attenuation pattern of the pressure pulsation coefficients within the pipeline. In the straight pipe section, the pressure pulsation coefficients decreased with increasing pipe length, while a slight increase was observed near the pipeline exit.
From the time-domain analysis, it was evident that the pressure pulsation amplitude was highest at the monitoring points near the pump outlet. This was attributed to the intense energy input from the pump, resulting in unstable flow conditions. From the frequency-domain analysis, the second stage exhibited a higher main frequency with higher pressure values, indicating significant pressure and flow variations. In contrast, the third stage showed a lower main frequency with significantly reduced pressure values, suggesting that the flow was gradually stabilizing. In the straight pipe section, the decrease in pressure pulsation coefficients was due to the development of turbulent structures as the fluid flowed, leading to energy dissipation and more uniform flow. The sudden increase in pressure pulsation coefficients near the pipeline exit may have been caused by the reflections or disturbances from the boundary conditions, resulting in localized pressure fluctuations.

3.3. Influence of Pump Internal Flow Field on Pipeline Pressure

As shown in Figure 14, between approximately 5.2 s and 5.4 s, the pressure waveforms at all monitoring points within the pipeline exhibited violent oscillations (with a slowly rising baseline). Between 5.8 s and 7.2 s, the pressure waveforms showed low-frequency fluctuations with small amplitudes and a continuously declining baseline. The flow passage structure played a crucial role in the entire fluid system’s pressure [17]. Therefore, the internal flow conditions of the LNG pump at 5.3 s, 5.8 s, and 7.2 s were selected for study.
Figure 17 and Figure 18 show the local turbulent kinetic energy and velocity streamline distributions in the impeller at the three time points, while Figure 19 and Figure 20 present the turbulent kinetic energy contour and velocity vorticity distribution in the axial view of the inlet section, inducer, impeller, diffuser, and outlet section.
As shown in Figure 17, at 5.3 s, the fluid medium entered from the inlet section and underwent the work performed by the impeller rotation, resulting in significant differences in turbulent kinetic energy. A distinct band of high turbulent kinetic energy was observed at the impeller inlet, while a high dissipation area was noticeable at the blade trailing edge due to flow separation. As the flow rate increased, by 7.2 s, the turbulent kinetic energy gradient at the inlet edge almost disappeared, and the high dissipation area at the blade trailing edge significantly reduced. Additionally, a distinct turbulent kinetic energy gradient was observed on the backside of the blade leading edge between 5.3 s and 5.8 s, which became more uniform by 7.2 s.
According to Figure 18, at 5.3 s, low-speed areas were evident at the impeller inlet and on the backside of the blades. This was primarily due to the insufficient initial flow within the pump, leading to boundary layer separation near the blade backside. At 5.8 s, the fluid velocity gradient was large, but the overall velocity was higher with a gradually improving streamline distribution. By 7.2 s, the low-speed areas within the impeller inlet and blade passages decreased as the increase in flow rate within the passage led to higher radial velocities of the fluid medium. The high-speed fluid was able to drive out the low-speed fluid, thereby improving the flow conditions.
Combining Figure 19 and Figure 20, at 5.3 s, a distinct high-turbulent kinetic energy area appeared at the end of the inlet section due to vortex-induced flow disturbances. After 5.8 s, a significant gradient in turbulent kinetic energy distribution was observed on the outer side of the inducer, which resulted from the fluid entering the high-speed region of the inducer from the relatively lower-speed inlet section. At all three time points, a noticeable gradient in turbulent kinetic energy was present at the junction between the diffuser and the impeller with a disordered vortex distribution and high vortex velocity. This was likely due to the unstable flow state at the interface between the stationary and rotating components, leading to widespread secondary flow. Additionally, by 7.2 s, distinct turbulent dissipation areas were visible within the pipeline, with the vortex distribution showing vortex separation phenomena with rotational components.
During the start-up process of the LNG pump, the evolution of the internal flow field affected the pipeline pressure. At 5.3 s, the uneven work performed by the impeller on the fluid and the generation of local vortices increased energy dissipation, disrupting stable fluid flow and causing violent pressure waveform oscillations within the pipeline. At 5.8 s, the fluid began to accelerate, but the flow remained unstable, resulting in low-frequency fluctuations with small amplitudes and a continuously declining baseline in the pipeline pressure waveform. By 7.2 s, the fluid had essentially reached a stable flow state, with the energy distribution and flow direction of the fluid within the pump becoming more uniform. However, the local instabilities within the pipeline due to vortices may have still caused the pressure pulsations to fluctuate.

4. Conclusions

A three-dimensional computational model of the LNG pump and pipeline system was developed, incorporating the weak compressibility of the fluid. The simulation was divided into three stages based on the valve opening and flow conditions. The boundary conditions, including the valve opening schedules and flow rates, were derived from a one-dimensional model using FLOWMASTER software. This study innovatively proposed the use of a compressible fluid as the medium. Under pump start-up conditions, the research on the flow field and pressure pulsation can more closely reflect the actual situation and could provide certain references for relevant future engineering projects. Meanwhile, the propagation of pressure waves can also help for the structural design and material selection of pipelines. According to the analysis, the following conclusions were drawn:
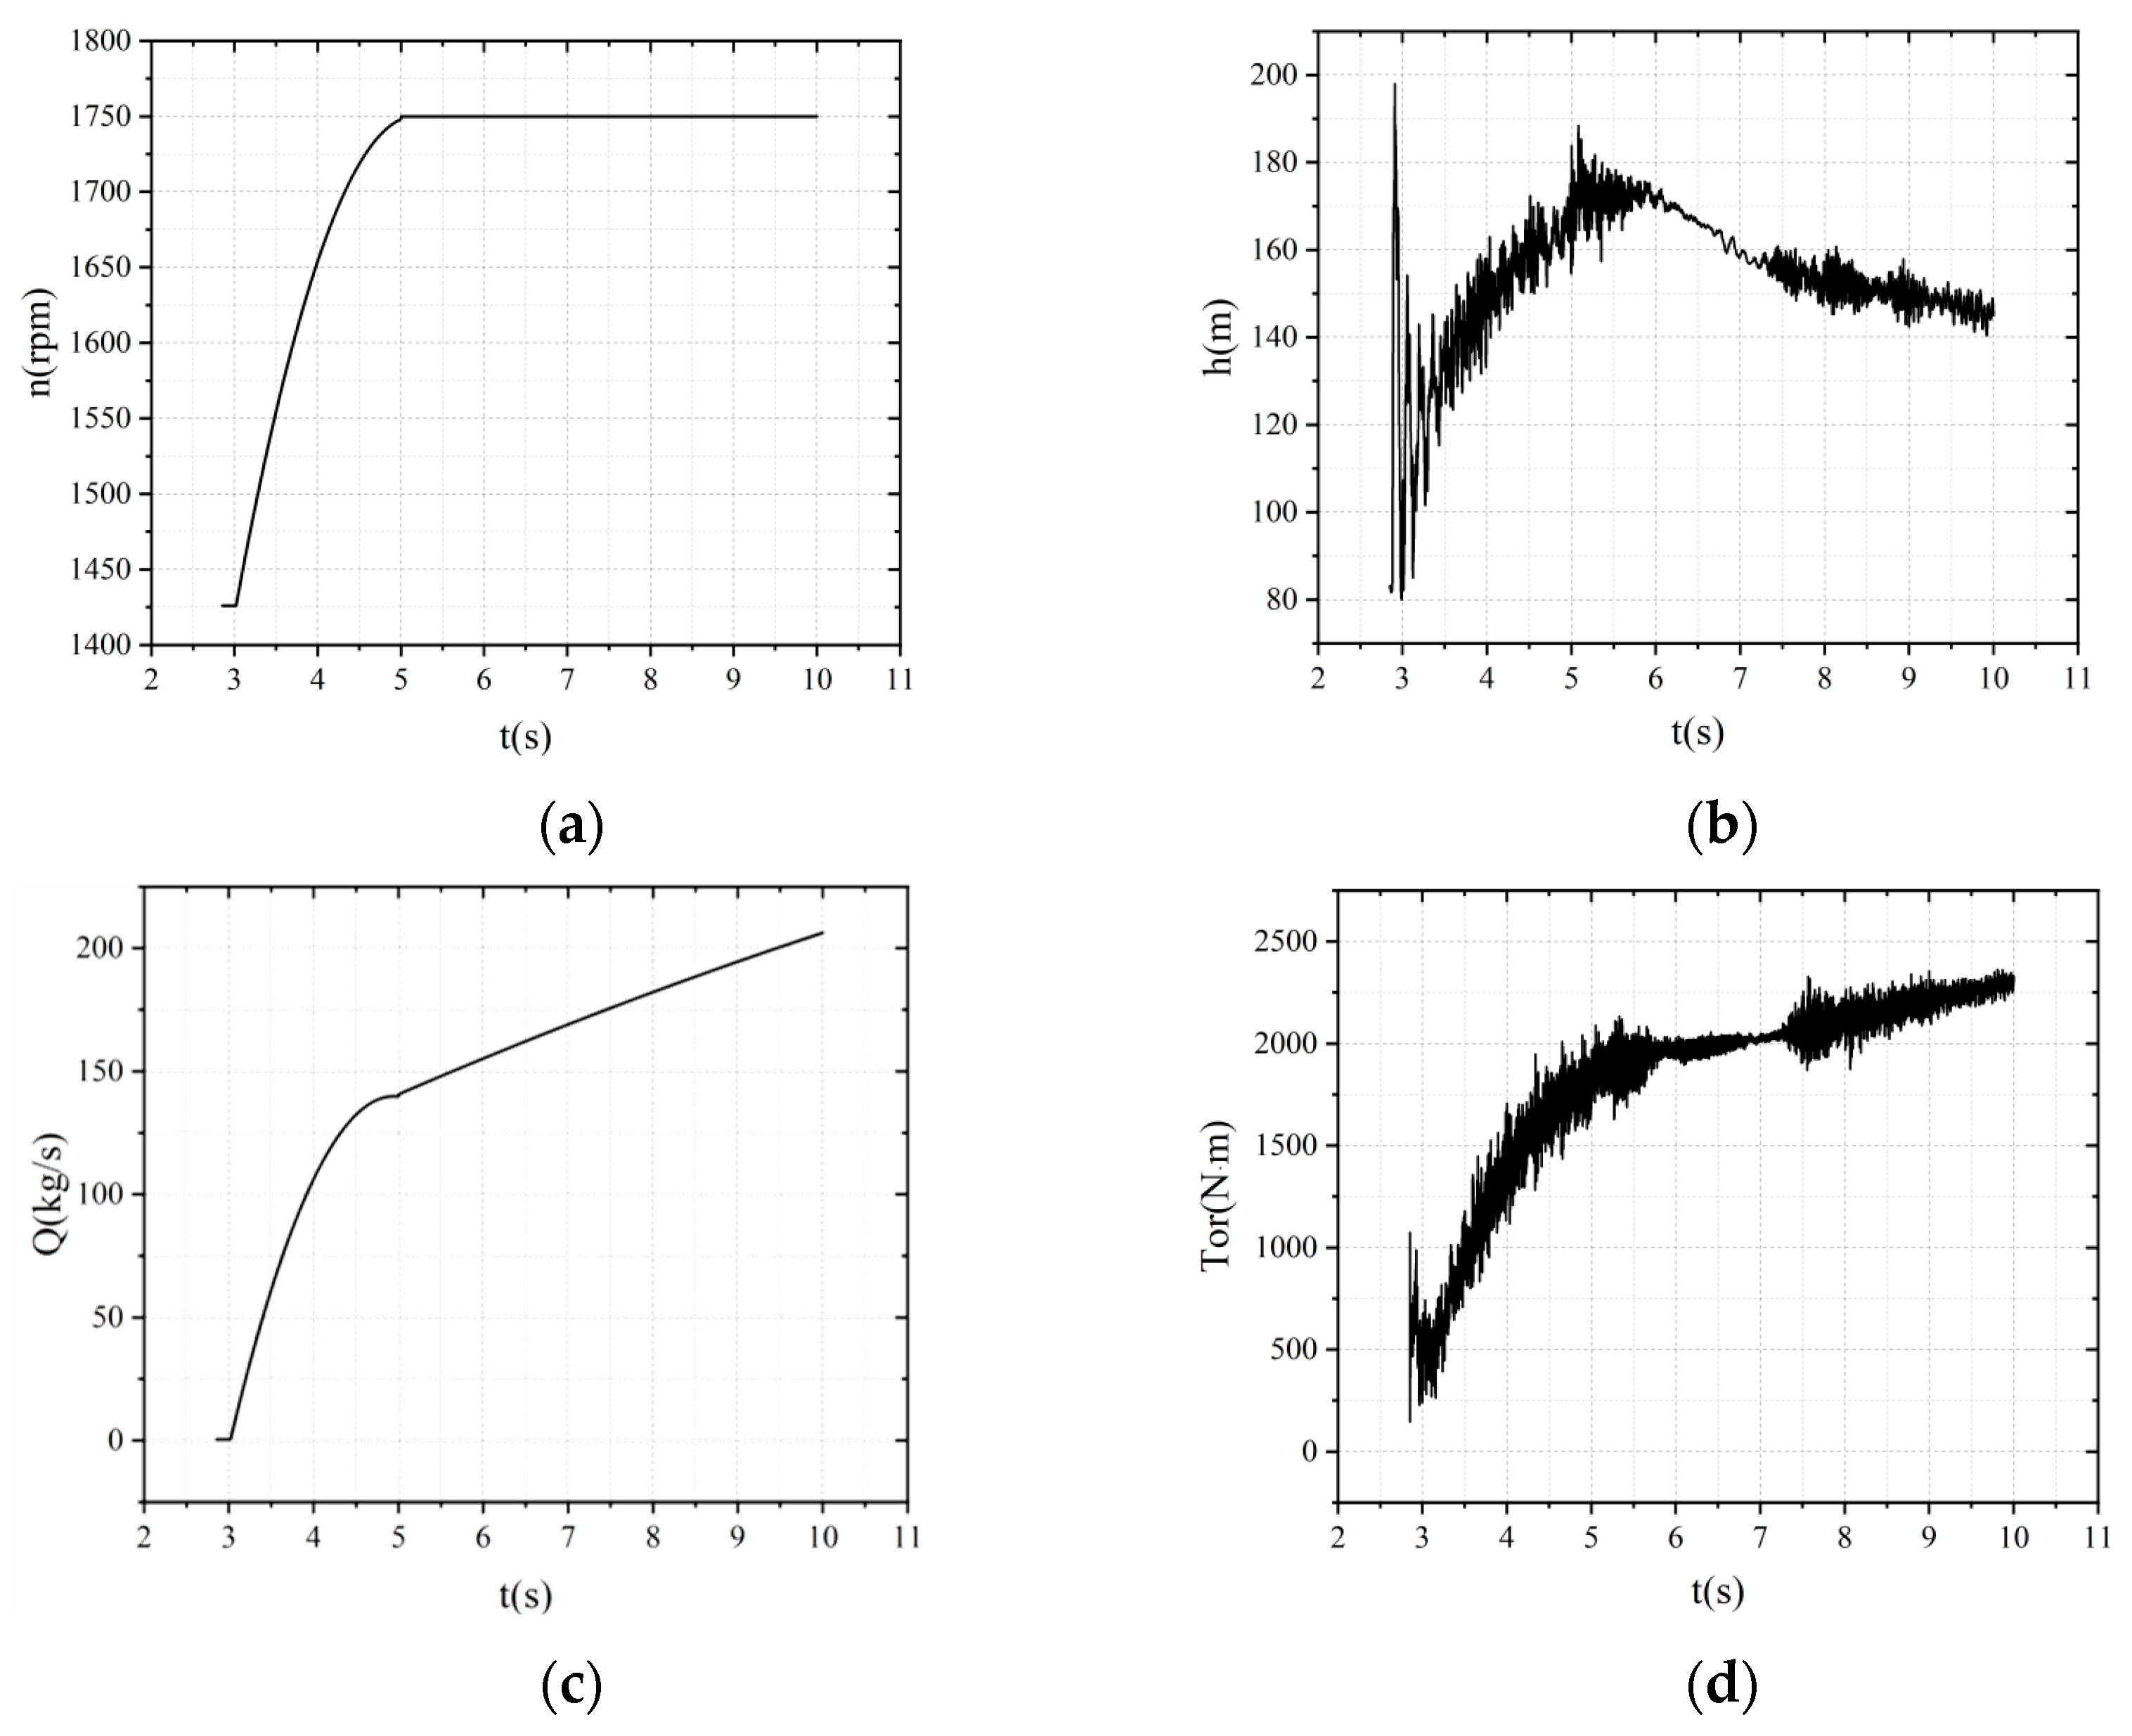
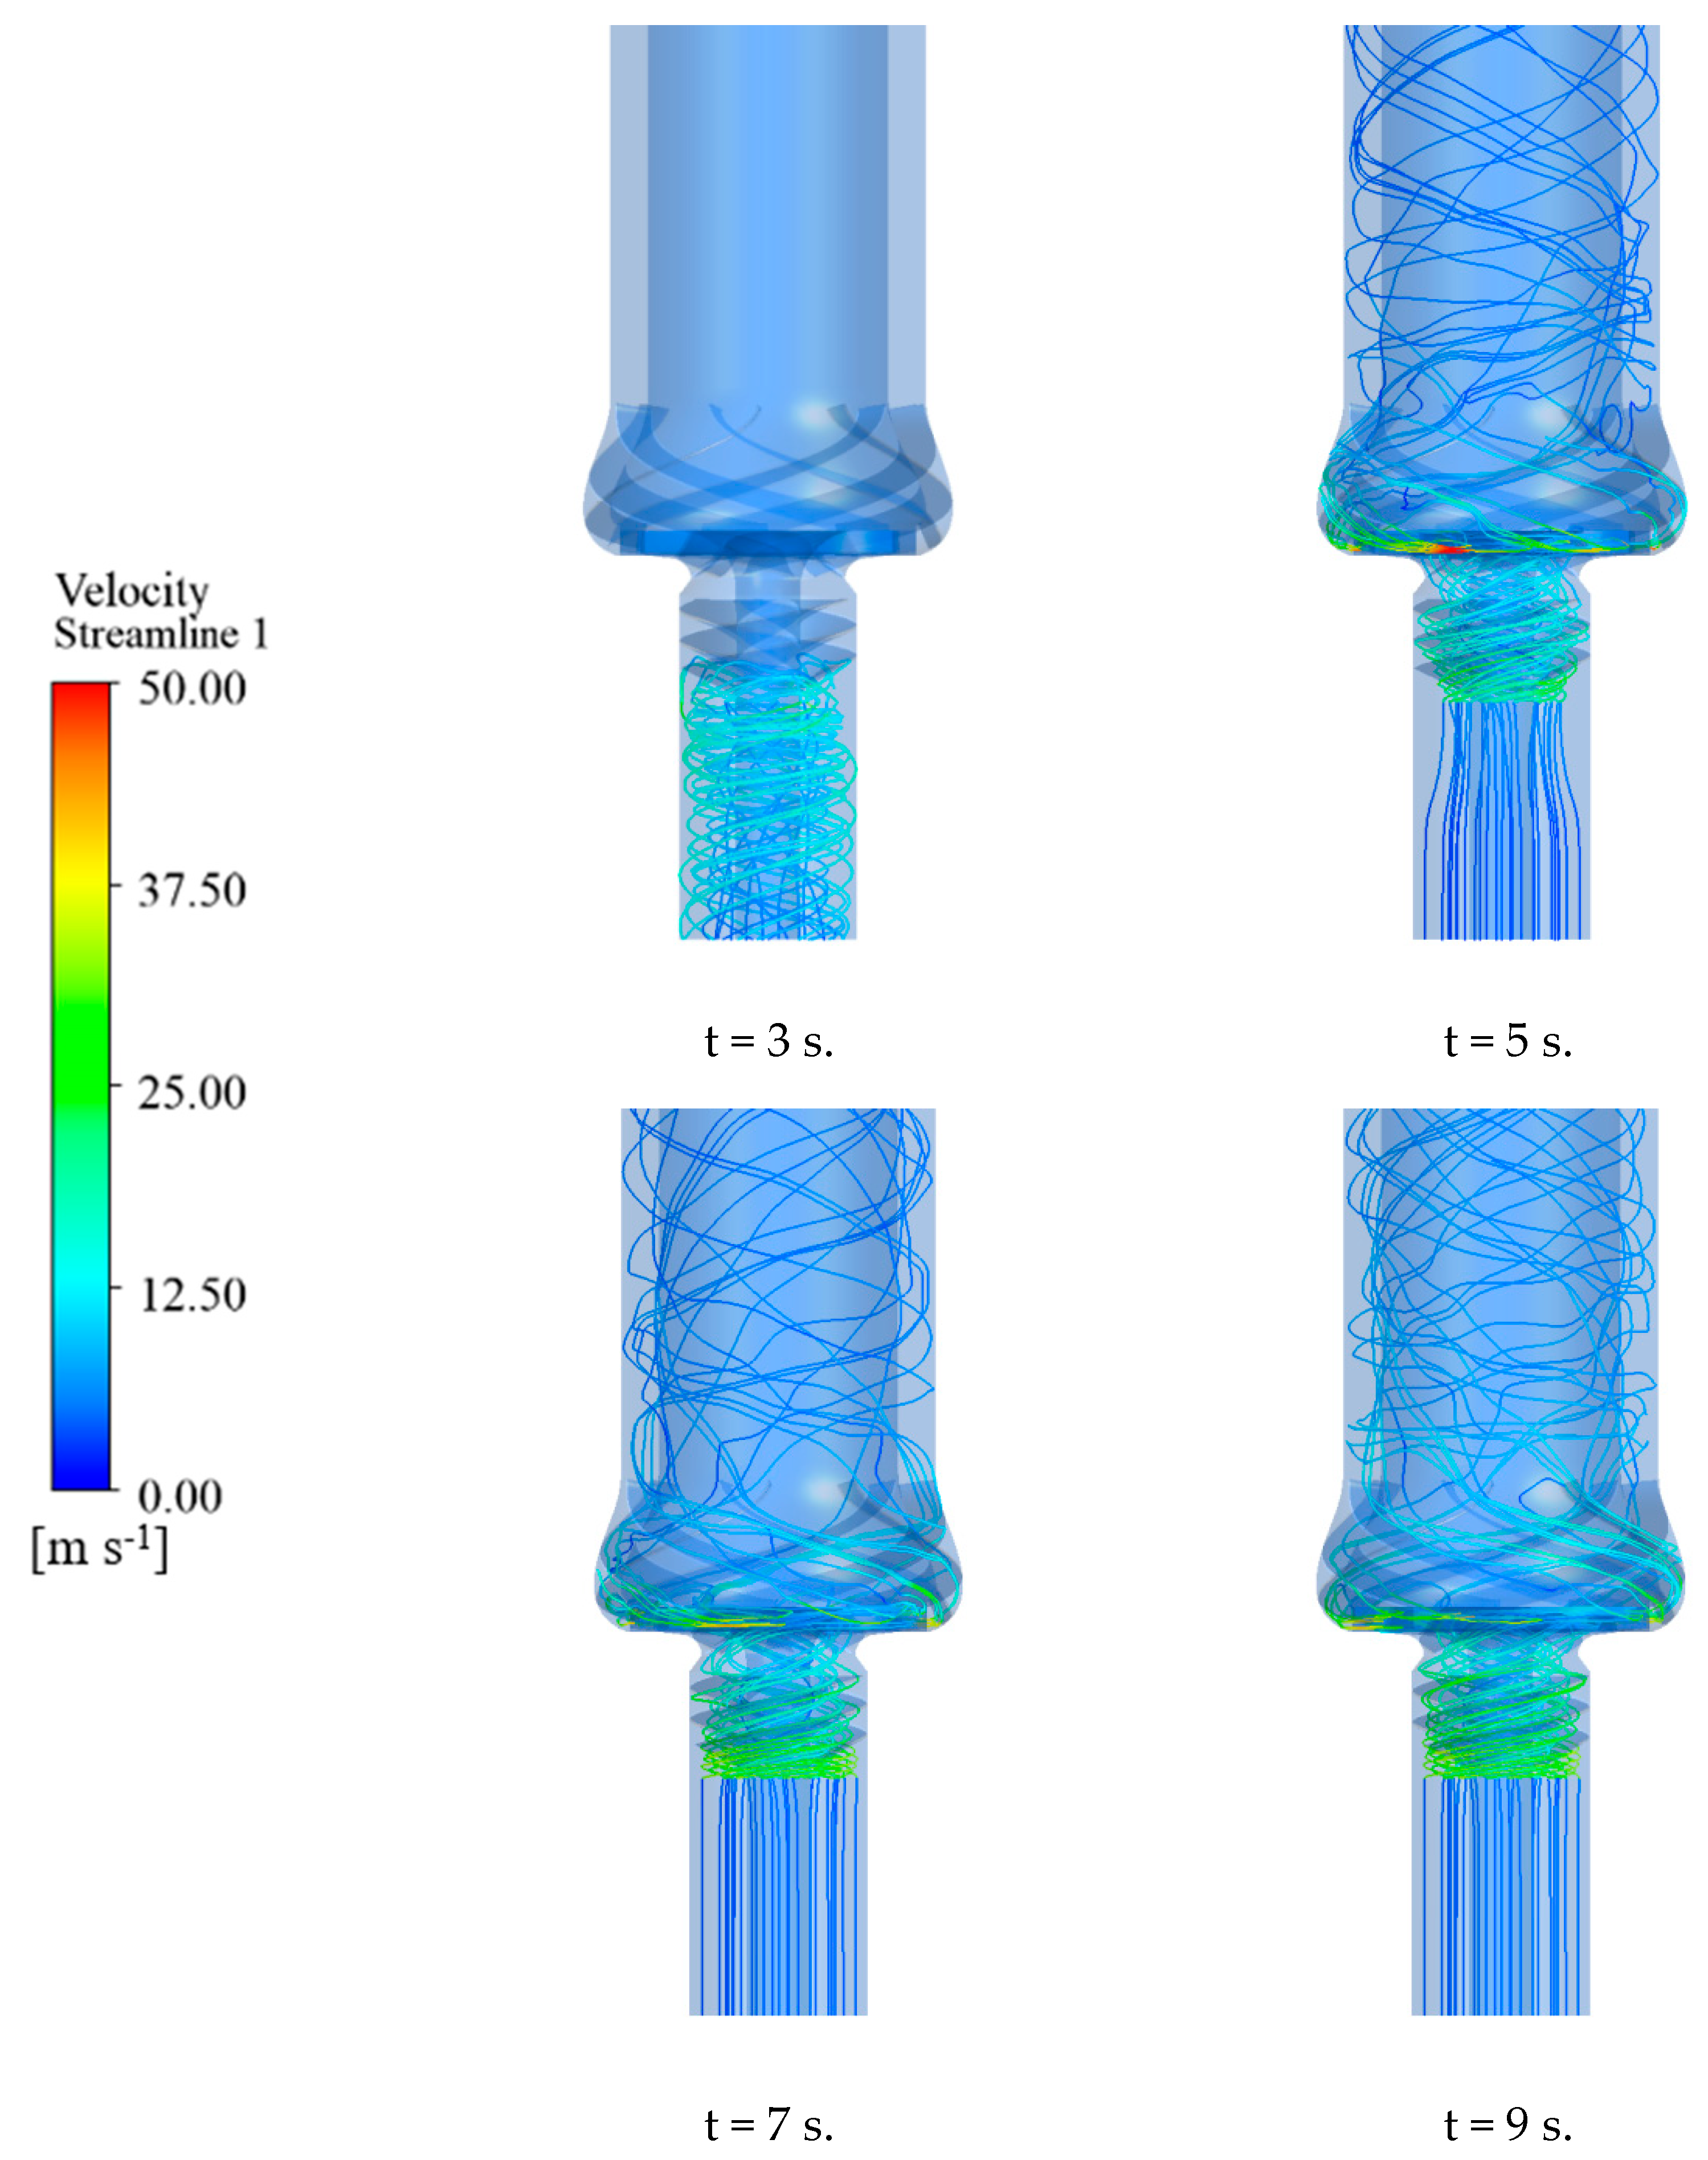
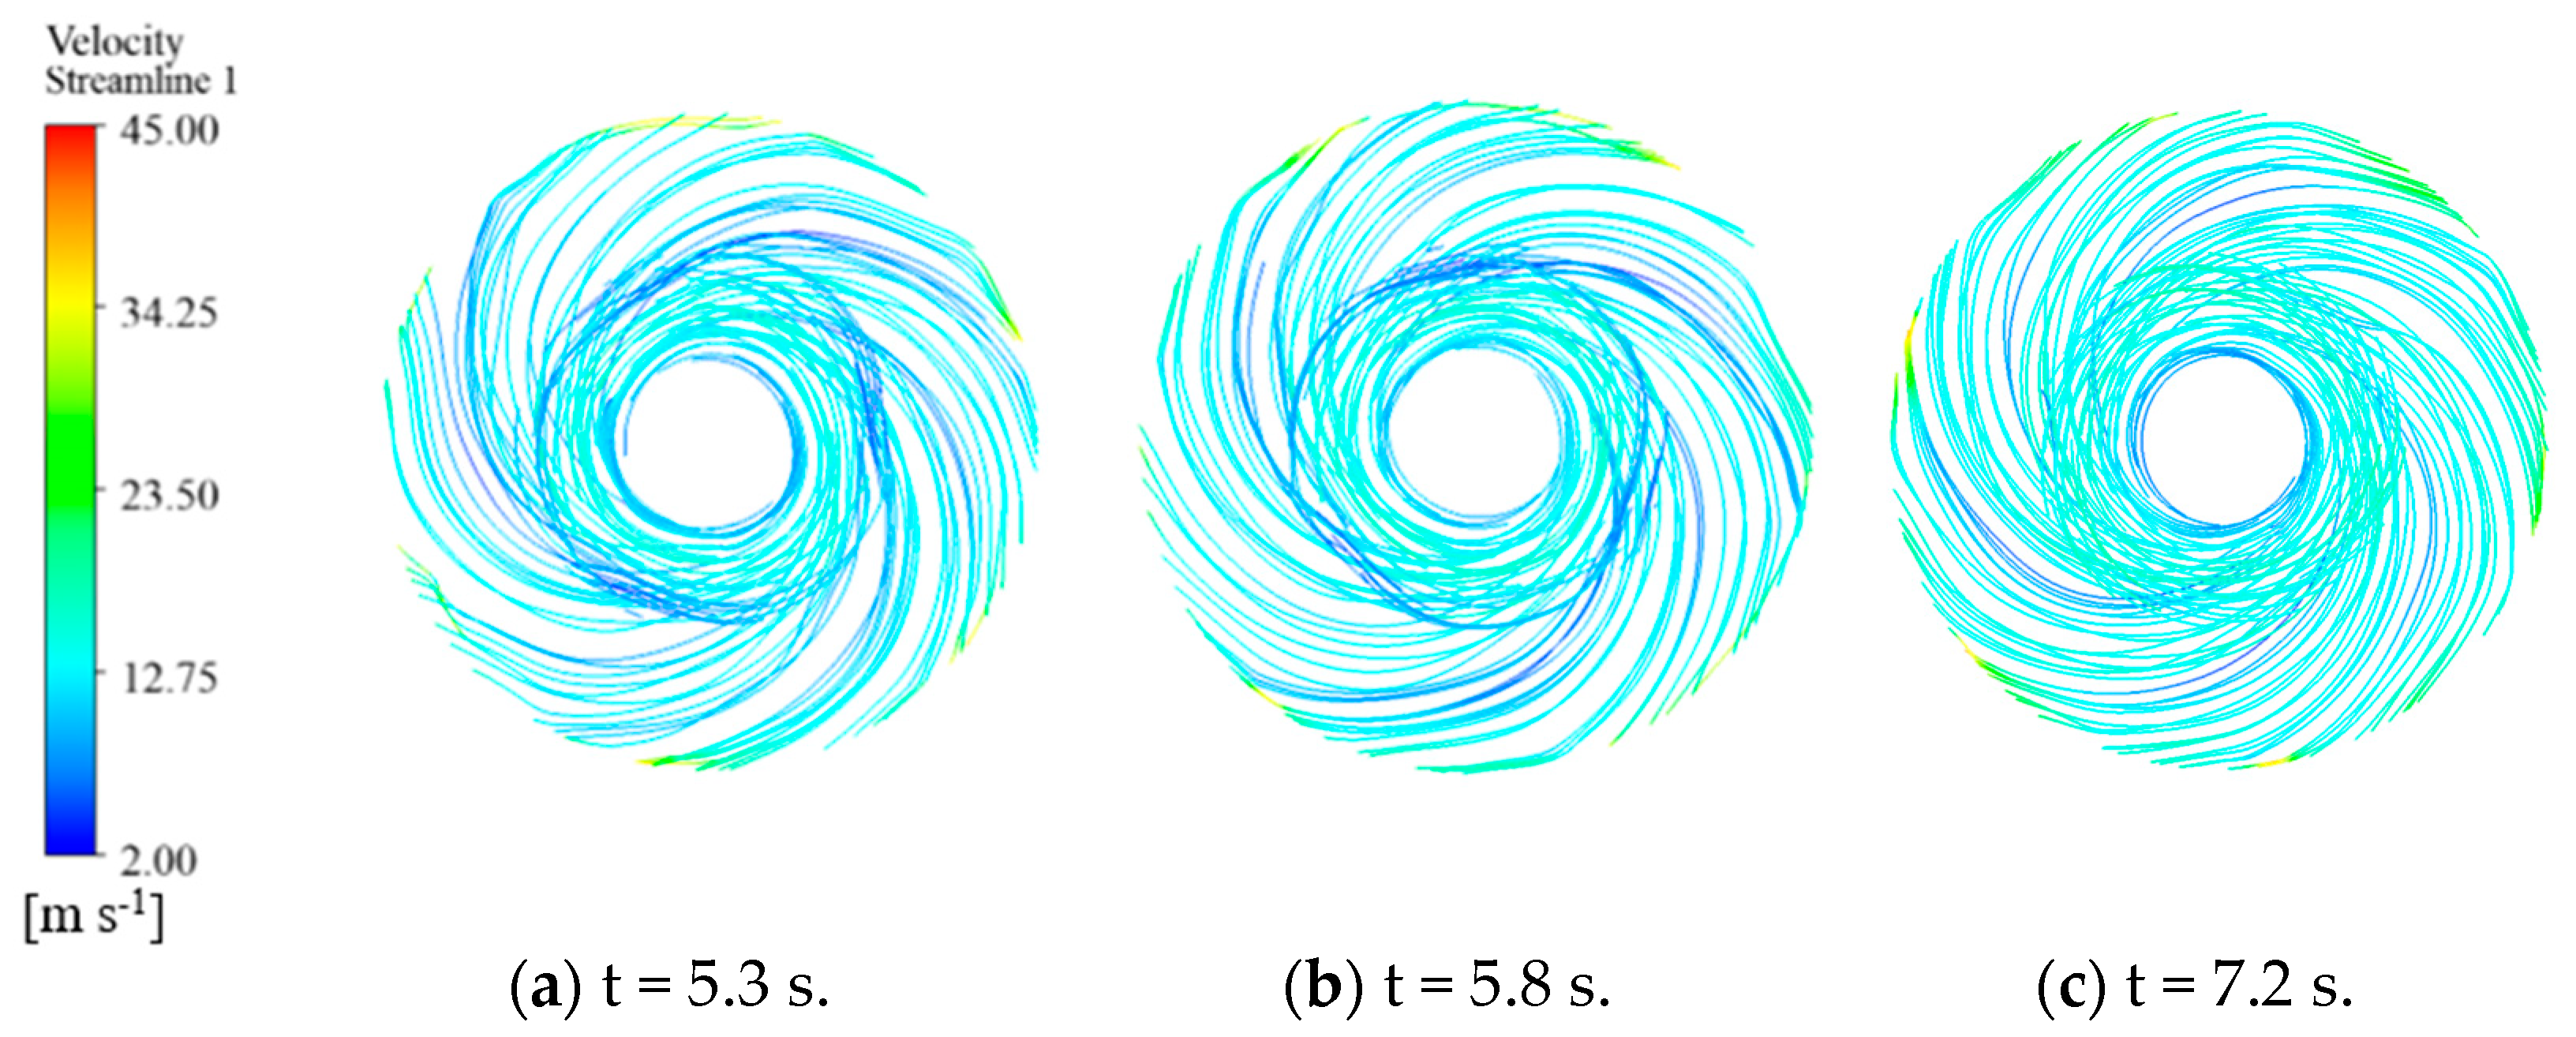
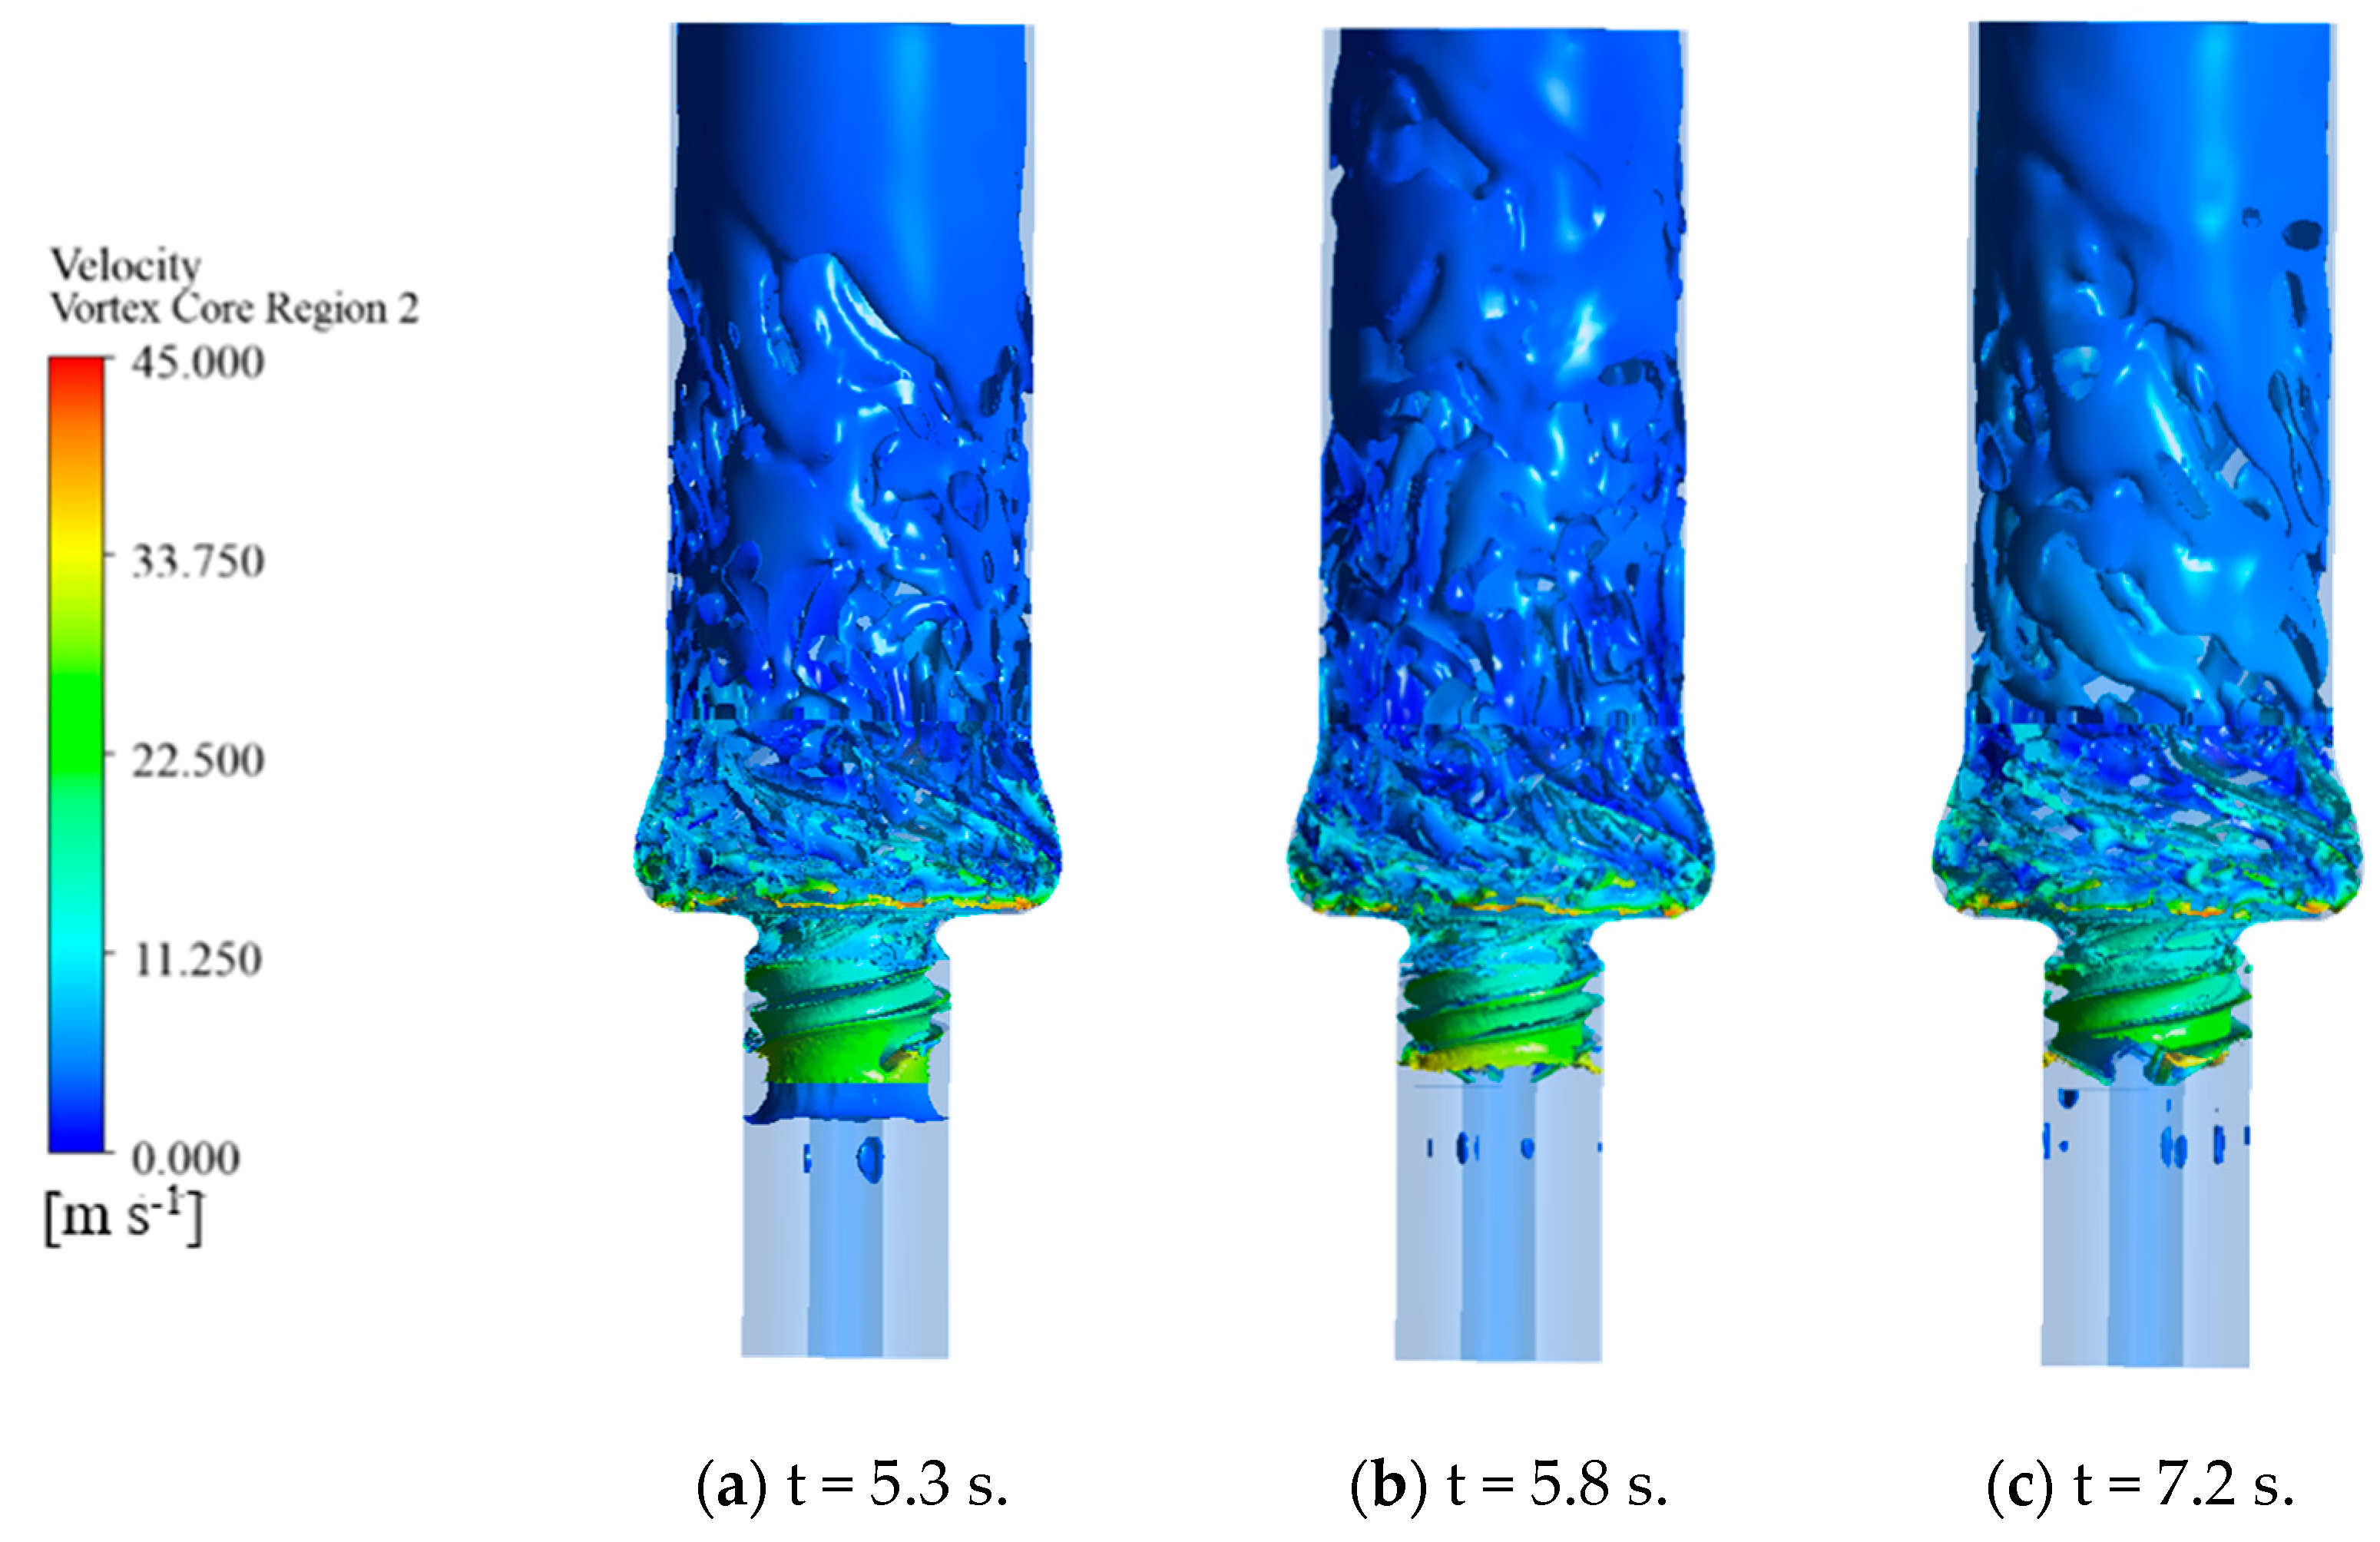
  • During the start-up phase, significant fluctuations in head and torque were observed, particularly in the initial stages. The mass flow rate increased rapidly in the second stage and stabilized in the third stage. The internal flow patterns within the pump were visualized through streamlines and pressure contours. Complex flow structures, including vortices and recirculation zones, were identified during the early stages of start-up, which gradually stabilized as the flow rate and speed increased.
  • Pressure pulsations within the pipeline were monitored at various locations. The pressure pulsation coefficients were found to vary significantly along the pipeline, with higher values near the pump outlet and lower values in the downstream sections. The pressure attenuation characteristics were analyzed in both time and frequency domains. The pressure pulsation coefficients in the straight pipe section (gd9–gd16) increased toward the pipeline outlet.
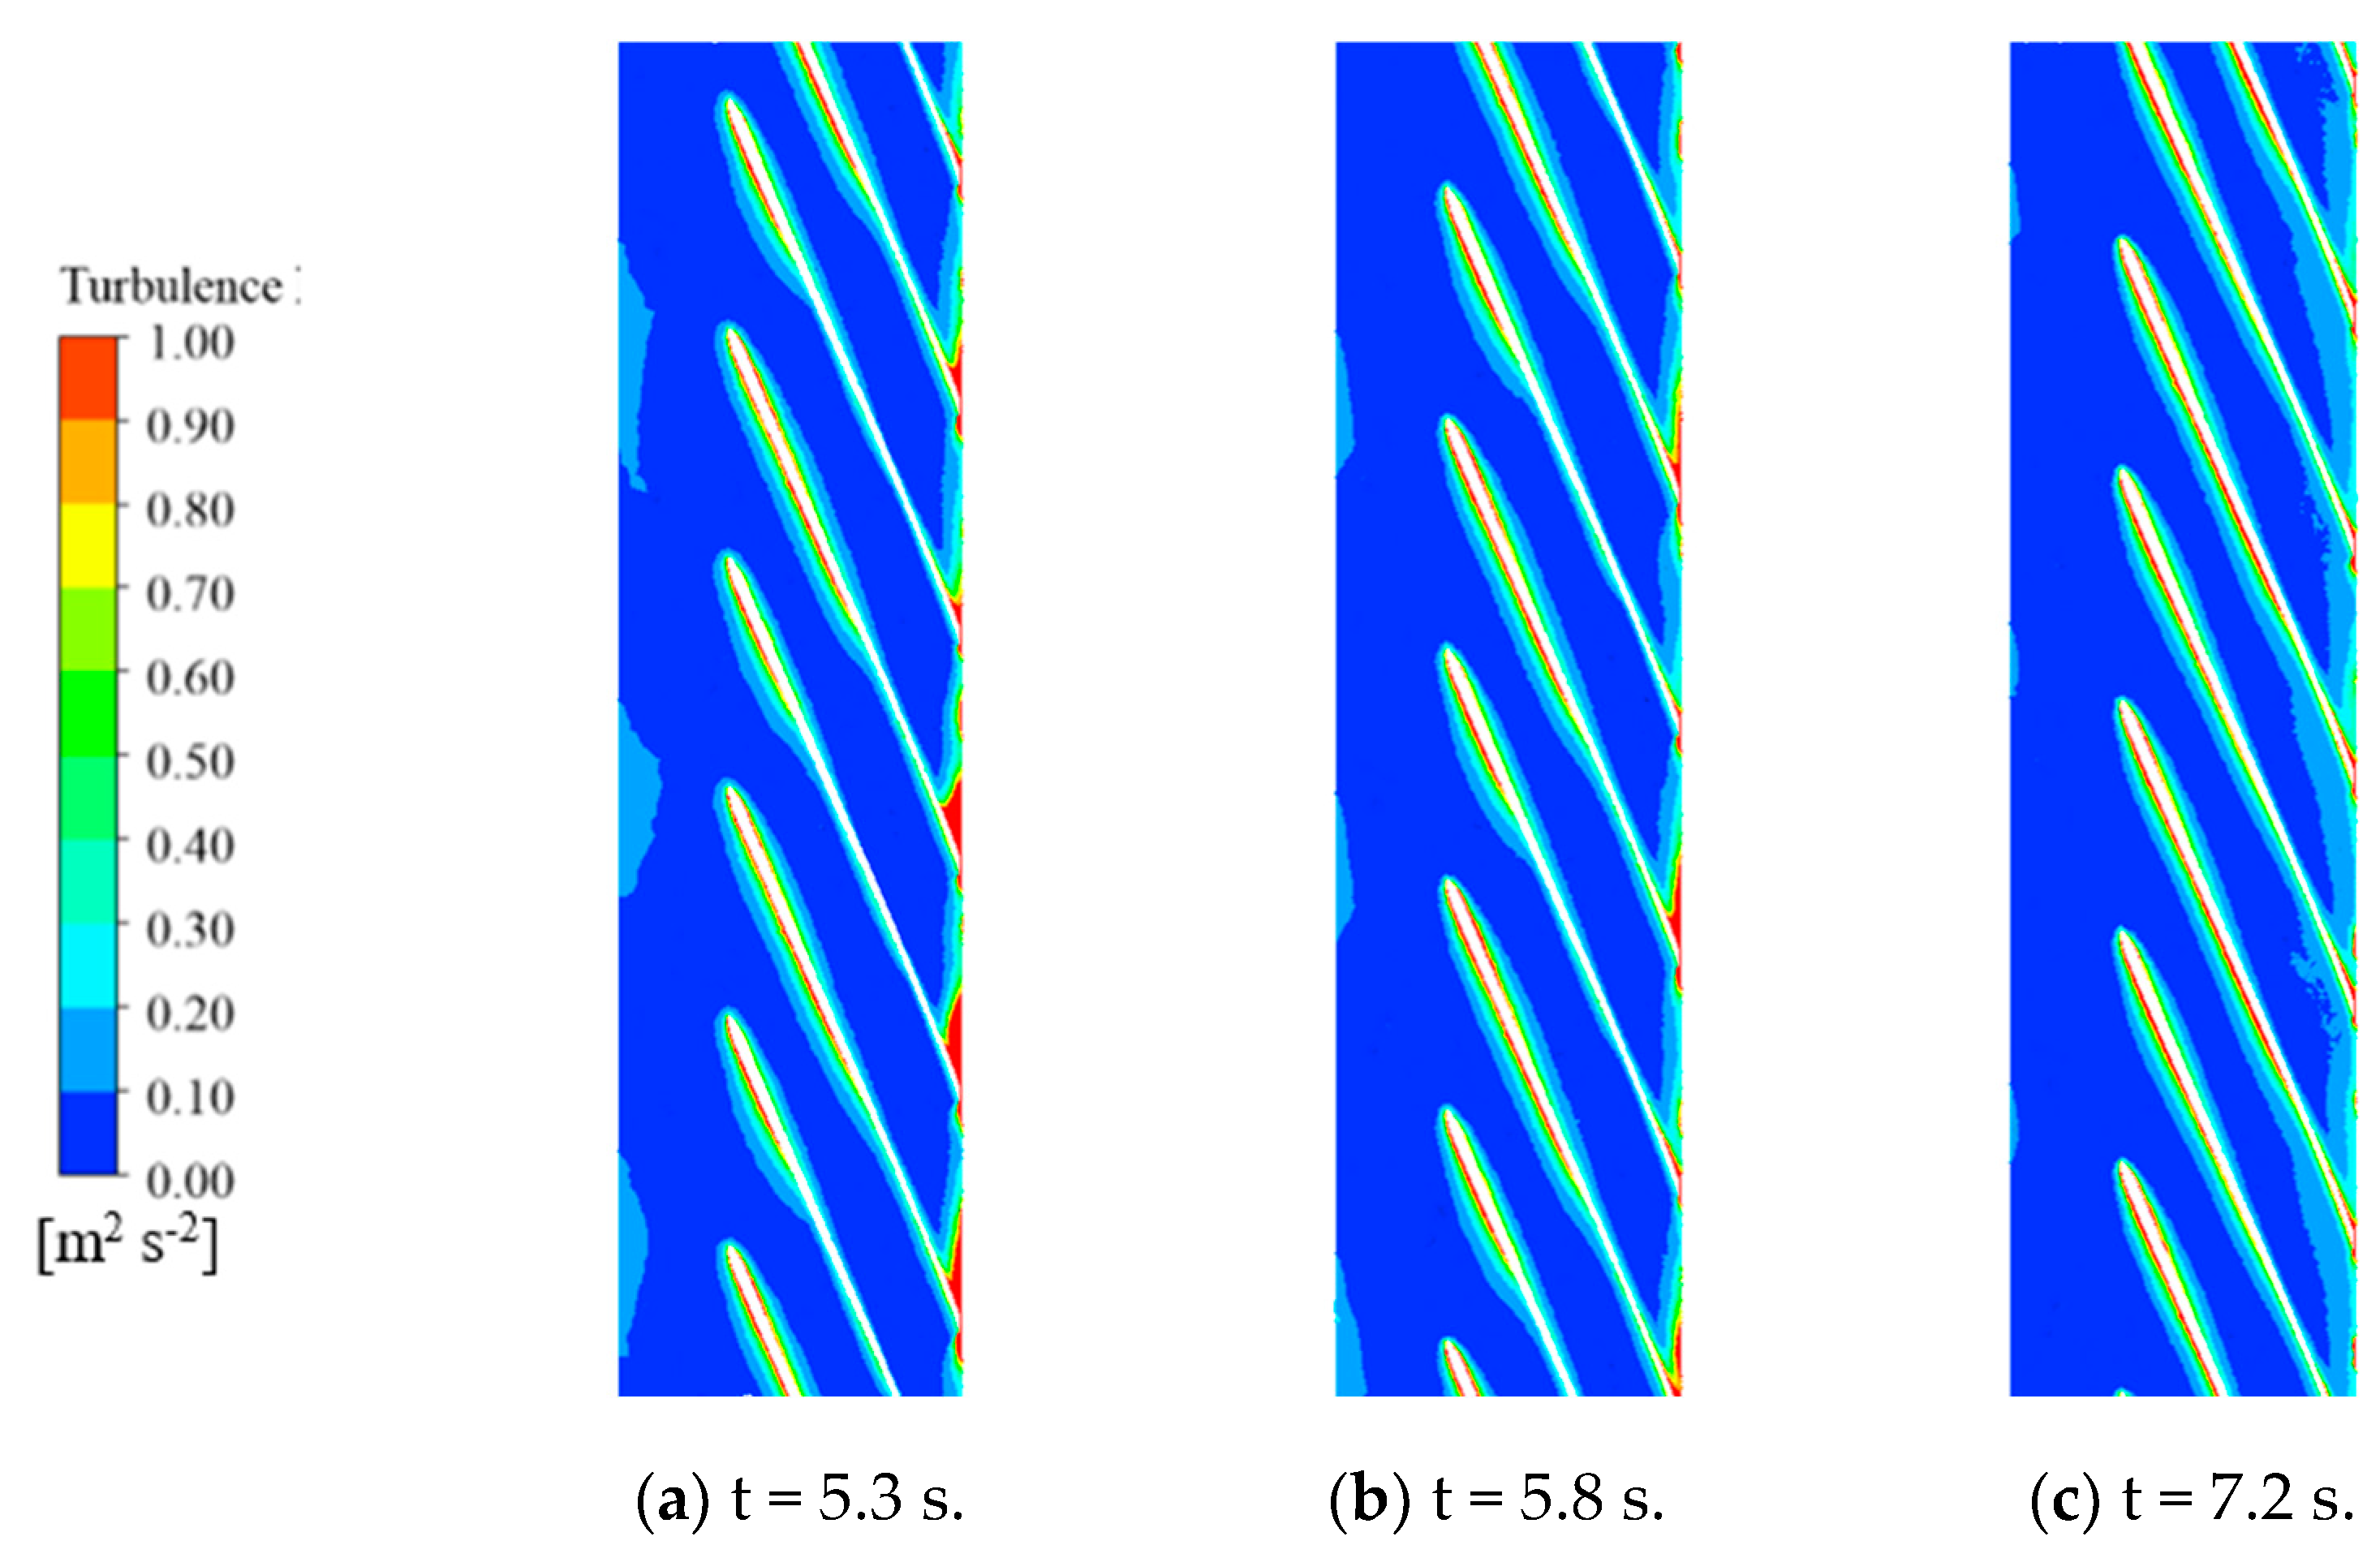
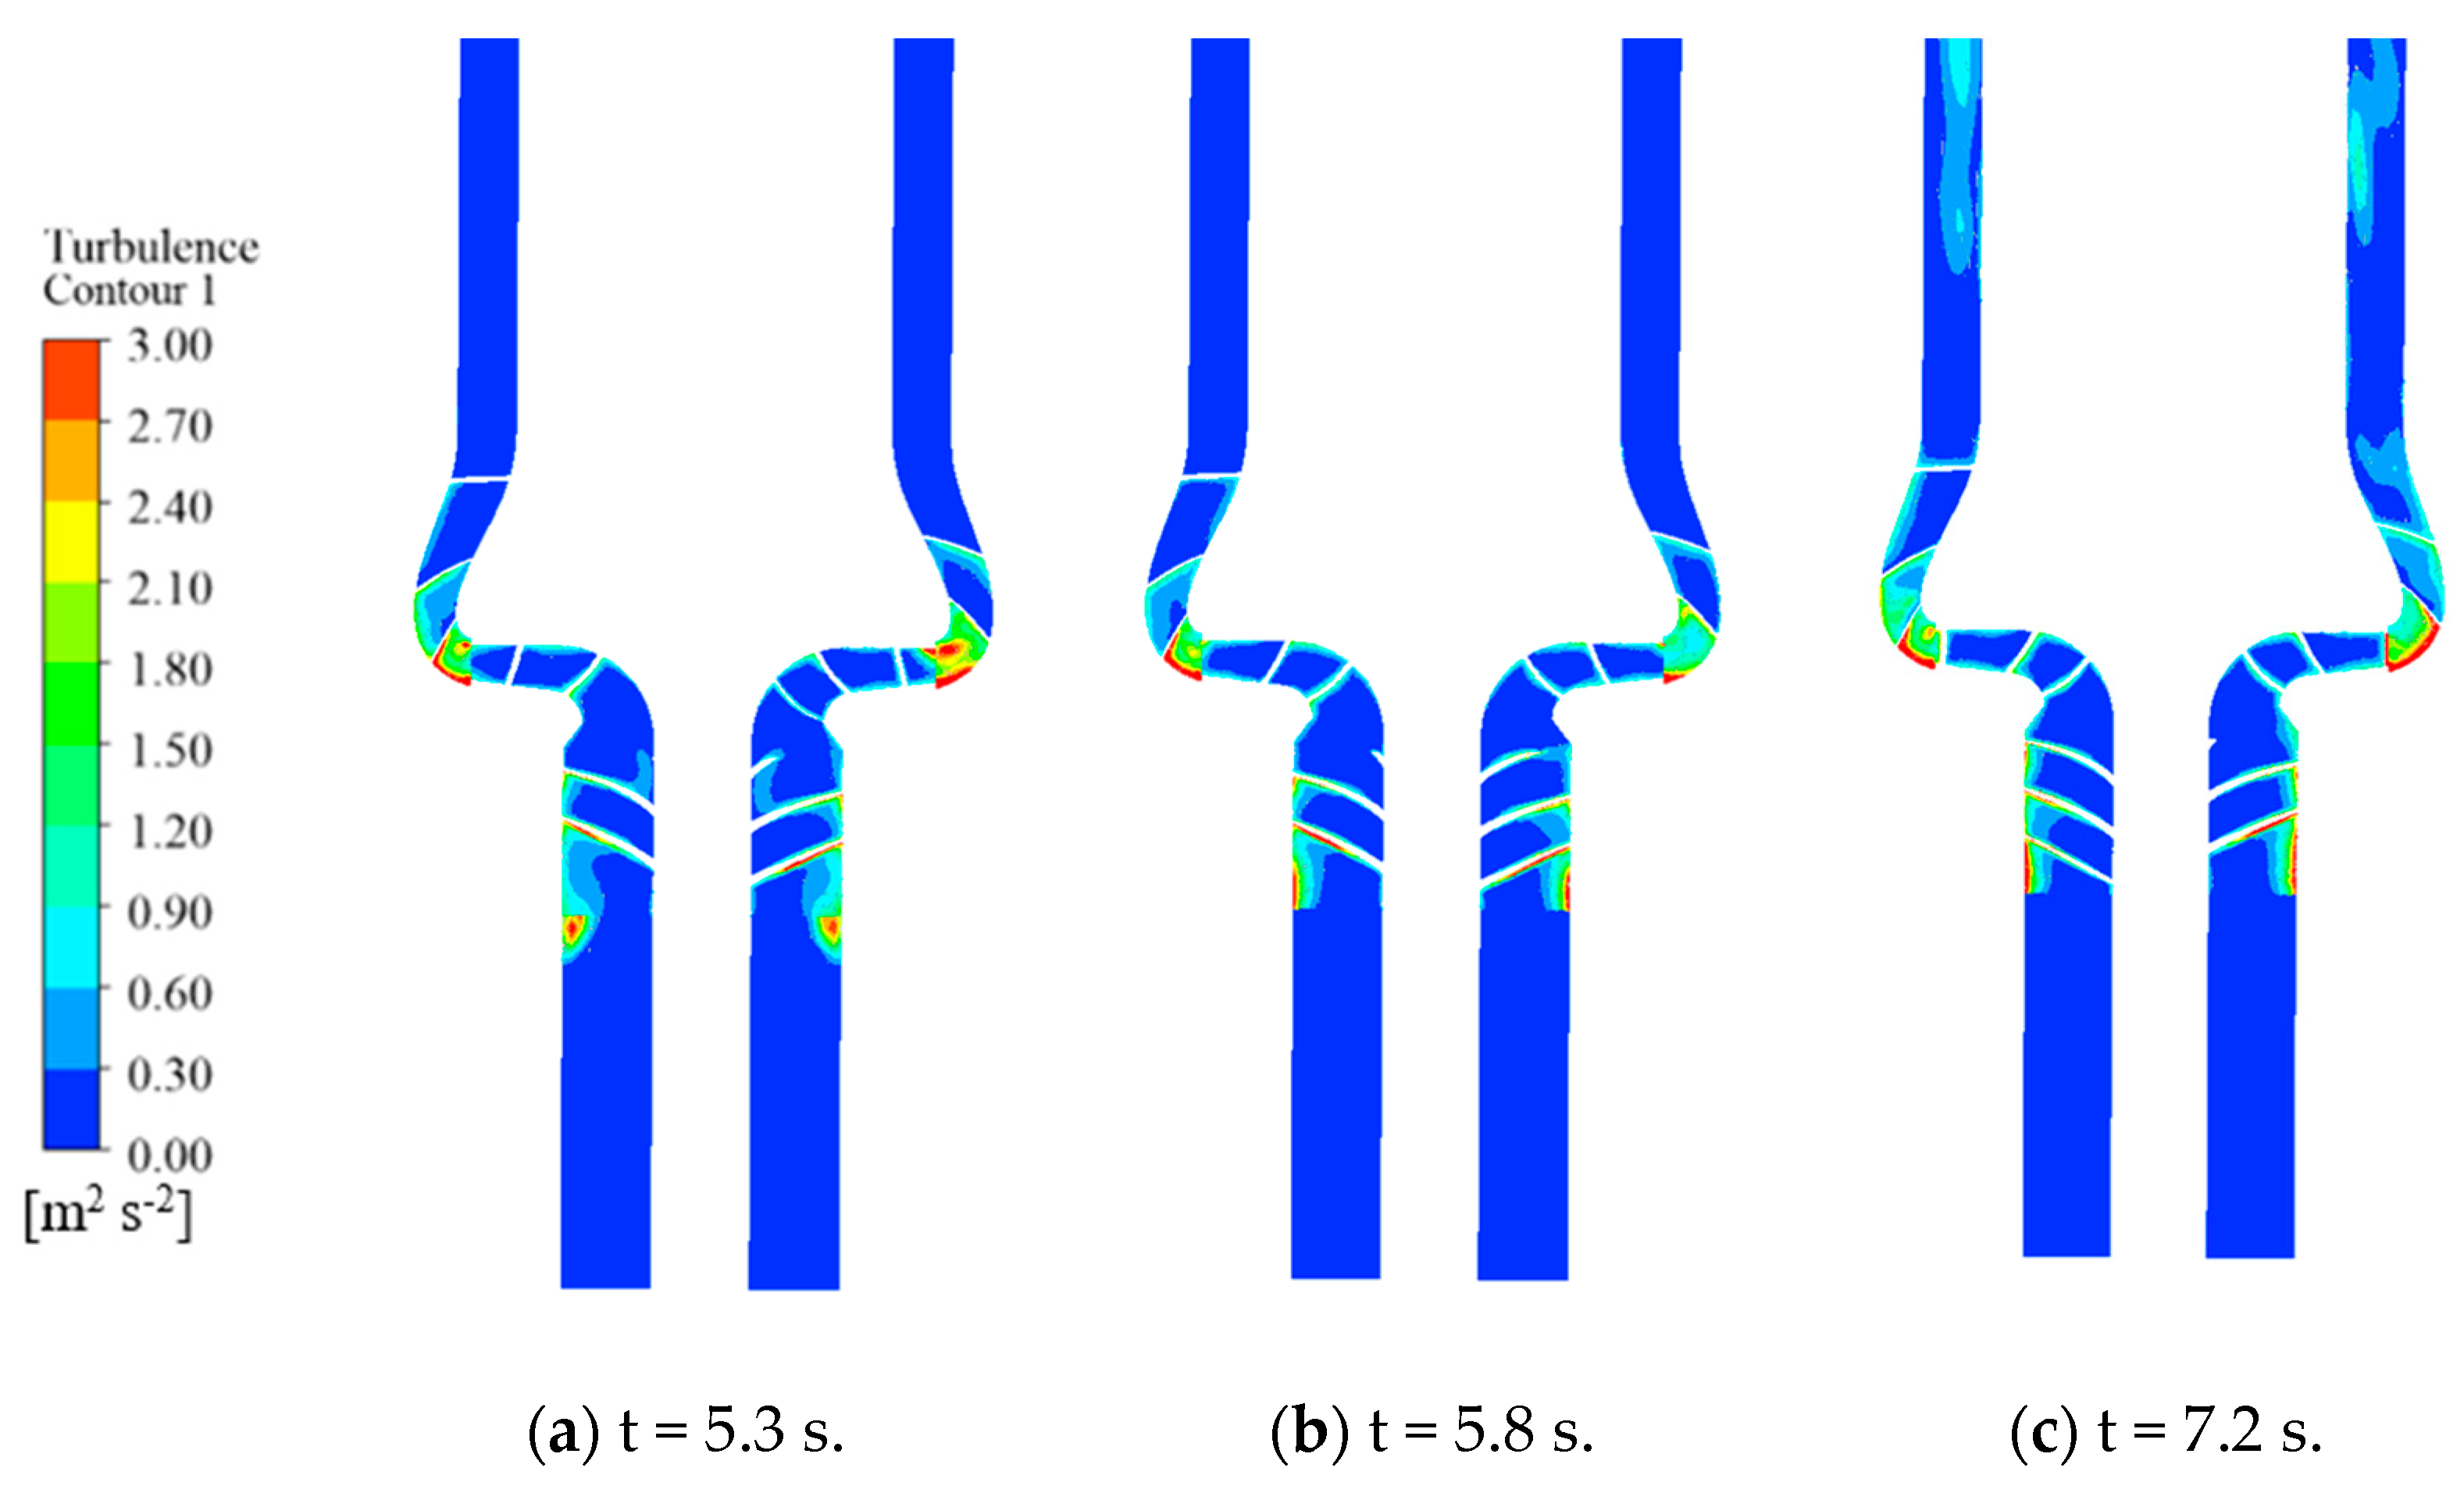
  • The internal flow field of the LNG pump at three critical time points was examined to understand its impact on pipeline pressure fluctuations. High turbulent kinetic energy regions were identified in the inducer and impeller, which correlated with pressure pulsations in the pipeline. This study revealed that the initial transient flow conditions within the pump, which are characterized by high turbulence and flow separation, significantly influenced the pressure pulsations in the pipeline. As the flow stabilized, the pressure pulsations in the pipeline also decreased.

Author Contributions

Conceptualization, Y.L. and M.M.; methodology, Y.L.; software, Y.Z.; validation, Y.L. and Z.W.; formal analysis, Y.Z.; investigation, W.S.; resources, Z.W.; data curation, Y.Z.; writing—original draft preparation, M.M.; writing—review and editing, M.M. and W.S.; visualization, Y.L.; supervision, W.S.; project administration, Z.W.; funding acquisition, Z.W. All authors have read and agreed to the published version of the manuscript.

Funding

This study was supported by the Joint Open Research Fund Program of State 381; the Key Laboratory of Hydroscience and Engineering and Tsinghua-Ningxia Yinchuan Joint 382; and the Institute of Internet of Waters on Digital Water Governance (sklhse-2024-Iow07).

Data Availability Statement

The data presented in this study are available on request from the corresponding author.

Conflicts of Interest

The authors declare no conflicts of interest.

References

  1. Long, Y.; Wu, Z.G.; Zhang, M.Y.; Xu, Y. Research on the transient flow and vortex structure evolution mechanism of reactor coolant pump under non-uniform inflow. Ann. Nucl. Energy 2025, 217, 111346. [Google Scholar]
  2. Liu, M.; Tan, L.; Zhao, X.C.; Ma, C.; Gou, J.L. Theoretical model on transient performance of a centrifugal pump under start-up conditions in pumped-storage system. Energy 2024, 299, 131452. [Google Scholar] [CrossRef]
  3. Chai, B.D.; Yan, J.H.; Wang, X.H. Force characteristics of centrifugal pump as turbine during start-up process under gas-liquid two-phase conditions. Actuators 2022, 11, 370. [Google Scholar] [CrossRef]
  4. Farhadi, K.; Bousbia-Salah, A.; D’Auria, F. A model for the analysis of pump start-up transients in Tehran Research Reactor. Prog. Nucl. Energy 2007, 49, 499–510. [Google Scholar] [CrossRef]
  5. Fu, S.F.; Zheng, Y.; Kan, K.; Chen, H.X.; Han, X.X.; Liang, X.L.; Liu, H.W.; Tian, X.Q. Numerical simulation and experimental study of transient characteristics in an axial flow pump during start-up. Renew. Energy 2020, 146, 1879–1887. [Google Scholar] [CrossRef]
  6. Elaoud, S.; Hadj-Taïeb, E. Influence of pump starting times on transient flows in pipes. Nucl. Eng. Des. 2011, 241, 3624–3631. [Google Scholar] [CrossRef]
  7. Kittredge, C.P. Hydraulic transients in centrifugal pump systems. J. Fluids Eng. 1956, 78, 1307–1320. [Google Scholar] [CrossRef]
  8. Cao, J.W.; Luo, Y.Y.; Shi, Y.S.; Liu, X.; Xu, D.X.; Wang, Y.H.; Zhai, L.M.; Wang, Z.W. A review of hydro-turbine unit rotor system dynamic behavior: Multi-field coupling of a three-dimensional model. Phys. Fluids 2024, 36, 121304. [Google Scholar] [CrossRef]
  9. Zhou, D.B.; Zhang, N.; Zheng, F.K.; Gad, M.; Gao, B. Experimental investigation on the effect of the rotor-stator matching mode on velocity pulsation in the centrifugal pump with a vaned diffuser. Nucl. Eng. Technol. 2025, 57, 103255. [Google Scholar] [CrossRef]
  10. Li, D.L.; Zhang, N.; Jiang, J.X.; Gao, B.; Akurugo Alubokin, A.; Zhou, W.J.; Shi, J.L. Numerical investigation on the unsteady vortical structure and pressure pulsations of a centrifugal pump with the vaned diffuser. Int. J. Heat Fluid Flow 2022, 98, 109050. [Google Scholar] [CrossRef]
  11. Wang, W.J.; Liu, S.; Pei, J.; Sun, J.; Sun, Q. Efficiency improvement and pressure pulsation reduction of volute centrifugal pump through diffuser design optimization. J. Energy Storage 2024, 102, 114184. [Google Scholar] [CrossRef]
  12. Yan, J.; Koutnik, J.; Seidel, U.; Hübner, B. Compressible simulation of rotor-stator interaction in pump-turbines. Int. J. Fluid Mach. Syst. 2010, 3, 315–323. [Google Scholar] [CrossRef]
  13. Jiang, Y.; Li, H.; Hua, L.; Zhang, D.M. Three-dimensional flow breakup characteristics of a circular jet with different nozzle geometries. Biosyst. Eng. 2020, 193, 216–231. [Google Scholar] [CrossRef]
  14. Xu, L.Z.; Hansen, A.C.; Li, Y.M.; Liang, Z.W.; Yu, L.J. Numerical and experimental analysis of airflow in a multi-duct cleaning system for a rice combine harvester. Trans. ASABE 2016, 59, 1101–1110. [Google Scholar]
  15. Long, Y.; Xu, Y.; Guo, X.A.; Zhang, M.Y. Analysis of internal flow excitation characteristics of reactor coolant pump based on POD. Ann. Nucl. Energy 2025, 216, 111286. [Google Scholar]
  16. Lu, Y.G.; Xin, L.C.; Hu, N.M.; Zhu, Z.X.; Xia, W.X. Influences of floating ice on the water entry process of slender body on the cavity evolution and hydrodynamic characteristic. Phys. Fluids 2025, 37, 042103. [Google Scholar] [CrossRef]
  17. Chen, C.; Zhao, Y.Y.; Liu, J.P.; Zhao, Y.X.; Hussain, Z.; Xie, R.J. Numerical simulation of the flow field stabilization of a pressure-regulating device. Agriculture 2024, 14, 1873. [Google Scholar] [CrossRef]
Figure 1. Fluid domain of the LNG pump and pipeline system.
Energies 18 02911 g001
Figure 2. Control flowchart for the start-up transition process.
Energies 18 02911 g002
Figure 3. The rotational speed variation with time during the start-up process.
Energies 18 02911 g003
Figure 4. One-dimensional computational platform for the start-up process.
Energies 18 02911 g004
Figure 5. Flow rate variation with time during the start-up process.
Energies 18 02911 g005
Figure 6. Meshing of the LNG pump.
Energies 18 02911 g006
Figure 7. (a) The curve of the rotational speed with time. (b) The curve of the head with time. (c) The curve of the mass flow rate with time. (d) The curve of the torque with time.
Energies 18 02911 g007
Figure 8. Evolution of the internal flow in the LNG pump during the start-up stage.
Energies 18 02911 g008
Figure 9. Evolution of the pressure distribution in the LNG pump during the start-up stage.
Energies 18 02911 g009
Figure 10. Layout of the monitoring points in the pipeline during the start-up process.
Energies 18 02911 g010
Figure 11. Evolution of the flow patterns at the tee junction during the start-up stage.
Energies 18 02911 g011
Figure 12. Evolution of the pressure distribution at the tee junction during the start-up stage.
Energies 18 02911 g012
Figure 13. Distribution of the velocity vorticity at the tee junction during the start-up stage.
Energies 18 02911 g013
Figure 14. The time-domain pressure variation within the pipeline during the start-up process.
Energies 18 02911 g014
Figure 15. The frequency-domain pressure variation within the pipeline during the start-up process.
Energies 18 02911 g015
Figure 16. The variation of the pressure pulsation coefficients within the pipeline. (a) The second stage: 0.465 Hz. (b) The third stage: 0.2 Hz. (c) The third stage: 29.2 Hz.
Energies 18 02911 g016
Figure 17. The turbulent kinetic energy distribution in the impeller at different times.
Energies 18 02911 g017
Figure 18. The velocity streamlines in the impeller at different times.
Energies 18 02911 g018
Figure 19. The turbulent kinetic energy contour in the LNG pump at different times.
Energies 18 02911 g019
Figure 20. The velocity vorticity distribution in the LNG pump at different times.
Energies 18 02911 g020
Table 1. Boundary conditions for different stages.
StageValve OpeningFlow Rate Q (kg/s)Rotational Speed n (r/min)
1: 0 s < t < 2.85 s0%0−0.06899 × t2+ 350.5 × t − 0.1542
2: 2.85 s < t < 5 s20%0.1094 × t2 − 0.7775 × t + 1.361−0.06899 × t2+ 350.5 × t − 0.1542
3: 5 s < t < 10 s20%−0.0007175 × t2 + 0.037 × t + 0.11831750
Disclaimer/Publisher’s Note: The statements, opinions and data contained in all publications are solely those of the individual author(s) and contributor(s) and not of MDPI and/or the editor(s). MDPI and/or the editor(s) disclaim responsibility for any injury to people or property resulting from any ideas, methods, instructions or products referred to in the content.

