Article

Robust Load Frequency Control in Cyber-Vulnerable Smart Grids with Renewable Integration

by
Rambaboo Singh
1,*,
Ramesh Kumar
1,
Utkarsh Raj
2 and
Ravi Shankar
1
1
Department of Electrical Engineering, National Institute of Technology, Patna 800005, India
2
Department of Electrical Engineering, Government Engineering College, Buxar 802103, India
*
Author to whom correspondence should be addressed.
Energies 2025, 18(11), 2899; https://doi.org/10.3390/en18112899
Submission received: 29 April 2025 / Revised: 22 May 2025 / Accepted: 26 May 2025 / Published: 31 May 2025

Abstract

Frequency regulation (FR) constitutes a fundamental aspect of power system stability, particularly in the context of the growing integration of intermittent renewable energy sources (RES) and electric vehicles (EVs). The load frequency control (LFC) mechanism, essential for achieving FR, is increasingly reliant on communication infrastructures that are inherently vulnerable to cyber threats. Cyberattacks targeting these communication links can severely compromise coordination among smart grid components, resulting in erroneous control actions that jeopardize the security and stability of the power system. In light of these concerns, this study proposes a cyber-physical LFC framework incorporating a fuzzy linear active disturbance rejection controller (F-LADRC), wherein the controller parameters are systematically optimized using the quasi-opposition-based reptile search algorithm (QORSA). Furthermore, the proposed approach integrates a comprehensive cyberattack detection and prevention scheme, employing Haar wavelet transforms for anomaly detection and long short-term memory (LSTM) networks for predictive mitigation. The effectiveness of the proposed methodology is validated through simulations conducted on a restructured power system integrating RES and EVs, as well as a modified IEEE 39-bus test system. The simulation outcomes substantiate the capability of the proposed framework to deliver robust and resilient frequency regulation, maintaining system frequency and tie-line power fluctuations within nominal operational thresholds, even under adverse cyberattack scenarios.

1. Introduction

The evolution of the modern power grid into a smart grid framework has been driven largely by the increasing integration of renewable energy sources (RES) and electric vehicles (EVs) [1,2]. These advancements offer significant benefits in terms of sustainability and energy efficiency but also introduce unprecedented challenges in maintaining grid stability. Among the critical tasks in smart grid operations, load frequency control (LFC) plays a central role by ensuring that the balance between power generation and consumption is dynamically preserved, thus maintaining system frequency within acceptable limits [3,4,5]. The integration of EVs, especially through vehicle-to-grid (V2G) technologies, further enhances frequency regulation capabilities by allowing bidirectional power flows that can respond flexibly to grid demands [6]. However, the stochastic nature of renewable generation and the unpredictable load behavior introduced by widespread EV adoption create complex control challenges that demand advanced, adaptive solutions.
Parallel to these operational challenges, the reliance of smart grids on cyber-physical infrastructures has introduced significant cybersecurity vulnerabilities. Communication systems that link sensors, controllers, and control centers are particularly susceptible to cyberattacks such as false data injection (FDI) attacks [7]. FDI attacks corrupt the authenticity of transmitted measurements, leading to incorrect control actions that severely impair the frequency regulation mechanism, threatening the secure and reliable operation of the smart grid [8].
Although numerous strategies have been proposed to detect and mitigate cyberattacks in traditional grid setups—including observer-based methods [9], resilient control schemes [10], and deep learning models [11,12]—most of these efforts focus on isolated attack types and are rarely evaluated under the complex dynamics introduced by RES and EV integration. Notably, the majority of previous studies have concentrated on conventional power systems [13], often overlooking the specific vulnerabilities and dynamic behaviors of smart grids enriched with renewable sources and V2G infrastructure.
To address these gaps, this work presents a novel approach for cyberattack detection and mitigation in smart grids, specifically targeting FDI attacks under realistic networked smart grid (NSG) scenarios. We employ a wavelet transform—long short-term memory (WT-LSTM)-based technique to enhance the detection and prediction of malicious impacts on the area control error (ACE) signal—a key indicator of frequency deviations. Unlike conventional detection methods that mainly utilize spatial information from single time instances, our approach captures temporal correlations across multiple system states by leveraging wavelet singular entropy (WSE) features. Moreover, the LSTM-based model predicts the system’s healthy behavior during attack phases, enabling more robust mitigation. The WT-LSTM framework is broadly adaptable to other cyber-physical systems (CPS) such as the following:
  • water distribution systems (e.g., SCADA-based flow control);
  • natural gas pipelines (e.g., pressure and flow regulation);
  • district heating or HVAC networks.
These systems, like power grids, exhibit
  • spatiotemporal dependencies (pressure, flow, demand over time);
  • vulnerabilities to FDI, DoS, replay attacks;
  • telemetry data suitable for wavelet decomposition and forecasting.
To facilitate real-world adoption of frameworks like WT-LSTM in critical infrastructure, the following regulatory/policy shifts are essential:
  • Standards and Certification: Update NERC CIP and IEC 61850 standards [14] to recognize AI/ML-based intrusion detection systems (IDS) alongside traditional rule-based FDD. Establish benchmarks and certification bodies for AI-based anomaly detection tools to ensure reliability and explainability.
  • Cybersecurity Incentives: Encourage utility participation through regulatory sandboxes where new detection technologies can be piloted without financial or compliance risks. Introduce financial incentives or tax credits for adopting certified AI-driven cybersecurity tools.
  • Data-Sharing Policies: Enable secure, anonymized telemetry sharing across utilities to improve the training of generalized AI models while preserving privacy and compliance. Mandate event logging and incident sharing (e.g. DOE Cybersecurity Risk Information Sharing Program—CRISP) to build resilient AI threat models.
  • Interoperability Requirements: Ensure detection frameworks can integrate with existing energy management systems (EMS), SCADA platforms, and digital twins through open APIs or OPC-UA/MQTT protocols.
This paper extends prior work by assessing the combined effects of cyberattacks in a modified IEEE 39-bus system testbed integrated with solar and wind generation. To the best of our knowledge, this is the first attempt to deploy a WT-LSTM framework for defending the load frequency regulation system of an NSG against FDI attacks, thereby significantly improving the system’s resilience against evolving cyber threats.
This paper offers the following key contributions:
  • A fuzzy rule-based LADRC (F-LADRC) scheme is proposed for frequency regulation (FR) under stochastic load conditions, with controller parameters optimized using the quasi-opposition-based reptile search algorithm (QORSA).
  • A modified IEEE 39-bus system incorporating renewable energy and electric vehicles is developed to simulate and analyze the impact of cyberattacks.
  • A novel cyberattack detection and mitigation framework is introduced, combining wavelet transform (WT) for feature extraction and long short-term memory (LSTM) networks for predictive analysis, targeting false data injection (FDI) and time delay attacks (TDA).
The paper is structured as follows: Section 2 details the problem formulation; Section 3 describes the control strategy; Section 4 discusses the cyberattack detection and mitigation model; Section 5 presents the experimental results; and Section 6 concludes the study.

2. Problem Formulation

2.1. Frequency Regulation in Smart Grids

A modified IEEE 39-bus system is considered as the proposed testbed for analysis. The testbed is regarded as a three-area system, as shown in Figure 1, while a single line diagram of the same is depicted in Figure 2. The installed capacity of the power system A ˜ a ˜ 1 , a ˜ 2 , a ˜ 3 ; a ˜ 1 : a r e a 1 , a ˜ 2 : a r e a 2 , a ˜ 3 : a r e a 3 is a ˜ 1 , c a p = a ˜ 2 , c a p = 1750 MW and a ˜ 3 , c a p = 2000 MW, where a ˜ i , c a p is the capacity of the ith control area. Electric vehicles (EV) as energy storage devices (ESD) and thermal generators with governor dead band (GDB) (Fourier coefficients N 1 = 0.8 , N 2 = 0.2 π and a generator rate constraint (GRC = 3% per minute) are connected in each area. Additionally, a ˜ 1 includes a solar PV (SPV) farm, while a ˜ 3 contains a wind farm. The linearized LFC model of the NSG system [11] is shown in (1).
x . ( t ) = A x t + B u t + D d t + w t y t = C x t + v t
A = 0 1 2 H t i 0 1 2 H t i 1 2 H t i 0 1 2 T W T G i 1 T W T G i 0 0 1 R T g 0 1 T g 0 0 0 0 0 1 T E V i 0 0 0 0 0 1 T S P V i i B = 0 0 0 0 0 0 1 T g i 0 0 0 1 T E V i 0 0 0 1 T S P V i C = 1 0 0 0 0 0 0 0 1 0 0 0 0 0 1 D = 1 2 H t 0 0 0 0 0 0 0 1 T E V 1 0 T
x t = Δ f i Δ P W T G i Δ X G i Δ P E V i Δ P S P V i T
u = 0 Δ u E V i 0 T
d = d 1 d 2 T
In the microgrid system, the state vector x(t) represents various parameters, including frequency deviation Δf, the output power of the WTG as ΔPWTG, the incremental valve position of the governor ΔXG, and the output powers of the EV and SPV as ΔPEV and ΔPSPV, respectively. Additionally, the microgrid input control u(t) and disturbance signal d(t) = [d1(t) d2(t)] play vital roles. The disturbance signal includes wind power perturbation ΔPWTG and solar power fluctuation ΔPSPV. The control output signal is denoted as y(t). The equivalent inertia of the NSG is represented as 2Ht, and the equivalent EV dynamics are modeled using time constant TEV, with control inputs ΔuEV subjected to mechanical limits such as power ramp rate δe, power increment μe, and controllable energy limits Emax and Emin. Table 1 and Appendix A provide the relevant NSG parameters. A detailed explanation of the NSG control structure is discussed in the next section.

2.2. Cyberattack Approaches Employed in the Smart Grid LFC System

Due to the secondary LFC layer’s greater vulnerability than the primary LFC layer, cyberattacks frequently try to insert misleading data into the communication channel. The state-space equations that take into account cyberattacks and time-varying delays are then developed. The LFC system aims for no variation in the area control error (ACE) and frequency.
(i)
FDIA Model
By misrepresenting the dynamic state estimation or deceiving the power system operators, an FDIA can jeopardize the power systems’ efficient and safe functioning. FDIAs have drawn particular attention recently because they can bypass the established faulty data detection (FDD) method. In this article, stealthy and scaling FDIA attacks have been considered.
(a)
Stealthy FDIA model: Originally put forth in [15], and according to the literature, FDIA targeting state estimation can bypass conventional FDD thanks to the following theorem.
Theorem 1. 
Define x as the measurement vector that can pass the BDD. The measurement vector under FDIA is xa = x + a. When an is a linear combination of the Jacobi matrix J, that is, a = Jc, the xa can also avoid the FDD. Traditional FDD detects erroneous data by using threshold values. When the residue res is less than the specified threshold value, the power system operators believe there are no attacks. Even with FDIA, the res will not change in this situation because as per (6).
r e s a = x a J z a 2 = x + a J ( z + c ) 2 = x J z 2 = r e s
It is important to note that the stated threshold value is determined by the power system’s structure and parameters, which can be depicted by the linear and nonlinear constraints shown in (7) and (8).
P Q p q T = J V θ T
P ¯ P P ¯ p ¯ p p ¯ q ¯ q q ¯
According to the literature [16], attackers can conduct a stealthy FDIA using fractional power system information. The FDIA only targets a certain attacking location. This reduces the expense and difficulty of a cyberattack and makes it easier to carry out. Algorithm I can generate an FDIA for a power system after obtaining the system’s partial structure and characteristics (e.g., bus voltage, upper and lower limits).
Attackers provide an attack vector V a θ a by limiting the power flow and alarm threshold. The attacked frequency deviation Δ f a is calculated by taking the derivative of the input phase angle Δ θ a in relation to a synchronous phasor rotating at the nominal frequency. The attacking tie-line power deviation Δ P t i e a is calculated as follows (9):
Δ P t i e a = p V p θ V a θ a T .
(b)
Scaling attack FDIA model: The model entails the process of multiplying real measurements by a constant, causing them to increase or decrease, depending on the scaling attack parameter. The three possible assault targets for scaling and exogenous events, together with their ACE formulations, are shown below.
  • Assault on the frequency measurement data of the kth area may be described as (10).
    A C E k * ( t ) = A C E k ( t ) + ( 1 + χ ) Δ f k ( t )
  • Assault on the tie-line measurement data between kth and lth areas may be described as (11).
    A C E k * ( t ) = A C E k ( t ) + ( 1 + χ ) Δ P t i e k , l ( t )
  • Assault on ACE measurement data may be described as (12)
A C E k * ( t ) = ( 1 + χ ) A C E k ( t )
where A C E k ( t ) is the ACE data before attack, χ 0 , is the scaling factor and A C E * k ( t ) is the actual/attacked ACE.
The assumption that attackers possess knowledge of partial system parameters—such as the Jacobian matrix—is indeed critical to the feasibility of stealthy FDIA, and its realism depends on the security posture of the specific power system in question.
In practice, while complete knowledge of system parameters may be challenging for attackers to obtain, partial or approximate knowledge is increasingly plausible due to the following:
  • Publicly available data: many utilities and independent system operators (ISOs) publish planning and operational data (e.g., one-line diagrams, base load/generation profiles, system operating conditions) that can be exploited by sophisticated attackers to estimate system topology or parameters.
  • Insider threats: employees or contractors with legitimate access to SCADA or EMS systems may inadvertently or maliciously leak sensitive information such as Jacobian structures or model parameters.
  • Reconnaissance and machine learning: attackers can perform probing attacks and use system responses to learn the Jacobian structure over time using statistical or machine learning techniques.
  • Prior research: this assumption is consistent with the prevailing literature on stealthy FDIAs, such as in subsequent studies, where even partial or estimated Jacobian information can be sufficient to bypass conventional bad data detection (BDD) mechanisms.

3. Design Methodology of the Proposed Adaptive Fuzzy-LADR Controller

The LADRC is a model-based controller that generates the control signal using a linearized model of the system. The controller includes a disturbance observer, which estimates the impacts of disturbances, and a compensator, which cancels these disturbances [17]. By continually updating the disturbance estimate and changing the control signal, the LADRC can provide resilient performance even in the face of disturbances and model errors. It provides rapid and precise reactions to disturbances as well as disturbance rejection even in the face of nonlinearities, uncertainties, and measurement noise [18]. The LADRC is a compelling alternative to classic load frequency controllers, providing superior performance and resilience for modern power systems.

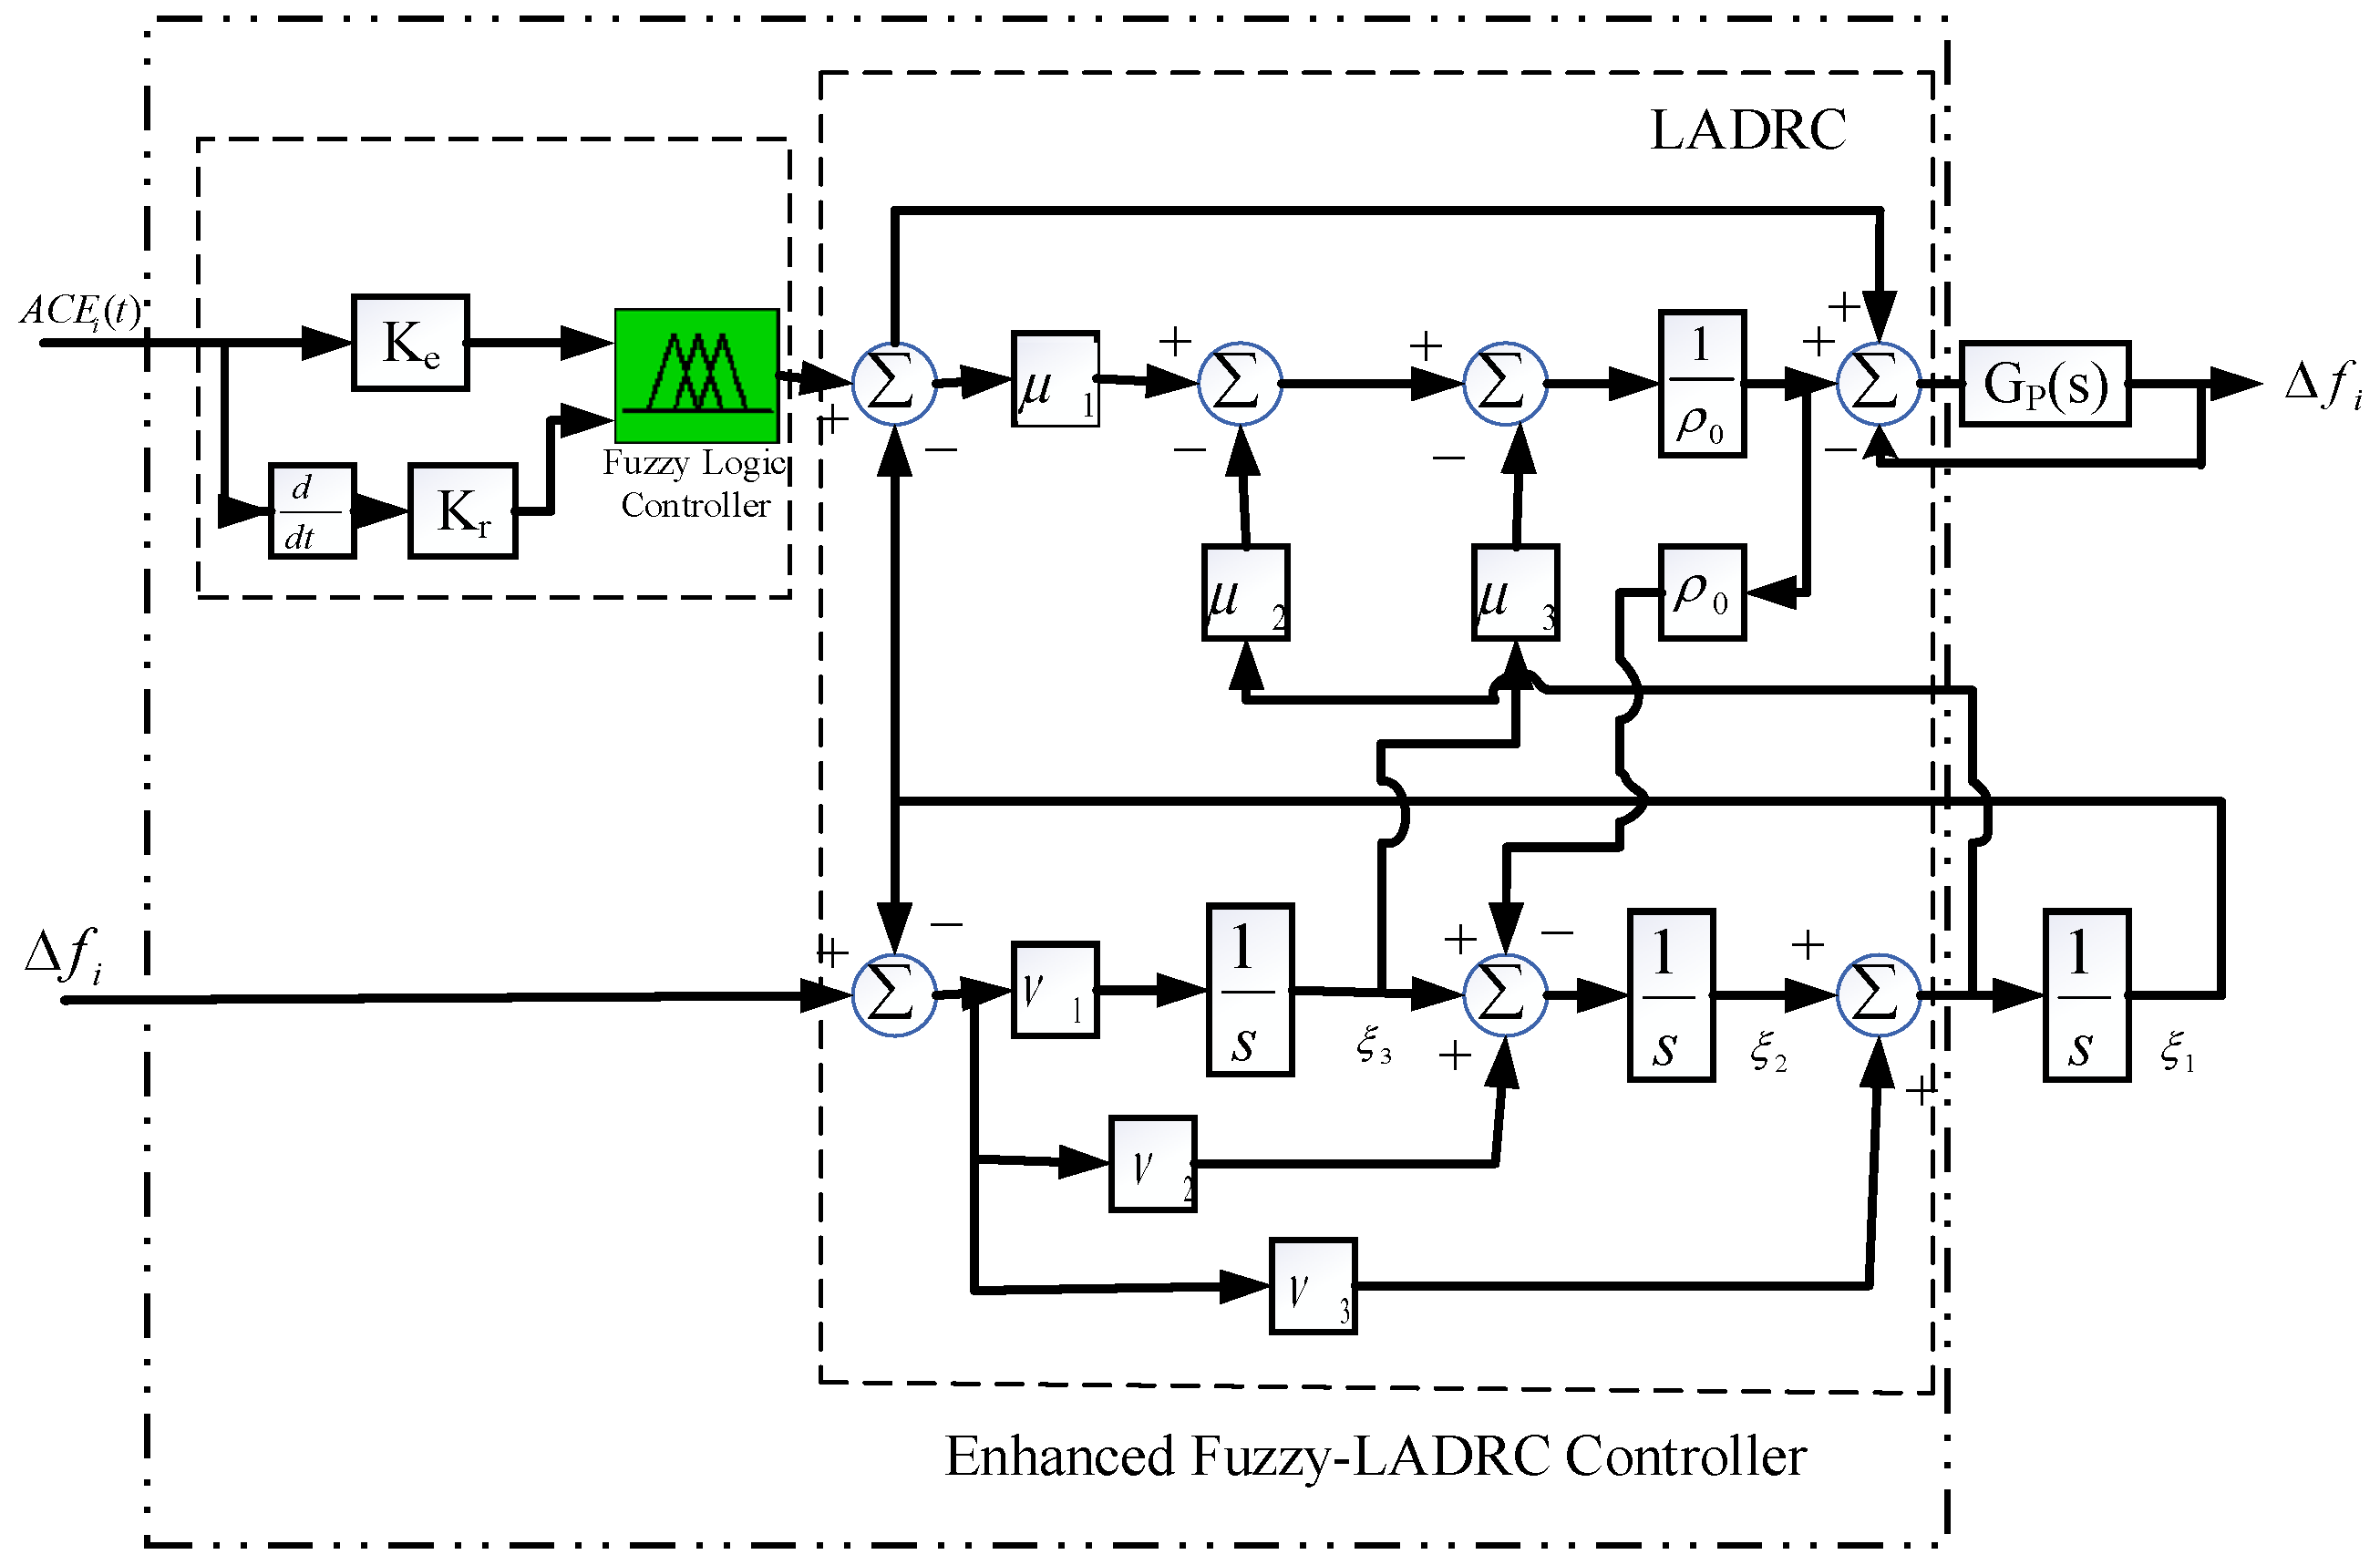
3.1. Proposed Control Strategy

Consider the following typical second-order system (13):
c ¨ = b u + f ( c ˙ , c , d )
where u is the regulatory input, b is process specification, f is net interference, and d is external disturbance. LADRC offers a substantial advantage in that the interruption does not need to be statistically modeled. As a result, if system modeling is not possible, the disruption can also be denied. The state-space equation of the second-order system described in (14) is as follows:
x ˙ 1 = x 2 x ˙ 2 = b 0 u + x 3 x ˙ 3 = h c = x 1
where x 1 = c , x 2 = c ˙ , x 3 = f ( c ˙ , c , d ) , and h = ˙ f ˙ ( c ˙ , c , d ) . In this context, we take an extended state to be x3 for the disturbance f. The goal is to develop a system observer that evaluates the system’s states. This knowledge is used to create a control law that reduces the error caused by the disturbance, thereby rejecting it. The observer can be defined as (15)
v ˙ = A 0 v + B 0 u + L 0 ( c c ^ ) c ^ = C 0 v
where, A 0 = 0 1 0 0 0 1 0 0 0 , B 0 = 0 b 0 0 , C 0 = 1 0 0 are the canonical form of integrators. c ^ is the estimated signal of c and b0 is the estimated rate that can be calculated from the plant transfer function. v = v 1 , v 2 , v 3 T is the intended value of x = x 1 , x 2 , x 3 T . The observer gain vector L 0 = μ 1 , μ 2 , μ 3 T = 3 υ 0 , υ 0 , 2 υ 0 3 T is derived using the pole-placement method. The estimated state observer (ESO) can be formulated as (16)
v ˙ 1 = v 2 + υ 1 ( c v 1 ) v ˙ 2 = v 3 + υ 2 ( c v 1 ) + b 0 u v ˙ 3 = υ 3 ( c v 1 ) .
In this case, the observer estimates the overall perturbance level as thrice the original. Following that, disruption can be avoided by developing an appropriate control law. The control law can be stated as follows (17):
u = ( f ^ + u 0 ) b 0 .
As a result, the original plant is converted into a very rudimentary form, as depicted below (18):
c ¨ = ( f ( c ˙ , c , d ) f ˙ ) + u 0 u 0 .
The simpler union for u0 is essential and the PD controller is as follows (19):
u 0 = k p ( r v 1 ) k d v 2 v 3
where the ACE is used as the reference value r and kp, and kd are proportional and derivative control parameters, respectively. According to [17], controller and observer gains are linear functions of their respective bandwidths. Because of this, the term linear ADRC can be understood as k p = υ c 2 , k d = 2 υ c , L 0 = μ 1 , μ 2 , μ 3 T where µ1, µ2 and µ3 are observer gains, and υc and υ0 are the controller and observer bandwidths, respectively, which must be tweaked in this situation. Suppose the transfer function of the plant is (20)
T P ( s ) = ρ m s m + ρ m 1 s m 1 + .... + ρ 0 σ n s n + σ n 1 s n 1 + + σ 0
ρ = ρ m σ n .
The value of ρ0 is considered to be slightly greater than the value of ρ. Figure 3 depicts the proposed controller. In the corresponding area, the controller’s input has been labeled as an area control error (ACE). The LADRC output response can be represented as (21)
u 1 = ( f ^ + u 0 ) b 0 .
A fuzzy logic controller (FLC) before the LADRC controller adjusts the controller coefficients to improve performance in diverse loading scenarios [19]. Figure 4 shows F-LADRC controller input and output membership functions. As shown in Figure 4 for controller inputs and outputs, seven membership triangular-type functions were applied, with verbal abbreviations SN and SP indicating small negative and positive changes, MN and MP indicating medium negative and positive changes and Z indicating zero changes. Additionally, two trapezoidal membership functions with the abbreviations LN and LP indicate large negative and positive changes. Membership function design affects FLC performance. The suggested approach improves controller performance by selecting the coefficients of the proposed controller. Figure 5 shows the suggested controller’s fuzzy rule.
The narrow range of UT in Figure 5 is intentional and reflects the fine-tuned nature of the fuzzy-linear active disturbance rejection controller (F-LADRC). The UT (control output) is designed to make smooth and gradual adjustments, thereby ensuring system stability and reducing overshoot and control effort.
This narrow range is particularly suitable in the context of load frequency control (LFC), where abrupt changes in control input can cause undesirable oscillations and instability in power system frequency. The fuzzy rules are designed to provide small corrective actions based on the ACE (area control error) and DACE (derivative of ACE), allowing for a more robust and adaptive response to system disturbances.
The fuzzy LADRC introduces additional computational overhead compared to traditional PID and I-PD controllers due to two primary components:
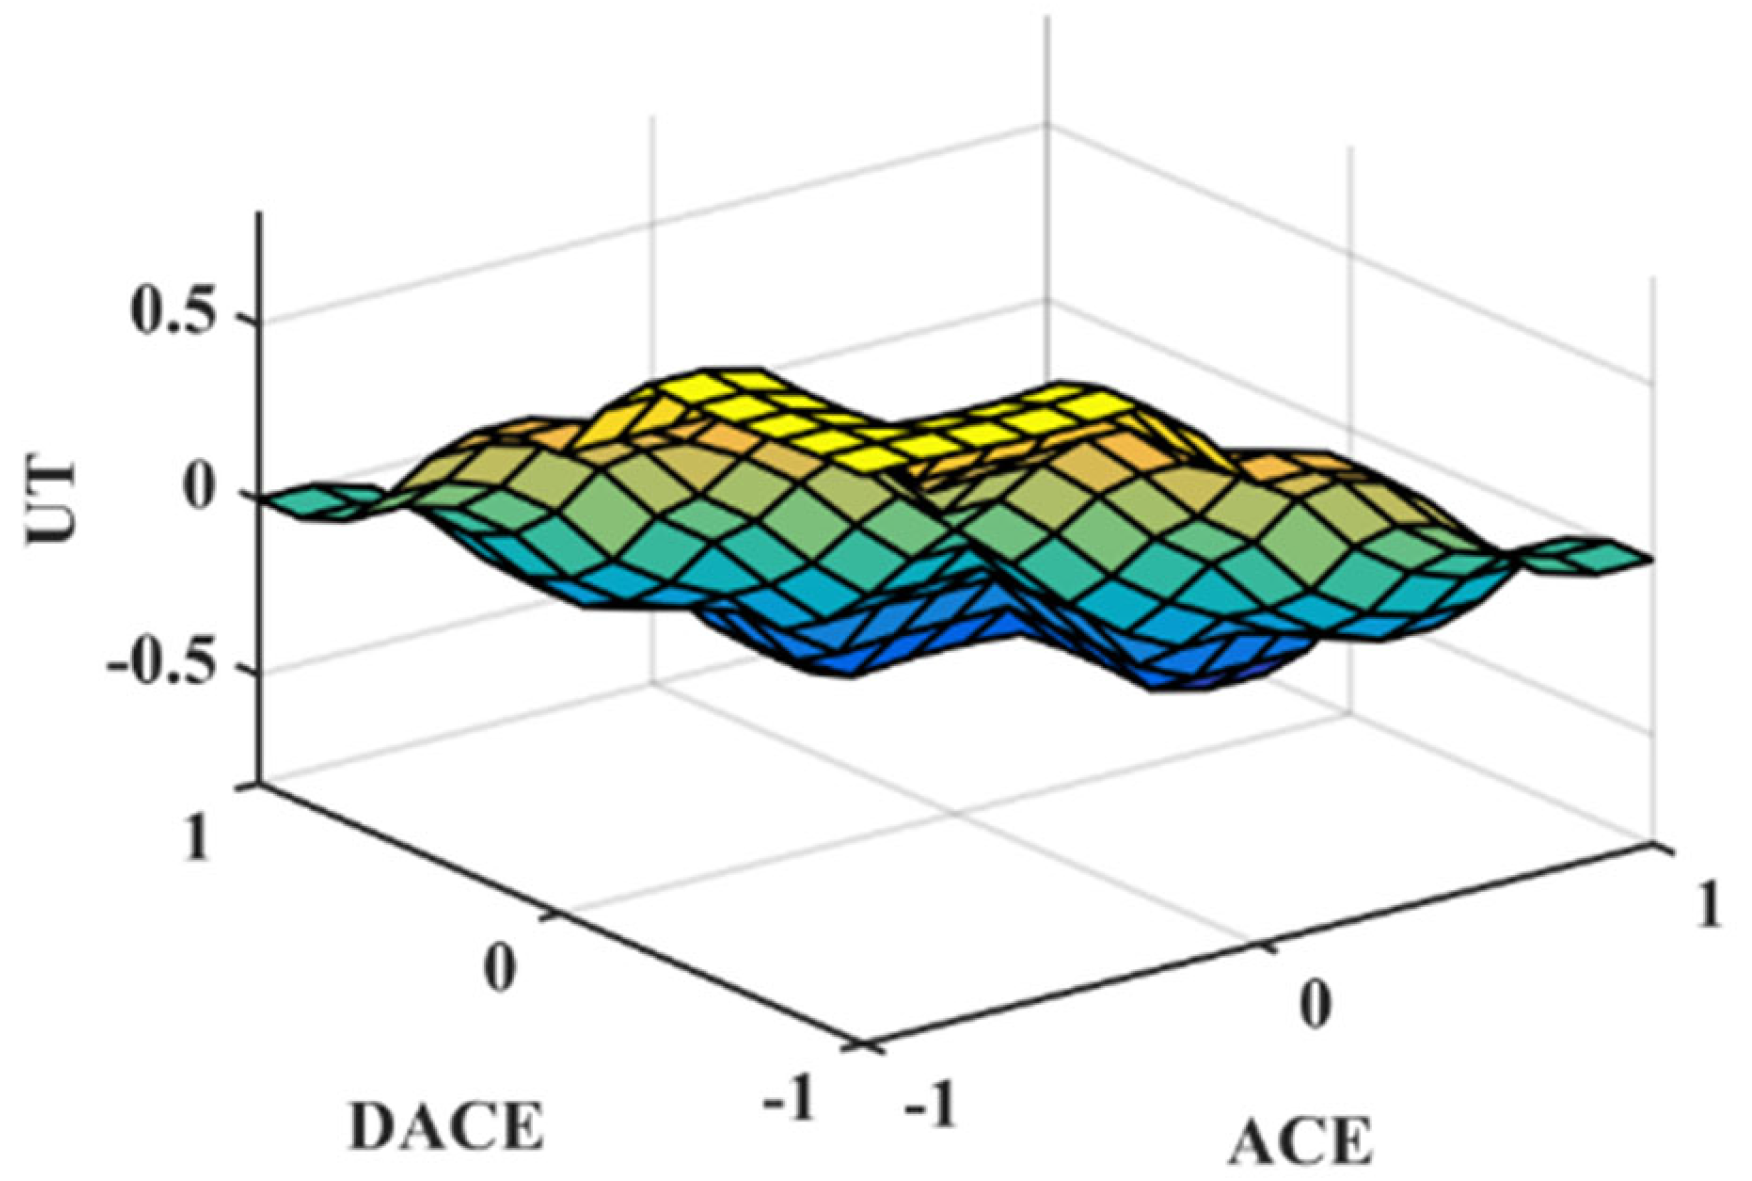
  • Fuzzy logic inference: The fuzzy controller requires the evaluation of membership functions and rule bases in real time. However, the inference mechanism used in our implementation is based on a Mamdani-type system with a small number of rules (typically fewer than 10), and triangular membership functions. This keeps the computational load relatively low and suitable for real-time execution on standard microcontrollers or DSP platforms.
  • Extended state observer (ESO): The LADRC framework includes an ESO for disturbance estimation, which involves solving a set of differential equations. This is computationally light and requires only a few arithmetic operations per control cycle.
To quantify this, we implemented the fuzzy LADRC on the MATLAB/Simulink platform (v2020a) and observed that it required approximately 12% more computation time per control cycle compared to a PID controller. However, this increase is marginal and remains well within the real-time execution capabilities of typical embedded systems used in LFC applications.
The proposed detection framework leverages the fuzzy LADRC (linear active disturbance rejection controller) which incorporates an extended state observer (ESO) to estimate and reject both matched disturbances and injected anomalies. How it handles differentiation is described below:
  • Natural disturbances (e.g., load changes) typically align with the system’s physical model and occur within expected bounds. The ESO within LADRC adapts to such changes as part of the normal control behavior.
  • FDI attacks, especially scaling-type injections, introduce structured deviations that do not conform to the model dynamics or expected measurement residuals over time. The LADRC’s ESO detects these as unmodeled disturbances, and the fuzzy adaptation enhances sensitivity by adjusting gains dynamically.
Additionally, the fuzzy layer distinguishes contextually between rapid, model-conforming fluctuations and sustained, structured anomalies, making the controller more selective and robust against false alarms due to natural events.

3.2. Proposed Optimization Algorithm

In the field of load frequency control (LFC), a wide range of optimization algorithms have been employed for the systematic tuning of controller parameters. In this study, a novel optimization framework, termed the quasi-oppositional reptile search algorithm (QORSA), is adopted to optimize the parameters of the proposed F-LADRC controller. The reptile search algorithm (RSA) is a population-based, gradient-free metaheuristic inspired by the cooperative hunting and social behaviors of crocodiles [20]. It features a two-stage process comprising an exploration phase, mimicking the encircling of prey, and an exploitation phase, reflecting the focused hunting behavior, both designed to efficiently converge to the global optimum.
To further enhance the convergence rate and global search capability, the quasi-oppositional learning strategy is incorporated. This approach generates quasi-opposite solutions corresponding to each population member, thereby improving the algorithm’s ability to avoid local minima and accelerating overall convergence. The procedural steps of the proposed QORSA [21] are depicted in Figure 6.

3.3. Examination of Designed Controller’s Effectiveness

The effectiveness of the proposed controller is evaluated by comparing its performance against several established controllers on a modified IEEE 39-bus system, as shown in Figure 2. Controller parameters are optimized using the QORSA with results summarized in Table 2. Random load disturbances (Figure 7a) and renewable generation profiles for PV and wind (Figure 7b) are utilized to test system dynamics. As illustrated in Figure 8, the proposed controller demonstrates superior dynamic performance compared to conventional LADRC-based methods.

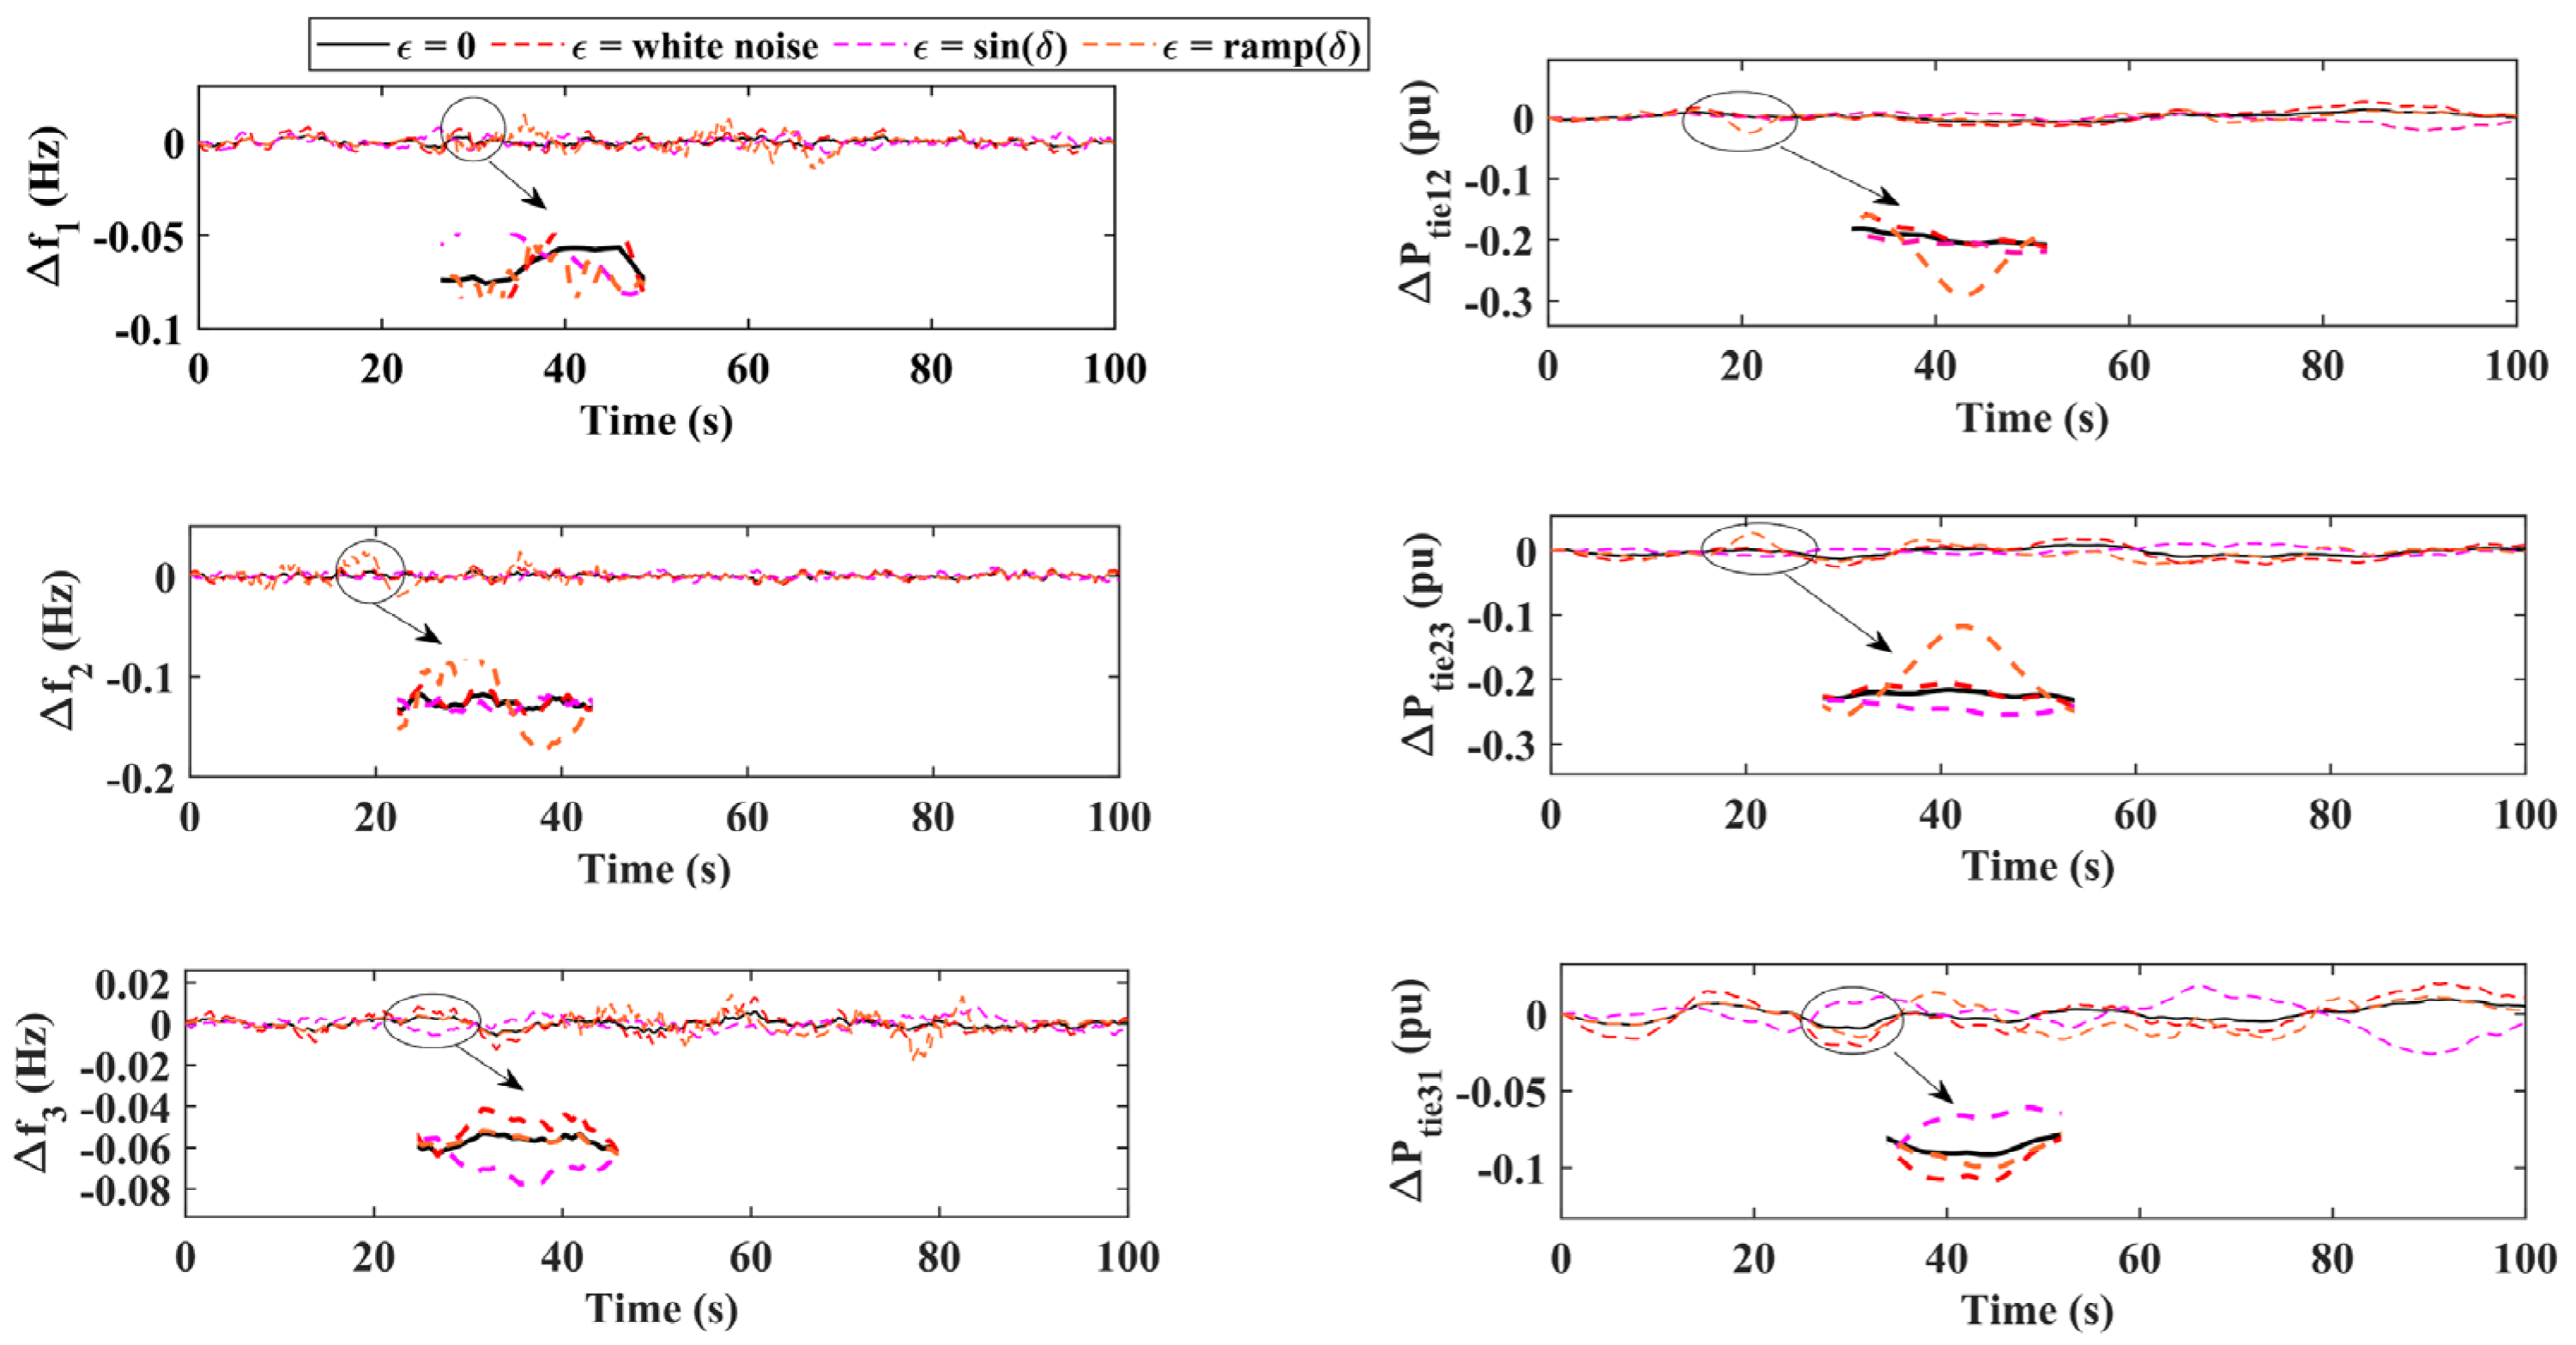
3.4. Sensitivity Analysis

In this case, the proposed control strategy is analyzed under ±20% uncertainty in Tr and +20% uncertainty in Tg ± 20% to the system parameters. Based on the system dynamics shown in Figure 9, it can be deduced that the system is robust as it has shown low sensitivity to parameter variations.

4. Proposed Cyber-Threat Detection and Mitigation Model

The proposed cyber-threat detection and mitigation (CDM) model includes a wavelet-LSTM system (W-LSTM). The wavelet transform-based model detects anomalous frequency deviation data while LSTM is used as a mitigator for the prediction of frequency deviation data during the attack phase.

4.1. Wavelet-Based Attack Detector

The Haar wavelet transform, known for its simplicity and low computational complexity, provides an efficient means of analyzing the local features of a signal. It decomposes a time-domain signal into approximation and detail components at different scales, thereby revealing sudden changes and anomalies often hidden in the raw measurements.
Among the various wavelet tools available, the Harr wavelet is considered the simplest one, and it is denoted as (22)
h a a r ( 2 r + ω , θ ) = 2 r ; ω / 2 r θ ω + 0.5 / 2 r 2 r ; ω + 0.5 / 2 r θ ω + 1 2 r 0 ; o t h e r w i s e .
Now, if ω = 0 and 2 r = 1 , then the Harr wavelet is (23)
Λ ( θ ) = 1 ; 0 θ 0.5 1 ; 0.5 θ 1 0 ; o t h e r w i s e .
In the context of FDI detection, the ACE signals are subjected to the Haar transform. Under normal operating conditions, the detail coefficients remain bounded within a predictable range. However, the occurrence of an FDI attack induces abrupt distortions, resulting in a sudden rise in the magnitude of detail coefficients.
To detect these anomalies, a dynamic threshold Γ is established based on the statistical properties of the detail coefficients during normal operation (24)
Γ = μ D + α σ D
where μD and σD denote the mean and standard deviation of the detail coefficients, respectively, and α is a tunable sensitivity parameter.
An FDI attack is flagged when (25)
D j k > Γ
for any coefficient at any decomposition level.
The parameter α in (24) serves as a sensitivity factor for the dynamic threshold where μD and σD denote the mean and standard deviation of the detail coefficients, respectively, and α is a tunable sensitivity parameter.
Calibration process: α was tuned empirically through a grid search over the range [1.5, 4.0] using historical ACE data under both normal and attack conditions. The optimal value was selected based on minimizing the following cost metric:
Cost = FPR + FNR
where FPR = false positive rate and FNR = false negative rate. A value of α = 3.0 was found to provide a strong balance, yielding >95% detection accuracy with a false positive rate below 3% across scenarios tested.

4.2. Long Short-Term Memory

While early detection of false data injection (FDI) attacks is critical and timely, accurate mitigation is equally important to preserve the operational stability of load frequency control (LFC) systems. To this end, a long short-term memory (LSTM) neural network is employed in this study for the real-time reconstruction and correction of compromised signals, ensuring continued reliable control performance, even under cyberattack scenarios.
LSTM networks, a variant of recurrent neural networks (RNNs), are particularly adept at learning complex temporal dependencies due to their unique gating mechanisms, which mitigate the problems of vanishing and exploding gradients commonly encountered in traditional RNNs. Their ability to capture both short-term and long-term correlations in sequential data makes them highly suitable for modeling the dynamic behavior of power system signals such as ACE.
An LSTM layer is composed of several interconnected LSTM units that generate the cell vector c t n based on inputs xt, ht−1, and ct−1. The generation of the cell vector ct involves employing specific operations (26).
d t = λ G d x t + J d h t 1 + ς d f t = λ G f x t + J f h t 1 + ς f o t = λ G o x t + J o h t 1 + ς o g t = tanh G g x t + J g h t 1 + ς g c t = f t c t 1 + i t g t h t = o t tanh c t
The LSTM layer utilizes element-wise activation functions, namely, λ . for the sigmoid function and tanh(·) for the hyperbolic tangent function. Additionally, it incorporates element-wise product representation. The variables d t n , f t n , and o t n represent the input gate, forget gate, and output gate, respectively. For each of these gates, parameters G k , J k , and ς k (where k d , f , o ) are used to facilitate their respective functions.
The LSTM-based cyber threat mitigation framework, illustrated in Figure 7, employs a hierarchical structure comprising three sub-networks. Two sub-networks predict frequency deviations for each control area, utilizing as input the current frequency and input power. Temporal dependencies are captured via LSTM layers, followed by fully connected layers with ReLU activations for actuator temperature prediction. The third sub-network processes historical joint-angle states through a similar LSTM-FC-ReLU pipeline, whose outputs are fused with the frequency deviation predictions to form a comprehensive system response model.
The LSTM-based mitigator is trained using multi-area ACE data, allowing it to learn temporal and spatial dependencies among different control areas. This enables the model to achieve the following:
  • Capture correlated behaviors: for example, simultaneous ramp FDIAs across interconnected areas will cause synchronized anomalies in ACE patterns, which the LSTM can recognize through learned temporal patterns.
  • Predict cross-area ACE values: during attacks, the LSTM estimates the expected ACE signal based on the joint evolution of all areas. Deviations between the predicted and actual ACE help isolate and suppress anomalous inputs.
  • Activate a mitigation mechanism: when a correlated attack is detected, the LSTM-predicted ACE acts as a surrogate signal for controller input, ensuring continuity of control. Additionally, its training includes mixed-scenario datasets with uncorrelated and correlated attacks, improving generalization.
Model performance is quantified using the root mean squared error (RMSE), defined as (27).
R M S E = 1 N i = 1 N A C E i , m e a s u r e d A C E i , e s t i m a t e d
The WT-LSTM framework can detect hybrid attacks insofar as they induce anomalies in ACE or system dynamics.
FDI-DoS typically leads to
  • missing or delayed data packets;
  • sudden communication drops.
These disruptions manifest as abrupt changes or irregular gaps in ACE/tie-line signals. The Haar transform will spike under such conditions, and LSTM prediction errors will increase due to divergence from learned patterns—triggering detection.
Zero-Day Exploits: While unknown in structure, zero-day attacks still impact system behavior. Because our detection relies on data-driven behavioral deviation rather than known signatures, it can flag unknown patterns that deviate from normal learned dynamics. That said, distinguishing malicious zero-day behavior from rare but benign events (e.g., generator trips) remains an open challenge and may require integration with physical redundancies or cyber-forensics.
The proposed framework relies on ACE signal patterns, not the specific source of generation.
Both hydro and geothermal plants exhibit different dynamics (e.g., longer ramp times for hydro), but the WT-LSTM approach adapts because
  • training is based on local historical ACE data;
  • LSTM captures temporal dependencies, irrespective of the underlying source.
We anticipate that retraining the LSTM on data from hydro/geothermal-integrated grids would maintain its effectiveness.
The WT-LSTM method trades slightly higher computational effort for greater robustness and adaptability, especially under nonlinear, coordinated, or data-driven attacks, which model-based approaches may not capture effectively (Table 3).
Blockchain frameworks are more suited for forensic-level verification and data integrity, whereas WT-LSTM is designed for real-time detection and mitigation. The two can be complementary, not competing (Table 4).

5. Results

The proposed control strategy is evaluated on a modified IEEE 39-bus system with three areas. Key system parameters, such as inertia, damping, droop coefficients, and time constants, are listed in Table 1, with values based on a 100 MVA base. Frequency deviations result from uncertain power inputs, including uncontracted loads, PV, and wind. The control scheme addresses both primary and secondary frequency regulation (FR) while accounting for cyber threats disrupting communication between the FR controller and EVs.
Simulations are run in MATLAB 2020a on a Windows 11 platform with an HP Intel i7-6700K CPU and 8 GB RAM, Gurugram, India. To test the scheme’s effectiveness, FDI attack scenarios are considered, with disturbances from wind, PV, and uncontracted loads (15 MW, 10 MW, 4 MW). Each area is modeled with 40,000 EVs, contributing ±10 kW, with 5% participation in FR. The simulations cover the three following scenarios:
  • S1: normal operation without an attack.
  • S2: FDI attack without cyber defense.
  • S3: FDI attack with the proposed detection and mitigation system.
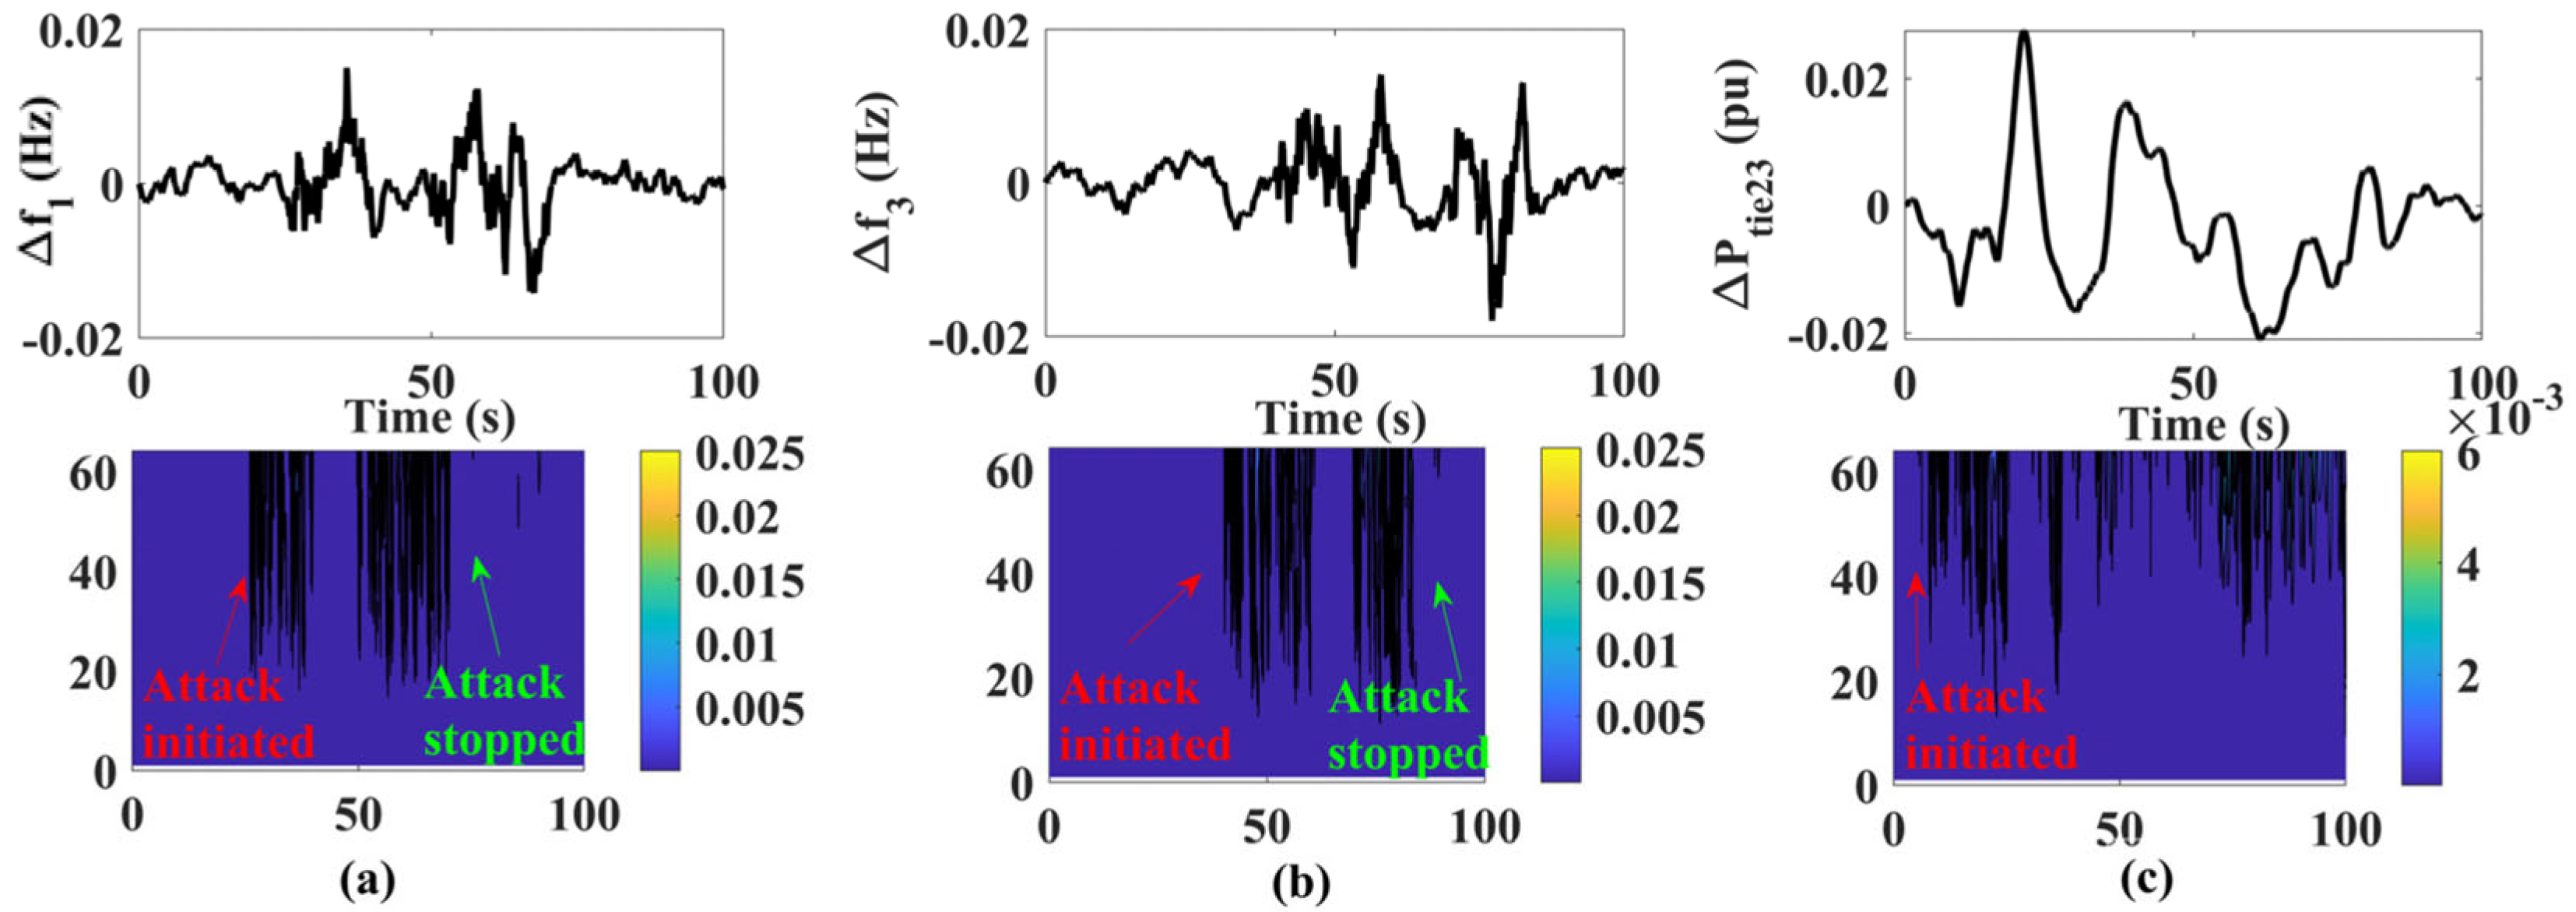
Case-1: FDI Attack

The proposed cyber defense and mitigation (CDM) system’s effectiveness is evaluated during a false data injection (FDI) attack targeting the area control error (ACE). The attack is applied sequentially to each region of the smart grid over a set time period.
Three distinct types of scaling FDI attacks are simulated within the system. These attack scenarios involve scaling factors in the form of white noise, sine waves, and ramp functions, as depicted in Figure 10. The wavelet-based detector identifies the malicious data injected during the attack through wavelet decomposition, as shown in Figure 11. Additionally, the LSTM-based predictor is employed to generate a mitigated signal during the attack, with results illustrated in Figure 12.
The combined wavelet transform (WT) + LSTM detection and mitigation pipeline introduces an average processing latency of approximately
  • WT transform and thresholding: ~5 ms;
  • LSTM prediction (1-step ahead): ~15–20 ms on a standard CPU (Intel i7, 2.8 GHz);
  • Total latency: ~20–25 ms per sampling interval.
Given that typical load frequency control (LFC) systems operate on 100–200 ms sampling intervals, this latency is well within the real-time control bounds and is thus acceptable for deployment in primary or secondary control loops.
To ensure low-latency operation, the LSTM was designed with a compact architecture (two hidden layers, thirty-two units) and optimized using a batch size = 1 inference.
The attack profiles in the simulations were chosen based on the following rationale:
  • Durations: each attack spans 5–15 s to capture the transient response, which is the most critical window for LFC and detection systems.
  • Intensities: scaling factors and signal amplitudes (e.g., 10–30% of nominal ACE or tie-line power) were selected to remain stealthy (i.e., bypass threshold detection), while still significantly perturbing system dynamics.
These were designed to reflect realistic yet challenging adversarial conditions, inspired by past FDIA studies and aligned with cyber-threat scenarios.

6. Conclusions

This paper has presented novel contributions focusing on the detection and mitigation of FDI attacks on area control error (ACE). To address the variability of load demands and RES, a robust frequency regulation (FR) mechanism was designed. A fuzzy logic rule-based linear active disturbance rejection control (F-LADRC) system was proposed to optimize transient and steady-state responses, ensuring precise control. To further enhance performance, the QORSA optimization algorithm was employed, improving controller efficacy and system stability. In response to rising cyber threats in smart grids, a strategy leveraging wavelet-based detection identified FDI-induced frequency deviations. An LSTM network was then used to forecast corrective signals by analyzing historical attack data.

Author Contributions

Methodology, R.S. (Rambaboo Singh) and U.R.; Formal analysis, R.S. (Rambaboo Singh) and R.K.; Investigation, U.R. and R.S. (Ravi Shankar); Data curation, R.S. (Rambaboo Singh); Writing—original draft, R.S. (Rambaboo Singh) and U.R.; Supervision, R.K. and R.S. (Ravi Shankar). All authors have read and agreed to the published version of the manuscript.

Funding

This research did not receive any specific grant from funding agencies in the public, commercial, or not-for-profit sectors.

Data Availability Statement

The original contributions presented in this study are included in the article. Further inquiries can be directed to the corresponding author.

Conflicts of Interest

The authors declare no conflict of interest.

Nomenclature

F-LADRCFuzzy Linear Active Disturbance Rejection Controller
DoSDenial of service
FDIFalse data injection
GDBGovernor dead band
GRCGeneration rate constraint
QORSAQuasi-Opposition-based Reptile Search Algorithm
LSTMLong Short-Term Memory
WTWavelet Transform
NSGNetworked Smart Grid

Appendix A

Thermal power plant: Kr = 0.3, Tr = 10 s, Tt = 0.3 s, Rth = 2.4 Hz/pu, Tg = 0.08 s, GRC = 0.0017 pu/MW/s. Power system: Kps = 120 Hz/pu, Tps = 20 s.

References

  1. Dong, M.; Liu, K.; He, J.; Li, X.; Qiao, L.; Zhao, X. Power grid load frequency control based on Fractional Order PID combined with pumped storage and battery energy storage. Energy Rep. 2023, 9, 1402–1411. [Google Scholar] [CrossRef]
  2. Raj, U.; Shankar, R. Deregulated Automatic Generation Control using Novel Opposition-based Interactive Search Algorithm Cascade Controller Including Distributed Generation and Electric Vehicle. Iran. J. Sci. Technol. Trans. Electr. Eng. 2020, 44, 1233–1251. [Google Scholar] [CrossRef]
  3. Bošković, M.Č.; Šekara, T.B.; Rapaić, M.R. Novel tuning rules for PIDC and PID load frequency controllers considering robustness and sensitivity to measurement noise. Int. J. Electr. Power Energy Syst. 2020, 114, 105416. [Google Scholar] [CrossRef]
  4. Gobinda, D.; Majhi, S. A new control scheme for PID load frequency controller of single-area and multi-area power systems. ISA Trans. 2013, 52, 242–251. [Google Scholar] [CrossRef]
  5. Ranjan, M.; Shankar, R. A literature survey on load frequency control considering renewable energy integration in power system: Recent trends and future prospects. J. Energy Storage 2022, 45, 103717. [Google Scholar] [CrossRef]
  6. Khan, M.; Sun, H.; Xiang, Y.; Shi, D. Electric vehicles participation in load frequency control based on mixed H2/H∞. Int. J. Electr. Power Energy Syst. 2021, 125, 106420. [Google Scholar] [CrossRef]
  7. Chen, C.; Chen, Y.; Zhao, J.; Zhang, K.; Ni, M.; Ren, B. Data-Driven Resilient Automatic Generation Control Against False Data Injection Attacks. IEEE Trans. Ind. Inform. 2021, 17, 8092–8101. [Google Scholar] [CrossRef]
  8. Khalili, J.; Dehkordi, N.M.; Hamzeh, M. Distributed event-triggered secondary frequency control of islanded AC microgrids under cyber attacks with input time delay. Int. J. Electr. Power Energy Syst. 2022, 143, 108506. [Google Scholar] [CrossRef]
  9. Ameli, A.; Hooshyar, A.; El-Saadany, E.F.; Youssef, A.M. Attack Detection and Identification for Automatic Generation Control Systems. IEEE Trans. Power Syst. 2018, 33, 4760–4774. [Google Scholar] [CrossRef]
  10. Tabassum, T.; Lim, S.; Khalghani, M.R. Artificial intelligence-based detection and mitigation of cyber disruptions in microgrid control. Electr. Power Syst. Res. 2024, 226, 109925. [Google Scholar] [CrossRef]
  11. Raj, U.; Shankar, R.; Rani, S.; Ranjan, M. Enhanced load frequency regulation in cyberattack triggered grids with renewable energy and electric vehicles. Electr. Eng. 2024. [Google Scholar] [CrossRef]
  12. Mishra, A.K.; Mishra, P.; Mathur, H.D. A deep learning assisted adaptive nonlinear deloading strategy for wind turbine generator integrated with an interconnected power system for enhanced load frequency control. Electr. Power Syst. Res. 2023, 214, 108960. [Google Scholar] [CrossRef]
  13. Sah, S.V.; Prakash, V.; Pathak, P.K.; Yadav, A.K. Virtual inertia and intelligent control assisted frequency regulation of time-delayed power system under DoS attacks. Chaos Solitons Fractals 2024, 188, 115578. [Google Scholar] [CrossRef]
  14. IEEE Recommended Practice for Implementing an IEC 61850-Based Substation Communications, Protection, Monitoring, and Control System. In IEEE Std 2030.100-2017; IEEE: Piscataway, NJ, USA, 2017; pp. 1–67. [CrossRef]
  15. Zhang, G.; Li, J.; Bamisile, O.; Xing, Y.; Cai, D.; Huang, Q. An H∞ Load Frequency Control Scheme for Multi-Area Power System Under Cyber-Attacks and Time-Varying Delays. IEEE Trans. Power Syst. 2023, 38, 1336–1349. [Google Scholar] [CrossRef]
  16. Wang, Q.; Tai, W.; Tang, Y.; Ni, M. Review of the false data injection attack against the cyber-physical power system. IET Cyber-Phys. Syst. Theory Appl. 2019, 4, 101–107. [Google Scholar] [CrossRef]
  17. Liu, K.; He, J.; Luo, Z.; Shen, X.; Liu, X.; Lu, T. Secondary Frequency Control of Isolated Microgrid Based on LADRC. IEEE Access 2019, 7, 53454–53462. [Google Scholar] [CrossRef]
  18. Yuan, C.; Zhou, X.; Ma, Y. DC Bus Voltage Control of Wind Power Inverter Based on First-Order LADRC. IEEE Access 2022, 10, 3263–3274. [Google Scholar] [CrossRef]
  19. An, L.; Yang, G.H. Decentralized Adaptive Fuzzy Secure Control for Nonlinear Uncertain Interconnected Systems Against Intermittent DoS Attacks. IEEE Trans. Cybern. 2019, 49, 827–838. [Google Scholar] [CrossRef] [PubMed]
  20. Abualigah, L.; Abd Elaziz, M.; Sumari, P.; Geem, Z.W.; Gandomi, A.H. Reptile Search Algorithm (RSA): A nature-inspired meta-heuristic optimizer. Expert Syst. Appl. 2022, 191, 116158. [Google Scholar] [CrossRef]
  21. Raj, U.; Shankar, R. Optimally enhanced fractional-order cascaded integral derivative tilt controller for improved load frequency control incorporating renewable energy sources and electric vehicle. Soft Comput. 2023, 27, 15247–15267. [Google Scholar] [CrossRef]
Figure 1. Schematic representation of cyberattack on ACE in a multi-area NSG.
Energies 18 02899 g001
Figure 2. Modified IEEE 39-bus testbed.
Energies 18 02899 g002
Figure 3. Block diagram model of proposed controller.
Energies 18 02899 g003
Figure 4. Input-output membership function of proposed F-LADRC.
Energies 18 02899 g004
Figure 5. Proposed F-LADRC controller fuzzy rule.
Energies 18 02899 g005
Figure 6. Algorithm flowchart of novel QORSA technique.
Energies 18 02899 g006
Figure 7. Load and RES generation change in each area.
Energies 18 02899 g007
Figure 8. Comparison of proposed controller with other popular controllers.
Energies 18 02899 g008
Figure 9. Sensitivity analysis to system parametric changes.
Energies 18 02899 g009
Figure 10. Frequency and tie-line deviation for S2.
Energies 18 02899 g010
Figure 11. Wavelet decomposition for detection of attack data. (a) Area-1 frequency deviation, (b) Area-2 frequency deviation, (c) Tie-line power deviation.
Energies 18 02899 g011
Figure 12. Frequency and tie-line deviation for S3.
Energies 18 02899 g012
Table 1. IEEE 39-bus parameters.
ParameterSymbolValue
Governor constantTg1, Tg2, Tg30.15, 0.10, 0.10
Turbine constantTt1, Tt2, Tt30.30, 0.30, 0.30
Droop constantR1, R2, R30.05, 0.05, 0.05
Frequency bias factorB1, B2, B330, 28, 34
Inertia constantM1, M2, M335.8, 26.4, 34.5
Damping coefficientD1, D2, D310, 8, 14
Area capacity factora12, a23, a311.33, 1.00, 0.75
Table 2. Optimized controller parameters.
Controller ParameterPIDTIDI-PDLADRCF-LADRC
Area-1
KP10.58-0.28--
KI10.660.140.21--
KD10.450.640.32--
KT1-0.12---
b1---8.624.51
w1---1.381.47
Area-2
KP20.61-0.41--
KI20.540.190.11--
KD20.240.270.17--
KT2-0.37---
b2---8.144.11
w2---1.441.36
Area-3
KP30.81-0.24--
KI30.350.150.29--
KD30.140.130.13--
KT3-0.22---
b3---9.635.19
w3---1.611.57
Table 3. Comparison table for WT-LSTM and model-based observers.
AspectWT-LSTM FrameworkModel-Based Observers
Detection AccuracyHigh accuracy for nonlinear/time-varying anomalies; learns from data patternsModerate-to-high accuracy but sensitive to model mismatches
AdaptabilityEasily adaptable to changing operating conditions (retrainable)Fixed structure; needs re-tuning under system changes
Robustness to NoiseHaar wavelet preprocessing improves robustnessKalman filters may degrade under unmodeled noise
Model DependencyModel-free (requires only historical ACE data)Requires accurate system modeling and parameters
ComputationModerate (20–25 ms latency)Very low (1–5 ms) but may lack generalization
Table 4. Comparison table for WT-LSTM and blockchain-based approaches.
AspectWT-LSTM FrameworkBlockchain-Based Approaches
Detection Latency~25 ms per sampling intervalHigh (seconds to minutes due to consensus delays)
Resource UsageRequires only local computation and storageHigh storage/computation due to distributed ledger overhead
ScalabilityScalable to many areas with parallel LSTM unitsLimited by network and consensus bottlenecks
Security FocusDetects anomalies in real-time ACE behaviorEnsures data integrity and non-repudiation, but not real-time detection
Implementation ComplexityModerate (data + neural model)High (smart contracts, cryptographic protocols, node trust)
Disclaimer/Publisher’s Note: The statements, opinions and data contained in all publications are solely those of the individual author(s) and contributor(s) and not of MDPI and/or the editor(s). MDPI and/or the editor(s) disclaim responsibility for any injury to people or property resulting from any ideas, methods, instructions or products referred to in the content.

