1. Introduction
In recent years, there has been a growing interest in micro air vehicles (MAVs) driven by advancements in electronics and energy storage technologies. MAVs hold significant potential for military applications, particularly in environments where the risk to human life is high. Recently, a Japanese research group proposed aircraft-like devices specifically designed for Mars exploration. The low weight and small size of these devices, combined with the need for low-speed cruising, require them to operate in environments characterized by very low Reynolds numbers, typically ranging from 10
3 to 10
5 [
1,
2,
3,
4], and thus their dynamics differ significantly from those of conventional UAVs [
5].
Another category of devices operating within a similar Reynolds number range includes small-scale wind turbines used in wind tunnel experiments. These turbines often have rotor diameters of one meter or smaller [
6,
7]. The results obtained from such experiments are frequently scaled up to predict the performance of full-scale wind turbines, which can reach diameters of several hundred meters [
8,
9]. Propeller and wind turbine blades operating under unsteady inflow conditions are subject to oscillating loads and fluctuating angles of attack. For vertical-axis wind turbines (VAWTs), these oscillations are inherent and occur continuously during their operation [
10].
In low-Reynolds-number flows, laminar boundary layer separation occurs, which leads to the formation of laminar separation bubbles through transition to turbulence. The size of these bubbles can vary depending on the angle of attack and Reynolds number, both of which influence the characteristics of flow separation [
11,
12].
Generally, laminar separation bubbles can be classified into two types: short and long. Short bubbles decrease in length with increasing angle of attack and can cause significant flow instability. However, the study of these phenomena is time-consuming and computationally demanding, as it often requires advanced numerical approaches such as Direct Numerical Simulation (DNS) or Large-Eddy Simulation (LES), which are typically performed on supercomputers [
1,
13]. In recent years, several studies have employed both Large-Eddy Simulation (LES) and Direct Numerical Simulation (DNS). Due to the significant computational costs, these studies have primarily focused on thin airfoils. The results confirmed the formation of short laminar separation bubbles at low Reynolds numbers and their impact on the nonlinearity of the lift forces. However, the current state of knowledge still does not fully explain the causes of these nonlinearities.
One alternative method for studying transition phenomena in low Reynolds number flows involves the use of modern models designed to capture the laminar-to-turbulent transition. Prior to the introduction of transition turbulence models, engineers primarily relied on turbulence models that treated the entire boundary layer as fully turbulent. Traditional turbulence models, such as those from the k-ω or k-ε families, fail to predict the nonlinear behavior of the C
L below the critical angle of attack [
14]. For applications in aeronautics, where the Reynolds numbers typically reach several million or higher, neglecting the transition effects is often sufficient due to the dominance of turbulent boundary layers. One reason for the omission of transition effects in traditional turbulence models is the complexity and variability of the transition mechanisms. Another key limitation is the absence of appropriate methods to describe transition flows, including both linear and nonlinear effects, within the framework of Reynolds-averaged Navier–Stokes (RANS) equations.
Among the more recent advancements in modeling transition phenomena is the correlation-based γ-Re
θ model, also known as the Transition SST turbulence model [
15,
16]. This model predicts the transition based on local flow conditions by solving transport equations that account for these conditions. In contrast, earlier transition models, such as the e
N method proposed by Smith and Gamberoni [
17], relied on global flow parameters and were challenging to implement in modern general-purpose CFD software. While these older models could yield reasonable transition predictions for airfoil analysis in homogeneous flows, they were less effective for more complex cases.
Several studies have validated the effectiveness of the Transition SST turbulence model in capturing transition phenomena at low Reynolds numbers. Melani et al. [
14] compiled a wide range of experimental and numerical data on the aerodynamic performance of the NACA 0018 airfoil at low and moderate Reynolds numbers. Their findings reveal that as the Reynolds number decreases, the discrepancies in aerodynamic force predictions increase, particularly in the range of Reynolds numbers from 40,000 to 160,000. Melani et al. [
14] also provided lift force characteristics for a Reynolds number of 150,000, obtained using the Transition SST model. These results, which are also available in [
18], show excellent agreement with experimental data for angles of attack up to 6 degrees.
A significant challenge for the Transition SST model is accurately estimating the dynamic characteristics of the pitching NACA 0018 airfoil under very low Reynolds number conditions.
Theodorsen and Glauert made groundbreaking contributions to the understanding of unsteady aerodynamics, particularly with respect to pitching airfoils [
19,
20,
21]. They provided foundational insights into the behavior of two-dimensional harmonically oscillating airfoils in inviscid and incompressible flows that were subjected to small disturbances. Theodorsen’s analytical framework remains a key reference for the performance analysis of both fixed-wing and rotating-wing systems, serving as a basis for further advancements in unsteady aerodynamics.
Theodorsen’s theory has several important limitations: it does not account for flow viscosity, is tailored specifically for thin airfoils, and lacks the capability to predict drag forces. Furthermore, at low Reynolds numbers, flows tend to separate prematurely, even at modest angles of attack, which further restricts the applicability of the theory under such conditions. Despite these limitations, Theodorsen’s framework has been adapted to address various aerodynamic challenges, including sudden changes in the angle of attack, sinusoidal gust responses, and the dynamics of returning wakes [
22].
A key parameter for characterizing the behavior of an airfoil undergoing harmonic oscillations is the reduced frequency,
, defined as
, where
c represents the chord length,
V0 is the free-stream velocity, and ω denotes the angular frequency of oscillation. When
k = 0, the flow is considered to be steady. For cases where unsteady effects are minimal, the reduced frequency lies in the range
0 < k ≤ 0.05. As
k increases beyond 0.05, the flow transitions into the unsteady regime, and when
k ≥ 0.2, the flow is classified as highly unsteady, exhibiting significant deviations from quasi-steady behavior [
21,
23]. In this study, the oscillation frequencies are reported in physical units (Hz) to align with the operating characteristics of a real Darrieus-type wind turbine rotor. However, the corresponding reduced frequencies
k are also calculated and discussed throughout the manuscript to ensure compatibility with the non-dimensional analyses.
Theoretical studies similar to those presented in this paper, focusing on a two-dimensional flat plate undergoing harmonic pitching oscillations (without plunging motion) about the quarter-chord within a Reynolds number range of 10
4–10
5 and reduced frequencies between 0.001 and 0.3, were conducted by Badrya et al. [
19] The authors aimed to analyze the influence of viscosity on flow behavior and the generation of aerodynamic forces and moments. Additionally, they compared the results obtained for a flat plate with those obtained for a thin NACA 0012 airfoil. Badrya et al. [
19] also employed Theodorsen’s theory and observed significant discrepancies between its predictions and numerical results. These differences were particularly pronounced at low Reynolds numbers and were attributed to the inability of the theory to account for viscous effects. Furthermore, for the NACA 0012 airfoil, it was found that this airfoil failed to generate sufficient pressure differences between the upper and lower surfaces, resulting in very low maximum lift coefficients.
Another notable study on pitching motions at low Reynolds numbers was conducted by Stevens and Babinsky [
24]. They investigated the behavior of a flat plate undergoing harmonic pitching oscillations with a high reduced frequency of 0.394 at a Reynolds number of 20,000. Their work combined experimental measurements with a reduced-order model that incorporated both circulation and vortex advection velocities, as informed by the experimental data. This approach highlights the significance of including unsteady aerodynamic effects when modeling such flows.
Moreover, Brunton and Rowley [
25] demonstrated the applicability of Theodorsen’s classical theory [
19] in predicting the lift for attached flows during pure pitching motion. They concluded that for scenarios dominated by non-circulatory and circulatory effects, Theodorsen’s model provides a reasonable approximation despite its limitations in capturing vortex dynamics. These studies collectively underscore the complexity of flow behavior at low Reynolds numbers and the challenges in bridging the theoretical predictions with experimental results.
The interplay between geometry, kinematics, Reynolds numbers, and three-dimensional effects significantly influences the aerodynamic forces and flow structures around pitching and plunging flat plates at low Reynolds numbers, as demonstrated by Kang et al. [
26]. Shallow- and deep-stall motions reveal dominant geometric effects, such as massive leading-edge separation on sharp-edged flat plates that overshadow viscosity-related influences. Compared to blunter airfoils like the SD7003, flat plates exhibit earlier and stronger leading-edge vortex formation, resulting in enhanced lift and drag characteristics under similar conditions.
Moriche et al. [
27] analyzed the stability of a plunging and pitching wing with an infinite aspect ratio at low Reynolds numbers. By varying the mean pitch angle and phase shift between pitching and plunging, they identified cases that produced different aerodynamic forces and wake structures. Notably, one configuration exhibited a period-doubling phenomenon and was linearly unstable, leading to a fully three-dimensional wake downstream. Despite this, the aerodynamic forces in the three-dimensional simulations remained consistent with those in the two-dimensional simulations.
The current study aims to bridge the knowledge gap in understanding the aerodynamic performance of thick airfoils, such as NACA 0018, under low Reynolds number regimes with harmonic pitching motions. Specifically, the research focuses on a pitching motion frequency of 13.3 Hz, motivated by the operational characteristics of Darrieus vertical-axis wind turbines (VAWTs). These turbines, including the rotor tested in the TU Delft wind tunnel [
6], provide a unique context in which laminar separation bubbles and oscillatory aerodynamic forces significantly influence performance. By employing advanced turbulence modeling techniques, such as the γ-Re
θ transition and k-ω SST models, and comparing the numerical predictions with experimental data, this study aims to unravel the dynamics of hysteresis loops, laminar separation bubbles, and turbulence effects. These findings contribute to a deeper understanding of aerodynamic force oscillations and their dependence on Reynolds numbers, thereby supporting the optimization of thick airfoils for a wide range of engineering applications.
2. The Harmonic Pitching NACA 0018 Airfoil
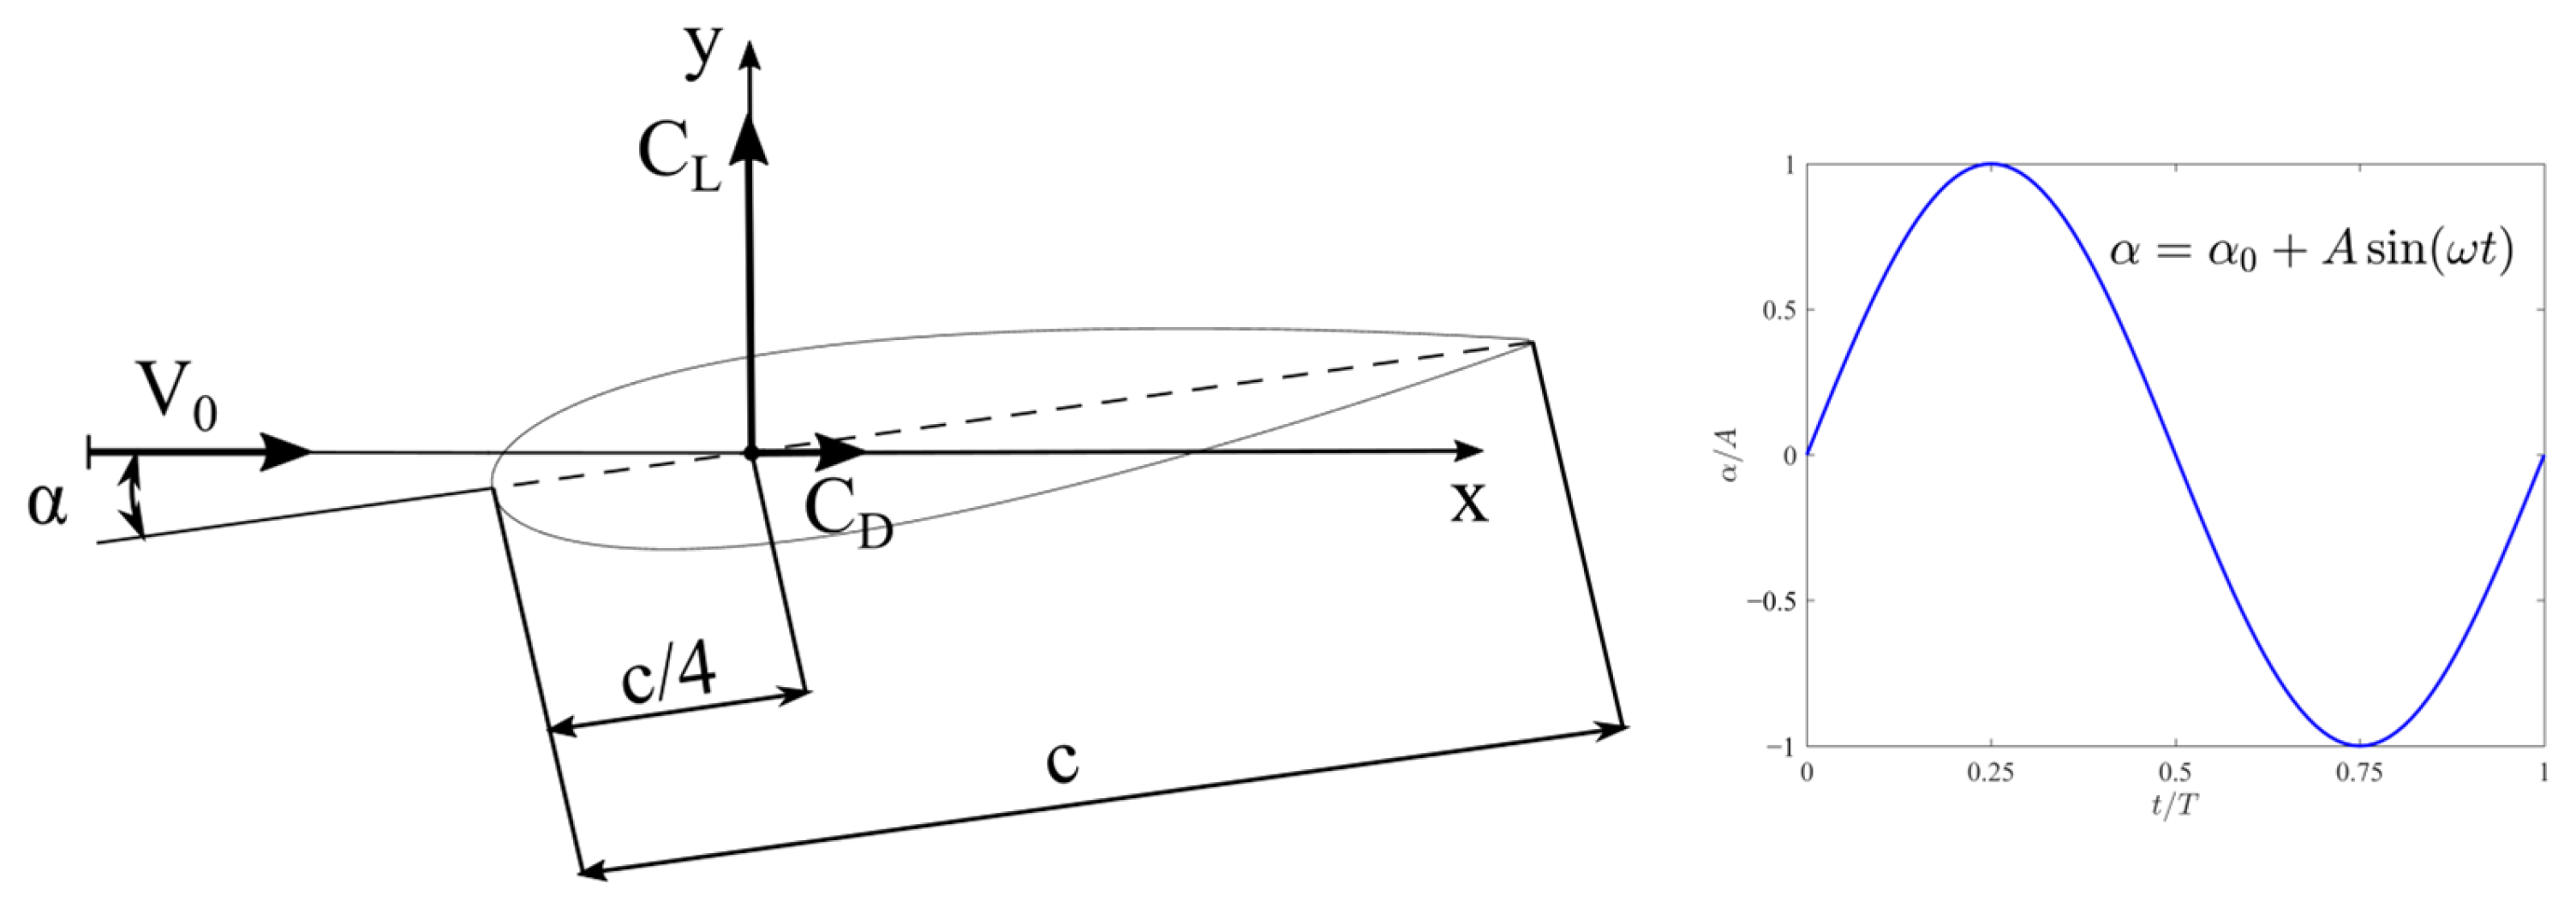
The concept of pure pitching motion for the NACA 0018 airfoil is illustrated in
Figure 1. The symmetric NACA 0018 airfoil oscillates harmonically according to a sinusoidal function (also shown in the figure) about a pivot point located on the chord at a distance of c/4 from the leading edge. The chord length, denoted as c, is also depicted in the sketch and is 6 cm.
The oscillation frequency is denoted by f, with the corresponding period T, angular frequency ω, and amplitude A. The origin of the coordinate system is defined at the quarter-chord point, measured from the leading edge. The constant pitch angle is represented as α0. In this study, only cases with α0 = 0° are considered.
It is important to clarify that, in this study, the angle of attack is directly defined by the prescribed pitch angle. Since the airfoil performs pure harmonic pitching around the quarter-chord axis, with no plunging motion or flow curvature effects, the angle of attack is equal to the instantaneous pitch angle. Consequently, no separate calculation of the angle of attack is performed for the flow field.
2.1. Simulation Setup and Turbulence Modeling
The lift coefficient (CL) and drag coefficient (CD) used in this study are defined as follows:
where
L and
D are the lift and drag forces acting on the airfoil,
ρ is the fluid density,
V0 is the free-stream velocity and is the chord length of the airfoil. These non-dimensional coefficients were evaluated at each time step based on the instantaneous aerodynamic forces computed from the surface pressure and shear stress distributions.
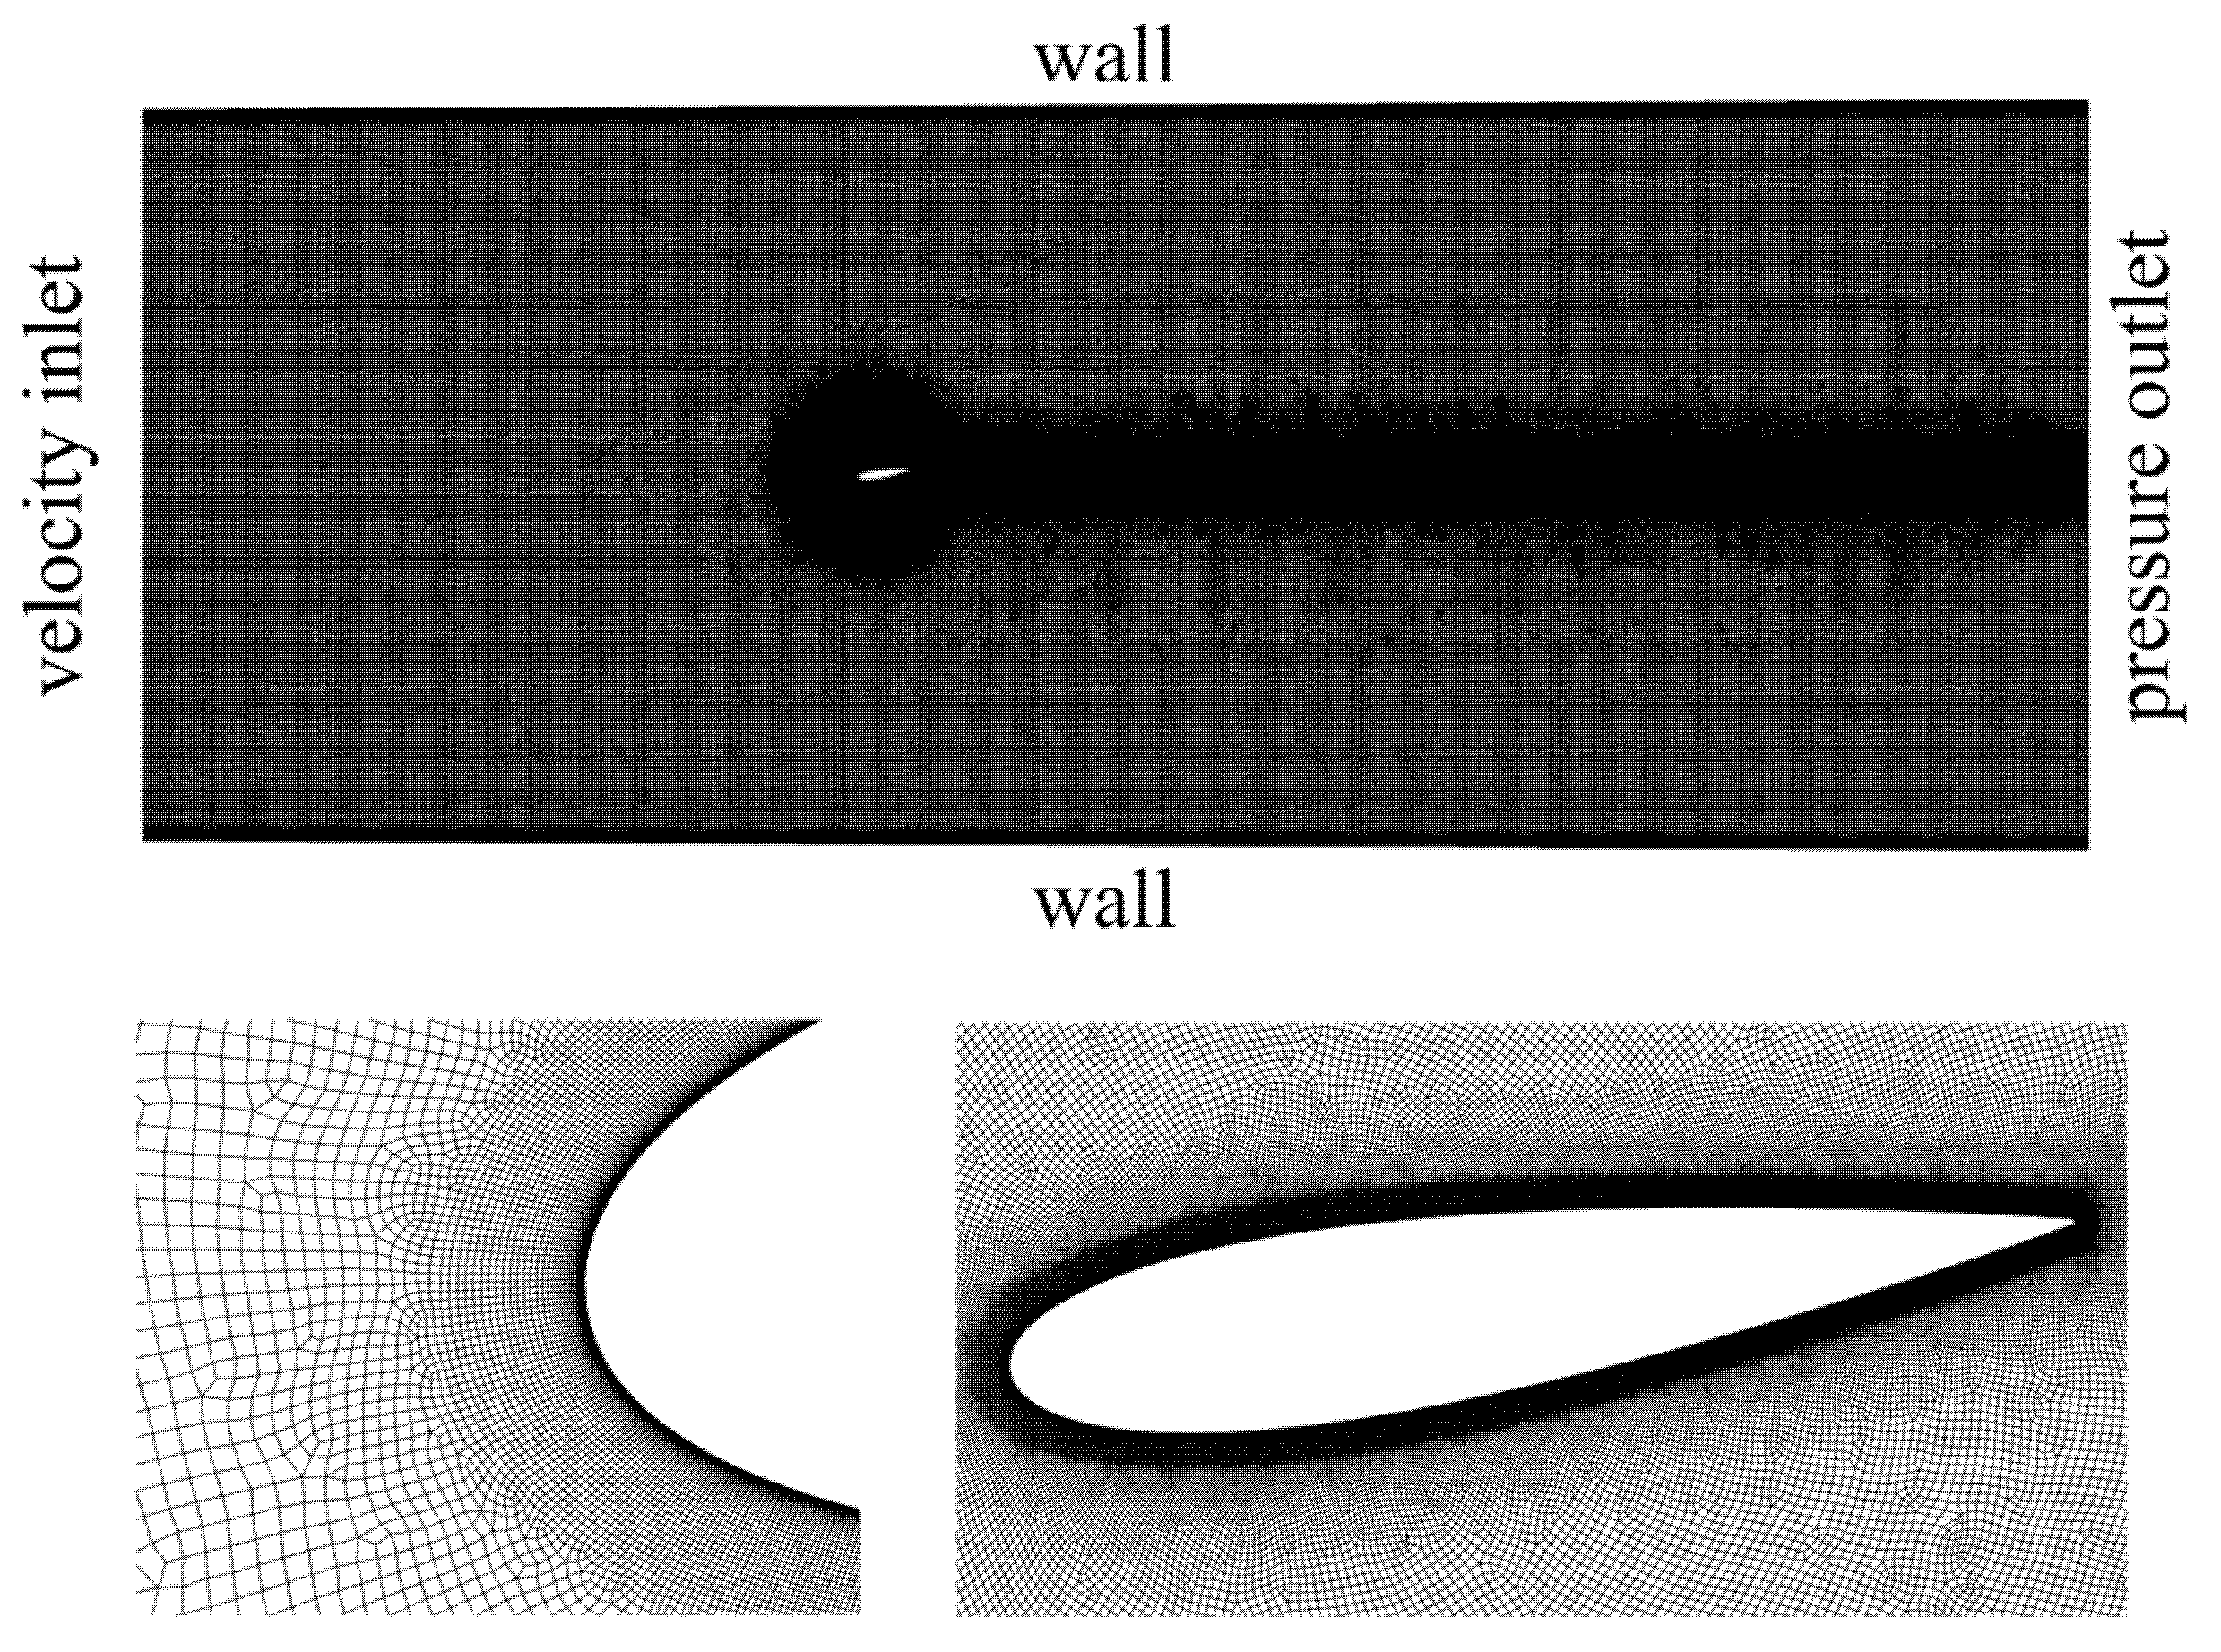
All numerical simulations summarized in this paper were conducted using the unsteady Reynolds-averaged Navier–Stokes (URANS) approach. The computational domain was developed based on the working section of the Red Wind Tunnel (RWT) at the TU Delft.
The test section of the wind tunnel measures 2000 mm in length and 500 mm in height. Its width gradually increases from 750 mm at the inlet to 770 mm at the outlet. This slight expansion compensates for the boundary layer growth along the walls and ensures an almost zero pressure gradient in the empty tunnel. The turntable center is positioned 750 mm from the inlet. Additional details regarding the experimental setup and settings can be found in [
28].
The URANS approach employed in these simulations required one of two methods: a dynamic or sliding mesh. Although the sliding mesh method is less computationally demanding, it necessitates the definition of an additional domain surrounding the oscillating foil. In our model, a circular domain with a diameter of two chord lengths was considered around the airfoil, with its center coinciding with the origin of the defined coordinate system [
29]. This moving subdomain, surrounding the pitching airfoil, was embedded within the stationary outer domain using the sliding mesh technique. As a result, the grid around the airfoil dynamically adjusted its position at each time step in accordance with the airfoil’s motion.
The solver used was pressure-based and transient, with air as the working fluid. Air was modeled with a constant density of ρ = 1.225 kg/m
3 and a constant viscosity of μ = 1.7895 × 10
−5 kg/(ms). The boundary conditions were specified as follows: a velocity inlet at the left vertical edge of the domain, a pressure outlet at the right edge of the tunnel, and no-slip walls along both the tunnel walls and airfoil surface [
30].
As noted earlier, the sliding mesh approach was utilized in this study. This method requires the creation of two regions: a stationary region and a moving region that oscillates with the airfoil. An interface was defined at the boundary between the two regions to facilitate their interaction.
For the numerical solution of the momentum equations and turbulence model equations, a second-order upwind discretization scheme was employed, along with a least-squares cell-based gradient evaluation. Pressure-velocity coupling was achieved using the SIMPLE algorithm. The residuals for all the equations were maintained at a level of 10
−7. In the transient simulations, the maximum number of iterations per time step was set to 20. The time step size corresponded to an angular step size of 0.5°, which was sufficient to achieve a satisfactory azimuthal resolution within the prescribed iteration limit per time step [
30]. The turbulence intensity at the domain inlet was set to 0.1%, corresponding to the free-stream conditions observed in the TU Delft Red Wind Tunnel. This value was chosen to represent a low-turbulence environment suitable for studying laminar-to-turbulent transition phenomena.
All simulations were performed using 24 parallel computing cores (Intel Haswell, Cray XC40 supercomputer Okeanos in ICM Warsaw). For the Transition SST model, the solver achieved a speed of approximately 40 time steps per minute. The k-ω SST model converged slightly faster due to its simpler formulation with only two transport equations.
This study focuses on the flow over a thick airfoil at low Reynolds numbers, where the formation of laminar separation bubbles plays a significant role in determining the aerodynamic characteristics. These bubbles can notably impact lift and drag, making their accurate prediction essential for understanding flow behavior.
To accurately capture the complex flow phenomena associated with laminar separation bubbles, the Transition SST turbulence model, also known as the γ-Re
θ model, is employed in this study. Developed by Langtry [
15] and Menter et al. [
31], this model builds upon the widely used k-ω Shear Stress Transport (SST) framework by introducing two additional transport equations: one for the momentum-thickness Reynolds number, Re
θ, and another for intermittency, γ. These enhancements enable precise prediction of the laminar-to-turbulent transition, which is crucial for flows influenced by separation bubbles.
Implemented in the ANSYS Fluent 2024 R1 solver, the Transition SST model employs a correlation-based approach reliant on local flow variables, making it suitable for a wide range of engineering applications. By simultaneously resolving the turbulent kinetic energy, its dissipation rate, and transition-specific parameters, this model provides a more accurate representation of the flow physics. Comprehensive details of the model formulation can be found in the works of Langtry [
15] and Menter et al. [
31]. The following equations summarize the transport models used in this study. For the k-ω SST turbulence model:
and for the γ-Re
θ turbulence model:
In addition to the γ-Reθ approach, for comparison purposes, certain cases were also computed using the well-known two-equation k-ω Shear Stress Transport (SST) turbulence model to highlight the differences between the two modeling approaches.
2.2. Numerical Mesh
The computational domain, shown in
Figure 2, was discretized using a hybrid mesh comprising a structured mesh near the airfoil edges and tunnel walls and an unstructured mesh in the remaining regions. The application of a structured mesh is essential for accurately resolving the flow in the boundary layer near the wall surfaces. The mesh on the airfoil surface consists of a total of 1669 nodes: 830 nodes along the upper edge, 830 along the lower edge, and nine nodes at the trailing edge. A uniform element distribution was employed. A structured mesh near the airfoil edges was constructed with 37 layers and a growth rate of 1.13 in the direction normal to the surface. The thickness of the first wall-adjacent element was set to 5 × 10
−6 m. This resolution was validated by the authors and adhered to the recommendations of ANSYS Fluent v2024. The thickness of the first element ensures that the wall y
+ criterion y
+ ≤ 1.0 is satisfied for all cases considered in this study. At the interfaces, a uniform element size of 5 × 10
−4 m was used. For the tunnel walls, a structured mesh was applied with the following parameters: thickness of the first element of 5 × 10
−6 m, 40 layers in the normal direction, and an element growth rate of 1.2. Similar to the structured mesh around the airfoil edges, these parameters are consistent with ANSYS Fluent guidelines and meet the wall y
+ criterion [
30]. In the unstructured mesh, the moving domain surrounding the airfoil employed elements with a size of 5 × 10
−4 m. In the stationary domain, the element size was 4 × 10
−3 m. Additionally, a smaller region within the stationary domain, extending 1 chord length (1c) from the interface to the outlet edge of the tunnel, was defined. This modification was performed to better resolve the flow in the wake region. In this additional region, the element size was 2 × 10
−3 m. The chosen element sizes were sufficient, even for the LES simulations [
32,
33]. The nominal mesh designed in this manner comprises a total of 285,016 nodes and 282,934 elements.
A mesh sensitivity analysis was conducted to evaluate the influence of the grid resolution on the numerical solution. This test was performed for a stationary case, where the frequency of the pitching motion of the NACA 0018 airfoil was set as zero.
The analysis was carried out at a fixed angle of attack of 8° and at the highest Reynolds number considered in this study, that is, Re = 160,000. Four different meshes were used: two coarser meshes with the number of nodes reduced by factors of √2 and 2 compared with the nominal mesh, and one finer mesh with the number of nodes on the airfoil surface increased by a factor of √2 relative to the nominal configuration.
The lift and drag coefficients as functions of the number of nodes on the airfoil surface are shown in
Figure 3. The results clearly indicate that the lift coefficient is independent of the grid resolution, while the drag coefficient exhibits minimal sensitivity to the number of nodes. In other words, increasing the number of nodes beyond the nominal mesh resolution does not enhance the accuracy of the computed aerodynamic loads but merely increases the computational cost.
The flow simulations around the NACA 0018 airfoil, even for the “no pitch” case and at low angles of attack, required the use of the unsteady Reynolds-averaged Navier-Stokes (URANS) approach with the advanced γ-Re
θ transition model. This is due to the high temporal variability of the physical phenomena occurring within the boundary layer near the airfoil surface. The application of the URANS approach necessitates the definition of a time step [
11].
In this work, the SIMPLE (Semi-Implicit Method for Pressure-Linked Equations) algorithm was utilized. In SIMPLE, there is no need to set the Courant–Friedrichs–Lewy (CFL) condition because SIMPLE is an iterative method that is not directly dependent on the time-step size. Instead, SIMPLE operates based on quasi-static computations, where the pressure and velocity equations are solved iteratively until convergence is achieved. As a result, the stability of the solution is not directly affected by the time step size or the CFL number. This makes the SIMPLE method “unconditionally stable” in a numerical sense [
30].
The time step applied for the “no pitch” case was 0.001 s. For cases in which the pitch motion was greater than zero, the time step was set to 1/720 of the period. Specifically, for a frequency of 1 Hz, the time step was 0.001388 s, whereas for a frequency of 2 Hz, the time step was 0.0006944 s.
3. Aerodynamic Load Analysis for the Pitching NACA 0018 Airfoil
3.1. Aerodynamic Load Analysis for 0 Hz Pitching Motion
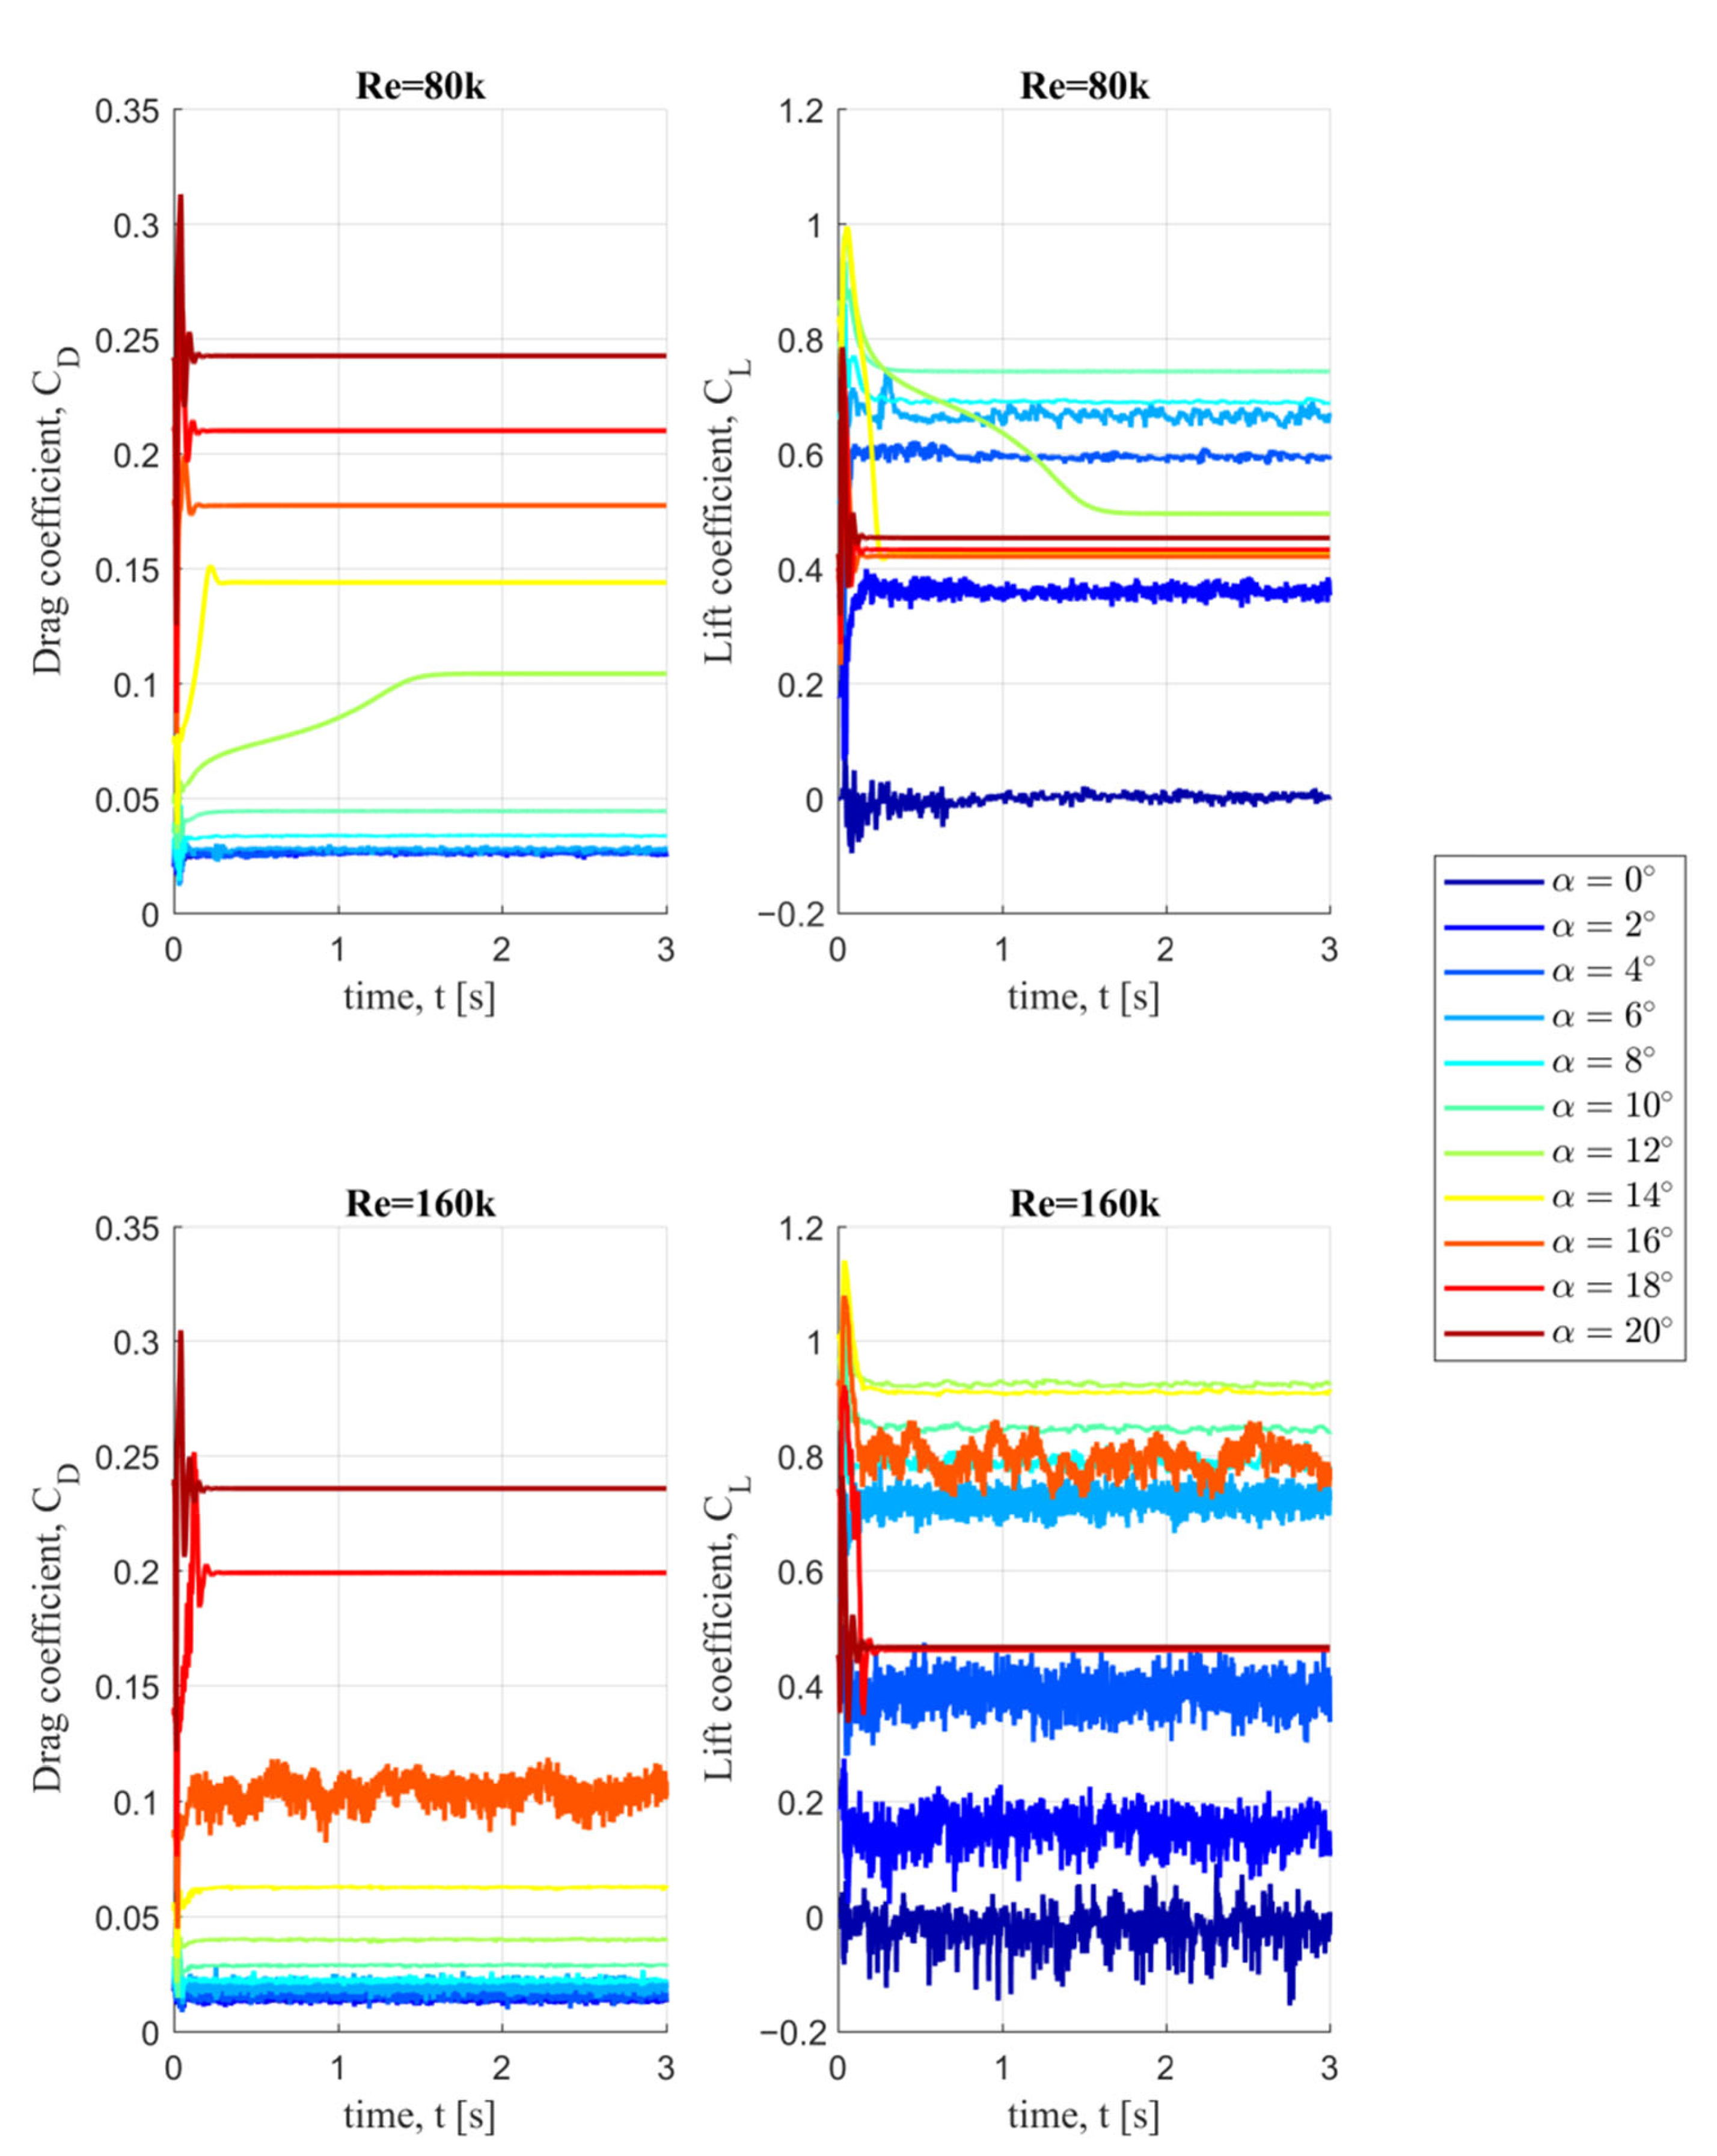
Figure 4 presents the aerodynamic characteristics C
L and C
D as functions of the angle of attack α for the NACA 0018 airfoil. The analysis was conducted for two Reynolds numbers, Re = 80k and Re = 160k. Numerical simulations were performed over an angle of attack range of 0° to 20° to capture the stall point. Although the results represent steady aerodynamic characteristics, they were obtained using the URANS approach and averaged over the last second of the simulation.
The primary turbulence model used in this study was a four-equation γ-Re
θ transition model. For comparison, a two-equation k-ω SST turbulence model was employed. Additionally, experimental data obtained by the authors in a low-turbulence wind tunnel at the Technical University of Denmark were included. The experimental results, along with data from the well-known XFOIL tool, were summarized by Rogowski et al. [
28].
The figure highlights the strong sensitivity of the aerodynamic forces to the Reynolds number. Notably, the experimental lift coefficient C
L exhibits nonlinear behavior below the critical angle of attack. As proposed by Rogowski et al. [
28], this nonlinearity arises from the presence and evolution of the laminar separation bubbles. These bubbles increase the lift at low angles of attack but also significantly increase the drag. A decrease in the Reynolds number by half reduces C
Lmax from 1.027 at α = 13.99° to 0.803 at α = 7.95°. Interestingly, at α = 3.96°, the lift coefficient is higher at the lower Reynolds number, with values of 0.406 for Re = 160k and 0.578 for Re = 80k.
These physical phenomena are challenging to model numerically. The least accurate results were obtained with the fully turbulent k-ω SST model, which produces linear lift characteristics up to the critical angle. However, at Re = 160k and low angles of attack (up to 3°–4°) as well as near the critical angle (12°–14°), the discrepancies in lift and drag are less significant. Despite overestimating the drag coefficients at Re = 160k, the drag coefficient for the SST model converged more closely to the experimental values at lower Reynolds numbers, with a deviation of only 15.6% at Re = 80k. This can be attributed to the increased boundary layer interactions at lower Reynolds numbers, leading to a higher form drag.
XFOIL demonstrates a similar trend for lift, with higher coefficients at lower angles of attack for lower Reynolds numbers. However, the CLmax predicted by XFOIL is overestimated compared to the experimental results across the entire angle of attack range. This overprediction may stem from the lack of calibration of XFOIL for thick airfoils, as the model was initially developed for flat plates. Additionally, this study did not examine the effect of the transition parameter N, which was set to a default value of 9. While appropriate for low-turbulence wind tunnels, even slight changes in turbulence intensity at low Reynolds numbers can significantly affect aerodynamic characteristics. Interestingly, XFOIL predicts a minimum drag coefficient at a nonzero angle of attack, with the drag decreasing slightly (by about 8%) as α increased from 0° to 4° at Re = 80k.
As mentioned in
Section 2.2, when analyzing the flow around a clean airfoil under low Reynolds number conditions, even in the “no pitch” scenario, a transient approach must be considered due to the unsteady phenomena occurring within the boundary layer.
As discussed in the Introduction, the magnitude and frequency of these unsteady phenomena depend on the Reynolds number and the angle of attack. In practice, the magnitude of these unsteady effects manifests as oscillations in the aerodynamic forces, both in terms of their amplitude and frequency. As shown in
Figure 5, the largest oscillations in the lift coefficient (C
L) are observed at a Reynolds number of 160k, particularly at angles of attack up to 8°. These oscillations decrease around the stall angle but begin to grow again at higher angles of attack. A similar behavior is observed for the drag coefficient (C
D), although its oscillation amplitudes are significantly smaller. In contrast, for a Reynolds number of 80k, the oscillations in the aerodynamic forces are much smaller. The aerodynamic characteristics C
L and C
D shown in
Figure 4 represent the time-averaged values of C
L (time) and C
D (time) (
Figure 5) over the last second of the simulation.
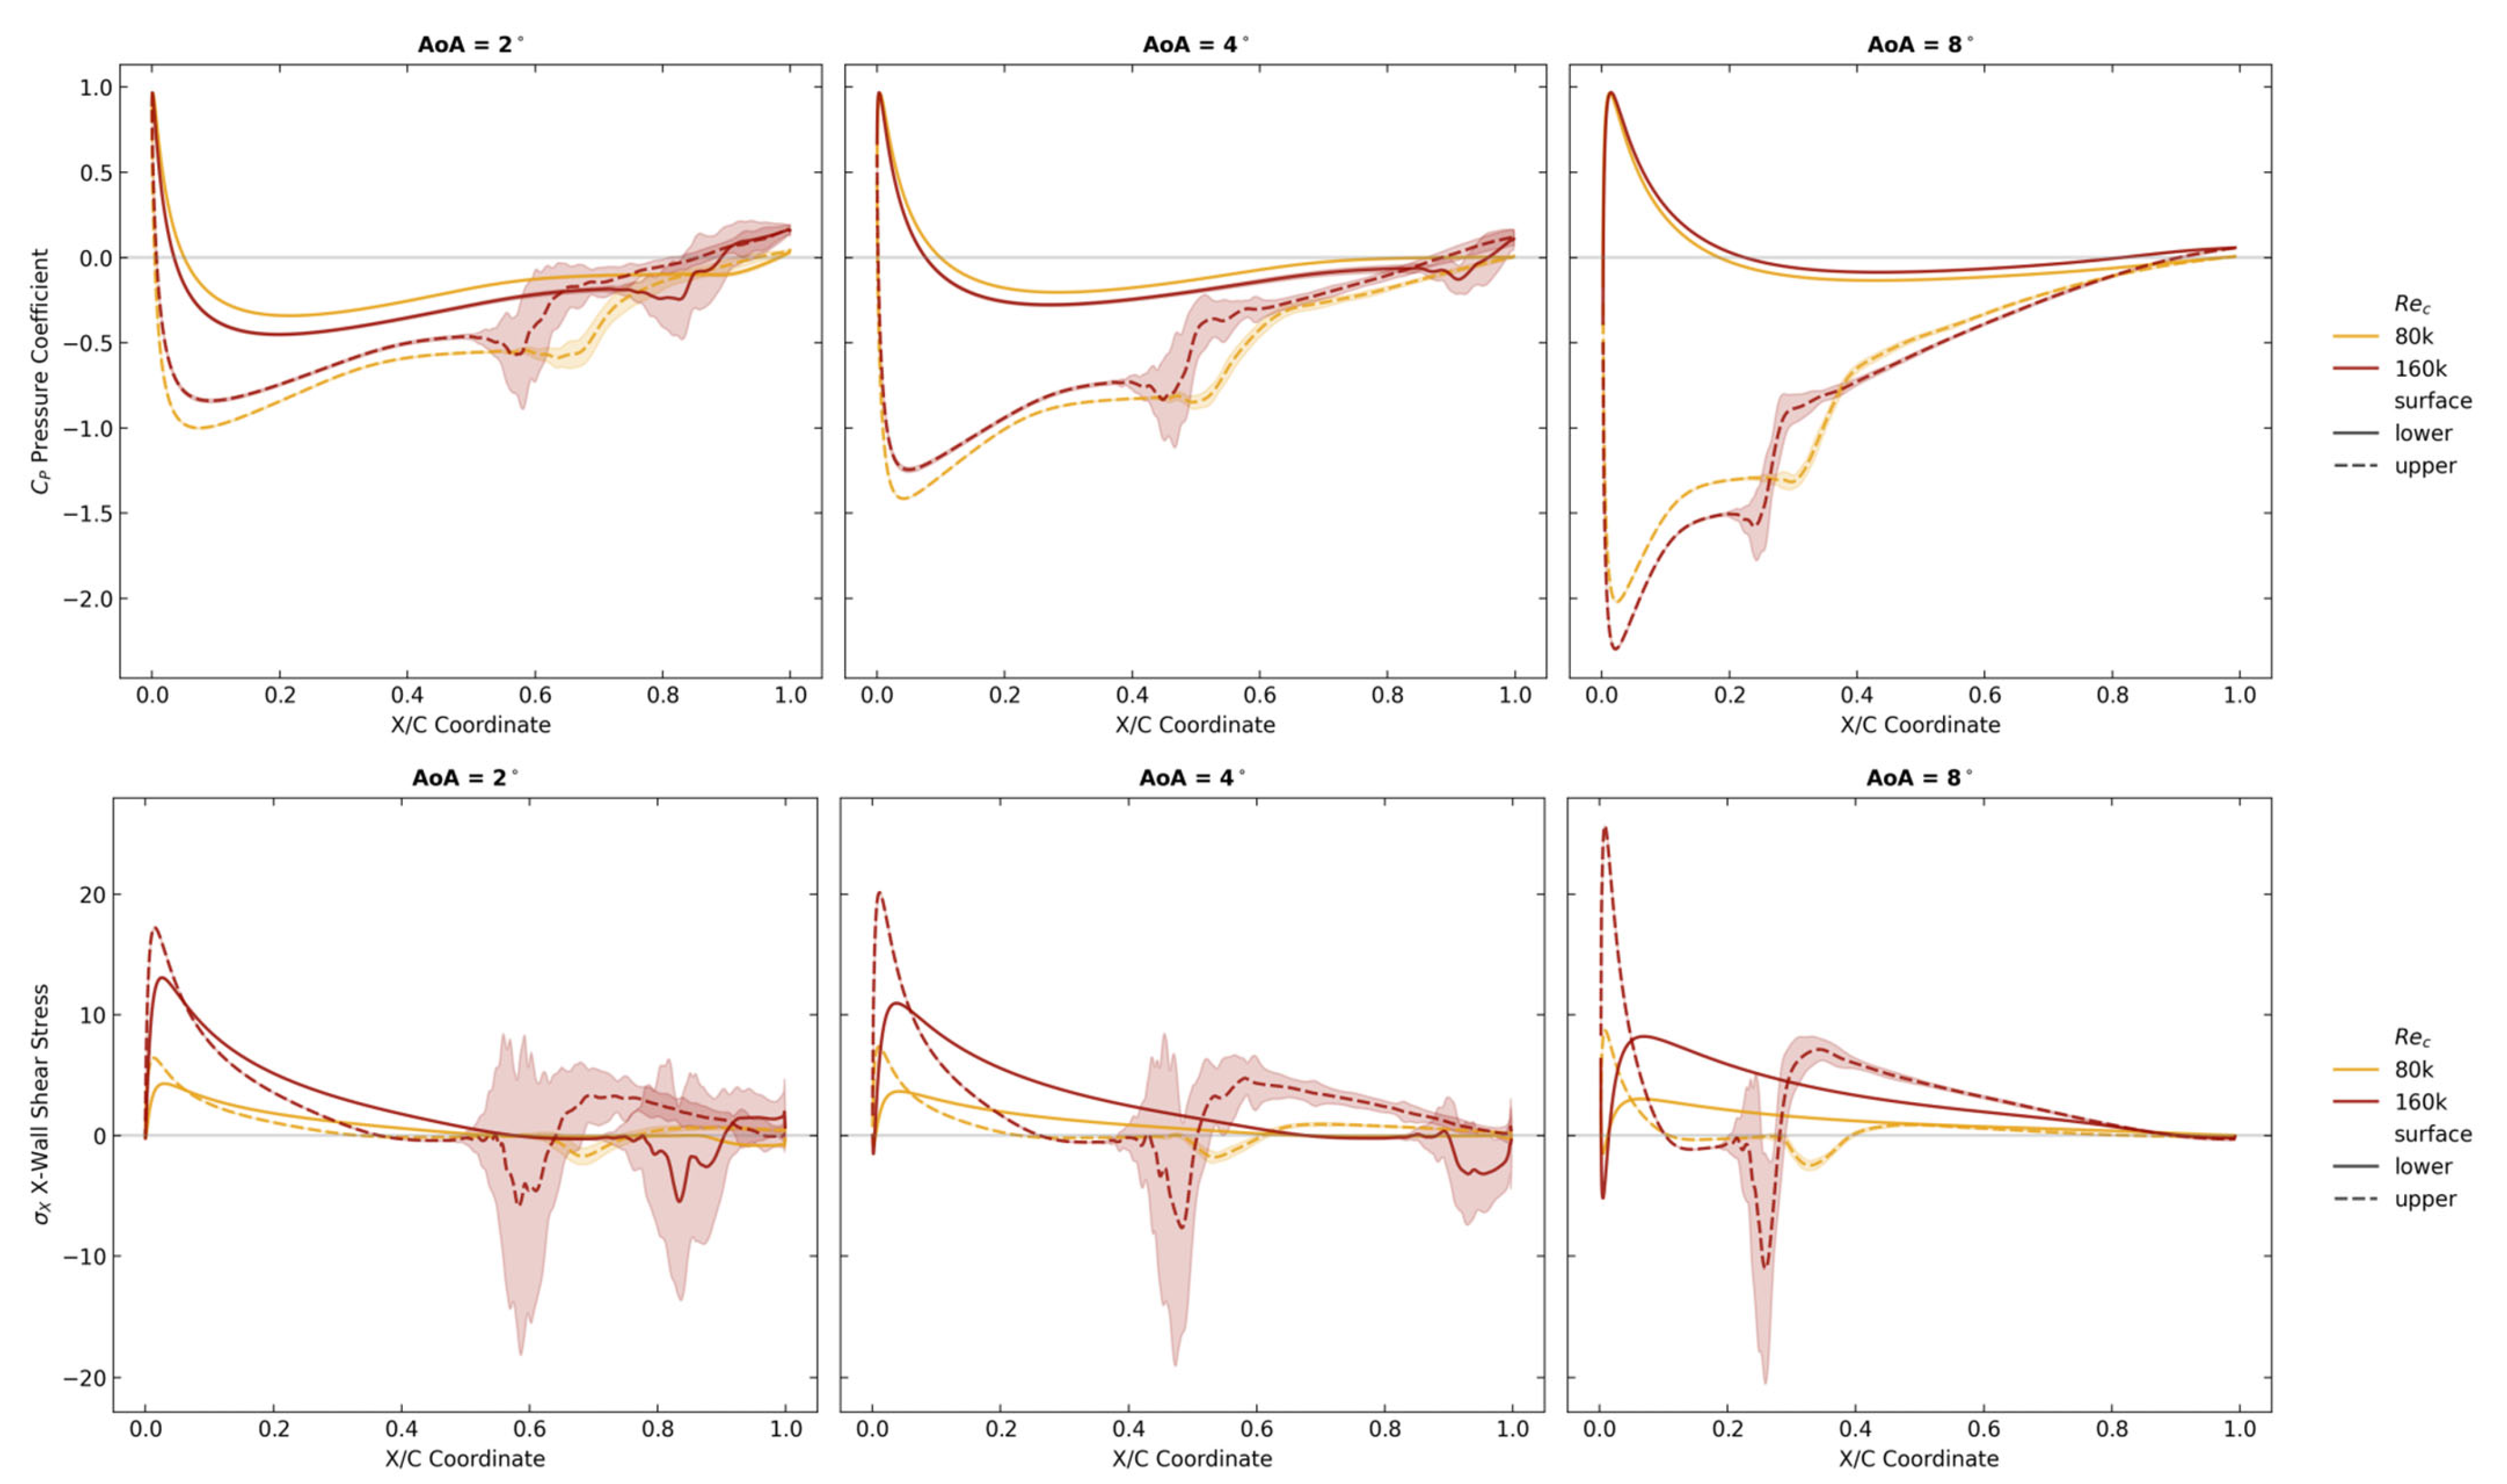
Figure 6 compares the pressure coefficient (C
p), and
x-wall shear stress distributions along the chordwise coordinate (x/c) for the two examined Reynolds numbers and three representative angles of attack (2°, 4°, and 8°). These plots confirm that, for a Reynolds number of 160k, the intensity of the laminar separation bubbles is significantly higher than that at Re = 80k. Furthermore, at lower angles of attack, the bubbles shift closer to the airfoil leading edge.
3.2. Aerodynamic Load Analysis for 1 Hz Pitching Motion
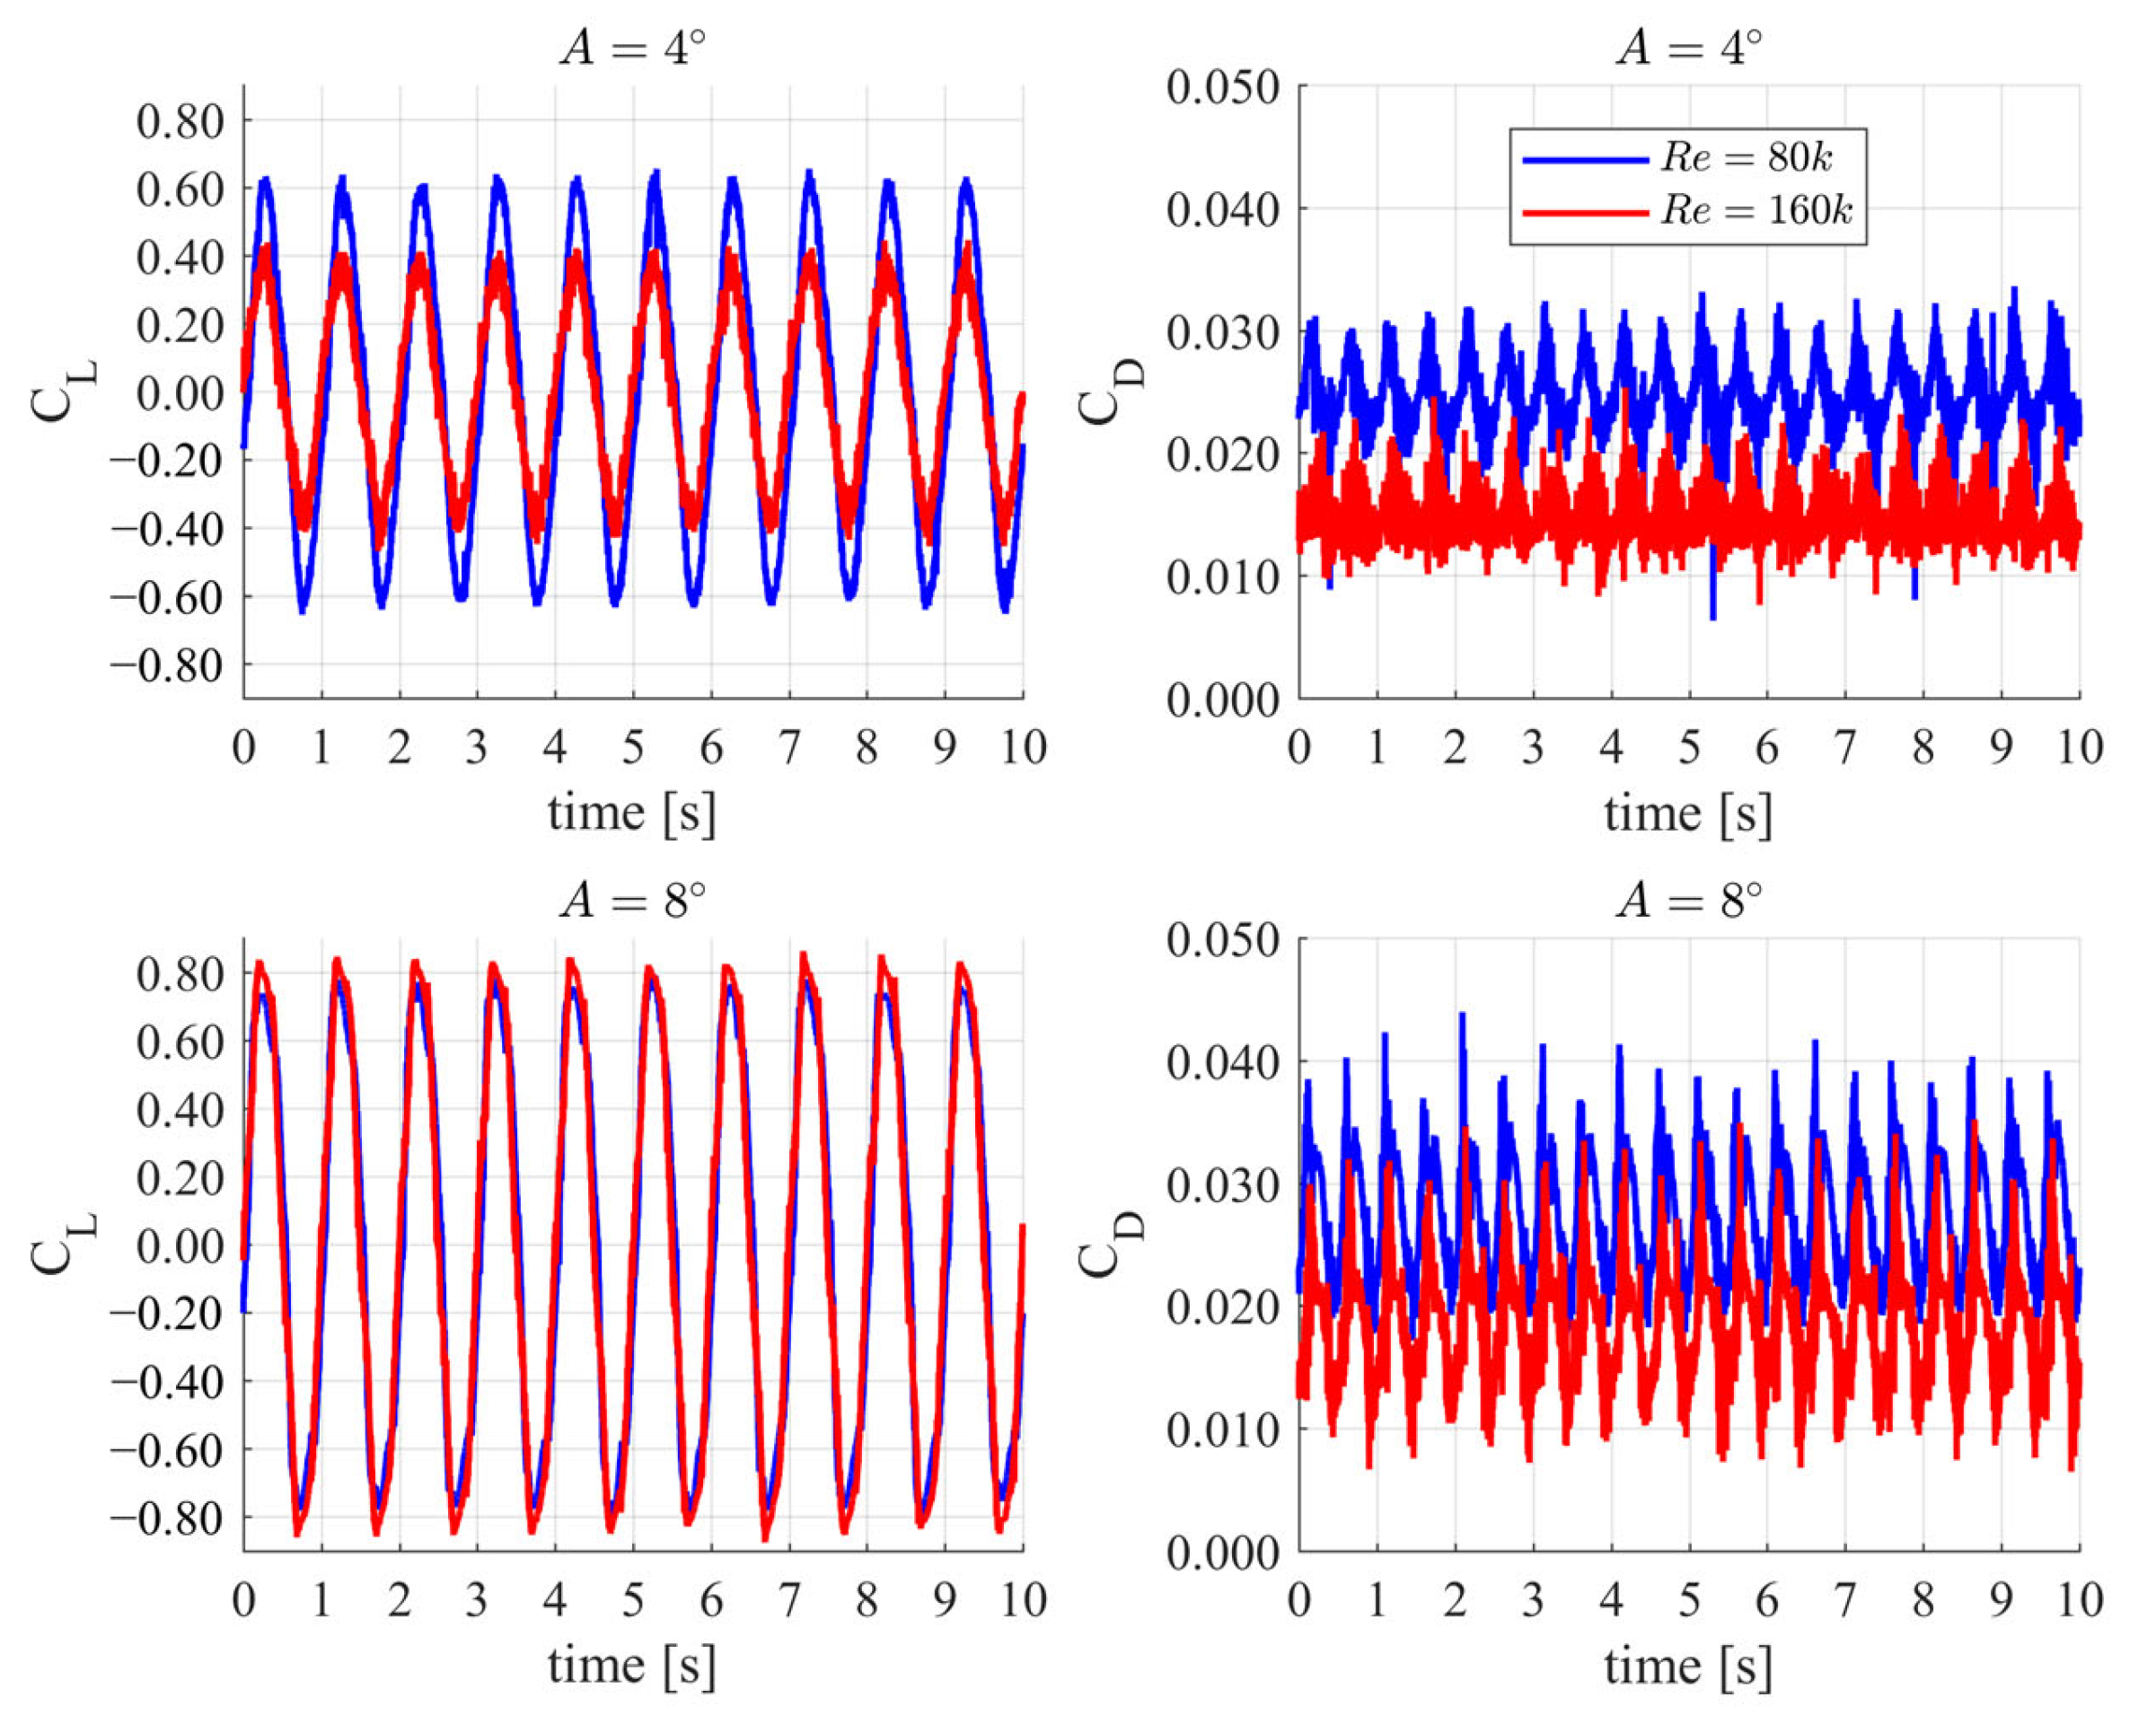
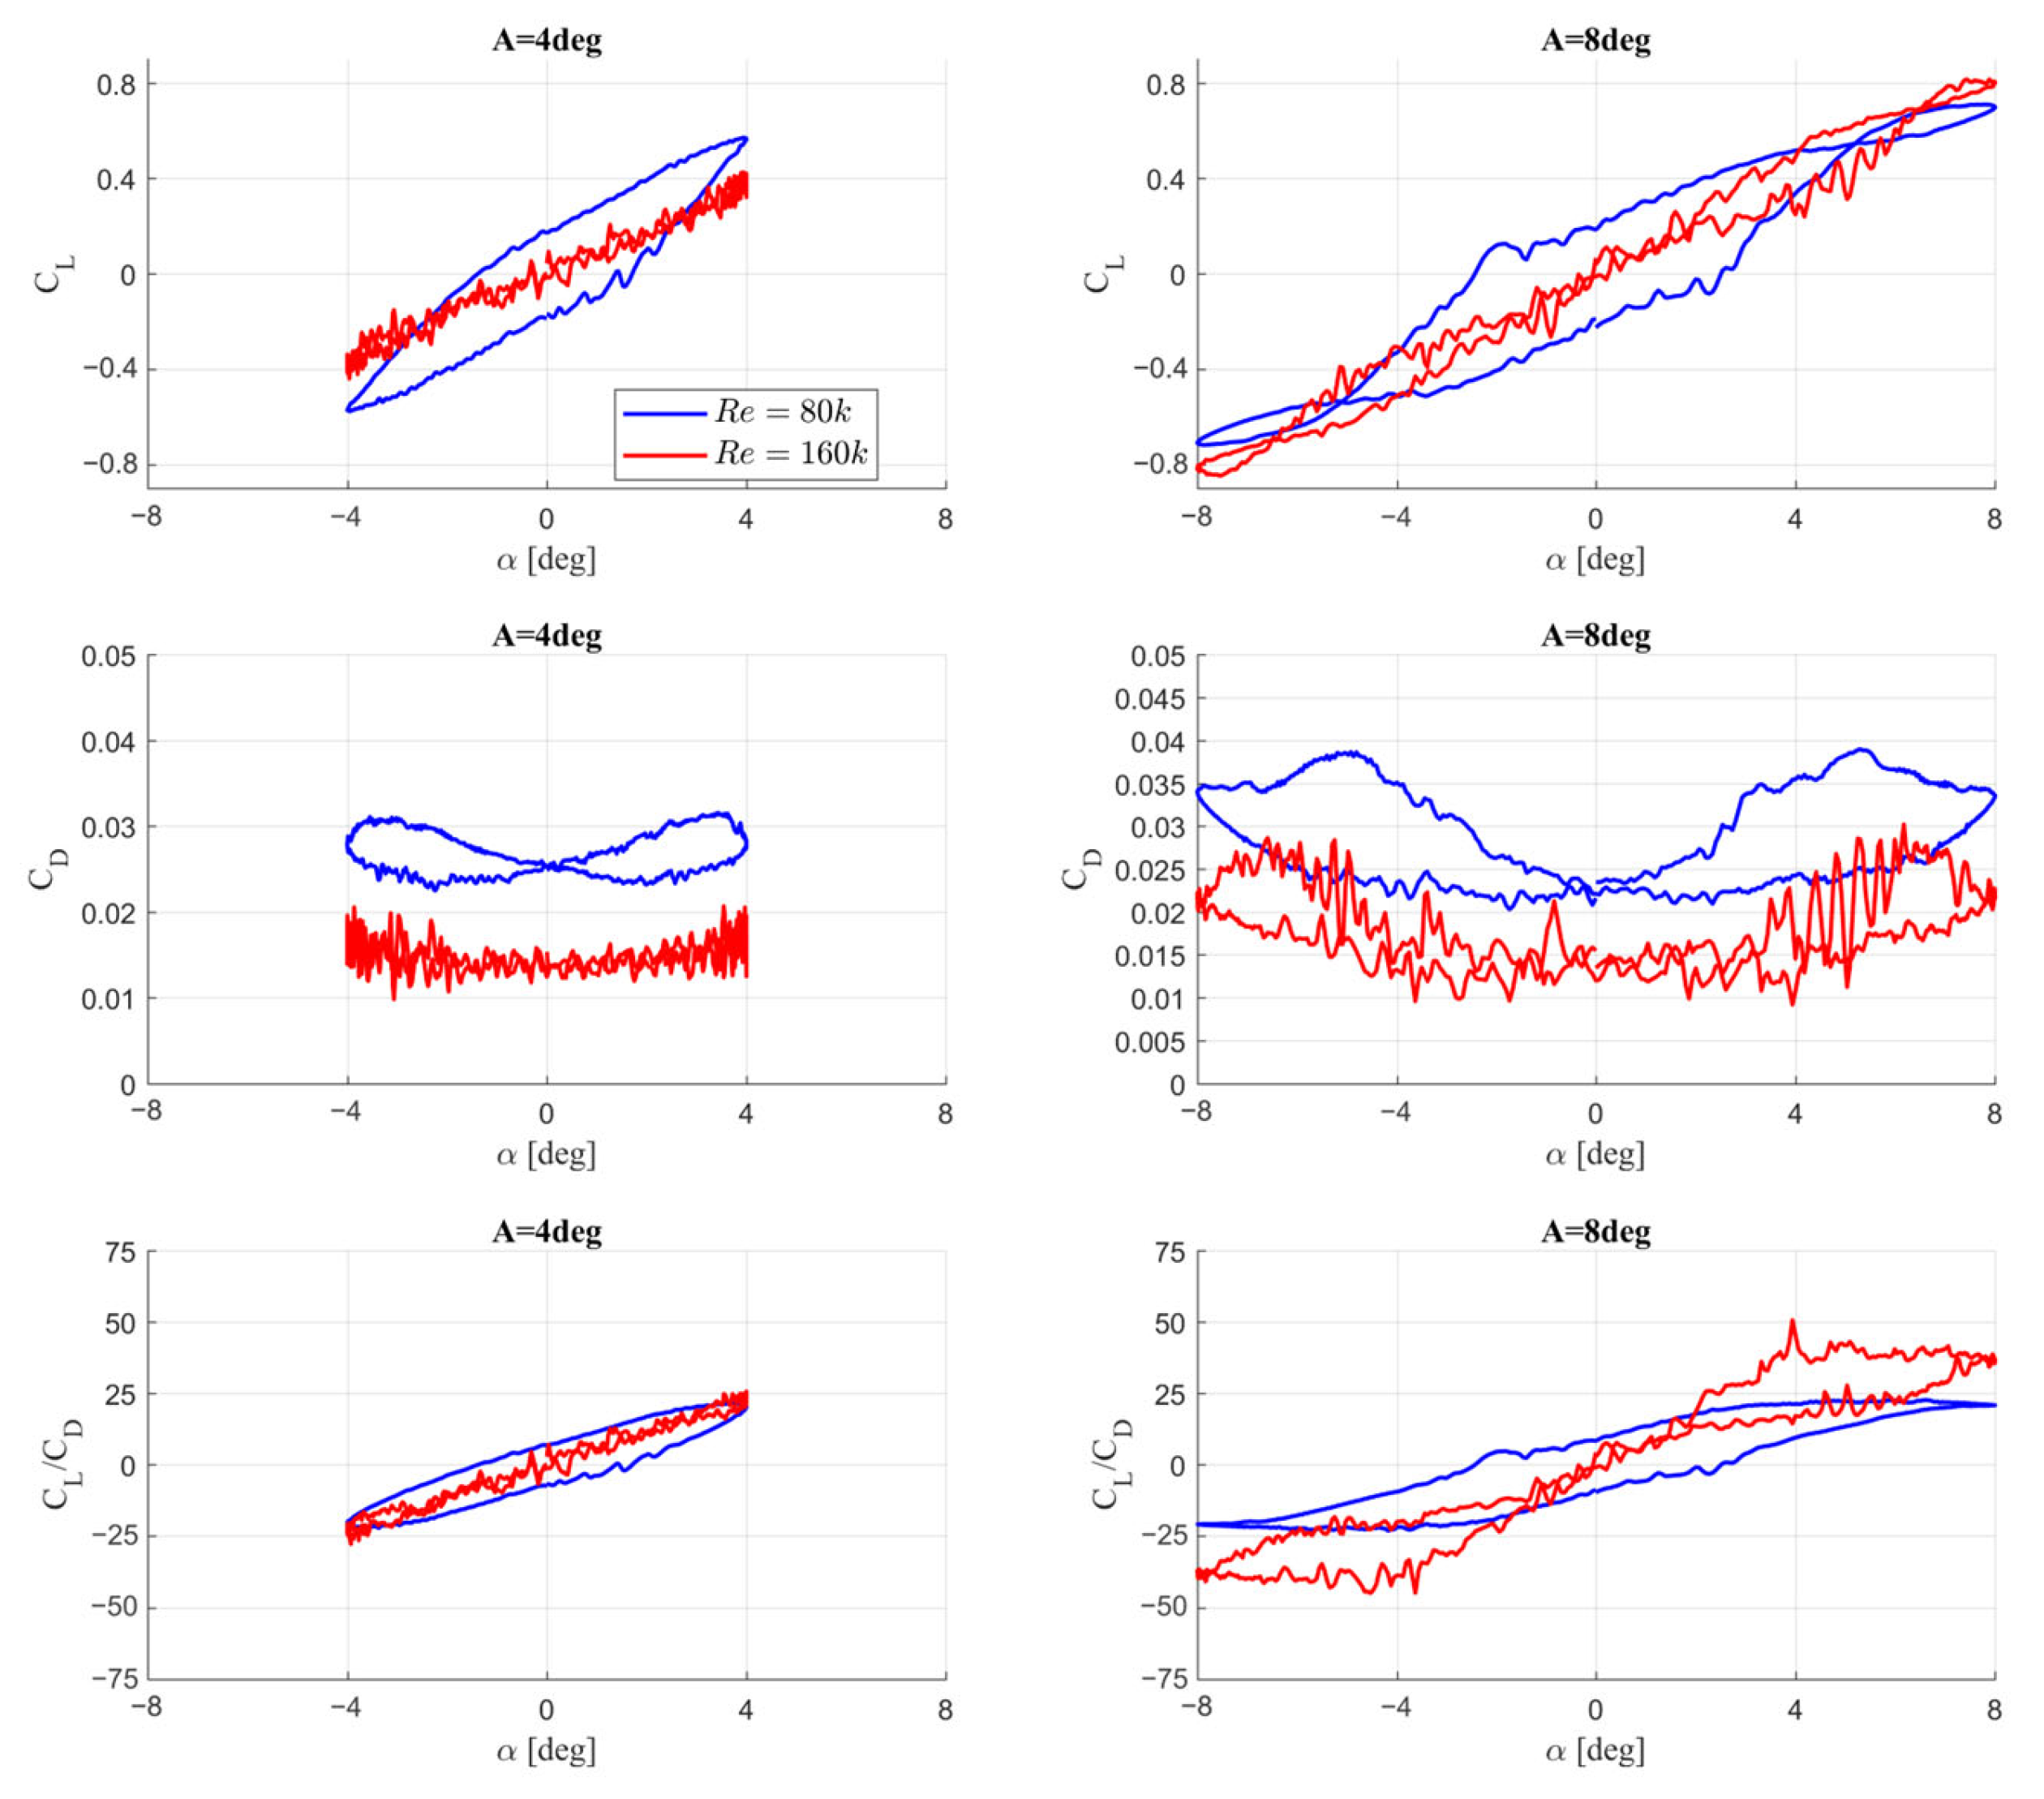
This section presents the results of the aerodynamic load analysis of the pitching NACA 0018 airfoil. The influence of the Reynolds number on the aerodynamic force coefficients was investigated by considering two pitching amplitudes: 4° and 8°. The frequency of the 1 Hz pitching motion corresponds to a reduced frequency of approximately 0.01 for Re = 80k and around 0.005 for Re = 160k, highlighting the influence of the Reynolds number on the normalized temporal scaling of the motion. The corresponding amplitude-to-chord ratios are approximately 0.067 for A = 4° and 0.133 for A = 8°, assuming a chord length of 6 cm.
It was observed that the drag coefficient component is the most sensitive to both the Reynolds number and the amplitude of pitching (
Figure 7). To confirm the influence of the Reynolds number on the drag coefficient, the values were averaged over the last computed cycle of motion.
For amplitude A = 4°, the drag coefficient for Re = 80k was approximately 67% higher than that for Re = 160k. For A = 8°, the drag coefficient is about 51% higher under the same comparison.
Our observations further revealed that the maximum values of the lift coefficient for the amplitude A = 4° were higher at lower Reynolds numbers. The maximum drag coefficient in this case was about 44% higher than that at Re = 160k at the same amplitude. Interestingly, for amplitude A = 8°, the opposite is true: the lift maxima for Re = 160k are greater, although the difference in these maxima is significantly smaller. This reversal in lift coefficient trends between A = 4° and A = 8° can be explained by the nonlinear characteristics of the laminar-to-turbulent transition and their sensitivity to the Reynolds number. At lower amplitudes (A = 4°), the airfoil operates primarily in a regime in which the transition location is delayed, especially at lower Reynolds numbers, resulting in more extensive laminar flow and higher lift. At larger amplitudes (A = 8°), the pitching motion enters a more dynamic regime with stronger flow separation. In this case, a higher Reynolds number (Re = 160k) promotes an earlier transition and reattachment, yielding a higher maximum lift. Similar effects were observed in [
11], where the lift behavior at low Re was shown to depend on the position and strength of the laminar separation bubbles. The transition model struggles to resolve these effects purely from first principles due to its reliance on empirical correlations rather than the direct resolution of boundary layer physics.
For both the analyzed amplitudes and Reynolds numbers, the mean values of the normal force coefficient are, as expected, very close to zero.
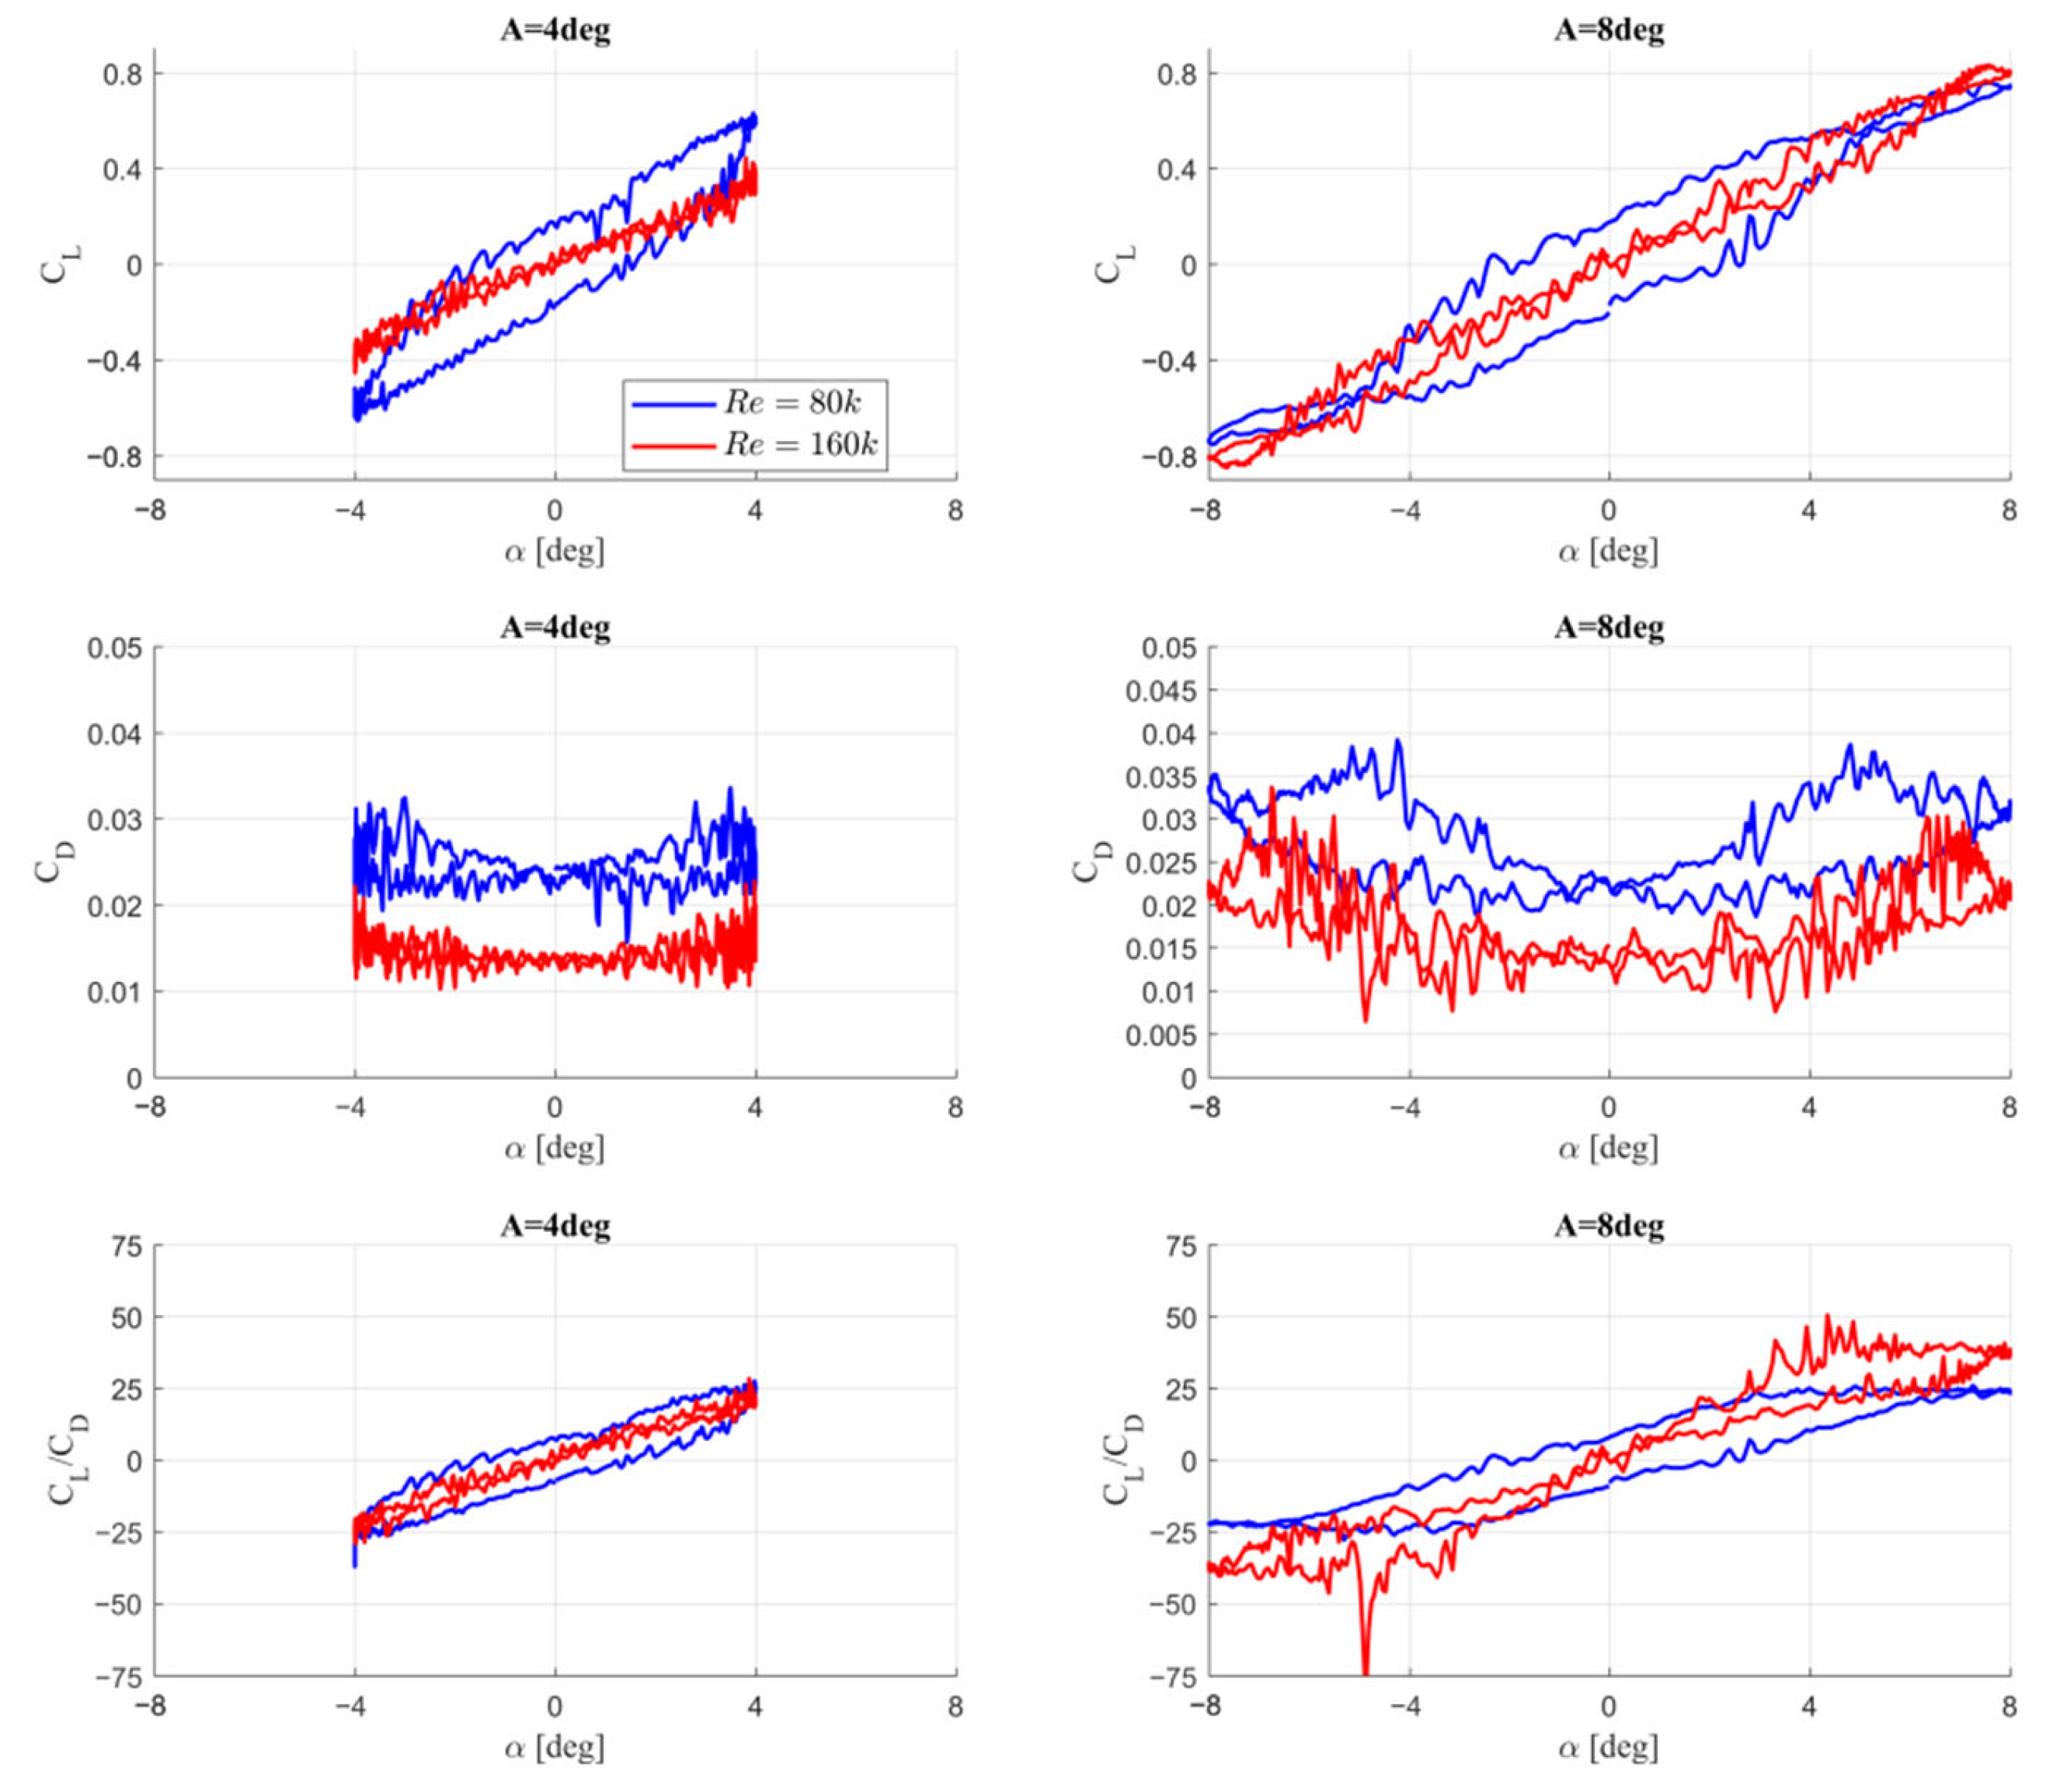
Figure 7 illustrates the influence of the Reynolds number on the aerodynamic loads as a function of time. For a better comparison, the same results for the aerodynamic force coefficients are also presented in a different format, plotted against the angle of attack α.
Figure 8 shows a comparison of the hysteresis loops of the aerodynamic force coefficients under the investigated wing motion parameters. In the case of the lift coefficient, the hysteresis loop is the widest at an angle of attack of α = 0°. An increase in the Reynolds number from 80k to 160k reduces the loop width for both the lift and drag coefficients. The relatively low oscillations of the drag coefficient at small angles of attack can be attributed to the stable nature of the boundary layer and the weak influence of laminar separation. At higher angles, the laminar separation bubble becomes larger and less stable, and reattachment behavior becomes more sensitive to the phase of the oscillation, leading to more pronounced and nonlinear drag oscillations.
The top-left panel of
Figure 8 highlights the significant impact of the Reynolds number on the shape and slope of the lift coefficient as a function of the angle of attack. Furthermore,
Figure 8 compares the relationship between the lift-to-drag ratio (C
L/C
D) and the angle of attack for two Reynolds numbers, 80k and 160k.
This comparison reveals a considerably smaller influence of the Reynolds number on the aerodynamic efficiency, particularly for the smaller amplitude of 4. This indicates that the higher drag associated with, the lower Reynolds number offsets the potential benefits of higher lift coefficient values.
For the larger amplitude under investigation, a higher Reynolds number results in greater values of the CL/CD ratio, especially at higher angles of attack.
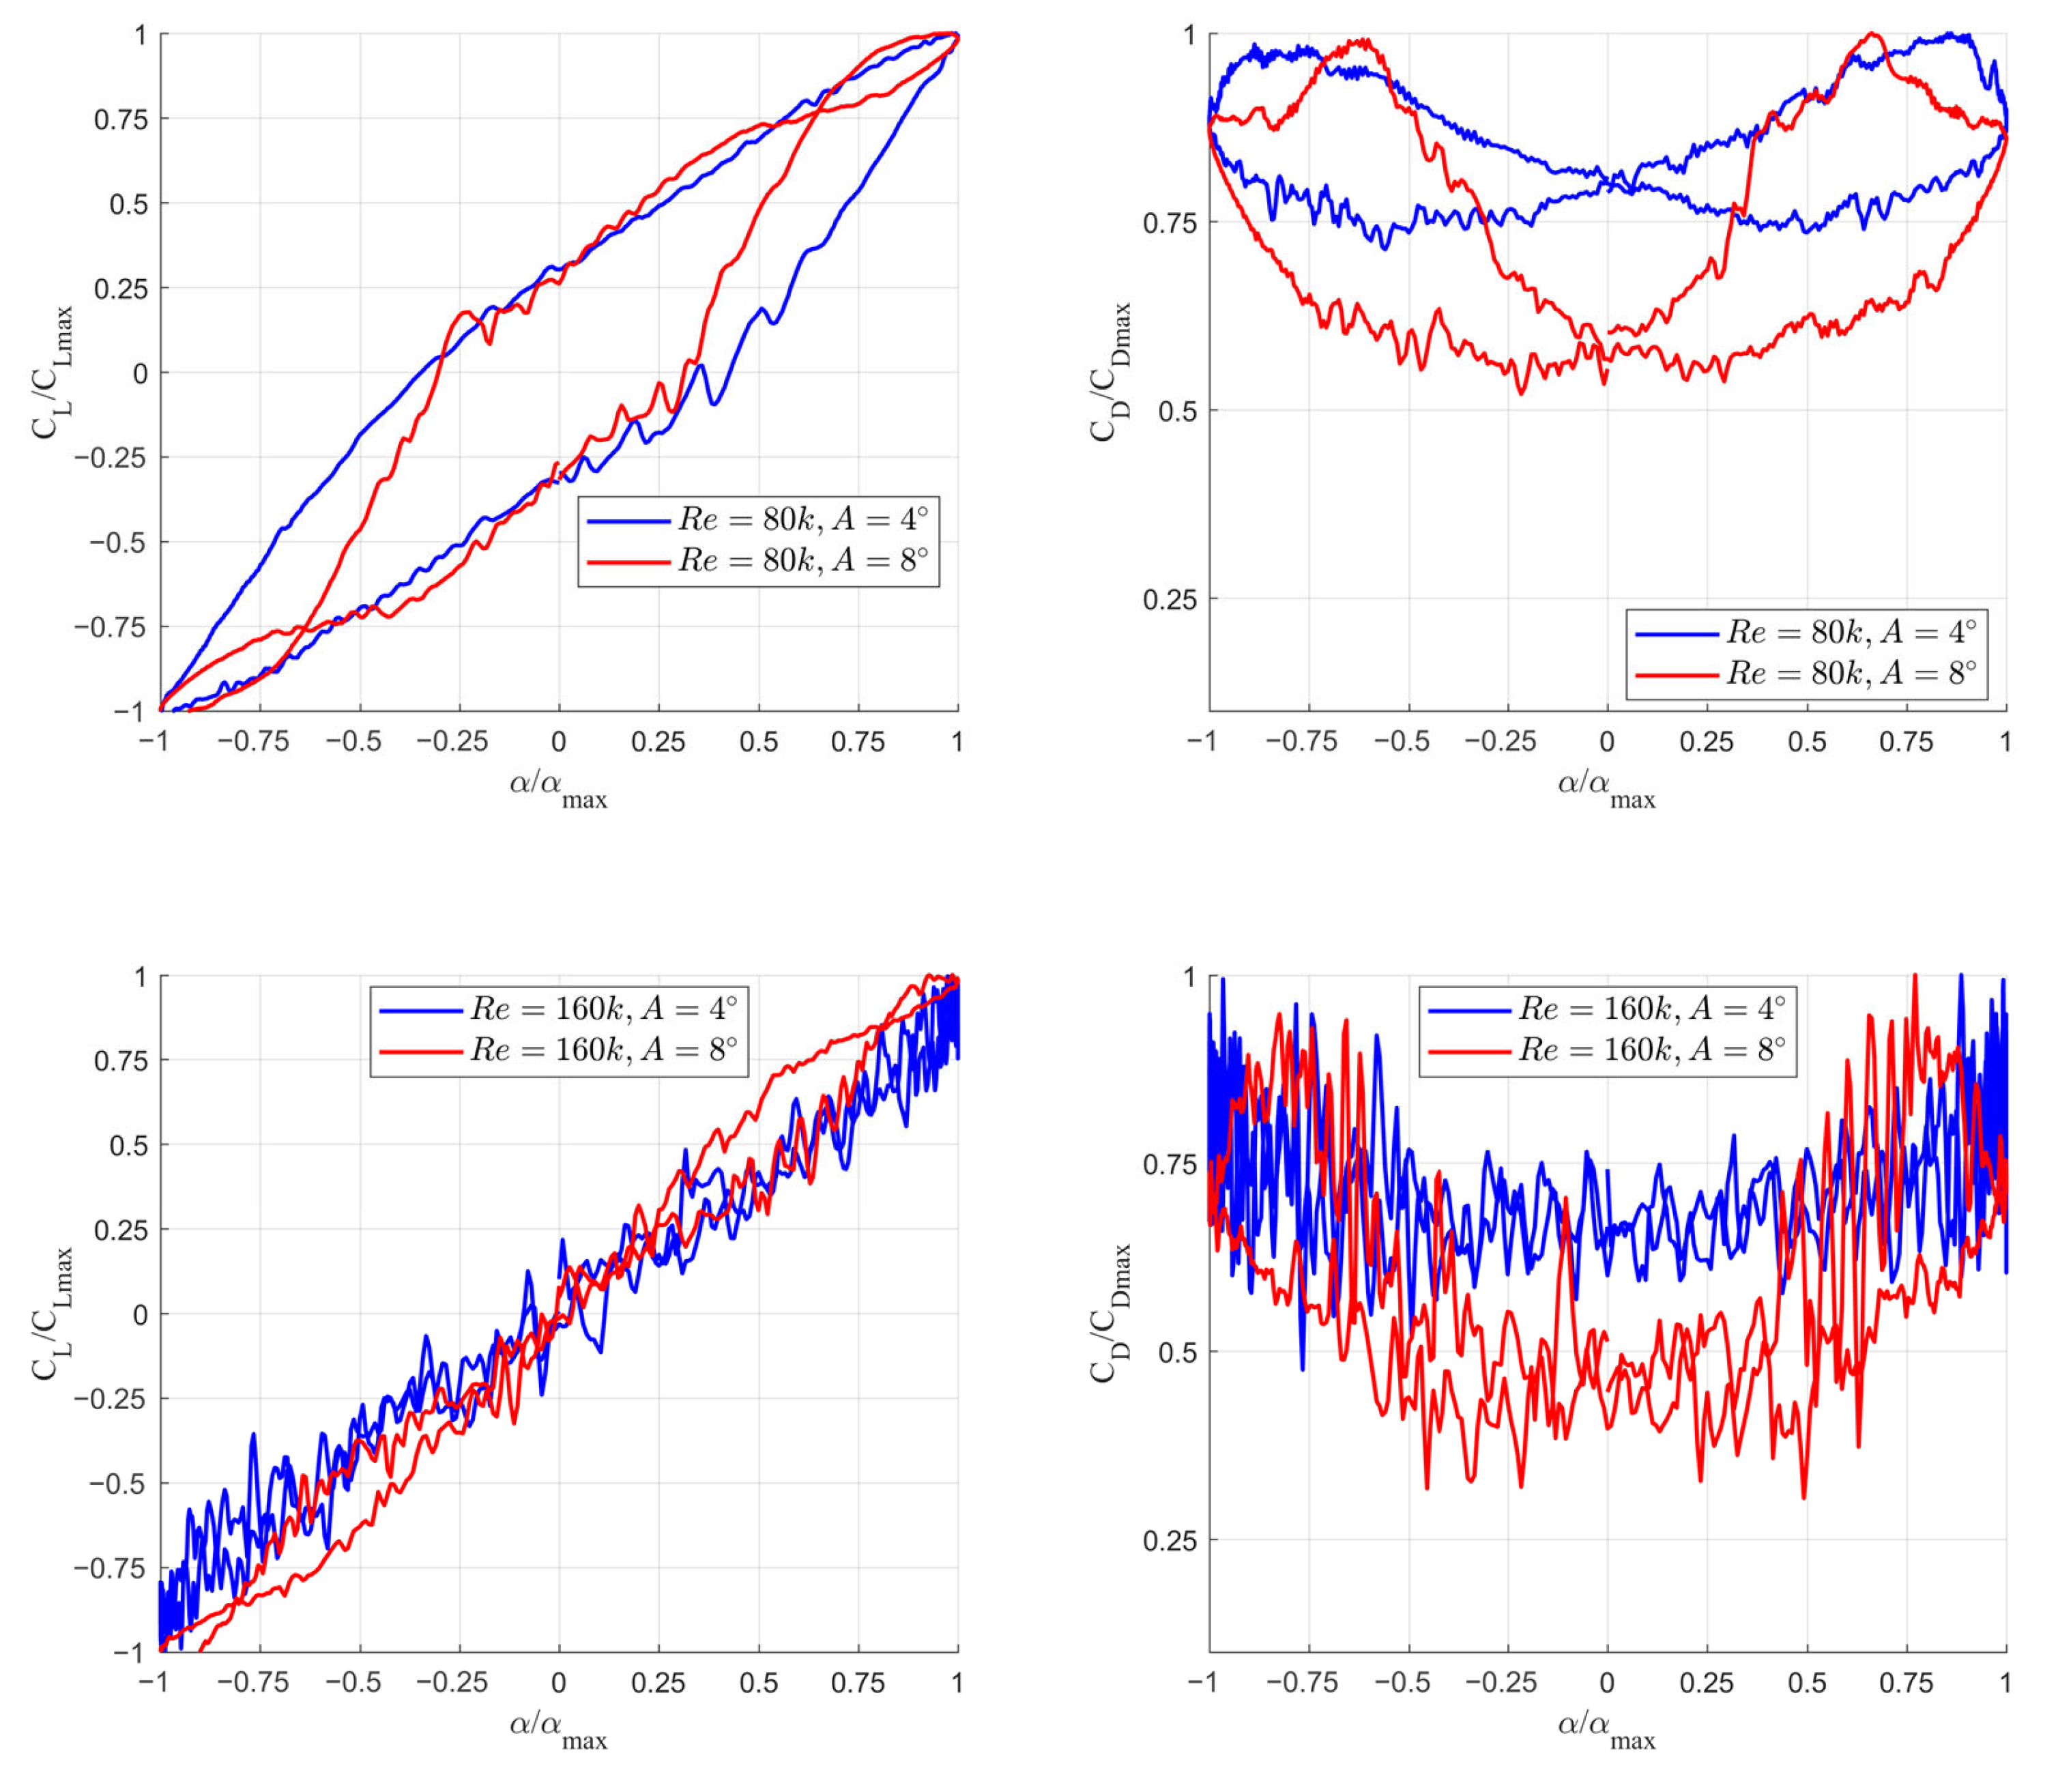
Figure 9 illustrates the influence of the amplitude on the hysteresis loops at a given Reynolds number. To compare the aerodynamic force coefficients for different amplitudes, the values of the coefficients were normalized by their respective maximum values. A similar normalization was applied to the angle of attack.
The plots presented in this figure reveal that the amplitude has the greatest impact on the drag coefficient at low values of the angle of attack. For both Reynolds numbers, the minimum drag coefficient for the amplitude A = 8˚ was lower than that for A = 4°. This is most likely associated with the higher linear velocity at the leading edge.
As shown in the top-left panel, the Reynolds number also significantly affects the lift coefficient. The largest differences are observed for α/αmax in the range from 0.5 to 1.0.
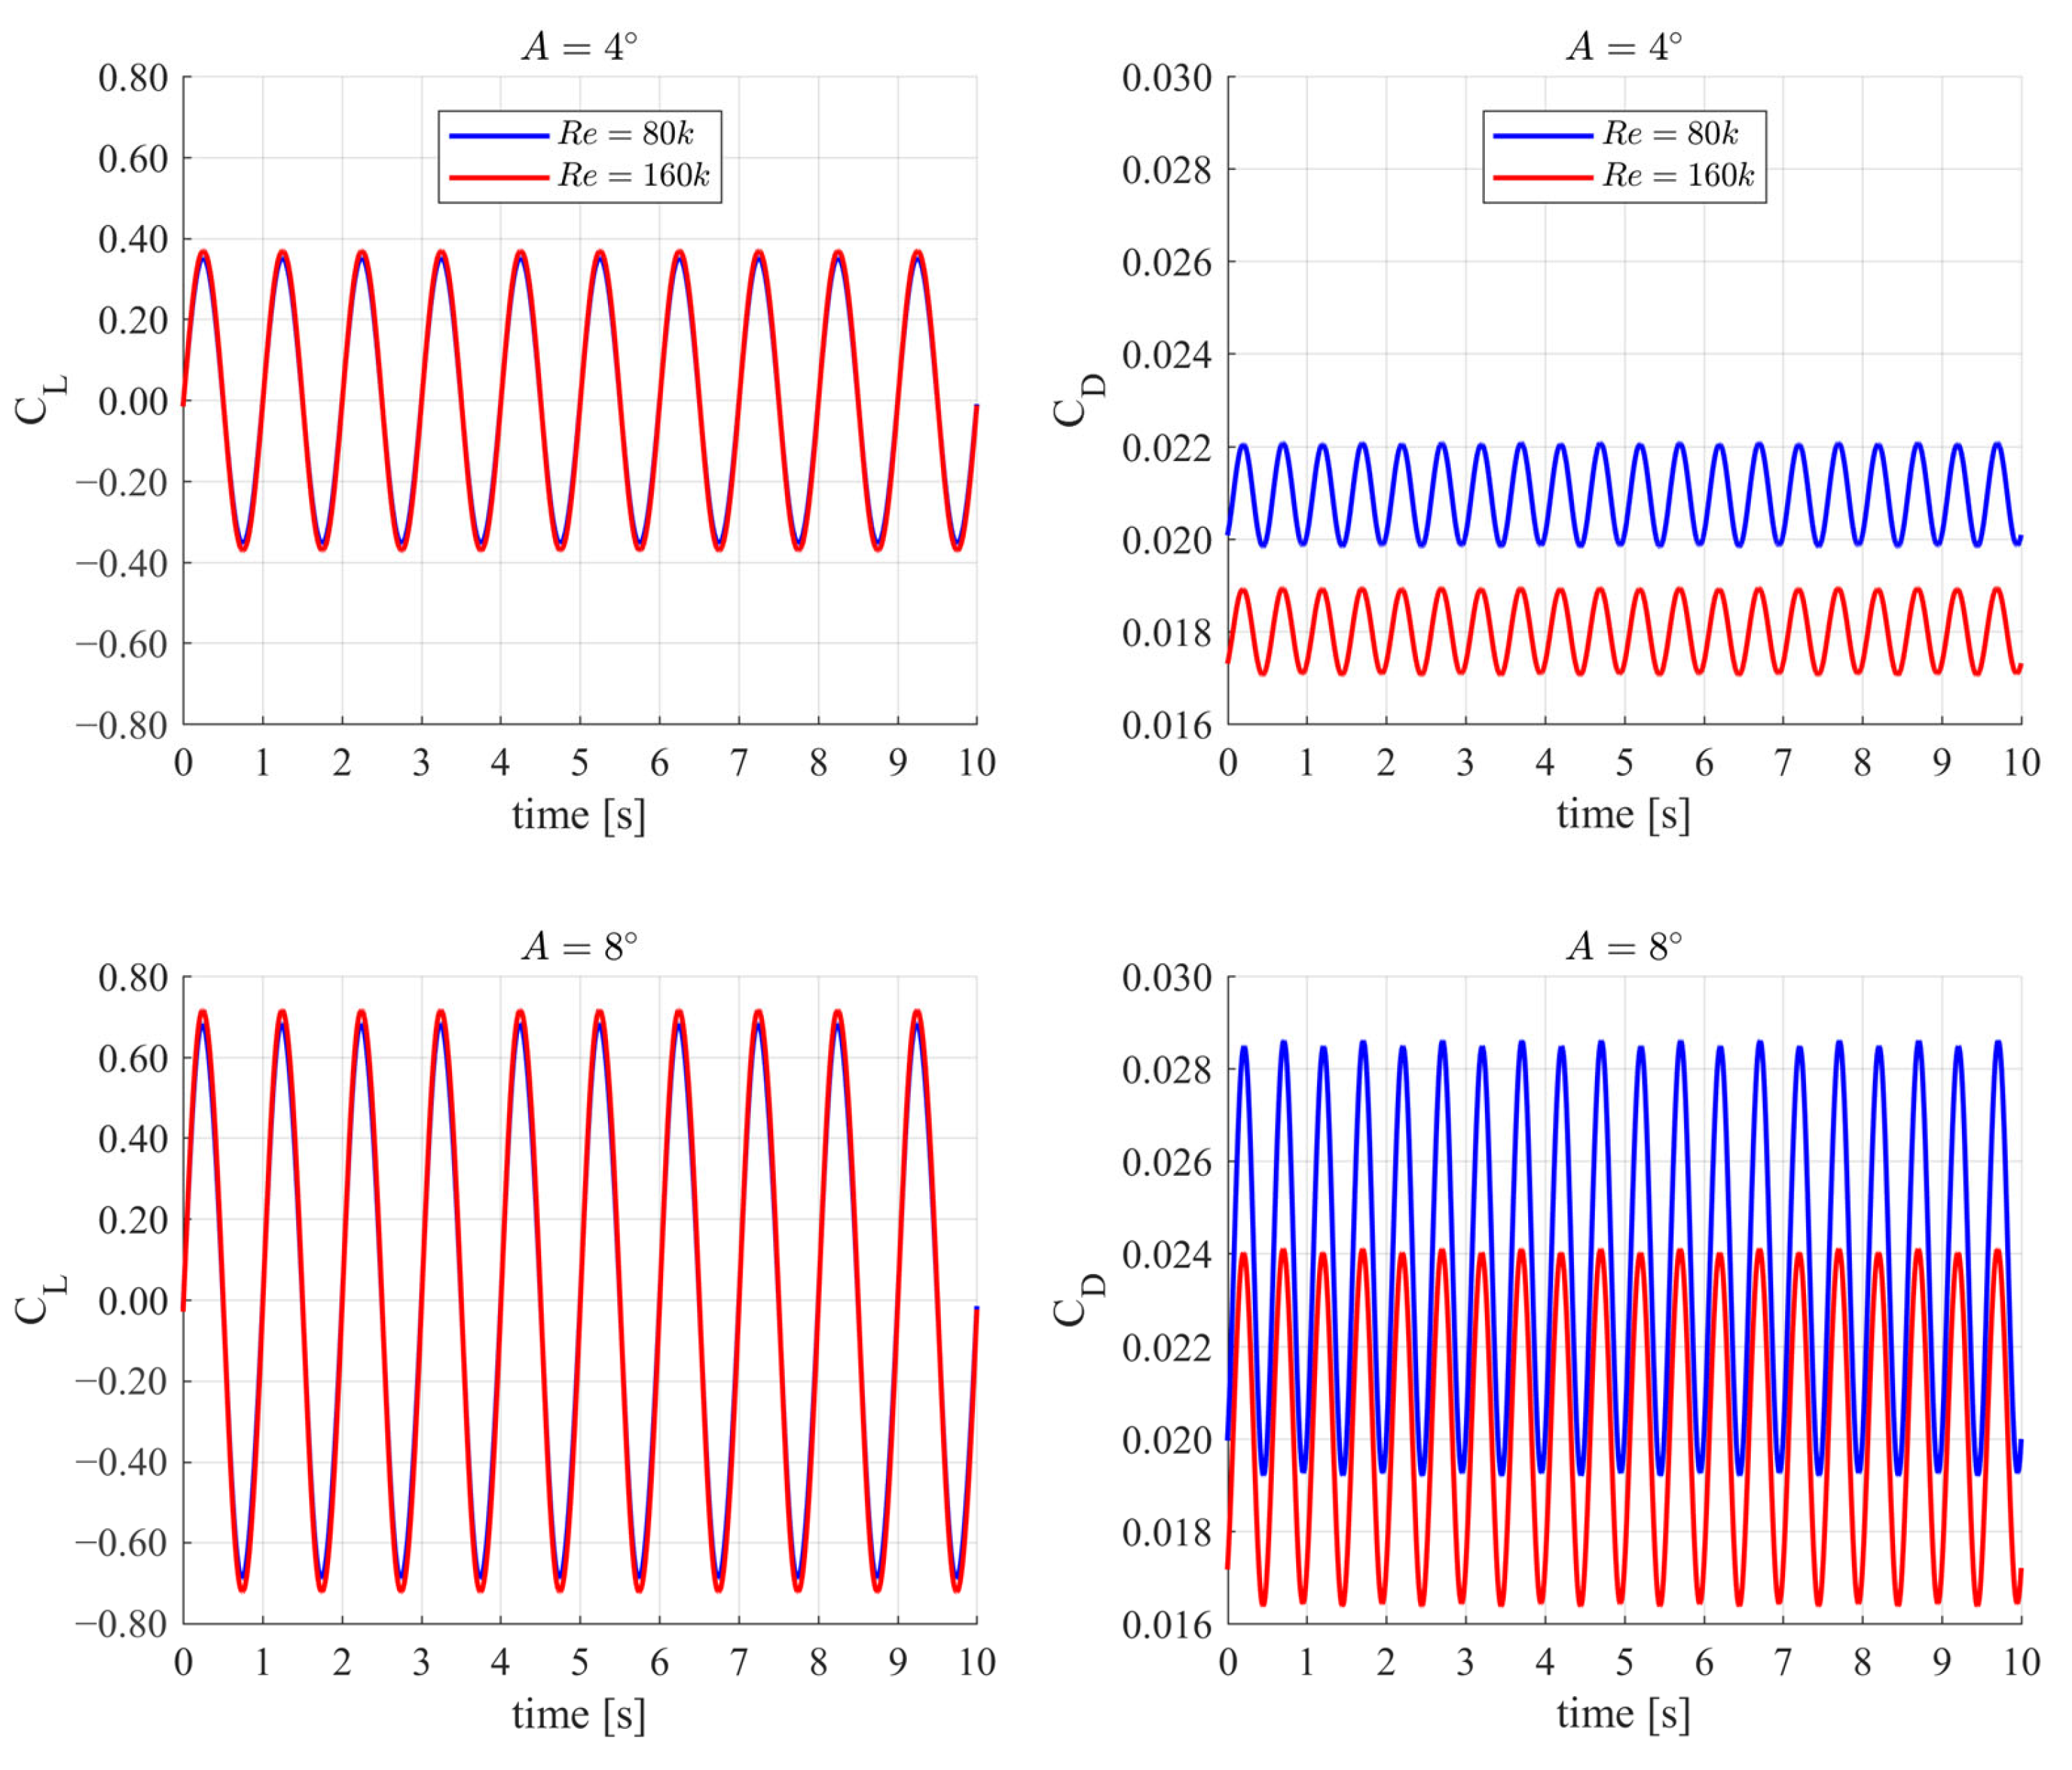
3.3. Aerodynamic Forces Predicted by the k-ω SST Model for Pitching Motion
This section presents the dynamic characteristics of the harmonically oscillating NACA0018 airfoil using the classical 2-equation k-ω turbulence model.
Figure 10 compares the aerodynamic force components in the time domain for the two cases.
The aerodynamic forces generated on the surface of the oscillating airfoil are, as expected, nearly harmonic functions. Due to the wall-layer modeling approach, no irregularities associated with laminar separation bubbles are visible in the characteristics. In contrast to the γ-Reθ model, the k-ω SST turbulence model showed that the maximum lift coefficient values calculated for case A = 4° and Re = 160,000 were slightly higher than those for Re = 80,000.
An increase in the amplitude to 8° resulted in a slight increase in the difference between the amplitudes. Despite minor differences in lift force estimation, drag is much more dependent on the Reynolds number, as shown in the right-hand column of the plots in
Figure 10.
The drag coefficient at the lower amplitude (A = 4°) exhibits an almost entirely periodic nature, repeating in each cycle of airfoil oscillation. This indicates the establishment of a steady dynamic regime in which the aerodynamic response is cyclically repeatable.
For an oscillation amplitude of 8° and Reynolds number Re = 80,000, very small differences in successive drag force amplitudes were observed. This may have resulted from the proximity to the critical static angle of attack, which affects the flow characteristics around the airfoil and stabilizes the aerodynamic forces.
The characteristics of the aerodynamic force coefficients and aerodynamic efficiency as a function of the angle of attack are shown in
Figure 11. All plots reveal the absence of effects associated with the laminar separation bubbles.
The hysteresis loops of the CL were nearly identical for A = 4° and A = 8°, showing only a scaling effect. For the CD hysteresis, a practically uniform shift dependent only on the Reynolds number was observed. The characteristics are symmetrical about alpha = 0°.
Additionally, the Reynolds number is reflected in the slightly different slopes of the CL/CD ratios. This highlights the role of the Reynolds number in determining the aerodynamic efficiency under dynamic conditions.
This comparison also serves to explain a surprising result observed in our recent VAWT simulations [
32], where both models predicted similar rotor loads despite fundamentally differing in how they handled the transition. The present simplified configuration highlights the underlying differences more clearly and will help guide further refinement of turbulence modeling in practical applications.
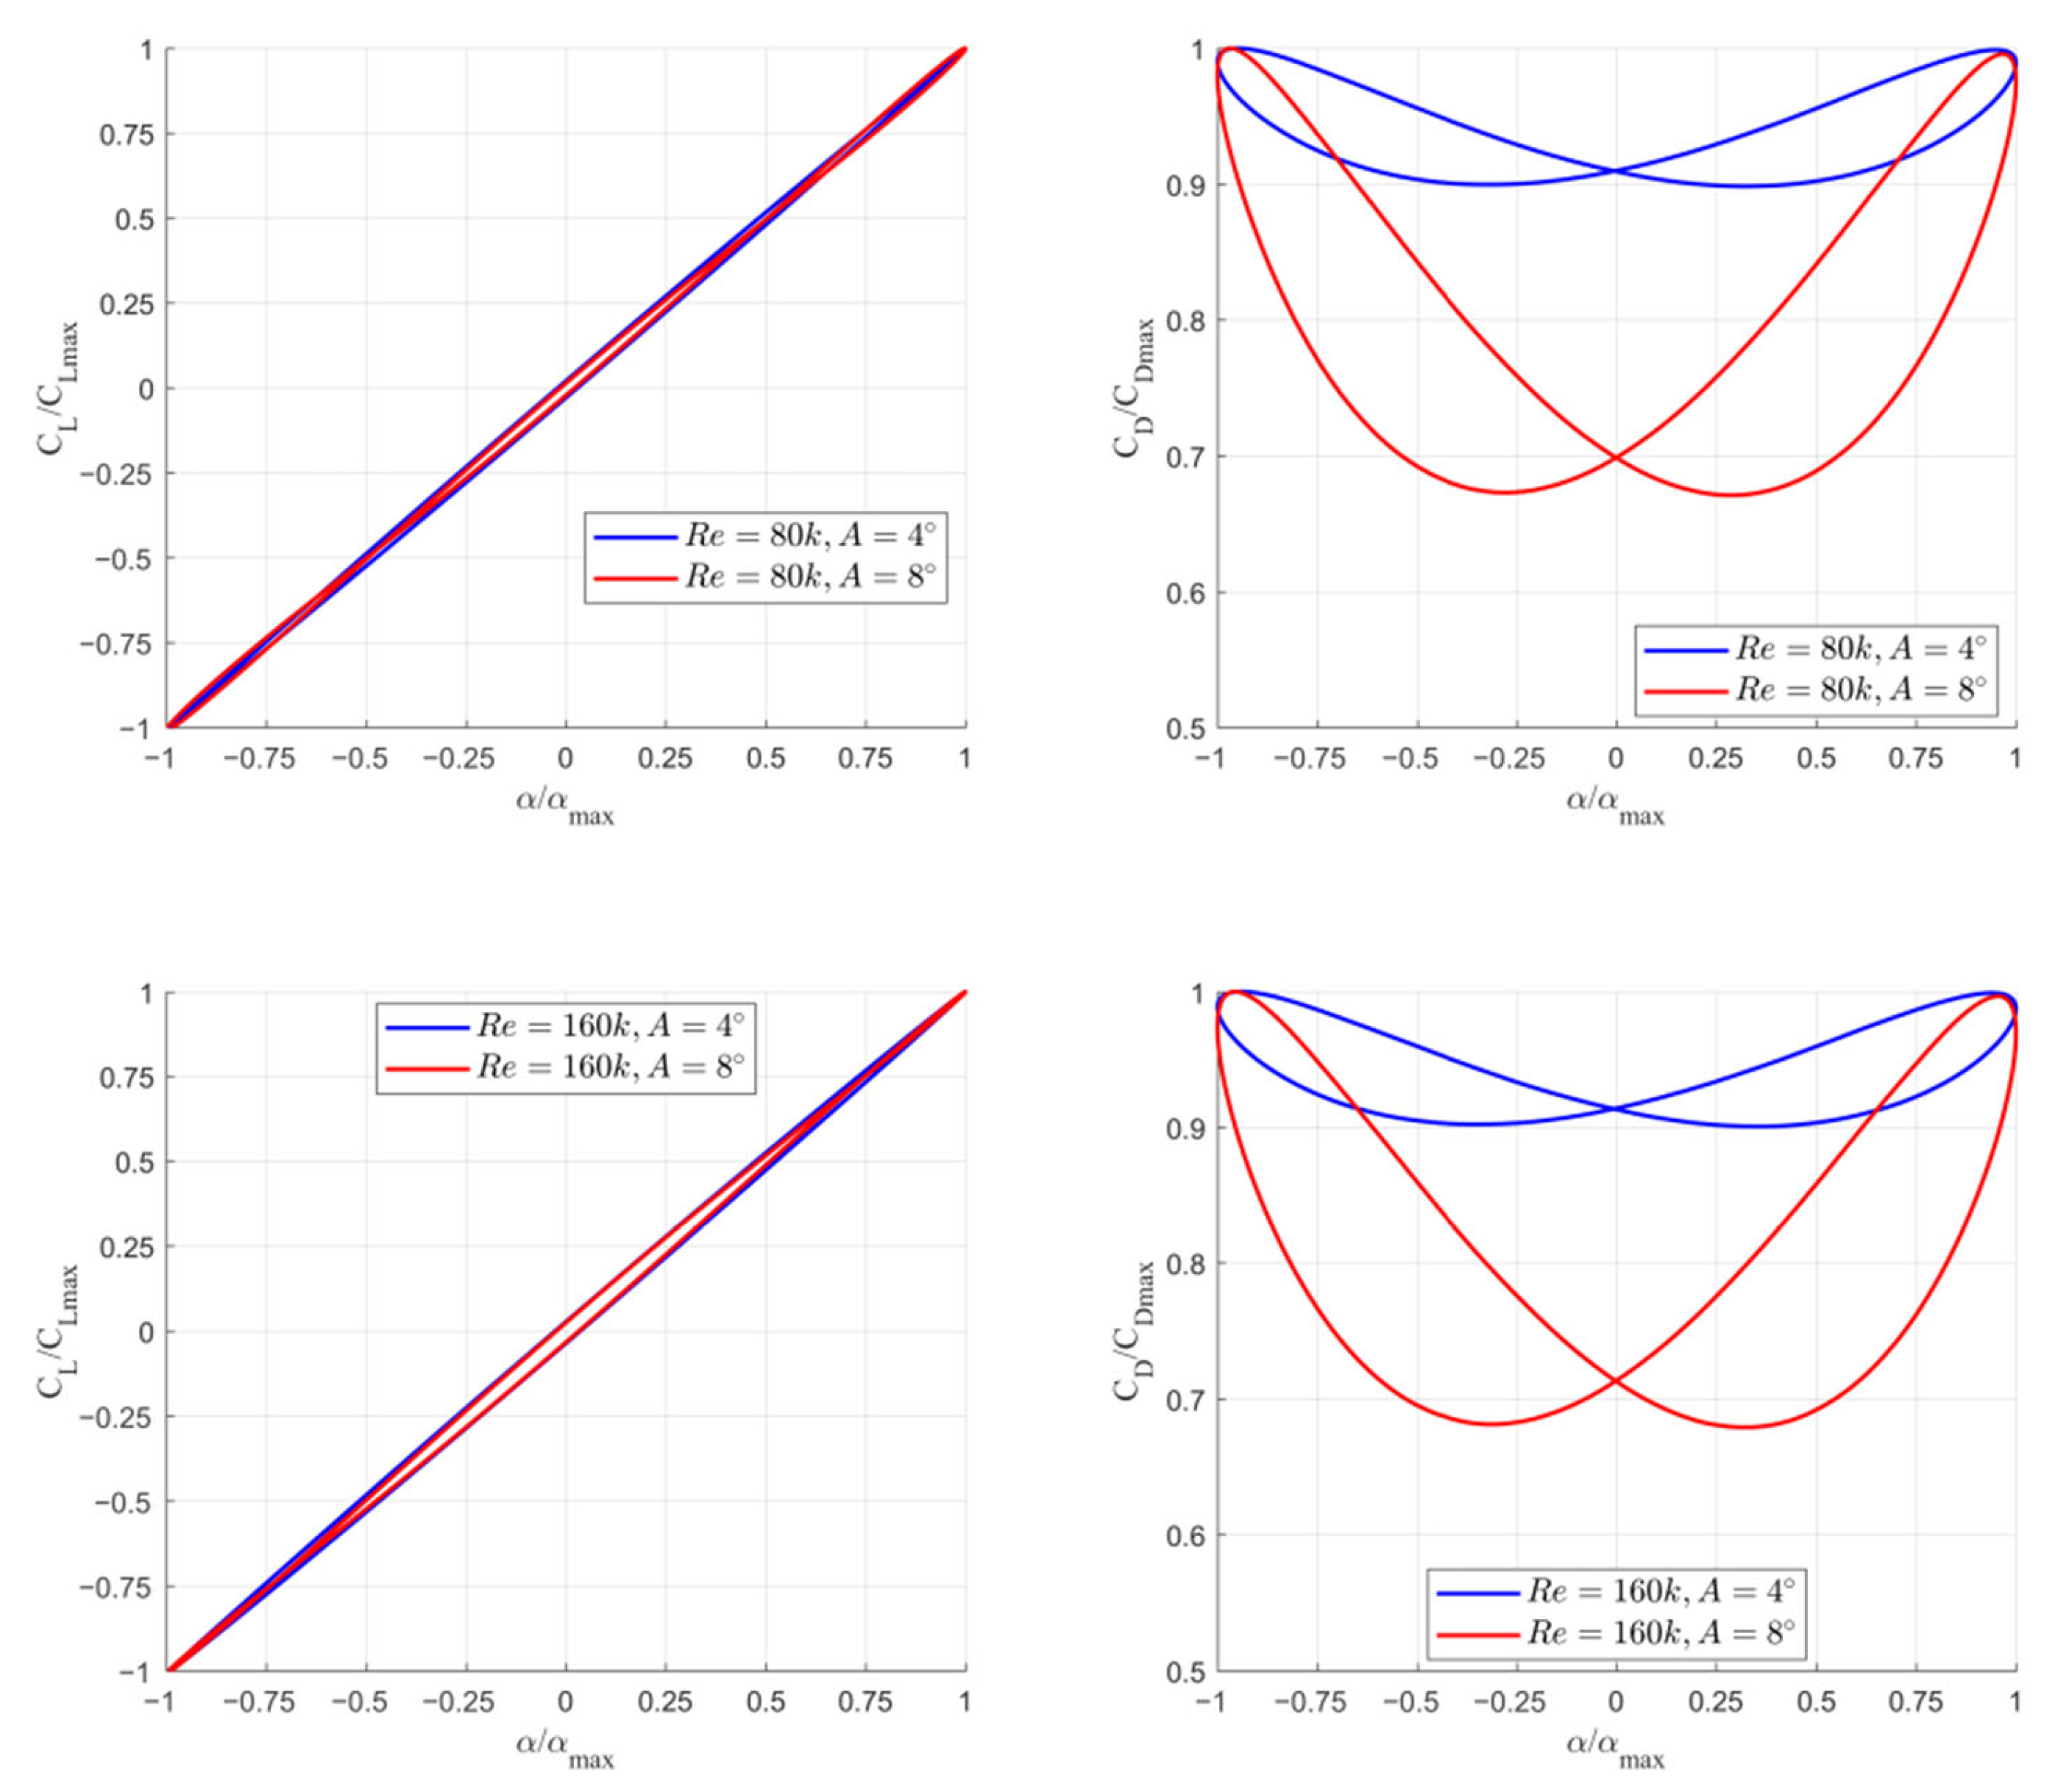
Figure 12 illustrates the greater influence of the Reynolds number on the ratio C
L/C
Lmax as a function of the normalized angle of attack. An increase in Re causes a broader hysteresis at small angles of attack.
Interestingly, the shape of the CL/CLmax curve is more dependent on the Reynolds number than on the amplitude. Similarly, the Reynolds number has a more significant impact on the drag coefficient, although in this case, the amplitude plays a key role.
As with the turbulence model accounting for the laminar-to-turbulent transition, a significant drop in α/αmax is observed for the higher amplitude case.
3.4. Aerodynamic Load Analysis for 2 Hz Pitching Motion
The reduced frequencies for the 2 Hz pitching motion are approximately 0.02 for Re = 80k and 0.01 for Re = 160k. The amplitude-to-chord ratios remain the same as in the 1 Hz case, i.e., 0.067 for 4° and 0.133 for 8°. The time histories of the aerodynamic force coefficients, shown in
Figure 13, exhibit a similar qualitative trend as that observed for the 1 Hz pitching motion. For the lower Reynolds number of Re = 80k, the maximum values of C
L are higher than those for Re = 160k. However, for amplitude A = 8°, the differences in the maximum C
L values between the two Reynolds numbers are significantly smaller, similar to the 1 Hz case. Both the Reynolds number and amplitude primarily influence the drag coefficient, which is consistently lower at higher Reynolds numbers.
An interesting observation, as shown in
Figure 13 and even more clearly in
Figure 14, which depicts the aerodynamic force coefficients as a function of the angle of attack, is the less oscillatory nature of the coefficients for the Reynolds number Re = 80k. For Re = 160k, oscillations are more pronounced but remain smaller than those in the 1 Hz case.
The remaining qualitative effects for both Reynolds numbers, including the aerodynamic force coefficients and lift-to-drag ratio (C
L/C
D), are consistent with the trends discussed in
Section 3.2 of this paper.
Figure 15 compares the normalized lift and drag coefficients as a function of the normalized angle of attack. This comparison clearly shows that, for the Reynolds number of Re = 80k, the effect of laminar separation bubbles is significantly smaller than that for Re = 160k. Similar to the 1 Hz frequency case, a notable reduction in the minimum drag coefficient is observed for the higher amplitude.
3.5. Hysteresis Loop Analysis for the Pitching Airfoil
In
Section 3.4, the aerodynamic load characteristics, including the lift and drag components on the surface of the pitching airfoil, were analyzed as functions of the Reynolds number and amplitude. Both factors significantly influence the characteristics and shape of the hysteresis loop.
The wide loop observed at low angles of attack is primarily attributed to phenomena occurring in the boundary layer, particularly the detachment of the laminar boundary layer.
Figure 16 illustrates the detachment location as a function of the dimensionless time t/T, where t is the time and T is the motion period.
This figure shows the evolution of the pressure coefficient (Cp) and x-wall shear stress for a pitch angle varying from 0 to its maximum value. The analysis considers an amplitude A = 4° and Re = 80k. Based on the x-wall shear stress characteristics, the local position of the laminar boundary layer separation can be identified, which is marked by a change in the x-wall shear stress from positive to negative.
In the C
p plots, the separation is reflected by a stagnation region (the flat part of the curve).
Figure 16c depicts the “migration” of the transition location, x
tr/c, normalized by airfoil chord c. Different colors represent the transition characteristics of the suction and pressure sides of the airfoil.
The figure demonstrates that as the pitch angle increases, separation occurs later on the suction side and earlier on the pressure side. The contour map of the vorticity vector parallel to the
z-axis, shown in
Figure 16b, visualizes the aerodynamic wake around the airfoil.
Both panels illustrate the same pitch angle of 2° during the increasing (upper plot) and decreasing (lower plot) pitch angles. The figure clearly reveals the large vortex structures generated at the trailing edge on both sides of the airfoil. It also highlights their dependence on the direction of the airfoil motion. Additionally, a slight curvature of the wake is observed during the decreasing pitch angle phase.
3.6. Aerodynamic Load Analysis for 13 Hz Pitching Motion
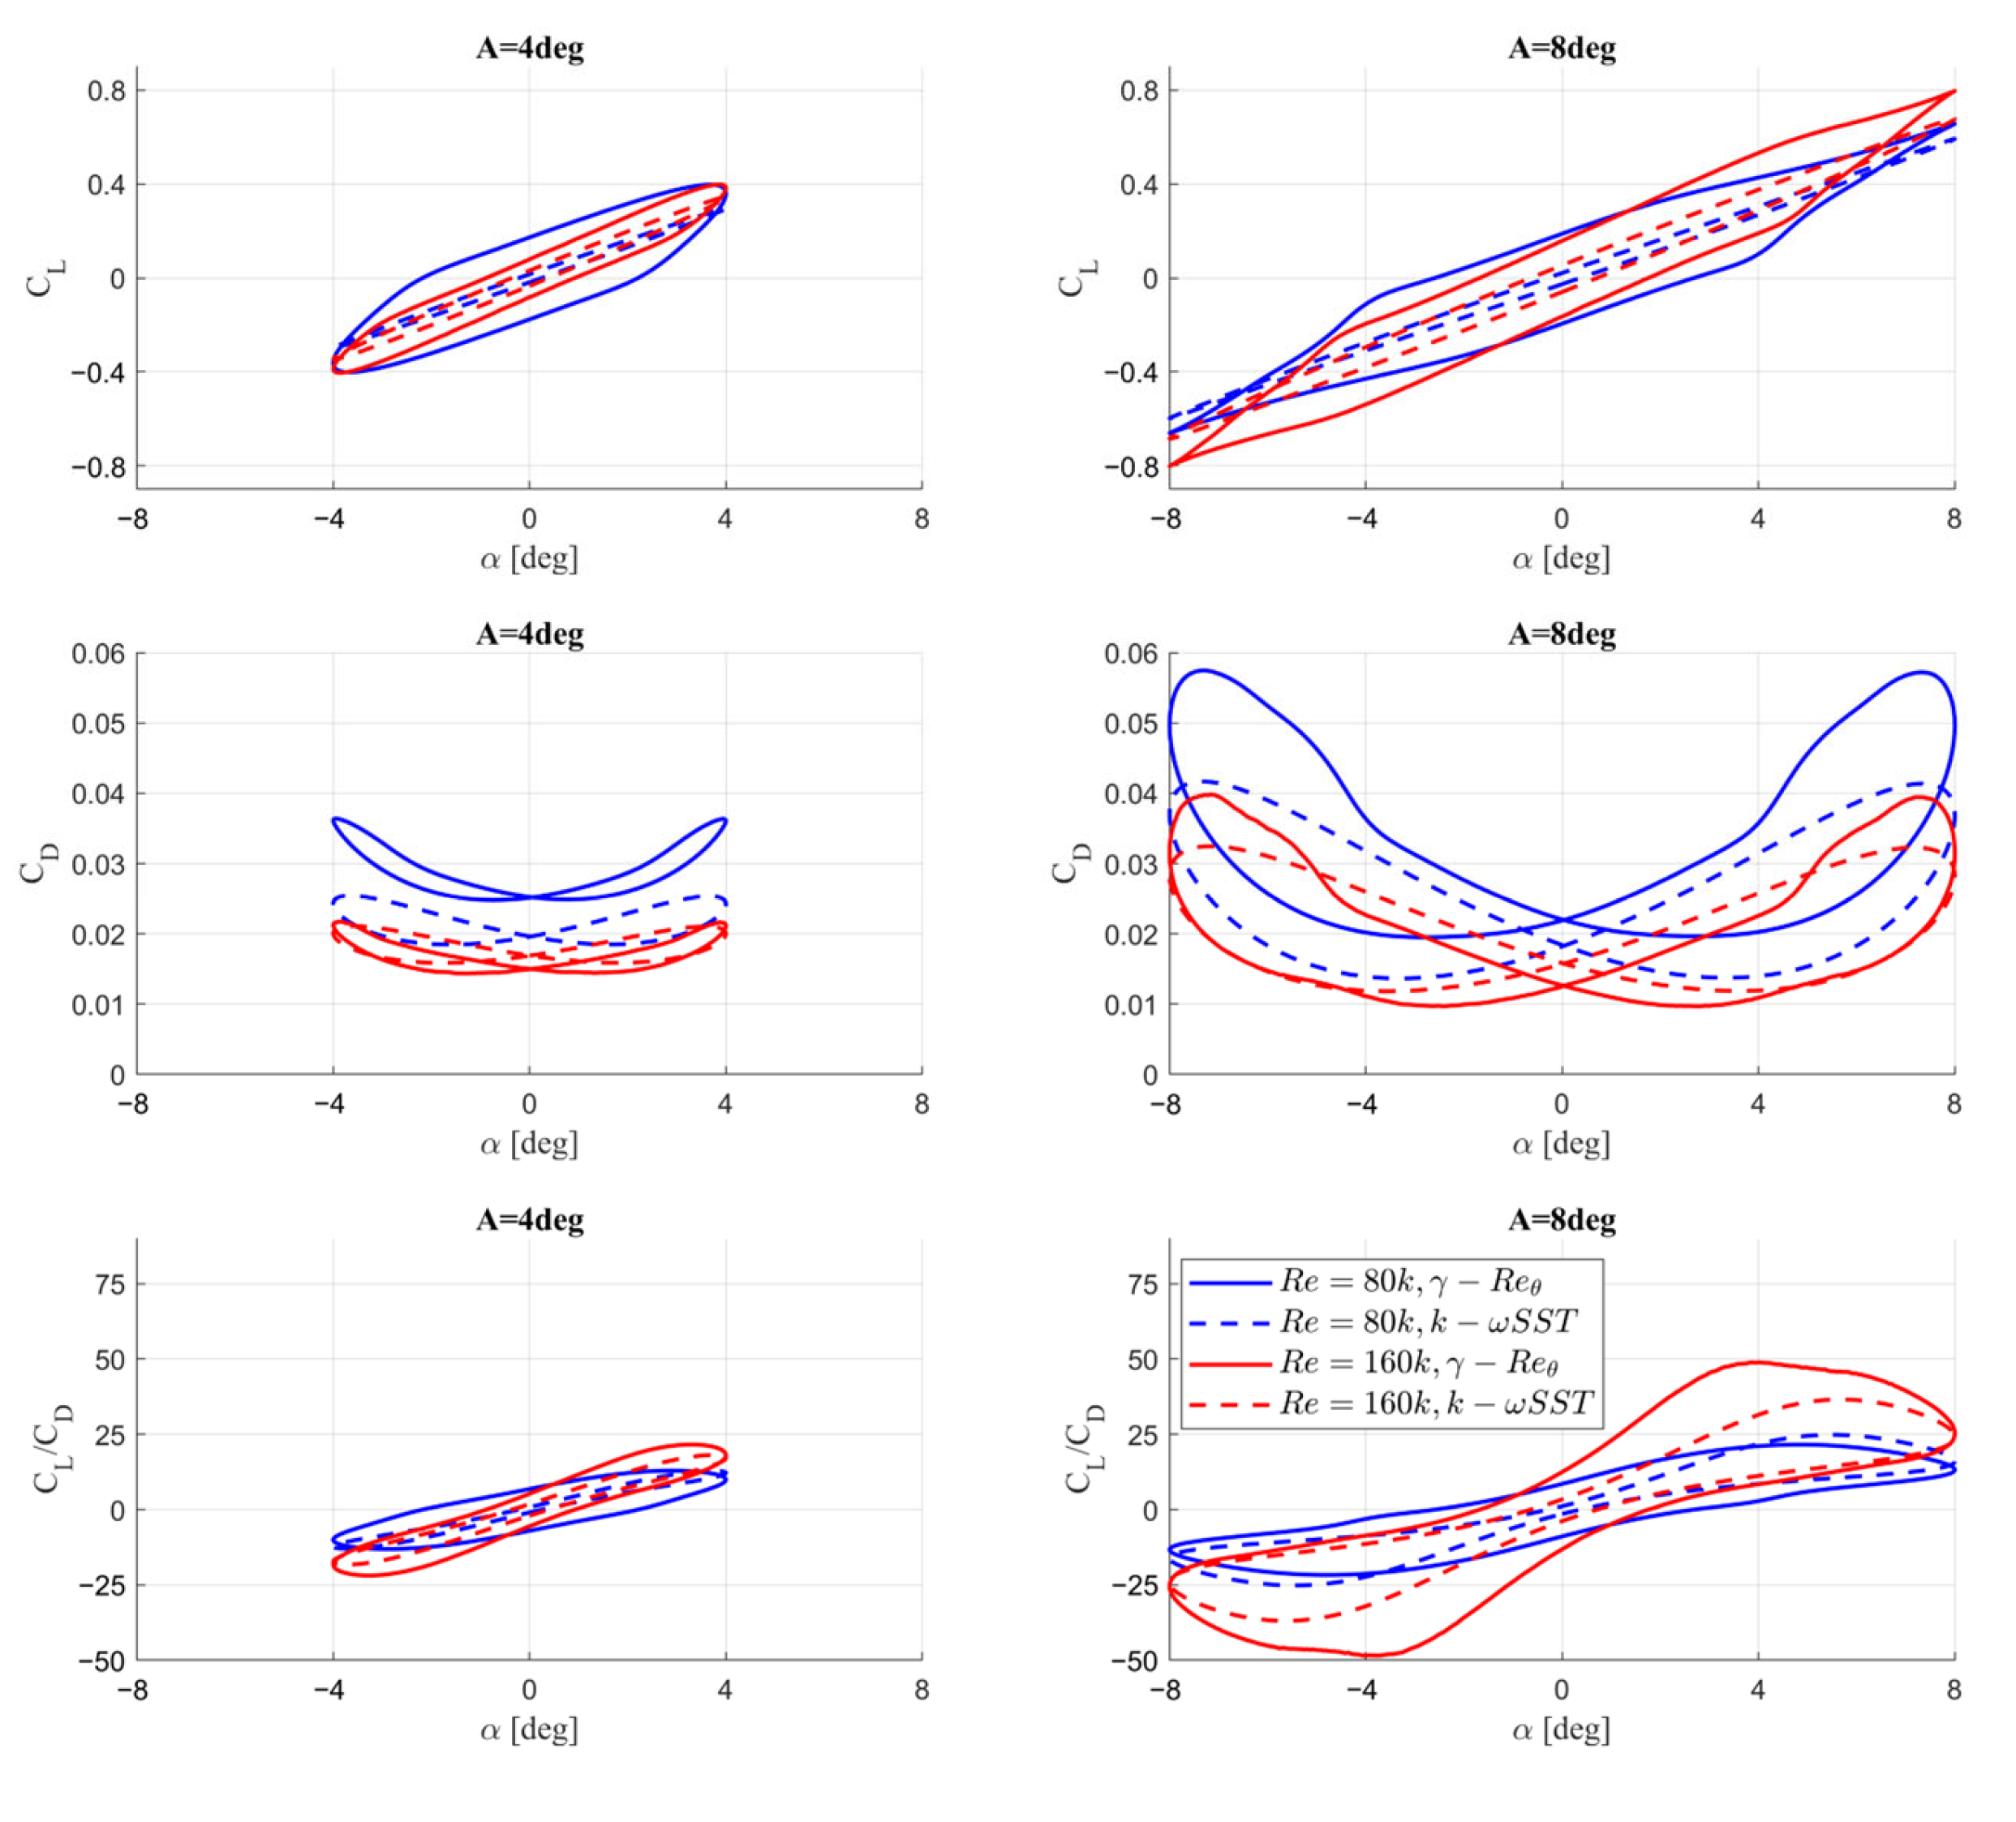
This section discusses the case in which the pitching motion frequency is 13.3(3) Hz. The reduced frequencies were 0.129 for Re = 80k and 0.065 for Re = 160k. For this case as well, the amplitude-to-chord ratios are 0.067 (4°) and 0.133 (8°), based on a 6 cm chord. The aerodynamic loads of a pitching NACA 0018 foil were analyzed at this “unusual” frequency because of the rotational speed of a Darrieus vertical-axis wind turbine (VAWT). This rotor was tested in the TU Delft wind tunnel, and the results of these tests can be found in [
6]. Since the publication of these tests, numerous scientific papers have been devoted to this rotor.
Some authors have utilized the experimental data of this turbine to validate numerical methods, including the γ-Re
θ transition model. Additionally, studies comparing turbine performance using various turbulence models, such as the k-ω SST model, have emerged. The results published by various authors confirm that both models generate similar results for aerodynamic loads, namely, the tangential and normal components, as shown, for example, in [
10,
34,
35]. These minor discrepancies are puzzling because both models exhibit significant differences in the stationary lift force characteristics. Furthermore, as sections of this article discussing the force dynamics for a foil oscillating at 1 Hz and 2 Hz have shown, laminar separation bubbles play a substantial role in the oscillations of aerodynamic forces. Consequently, the lack of significant differences between the aerodynamic load characteristics obtained using the γ-Re
θ transition and k-ω SST models was partially attributed to turbulence intensity. The effect of bubbles diminishes with increasing turbulence intensity [
36]. However, in the case of this particular rotor, this does not appear to be the main reason, as it was tested in a low turbulence intensity wind tunnel [
6].
The results presented in this section partially resolve the puzzle of the significant similarities in loads obtained using both approaches-γ-Re
θ and k-ω SST.
Figure 17 and
Figure 18 illustrate the hysteresis loops of the aerodynamic coefficients at the two examined Reynolds numbers and two amplitudes. Both figures compare the results of the two turbulence models, with the dashed lines representing the k-ω SST approach. As can be seen, the k-ω SST model results improved with increasing the Reynolds number. Interestingly, the hysteresis of the C
L coefficient obtained using this model is broader for Re = 160k and A = 8°, whereas the agreement between the two approaches for A = 4° is very high. Additionally, the drag coefficients for both amplitudes at high Reynolds numbers are surprisingly consistent.
Another critical observation from these figures is the absence of aerodynamic load oscillations obtained using the γ-Re
θ transition model, indicating the reduced impact of laminar separation bubbles. Comparing the results shown in this section with those in
Section 3.4 further reveals that at lower oscillation frequencies, the bubble effect weakens at lower Reynolds numbers.
4. Conclusions
The primary objective of this study was to analyze the aerodynamic loads on a symmetric, thick NACA 0018 airfoil under pitching motion at low Reynolds numbers. The oscillation frequencies were set to 1 and 2 Hz, and the amplitudes were set to 4 and 8 degrees. Additionally, steady-state simulations for a clean airfoil were conducted for angles of attack of up to 20 degrees to validate the numerical model. The main observations of this study are as follows:
1. The four-equation γ-Reθ turbulence model performed significantly better in predicting the steady aerodynamic characteristics at higher Reynolds numbers. At lower Reynolds numbers, as the flow becomes laminar, the model struggles to accurately capture the CL curve, even at small angles of attack. For a more accurate representation under these conditions, three-dimensional modeling and at least LES approaches are required. Nevertheless, the results from the Transition SST model are more physical than those from classical turbulence models.
2. The classical two-equation k-ω SST turbulence model, which assumes a fully turbulent boundary layer, does not produce any nonlinearities in the lift force characteristics for angles of attack below the critical angle. Consequently, the laminar boundary layer separation effects are absent. Interestingly, the difference between the drag coefficient predicted by this model and the experimental results decreases as the Reynolds number decreases.
3. The XFOIL approach, which also models the laminar-to-turbulent transition, overestimates the lift coefficients, although the drag coefficients are acceptable for moderate angles of attack. Calibration is required when using XFOIL for thick airfoils.
4. The dynamic characteristics of an airfoil are strongly influenced by both the oscillation amplitude and reduced frequency. At lower Reynolds numbers, earlier boundary layer separation leads to an increase in the amplitude of the lift coefficient for small oscillation amplitudes.
5. Laminar separation bubbles cause significant hysteresis in the lift coefficient at low angles of attack and lead to notable oscillations in the aerodynamic forces. For the CL characteristics obtained using the k-ω SST model, oscillations are nearly absent, and the hysteresis in the CL is minimal.
6. Both the Reynolds number and the oscillation amplitude and frequency significantly affect the drag coefficient, as shown by both turbulence models used in this study. Specifically, when the Reynolds number is halved from 160k, the drag coefficient decreases substantially. Furthermore, increasing the amplitude at the same Reynolds number significantly reduced the ratio of the minimum to maximum drag coefficients (CD/CDmax).
7. An increase in the oscillation frequency from 1 Hz to 2 Hz results in a significant reduction in the oscillations of the aerodynamic force components at a Reynolds number of 80k.
8. The pitching motion of the NACA 0018 airfoil induced notable hysteresis at the transition location, even at small amplitudes.
9. This study demonstrates that the similarity in the aerodynamic loads obtained from the γ-Reθ and k-ω SST models can be partially explained by the reduced impact of laminar separation bubbles under the tested conditions. The results highlight that the γ-Reθ model provides consistent performance with negligible oscillations, particularly at lower frequencies and Reynolds numbers, while the k-ω SST model shows improved agreement with the γ-Reθ model at higher Reynolds numbers. These findings emphasize the importance of considering the laminar separation bubble dynamics and Reynolds number effects when selecting turbulence models for simulating pitching airfoils, especially in applications involving vertical-axis wind turbines.
10. While this study is limited to 2D URANS simulations, the authors recognize the importance of extending the analysis to 3D LES or DNS approaches. However, such simulations are currently beyond the available computational capacity, especially for Reynolds numbers exceeding 100,000 and under unsteady conditions. Preliminary estimates suggest that a 3D mesh resolution of at least 60 to 160 million elements is required, along with high-order discretization schemes and long simulation times. Therefore, the present study provides a foundational step toward more advanced and higher-fidelity investigations.
These findings provide new insights into the aerodynamic performance of thick airfoils at low Reynolds numbers and demonstrate the importance of turbulence modeling for accurately capturing flow physics.
Although the Transition SST model significantly improves the predictions compared with the standard k-ω SST model by incorporating transition physics, discrepancies with the experimental data persist, especially at higher angles of attack. These deviations stem from the model’s correlation-based formulation, which relies on local flow parameters rather than directly resolving the transition mechanisms from the Navier–Stokes equations. Our previous attempts to calibrate the model by adjusting the transition onset parameter s
1 [
37] yielded limited improvements. This highlights the need for more robust transition modeling or 3-D high-fidelity simulations in future studies to improve the accuracy in the stall region.


