Article

Spatial Differentiation of Profitability of Wind Turbine Investments in Poland

Department of International Economics and Market Analysis, Faculty of Law and Economic Sciences, University of Zielona Góra, 65-246 Zielona Góra, Poland
*
Author to whom correspondence should be addressed.
Energies 2025, 18(11), 2871; https://doi.org/10.3390/en18112871
Submission received: 3 May 2025 / Revised: 19 May 2025 / Accepted: 28 May 2025 / Published: 30 May 2025

Abstract

Dilemmas related to the development of demand for renewable energy encourage continuous evaluation of such investments in various locations, taking into account market and environmental conditions. The conducted study concerns the analysis of the profitability of investment in a 1.65 MW wind turbine with a hub height of 70 m in various zones in Poland. The analysis was performed using the clustering method (cluster analysis and the Czekanowski diagram). Computer simulation was also used using the Hybrid Optimization of Multiple Energy Resources (HOMER), ver. x64 3.18.4 software. As a result, three zones were distinguished that ensure differentiation in the rates of return on investment in wind energy. The authors positively verified the hypothesis about the spatial differentiation of profitability in relation to the examined factors. The justification for investments in wind farms was demonstrated and factors determining their profitability were indicated. It was emphasized that, in the case of wind farms, energy production is relatively predictable, which shapes the benefits for investors, and facilitates financial planning and long-term return on investment.

1. Introduction

The energy challenges of the modern world, such as the goals of the Paris Agreement to achieve net zero emissions by 2050 and limit the increase in global temperature to 1.5 °C, require the proper planning and implementation of actions towards the transition to renewable energy sources. As studies have indicated, the energy sector plays a key role in global decarbonization efforts. It is necessary to carry out a transformation process, which requires the optimization of energy systems in order to enable significant emission reductions, without compromising energy reliability and affordability for electricity consumers, industry, and global enterprises [1]. Studies have indicated that energy consumption has a significant impact on the development of a country. It has been confirmed that there is a positive bidirectional relationship between electricity consumption and the Human Development Index (HDI) [2]. Current trends indicate that maintaining global economic growth is associated with an increase in global energy demand. This process is additionally reinforced by the need to switch from fossil fuels, which contribute to environmental damage and are exhaustible, to more sustainable and renewable energy sources. Since electricity is currently the main energy vector, mechanisms using clean sources of its generation should be developed [3]. One of the possibilities of substitution is energy from wind. Switching to wind energy has a positive impact on mitigating climate change and contributes to the decarbonization process, and achieves low-emission goals, necessary to maintain ecological integrity and implement the concept of sustainable development. The scalable nature of wind technologies provides a number of applications, from small residential installations to large offshore wind farms, which allows for the implementation of a wide range of energy projects for a wide range of applications [4]. Renewable energy, including wind energy, is to be an alternative source of electricity supply to conventional methods. This is to be supported by numerous incentives, such as government support programs, political regulations, reliefs, and subsidies. As a result, wind energy systems are gaining popularity in the residential sector with the aim of reducing electricity bills and achieving energy independence [5]. The positive impact of technological development has contributed to the use of wind as a source of electricity generation worldwide. Currently, wind energy is considered to be an environmentally friendly and economically competitive energy source [6]. Public awareness of offshore turbine installations is also growing [7], and research is being conducted on their impact on carbon dioxide reduction [8].
Investments in wind energy still encounter many barriers, including social ones. Opponents emphasize the negative impact on the landscape, animal life, in terms of changes in their existence due to noise and the visibility of wind turbine structures [9], negative impact on breeding sites, loss of habitats, and collisions with power lines and fences of birds [10] and their migrations [11], potential changes in real estate prices [12,13], generation of external costs estimated at about 10% of the value of the wind turbine [14], bothersome noise for nearby houses at low wind speeds, which is not masked by wind noise [15]. Also, the subjective opinions of residents of some communes in Poland indicate that there is a relationship between the presence of wind turbines in their areas and support for their development [16]. In addition, operating wind farms cause shadow flicker and occupy relatively large areas [17]. A potential solution to these problems is to conduct appropriate projects, select the right location, create scenarios that take into account different cases, and conduct process simulations in terms of economic profitability or feasibility. Model simulations of wind farms have shown that, at the planning stage, it is crucial to create appropriate behavioral scenarios and minimize the risk of collisions between animals and the wind farm. Moreover, wind farms built in areas with lower traffic intensity do not have such a negative social impact. Studies based on individual based models (IBM) indicate that the key factor regarding the location of a wind farm is to know the feeding grounds of bird colonies, and the analysis of large transport networks and the implementation of construction investments should be effective in reducing bird mortality in connection with investments in wind energy [18]. These studies did not find any impact of wind farms on the mortality, productivity, and physiological condition of the studied bird population. It is also emphasized that wild birds show a tendency to avoid, and locating farms far from mountainous areas can reduce their collisions [19]. All these aspects are crucial in decision-making by the managers and decision-makers involved in landscape and environmental planning, and their implementation can help managers in planning future wind farms and managing currently operating projects [20]. Interested residents themselves often have mixed feelings about such investment projects. Research conducted by Johansen [21] showed that general public support for wind energy does not always translate into local support for wind farm projects. Polarizations in the assessment of renewable energy projects in societies mean that the subjective feelings of the stakeholders of wind energy projects will be clearly heterogeneous, as indicated by the collected statistical material. In turn, research by Slattery et al [22] showed that social concerns about the natural environment and support for wind energy is much more related to socio-economic factors that have a positive impact on economic dynamics than to moral and aesthetic criteria. The society clearly agreed that wind energy is safe and a “clean” source of energy. In this case, the greatest polarization concerned the impact on the attractiveness of the landscape and its uncertainty and instability. In the study by Azevêdo et al. [23], the factors influencing the feasibility analysis of the wind turbine investment project were identified, influencing the economic profitability of wind farms. The distinguished categories included location (type of surface and location of the turbine itself), economic criteria (all investment, operating costs and rents), political (dependent on the state policy—interest rates and taxes, price, attractiveness of financing), climatic (wind speed, air density, temperature), and technical (turbine height, service life and efficiency of the installation, rotor diameter, operating time, number of turbine blades, installed power). Therefore, in the planning process, economic, technical aspects, public opinion, and environmental issues should be considered. In addition, the location issues should be thoroughly examined. According to [24], such an area should meet the following conditions: maximum distance from the power source—1000 m; maximum distance from the main road network—1500 m; the area cannot be classified as protected; the distance from the migration routes of wild animals should be greater than 1500 m and from urban areas greater than 1000 m. In the case of an airport, this distance must be greater than 2.5 km. In this study, we assessed the conditions for the allocation and profitability of wind farms in Poland. The vast majority of studies are based on average data for a specific region or selected locations without taking into account regional conditions. At this stage, there is no clear approach to classifying regions based on a collective set of features. Based on the conducted analysis of the literature, a research gap can be indicated resulting from the lack of systematic regional studies on the location of wind farms in Poland, which would combine spatial analysis with the assessment of social acceptability, energy potential, environmental constraints, and economic profitability on the scale of provinces, counties, or communes. Presentation of the integration of environmental, infrastructural, and social data in a single model describes the justification for investing in wind turbines. This study includes references to environmental and social, technical and economic barriers as location criteria. Consequently, the aim was to search for regional models of wind farm location. To achieve this, simulation models of a single-family house were used and calibrated to accurately reflect its current energy efficiency and economic profitability based on forecasted parameters. The authors put forward a hypothesis about the occurrence of spatial differentiation of profitability corrected by factors, including carbon dioxide emissions, road network density, average wind speeds, share of agricultural land, and population density.

2. Research Methodology

2.1. Application of Simulation Models

The possibilities of using simulation models for wind energy have been used in a wide range of economic analyses, feasibility studies, payback periods or environmental impacts. Due to the use of geolocation systems, it is possible to analyze local wind conditions for a given location, and the introduced economic criteria, such as initial costs, subsidy size, implementation amount and credit period, investment time, discount rate, expected inflation, project duration, or estimated depreciation expenses, provide a full picture of the implementation of a given project in the analyzed time horizon. Simulation analyses related to wind turbine siting were used to estimate the financial profitability and payback periods of different small turbine models in Turkey. The results were used to help decision makers select the best option under given constraints. The wide spectrum of the analysis showed a range of payback rates ranging from 20 to even 112 years [25]. Similar studies were conducted in Malaysia for two locations and three variants (models) of turbines, where the feasibility of small wind turbines was analyzed based on the analysis of the current net cost. The simulation concerned installations at high altitudes and its purpose was to supply electricity to households. The simulation software used was Hybrid Optimization of Multiple Energy Resources (HOMER) ver. x64 3.18.4 [26]. The practical use of the simulation model was used by Augustowski and Kułyk [27], who studied the impact of subsidies and state support programs on the efficiency and estimated payback period of wind energy investments for individual households in Poland in various locations according to the Homer Pro tools. They have also been used in a wide range of hybrid analyses (Hybrid Renewable Energy Systems) as a synthesis of renewable and conventional energy resources in grid-connected and stand-alone modes [28] or for the assessment of energy generation, greenhouse gas emissions, net current costs and average cost of electricity production [29], for commercial purposes, such as residential complexes [30] and hybrid solutions in a single-family home [31], as well as for social purposes, such as energy demand in schools [32] or for the needs of the Rajasthan Technical University campus in Kota, Rajasthan, India [33], and an analysis of the use of wind turbines for the production of renewable hydrogen [34]. These analyses therefore address three main issues of electrification, which include system reliability, economics, and environmental issues [35].

2.2. Research Scope and Research Methods
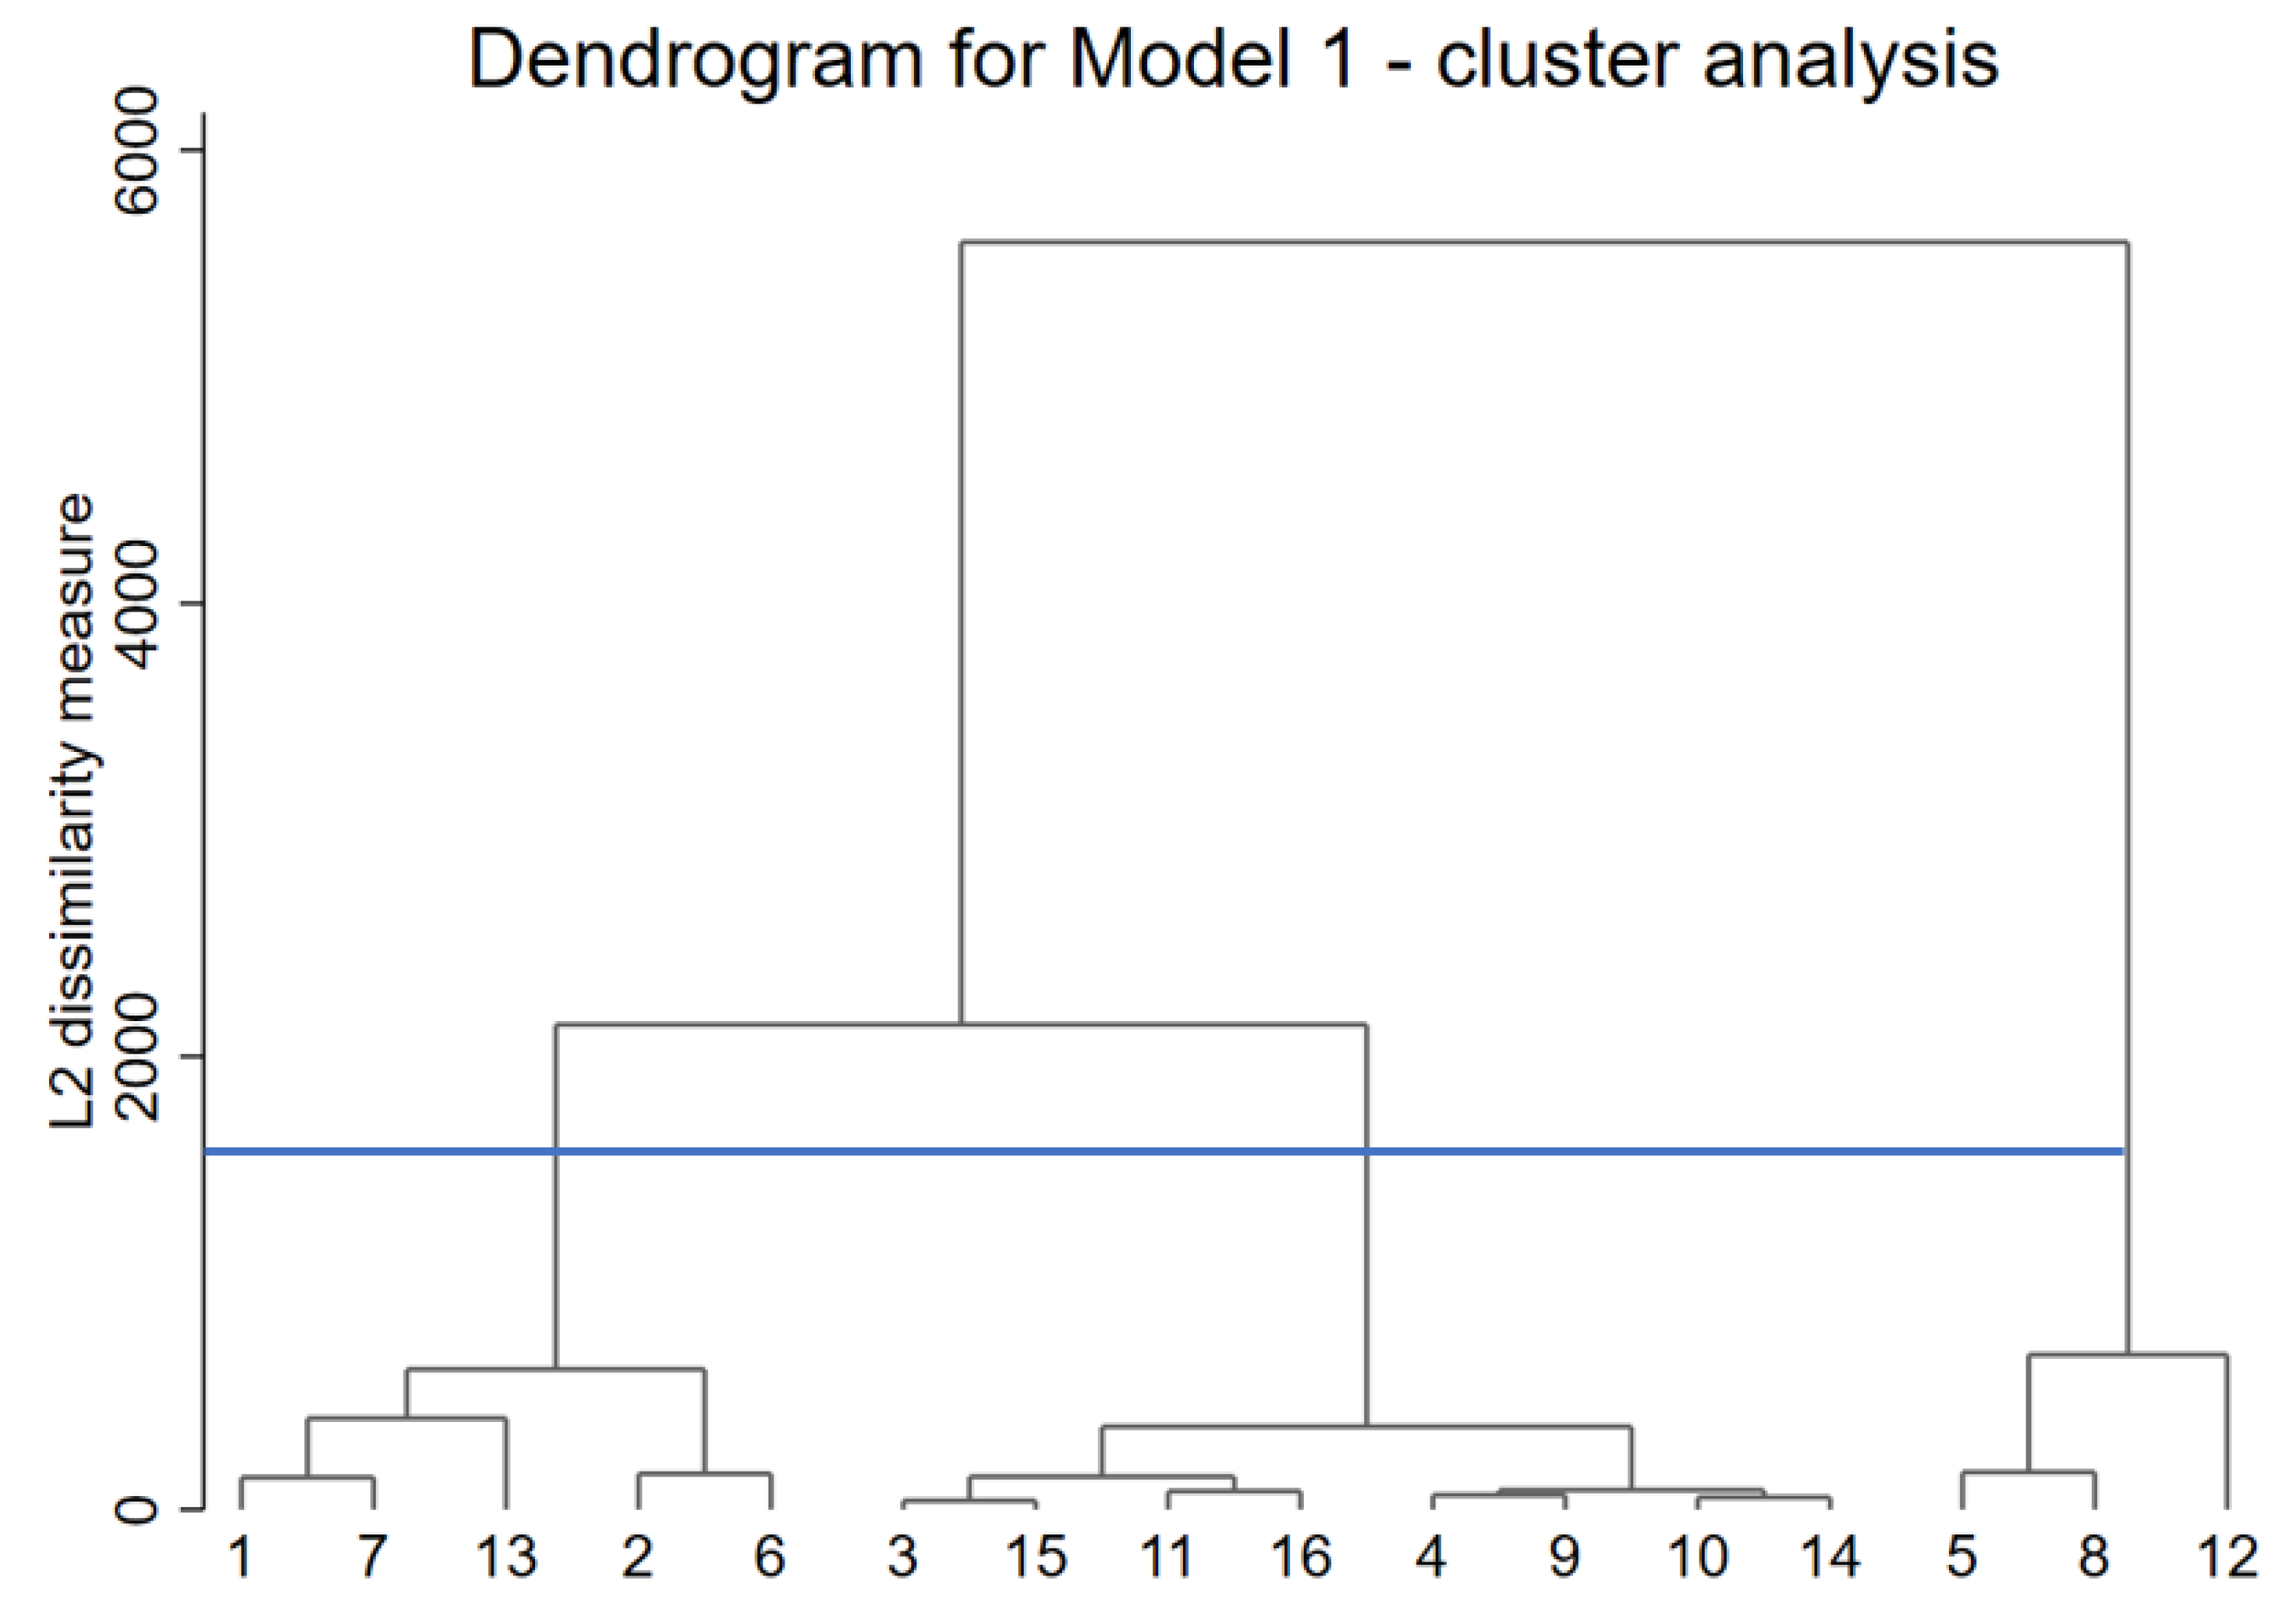
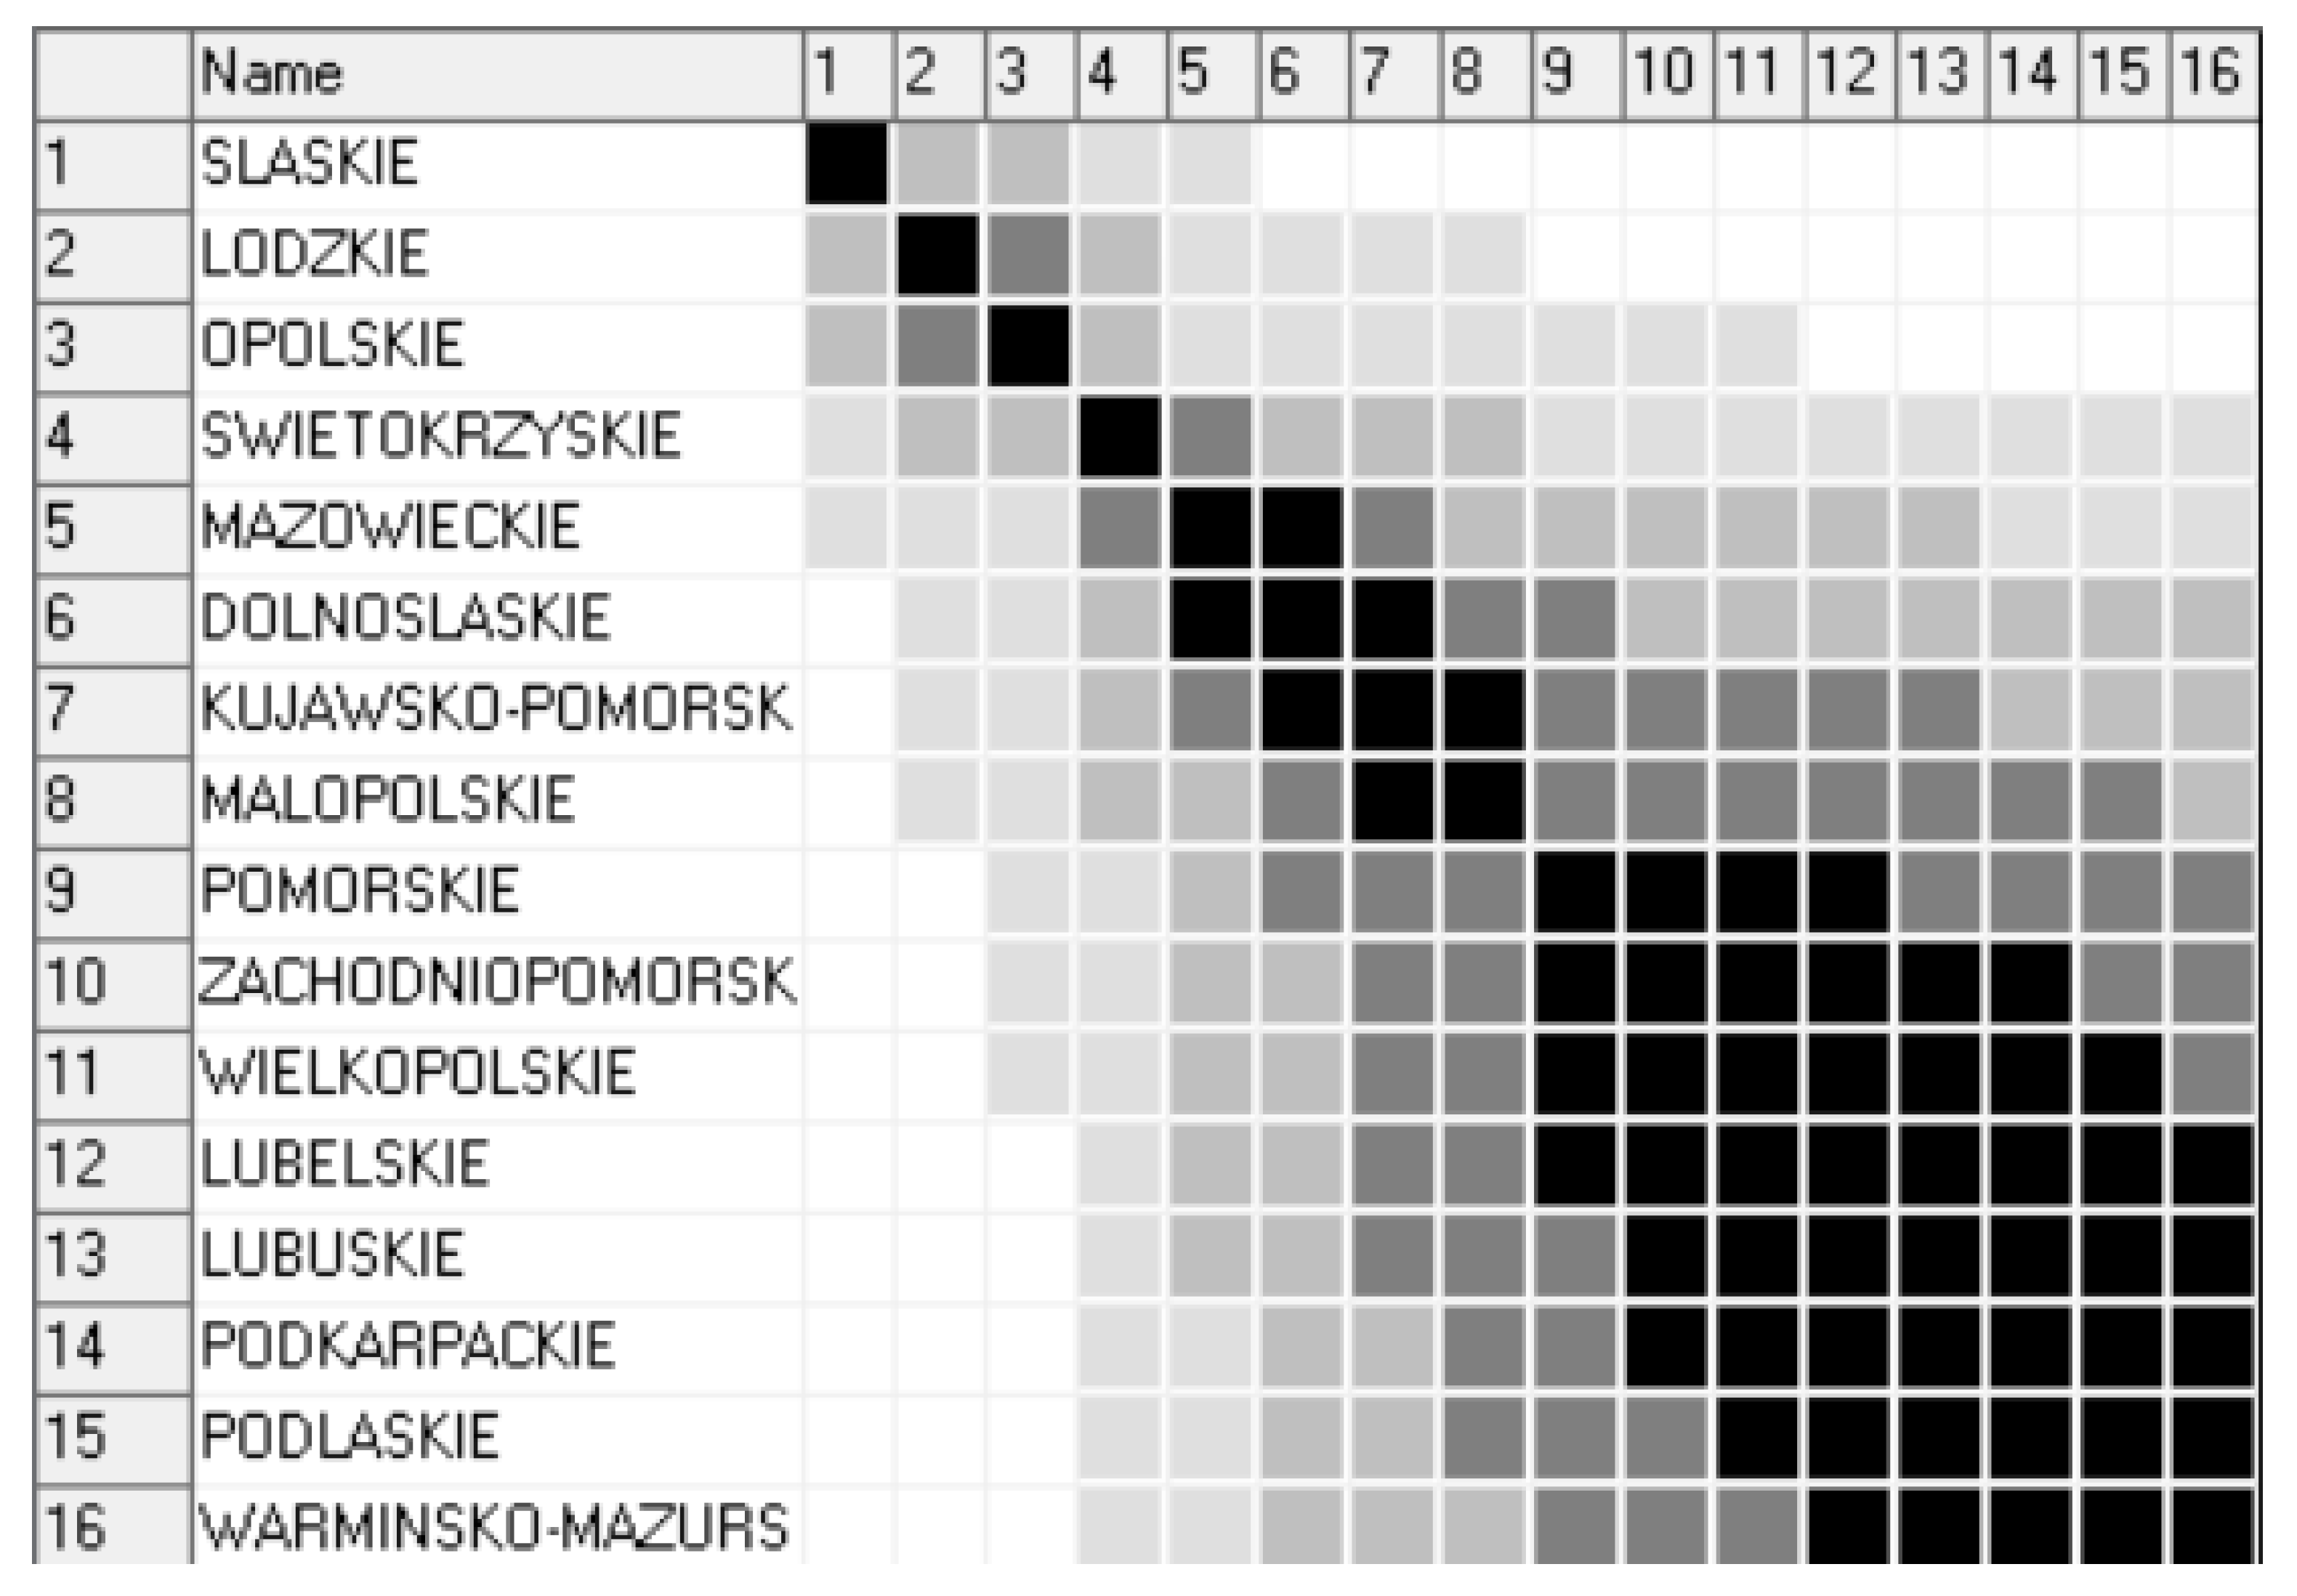
A broad review of the studies shows that wind energy makes a significant contribution to the environment, although the installation of wind turbines in a given location can only be profitable after a thorough feasibility study. Before the project is implemented, a proper feasibility study of the turbine installation is required, i.e., before any binding investment decisions are made [36]. As a rule, these analyses are related to a specific case and location that decision makers are considering for a given investment site. In this study, the authors identified the main factors most frequently mentioned in the literature to group the voivodeships in Poland into homogeneous groups in order to determine the potential locations for wind turbine investment. As indicated by Hosseinalizadeh et al. [37], climatic and economic factors should be considered when selecting a location. The literature research conducted by Rediske et al. [38] showed that wind speed is the most important factor determining the decision, followed by wind density, and the proximity to roads, while protected areas, watercourses, and species migration routes were the most frequently mentioned limiting factors in the literature. In the study by Zagubień and Wolniewicz [39], it was shown that wind zones characterizing the wind potential in open areas do not have a significant impact on wind conditions in built-up areas located in the area. However, this analysis concerned selected urban agglomerations of various sizes, located in different wind zones in Poland, the choice of which was rather arbitrary. Wind speed is the main and most frequently analyzed factor concerning the location of wind turbines [40,41,42,43,44], and the optimal wind speed range is within the range of 7–25 m/s. Numerous studies have indicated the great importance of the density of road networks, taking into account provincial borders, the presence of airports, port areas, urban and highly industrialized areas, or power supply networks [24], for the measurement of which satellite tools and techniques [45] and geographic information systems [46,47] are used, as well as with the use of multi-criteria constraints [48]. Due to the fact that large structures affect the local landscape, are visible from considerable distances, and operating turbines emit noise, it is important to take into account the population density in a given area. Taking into account safety considerations, their placement in built-up areas should be excluded. It is also worth conducting a survey of local public opinion [49]. The analysis should also include agricultural land and agricultural areas, which requires securing a balance between land occupation and use, while maintaining and respecting the environmental, cultural, and landscape values of these privileged territories [50,51]. The environmental aspect is taken into account by reducing the carbon footprint. Taking into account the above suggestions, when making a taxonomy of voivodeships in Poland based on the literature, factors such as carbon dioxide emissions, road network density, average wind speeds, share of agricultural land, and population density were selected (Table 1).
The division was made using two alternative taxonomic methods. The methods used consisted of several procedures. In the case of cluster analysis, after selecting factors defining input variables (Table 1) for each province in Poland, the Ward method was used. The original dendrogram created in this way was divided into homogeneous groups using the Caliński–Harabasz and Duda–Hart tests. Determining the number of clusters revealed groups of regions similar to each other, which were formally confirmed by the Wilks’ lambda, Pillai’s trace, Lawley–Hotelling trace, and Roy’s largest root statistical tests. In the case of Czekanowski’s analysis, the first stage involved estimating the distance matrix using the Euclidean method, based on which clustering was performed using the simple genetic algorithm for 2000 generations and 50 variants. The clusters obtained using both methods were compared and a simulation analysis was performed on this basis. Due to the fact that the taxonomic analysis concerns a cross-section of one time period, the year 2023 was used for the sake of data completeness. Local wind speeds were estimated as average annual values for a given period. Based on the data thus adopted, the clustering process was performed at a later stage.

3. Results

In order to determine the homogeneity of regions, and taking into account the analyzed factors, the Ward method was used. The correlation of factors was previously assessed. The general form of the dendrogram is presented in Figure 1.
Visual analysis indicates a consistent, three-cluster division into homogeneous areas with different frequencies of occurrence. This is indicated by the moment of cut-off at the first branch. The blue line indicates the moment of cut-off and cluster formation. The formal determination of the number of clusters requires the use of test statistics. For this purpose, the pseudo-F Caliński–Harabasz test and the Duda–Hart test were performed (Table 2). The use of these procedures is justified due to their independence from the method. This means that the procedure should not depend on the use of a given clustering method [52].
The Caliński–Harabasz and Duda–Hart methods indicate a stopping rule. In this case, the default value is determined by the pseudo-F index for Caliński–Harabasz and the Je(2)/Je(1) index for Duda–Hart. The advantage of the Caliński–Harabasz method is that it can be used for both hierarchical and non-hierarchical cluster analyses, while the Duda–Hart statistic is used only for hierarchical cluster analyses, which was the case here. For 16 voivodeships, it is rational to adopt three to four clusters. In this case, the Caliński–Harabasz stopping rule takes on similar values. In the case of Duda–Hart, the highest value of the Je(2)/Je(1) stopping rule is 0.3601, which corresponds to four groups. However, such a division causes the occurrence of a single-element fourth cluster. It is therefore reasonable to adopt three groups. The dendrogram for the cluster analysis conducted in this way is presented in Figure 2.
In order to formally confirm the validity of the division into three groups, four statistical tests were performed for which the Prob > F values reached a satisfactory level below 5% (Table 3).
The obtained clusters were characterized by different numbers: cluster G1—five objects, G2—eight objects, and cluster G3—three objects (Table 4).
The cluster analysis using Ward’s method was supplemented by a taxonomic analysis using the Czekanowski diagram method using a simple genetic algorithm. The Euclidean distance matrix was used for the assessment, and the formal analysis of the selection of the number of groups was determined based on the distance between following records in the diagram (Figure 3).
The distance between subsequent objects is the largest at the first stage of grouping, which indicates the need for further divisions. The same situation occurs for three clusters. Further divisions show a strong downward trend, which indicates that further divisions are unnecessary. Further attempts to combine clusters begin to group objects that differ less and less. This justifies the selection of three clusters, which is consistent with previous analyses for the dendrogram (Figure 2). The clustering method according to the simple genetic algorithm for 2000 generations and 50 variants, according to the Euclidean distance method, allowed for the identification of three groups (Figure 4).
Both analyses confirm the occurrence of the same objects within each cluster. This creates the possibility of conducting a simulation analysis for selected locations within each cluster group, and indicating the potential differences in the analyzed factors on the profitability of investing in a wind turbine. Due to the differences in the number of objects representing the given clusters, the number of potential locations within a given cluster was assumed accordingly: cluster G1—five locations, cluster G2—four locations, cluster G3—three locations. Due to the fact that the life cycle of an investment project in a wind turbine is about 20–25 years, it is necessary to assume a priori the economic parameters, the parameters for the turbine and, in the case of bilateral transactions between the grid and the prosumer, the amounts for the purchase and resale of electricity. The analyses were performed using the Homer Pro x64 3.18.4 software. The adopted model parameters are presented in Table 5.
Despite the optimistic forecasts of the National Bank of Poland, the inflation rate was assumed at 6%, which is a cautious option. A more rigorous adoption of the price growth index thus corrects the real interest rate and, in some variants, makes the obtained results more probable. The discount rate for this type of onshore projects is usually 5–8%, and for high-risk projects even up to 12%. In the analyzed case, the discount rate was assumed at 7.5%, which is in the upper range for onshore wind farms. The price of the turbine was estimated according to the convention of 1 MW ≈ 1 million euros, and on this basis further cost estimates were made. When analyzing the fixed capital cost system, all costs related to the construction and installation of the project were taken into account, which consist of the cost of turbines—purchase and transport, foundation cost, installation cost, cost related to infrastructure, grid connection costs, and administrative costs. Operational and maintenance (O&M) costs incurred after the turbine is launched are typically estimated at 2–4%. In this case, they are the upper limit of this range. Fixed O&M typically accounts for 30–50% of the total O&M costs, which is within the acceptable range at its upper limit, which protects the simulation against the potential risk of underestimated costs. The replacement variant includes the risk of full replacement of larger components, which is realistic in the case of older turbines, or in the event of a large-scale failure. In the case of the purchase and resale of energy, market rates and average annual buy-back amounts adopted by the Polish power grids (PSE) were assumed. The analyzed Vestas V82 turbine (1.65 MW) is a Danish product, most common in Polish wind energy. The assumed hub height is 70 m. The exchange rate was estimated at PLN/4.19 euros. The analyzed model assumes the connection of the turbine to the network and power supply to single-family houses with the consumption for the 2 + 1 family model estimated at 9.59 kWh/d (Figure 5).

4. Discussion

The statistical consumption of electricity by households differs significantly from the consumption in commercial, industrial, or community areas. For a household, a decrease in demand is observed during the night hours, moderate consumption in the morning hours, and an increase in the afternoon hours. In addition, the seasonal profile indicates a decrease in consumption in the summer months (Figure 6a,b).
The annual consumption profile is presented in Figure 7. Energy consumption increases during the day, reaching a peak in the afternoon and evening hours (18:00–24:00), which corresponds to the daily profile model. It is characterized by stable energy consumption—energy consumption in the household is relatively stable throughout the year, without clear seasonal peaks, with clear daily fluctuations in energy consumption, with the lowest consumption at night and the highest in the afternoon and evening hours. In the analyses carried out, special attention was paid to the payback period, the internal rate of return (IRR), and the return on investment indicator (ROI) (Table 6).
The IRR determines the internal rate of return used in assessing the profitability of investments, including investments in wind turbines. This is the discount rate at which the net present value (NPV) of all cash flows from the investment is zero and is a determinant of the expected rate of return on a given investment, taking into account the changes in the value of money over time. Thus, higher IRR values indicate more profitable investments in wind turbines. This indicator also takes into account the initial investment costs, future revenues from the sale of electricity, and the costs of operating and maintaining the turbine. The net present cost was estimated at 3.24 million euros, and the initial capital at 2.70 million euros. The LCOE (E/kWh) = 53.41. Since the actual energy production by a wind turbine also depends on the efficiency of the wind turbine in terms of extracting energy from the wind, the height at which the turbine is located, and the individual design features, differences in the location above sea level were taken into account in the simulation process. In the simulation process, it is also important to take into account the influence of location factors, including nearby trees and buildings, because they can affect the measurement of wind speed data [53].
The presented results indicate spatial differentiation of profitability of investing in wind turbines. The adopted set of factors significantly differentiates the payback period in each zone. The most optimistic values were shown for area I, the worst for III. It is also worth pointing out that some locations considered for cluster III did not generate a return over the entire life cycle of the turbine, which indicated investment unprofitability. Economic practice has shown that often large clusters of wind farms are located on the border areas of two zones. Therefore, such differentiation is not so visible for each analyzed case. The energy profile and household demand for energy also play a significant role, which, together with local conditions, determines the production capabilities of the turbine. In the first zone, all results are below average in terms of the payback period of investment in wind farms. In the second zone, they are close to the average result. In the third zone, they are always above average. The first zone is the most extensive in terms of area, which justifies, in extreme cases, building farms close to its border (if other conditions indicate the need for allocation in a zone other than the first) or only in the first zone. In the case of the third zone, the rate of return is relatively low, which means that, in the case of using a loan, the investment is unprofitable (7–10%). In other areas, even with 100% use of external financing, the investment provides economic benefits. Of course, the interest rate on investment loans should be considered individually, because it depends on many variables, such as the type of investment, the size of the company, the type of security, or the length of the loan. Therefore, the level of inflation and the reduction of this rate in the long term are also determining factors. Payback periods may vary depending on the sale and purchase prices of energy, the cost of the turbine, O&M costs, and other cost groups. In such cases, the location factor may determine the final profitability of the project.
Wind energy is one of the variants of renewable energy sources. Solar energy and energy from biomass are also used in Poland. Research conducted in 2022 in Poland indicated that the most popular RES technologies in which respondents plan to invest are photovoltaics (57.8%) and biomass (17.6%) [54]. The comparison of profitability should concern similar parameters and estimated duration of a given project. In the case of photovoltaics, the simple payback period for selected cities in Poland was shorter by about 2 years (compared to zone I) than in the case of wind energy [55]. In turn, research [56] has shown that the discounted payback period of the investment in a photovoltaic power plant in Poland for the version with a subsidy was 9 years, while in the variant without a subsidy this period was extended to 13 years. In turn, research [57] has indicated that, depending on the installed capacity, the payback period may be as long as 12–13.5 years. This confirms the conclusion [58] that, with current settlements, an individual PV installation will pay off after about 10 years. In the case of hybrid solutions, this assessment is more complex and depends on the variant adopted.

5. Conclusions

The conducted research on the feasibility of investing in wind farms in various regions of Poland, taking into account economic, social, and technical factors, allowed for the formulation of several conclusions. This study draws attention to the fact that the profitability of such installations varies depending on the location. It also emphasizes that rising energy prices and technological development increase the profitability of such installations, which makes them an attractive option for both households and businesses. The article also compares the initial costs and the payback period in various parts of Poland, indicating that, in some regions, thanks to public support, the investment may pay off faster.
1. Payback periods and IRR and ROI were the most advantageous in zone I, and extended as we moved to subsequent zones. It should be noted that there were also locations in zone III for which the payback period was relatively long, undermining the profitability of the investment, especially when financed from external sources. In the case of zone III, it becomes more advantageous to allocate in other zones, but in areas adjacent to recipients located in zone III.
2. The adopted differentiating factors turned out to have a significant impact on determining the location potential for investments in wind turbines in Poland. Such factors that spatially differentiate the profitability of investments in wind farms include the density of the road network, average wind speeds, the share of agricultural land, and population density. These factors spatially differentiate the allocative profitability of investments in wind energy.
3. In order to more precisely determine the indicated factors on profitability, such as inflation, energy costs, or turbine prices, econometric modeling is recommended to determine the impact of potential independent variables on the dependent variable for a specific region or group of regions (using panel data). Such supplementary studies can be a starting point for further considerations to bridge the potential research gap.
4. The variability of energy obtained from wind in Poland shows differences in individual months. A higher level of energy acquisition in the autumn and winter periods indicates the justification for using hybrid solutions. Only the initial investment costs, which are relatively high, remain a certain problem. This encourages the use of specific incentives from the state to reduce these costs for investors.
5. It is worth noting the relatively low operating costs of such investments. After the wind farm is built, the operating and maintenance costs are relatively low. Wind turbines require only occasional servicing and there are no fuel costs. Therefore, despite the high initial investment cost, in the long term such investments in Polish conditions will generate stable and predictable income, especially in the case of their allocation in the first of the distinguished zones. This also shapes the reduction of costs in the long term and thus the ability to reduce electricity prices, which creates a favorable perspective for both investors and consumers. In the case of Poland, such investments allow for the reduction of high CO2 emissions and, in a broader sense, reduce the dependence on fossil fuels, such as coal and gas, which are harmful to the environment.

Author Contributions

Conceptualization, Ł.A. and P.K.; methodology, Ł.A. and P.K.; software, Ł.A. and P.K.; validation, Ł.A. and P.K.; formal analysis, Ł.A. and P.K.; investigation, Ł.A. and P.K.; resources, Ł.A. and P.K.; data curation, Ł.A. and P.K.; writing—original draft preparation, Ł.A. and P.K.; writing—review and editing, Ł.A. and P.K.; visualization, Ł.A. and P.K. All authors have read and agreed to the published version of the manuscript.

Funding

This research received no external funding.

Data Availability Statement

Local Data Bank, Central Statistical Office; https://bdl.stat.gov.pl/bdl/dane/podgrup/temat (accessed on 14 April 2025).

Conflicts of Interest

The authors declare no conflicts of interest.

References

  1. Wärtsilä Energy. Crossroads to Net Zero: Choosing the Optimal Path to a Renewable Energy Future—Report 2024; Wärtsilä Energy: Helsinki, Finland, 2024. [Google Scholar]
  2. Becerra, M.; Morán, J.; Jerez, A.; Cepeda, F.; Valenzuela, M. Wind Energy Potential in Chile: Assessment of a Small Scale Wind Farm for Residential Clients. Energy Convers. Manag. 2017, 140, 71–90. [Google Scholar] [CrossRef]
  3. Souza Rocha, L.C.; Aquila, G.; Rotela Junior, P.; de Paiva, A.P.; Pamplona, E.O.; Balestrassi, P.P. A Stochastic Economic Viability Analysis of Residential Wind Power Generation in Brazil. Renew. Sustain. Energy Rev. 2018, 90, 412–419. [Google Scholar] [CrossRef]
  4. Duranay, Z.B.; Güldemir, H.; Coşkun, B. The Role of Wind Turbine Siting in Achieving Sustainable Energy Goals. Processes 2024, 12, 2900. [Google Scholar] [CrossRef]
  5. Predescu, M. Economic Evaluation of Small Wind Turbines and Hybrid Systems for Residential Use. Renew. Energy Environ. Sustain. 2016, 1, 33. [Google Scholar] [CrossRef]
  6. Botelho, A.; Arezes, P.; Bernardo, C.; Dias, H.; Pinto, L.M.C. Effect of Wind Farm Noise on Local Residents’ Decision to Adopt Mitigation Measures. Int. J. Environ. Res. Public Health 2017, 14, 753. [Google Scholar] [CrossRef]
  7. Cronin, Y.; Cummins, V.; Wolsztynski, E. Public Perception of Offshore Wind Farms in Ireland. Mar. Policy 2021, 134, 104814. [Google Scholar] [CrossRef]
  8. Bailey, H.; Brookes, K.L.; Thompson, P.M. Assessing Environmental Impacts of Offshore Wind Farms: Lessons Learned and Recommendations for the Future. Aquatic Biosyst. 2014, 10, 8. [Google Scholar] [CrossRef]
  9. Skarin, A.; Sandström, P.; Alam, M. Out of sight of wind turbines—Reindeer response to wind farms in operation. Ecol. Evol. 2018, 8, 9906–9919. [Google Scholar] [CrossRef]
  10. Veltheim, I.; Cook, S.; Palmer, G.C.; Hill, F.A.R.; McCarthy, M.A. Breeding home range movements of pre-fledged brolga chicks, Antigone rubicunda (Gruidae) in Victoria, Australia—Implications for wind farm planning and conservation. Glob. Ecol. Conserv. 2019, 20, e00703. [Google Scholar] [CrossRef]
  11. Nishibayashi, N.; Kitamura, W.; Yoshizaki, S. Comparison of the Home Ranges of Mountain Hawk-Eagles during Different Phases of Wind Farm Construction. Ornithol. Sci. 2022, 21, 63–70. [Google Scholar] [CrossRef]
  12. Laposa, S.; Mueller, A. Wind Farm Announcements and Rural Home Prices: Maxwell Ranch and Rural Northern Colorado. J. Sustain. Real Estate 2010, 2, 383–402. [Google Scholar] [CrossRef]
  13. Hoen, B.; Atkinson-Palombo, C. Wind Turbines, Amenities and Disamenities: A Study of Home Value Impacts in Densely Populated Massachusetts. J. Real Estate Res. 2016, 38, 473–504. [Google Scholar] [CrossRef]
  14. Dröes, M.I.; Koster, H.R.A. Renewable energy and negative externalities: The effect of wind turbines on house prices. J. Urban Econ. 2016, 96, 121–141. [Google Scholar] [CrossRef]
  15. Iannace, G. Effects of noise from wind turbines inside home. Wind Eng. 2015, 40, 25–30. [Google Scholar] [CrossRef]
  16. Świdyńska, N.; Witkowska-Dąbrowska, M.; Jakubowska, D. Influence of Wind Turbines as Dominants in the Landscape on the Acceptance of the Development of Renewable Energy Sources in Poland. Energies 2024, 17, 3268. [Google Scholar] [CrossRef]
  17. Katsaprakakis, D.A. A Review of the Environmental and Human Impacts from Wind Parks: A Case Study for the Prefecture of Lasithi, Crete. Renew. Sustain. Energy Rev. 2012, 16, 2850–2863. [Google Scholar] [CrossRef]
  18. Warwick-Evans, V.; Atkinson, P.W.; Walkington, I.; Green, J.A. Predicting the impacts of wind farms on seabirds: An individual-based model. J. Appl. Ecol. 2018, 55, 503–515. [Google Scholar] [CrossRef]
  19. Estellés-Domingo, I.; López-López, P. Effects of wind farms on raptors: A systematic review of the current knowledge and the potential solutions to mitigate negative impacts. Anim. Conserv. 2024, 1–19. [Google Scholar] [CrossRef]
  20. Carrete, M.; Sánchez-Zapata, J.A.; Benítez, J.R.; Lobón, M.; Montoya, F.; Donázar, J.A. Mortality at wind-farms is positively related to large-scale distribution and aggregation in griffon vultures. Biol. Conserv. 2012, 147, 102–108. [Google Scholar] [CrossRef]
  21. Johansen, K. Local support for renewable energy technologies? Attitudes towards local near-shore wind farms among second home owners and permanent area residents on the Danish coast. Energy Policy 2019, 132, 691–701. [Google Scholar] [CrossRef]
  22. Slattery, M.C.; Johnson, B.L.; Swofford, J.A.; Pasqualetti, M.J. The predominance of economic development in the support for large-scale wind farms in the U. S. Great Plains. Renew. Sustain. Energy Rev. 2012, 16, 3690–3701. [Google Scholar] [CrossRef]
  23. Azevêdo, R.d.O.; Rotela Junior, P.; Chicco, G.; Aquila, G.; Souza Rocha, L.C.; Peruchi, R.S. Identification and Analysis of Impact Factors on the Economic Feasibility of Wind Energy Investments. Int. J. Energy Res. 2021, 45, 3671–3697. [Google Scholar] [CrossRef]
  24. Ouammi, A.; Ghigliotti, V.; Robba, M.; Mimet, A.; Sacile, R. A Decision Support System for the Optimal Exploitation of Wind Energy on Regional Scale. Renew. Energy 2012, 37, 299–309. [Google Scholar] [CrossRef]
  25. Ugur, E.; Elma, O.; Ugur, S.; Selamogullari, M.; Tanrioven, M.; Uzunoglu, M. Financial Payback Analysis of Small Wind Turbines for a Smart Home Application in Istanbul/Turkey. In Proceedings of the 2013 International Conference on Renewable Energy Research and Applications, ICRERA 2013, Madrid, Spain, 20–23 October 2013; IEEE: Istanbul, Turkey, 2013; pp. 220–224. [Google Scholar] [CrossRef]
  26. Alkahtani, A.; Alkawsi, G.; Mohamed, Y.; Lim, C.W.; Tiong, S.K.; Khudari, M. Viability Assessment of Small-Scale On-Grid Wind Energy Generator for Households in Malaysia. Energies 2021, 14, 3391. [Google Scholar] [CrossRef]
  27. Augustowski, Ł.; Kułyk, P. Conditions for the Development of Wind Energy for Individual Consumers: A Case Study in Poland. Energies 2024, 17, 3358. [Google Scholar] [CrossRef]
  28. Bahramara, S.; Parsa Moghaddamn, M.; Haghifam, M.R. Optimal planning of hybrid renewable energy systems using HOMER: A review. Renew. Sustain. Energy Rev. 2016, 62, 609–620. [Google Scholar] [CrossRef]
  29. Khalil, L.; Bhatti, K.L.; Awan, M.A.I.; Riaz, M.; Khalil, K.; Alwaz, N. Optimization and Designing of Hybrid Power System Using HOMER Pro. Mater. Today Proc. 2021, 47, 110–115. [Google Scholar] [CrossRef]
  30. Abbaszadeh, M.A.; Ghourichaei, M.J.; Mohammadkhani, F. Thermo-Economic Feasibility of a Hybrid Wind Turbine/PV/Gas Generator Energy System for Application in a Residential Complex in Tehran, Iran. Environ. Prog. Sustain. Energy 2020, 39, e13396. [Google Scholar] [CrossRef]
  31. Bulut, F.; Lüy, M.; Çam, E. The Effects of Incentives on Renewable Energy Resources for Home Users. Int. J. Energy Appl. Technol. 2017, 4, 94–100. [Google Scholar]
  32. Chisale, S.W.; Eliya, S.; Taulo, J. Optimization and Design of Hybrid Power System Using HOMER Pro and Integrated CRITIC-PROMETHEE II Approaches. Green Technol. Sustain. 2023, 1, 100005. [Google Scholar] [CrossRef]
  33. Swarnkar, N.M.; Gidwani, L.; Sharma, R. An Application of HOMER Pro in Optimization of Hybrid Energy System for Electrification of Technical Institute. In Proceedings of the 2016 International Conference on Energy Efficient Technologies for Sustainability (ICEETS), Nagercoil, India, 7–8 April 2016; IEEE: Nagercoil, India, 2016; pp. 56–61. [Google Scholar] [CrossRef]
  34. Mostafaeipour, A.; Qolipour, M.; Goudarzi, H. Feasibility of Using Wind Turbines for Renewable Hydrogen Production in Firuzkuh, Iran. Front. Energy 2019, 13, 494–505. [Google Scholar] [CrossRef]
  35. Mishra, S.; Panigrahi, C.K.; Kothari, D.P. Design and Simulation of a Solar–Wind–Biogas Hybrid System Architecture Using HOMER in India. Int. J. Ambient Energy 2016, 37, 184–191. [Google Scholar] [CrossRef]
  36. Mohammadia, K.; Mostafaeipour, A. Economic Feasibility of Developing Wind Turbines in Aligoodarz, Iran. Energy Convers. Manag. 2013, 76, 645–653. [Google Scholar] [CrossRef]
  37. Hosseinalizadeh, R.; Rafiei, E.S.; Shafiei Alavijeh, A.; Ghaderi, S.F. Economic Analysis of Small Wind Turbines in Residential Energy Sector in Iran. Sustain. Energy Technol. Assess. 2017, 20, 58–71. [Google Scholar] [CrossRef]
  38. Rediske, G.; Burin, H.P.; Rigo, P.D.; Rosa, C.B.; Michels, L.; Siluk, J.C.M. Wind Power Plant Site Selection: A Systematic Review. Renew. Sustain. Energy Rev. 2021, 148, 111293. [Google Scholar] [CrossRef]
  39. Zagubień, A.; Wolniewicz, K. Energy Efficiency of Small Wind Turbines in an Urbanized Area—Case Studies. Energies 2022, 15, 5287. [Google Scholar] [CrossRef]
  40. Azadeh, A.; Ghaderi, S.F.; Nasrollahi, M.R. Location Optimization of Wind Plants in Iran by an Integrated Hierarchical Data Envelopment Analysis. Renew. Energy 2011, 36, 1621–1631. [Google Scholar] [CrossRef]
  41. Koc, A.; Turk, S.; Şahin, G. Multi-Criteria of Wind-Solar Site Selection Problem Using a GIS-AHP-Based Approach with an Application in Igdir Province/Turkey. Environ. Sci. Pollut. Res. 2019, 26, 32298–32310. [Google Scholar] [CrossRef]
  42. Tavner, P.; Edwards, C.; Brinkman, A.; Spinato, F. Influence of Wind Speed on Wind Turbine Reliability. Wind Eng. 2006, 30, 55–72. [Google Scholar] [CrossRef]
  43. Sedaghat, A.; Hassanzadeh, A.; Jamali, J.; Mostafaeipour, A.; Chen, W.-H. Determination of Rated Wind Speed for Maximum Annual Energy Production of Variable Speed Wind Turbines. Appl. Energy 2017, 205, 781–789. [Google Scholar] [CrossRef]
  44. Jena, D.; Rajendran, S. Estimation of Effective Wind Speed Based Control of Wind Turbines: A Review. Renew. Sustain. Energy Rev. 2015, 43, 1046–1062. [Google Scholar] [CrossRef]
  45. Daneshvar Rouyendegh, B.; Yildizbasi, A.; Arikan, Ü.Z.B. Using Intuitionistic Fuzzy TOPSIS in Site Selection of Wind Power Plants in Turkey. In Applications of Fuzzy Multicriteria Decision Making to Complex Engineering Problems; Springer: Berlin/Heidelberg, Germany, 2018. [Google Scholar] [CrossRef]
  46. Sliz-Szkliniarz, B.; Vogt, J. GIS-Based Approach for the Evaluation of Wind Energy Potential: A Case Study for the Kujawsko–Pomorskie Voivodeship. Renew. Sustain. Energy Rev. 2011, 15, 1696–1707. [Google Scholar] [CrossRef]
  47. Azizi, A.; Malekmohammadi, B.; Jafari, H.R.; Nasiri, H.; Parsa, V.A. Land Suitability Assessment for Wind Power Plant Site Selection Using ANP-DEMATEL in a GIS Environment: Case Study of Ardabil Province, Iran. Environ. Monit. Assess. 2014, 186, 6695–6709. [Google Scholar] [CrossRef] [PubMed]
  48. Díaz-Cuevas, P. GIS-Based Methodology for Evaluating the Wind-Energy Potential of Territories: A Case Study from Andalusia (Spain). Energies 2018, 11, 2789. [Google Scholar] [CrossRef]
  49. Clarke, A. Wind Farm Location and Environmental Impact. Int. J. Ambient Energy 1989, 10, 129–144. [Google Scholar] [CrossRef]
  50. Poggi, F.; Firmino, A.; Amado, M. Planning Renewable Energy in Rural Areas: Impacts on Occupation and Land Use. Energy 2018, 155, 630–640. [Google Scholar] [CrossRef]
  51. Hanssen, F.; May, R.; van Dijk, J.; Rød, J.K. Spatial Multi-Criteria Decision Analysis Tool Suite for Consensus-Based Siting of Renewable Energy Structures. J. Environ. Assess. Policy Manag. 2018, 20, 1840003. [Google Scholar] [CrossRef]
  52. Milligan, G.W.; Cooper, M.C. An Examination of Procedures for Determining the Number of Clusters in a Data Set. Psychometrika 1985, 50, 159–179. [Google Scholar] [CrossRef]
  53. Clarke, S. Electricity Generation Using Small Wind Turbines for Home or Farm Use; FACTSHEET 18-005, AGDEX 767; Ontario Ministry of Agriculture, Food and Rural Affairs: Guelph, ON, USA, 2018; pp. 1–15. [Google Scholar]
  54. Wyszomierski, R.; Bórawski, P.; Bełdycka-Bórawska, A. Competitive Potential of Plant Biomass in Poland Compared to Other Renewable Energy Sources for Heat and Electricity Production. Energies 2025, 18, 1892. [Google Scholar] [CrossRef]
  55. Augustowski, Ł.; Kułyk, P. The Economic Profitability of Photovoltaic Installations in Households in Poland from a New Policy Perspective. Energies 2023, 16, 7595. [Google Scholar] [CrossRef]
  56. Gradziuk, P.; Gradziuk, B. Economic Profitability Of Investment in A Photovoltaic Plant In South-East Poland. Ann. Pol. Assoc. Agric. Agribus. Econ. 2019, 21, 124–133. [Google Scholar] [CrossRef]
  57. Brodziński, Z.; Brodzińska, K.; Szadziun, M. Photovoltaic Farms—Economic Efficiency of Investments in North-East Poland. Energies 2021, 14, 2087. [Google Scholar] [CrossRef]
  58. Igliński, B.; Piechota, G.; Kiełkowska, U.; Kujawski, W.; Pietrzak, M.B.; Skrzatek, M. The assessment of solar photovoltaic in Poland: The photovoltaics potential, perspectives and development. Clean Technol. Environ. Policy 2023, 25, 281–298. [Google Scholar] [CrossRef] [PubMed]
Figure 1. Dendrogram of the division of voivodeships. Source: own study using Stata 17 software.
Energies 18 02871 g001
Figure 2. Dendrogram of clusters for the analyzed variables. Source: own study using Stata 17 software.
Energies 18 02871 g002
Figure 3. Distance between following records in diagram. Source: own study using MaCzek 3.3.44 software.
Energies 18 02871 g003
Figure 4. Czekanowski diagram—Simple genetic algorithm. Source: own study using MaCzek 3.3.44 software.
Energies 18 02871 g004
Figure 5. Installation diagram of the studied case. Source: own work using Homer Pro x64 3.18.4.
Energies 18 02871 g005
Figure 6. (a) Daily profile of energy demand for a household. (b) Seasonal profile of energy demand for a household. Source: own study using Homer Pro x64 3.18.4 software.
Energies 18 02871 g006
Figure 7. Annual profile of energy demand for a household. Source: own study using Homer Pro x64 3.18.4 software.
Energies 18 02871 g007
Table 1. Selection of variables for taxonomic analyses.
VariableDescription
Average wind speedAverage wind speed in m/s
Population densityPopulation per 1 km2
Public roadsPublic roads per 100 km2 (in km)
Agricultural landtotal agricultural land (ha)/area (ha)
CO2 emissionCO2 emissions from particularly burdensome plants (t/y)/area in km2
Source: own study based on: Local Data Bank, Central Statistical Office.
Table 2. Cluster size tests.
Number of ClustersCaliński/Harabasz Pseudo-FDuda/Hart
Je(2)/Je(1)Pseudo T-Squared
1 0.214051.42
251.420.284427.68
370.160.062515.01
470.860.36015.33
5100.690.11697.55
6131.820.330612.15
7171.610.0000
8172.670.0000
9187.610.31324.39
10203.040.0000
Source: own calculations using Stata 17 software.
Table 3. Test for equality of three group means, assuming homogeneity.
TestStatisticsF (df 1)F (df 2)FProb > F
Wilks’ lambda0.047410.018.06.470.0003 (e)
Pillai’s trace1.198410.020.02.990.0178 (a)
Lawley–Hotelling trace14.921610.016.011.940.0000 (a)
Roy’s largest root14.56545.010.029.130.0000 (u)
e—exact, a—approximate, u—upper bound on F. Source: own study using Stata 17 software.
Table 4. Division of provinces into clusters.
ClusterVoivodeships
G1Dolnośląskie, Kujawsko-Pomorskie, Małopolskie, Mazowieckie, Świętokrzyskie
G2Lubelskie, Lubuskie, Podkarpackie, Podlaskie, Pomorskie, Warmińsko-Mazurskie, Wielkopolskie, Zachodniopomorskie
G3Łódzkie, Opolskie, Śląskie
Source: own study based on conducted research.
Table 5. Adopted model parameters.
ParameterValue
Economics:
Nominal discount rate (%)7.5
Expected inflation rate (%)6.0
Projected lifetime (years)20
System fixed capital cost (€)2,700,000.00
System fixed O&M cost (€/yr)30,000.00
Grid:
Grid Power Price (€/kWh)0.289
Grid Sellback Price (€/kWh)0.076
Turbine:
Capital (€)1,650,000.00
Replacement (€)1,155,000.00
O&M (€/year)66,000.00
Hub height (m)70
Wind power output (%)50
Source: own study.
Table 6. IRR, ROI, and simple payback for selected locations.
LocationZoneThe Nearest CitySimple Payback (yr)IRR (%)ROI (%)
52°16.3′ N, 18°8.5′ EIKonin6.11511
51°34.2′ N, 22°23′ EILubartów6.41511
54°10.3′ N, 21°11.3′ EIKorsze5.71712
52°27.2′ N, 14°55.7′ EIOśno Lubuskie6.11612
53°53.0′ N, 14°26.4′ EIWapnica5.11915
51°11.5′ N, 20°30.6′ EIIKońskie6.61410
50°5.2′ N, 20°24.9′ EIINowe Brzesko8.0117.5
50°30.1′ N, 21°52.0′ EIITarnobrzeg6.9139.5
51°19.2′ N, 21°13.7′ EIISkaryszew6.51410
50°2.9′ N, 18°52.9′ EIIIŻory7.6128.2
49°46.4′ N, 18°40.3′ EIIIZamarski125.53.4
50°20.5′ N, 17°21.0′ EIIIBodzianów8.1117.4
Average value7.1013.549.75
Source: own calculations using Homer Pro x64 3.18.4 software.
Disclaimer/Publisher’s Note: The statements, opinions and data contained in all publications are solely those of the individual author(s) and contributor(s) and not of MDPI and/or the editor(s). MDPI and/or the editor(s) disclaim responsibility for any injury to people or property resulting from any ideas, methods, instructions or products referred to in the content.

