Article

Numerical Investigation of the Impact of Variation of Negative Electrode Porosity upon the Cycle Life of Lithium-Ion Batteries

College of Mechanical and Automotive Engineering, Shanghai University of Engineering Science, Shanghai 201620, China
*
Author to whom correspondence should be addressed.
Energies 2025, 18(11), 2883; https://doi.org/10.3390/en18112883
Submission received: 12 May 2025 / Revised: 25 May 2025 / Accepted: 29 May 2025 / Published: 30 May 2025

Abstract

:
Lithium-ion batteries (LIBs), crucial in modern advanced energy storage systems, inherently experience several side reactions during operation, with the formation of a solid electrolyte interface (SEI) and lithium plating being the most significant. These side reactions, which deplete lithium ions and lead to the clogging of negative electrode pores, considerably impair the battery’s cycle life and overall performance. This study introduces a numerical model for the battery aging process, grounded in existing research on SEI formation and its temperature-dependent aging kinetics. The model aims to elucidate how variations in the porosity of the negative electrode impact the battery’s cycle life. The study initially focuses on analyzing the principal mechanisms behind pore clogging in LIBs’ negative electrodes following extensive charge/discharge cycles. Subsequently, the study conducts numerical simulations to thoroughly investigate the effects of various non-uniform porosity structures in the negative electrode, encompassing both linear and gradient configurations, on the battery’s cycle life. Additionally, the investigation conducts a comparative analysis to determine how different gradients in porosity structures influence pore clogging. It also delves into a detailed exploration of heat generation associated with the linear porosity structure of the negative electrode. The results indicate that the accumulation of the SEI layer significantly reduces porosity. This reduction, in turn, affects the conductivity and alters the current density during the SEI reaction. Notably, the linear porosity structure exhibits a significant advantage over traditional structures, especially in terms of reducing pore clogging and minimizing irreversible heat generation. In summary, this study presents a multi-physics and detailed numerical model to evaluate the impact of variations in negative electrode porosity on the cycle life of LIBs. Furthermore, it provides essential theoretical support for battery design and performance optimization, particularly in the determination of pore structures and material selection.

1. Introduction

As one of the most important energy storage systems, LIBs have key attributes like high energy density, long cycle life, low self-discharge rate, and no memory effect [1,2]. However, LIBs inevitably experience capacity loss with increasing cycles and may pose potential safety hazards, such as latent thermal runaway [3,4]. A comprehensive investigation into the mechanism of capacity loss is crucial for achieving the design objectives of prolonged battery life and secure operation [5].
LIBs’ capacity degradation mainly stems from a decrease in recoverable lithium [6]. Various side reactions on the electrode particles deplete lithium ions, particularly on the negative electrode during charging [7]. These side reactions mainly include the formation of an SEI layer and lithium plating, and these two types of side reactions interact [8]. The redox reactions between lithium ions and electrolytes are driven by the potential difference between the solid and liquid phases, leading to SEI film deposition [9]. As the thickness of the SEI film increases, a large number of lithium ions accumulate in the ion channels of the SEI. Certain lithium ions interact with electrons, forming lithium that accumulates on the surface of SEI pores or particles [10]. However, a portion of the deposited lithium metal is re-dissolved into recyclable lithium, and the amount of dissolution is always less than the amount deposited [11,12]. Therefore, some lithium elements become irreversibly bound in the end, which we call dead lithium [13,14]. As lithium deposition increases, the porosity and tortuosity of the negative electrode alter considerably, intensifying the lithium deposition side reactions, which leads to the non-linear loss of lithium ions [15]. Yang et al. [16] pointed out the interaction between porosity and lithium deposition during the fading loss from linear to non-linear aging. However, SEI formation is primarily influenced by lithium-ion concentration, without considering temperature fluctuation. In this paper, the reaction current density of the side reaction of SEI changes with the concentration of lithium ions and temperature, which can provide a more accurate representation of the actual operating conditions of the LIBs. The formation of SEI and lithium deposition reduces recoverable lithium, which in turn shortens LIB cycle life [16]. In addition, the accumulation of side reactions clogs the electrode’s pores and impacts the cycle life of LIBs [17]. In general, if the capacity of LIBs is less than 80%, we believe that the battery’s performance is seriously degraded. Although batteries with less than 80% capacity can still operate, pore clogging can lead to sudden LIB failure [18]. LIBs can also experience a sudden and significant decrease in capacity, known as sudden death, under aggressive but practically relevant conditions, such as high-voltage operation or cycling at elevated temperatures [19]. Broussely et al. [20] attributed the sudden death of LIBs to a significant self-reinforced lithium coating caused by pore clogging, resulting from the growth of surface films. Burns et al. [21] also presented pore clogging as a cause of rapid degradation. Pore clogging impedes the transport of lithium ions to the negative electrode, which leads to kinetic obstacles.
In addition to the well-documented reduction in recoverable lithium, other factors such as structural changes in electrode materials and the degradation of the electrolyte also contribute significantly to capacity loss in LIBs [22,23]. Over time, the repeated cycling of the battery leads to mechanical stress and volume expansion within the electrode materials, particularly the anode, which causes microcracks and delamination [24]. These structural changes hinder lithium ion transport and increase internal resistance, further accelerating capacity fade. Moreover, electrolyte degradation due to high temperatures and voltage stress is another major contributor to battery aging. The decomposition of the electrolyte can produce gaseous by-products and form resistive films on the electrode surfaces, which impede ion transport and reduce the overall energy efficiency of the battery [25]. Studies have shown that electrolyte additives can mitigate this effect to some extent, but their long-term efficacy remains a challenge [26]. These factors, in combination with SEI growth and lithium plating, highlight the complex nature of lithium-ion battery degradation mechanisms.
Numerous studies have explored the optimization of battery performance through porosity structure adjustments [27,28]. Ye et al. [29] developed a simple and powerful analytical method for designing electrodes with gradient pore networks. The analytical expression of effective tortuosity obtained by this method was used as an objective function, which more accurately reflected the electrode performance. Using this method, electrodes with hierarchical pore networks were optimized at various levels of total porosity and electrode thickness. Compared to the traditional electrode, the optimal electrode with a layered pore network exhibited a remarkable 350% increase in energy density at the 5C rate. However, this only improved the energy density and did not consider the influence of the gradient pore structure on performance, such as capacity loss. Suthar et al. [30] considered the effect of negative electrode porosity and thickness on capacity loss while keeping all other parameters constant. They suggested that a reasonable linear porosity distribution at the negative electrode can reduce capacity loss. However, altering the pore size and thickness also affects the overall capacity of the LIB. In this work, only the spatial distribution of the porosity is changed, not the battery’s initial capacity. This approach allows for a more accurate assessment of the impact of porosity on capacity loss. Yu et al. [31] investigated the effect of linear variation in positive electrode porosity on the performance of LIBs. The results demonstrated that the linear porosity model enhances lithium-ion transport in both the solid and liquid phases, leading to more uniform lithiation across the electrode. The inhomogeneous distribution of active materials on the electrode simultaneously altered the stress distribution within the electrode and the active particles. The capacity loss during a long cycle is related to the negative electrode. In this paper, we investigate the effects of the negative electrode’s linear porosity distribution and gradient porosity distribution on the capacity loss and pore clogging of LIBs, while leaving the initial capacity of the battery unchanged.
In studying the operation of LIBs, it is crucial to establish reliable models. These models are fundamental in predicting battery behavior and guiding optimization designs. To date, the most widely used electrochemical model is the P2D model, developed by Newman and his colleagues [32,33]. The model integrates porous electrode theory and concentrated solution theory. Since its introduction, numerous electrochemical models of LIBs have been developed based on the P2D model. Pals and Newman introduced an energy conservation equation into the P2D model, establishing an electrothermal (ET) coupling model [34,35], which simulates the relationship between temperature and electrochemical processes during battery operation. Yin et al. [36] developed an integrated battery model by combining a three-dimensional electrochemical model with a two-dimensional axisymmetric heat transfer model. This electrochemical model is based on the battery’s disassembled structure and incorporates temperature-dependent aging kinetics, driven by the formation of the SEI.
The SEI plays a key role in the performance and aging of LIBs. Its growth over time, while protective, increases internal resistance and contributes to capacity loss. At low temperatures, SEI growth slows, but lithium plating increases, creating dead lithium that reduces battery capacity. At high temperatures, SEI grows faster, becoming thicker and more uneven. This increases resistance and speeds up battery degradation. High temperatures also accelerate electrolyte breakdown, further harming battery life. Building on the temperature-dependent aging kinetics model of SEI formation proposed by Yin et al. [36], this study further develops a numerical model to simulate the aging process of LIBs. The core innovation of this research is its detailed examination of the mechanisms behind the formation of non-uniform distributions of negative electrode porosity during long-term cycling processes, coupled with a comprehensive heat transfer analysis of these improved porosity structures. This research seeks to elucidate the impact mechanisms of porosity changes on LIB performance, thus providing a solid theoretical foundation and practical guidance for designing more efficient and safer LIBs. Furthermore, the study investigates how optimizing porosity structure contributes to enhanced thermal management and cycle stability in LIBs, highlighting the importance of controlling the internal microstructure. The analytical results broaden our understanding of LIB aging mechanisms and provide new perspectives and strategies for future research and development in battery materials and their engineering applications. In summary, the development and application of this aging model validates its effectiveness in explaining experimental phenomena, offering crucial theoretical support and design guidelines for the future advancement of LIB technology.

2. Model Description and Validation

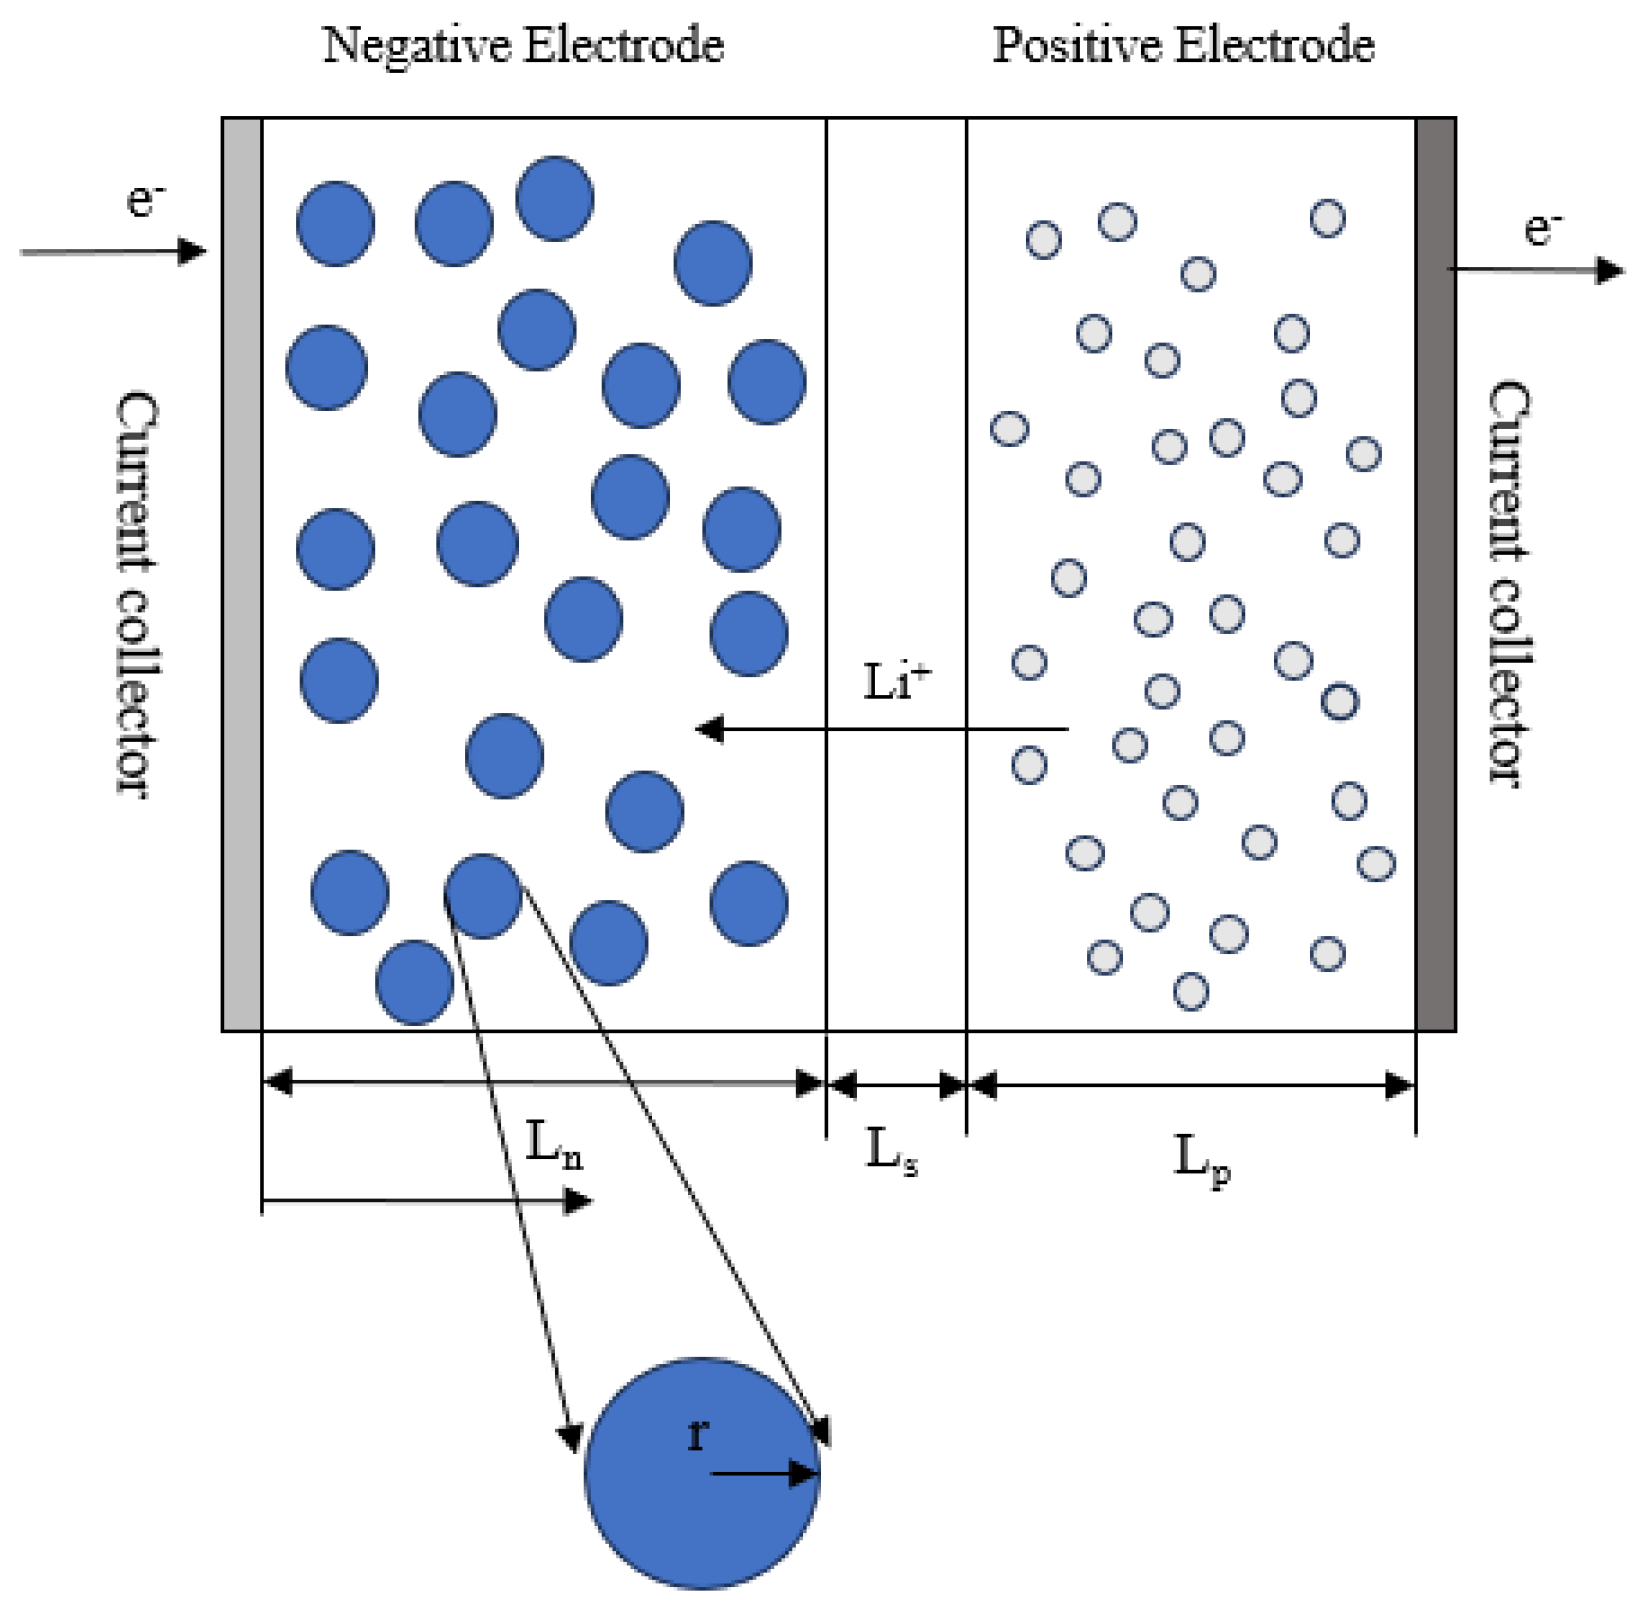
2.1. Model Description

The model builds upon the P2D ET coupling model (Figure 1), with a detailed description of the underlying partial differential equations available in the literature [34,35]. The governing equations of the electrochemical model are mainly based on two key principles: charge conservation and mass conservation. Meanwhile, the thermal model’s governing equations are derived from the principle of energy conservation. The coupling between the different physical fields is achieved by incorporating coupling parameters into the governing equations. Specifically, the electrochemical field acts as a heat source for the temperature field, while the temperature field, in turn, influences the electrochemical field through temperature-dependent parameters such as the diffusion coefficient, reaction rate constant, and conductivity. Implementing the aging mechanism and its effects are similar to the model proposed by Yin et al. [36] During the negative electrode charging process, in addition to the required embedding reaction, the formation of SEI is also introduced.
The reaction current density of the side reaction SEI formation is as follows:
j S E I = n F K S E I C O ( 1 α ) C R α c l c l , 0 exp ( 0.5 F η R T )
K S E I = k S E I exp ( E a , S E I R T )
η = ϕ 1 ϕ 2 E e q , S E I ϕ 1 , film
where K S E I is the reaction rate constant of SEI formation, F is the Faraday constant, C O is the oxide concentration, C R is the reduction concentration, and c l is the electrolyte concentration. ϕ 1 is the solid-phase potential, ϕ 2 is the liquid-phase potential, η is the overpotential, and ϕ 1 , film is the potential drop caused by film thickness.
In this work, SEI is considered to be made from lithium ethyl carbonate ( C H 2 O C O 2 L i ), which is produced by the reaction of ethyl carbonate (EC) with lithium ions.
C 6 + L i + + e L i C 6
2 C 2 H 4 C O 3 + 2 e + 2 L i + ( C H 2 O C O 2 L i ) 2 +   C 2 H 4
The equation of mass conservation in terms of SEI is as follows:
c S E I t = j S E I 2 F
where c S E I represents the molar concentration of SEI per unit volume of electrode.
Note that the side reaction of SEI formation occurs on the surface of graphite particles and also consumes lithium ions in the battery reaction. It is assumed that the formation of SEI only occurs during charging. The consumption of recyclable lithium ions caused by side reactions leads to a reduction in battery capacity, and the formation of the SEI layer increases the potential drop at the electrode interface. The side reactions result in the formation of a surface film product, which coats the active material of the negative electrode in a uniform layer.
The expression of the total film thickness is as follows:
δ film = δ film , 0 1 S a ( c S E I M S E I ρ S E I )
where S a represents the specific surface area, M S E I is SEI molar mass, φ S E I is SEI density, and δ film , 0 is the initial thickness.
It should be mentioned that increasing the film thickness has several effects; (1) the resistance increases, (2) the volume fraction of electrolyte decreases, and (3) the recyclable lithium is lost.
Thin film resistance can be expressed as
R film = ω S E I δ f i l m κ S E I
where ω S E I is the volume fraction of SEI in the membrane and κ S E I is its ionic conductivity.
The side reaction SEI formation consumes the amount of recyclable lithium ions in the LIB, and the resulting capacity loss is as follows [11]:
C l o s s = ε 1 , n e g L n e g A c e l l F c S E I
where ε 1 , n e g represents the solid volume fraction of the negative electrode, L n e g represents the thickness of the negative electrode, A c e l l represents the cross-sectional area of the battery, and F represents the Faraday constant.
The change in porosity during charging is due to the interaction of the embedding reaction and side reaction. Because the volume change caused by the embedding reaction is reversible, it is ignored. However, the volume change caused by the irreversible product is considered. This is achieved by linking the change in negative porosity with the increase in surface film thickness through the following expression:
ε t = δ f i l m t
Equation (11) is derived and written as follows:
ε 1 , n e g = ε 1 , 0 S a δ film
The side reaction causes pore clogging while consuming lithium ions. Both of these factors have an impact on the cycle life of the LIB.
The specific surface area expression is as follows [37]:
S a = S a 0 1 ε 2 0 S a δ f i l m ε 2 0 ξ
where S a represents the specific surface area, ε 2 0 represents the initial porosity of the negative electrode, and ξ is an experimentally determined parameter used to describe the morphology of the precipitate.
Additionally, pore clogging leads to changes in the solid-phase diffusion coefficient. Equation (13) is the change in solid-phase conductivity [37]:
D 1 = D 1 0 1 ε 2 ε 2 0 ξ ( 1 ε 2 0 + ε 2 )
where D 1 0 represents the initial solid diffusion coefficient of the negative electrode.
Changes in porosity also affect certain parameters, such as electronic conductivity σ 1 , ionic conductivity κ 2 , and the liquid-phase diffusion coefficient D 2 . These parameters are adjusted using the Bruggeman coefficient.
σ 1 e f f = σ 1 ε 1 , i r 1
κ 2 e f f = κ 2 ε 2 , i r 2
D 2 e f f = D 2 ε 2 , i r 2
Porosity is dynamically updated at each time step using Equations (6) and (7), which accounts for SEI-induced volume fraction changes. The Bruggeman relation (Equations (14)–(16)) couples porosity to ionic conductivity and diffusion coefficients, ensuring self-consistent electrochemical–thermal feedback. The simulation in this paper is conducted using the COMSOL Multiphysics software 6.1. The laws of mass conservation and energy conservation are primarily utilized. A more detailed explanation of the governing equations can be found in [11]. All symbols are explained in “Nomenclature”. Table 1 and Table 2 list the key battery parameters and aging parameters. The constant current/constant voltage (CC/CV) charging strategy is used to simulate the cycle. The discharge is only simulated using CC, and the entire simulation utilizes a 1C current. Figure 2 shows the three different porosity profiles that were considered in this study. The linear porosity structure refers to the uniform change in porosity along the length of the electrode, while the gradient porosity structure is the form of sudden change in porosity. Each subgraph shows the porosity distribution of the entire negative electrode, ranging from the left collector (X = 0) position to the right separator (X = 1) position. The specific method of implementing porosity refers to the existing work of the research group [31]. The higher porosity at X = 1 aims to alleviate the limitation of lithium-ion transport. The COMSOL-based model is designed to accommodate diverse porosity profiles, enabling systematic comparisons of predefined structures (e.g., linear, gradient) while retaining adaptability for novel configurations.

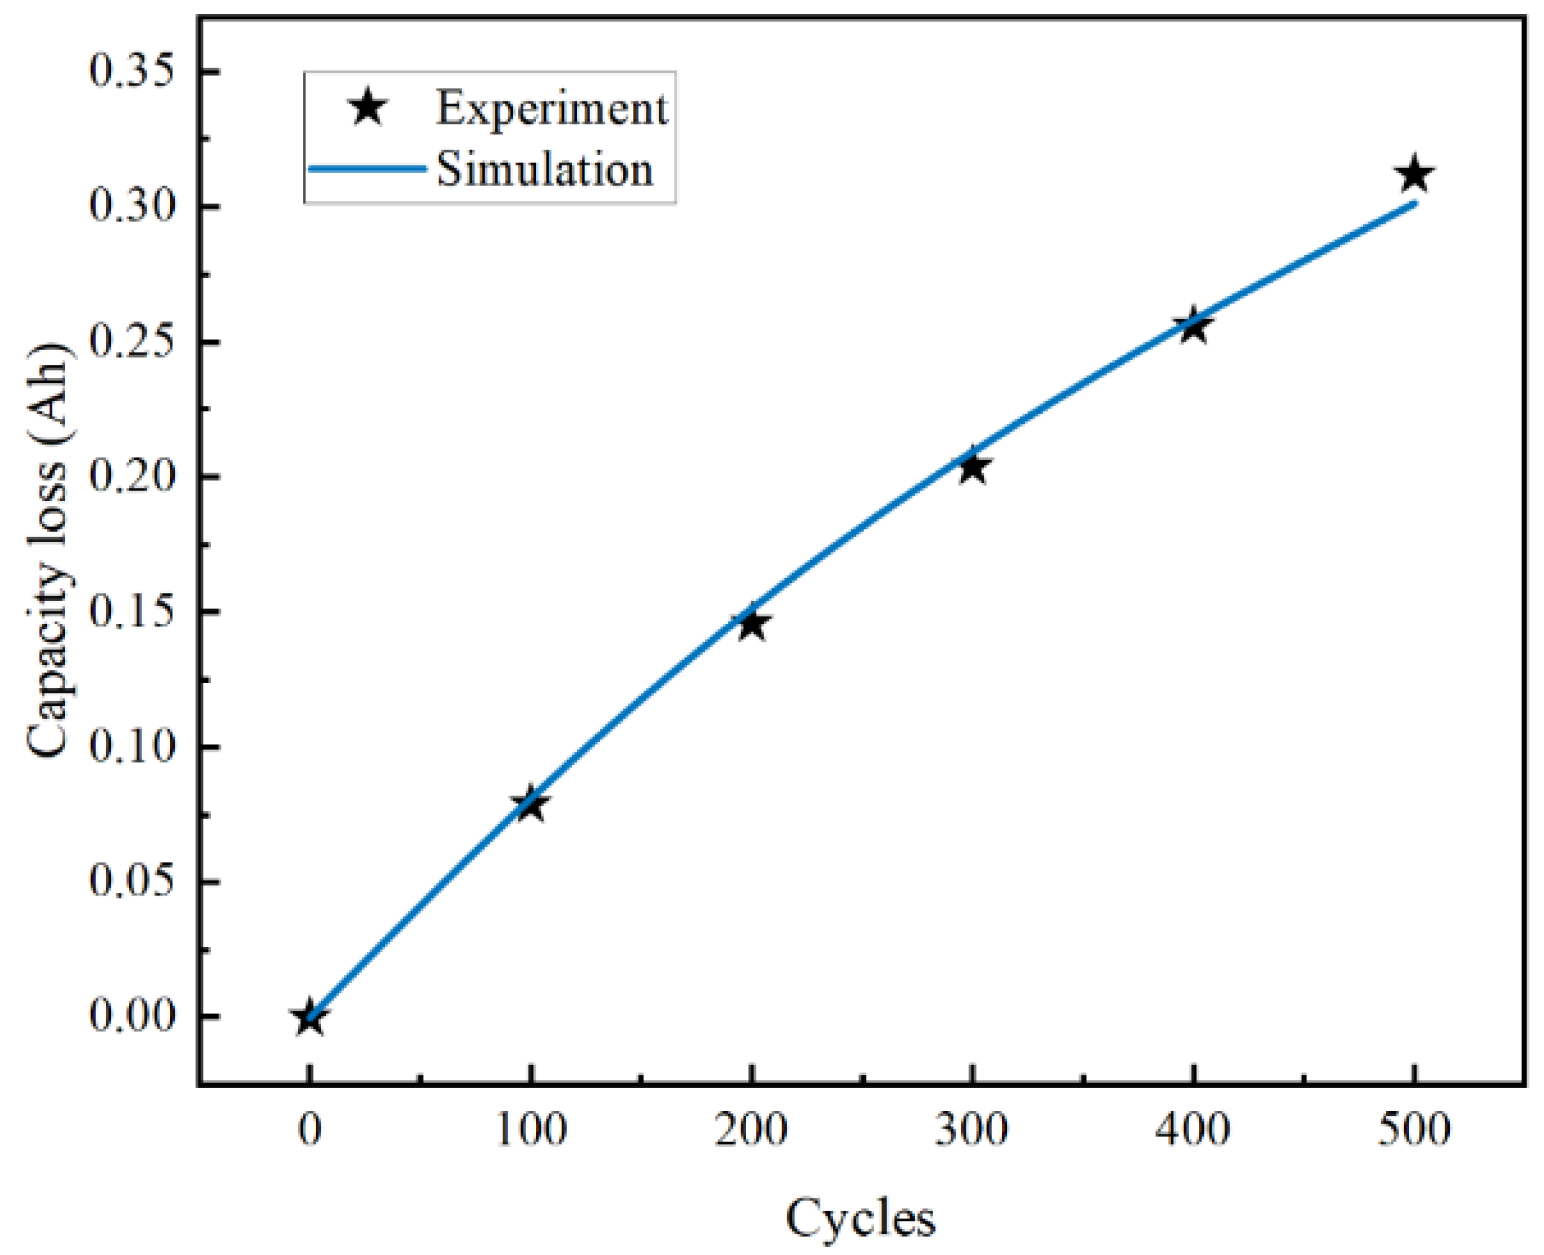
2.2. Model Validation

The accuracy of the aging model used in this study was confirmed through comparative analysis with the experimental data of Keil et al. [11]. In their research, Keil et al. utilized the Sanyo UR18650E LIB model. In their experiments, the battery was subjected to charge/discharge cycles at a constant 1C current at an ambient temperature of 25 °C. In the current study, COMSOL Multiphysics software was used to simulate the battery cycling process under identical temperature and current conditions. The simulation parameters included a charging cut-off voltage of 4.2 V and a discharging cut-off voltage of 2.75 V. The correlation between the numerical simulation results and Keil et al.’s experimental data are demonstrated in Figure 3, where the experimental data are represented as a scatter plot and the simulation data as a solid line. The comparison reveals that, for the initial 400 charge/discharge cycles, the simulation closely aligns with the empirical data. However, after 500 cycles, a minor discrepancy was observed, with the simulated battery capacity degradation being slightly less than the experimental results. This deviation is likely caused by lithium plating, as observed in [11], further validating the accuracy of the aging model in capturing long-term degradation behavior.

3. Results and Discussion

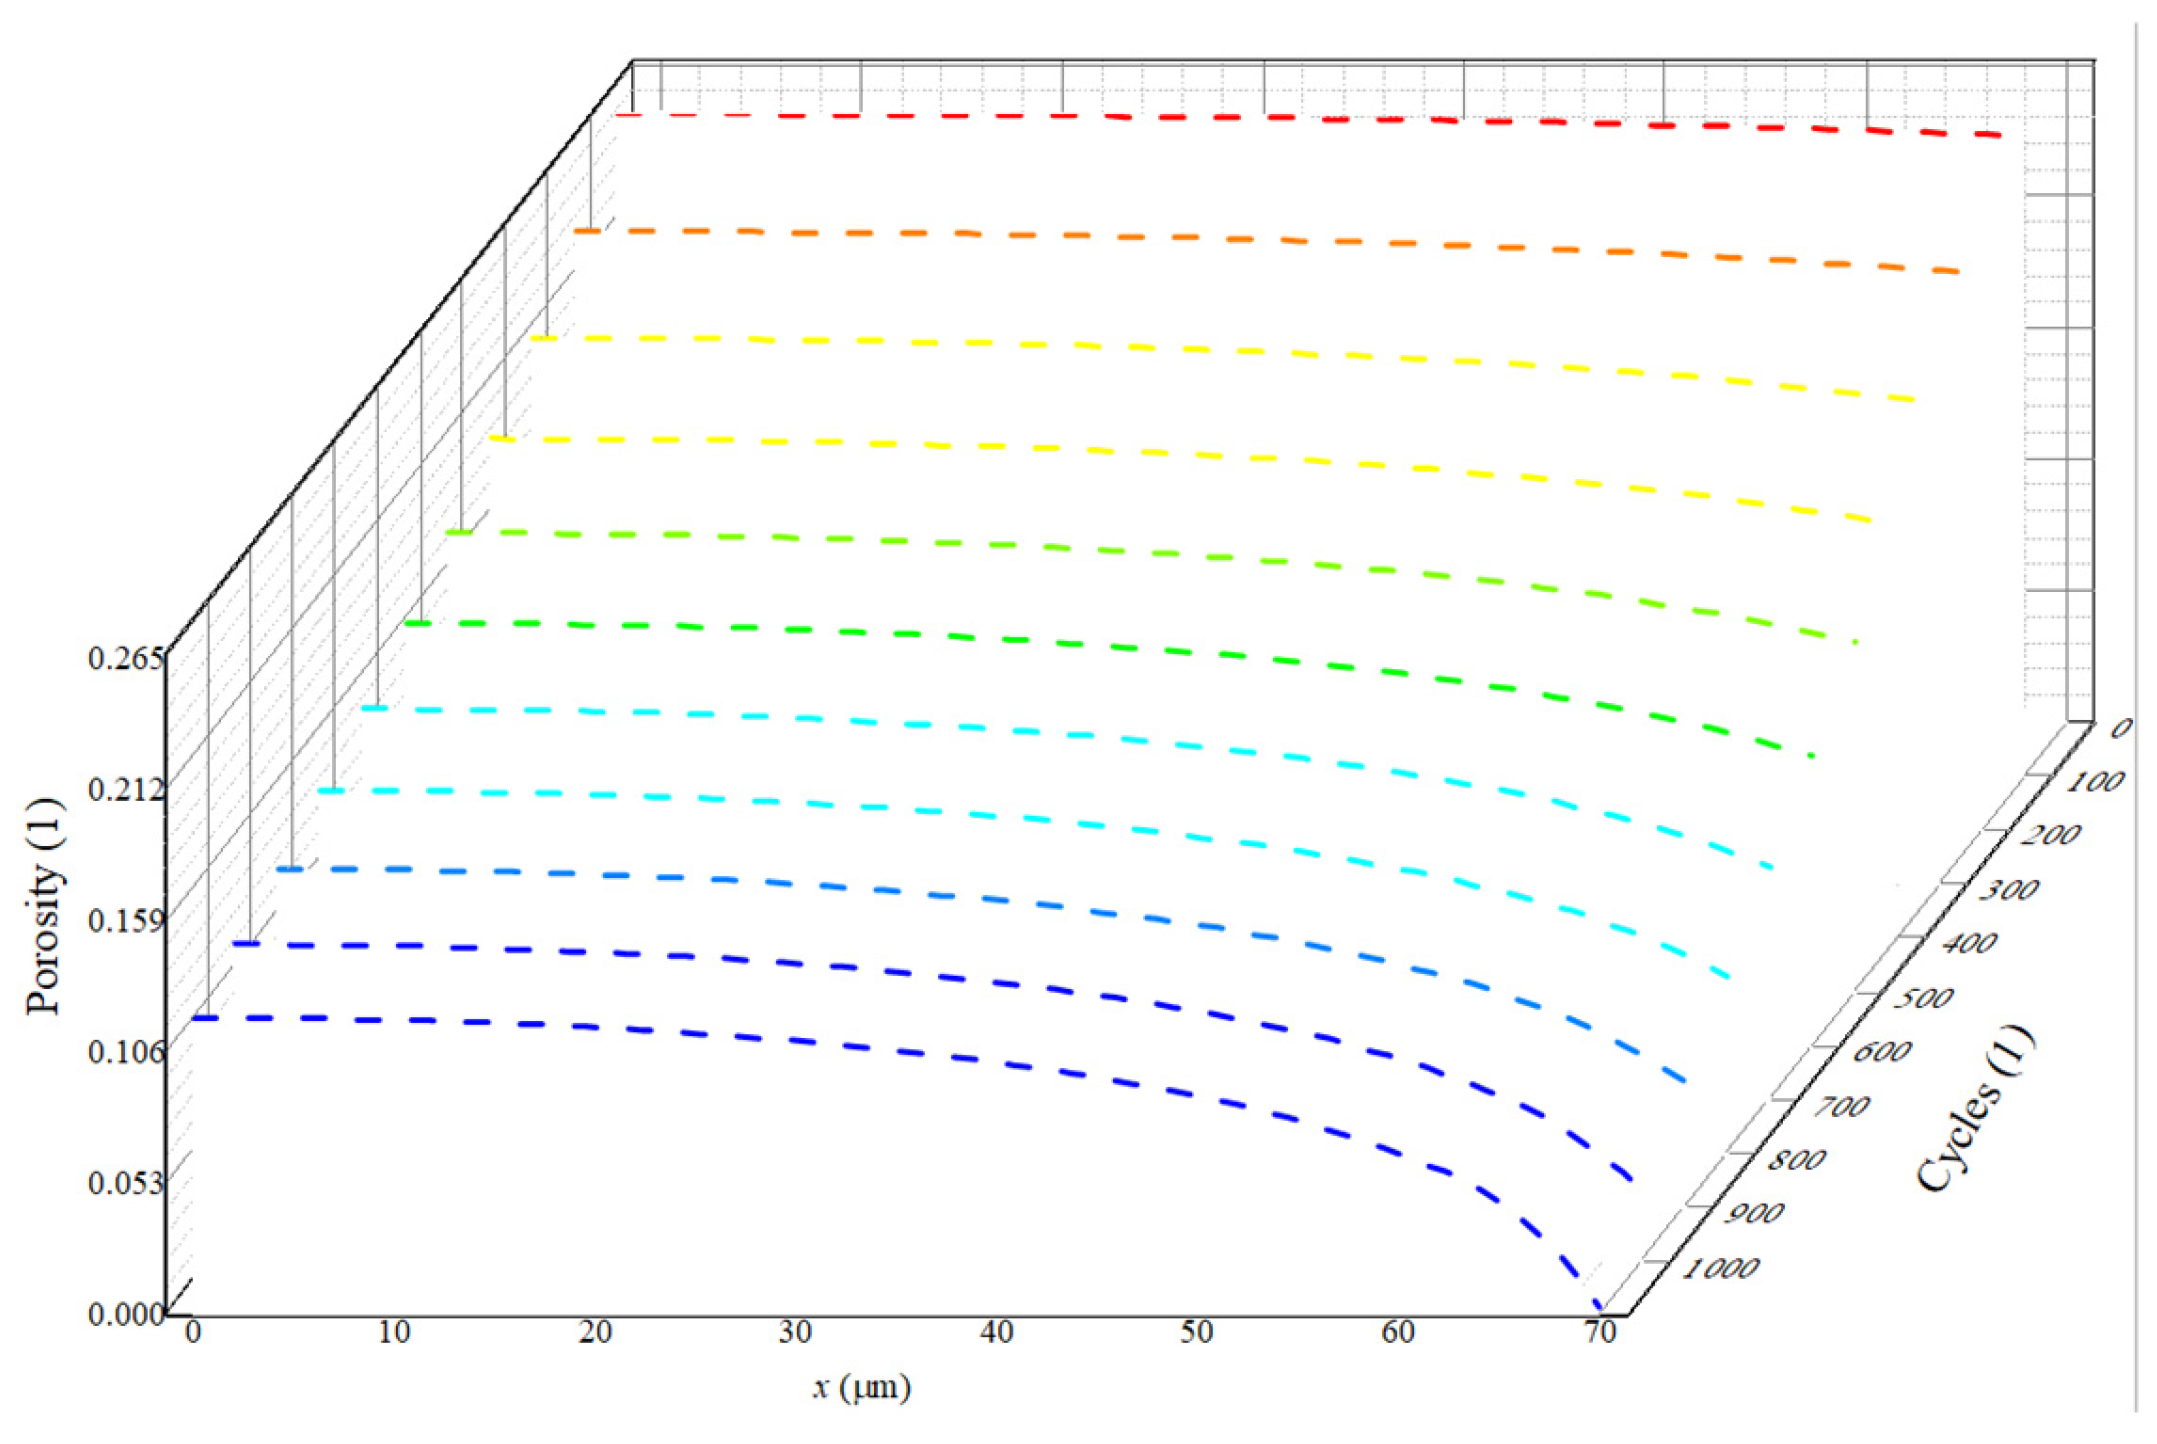
3.1. The Distribution Characteristics of Negative Electrode Porosity After a Long Cycle

Building upon the uniform porosity structure of the negative electrode, we explore the pore clogging resulting from the growth of the SEI film. Additionally, a detailed analysis is presented regarding the interaction between porosity and key parameters within the LIB. It can be seen form Equation (1) that δ film is related to c S E I . The greater c S E I , the greater δ film , and the faster the pore clogging occurs. Figure 4 shows the porosity distribution of the negative electrode after 1100 cycles. The x-axis denotes the length of the negative electrode, with the left side corresponding to the position near the current collector and the right side representing the position near the separator. The y-axis represents porosity. We observe a gradual decrease in porosity along the x-direction. As the number of cycles increases, the negative electrode porosity gradient also gradually intensifies. Specifically, numerous side reactions occur near the separator position, resulting in more severe pore clogging. This phenomenon has been confirmed in the study of Muller et al. [18]. This is evident in Equation (6), which indicates that the quantity of side reaction products is related to j S E I .
It can be clearly seen from Equations (1) and (3) that j S E I is a function of both ϕ 1 and ϕ 2 . The change in ϕ 1 at both ends of the electrode is approximately 10−5 V, while the change in ϕ 2 is at least an order of magnitude higher, around 10−2 V (Figure 5), which is much greater than ϕ 1 . Therefore, to control the uniformity of the reaction and reduce its strength at the interface between the negative electrode and the separator, it is necessary to control ϕ 2 . It is revealed that, at the beginning of the charging process, the positive electrode loses electrons, generating a large quantity of lithium ions. These electrons are transferred through the external circuit. Some lithium ions become embedded in the graphite throughout the thickness of the separator and the negative electrode graphite, while others contribute to the formation of an SEI film. The SEI adheres to the surface of the negative electrode particles, leading to a decrease in porosity near the separator. It is important to note that this reduction in porosity results in decreased conductivity in the liquid phase. In addition, Figure 6 also exhibits the distribution of ε 2 , κ 2 e f f , ϕ 2 , η , j S E I , c S E I , and δ film on the negative electrode at different time points. As seen from Figure 5, as the reaction proceeds, c S E I increases continuously. It is found from Equations (6) and (11) that the larger the value of c S E I , the larger δ film increases and the faster the porosity decreases. It is worth noting that κ 2 e f f decreases with the decrease in porosity. It can be seen from Figure 4 that c S E I near the separator is larger, and κ 2 e f f near the separator is small, which corresponds to Equation (15). κ 2 e f f has a greater impact on ϕ 2 . The decrease of κ 2 e f f leads to the increase of ϕ 2 , then leads to the decrease of η . Meanwhile, j S E I increases with the decrease of η . When j S E I increases, c S E I increases and ε 2 decreases. This is a positive feedback phenomenon. The decrease in porosity near the separator causes a reduction in κ 2 e f f . This, in turn, accelerates the decrease in porosity. Consequently, as the number of cycles increases, the gradient of negative electrode porosity becomes more pronounced, with the most rapid decrease occurring near the separator.

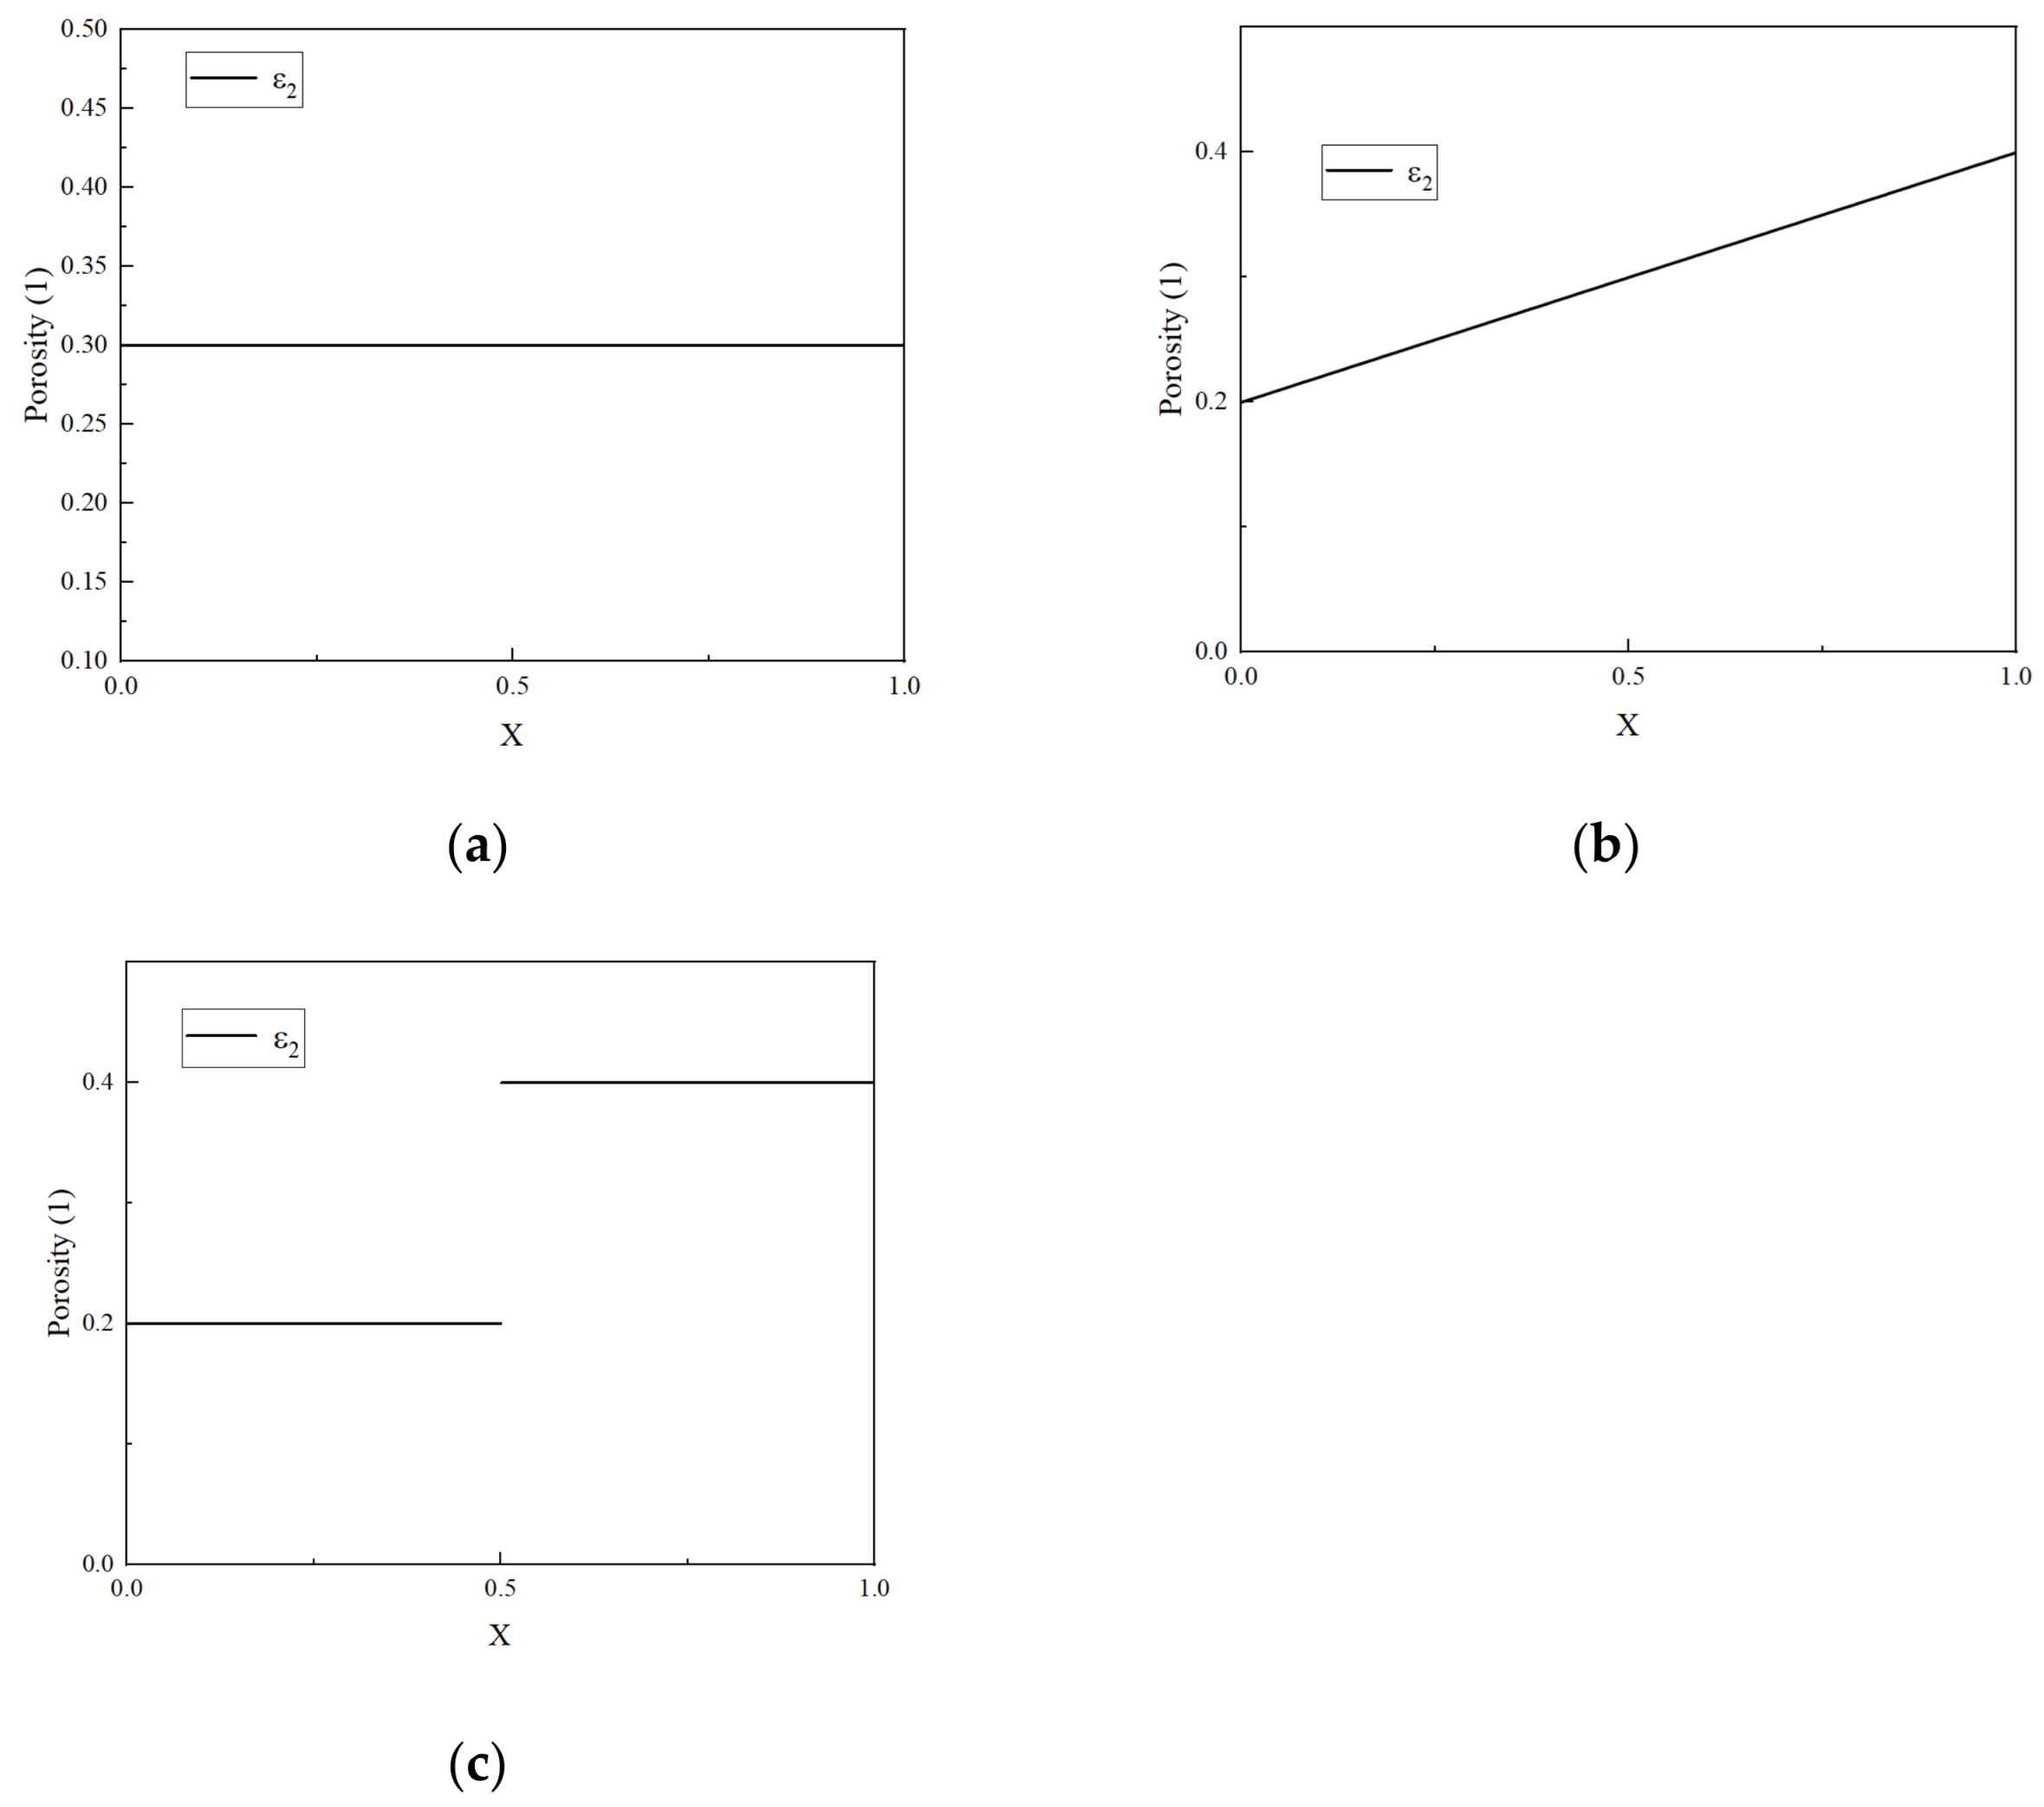
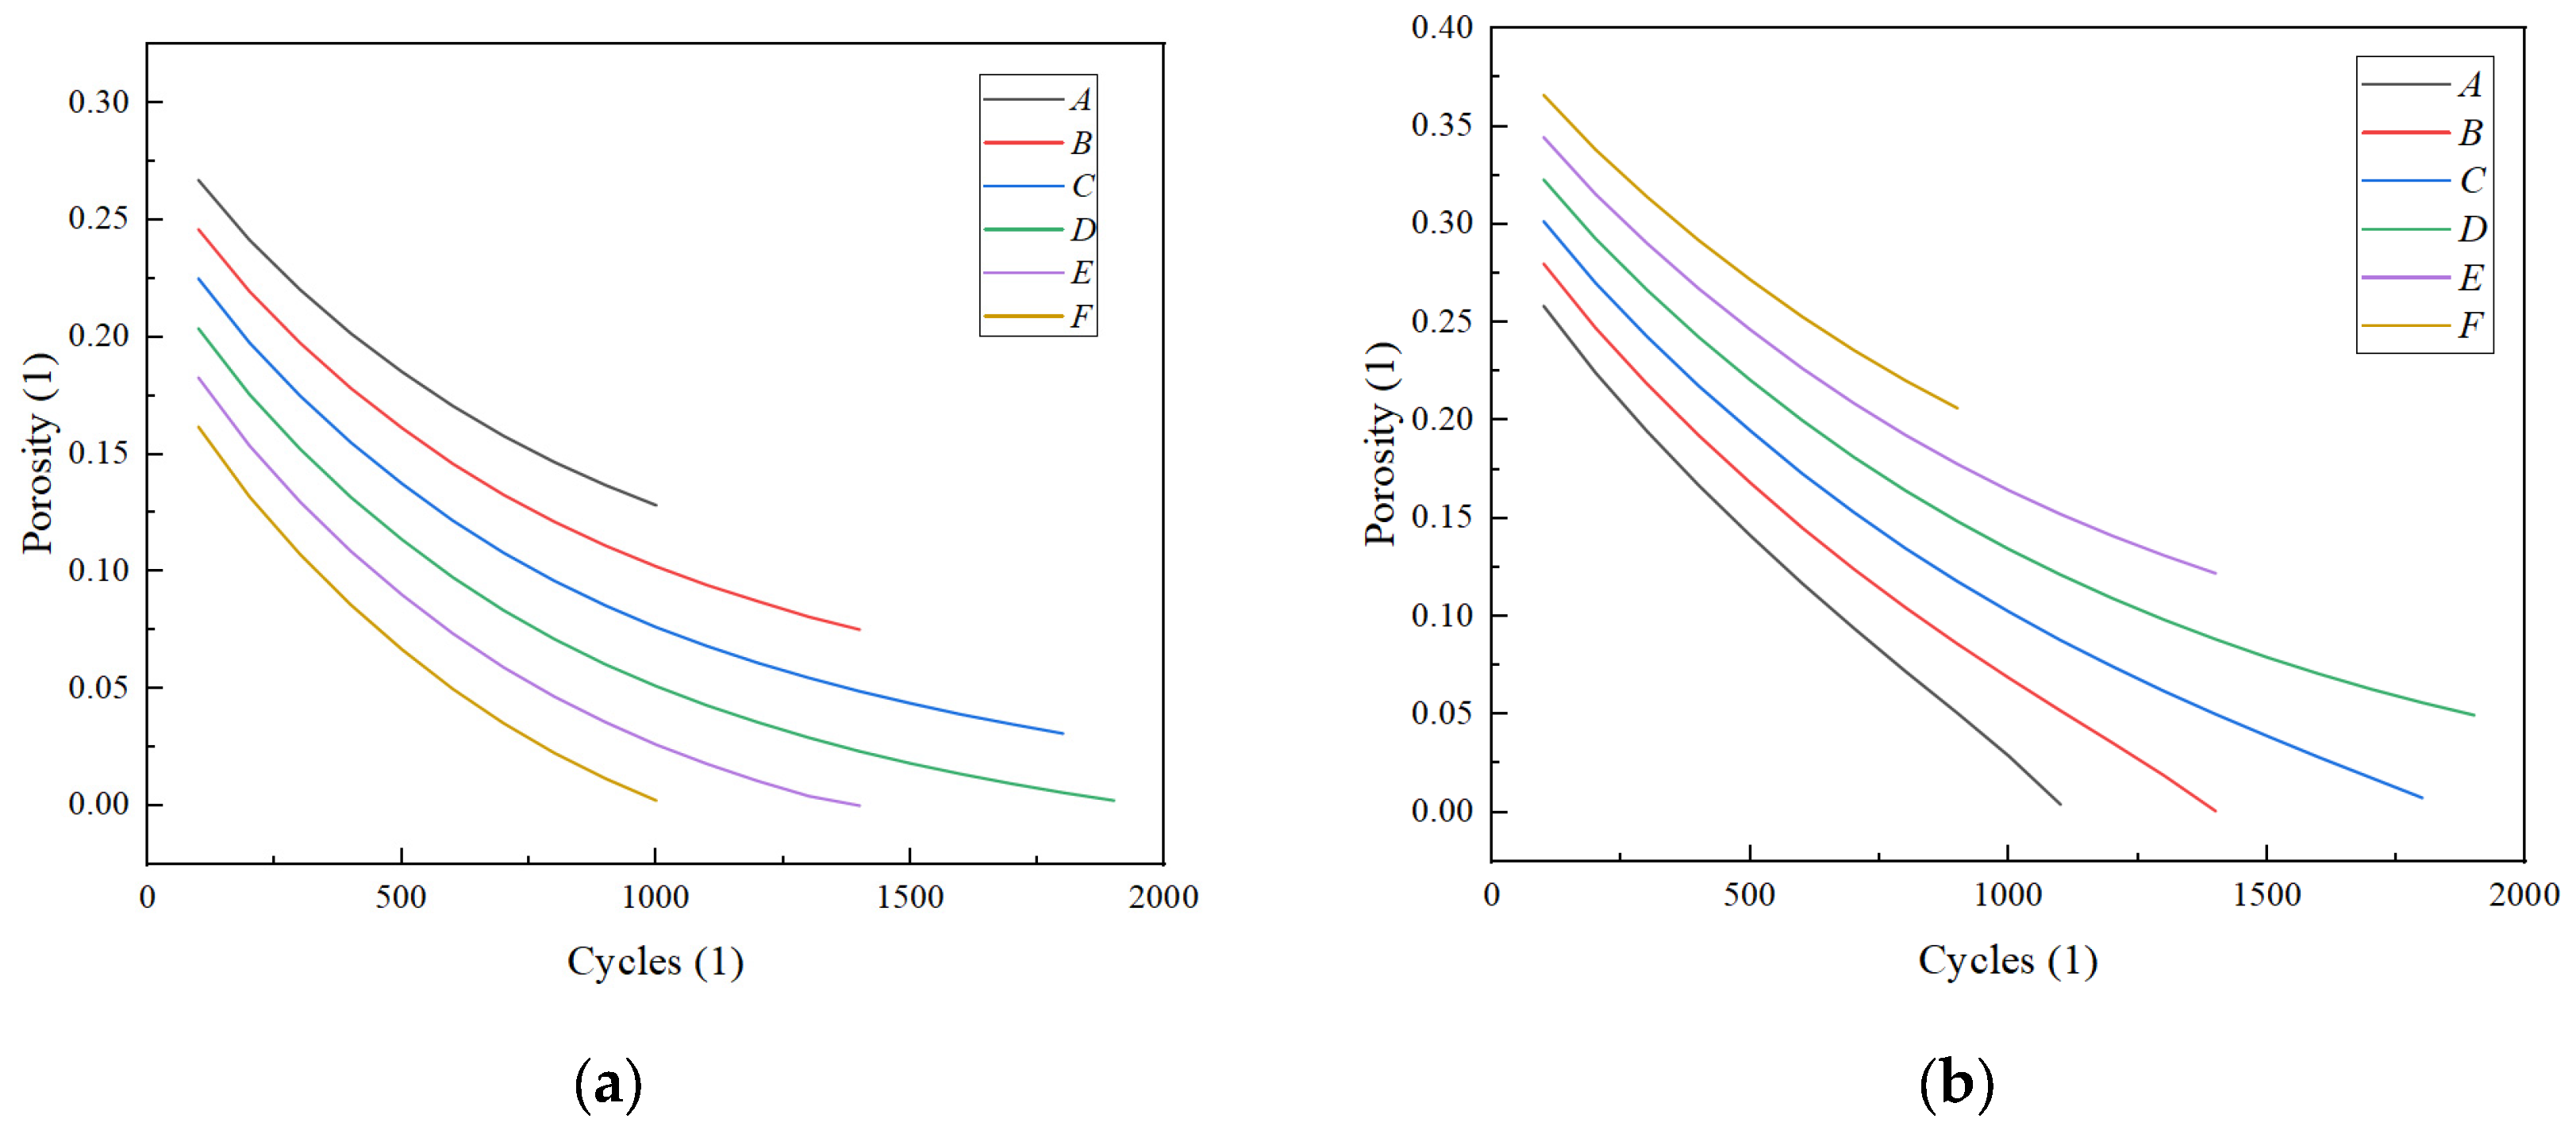
3.2. The Impact of Different Porosity Structures on the Cycle Life of LIBs

Given the rapid pore clogging observed near the separator, this section explores potential modifications to the porosity structure of the negative electrode, aimed at enhancing the cycle life of the LIBs. The linear, gradient, and uniform porosity structures are evaluated to determine which minimally impacts pore clogging. This analysis is vital for improving the cycle life of LIBs. Figure 2 illustrates a schematic diagram of these three porosity structures. Figure 7 depicts the capacity loss of the LIB with a uniform porosity structure, indicating a decline to about 76% of its initial capacity after around 1100 cycles.
Figure 8 illustrates the distribution of negative electrode porosity after 1100 cycles, with the left side adjacent to the collector and the right side proximal to the separator. It becomes apparent that after 1100 cycles, the porosity near the separator reduces to zero, attributed to the accumulation of side reaction products, which leads to the failure of the LIBs. Furthermore, the diagram reveals an increase in porosity on both the collector and separator sides during the reaction, with the disparity between the two sides widening. Consequently, this leads to an increasing gradient in the negative electrode’s porosity.
Figure 9a illustrates that, after 1100 cycles, the capacity loss for both uniform and linear porosity structures is identical. Figure 9b presents a comparative analysis of the concentration of by-products after 1100 cycles. Although the total capacity loss is consistent across both structures, the distribution of these by-products varies. The diagram indicates that the linear porosity structure demonstrates a reduced concentration gradient on the negative electrode, leading to a more uniform distribution of side reaction products. As a result, there is a more uniform occurrence of pore clogging on both sides of the negative electrode, which contributes to a deceleration in pore clogging and, consequently, enhances the cycle life of the LIBs. Figure 9c depicts the change in porosity after 1100 cycles. Following this cycle count, the negative electrode with a uniform porosity structure exhibits pore clogging near the separator. In contrast, the linear porosity structure shows a porosity near the separator of 0.04 after the same number of cycles. Although the linear porosity structure does not affect the overall capacity loss compared to the uniform structure, it does alter the distribution of side reaction products. The linear porosity structure results in a more even distribution of side reaction products on the negative electrode compared to a uniform porosity structure, contributing to a slower rate of pore clogging.
As shown in Figure 9a, the relative discharge capacities of the three structures are identical. Figure 9b provides a comparison of the concentration of by-products after 1100 cycles. As the total capacity loss remains consistent, the total amount of side reaction products for the three structures is also identical. However, the distribution of these products differs. It can be observed from the diagram that the linear porosity structure has a smaller concentration gradient on the negative electrode, resulting in a more even distribution of side reaction products. Hence, the pore clogging on both sides of the negative electrode becomes more uniform, mitigating the pore clogging to some extent and enhancing the cycle life of the LIB. Figure 9c shows the distribution of negative electrode porosity after 1100 cycles. After 1100 cycles of the negative electrode uniform porosity structure, the porosity near the separator becomes clogged. In contrast, after 1100 cycles of the linear porosity structure, the porosity near the separator is reduced to 0.04. The porosity distribution at both ends of the gradient and in linear porosity structures is nearly identical, yet the linear porosity structure exhibits higher uniformity. This improved uniformity enhances the distribution of side reaction products to a certain extent, thereby slowing down the clogging process.
A consistent total capacity loss was observed across the three porosity structures. However, variations in the distribution of c S E I result in differing levels of pore clogging. Both the linear and the two-layer gradient porosity structures demonstrate the ability to mitigate pore clogging to a certain degree. Notably, the linear porosity structure exhibits a more uniform distribution of side reaction concentrations, which makes it a preferable choice for addressing pore clogging throughout the cycle life of LIBs.
Our simulation results show that linear porosity and gradient porosity structures improve ion transport and reduce internal resistance, leading to enhanced cycle life. This is consistent with the findings of Lu et al. [38], who demonstrated that non-uniform porosity structures could optimize lithium-ion flow and improve battery performance under various operating conditions. Similarly, Zhou et al. [39] found that gradient porosity designs significantly mitigate lithium-ion concentration gradients, particularly in high-capacity batteries.

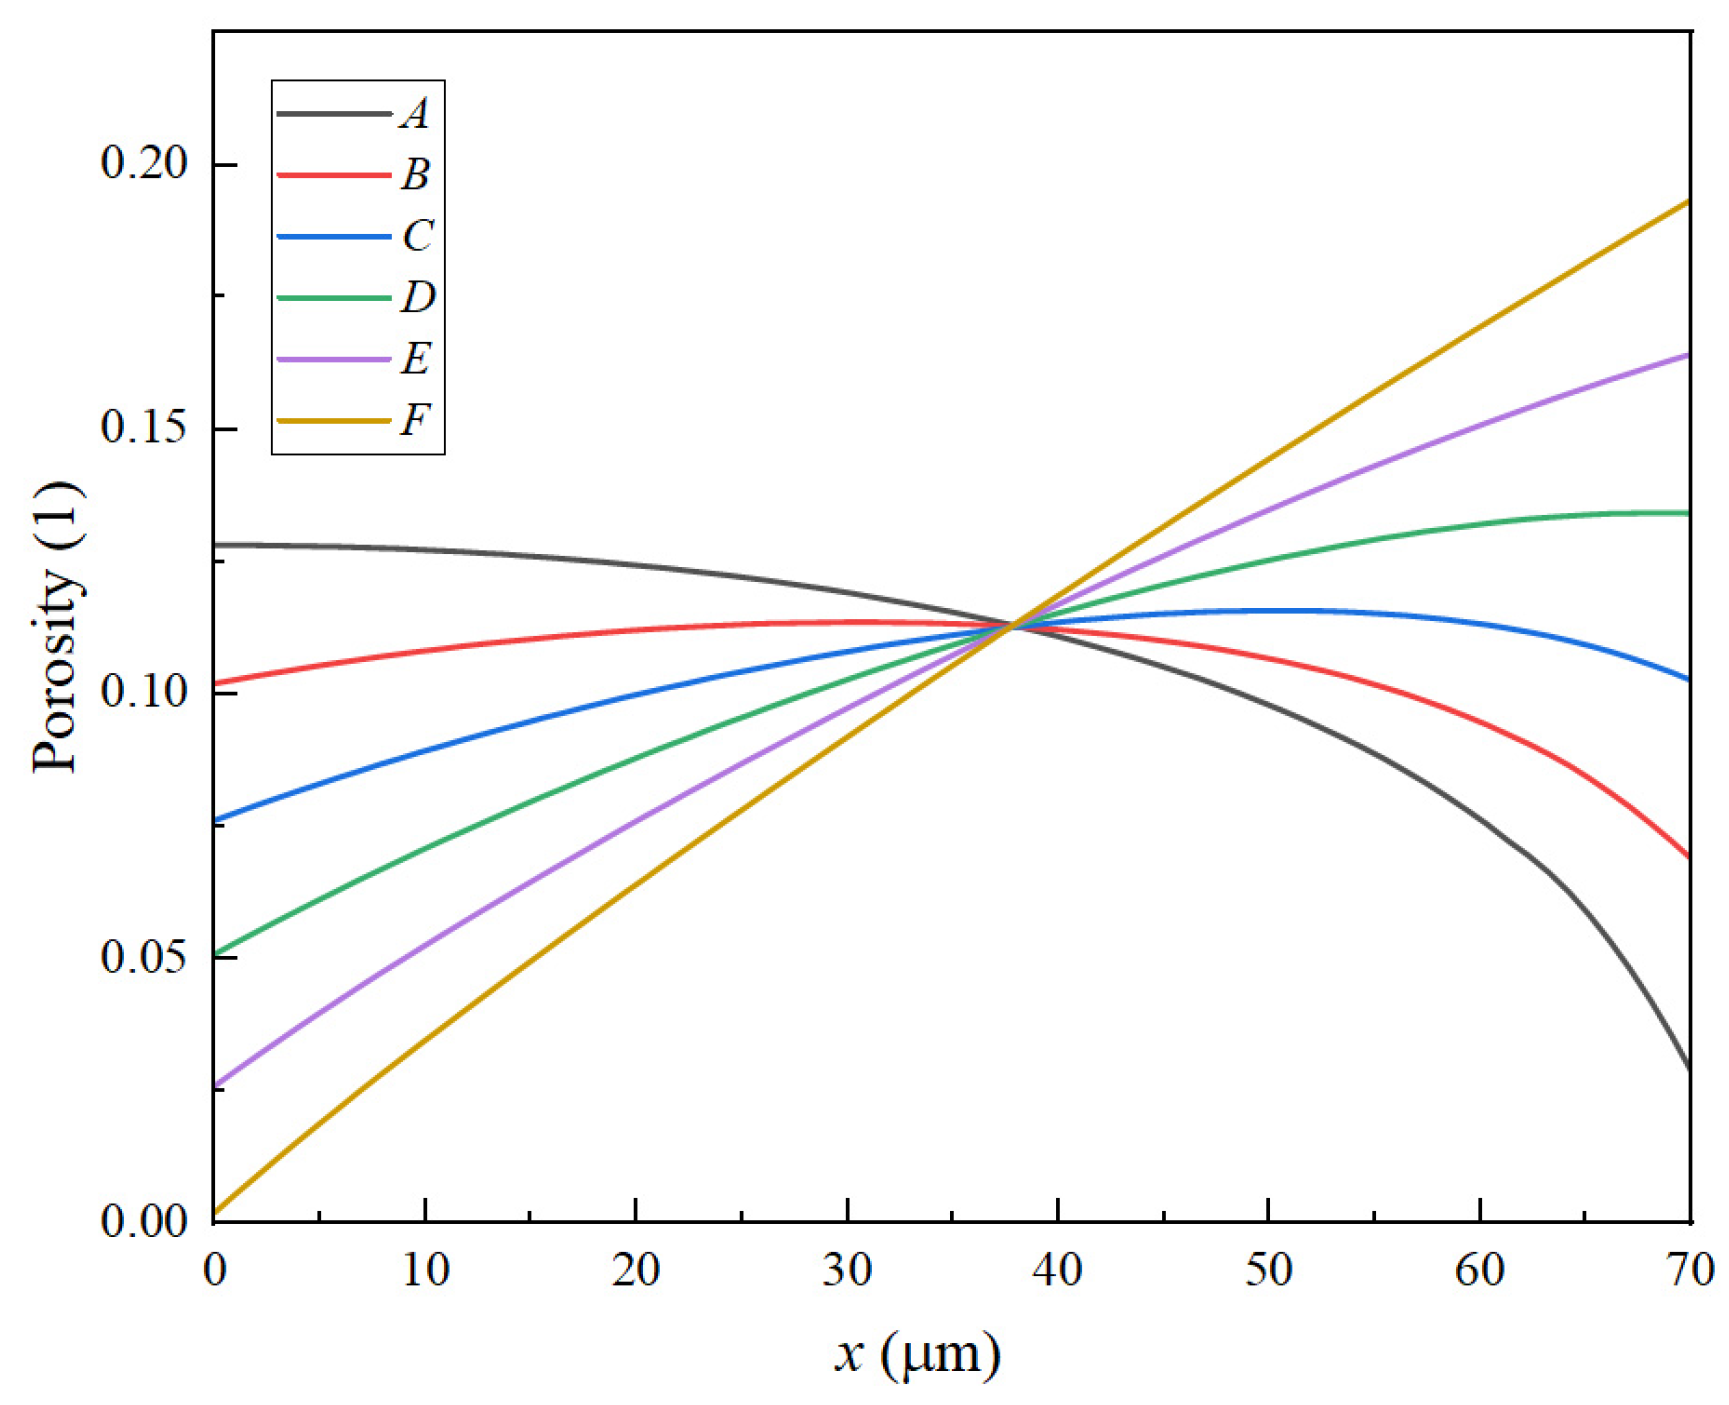
3.3. The Effect of Various Linear Porosity Structures on the Pore Clogging of the Negative Electrode

From the results and the second section of the discussion, it is evident that the linear porosity structure has the most favorable impact on optimizing the pore clogging of the LIB. In this section, we discuss the influence of different linear porosity structures of the LIB, considering six porosity structures shown in Figure 10.
To evaluate the influence of various porosity structures, this study investigates the changes in porosity at two distinct locations: point “a”, near the current collector, and point “b”, near the separator, as illustrated in Figure 11. Figure 12 and Figure 13 demonstrate that the porosity decreases at points “a” and “b”. Notably, for structure A, the porosity decreases to zero near the separator, resulting in the failure of the LIB. In the case of the F structure, when positioned near the current collector, the porosity initially decreases to zero, subsequently leading to the failure of the LIB. For structures C and D, which endure more cycles, maintaining an optimal slope for the negative electrode’s linear porosity structure—neither too steep nor too shallow—is crucial. Therefore, the selection of the slope for the negative linear structure can be based on the actual performance of the LIBs. Furthermore, the distribution of different structures on the negative electrode for the same cycle can also clearly reflect the aforementioned conclusions. As depicted in the diagram, the pores in the local A and D structures have become clogged, resulting in battery failure. In contrast, the porosity of the linear porosity structure in the B structure changes more uniformly and exhibits a longer cycle life. The linear porosity structure in the B configuration can extend the cycle life to 1800 cycles, thereby significantly enhancing the overall cycle life of the LIB. The linear porosity gradient balances mechanical stability; higher porosity near the separator (ε = 0.3–0.4) mitigates volume expansion, while lower porosity near the current collector (ε = 0.1–0.2) maintains structural integrity.

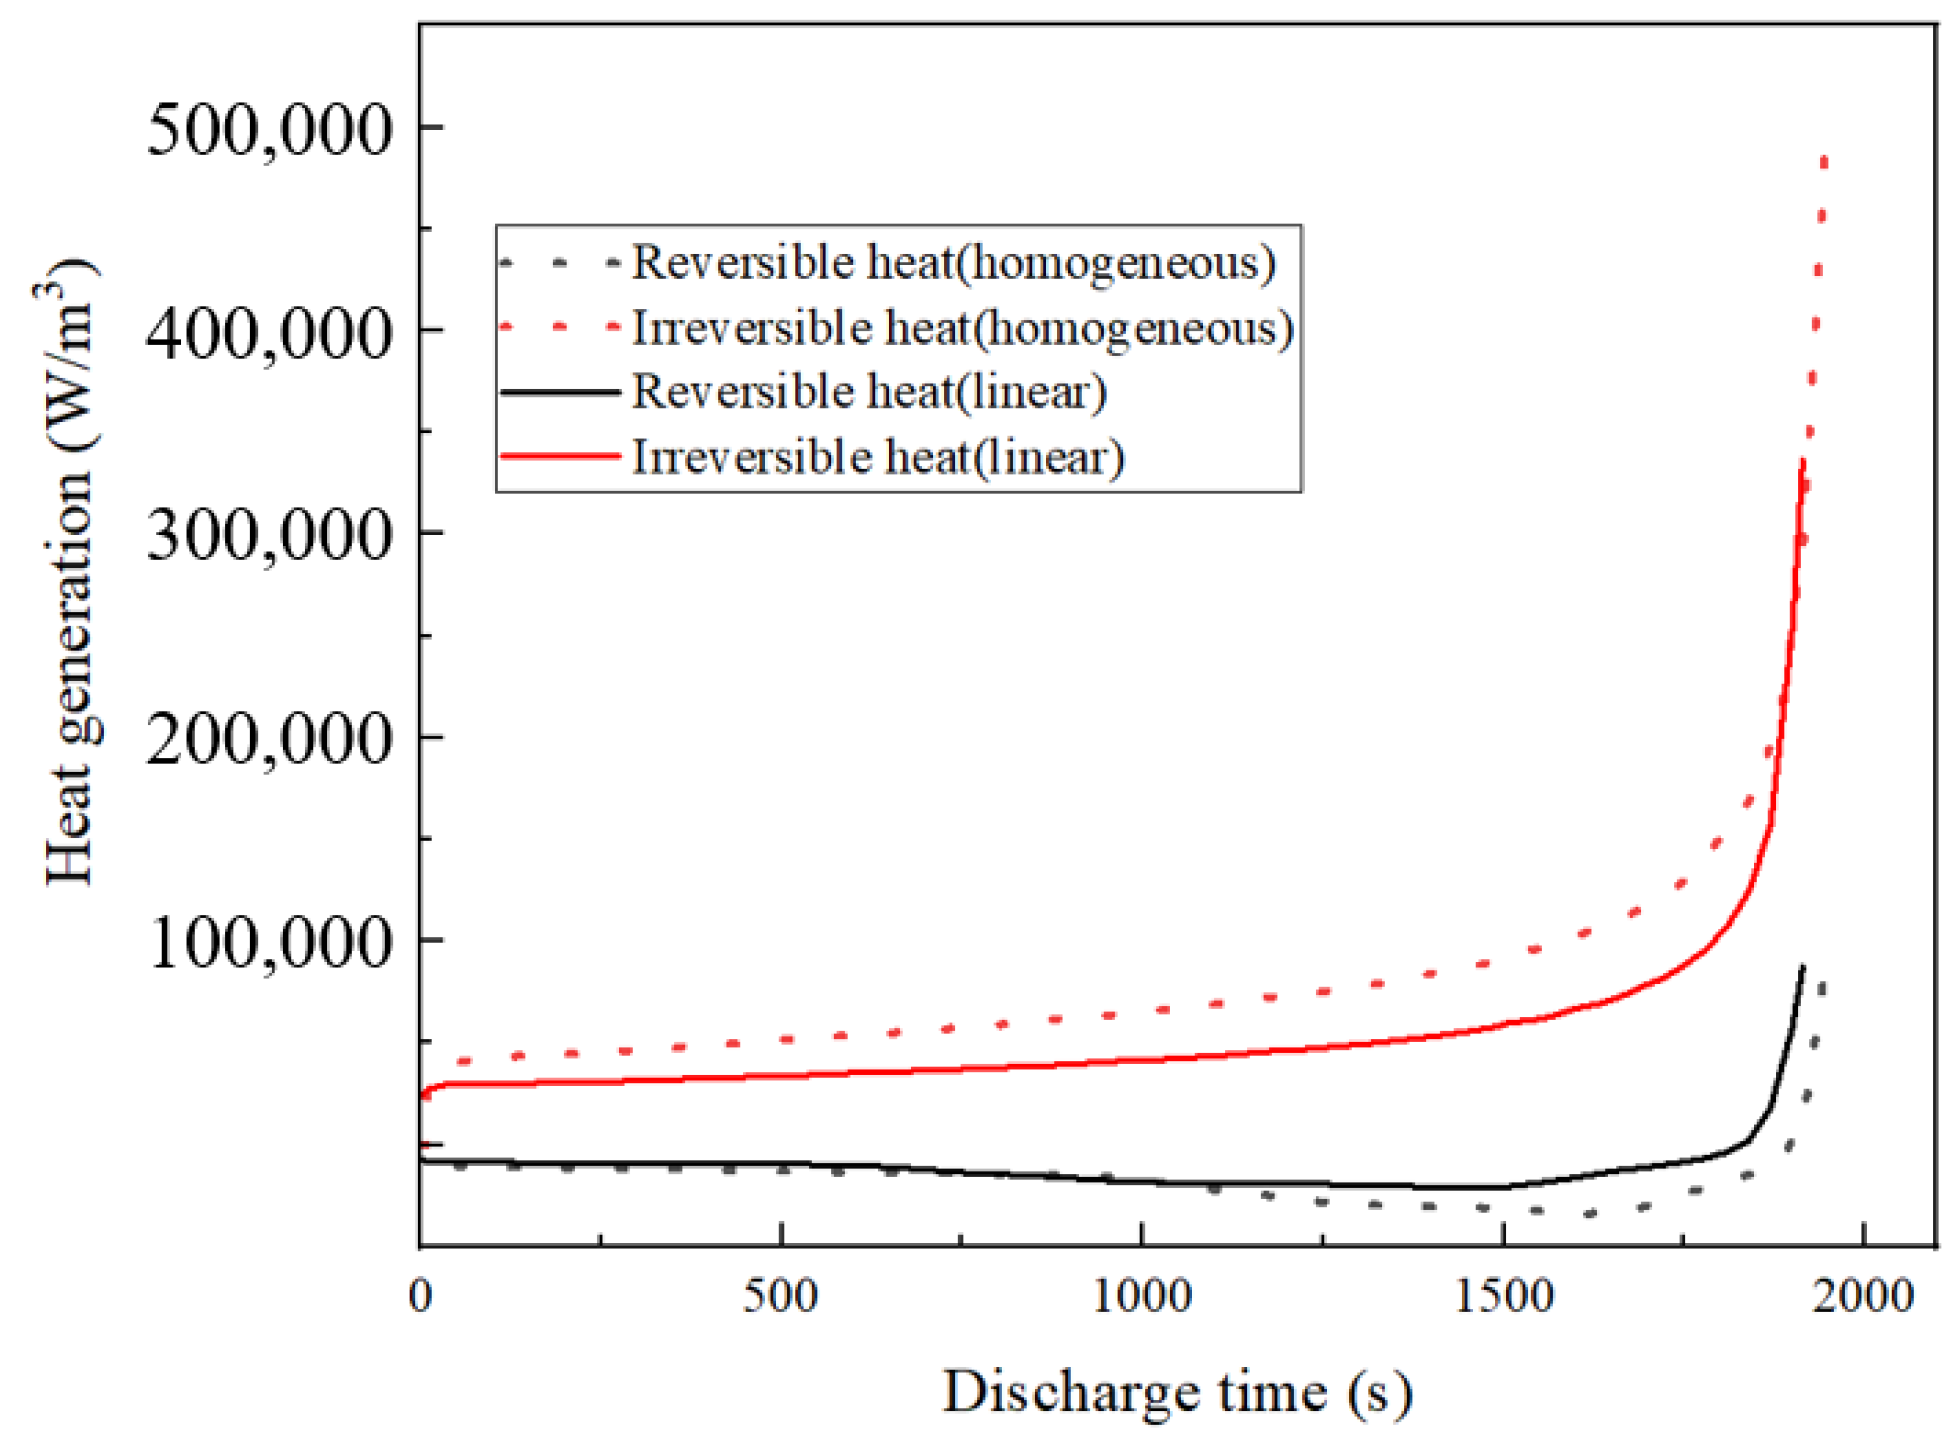
3.4. The Impact of the Linear Porosity Structure of the Negative Electrode on the Heating Behavior of the LIBs

In general, the heat generation in LIBs can be divided into three categories [40]: (1) activation polarization heat Q a c t , resulting from electrochemical reaction polarization between the surface of active material particles and the electrolyte; (2) ohmic heat Q o h m , attributed to the decrease in ohmic potential; and (3) reversible reaction heat Q r e a , associated with the entropy change during charging and discharging.
Q a c t = S a j t o t η
Q r e a = S a j t o t T E E q T
Q o h m = i 1 ϕ 1 + i 2 ϕ 2
Here, j t o t represents the total local current density and E E q T represents the reversible entropy heat. Irreversible heat in LIBs includes both polarization heat and ohmic heat, while reversible heat primarily arises from reaction heat. Ohmic heat originates from the resistance encountered by lithium ions during their transport in electrochemical reactions, a factor closely linked to electrode thickness. As a result, LIBs with thicker electrodes tend to generate more ohmic heat. During battery operation, the electrode/separator interface experiences a heightened flow of lithium ions in comparison to other regions. As a consequence, more ohmic heat is generated at the separator/electrode interface, adversely impacting the uniform distribution of heat within the LIB. Elevated levels of ohmic heat significantly contribute to the overall thermal instability of the electrochemical system, especially near the separator. This, in turn, results in uneven capacity loss. Heat transfer comparisons between uniform and linear porosity structures are analyzed with the negative electrode positioned near the separator, as depicted in Figure 14.
From Figure 14, it can be seen that after 800 cycles, the negative electrode linear porosity structure produces more heat than the negative electrode uniform porosity structure. The reversible heat is not much different, and the irreversible heat increases significantly. The linear porosity structure exhibits minimal impact on the rate of irreversible heat production. Ohmic heat plays a major role in irreversible heat [41]. Over extended cycling periods, the linear porosity structure of the negative electrode significantly reduces the battery’s heat generation, primarily by lowering ohmic heat. This reduction is mainly associated with factors such as ϕ 1 and ϕ 2 in Equation (19), with ϕ 2 playing a predominant role. The porosity of the linear structure near the separator consistently surpasses that of the uniform porosity structure. This observation highlights that as ε 2 decreases, ϕ 2 increases, resulting in a higher production of ohmic heat in a uniform porosity structure.

4. Conclusions

This investigation developed a comprehensive numerical model to investigate the impact of negative electrode porosity distribution on the cycle life of LIBs, with a focus on temperature-dependent aging due to SEI formation. The following key findings and practical applications were derived from the research:
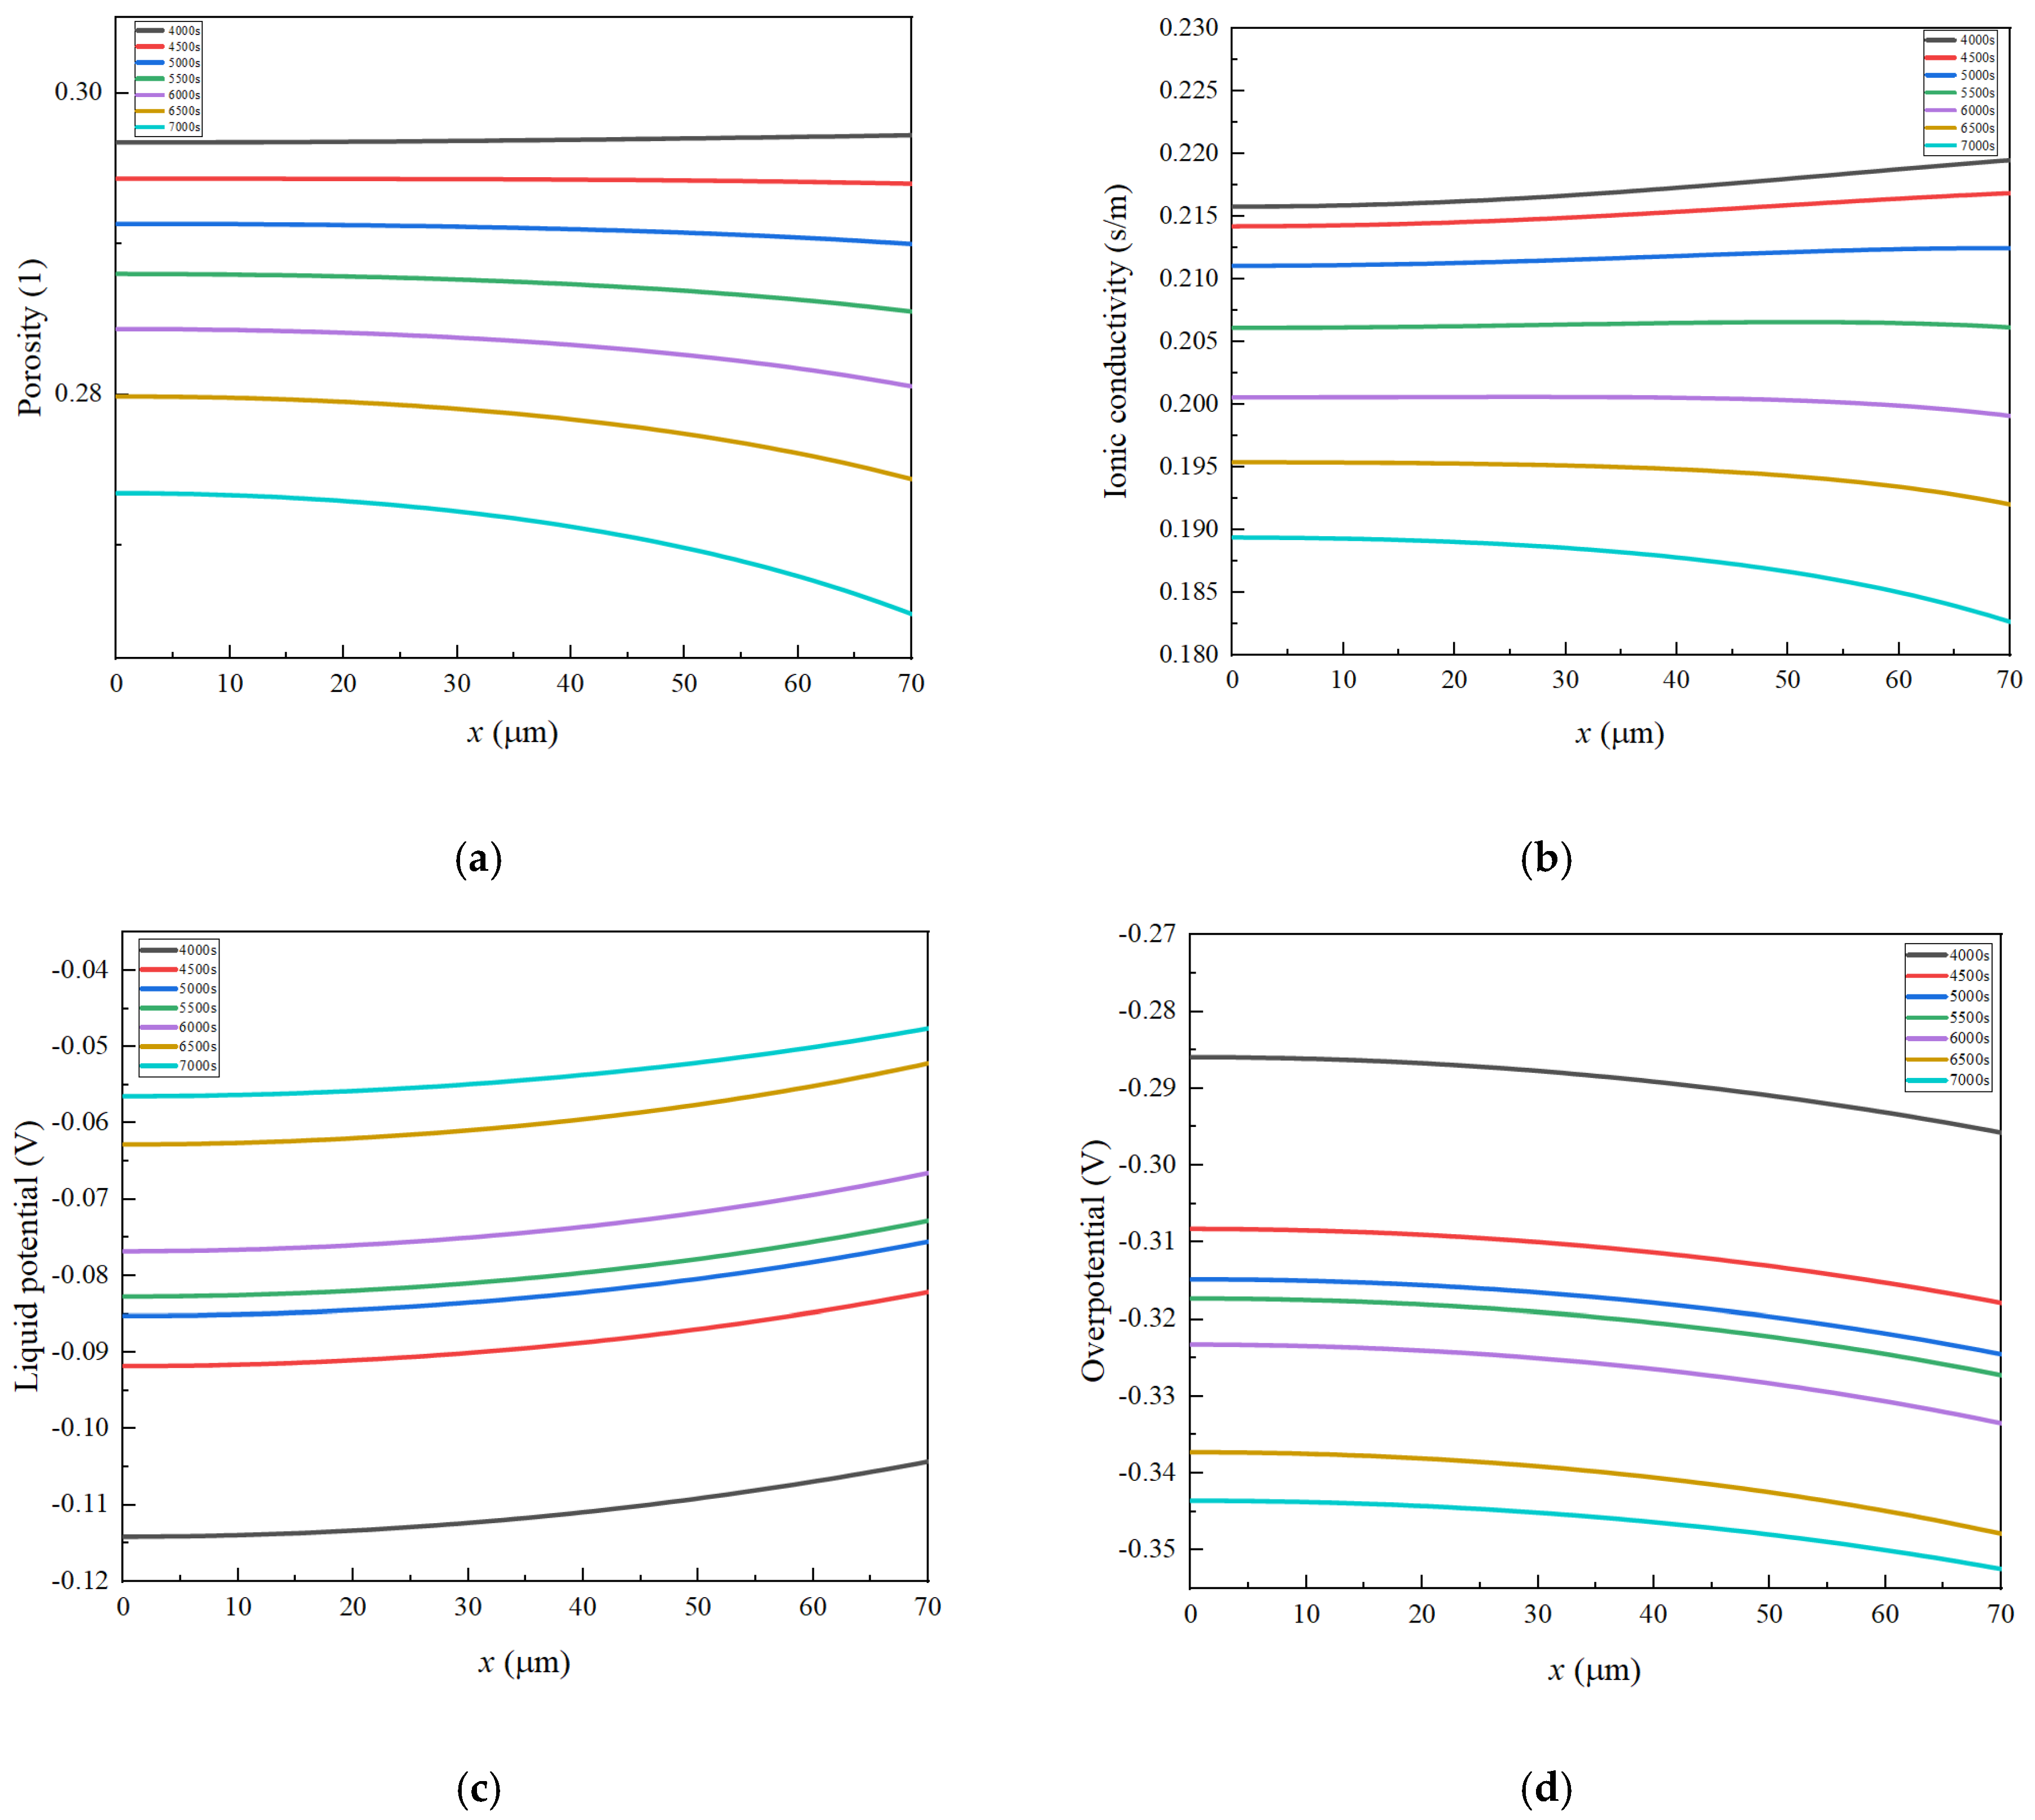
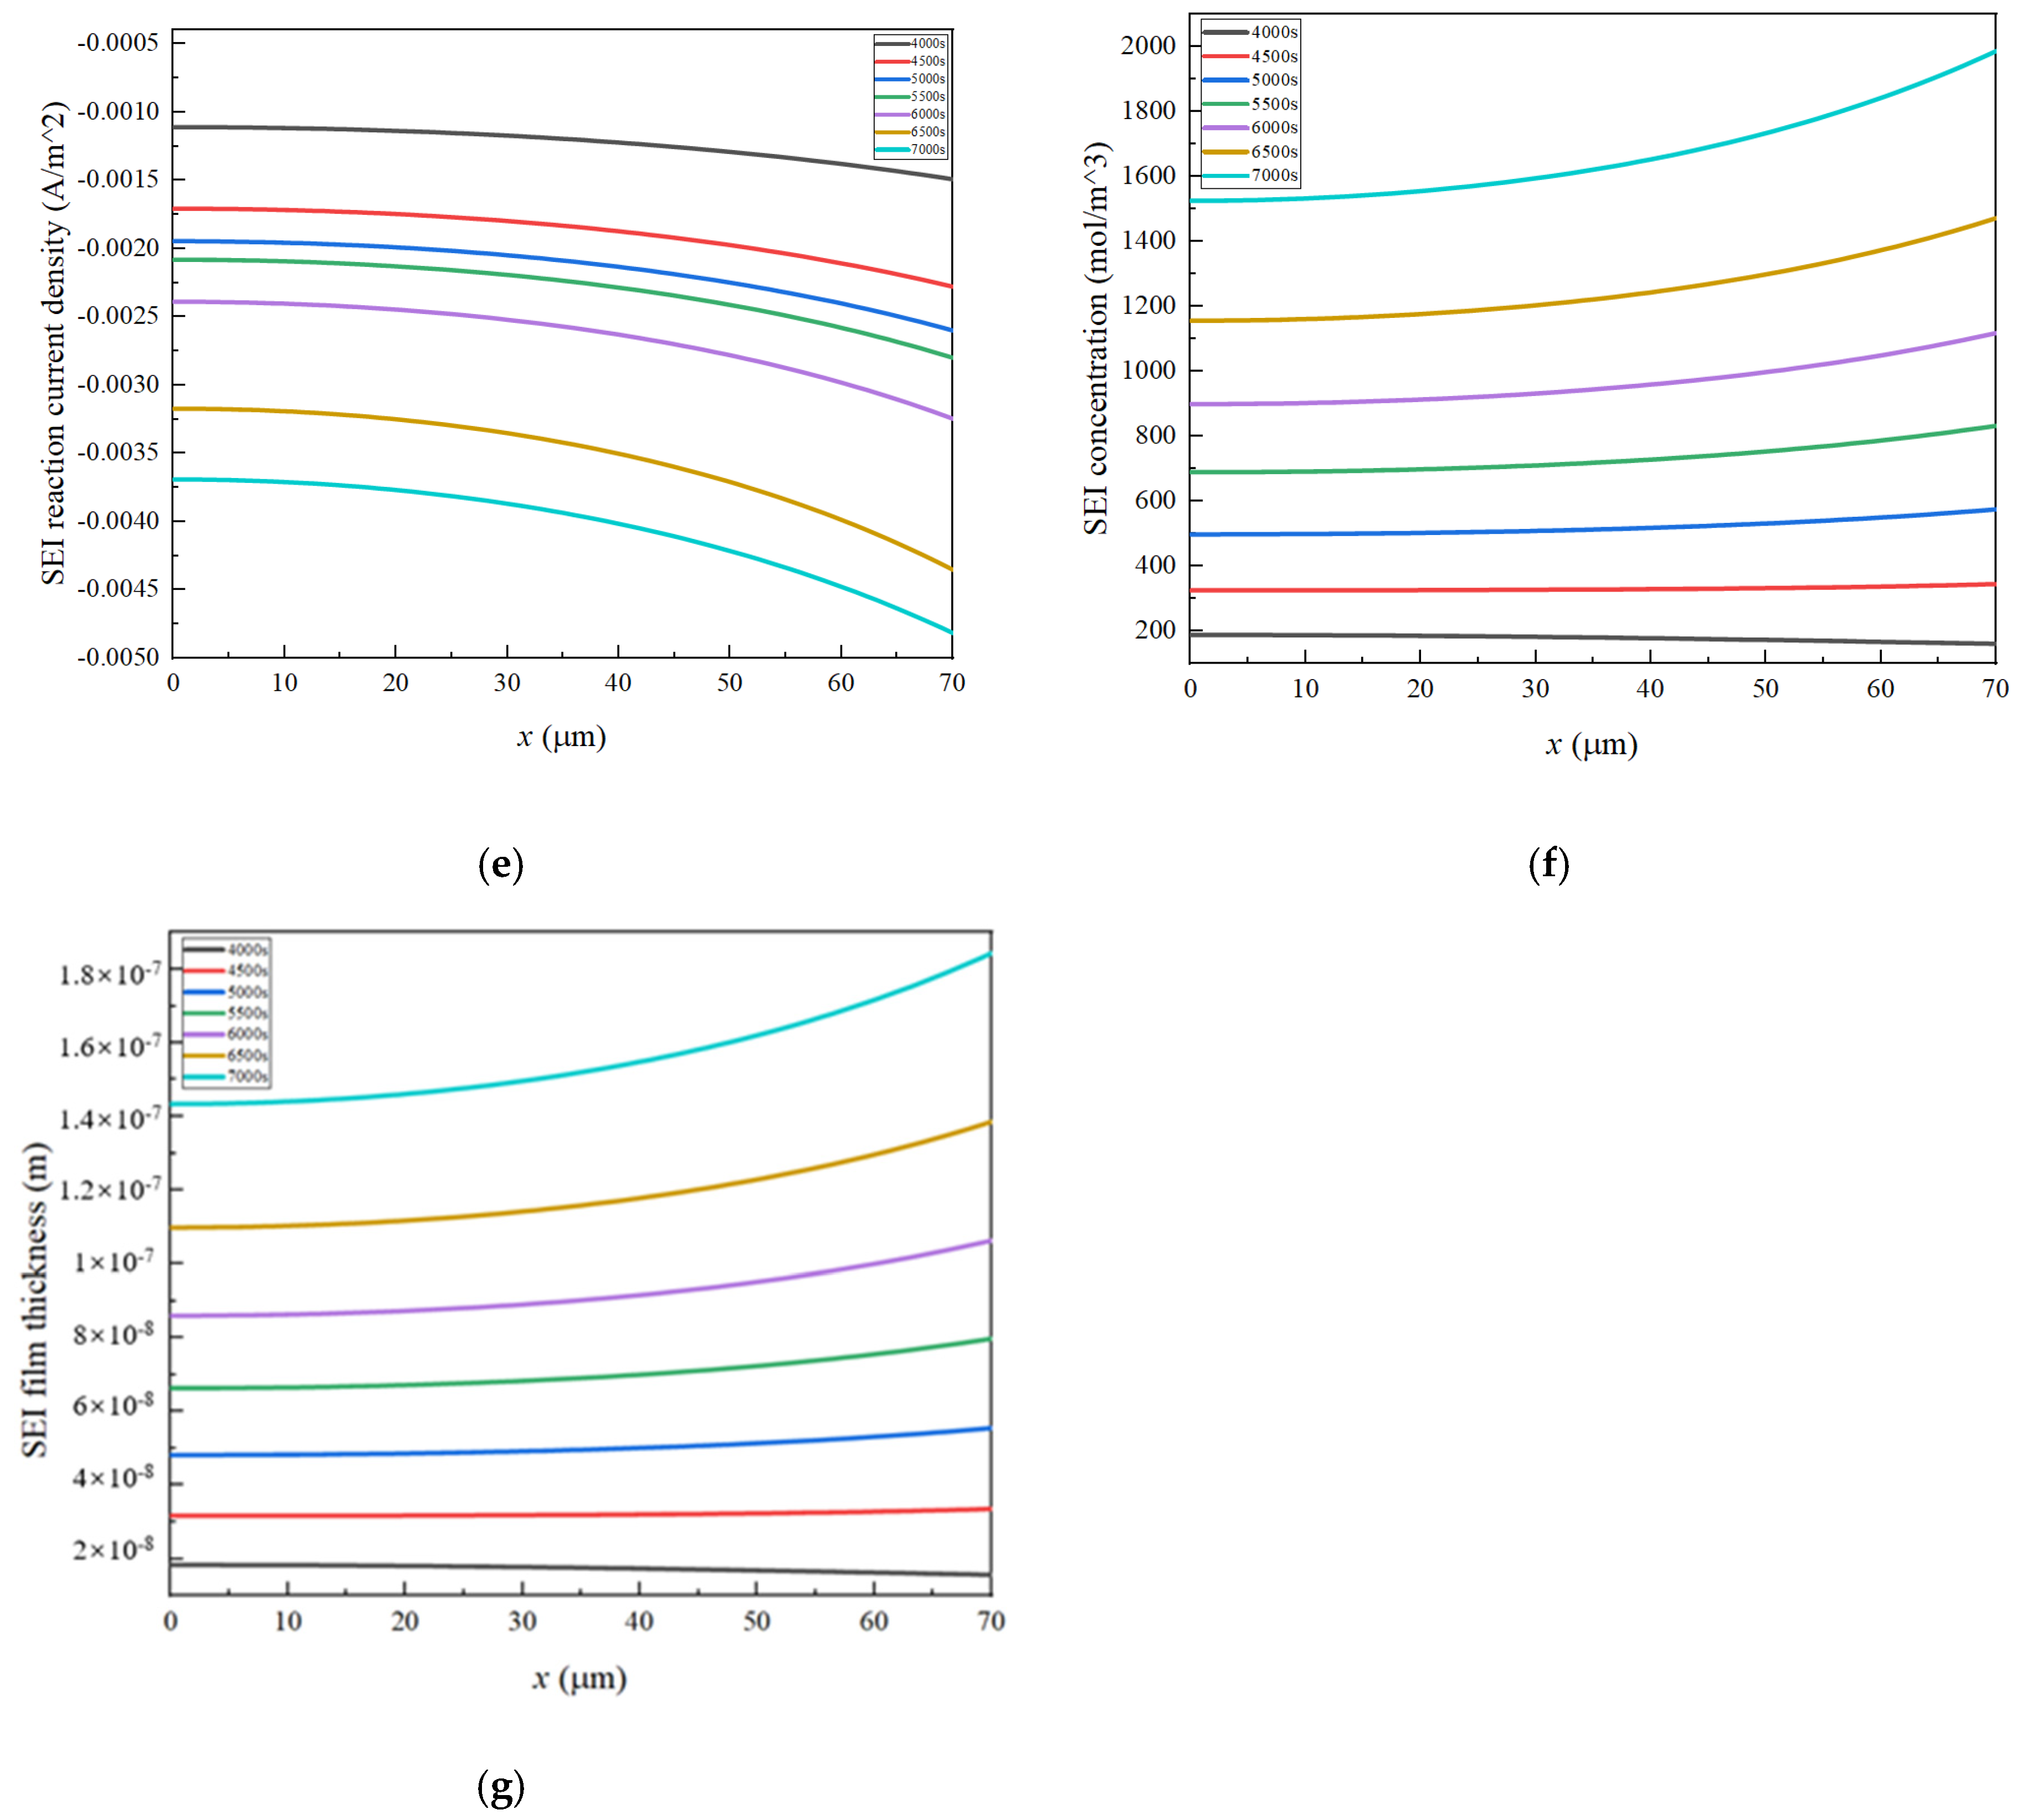
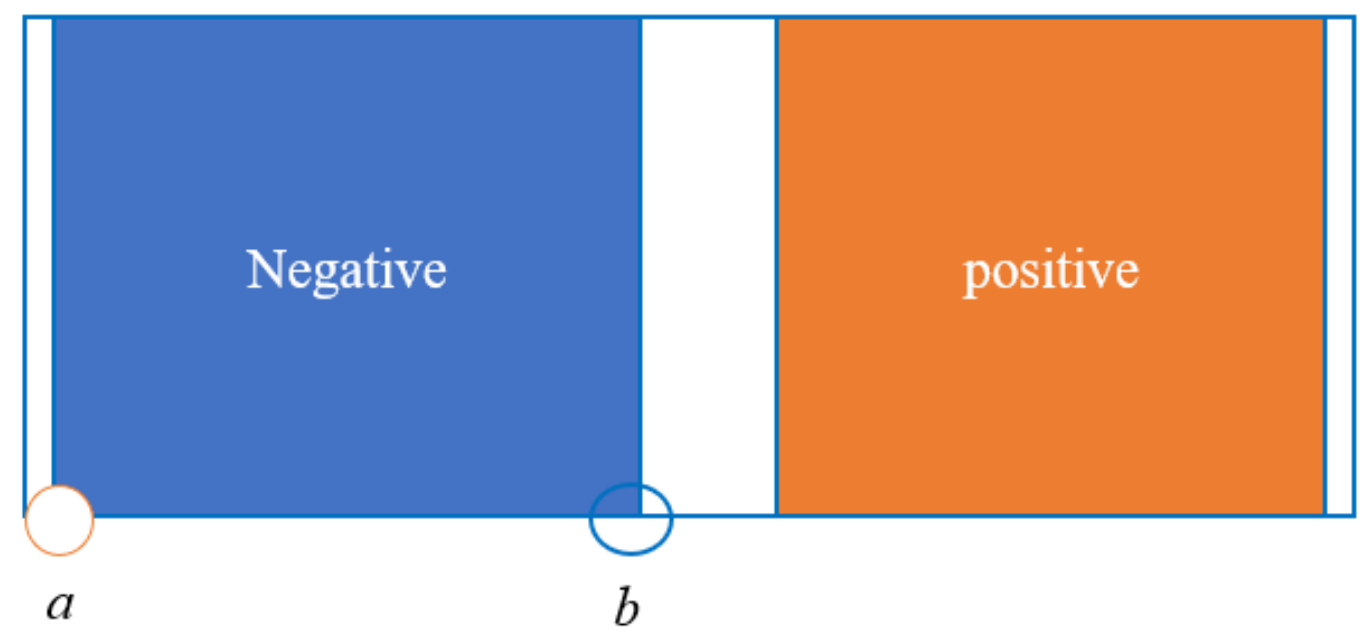
  • Porosity reduction near the separator: During charging, lithium ions diffuse from the positive electrode through the separator, leading to a reduction in porosity near the separator in the negative electrode. This reduced porosity decreases ionic conductivity, accelerates SEI growth, and promotes pore clogging. Consequently, this area experiences the most rapid decrease in porosity, impacting overall battery performance.
  • Influence of gradient and linear porosity structures: Both gradient and linear porosity structures contribute to mitigating pore clogging, though with different effects on capacity loss. Notably, the linear porosity structure enables a more uniform distribution of SEI, leading to better management of lithium-ion transport during cycling.
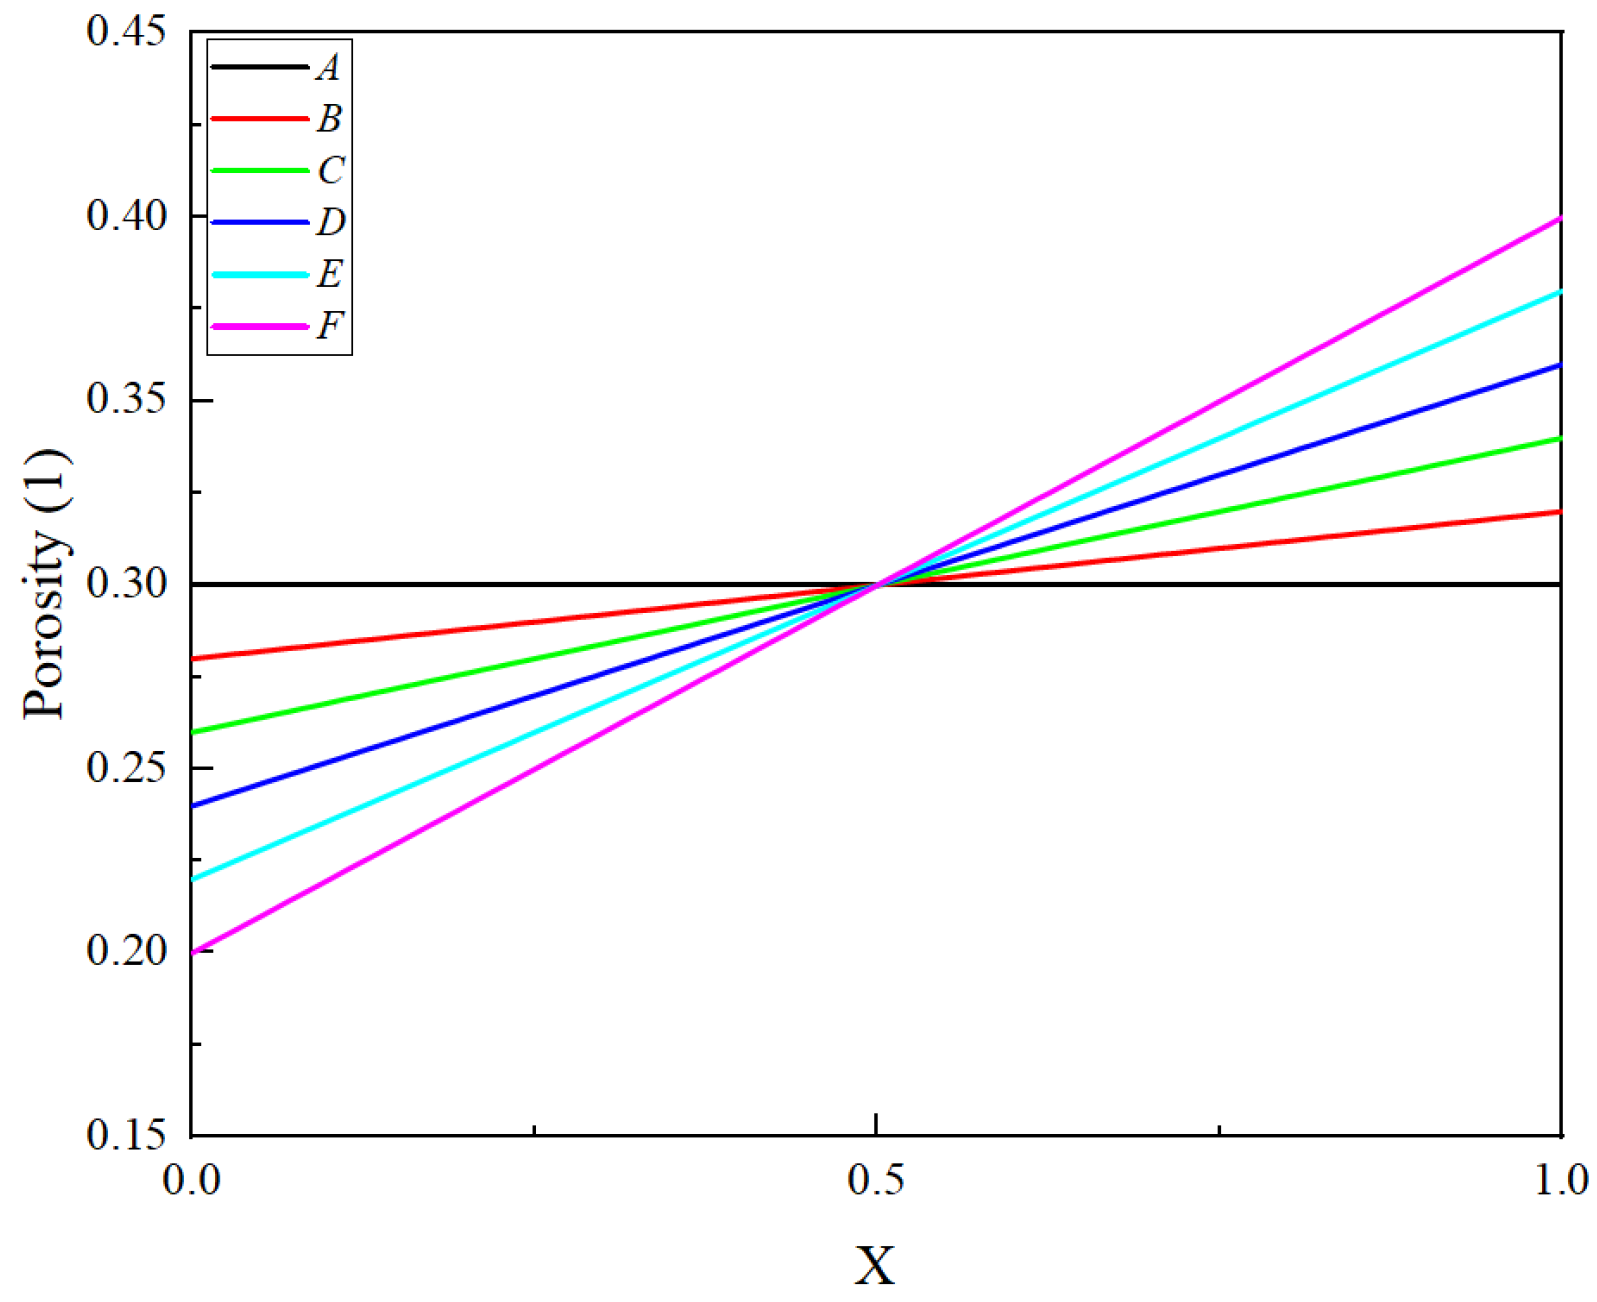
  • Optimization of linear porosity slope: The slope of the linear porosity structure plays a critical role in maintaining cell stability and performance. A high slope leads to premature porosity reduction near the current collector, increasing local current density and reducing conductivity. Conversely, a low slope causes early porosity depletion near the separator, affecting lithium-ion transport and overall electrochemical performance. This finding underscores the need for precise optimization of porosity gradients in battery design.
  • Reduction in ohmic heating: The linear porosity structure is found to significantly reduce ohmic heating in the negative electrode after extended cycling, enhancing the thermal stability and overall efficiency of the LIBs.
This work provides practical insights for optimizing negative electrode porosity structures to improve the cycle life and performance of LIBs, particularly under typical 1C operational conditions. However, factors such as lithium plating and porosity-related internal stress were not considered in this model, and the model’s applicability under low-temperature or high-rate conditions remains limited. Additionally, as the current analysis focuses on uniform, linear, and gradient porosity structures, future studies could explore advanced profiles (e.g., parabolic, fractal) to further optimize electrode performance under dynamic operating conditions. Addressing these limitations and expanding the model’s scope will be important directions for future research. The current model is tailored to LIBs, but the insights gained from porosity optimization could be extended to other types of batteries, such as sodium-ion or solid-state batteries, where ion transport mechanisms differ. These alternative chemistries may benefit from customized porosity designs to enhance performance.

Author Contributions

Conceptualization, S.L. and P.L.; methodology, S.L. and R.Y.; software, S.L.; validation, S.L.; formal analysis, S.L.; investigation, S.L.; resources, P.L.; data curation, S.L.; writing—original draft preparation, S.L.; writing—review and editing, S.L.; visualization, S.L.; supervision, P.L.; project administration, S.L.; funding acquisition, P.L. All authors have read and agreed to the published version of the manuscript.

Funding

This work was funded by the National Natural Science Foundation of China (Grant No. 12272217).

Data Availability Statement

The original contributions presented in this study are included in the article. Further inquiries can be directed to the corresponding author.

Conflicts of Interest

The authors declare no conflict of interest.

Nomenclature

A c e l l area of the positive (both sides) that has opposing negative (m2)
c 1 , i lithium-ion concentration in solid phase (mol m−3)
c 2 , i lithium-ion concentration in electrolyte (mol m−3)
c 1 , max , i maximum lithium-ion concentration (mol m−3)
C p , i heat capacity (J kg−1K−1)
D 1 , i solid-phase diffusivity (m2 s−1)
D ref , i solid-phase diffusivity at reference temperature (m2 s−1)
E k , i reaction active energy (kJ mol−1)
i 1 solid-phase current density (A m−2)
i 2 liquid-phase current density (A m−2)
i 0 , i exchange current density (A m−2)
i loc , i local current density (A m−2)
k 0 , ref , i reaction rate constant at reference temperature (m2.5mol−0.5s−1)
k 0 , i reaction rate constant (m2.5mol−0.5s−1)
k i thermal conductivity (Wm−1K−1)
L i battery thickness (μm)
Q a c t active heat generation (W m−3)
Q o h m ohmic heat generation (W m−3)
Q r e a reaction heat generation (W m−3)
r i characteristic radius of electrode particles (μm)
S O C 0 , i initial state of charge
t time (s)
t + transference number of lithium-ion species dissolved in liquid
T absolute temperature (K)
U i thermodynamic, open circuit voltage (V)
m c e l l total weight of the battery (kg)
t d i s discharge time (s)
J lithium-ion flux (mol m−2s−1)
F Faraday constant (C mol−1)
α transfer coefficient
η Overpotential (V)
γ i Bruggeman tortuosity exponent
ε volume fraction
ϕ i electric potential (V)
κ i ionic conductivity (S m−1)
σ i electronic conductivity (S m−1)
τ tortuosity
v + thermodynamic factor relating to electrolyte activity
ρ i density (kg m−3)
0initial or equilibrium state
1solid phase
eqequilibrium potential
pospositive
sseparator
cccurrent collector
effeffective
2liquid phase
ipos or neg
negnegative
disdischarge
maxmaximum value

References

  1. Kulova, T.L.; Fateev, V.N.; Seregina, E.A.; Grigoriev, A.S. A brief review of post-lithium-ion batteries. Int. J. Electrochem. Sci. 2020, 15, 7242–7259. [Google Scholar] [CrossRef]
  2. Li, C.; Zhang, H.; Ding, P.; Yang, S.; Bai, Y. Deep feature extraction in lifetime prognostics of lithium-ion batteries: Advances, challenges and perspectives. Renew. Sustain. Energy Rev. 2023, 184, 113576. [Google Scholar] [CrossRef]
  3. Dubarry, M.; Liaw, B.Y. Identify capacity fading mechanism in a commercial LiFePO4 cell. J. Power Sources 2009, 194, 541–549. [Google Scholar] [CrossRef]
  4. Schmitt, J.; Rehm, M.; Karger, A.; Jossen, A. Capacity and degradation mode estimation for lithium-ion batteries based on partial charging curves at different current rates. J. Energy Storage 2023, 59, 106517. [Google Scholar] [CrossRef]
  5. Wu, X.G.; Wang, W.B.; Du, J.Y. Effect of charge rate on capacity degradation of LiFePO4 power battery at low temperature. Int. J. Energy Res. 2020, 44, 1775–1785. [Google Scholar] [CrossRef]
  6. Liu, J.; Duan, Q.; Qi, K.; Liu, Y.; Sun, J.; Wang, Z.; Wang, Z.; Wang, Q. Capacity fading mechanisms and state of health prediction of commercial lithium-ion battery in total lifespan. J. Energy Storage 2022, 46, 103910. [Google Scholar] [CrossRef]
  7. Seo, G.; Ha, J.; Kim, M.; Park, J.; Lee, J.; Park, E.; Bong, S.; Lee, K.; Kwon, S.J.; Moon, S.P.; et al. Rapid determination of lithium-ion battery degradation: High C-rate LAM and calculated limiting LLI. J. Energy Chem. 2022, 67, 663–671. [Google Scholar] [CrossRef]
  8. Campbell, I.D.; Marzook, M.; Marinescu, M.; Offer, G.J. How observable is lithium plating? Differential voltage analysis to identify and quantify lithium plating following fast charging of cold lithium-ion batteries. J. Electrochem. Soc. 2019, 166, A725–A741. [Google Scholar] [CrossRef]
  9. Fedorov, R.; Maletti, S.; Heubner, C.; Michaelis, A.; Ein-Eli, Y. Molecular engineering approaches to fabricate artificial solid-electrolyte interphases on anodes for Li-ion batteries: A critical review. Adv. Energy Mater. 2021, 11, 2101173. [Google Scholar] [CrossRef]
  10. Sarkar, A.; Nlebedim, I.; Shrotriga, P. Performance degradation due to anodic failure mechanisms in lithium-ion batteries. J. Power Sources 2020, 502, 229145. [Google Scholar] [CrossRef]
  11. Keil, J.; Jossen, A. Electrochemical modeling of linear and nonlinear aging of lithium-ion cells. J. Electrochem. Soc. 2020, 167, 110535. [Google Scholar] [CrossRef]
  12. Zhou, F.; Bao, C. Analysis of the lithium-ion battery capacity degradation behavior with a comprehensive mathematical model. J. Power Sources 2021, 515, 230630. [Google Scholar] [CrossRef]
  13. Sun, F.; Manke, L. Differentiating and quantifying dead lithium. ChemElectroChem 2019, 6, 5787–5795. [Google Scholar] [CrossRef]
  14. Kushima, A.; So, K.P.; Su, C.; Bai, P.; Kuriyama, N.; Maebashi, T.; Fujiwara, Y.; Bazant, M.Z.; Li, J. Liquid cell transmission electron microscopy observation of lithium metal growth and dissolution: Root growth, dead lithium and lithium flotsams. Nano Energy 2017, 32, 271–279. [Google Scholar] [CrossRef]
  15. Samad, H.; Malik, M.S.S.; Gulzar, M. A non-linear model predictive control strategy to minimise mechanical degradation effects of lithium-ion battery. J. Energy Storage 2023, 71, 108050. [Google Scholar] [CrossRef]
  16. Yang, X.; Leng, Y.; Zhang, G.; Ge, S.; Wang, C. Modeling of lithium plating induced aging of lithium-ion batteries: Transition from linear to nonlinear aging. J. Power Sources 2017, 360, 28–40. [Google Scholar] [CrossRef]
  17. Pfrang, A.; Kersys, A.; Kriston, A.; Sauer, D.U.; Rahe, C.; Kabitz, S.; Figgemeier, E. Long-term cycling induced jelly roll deformation in commercial 18650 cells. J. Power Sources 2018, 392, 168–175. [Google Scholar] [CrossRef]
  18. Muller, D.; Dufaux, T.; Brike, K.P. Model-based investigation of porosity profiles in graphite anodes regarding sudden-death and second-life of lithium ion cells. Batteries 2019, 5, 49. [Google Scholar] [CrossRef]
  19. Wang, Y.; Chang, X.W.; Li, Z.Y.; Mei, Y.N.; Zhang, Y.X.; Liu, L.; Wang, K.; Gu, H.T.; Li, L.S. Preventing sudden death of high-energy lithium-ion batteries at elevated temperature through interfacial ion-flux rectification. Adv. Funct. Mater. 2023, 33, 2208329. [Google Scholar] [CrossRef]
  20. Broussely, M.; Biensan, P.; Bonhomme, F.; Blanchard, P.; Herreyre, S.; Nechev, K.; Staniewicz, R.J. Main aging mechanisms in Li ion batteries. J. Power Sources 2005, 146, 90–96. [Google Scholar] [CrossRef]
  21. Bach, T.C.; Schuster, S.F.; Fleder, E.; Muller, J.; Brand, M.J.; Lorrmann, H.; Jossen, A.; Sextl, G. Nonlinear aging of cylindrical lithium-ion cells linked to heterogeneous compression. J. Energy Storage 2016, 5, 212–223. [Google Scholar] [CrossRef]
  22. Mukhopadhyay, A.; Sheldon, B.W. Deformation and stress in electrode materials for Li-ion batteries. Prog. Mater. Sci. 2014, 63, 58–116. [Google Scholar] [CrossRef]
  23. Lee, D.; Kim, B.; Shin, C.B.; Oh, S.-M.; Song, J.; Jang, I.-C.; Woo, J.-J. Modeling the combined effects of cyclable lithium loss and electrolyte depletion on the capacity and power fades of a lithium-ion battery. Energies 2022, 15, 7056. [Google Scholar] [CrossRef]
  24. Sauertieg, D.; Hanselmann, N.; Arzberger, A.; Reinshagen, H.; Ivanov, S.; Bund, A. Electrochemical-mechanical coupled modeling and parameterization of swelling and ionic transport in lithium-ion batteries. J. Power Sources 2018, 378, 235–247. [Google Scholar] [CrossRef]
  25. Kim, Y. Encapsulation of LiNi0.5Co0.2Mn0.3O2 with a thin inorganic electrolyte film to reduce gas evolution in the application of lithium ion batteries. Phys. Chem. Chem. Phys. 2015, 17, 6400–6405. [Google Scholar] [CrossRef]
  26. Niu, S.J.; Zhu, G.B.; Wu, K.; Zheng, H. The feasibility for natural graphite to replace artificial graphite in organic electrolyte with different film-forming additives. Chin. J. Chem. Eng. 2023, 56, 58–69. [Google Scholar] [CrossRef]
  27. Ji, Y.; Zhang, Y.; Wang, C.Y. Li-ion cell operation at low temperatures. J. Electrochem. Soc. 2013, 160, A636–A649. [Google Scholar] [CrossRef]
  28. Miranda, D.; Costa, C.M.; Almeida, A.M.; Lanceros-Mendez, S. Computer simulations of the influence of geometry in the performance of conventional and unconventional lithium-ion batteries. Appl. Energy 2016, 165, 318–328. [Google Scholar] [CrossRef]
  29. Ye, G.; Tong, W.; Liu, X.; Song, X.; Zhou, J.; Zhou, X. An analytical method for the optimization of pore network in lithium-ion battery electrodes. Chem. Eng. Res. Des. 2019, 149, 226–234. [Google Scholar] [CrossRef]
  30. Suthar, B.; Northrop, P.W.C.; Rife, D.; Subramanian, V.R. Effect of porosity, thickness and tortuosity on capacity fade of anode. J. Electrochem. Soc. 2015, 162, A1708–A1722. [Google Scholar] [CrossRef]
  31. Yu, R.; Li, P.; Wang, K.; Zhang, H. Numerical investigation on the impact of linear variation of positive electrode porosity upon the performance of lithium-ion batteries. J. Electrochem. Soc. 2023, 170, 050502. [Google Scholar] [CrossRef]
  32. Fuller, T.F.; Doyle, M.; Newman, J. Modeling of galvanostatic charge and discharge of the lithium/polymer/insertion cell. J. Electrochem. Soc. 1993, 140, 1526–1533. [Google Scholar] [CrossRef]
  33. Doyle, M.; Newman, J.; Gozdz, A.S.; Schmutz, C.N.; Tarascon, J.M. Comparison of modeling predictions with experimental data from plastic lithium ion cells. J. Electrochem. Soc. 1996, 143, 1890–1903. [Google Scholar] [CrossRef]
  34. Pals, C.R.; Newman, J. Thermal modeling of the lithium/polymer battery: I. Discharge behavior of a single cell. J. Electrochem. Soc. 1995, 142, 3274–3281. [Google Scholar] [CrossRef]
  35. Pals, C.R.; Newman, J. Thermal modeling of the lithium/polymer battery: II. Temperature profiles in a cell stack. J. Electrochem. Soc. 1995, 142, 3282–3288. [Google Scholar] [CrossRef]
  36. Yin, L.; Björneklett, A.; Söderlund, E.; Brandell, D. Analyzing and mitigating battery ageing by self-heating through a coupled thermal-electrochemical model of cylindrical Li-ion cells. J. Energy Storage 2021, 39, 102648. [Google Scholar] [CrossRef]
  37. Sikha, G.; Popov, B.N.; White, R.E. Effect of porosity on the capacity fade of a lithium-ion battery. J. Electrochem. Soc. 2004, 151, A1104–A1114. [Google Scholar] [CrossRef]
  38. Lu, L.L.; Lu, Y.Y.; Zhu, Z.X.; Shao, J.X.; Yao, H.B.; Wang, S.; Zhang, T.W.; Ni, Y.; Wang, X.X.; Yu, S.H. Extremely fast-charging lithium ion battery enabled by dual-gradient structure design. Sci. Adv. 2022, 8, eabm6624. [Google Scholar] [CrossRef]
  39. Zhou, H.Y.; Gao, L.T.; Li, Y.M.; Lyu, Y.; Guo, Z.-S. Electrochemical performance of lithium-ion batteries with two-layer gradient electrode architectures. Electrochim. Acta 2024, 476, 143656. [Google Scholar] [CrossRef]
  40. Luo, P.; Li, P.; Ma, D.; Wang, K.; Zhang, H. A novel capacity fade model of lithium-ion cells considering the influence of stress. J. Electrochem. Soc. 2022, 169, 100535. [Google Scholar] [CrossRef]
  41. Zhao, R.; Liu, J.; Gu, J. The effects of electrode thickness on the electrochemical and thermal characteristics of lithium ion battery. Appl. Energy 2015, 139, 220–229. [Google Scholar] [CrossRef]
Figure 1. P2D model of lithium-ion battery.
Energies 18 02883 g001
Figure 2. Negative electrode porosity structure distribution. (a) Uniform porosity structure. (b) Linear porosity structure. (c) Gradient porosity structure.
Energies 18 02883 g002
Figure 3. Capacity loss vs. cycles.
Energies 18 02883 g003
Figure 4. The porosity changes with the number of cycles.
Energies 18 02883 g004
Figure 5. The electrolyte potential at both ends of the electrode at the end of the first cycle discharge ϕ 2 .
Energies 18 02883 g005
Figure 6. The distribution of important parameters at 4000–7000 s in the negative electrode: (a) ε 2 , (b) κ 2 e f f , (c) ϕ 2 , (d) η , (e) j S E I , (f) c S E I , (g) δ f i l m .
Energies 18 02883 g006aEnergies 18 02883 g006b
Figure 7. Relative capacity vs. cycles.
Energies 18 02883 g007
Figure 8. Porosity distribution of negative electrode after 110 cycles.
Energies 18 02883 g008
Figure 9. (a) Relative capacity vs. cycles. (b) SEI concentration distribution on the negative electrode. (c) Porosity distribution on the negative electrode.
Energies 18 02883 g009
Figure 10. Six kinds of negative electrode linear porosity distribution.
Energies 18 02883 g010
Figure 11. Negative electrode pole position diagram.
Energies 18 02883 g011
Figure 12. Porosity distribution: (a) “a” position and (b) “b” position.
Energies 18 02883 g012
Figure 13. Negative electrode porosity distribution after 1000 cycles.
Energies 18 02883 g013
Figure 14. Different heat sources in the discharge process after 1C 800 cycles.
Energies 18 02883 g014
Table 1. Model parameter for battery.
ParameterCc (neg)NegSepPosCc (pos)
A cell   ( m 2 ) 0.4275
ε 1 , i 0.59 0.61
ε 2 , i 0.30.450.3
L i   ( μ m ) 1070206015
r i   ( μ m ) 10 4
c 2 , 0   ( mol   m 3 ) 1000
c 1 , max , i   ( mol   m 3 ) 31,370 51,385
S O C 0 , i 0.8 0.4
α n ,   α p 0.5 0.5
γ i 1.541.5
D ref , i   ( m 2 s 1 ) 9 × 10 11 2.6 × 10 13
E D , i   ( kJ   mol 1 ) 50 25
t + 0.363
F   ( C   mol 1 ) 96,487
T ref   ( K ) 298.15
Table 2. Aging parameters.
ParametersValue
Reaction rate constant for SEI formation, K S E I (m s−1) K S E I = 9.85 × 10 4 × exp ( 15700 J/mol R T )
Equilibrium potential SEI formation, E e q , S E I (V)0.4
Lower and upper voltage boundary for cycling, U min U max (V)2.75–4.2
charge transfer coefficients for side reactions, α 0.5
Disclaimer/Publisher’s Note: The statements, opinions and data contained in all publications are solely those of the individual author(s) and contributor(s) and not of MDPI and/or the editor(s). MDPI and/or the editor(s) disclaim responsibility for any injury to people or property resulting from any ideas, methods, instructions or products referred to in the content.

