Article

Impact of Rock Elastic Properties on Fracture Geometry in Potential Enhanced Geothermal Systems in Poland

1
Oil and Gas Institute—National Research Institute, 25A Lubicz Str., 31-503 Krakow, Poland
2
Faculty of Mining, Safety Engineering and Industrial Automation, Silesian University of Technology, 2 Akademicka Str., 44-100 Gliwice, Poland
*
Author to whom correspondence should be addressed.
Energies 2025, 18(11), 2869; https://doi.org/10.3390/en18112869
Submission received: 8 April 2025 / Revised: 13 May 2025 / Accepted: 27 May 2025 / Published: 30 May 2025
(This article belongs to the Special Issue The Status and Development Trend of Geothermal Resources)

Abstract

In hot dry rocks (HDRs), hydraulic fracturing is necessary to create enhanced geothermal systems (EGSs) and optimize flow rates between injection and production wells. The geometry of the induced fracture is related to numerous factors, including rock mechanical properties, especially Young’s modulus and Poisson’s ratio. In this paper, we show the influence of Young’s and Poisson’s parameters on fracture geometry in selected HDR-type prospective areas in Poland. Parameters were determined in the laboratory based on drill core samples from granite and sandstone formations using both dynamic and static methods. The results obtained reveal strong differences between dynamic and static values in granite and less diverse results in sandstone. Based on these data, numerical simulations of fracture geometry were carried out, taking into account the variability in the rocks’ elastic parameters. Sensitivity analysis showed that relatively high diversity in the elastic parameters led to a relatively slight impact on the fracture geometry of the tested formations. The influence of Young’s modulus did not exceed 6.5% of the reference half-length and width values for sandstone and 7.3% of the half-length for granite. Variability in the fracture width was significant in granite formation and amounted to 46.4%. The influence of Poisson’s ratio was marginal in both tested types of rocks. The research results, which have not been reported previously, can be considered for the design of hydraulic fracturing operations in enhanced geothermal systems in Poland.

1. Introduction

Hot dry rocks (HDRs) are one of the most promising sources of clean, renewable energy production. Utilizing this potential may meet energy needs for many decades [1]. To extract heat from deep formations with low porosity and low permeability, it is necessary to improve the hydraulic conductivity in reservoirs [2]. Due to the use of stimulation methods to increase conductivity in rocks, these types of systems are called enhanced geothermal systems (EGSs). In EGSs, connecting two or more wells at the depth of the target zone allows one to create an underground heat exchanger, where the process fluid (most often water) circulates in the loop through the formation between injection and production wells. The fluid is heated in a conduction process and then releases energy at the surface as steam, driving electric generators. Depending on the temperature at the surface, electricity is generated in binary or direct systems. The most widely used method of HDR stimulation is hydraulic fracturing (HF), which allows engineers to create new or reopen pre-existing fractures both near and far from the wellbore [3,4,5]. In contrast to other reservoir stimulation methods, HF enables a permanent connection between wells spaced hundreds of meters apart in the target zone. Since the 1970s, many EGS projects in which the main method of rock stimulation was tensile fracturing or hydroshearing have been developed, e.g., Fenton Hill in the USA [6,7], Rosemanowes in the UK [3], Ogachi in Japan [8], Habanero in Australia [9], projects in Rhine Graben in Western Europe [10,11,12,13,14], and Phoang in Korea [15]. In these projects, HF operations were carried out in both igneous and sedimentary strata, using different types of fracking fluid, proppants, and diversified types of pumping schedules. In other regions, including Poland, extensive work is currently underway to identify and evaluate prospective areas for EGSs [16,17,18].
The geometry of the fracture network that makes up the HDR geothermal system is influenced by many factors, including the stress state, development of the planes of discontinuity, and petrophysical parameters of the target zone. Our study investigates how rock elastic parameters influence fracture geometry at selected prospective EGS sites in Poland. It presents preliminary recommendations for HF operations in these formations. The data, which include the impact of Young’s modulus and Poisson’s ratio on fracture dimensions along with a sensitivity analysis, are novel and have not been published previously. To achieve this goal, we selected two petrothermal formations in Poland: altered granite from the Karkonosze Mountains and sandstone from the Mogilno-Łódź Trough. Core samples were collected from wellbores in both regions for analysis.
Results of the laboratory petrophysical and petrographical analyses of these samples in dry conditions were presented in a previous study [18]. In this paper, we combine these data with new results from subsequent laboratory ultrasonic tests on brine-saturated samples and strength tests of dry samples. Using FracPro software (version 10.13.6.0), we analyze the impact of rock elastic parameters on fracture half-length, height, and width as well as conductivity in the considered formations and present preliminary guidelines for their enhancement through HF operations.

2. Geomechanical Issues of Hydraulic Fracturing in Hot Dry Formations

EGS reservoirs can be broadly classified into two main types based on the stimulation concept [19]: (1) relatively intact reservoirs with extremely low matrix permeability and poorly conductive natural fractures and (2) reservoirs where conductivity is primarily enhanced by shear failure and slippage along pre-existing natural fractures. In the first type reservoirs, HF operations are predominantly controlled by in situ stress conditions and, to a lesser extent, petrophysical and rock mechanical parameters. In these settings, the minimum principal stress largely dictates the initiation and propagation direction of fractures [2,11]. Under common stress regimes such as extensional or strike-slip, vertical fractures are primarily formed (Figure 1). Fracturing in this case is governed by a tensile mechanism, which demands high injection pressures and the use of proppants. While this produces a simpler fracture network, it results in a reduced contact area between the rock and wellbore, thereby limiting system efficiency [19]. The second type of reservoir is dominated by shear-driven fracturing mechanisms (hydroshearing), where stimulation pressures are typically lower (below the minimum principal stress) and proppant is often unnecessary. This is due to the self-propping behavior of reactivated natural fractures. These shear-activated fractures provide greater contact area, resulting in more efficient geothermal energy extraction. However, in some other EGSs, both natural and induced fractures created in both pure tensile and hydroshearing mechanisms can play a role, with induced fractures acting as connectors between natural ones [20]. The interaction mode between natural and induced fractures is mainly controlled by the confining stress, approaching angle, mechanical properties of natural fractures, injection rate, and fluid viscosity [21]. The injection of relatively cool treatment fluid into a hot reservoir can also induce thermally driven fractures, typically oriented perpendicular to hydraulic fractures induced by stress reduction. While this mechanism has not been directly observed in the field, it has been confirmed through laboratory-scale experimental studies [19].
The geological factors that influence the geometry of the induced fracture also include rock permeability/leakoff coefficient as well as the elastic properties of the target zone and the formations above and below it. The elastic parameters of the rock describe the behavior of the material, including its susceptibility to deformation and failure under applied stress of a certain magnitude. Main elastic rock parameters that must be known to design an HF system are Young’s modulus ( E ) and Poisson’s ratio ( v ). E defines how much energy is required to complete the displacement, which is consistent with the classical concept of linear elastic fracture mechanics. According to classic fracture mechanics, as E increases, the length and height of the fracture increase, while width decreases. The net pressure (fracturing and closure differential pressure ratio) also increases. Rocks with a large E require more energy to experience displacement. In these formations, fractures tend to be relatively narrow, and the rock is referred to as “hard” [23]. The E value of a rock typically increases with decreasing values of discontinuity and weakness planes and with increasing water saturation. v determines the ability of rocks to fail under stress [24]. In practice, the influence of v is lower than that of E . In formations with low v values, the unfavorable penetration of proppant grains into the fracture walls (embedment phenomenon) increases, leading to a decrease in conductivity [25,26]. Other elastic parameters, i.e., bulk ( K ) and shear modulus ( G ), are derivatives that can be calculated from E and v . Their influence on the fracture geometry results from the influence of E and v ; thus, they are usually not directly used for HF design.

2.1. Laboratory Rock Elastic Parameter Determination

Mechanical properties play one of the most crucial roles in HF operations but also have an impact on many other aspects, especially on wellbore stability, compression/tension capacity, and the general safety of underground structures in exploration areas [27]. Two laboratory methods of rock mechanical parameter determination are commonly used: destructive and non-destructive. In the destructive method, parameters are calculated from stress-to-strain relation in the sample during uniaxial or triaxial static loading experiments. The deformation is recorded until the sample breaks, and the parameters obtained are called static. The static Young’s modulus ( E s t a t ) defines the linear relationship between applied stress σ and strain ε on the load axis (1) [23],
E s t a t = σ / ε
whereas the static Poisson’s ratio ( v s t a t ) describes the negative ratio of transverse strain ( ε t r a n s v e r s e ) to axial strain ( ε a x i a l ) (2) [23].
v s t a t = d   ε t r a n s v e r s e / d   ε a x i a l
In the non-destructive method, mechanical properties are measured indirectly based on the relationship between the velocity of elastic waves (longitudinal and shear) and the bulk density of the measured sample (3) and (4) [28]:
v d y n = 1 / 2 ( V S / V P ) 2 1 ( V S / V P ) 2
E d y n = ρ V P 2 ( 1 + v ) ( 1 v ) ( 1 v )
where E d y n —dynamic Young’s modulus, Pa; V P —P-wave velocity, m/s; V S —S-wave velocity, m/s; v d y n —dynamic Poisson’s ratio, dimensionless; ρ —bulk density, g/cm3. The advantage of this type of testing is that the dynamic elastic parameters determined in reservoir conditions, i.e., the measurement of a saturated core sample at reservoir temperature, taking into account the influence of the effective pressure, can be correlated with the acoustic logging data. Since the samples are not destroyed during testing, they can be measured multiple times, which allows for testing before and after exposure to unfavorable environmental conditions, for example CO2 [29,30]. E -to- v relations, both dynamic and static, are also used to calculate the rock brittleness index (BI) parameter used to estimate susceptibility to fracking, mostly in natural gas reservoirs [24,31], and also may indicate prospective intervals in HDRs [18].

2.2. Relation Between Dynamic and Static Moduli

The discrepancy between static and dynamic rock mechanical parameters has been the subject of research for many years [27,32,33]. In most published papers, researchers indicate that E d y n is larger than E s t a t , whereas the relationship between v d y n and v s t a t is not so obvious. E d y n is typically one to two times greater than the corresponding static value [34]. However, in weak or fractured rocks, such as coal, the E d y n / E s t a t ratio can significantly exceed two [35]. Furthermore, Bukowska et al. [36] showed that E d y n for very weak fractured coals can be several times greater than E s t a t , whereas v d y n is comparable to v s t a t . The observed variations between static and dynamic parameters are explained by complex external and internal factors like stress–strain conditions, temperature, sample mineral composition, presence of fractures or cracks, type of pore fluid, and rock anisotropy. With respect to these factors, the existence of microfractures and pores in the rock is described as the main cause of these differences. Correlations between dynamic and static parameters are usually described by several types of empirical equations. The most commonly used are linear regression-based ( E s t a t =   a E d y n + b ) and power-law-based ( E s t a t =   α E d y n β ). For igneous and metamorphic rocks, the optimal relationship is the power-law correlation. On the other hand, for sedimentary rocks, linear and nonlinear logarithmic correlations give better results [27].
HDRs are usually igneous or less often tight sedimentary rocks. In general, intact unaltered granite formations are characterized by significantly high E values, up to 80 GPa [37,38]. However, as the number of planes of discontinuity in the rock increases, lower E values and higher discrepancies between dynamic and static values are expected [39]. Igneous rocks are good examples of diversity in static and dynamic elastic moduli depending on rock alteration. In the study conducted by Lama and Vutukuri [40], in intact unaltered granite, E d y n and E s t a t were similar and in the range of 65.0–70.0 GPa, whereas in slightly altered granite, both E d y n and E s t a t decreased rapidly, and the average E d y n was three times higher than E s t a t (about 15.0–5.0 GPa for dynamic and static, respectively).

2.3. Modeling Hydraulic Fracture Geometry

The numerical modeling of synthetic EGSs is a strategy that allows for testing different operational approaches before implementation in the field [2]. In scientific and field practice, several types of models are used, differing in terms of the set of required input data and associated numerical solutions and providing different types of output data depending on the specific needs. A 2D-plane strain approximation (Khristianovich–Geertsma–De Klerk) or 3D planar fracture model with fixed height (Perkins–Kern–Nordgren) cannot take into account, among others, the impact of natural planes of weakness or the reorientation of fractures under the influence of field stresses. More advanced models (planar shear decoupled, planar elastically coupled) consider stress shadow effects and predefined fracture barriers. High-resolution fracture models (discrete fracture network, synthetic rock mass, and bonded particle models) are suitable for modeling non-planar and complex fractures when detailed petrophysical and geomechanical data are available, whereas continuum models are advantageous in simulating large-scale problems [41]. For modeling HF operations in HDRs, both 3D planar fracture models [10,11,42,43] and more advanced models, e.g., multiple, cluster and discrete fracture models [2,44], thermo-hydro-mechanical damage models [45,46,47], and coupled thermo-poroelastic finite element models [48], have been used so far. Recently, advanced models integrating thermal, hydraulic, mechanical, chemical, and wellbore dynamics effects have been developed to evaluate, among others, various fracture network scenarios and consequently predict heat extraction performance [49].

3. Materials and Methods

3.1. Research Area

For this study, two potential EGS locations in Poland were defined, differing in terms of lithology and petrophysical properties: low-porosity and permeable sandstones from the Mogilno-Łódź Trough and granites from the Karkonosze Mountains area. The core samples were collected from two boreholes: Piotrków Trybunalski IG-1 (PT-1) (sandstones) and Czerwony Potok PIG-1 (CP-1) (granites). Following the method suggested by ISRM [50], cylindrical samples with a diameter of 2.54 cm (1 inch) and a length of 5.08 cm (2 inches) were cut in the vertical direction (along the borehole axis).

3.2. Determination of Dynamic Elastic Parameters

Dynamic elastic parameters were determined using the Acoustic Velocity System AVS-700 produced by Vinci (Nanterre, France). Before testing, the samples were fully saturated with 2% KCl brine in a vacuum container for 24 h. The samples were tested at 140 °C under triaxial conditions, with the hydrostatic confining pressure increasing from ambient pressure to 550 bar. The pore pressure in the samples was maintained at up to 20 bar throughout the tests; therefore, with increasing confining pressure, the effective pressure also increased. The methodology of determining the dynamic elastic parameters for dry samples, as well as a detailed description of the device and sample preparation, is presented by Moska et al. [18].

3.3. Determination of Static Elastic Parameters

Stress–strain experiments were carried out on an MTS-810 universal testing machine (MTS Systems, Eden Prairie, MN, USA). Sixteen core samples were tested under conventional triaxial conditions based on ISRM recommendations [50]. The aim was to determine the stress–strain characteristics of the sample during uniform loading until failure. E s t a t was measured based on precritical stress–strain characteristics as a tangent of the straight line slope to the strain axis. This straight line is a linear approximation of the failure curve in the precritical part of the stress–strain curve. The tests were carried out at ambient temperature and a radial pressure of 150 or 300 bar. Initially, it was assumed that E s t a t would be compared with E d y n at both pressures separately; however, due to the small number of samples and the average difference between the confining pressures in E s t a t of 14% for granites and 9.5% for sandstones, it was decided to combine the results from both confining pressures and compare them with the corresponding E d y n . Due to the limitations of the pressure chamber, the values of v s t a t were determined only under uniaxial conditions (additional eight samples) using transverse extensometer set and were compared to v d y n measured in triaxial tests.

3.4. Numerical Modeling of Fracture Geometry

Planar 3D fracture geometry was simulated using Carboceramics FracPro software (version 10.13.6.0). The chosen model was the default model in the software (3D shear decoupled), which calculates the fracture growth with the composite layering effect. An important feature of the used model is that it does not take into account the presence of natural planes of discontinuity (natural fractures, cracks of fault planes), which may be prospective zones for hydraulic stimulation, especially in igneous HDRs. In other words, the model assumes the propagation of the newly induced fracture in an intact rock layer. As a result, the model also does not include the effect of the mixed stimulation mechanism or the related connection of natural fractures with induced fractures [20,21]. These simplifications in the use of the model were adopted due to the lack of available data, especially information on the presence of natural fracture zones in the analyzed locations, and because of discontinuities on a macro scale. Therefore, the results obtained for igneous rocks are intended to show how the geometry of the induced fracture changes depending on the variability in the elastic parameters of the intact rock layer. To better reflect the desirable natural fracture zones in the igneous formation, in the pay zone, slightly increased porosity and permeability were assumed with respect to adjacent zones. Due to the mentioned features of the used model, especially in the igneous formation, the showed results should be considered preliminary information on the variability in the geometry of the induced fracture as a function of elastic parameters. More precise results can be obtained by modeling natural fractures and their interactions with induced ones. A broader set of input data would enable the use of specialized thermal–hydraulic–mechanical simulators, leading to more accurate and reliable results. In practice, an analysis of the treatment parameters and reservoir responses is performed after each HF simulation. The conclusions allow one to improve the calibration of the assumed model and the design of the next treatment.
The first step in the modeling process is to define the general geological conditions in the considered locations, as well as the assumptions for the HF operation. These assumptions were based on the HF effects obtained in previously conducted EGS projects in Western Europe, in particular those in Rhine Graben (Soultz-sous-Forêts, Landau, Rittershoffen) and Groß Schönebeck [11,43,51,52]. Based on above-mentioned literature data, the depth, thickness, and lithological profile in selected locations were defined. The porosity and permeability coefficients, as well as elastic parameters, of the target zone rocks were adopted from laboratory tests on the core samples [18], while for the overlying rocks, the literature values for the relevant lithological types were assumed. The vertical principal stress σ V was calculated based on the assumed average density of the overburden. Analyzed fracture dimensions were defined as follows: fracture half-length: radial distance from the wellbore to the outer tip of a fracture, fracture height: vertical distance of the fracture, fracture width: opening width of the fracture along the normal direction, propped half-length/height: length/height of the propped part of the fracture.

3.4.1. Mogilno-Łódź Trough Area, Sandstone Formation

The lithological model for the sandstone formation was based on the simplified model of the Piotrków Trybunalski IG-1 well. The pay zone in the Rotliegend sandstone was assumed to exist at a depth of 4030 to 4101 m. Due to the incomplete information on the construction of the wellbore, in the model, we used the selected data from the Gt GrSK 4/05 wellbore in the Groß Schönebeck EGS project [12], as well as construction data from other wellbores in the Rotliegend formation in Poland. Figure 2 shows a schematic view of the wellbore construction, including the depths and diameters of the tubing and casing. The design of the well construction, including casing and tubing, was adapted to the ranges of formation pressure, ensuring safe operation (400 and below 600 bar for reservoir and maximum wellhead pressure, respectively). The perforation was assumed from 4060 to 4080 m in the Rotliegend formation.
The principal petrophysical parameters of the pay zone and the adjacent over- and underlying zones (40 and 88 m thick, respectively) were taken from laboratory core sample measurements presented by Moska et al. [18]. The pay zone was characterized by slightly higher porosity and permeability relative to adjacent zones. For the elastic modulus sensitivity analysis, it was assumed that the applied E and v in the pay zone ranged from the lowest to the highest, including the average, values obtained for this formation in the dynamic laboratory tests presented by Moska et al. [18] and static tests described in this study. The range of considered E values was from 14.8 GPa (minimum value obtained in static tests) to 31.4 GPa (maximum obtained in dynamic tests for saturated samples). The hypothetical elevated value for hard sandstone (50.0 GPa) was also added to show the influence the higher E . The reference point (100%) for E was assumed to be 19.2 GPa. The remaining petrophysical parameters of the model, including v , were not changed. v was assumed as the average value from dynamic tests for dry samples and was equal to 0.19. The range of v in sensitivity analysis ranged from 0.12 to 0.22 (values obtained in the performed tests) and additionally included hypothetically elevated values of 0.30 and 0.35, wherein E was fixed as the average value from the dynamic tests of the dry samples and equaled 19.2 GPa.
The pumping schedule was designed based on information available in the literature [11,12,43]. It was divided into 10 steps. In the first step, 30 lb/1000 gal linear polymer fluid (so called pad) was pumped. This concentration of the fluid provides enough viscosity to open and propagate the fracture under the assumed conditions. In the second step, fluid with the same polymer concentration was used in addition to 100-mesh quartz sand. The addition of very-small-grain sand allows for the widening of perforation holes and reduces the fluid flow resistance in the near-wellbore zone. In the next steps, the transport of the proppant to the created fracture was scheduled. For this purpose, high-viscosity fluids based on cross-linked polymer bonds, are usually used. This allows for the transport of a proppant of relatively high strength and density deep into the created fracture. In these steps, 30 lb/1000 gal cross-linked polymer fluid with 20/40 high-strength ceramic proppant was used. Typically, during HF operations, proppant injection begins from the lowest concentrations and gradually increases during the process. This technique allows for more efficient propping. The pumping rate depends on the type of liquid and the concentration of proppant. The rates were assumed to be 2.0 m3/min in the pad, 3.0 m3/min in the clean perforation step, and 4.0 m3/min in the slurry steps. The proppant concentration increased between the first and last slurry steps from 150 to 800 kg/m3. The model net pressure for the last frac step was 49.5 bar. Details of the pumping schedule in the Mogilno-Łódź area are shown in Figure 3.

3.4.2. Karkonosze Mountains, Granite Formation

In the Karkonosze Mountains area, the lithology is confirmed from drilling data only to a depth of about 2000 m [53]. Below this depth, only assumptions based on the literature are possible. For the purposes of this work, we assumed that the lithological profile consists of granitoid pluton along its entire considered depth. The pay zone was placed at a depth of 4020 to 4180 m (160 m thick). The perforation was assumed to be at a depth of 4100 to 4112 m.
Similarly to the case of the considered sandstone formation, the pay zone parameters were assumed based on laboratory core sample measurements presented by Moska et al. [18] and from this study, whereas the parameters of the overburden were taken from the software database. We assumed that the pay zone is characterized by increased porosity (2.5%) and permeability (0.5 mD) with respect to adjacent zones (0.79% and 0.001%, respectively) to reflect the desirable tightened natural fracture zone of higher alteration.
The applied E and v values in the pay zone were assumed to include the lowest, average, and highest values obtained for the formation in dynamic laboratory tests presented by Moska et al. [18] and static tests described in this study. The considered E ranged from 16.75 GPa (average value obtained in static tests for naturally fractured samples) to 62.9 GPa (average from dynamic tests for dry intact samples); 80 GPa, a value for intact granite obtained from the literature [37,38]; and several intermediate values. The reference point (100%) for E was assumed to be 62.9 GPa, while v was fixed at the average value obtained from dynamic tests (0.28). The range of v in sensitivity analyses was from 0.07 (minimum obtained in static tests) to 0.37 (hypotethical elevated value), including intermediate values obtained in the static and dynamic tests, wherein E was fixed as the average value from dynamic tests for naturally fractured samples and equaled 43.8 GPa. It was assumed that the reference point for v (100%) was 0.28.
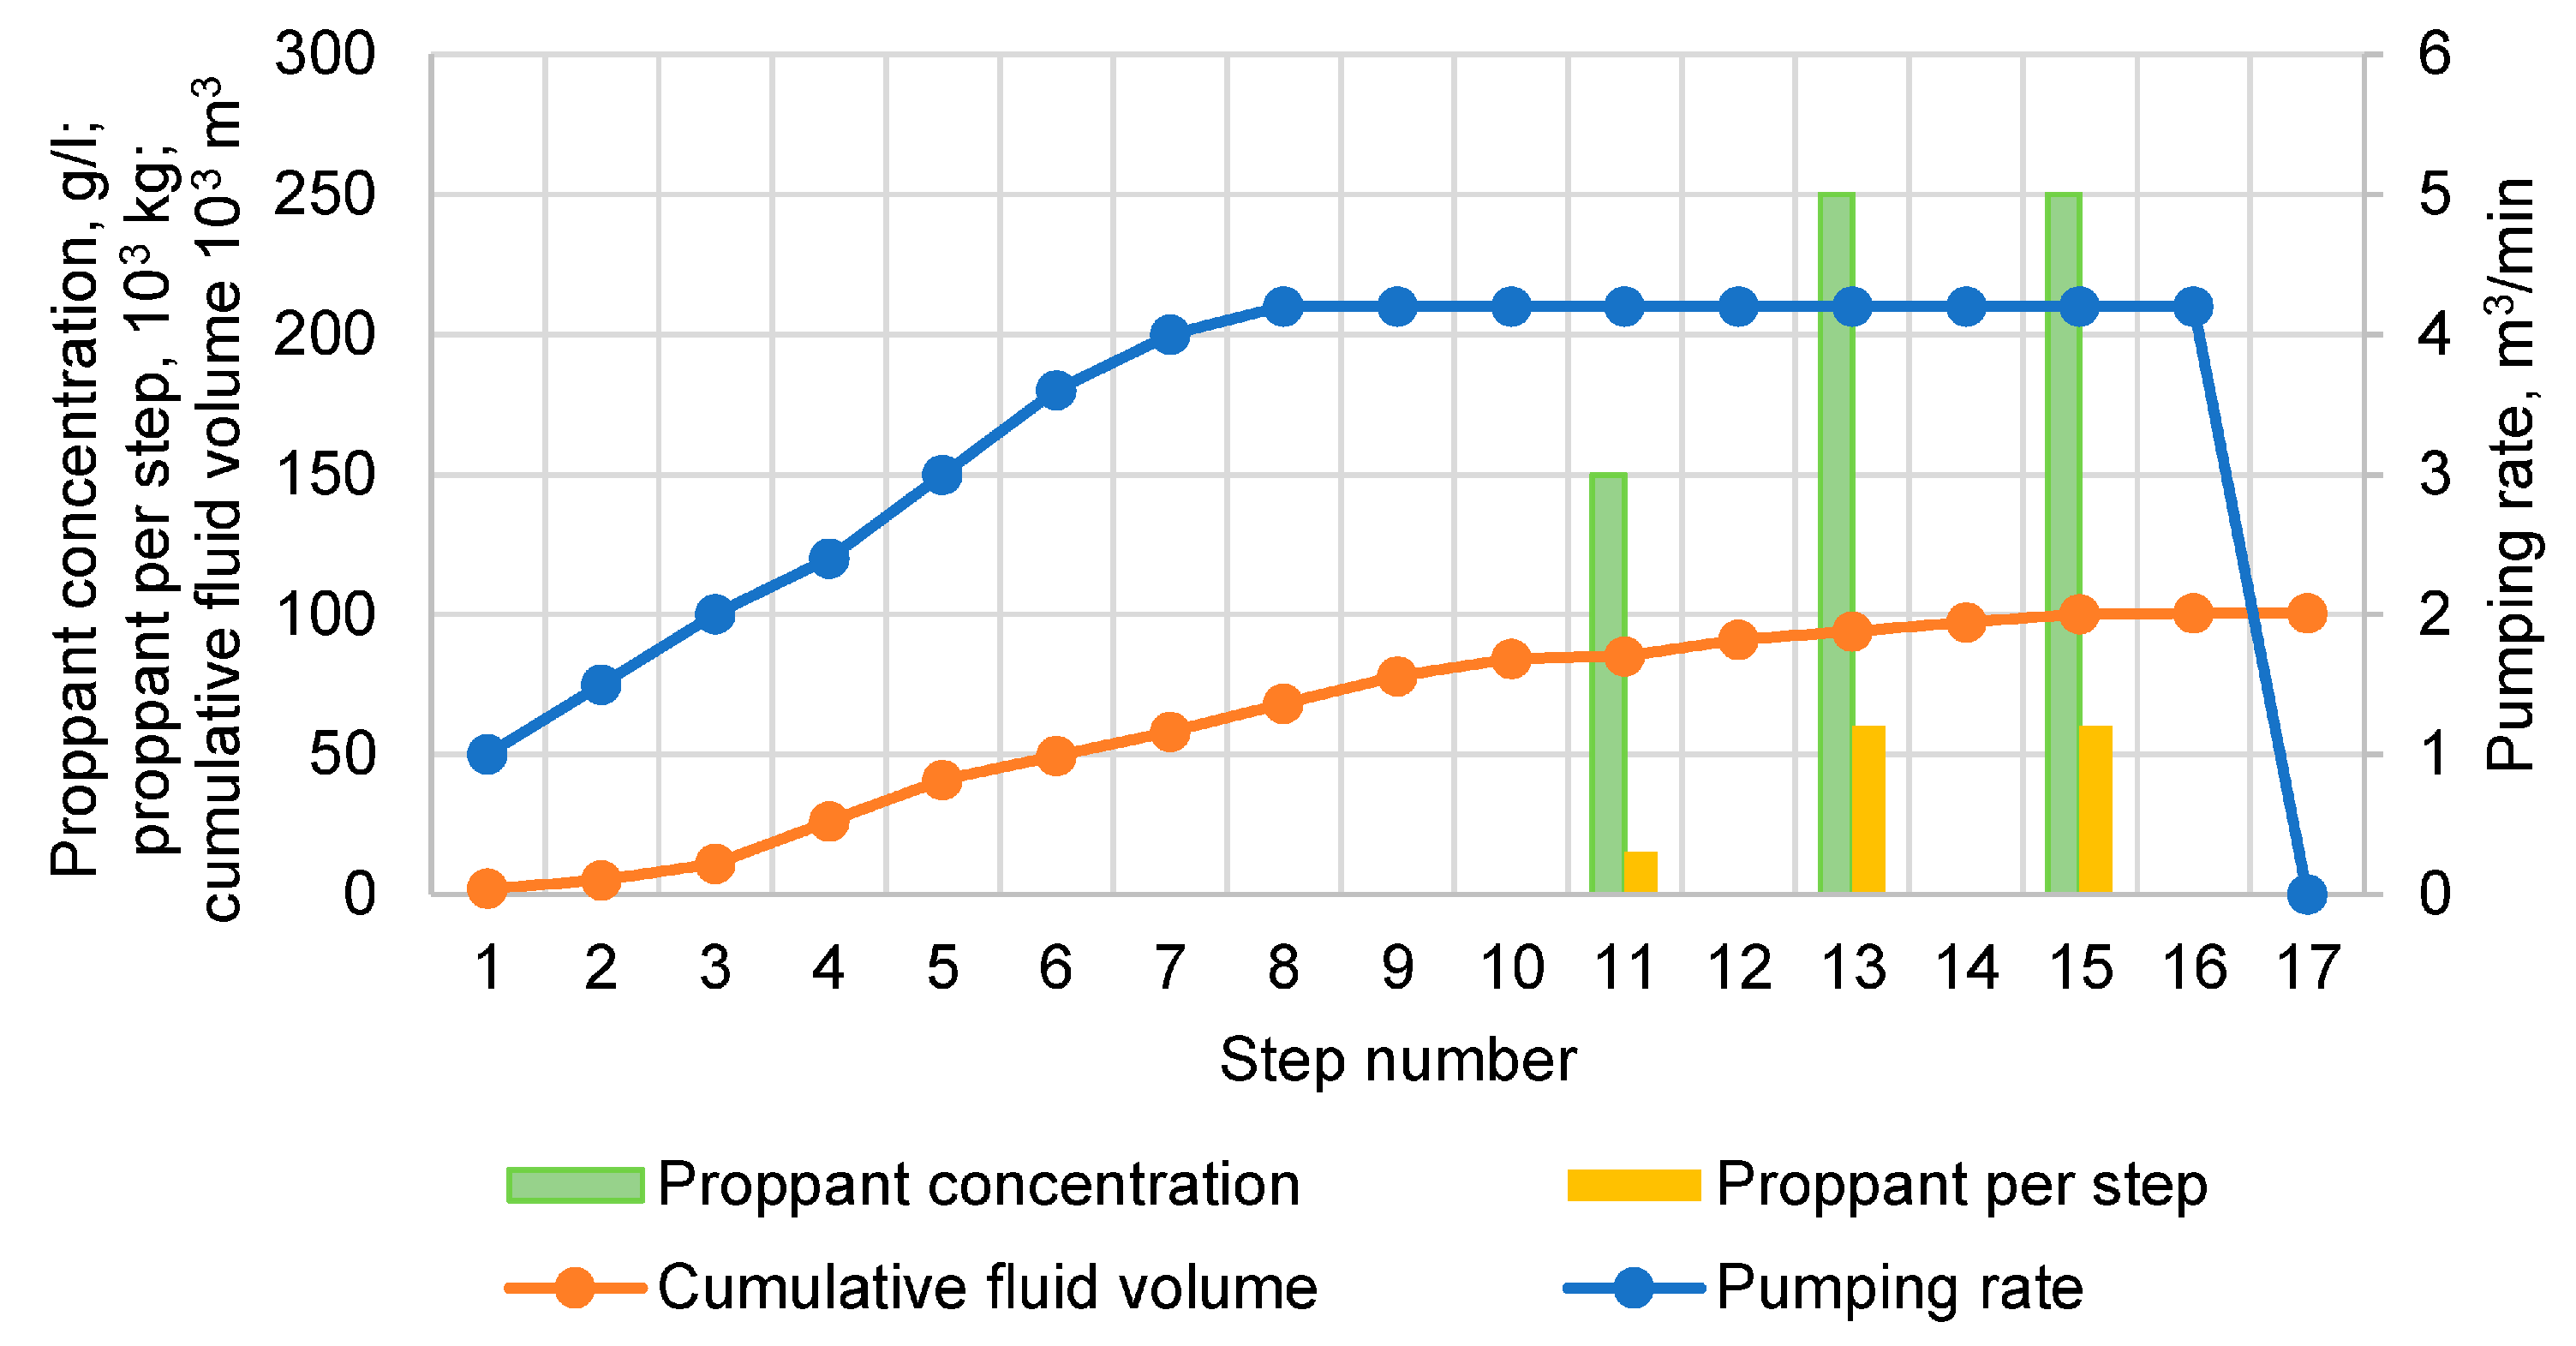
The pumping schedule was divided into 16 steps. In steps 1–10, 20 lb/1000 gal of slickwater fluid was used to open the formation. This type of fluid is characterized by a viscosity slightly higher than that of water because of a very low polymer concentration, enough to create and propagate the fracture. Furthermore, the friction-reducing additive reduces the flow resistance, which is especially important at high pumping pressures. In the simulation performed, we decided to use 40/70-mesh ceramic proppant during three stages in the final part of the treatment. The low viscosity of the liquid enables the transport of the low-density and small-grain-size proppant. The detailed pumping schedule for the Karkonosze Mountains area is shown in Figure 4.

4. Results

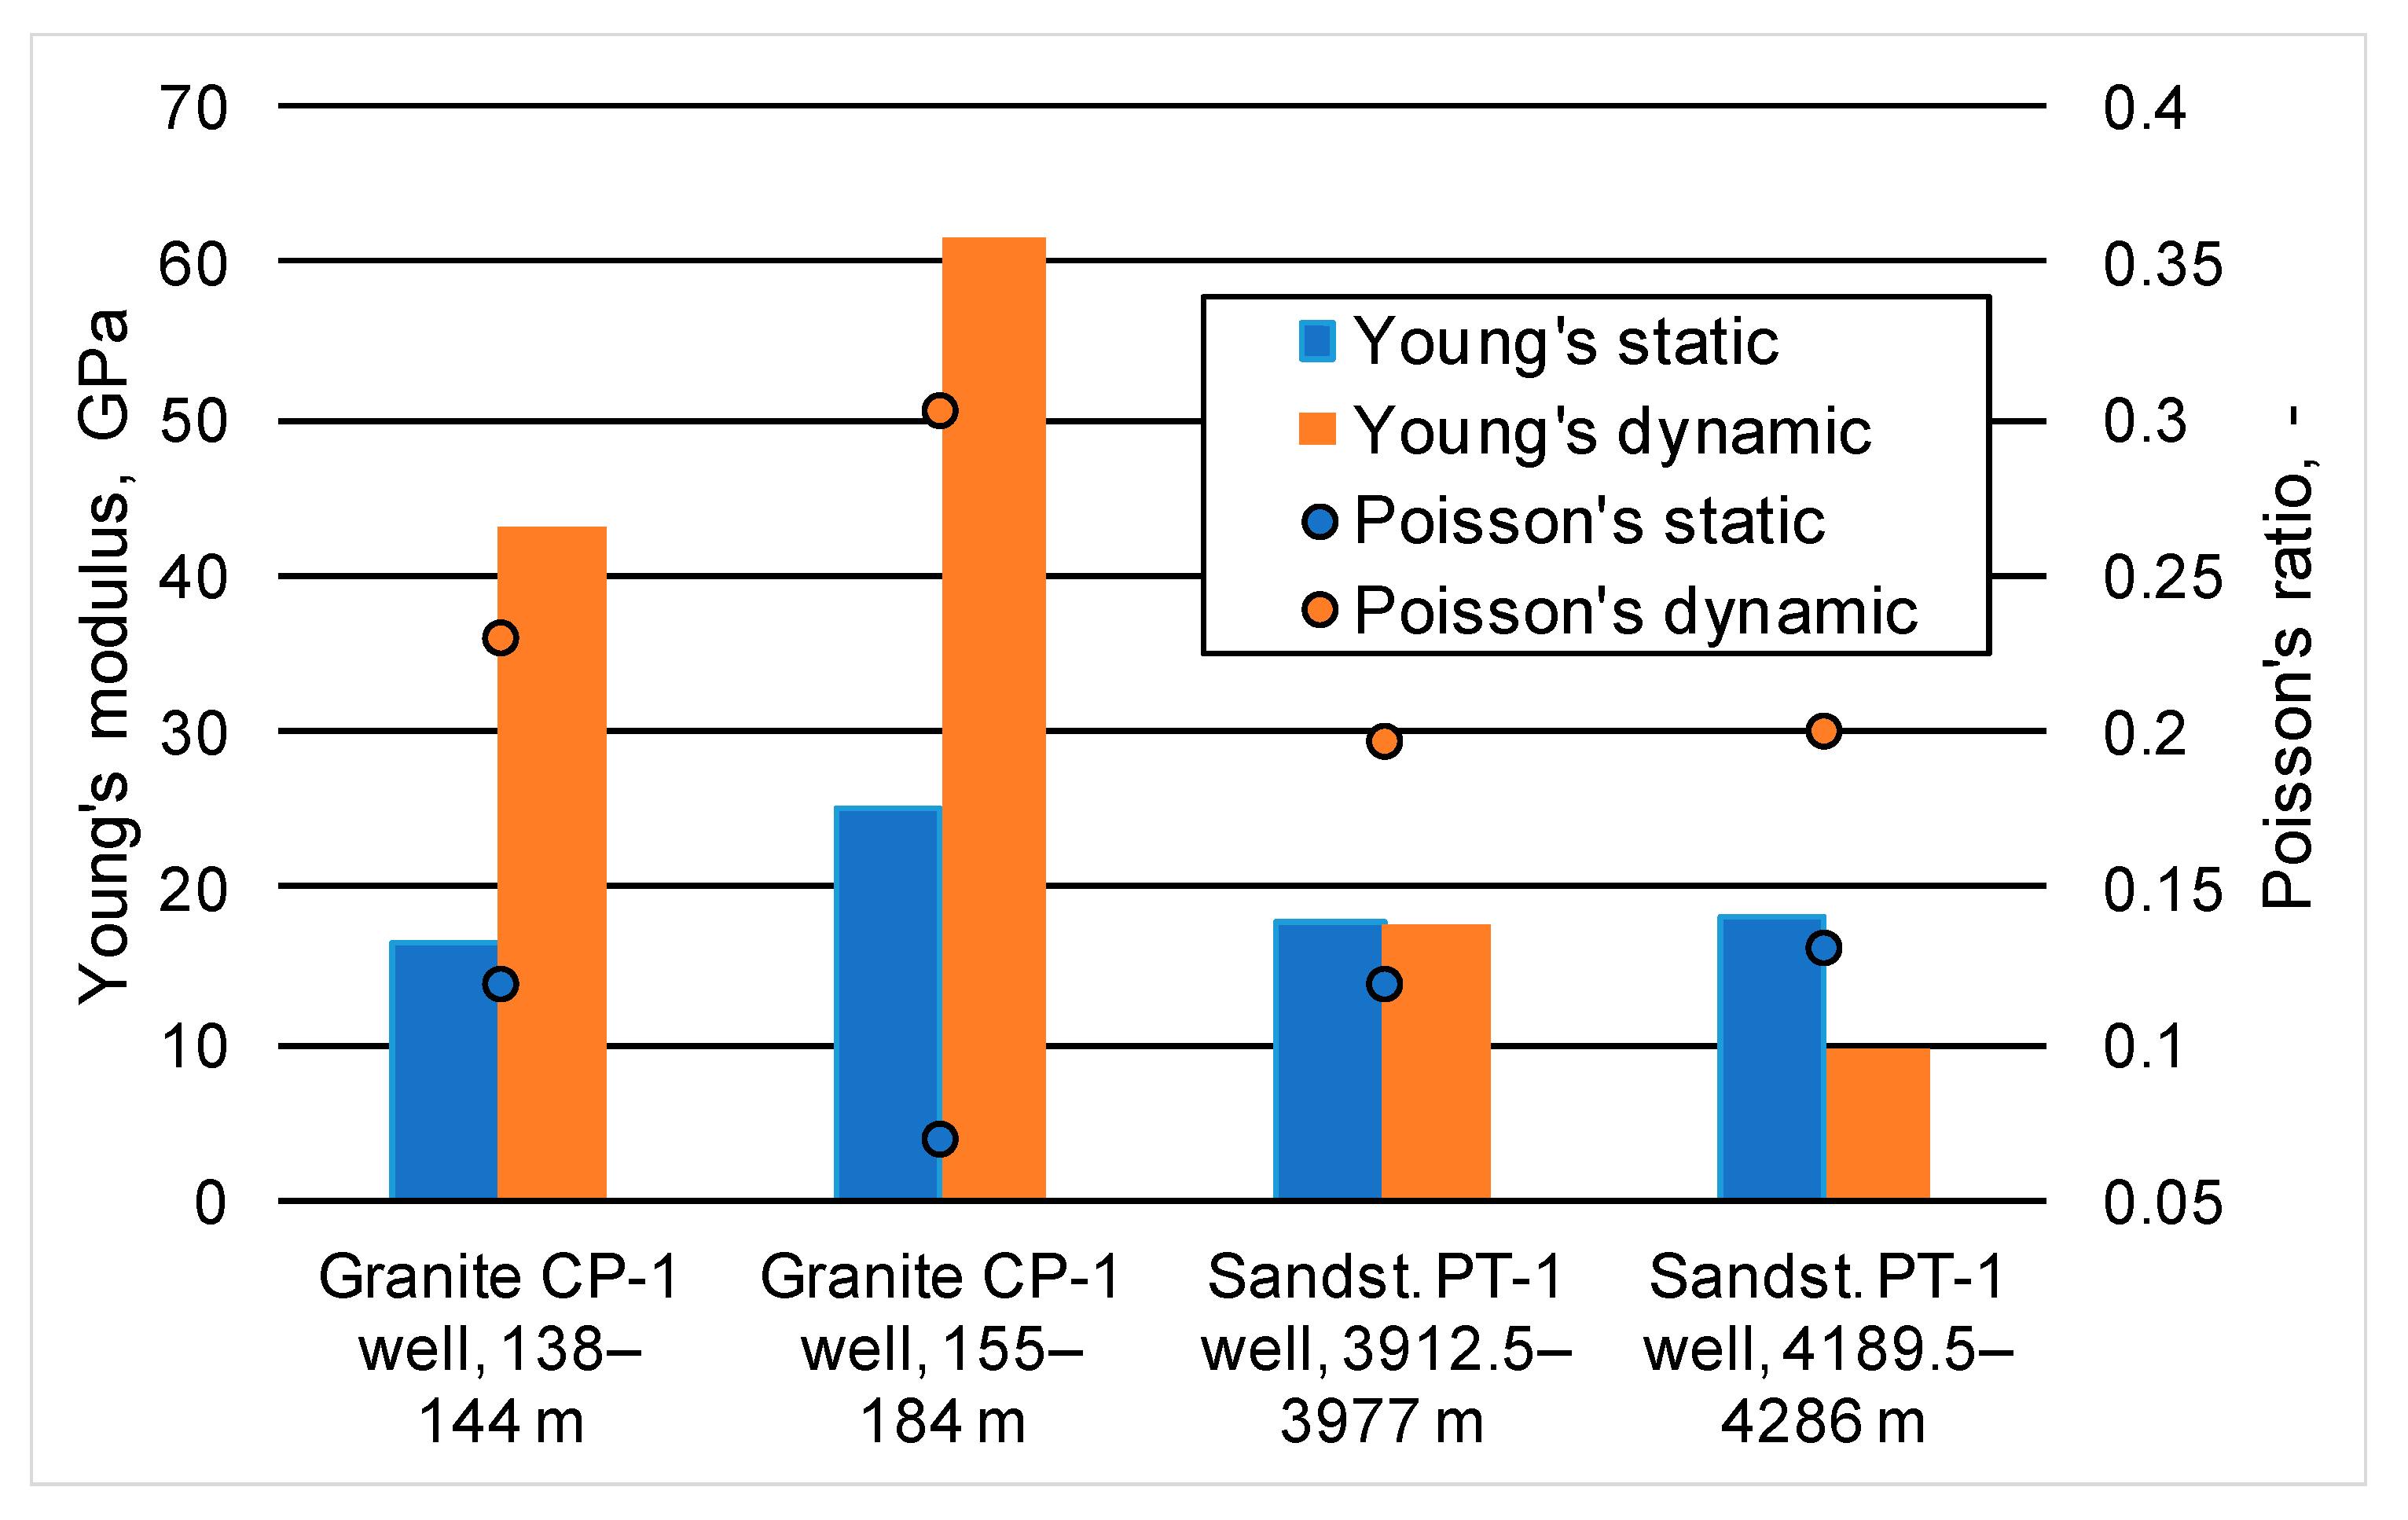
Figure 5 shows a comparison of dynamic and static E and v parameters for dry samples from the Mogilno-Łódź Trough (sandstone) and Karkonosze Mountains (granite).
The average E s t a t values of the granite samples (16–25 GPa) were relatively low compared to the literature data [37,38] and confirmed the behavior observed for altered granite [40]. Altered granites with more developed natural fracture networks, collected from a shallower interval (138–144), exhibit lower E s t a t than deeper ones, which can also be explained by the elevated amount of clay minerals in the mineral composition (chlorite, kaolinite, illite) [18]. The v s t a t of granites from deeper intervals is slightly lower; however, it should be remembered that v s t a t was measured in uniaxial conditions, which influenced the results. According to Lógó and Vásárhelyi [54], for hard intact rocks, it can be expected that v s t a t will increase with increasing confining pressure. Sandstone samples collected from both intervals present average E s t a t values in the range of 17.9–18.2 GPa and v s t a t values of 0.12–0.13, which correspond to values for medium-strength sandstones in the literature, e.g., [55,56].
Granite samples showed a strong variability in elastic parameters depending on the measurement method (Figure 5). The average E d y n   was more than twice the static value in both intervals, whereas v d y n was about four times greater than the static one measured in uniaxial conditions in the case of samples collected from a 155–185 m depth interval. On the other hand, the E values of the sandstones were comparable regardless of the measurement method (in the range of 9.6–18.1 GPa for both methods), and the v ratios were higher in the dynamic method. Differences between E d y n and E s t a t in granite samples can result from alteration, similar to the results presented in literature [40], and/or from the presence of microcracks in the samples, which do not cause elastic wave attenuation but significantly reduce the strength of the sample during static tests. Figure 6 shows the correlation between dynamic and static E for measured samples. Despite the small amount of data due to the small number of undamaged samples that could be directly compared with each other, the correlation is good for both sandstone (R2 = 0.84) and granite (R2 = 0.89). For both data sets, the linear trend line gives the best R2 coefficient, although the literature indicates the best matching of the power-law correlation for igneous rocks [27]. A flatter trend line of granite samples compared to the sandstone one indicates that the increase in E d y n in granites is not highly reflected in E s t a t growth. This can result from the presence of microcracks and microfractures that cause a reduction in the strength of the samples in static tests.
It is also important to note that differences in testing temperature between ultrasonic measurements (conducted at 140 °C) and strength tests (conducted at ambient temperature) can influence the results. In general, elevated temperatures lead to thermal cracking in rocks due to differential thermal expansion between mineral grains, resulting in a reduction in the static Young’s modulus of E s t a t . However, in low-porosity rocks such as granite, the P-wave velocity typically decreases by less than 5% for a temperature increase of approximately 100 °C [57]. The rate of decrease in E s t a t with temperature is generally higher than that of the dynamic modulus ( E d y n ) [58]. Nevertheless, within the temperature range from ambient to about 150 °C, changes in mechanical properties reported in the literature usually remain within a few percent of their reference values, depending on rock type [59,60]. Therefore, it can be assumed that the variation in testing temperature in this study should have only a minor effect on the results.
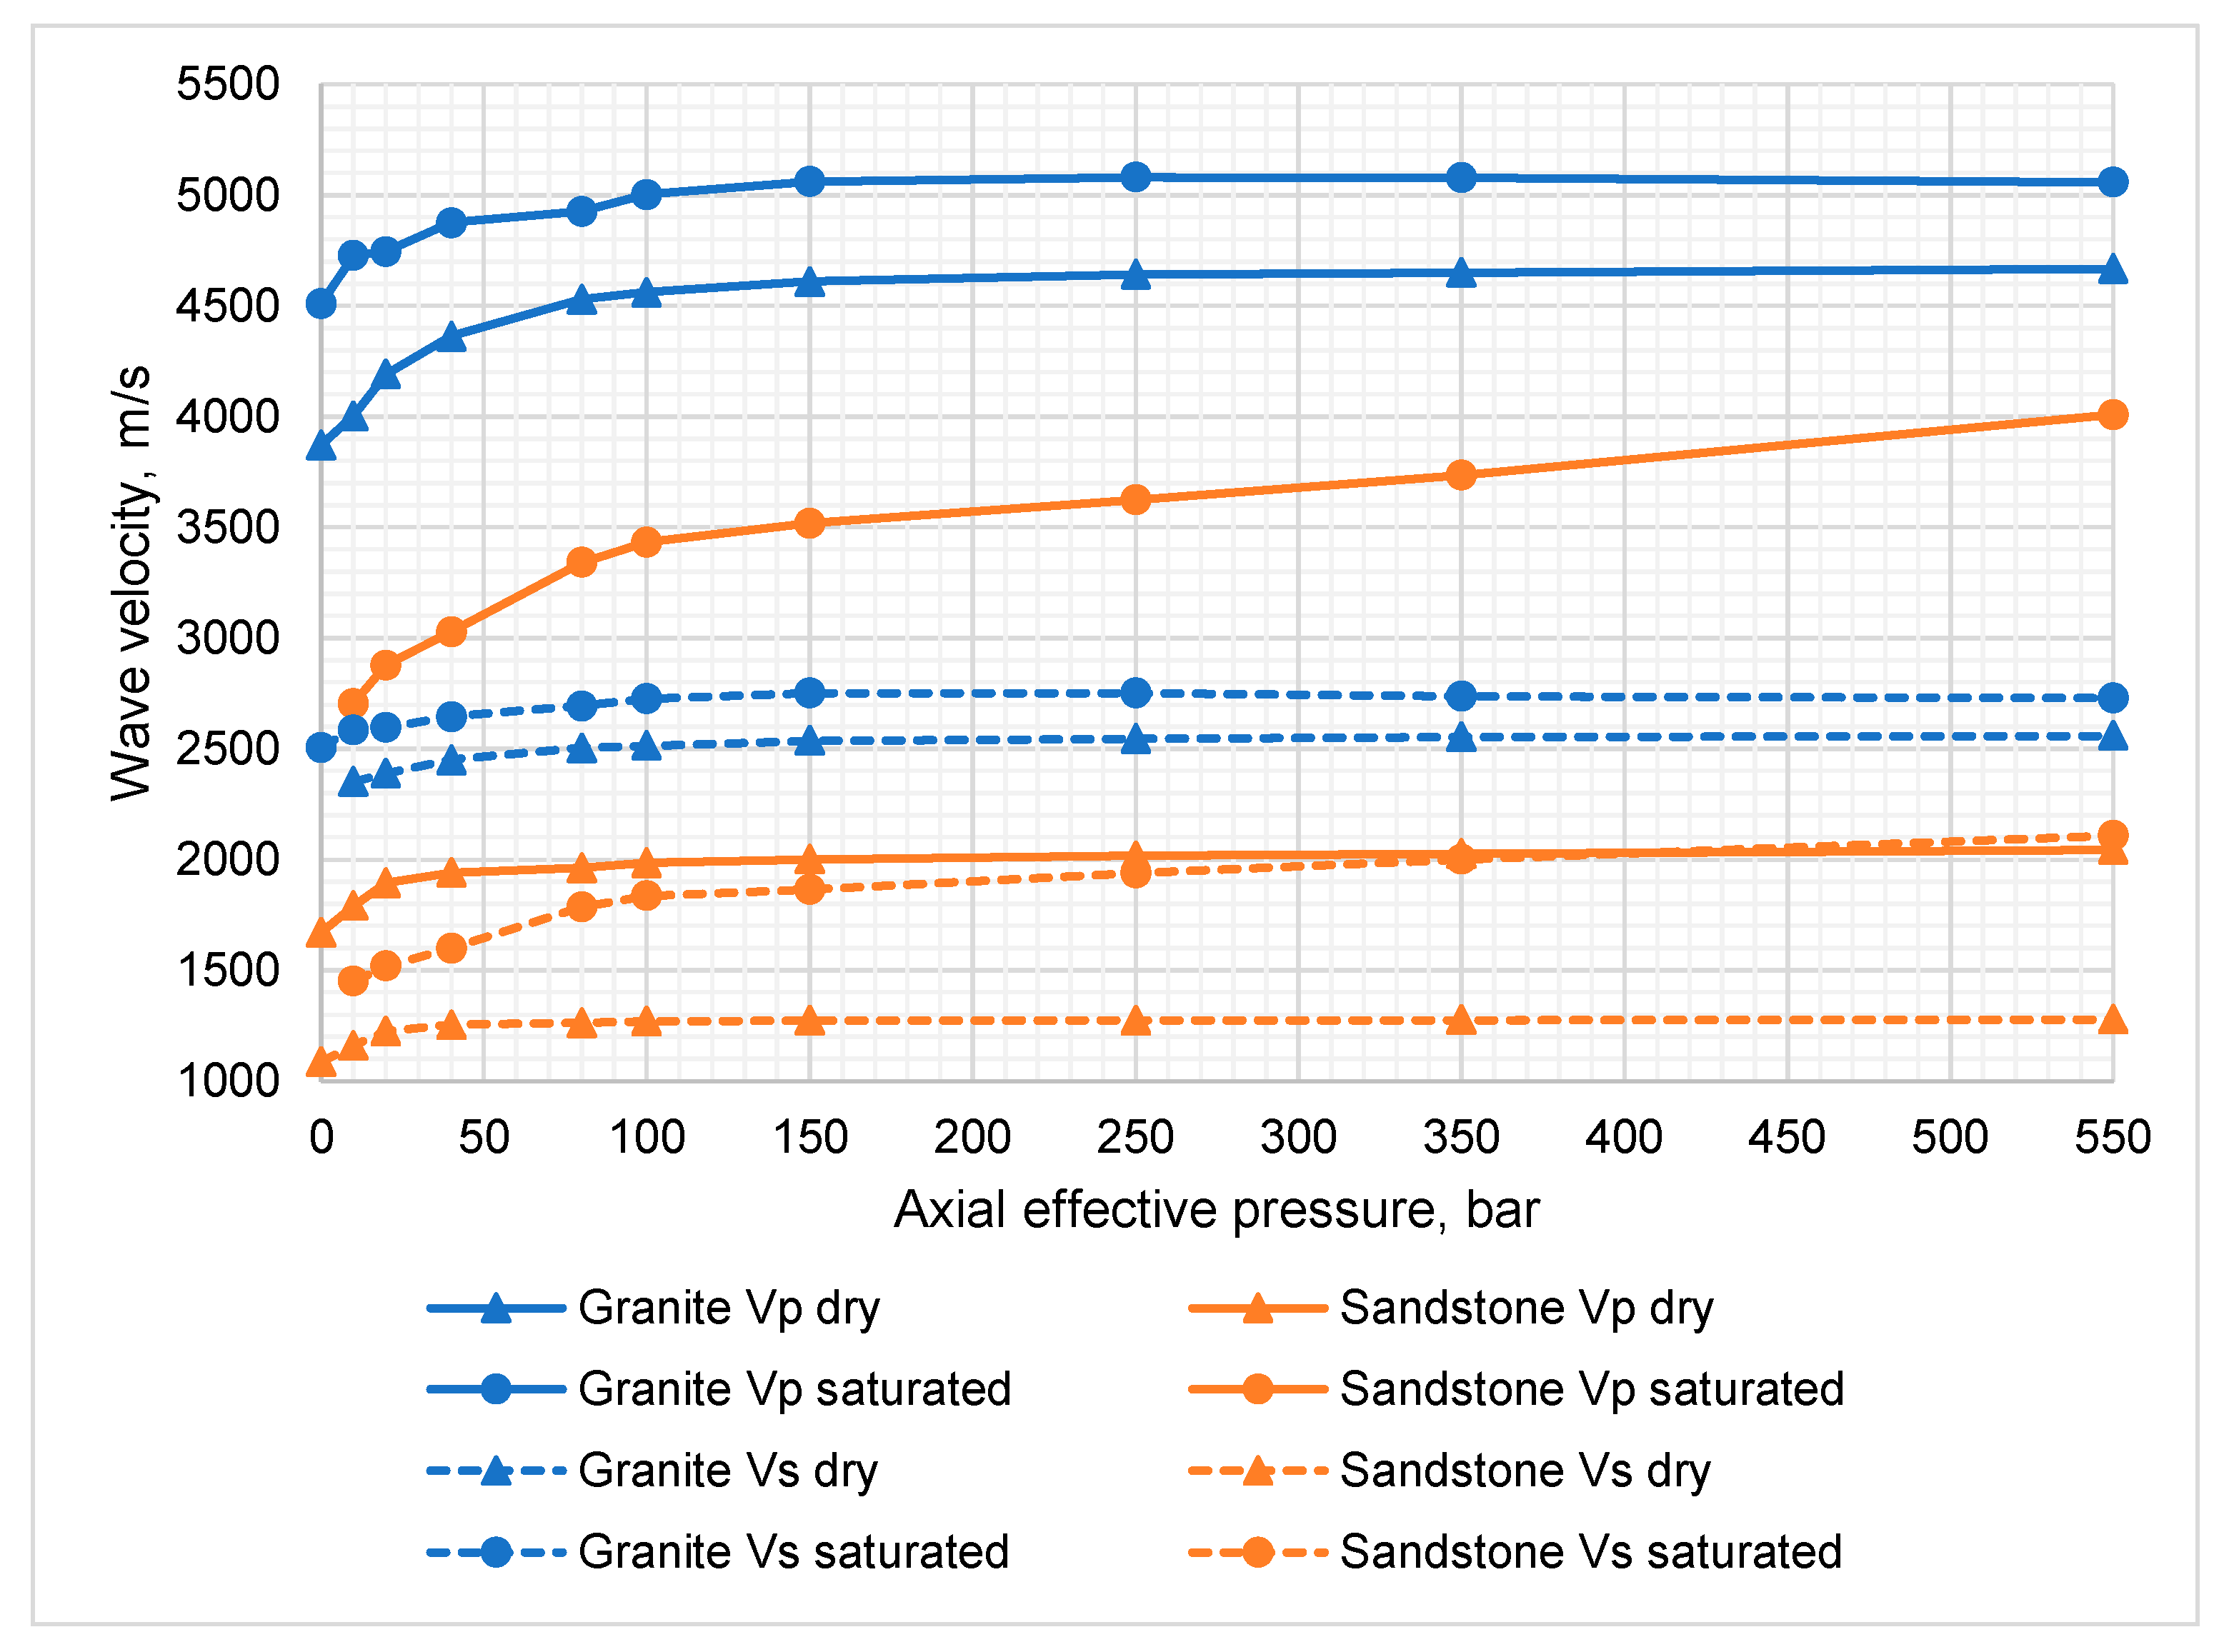
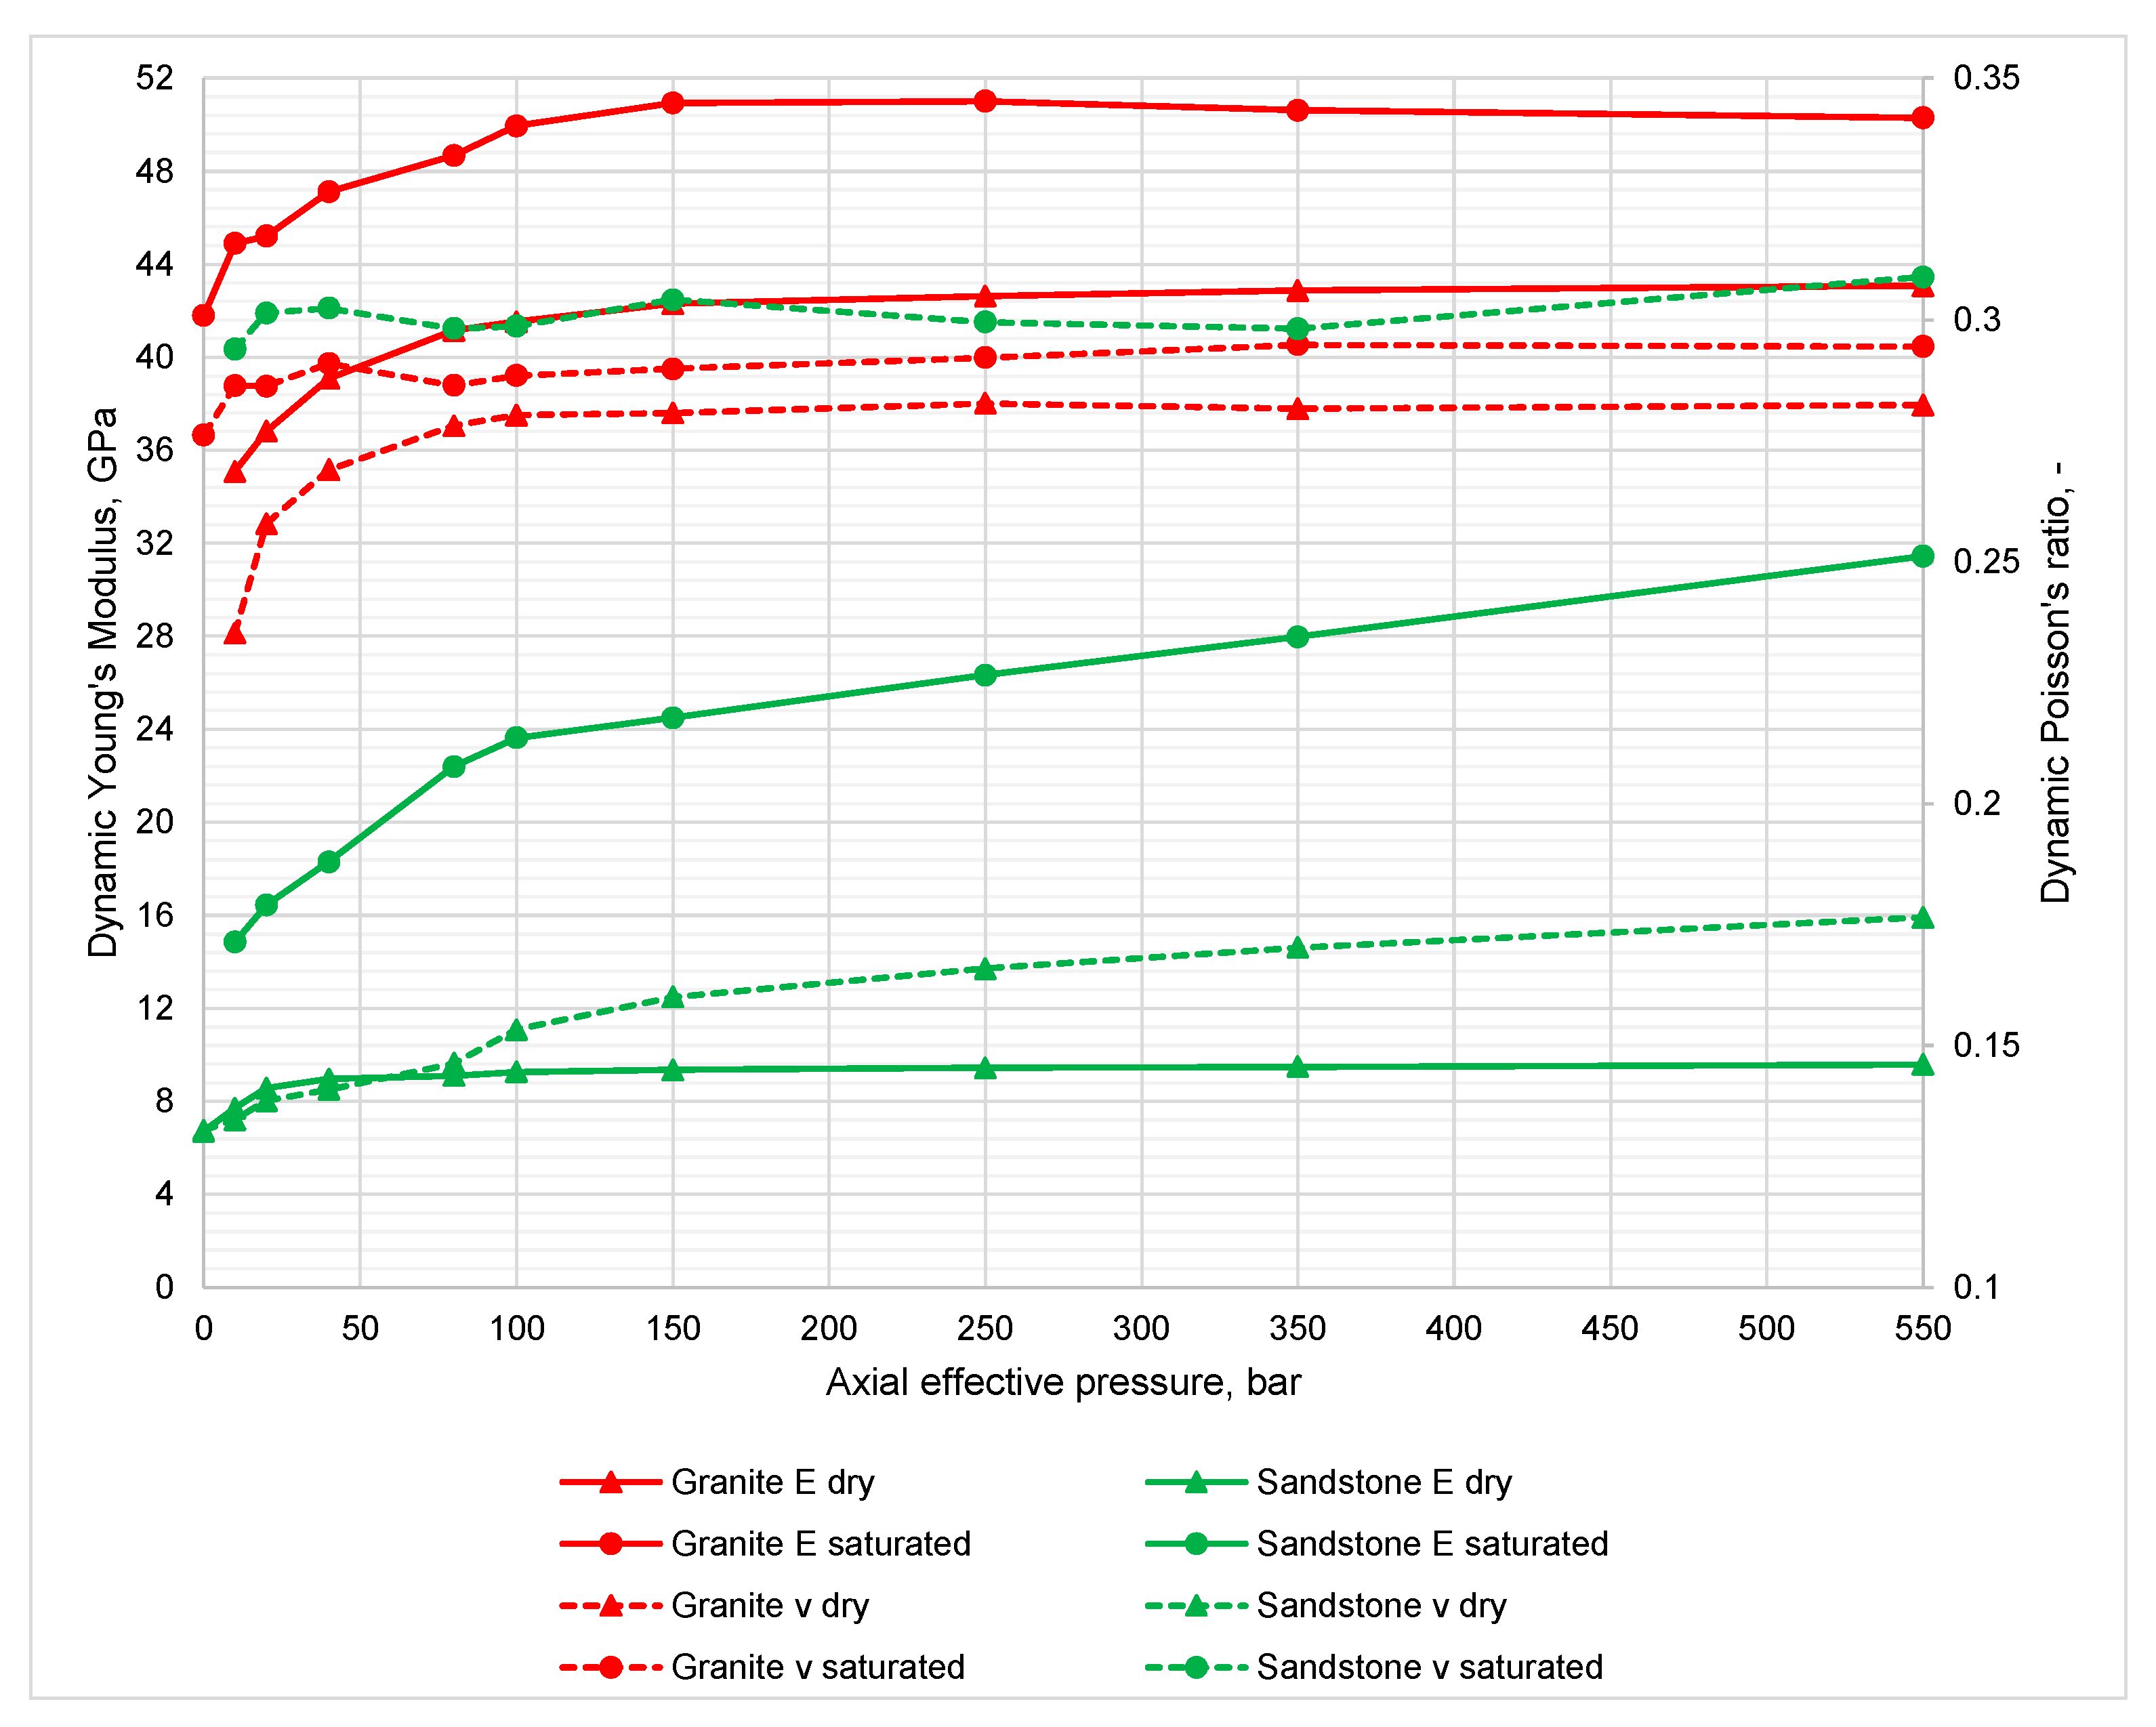
HDRs are usually described as formations that contain little or no water. However, the presence of water in the pore space or fractures significantly influences the elastic parameters, especially E , which is presented in Figure 7 and Figure 8. Both in granite and sandstone samples, P-wave velocities increase in saturated samples because the K modulus of the water is higher than the gas modulus [57]. The S-wave velocities increase slightly as a result of the increase in bulk density. This relation results in a significant increase in E d y n in both types of samples, though it is especially noticeable in weak sandstones. The saturation of the sandstone samples also results in a significant increase in deformation in the directions perpendicular to the direction of loading. The influence of water saturation on fracture propagation is described in the discussion section.
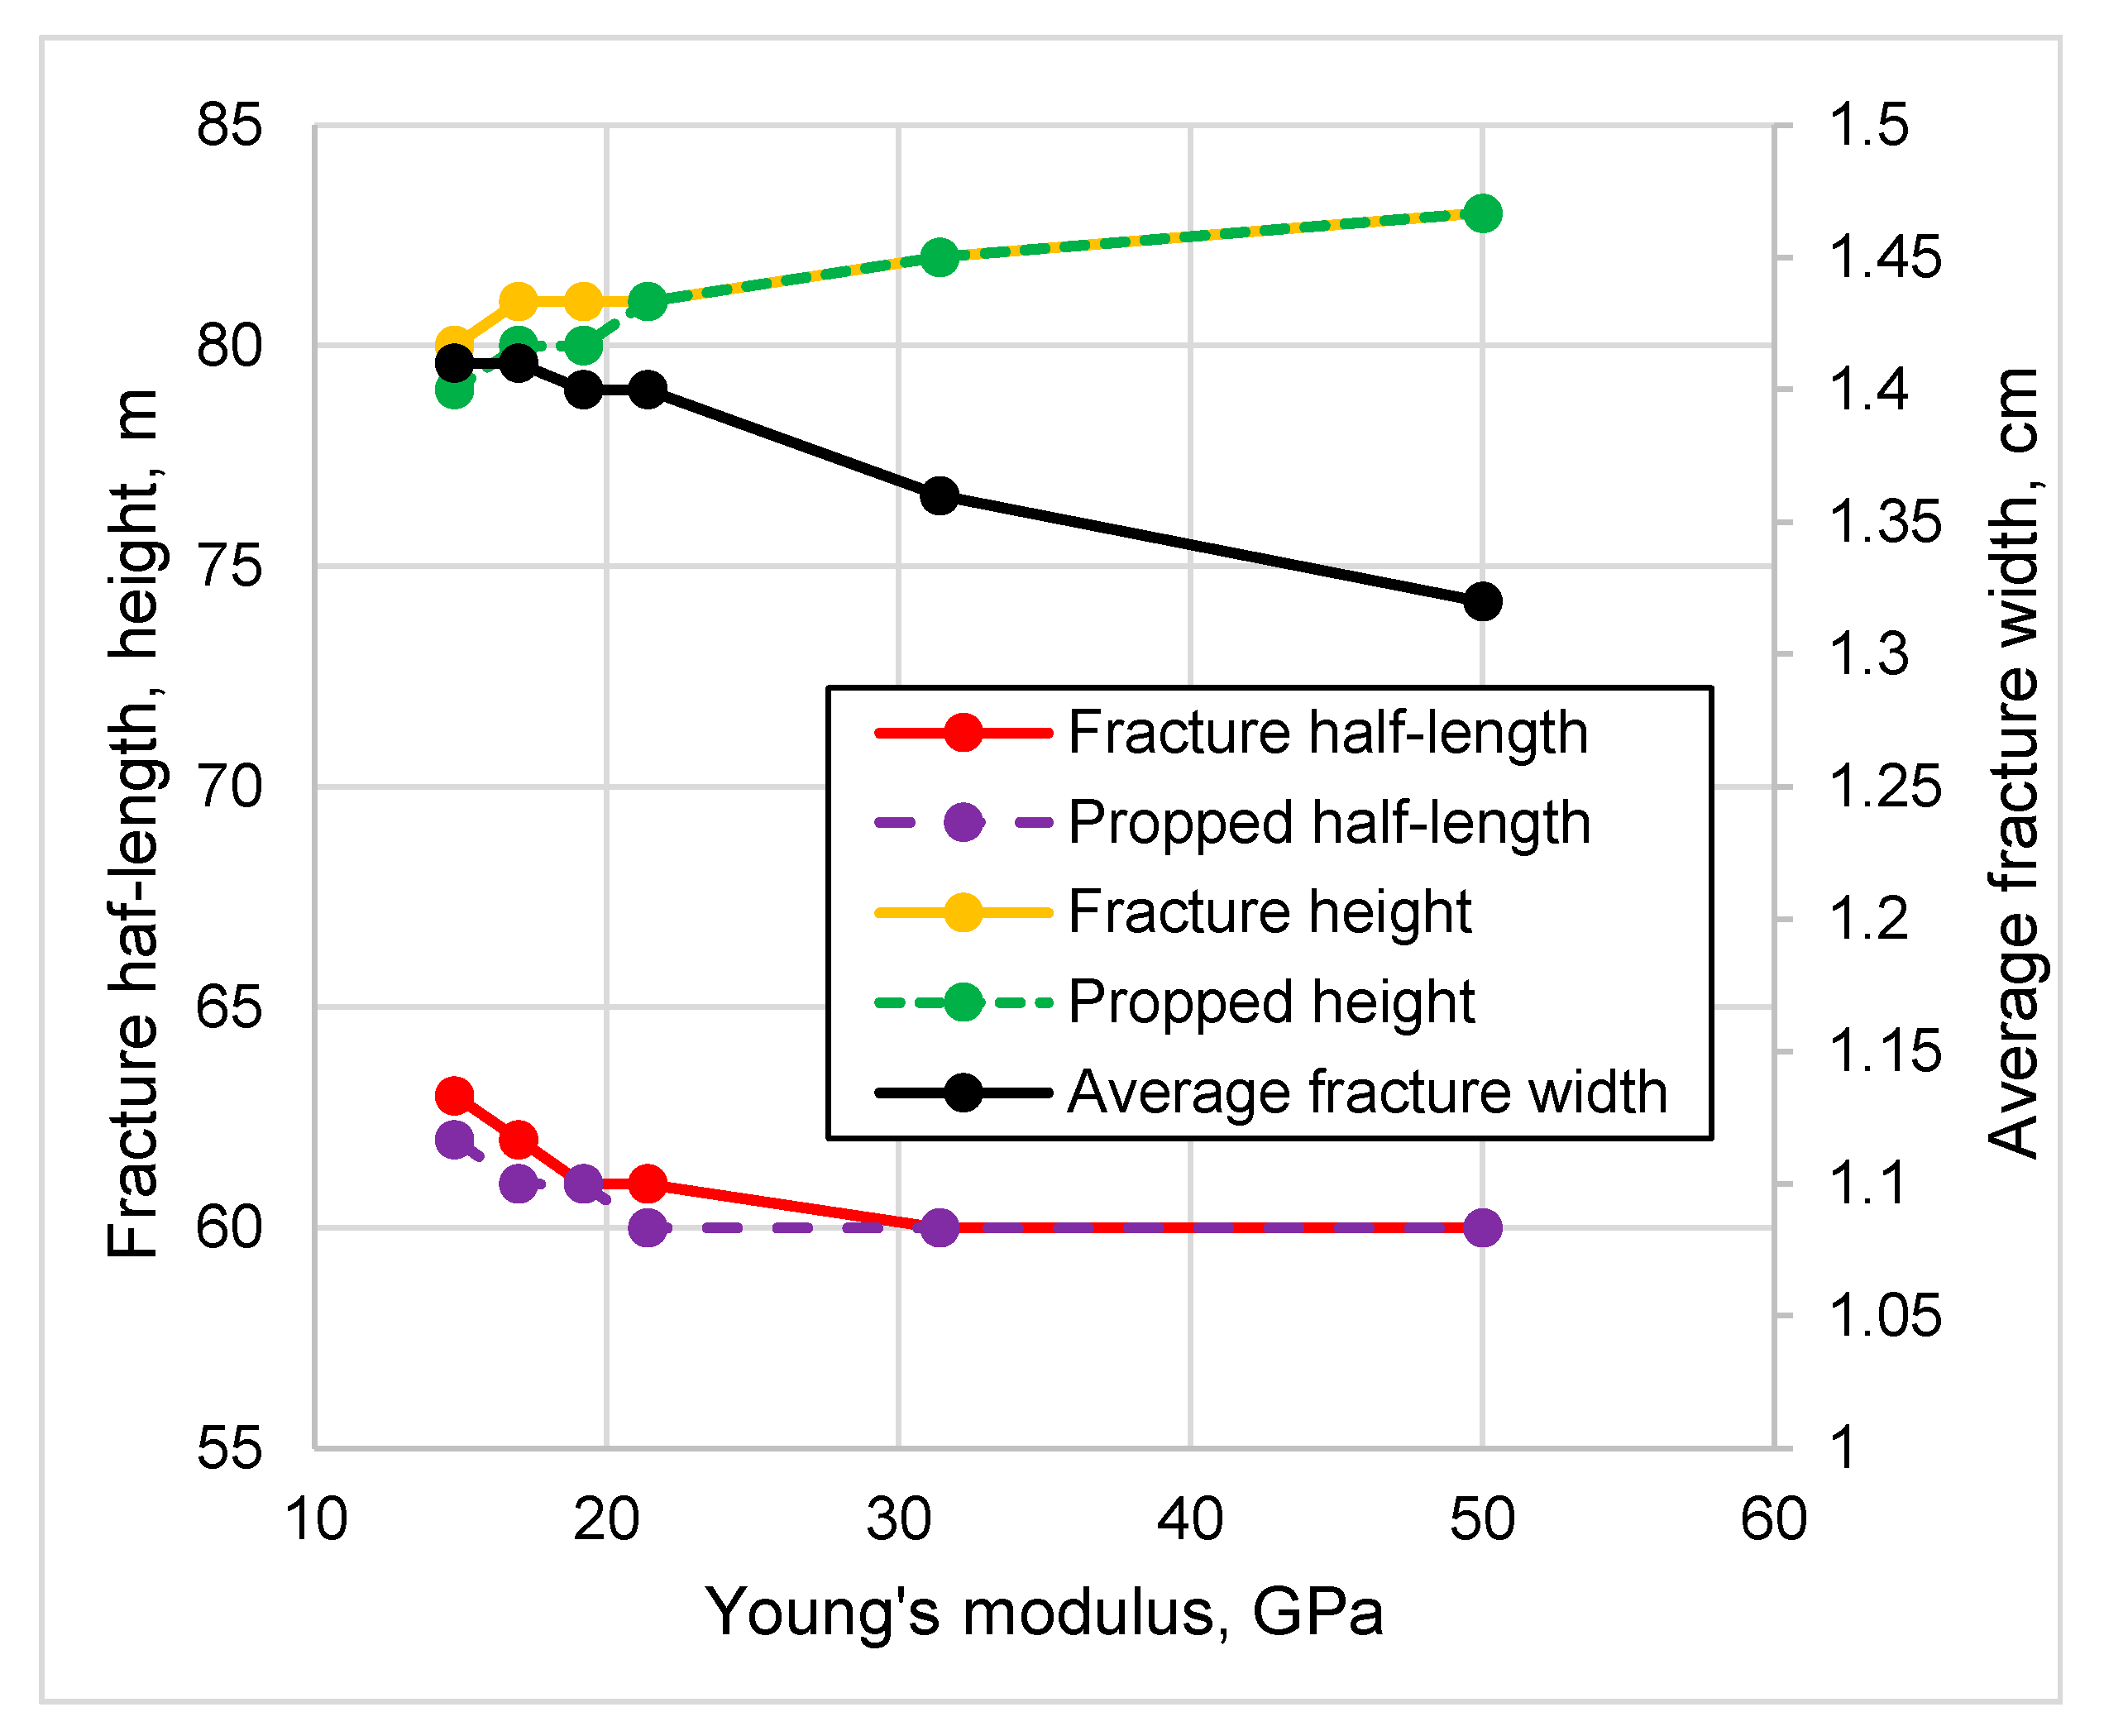
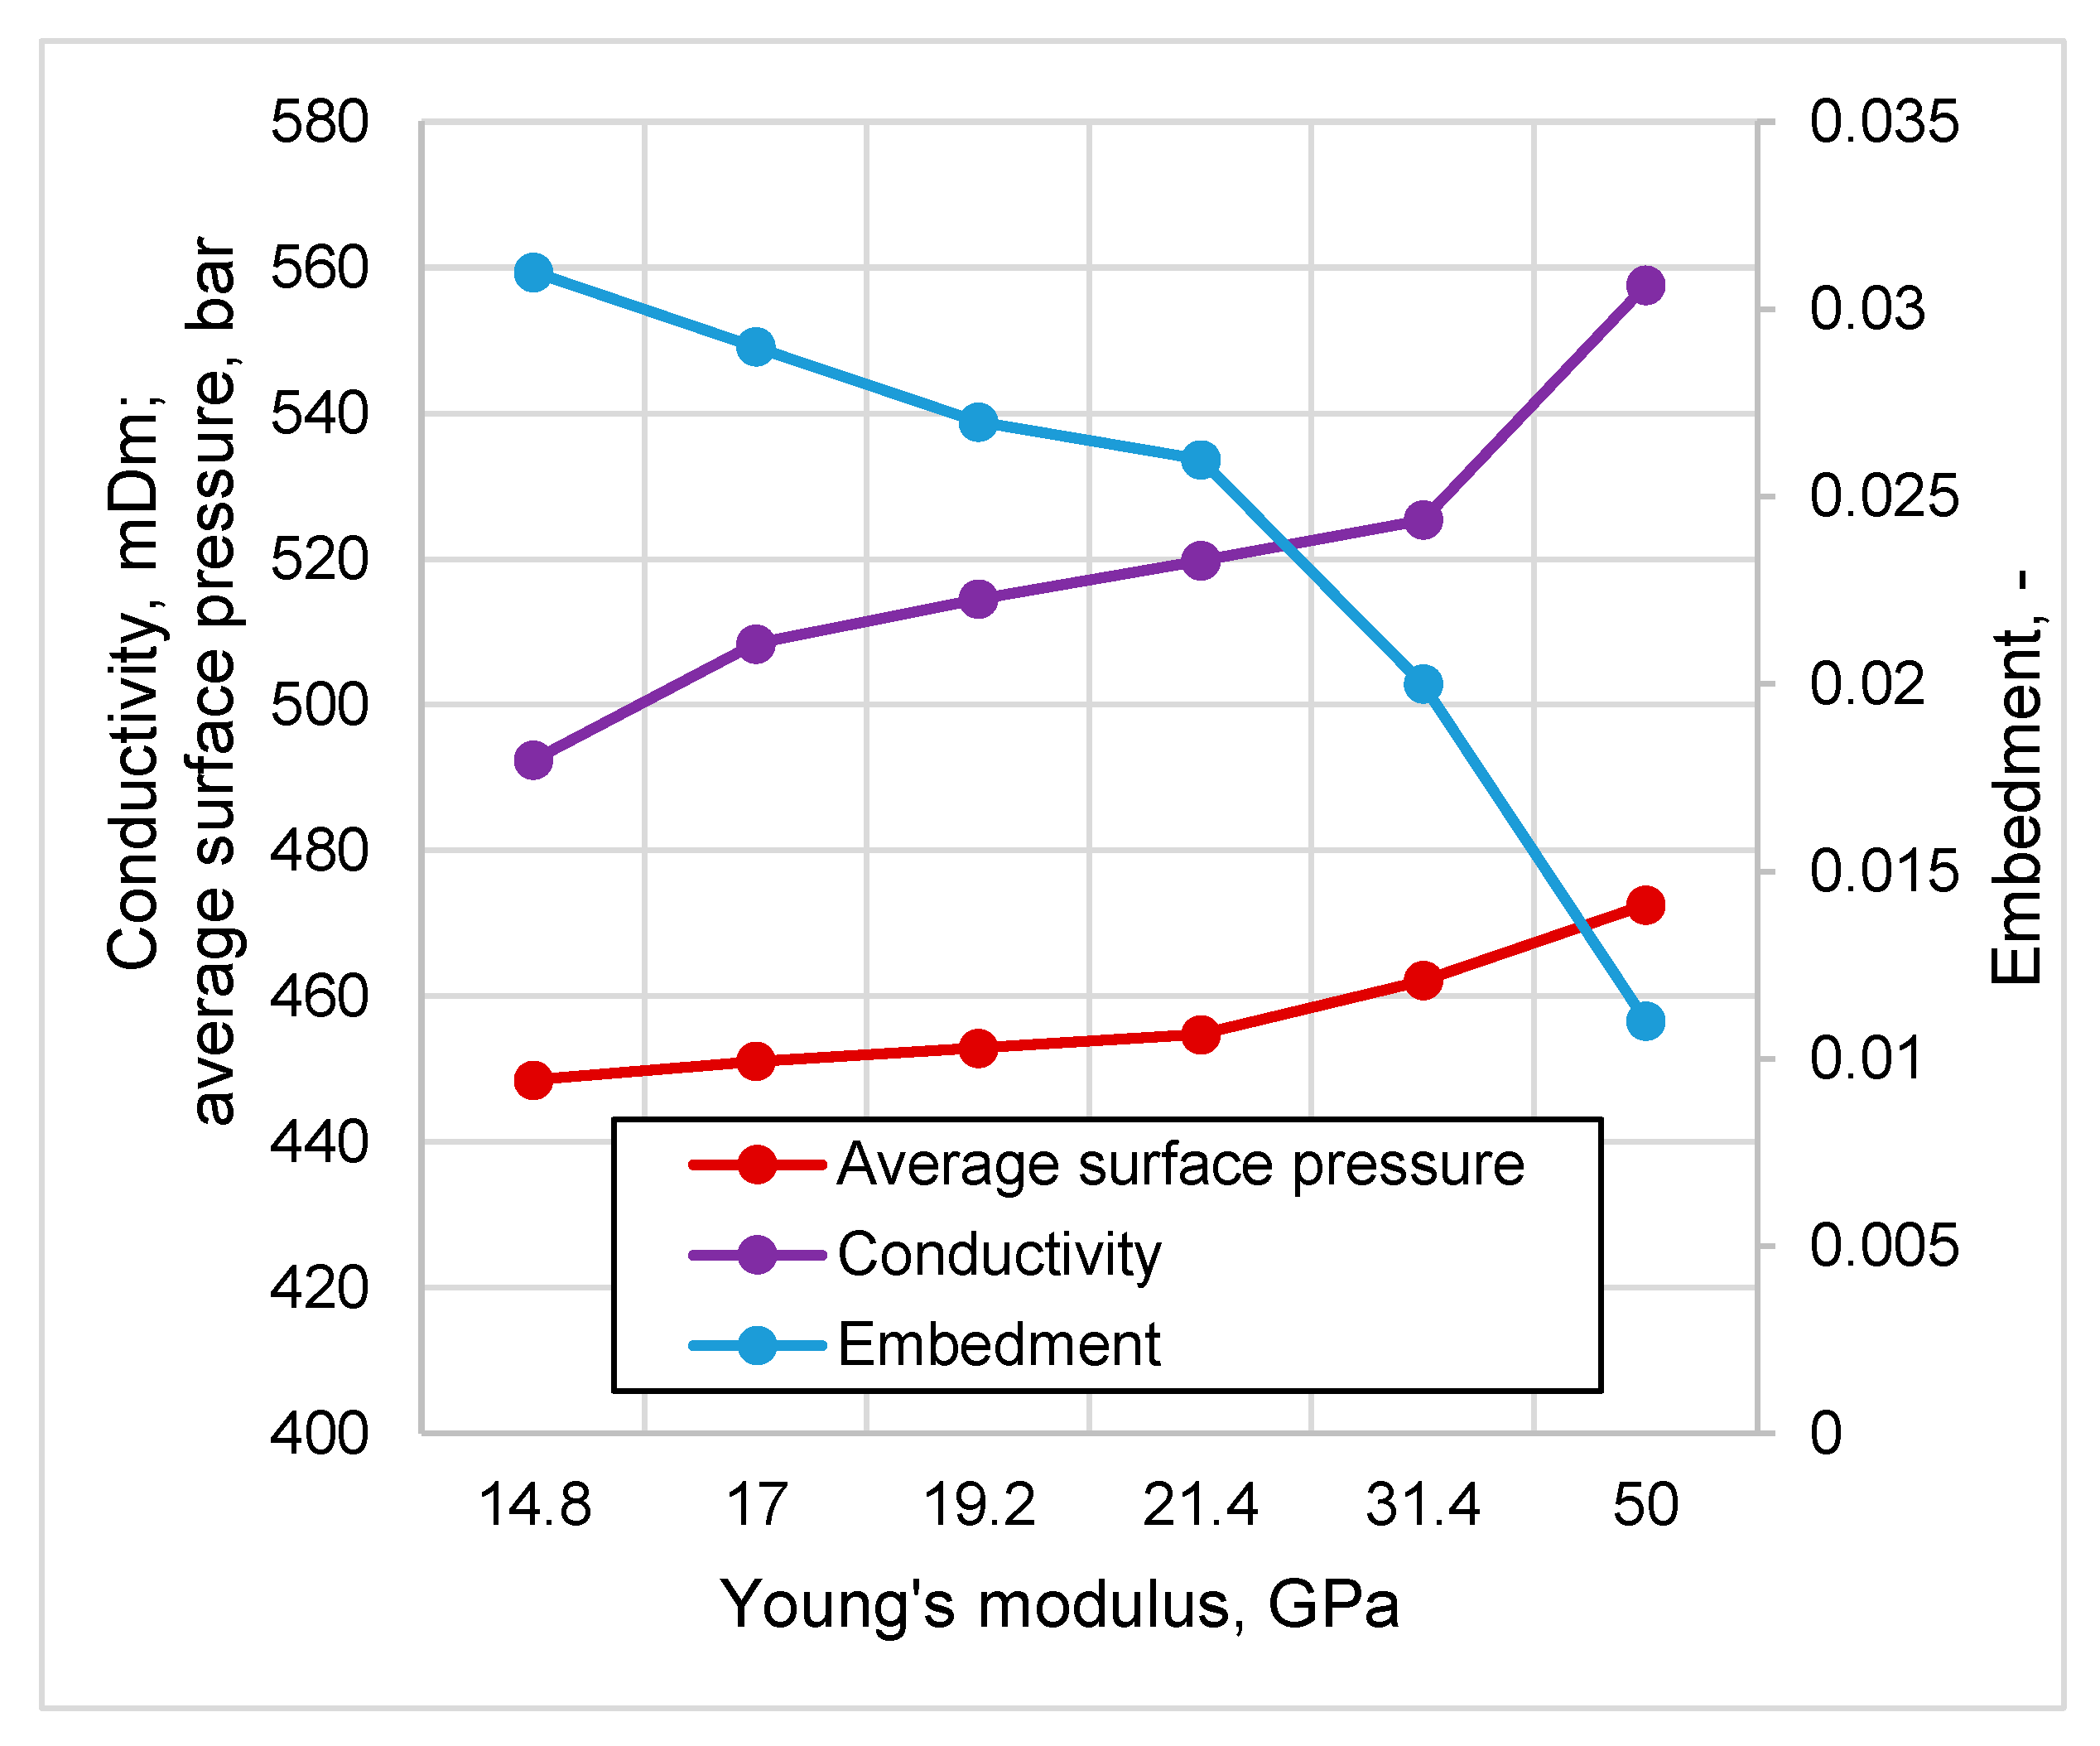
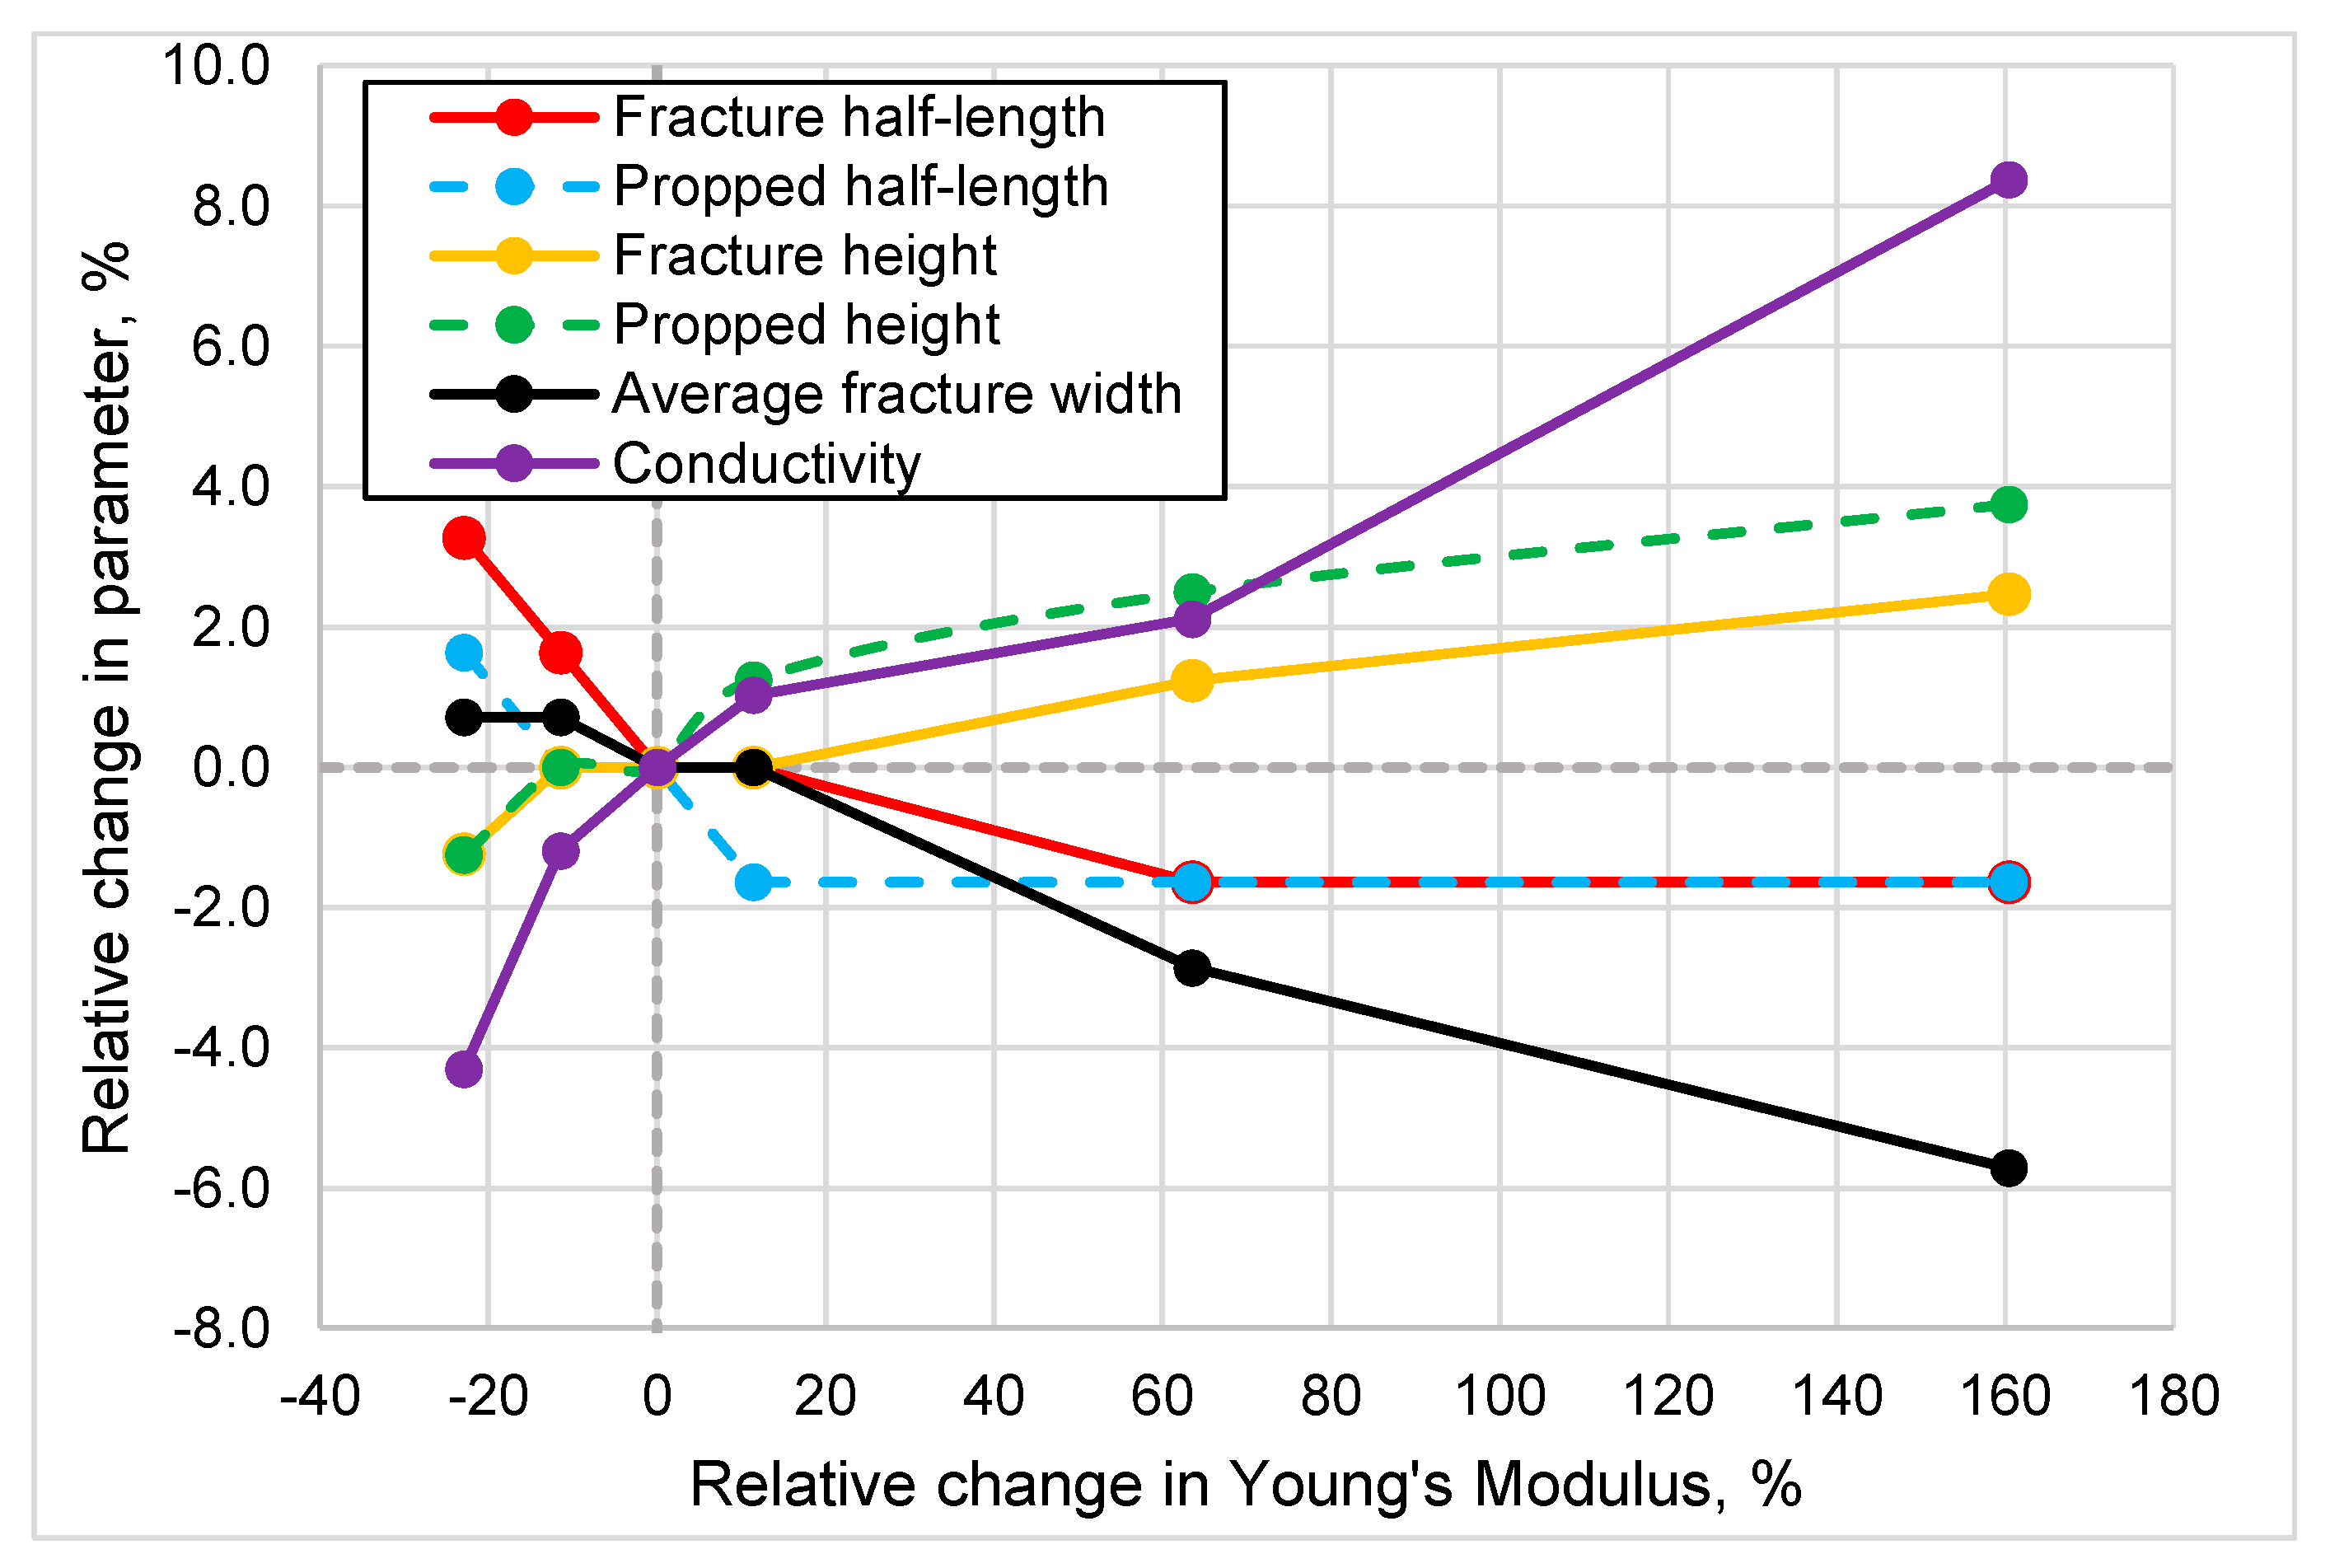
The sensitivity analysis for Mogilno-Łódź HDRs showed that an increase in E in the target zone from 14.8 to 50.0 GPa leads to an increase in fracture height by 3.0 m, a decrease in half-length also by 3.0 m, and a decrease in width by 0.09 cm (Figure 9). Similar-scale variability was observed for the propped fracture half-length and propped height. The average fracture conductivity increased by 65 mDm and the average surface pressure by 24 bar, while the embedment phenomenon decreased from 0.031 to 0.011 cm (Figure 10). The variability in E in the range mentioned above had the greatest impact on average fracture conductivity (increase from −4.3 to +8.4%) in relation to the value corresponding to the average E (Figure 11). A lower impact was observed for the half-length, height, and width (decrease from +3.3 to −1.6%, increase from −1.2 to 2.5%, and decrease from 0.7 to −5.7%, respectively). Therefore, the increase in E in the considered range caused a change in the half-length, height, width, and conductivity of the fracture to 4.9%, 3.7%, 6.4%, and 12.7%, respectively, which can be seen in Figure 11. Variability in fracture geometry with increasing Young’s modulus in the pay zone of the Mogilno-Łódź HDR area can be seen in Figure 12.
The sensitivity analysis of v for the considered formation shows that at a fixed average E of 19.2 GPa, the variability in v from 0.1 to 0.35 did not affect the fracture length, height, or width and had a negligible impact on the propped length and height. The impact on the fracture conductivity did not exceed 2.5%. The proppant concentration in the fracture for the average values of E and v are shown in Figure 13. The proppant is concentrated in the middle and lower part of the fracture due to the settling proppant transport type.
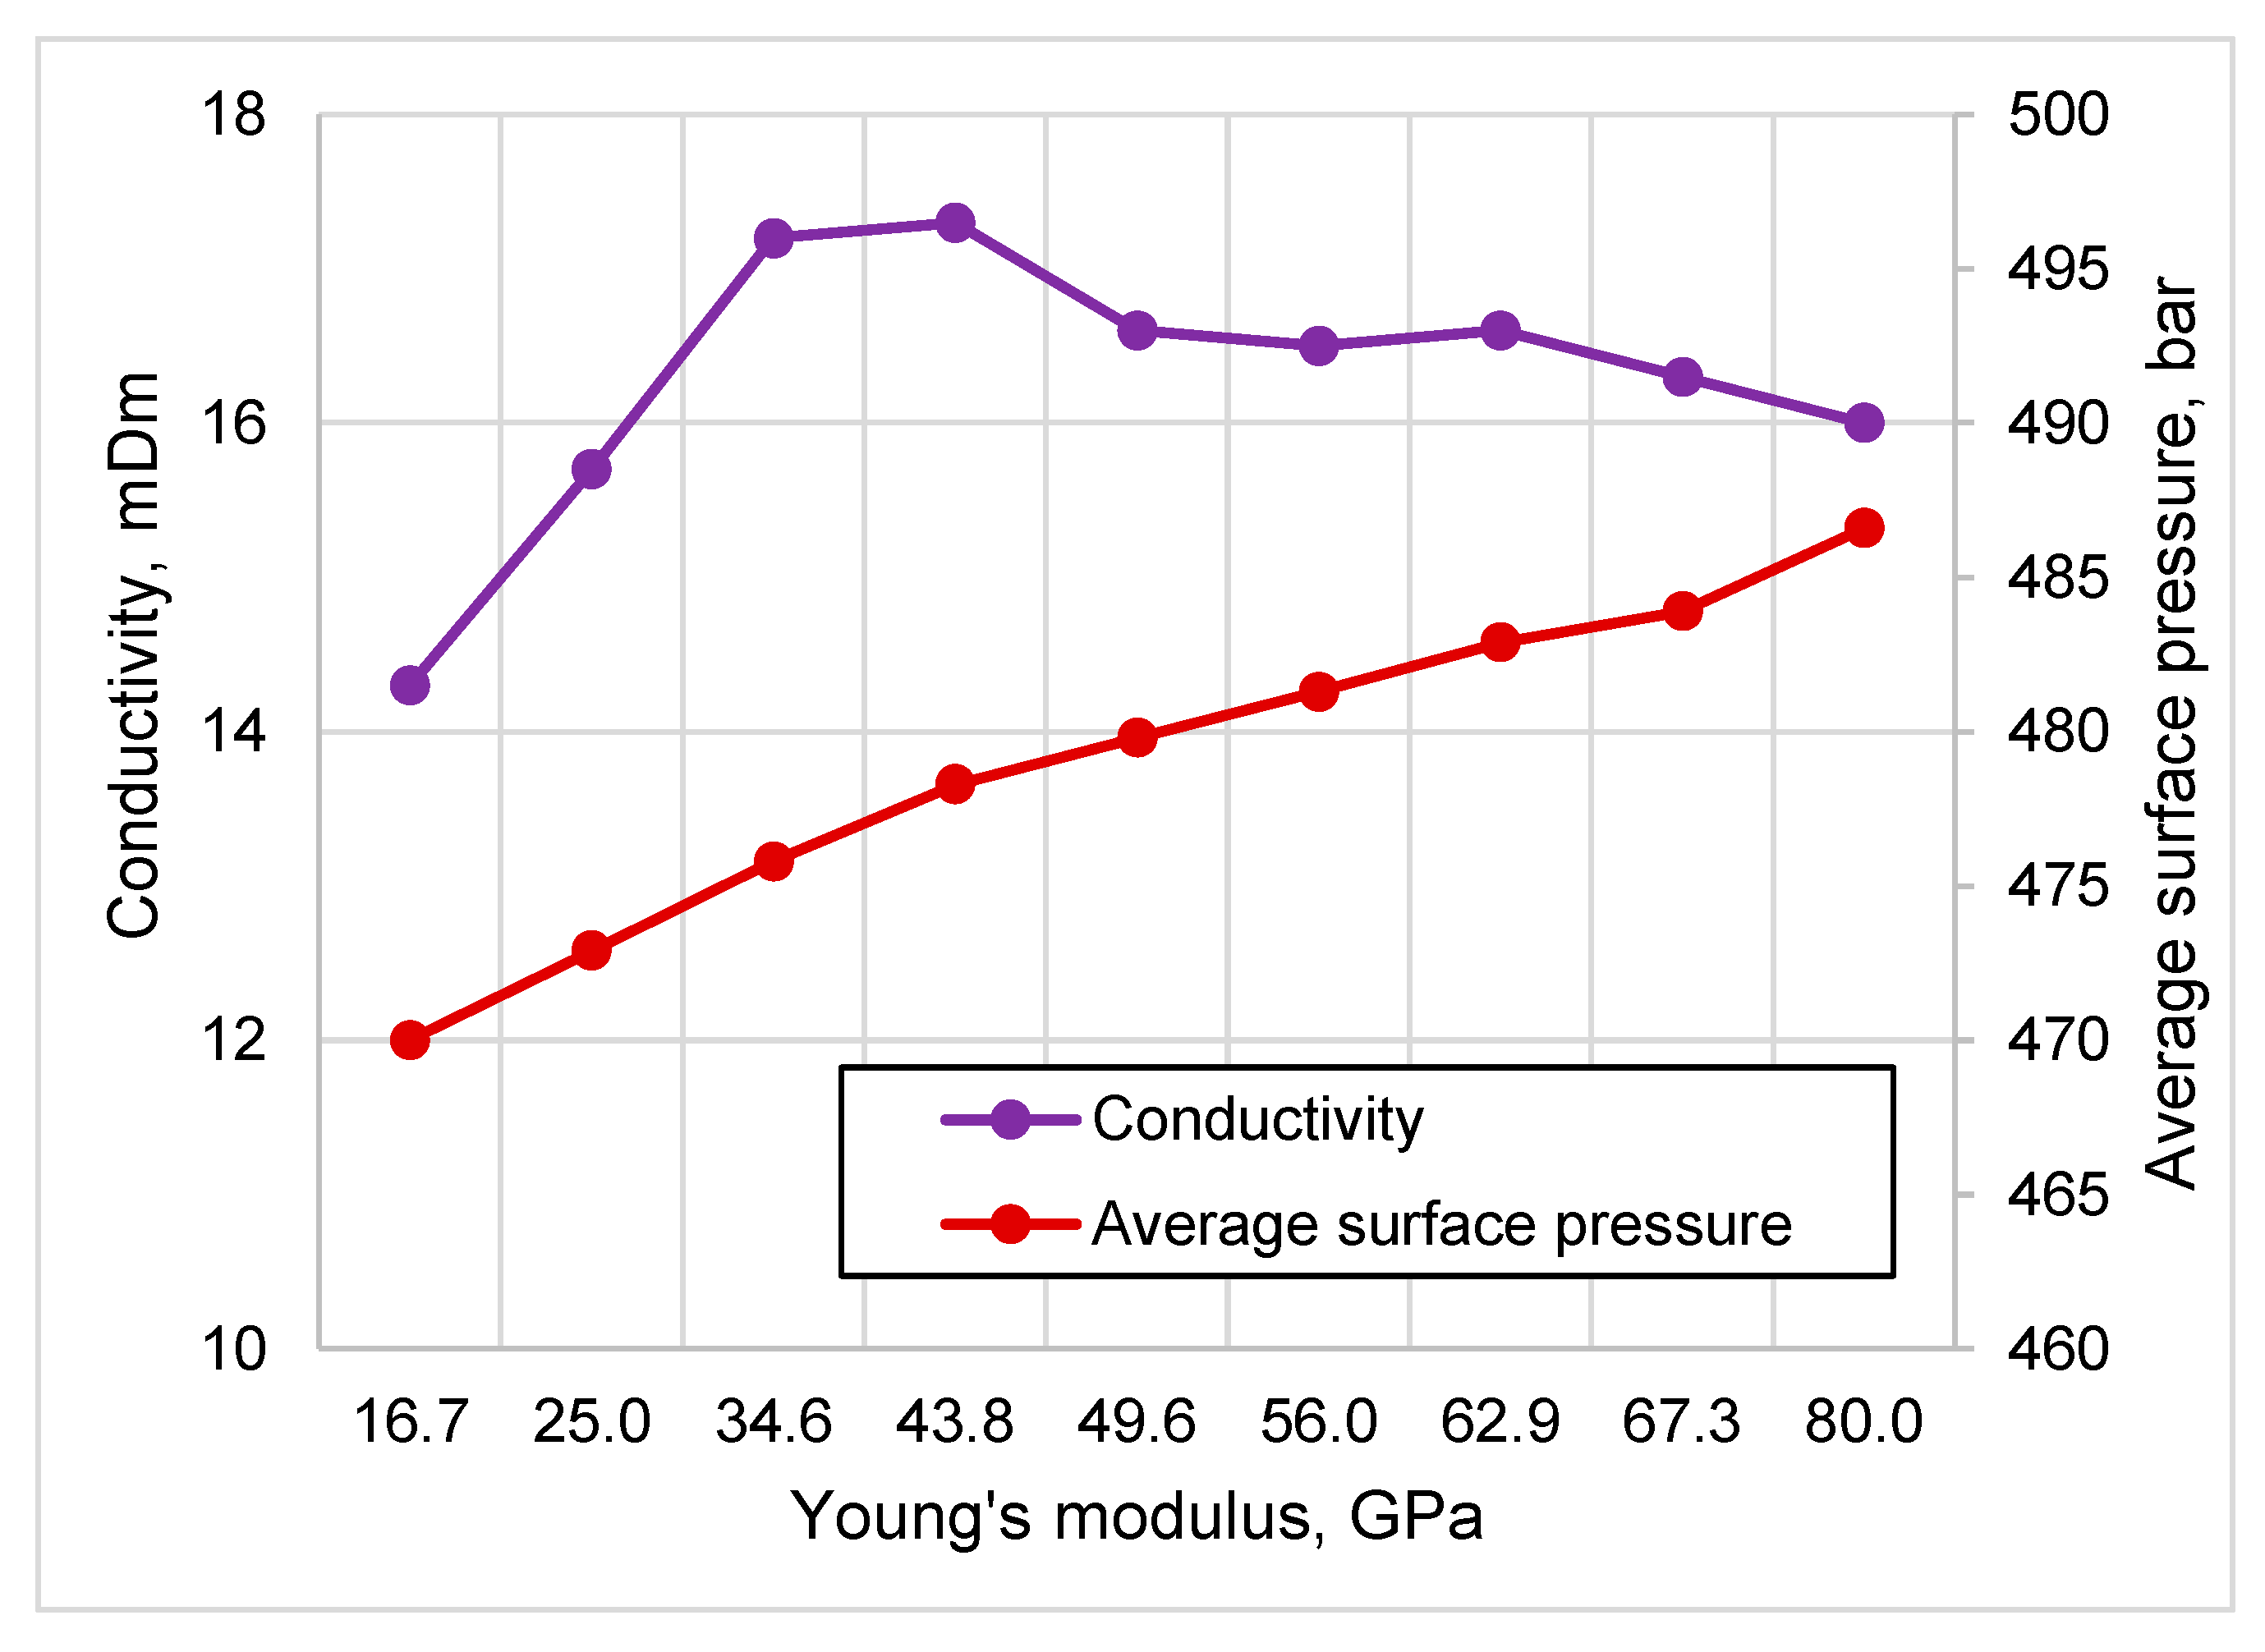
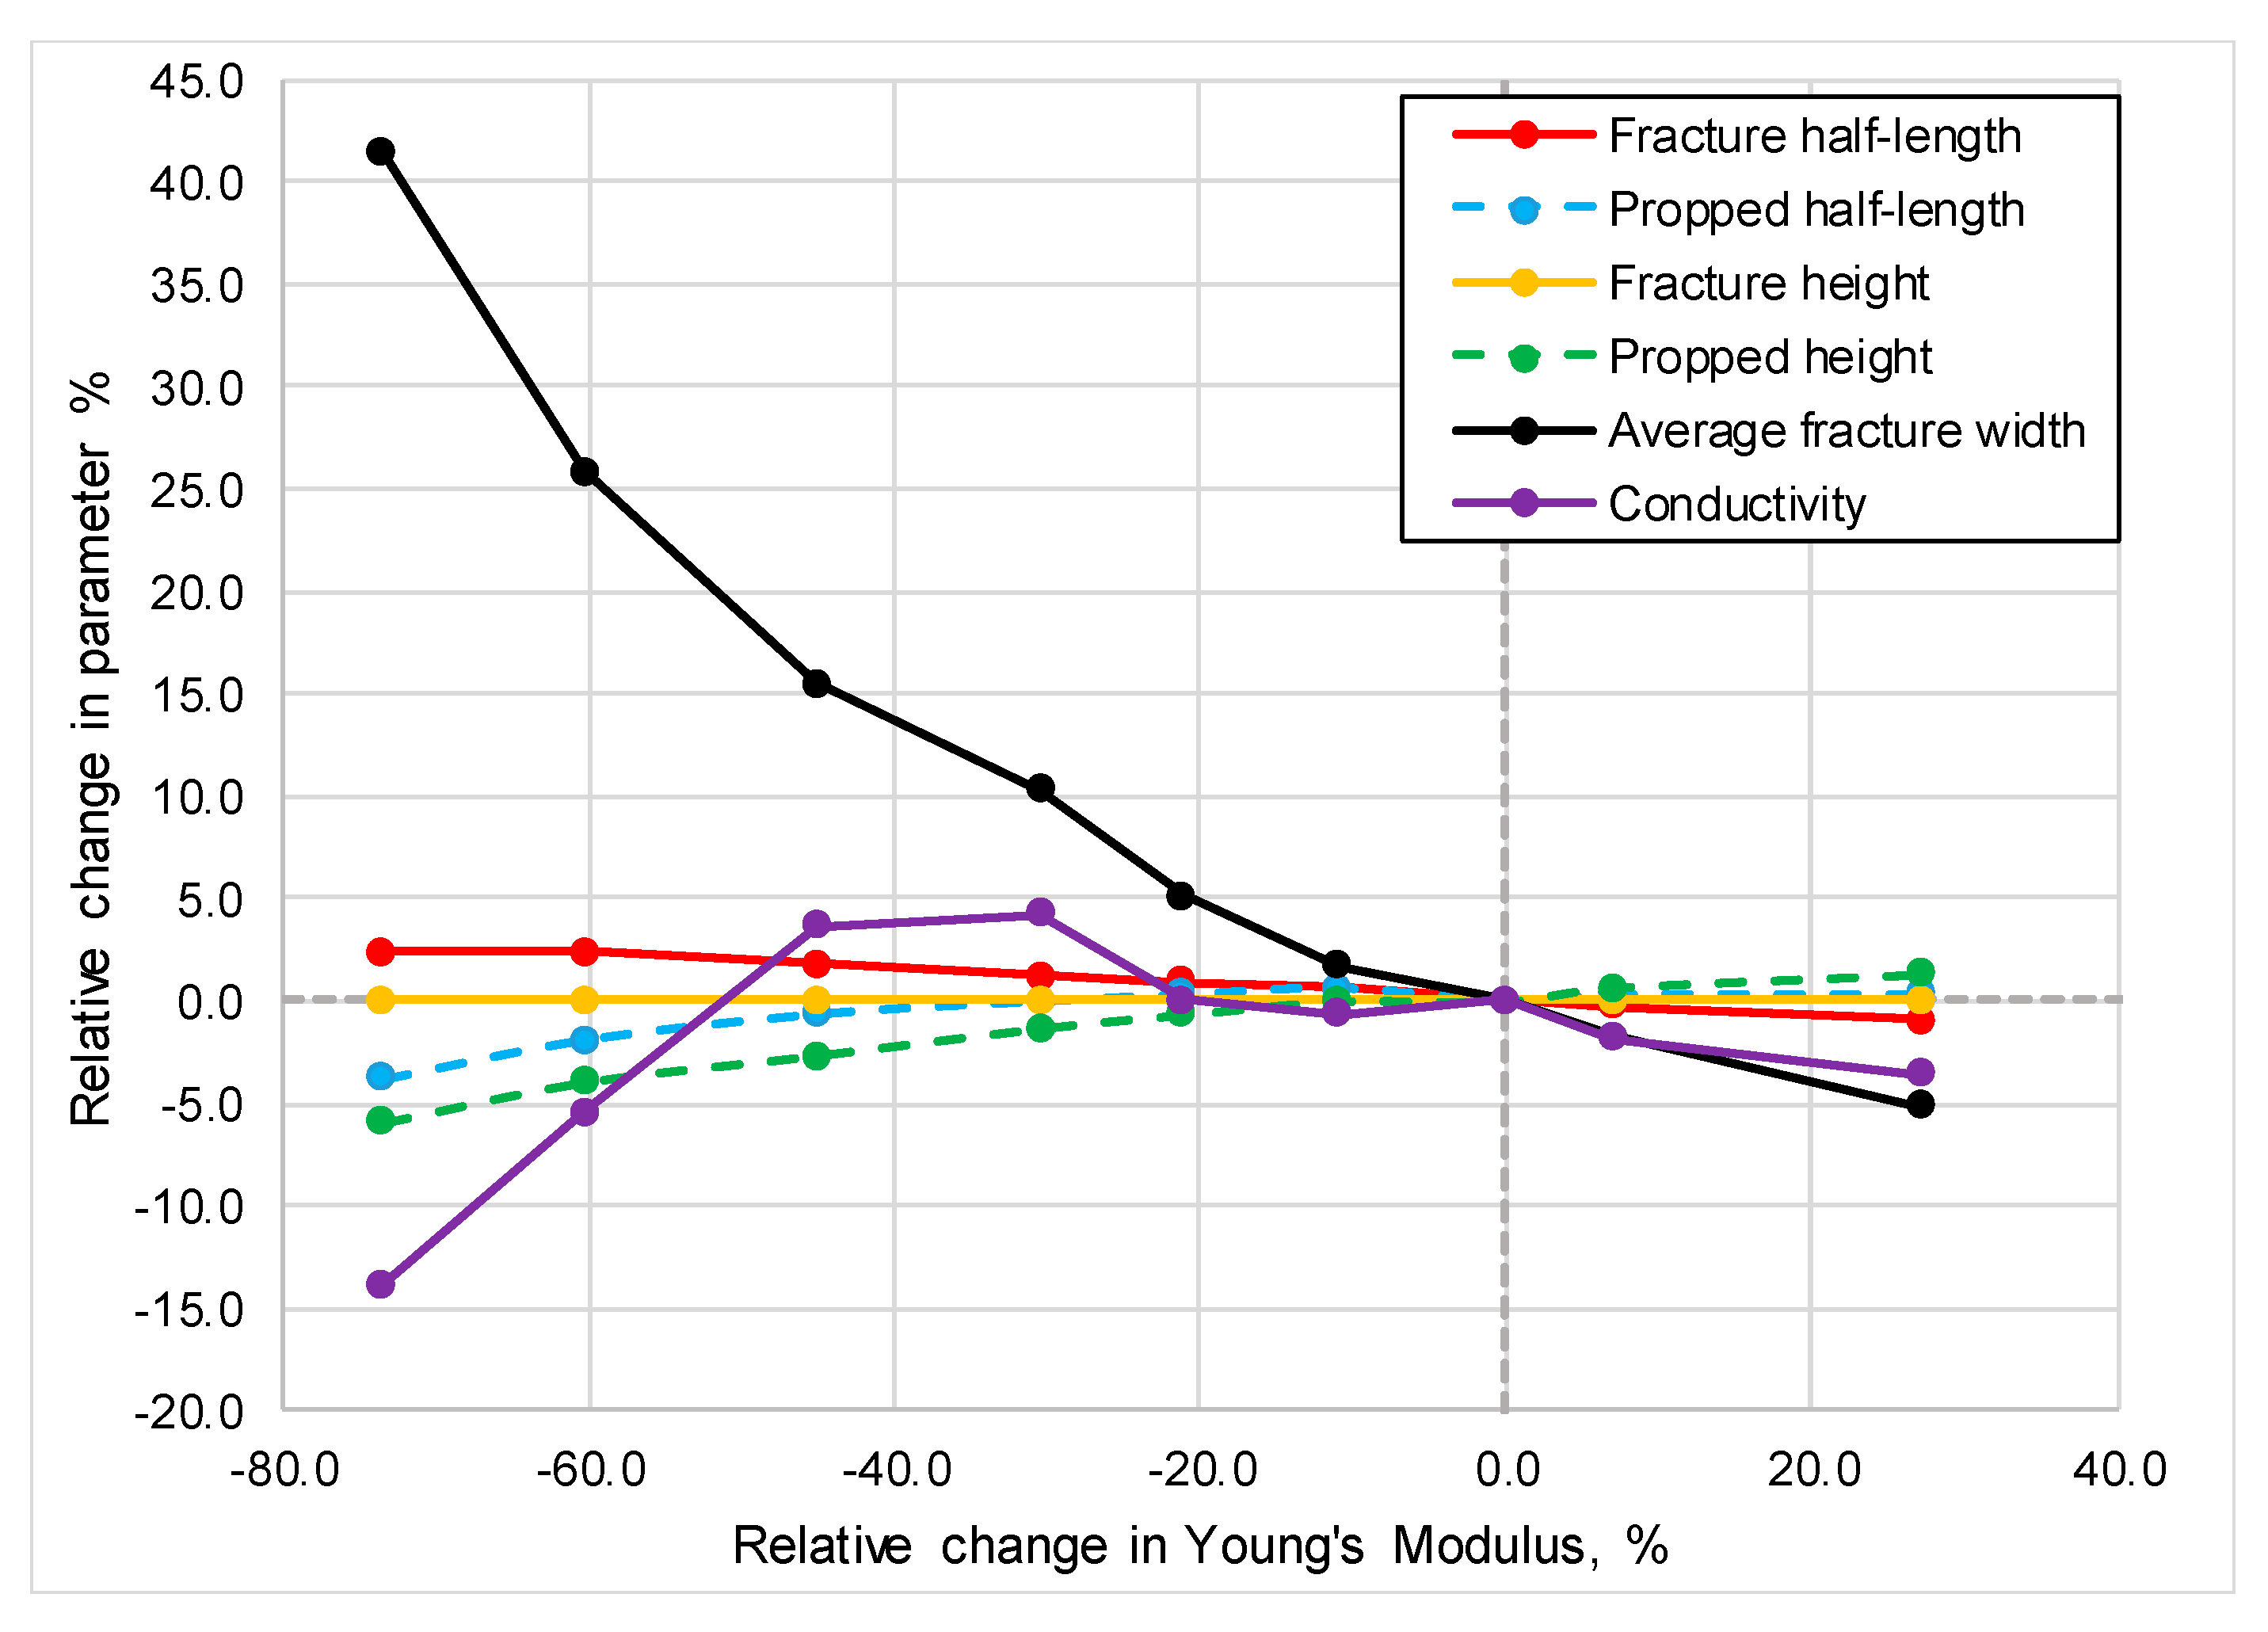
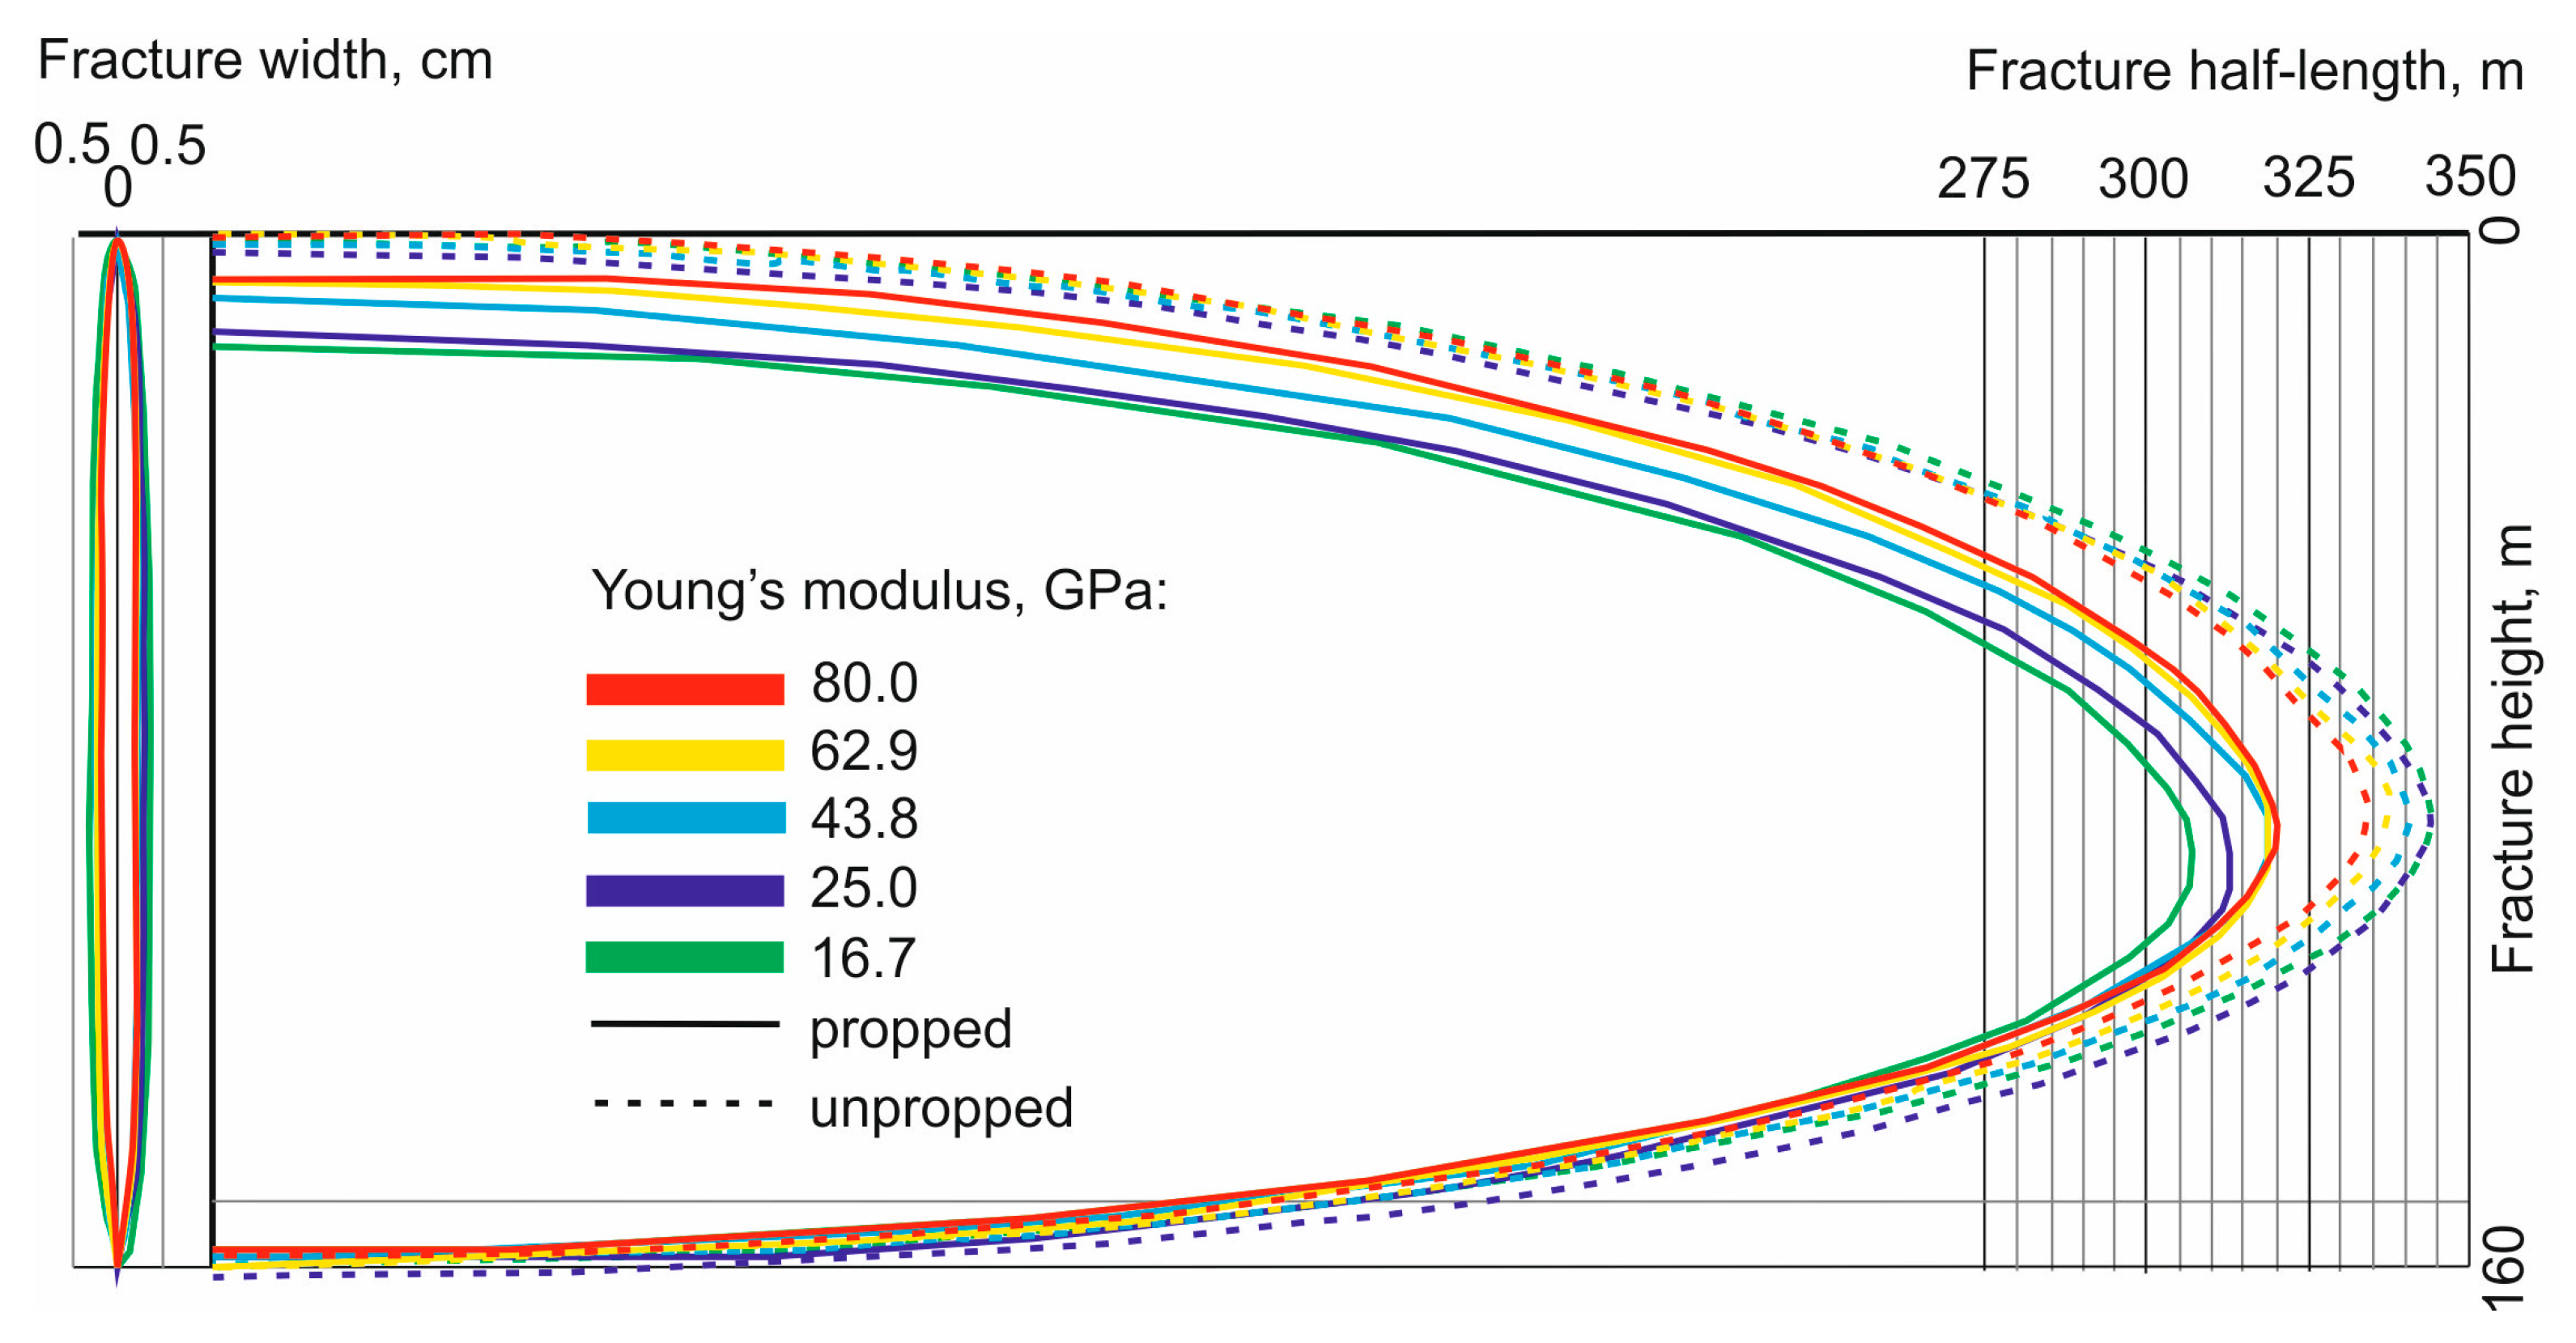
Sensitivity analysis on the granite from the Karkonosze Mountains showed that an increase in E in the pay zone from 16.7 to 80.0 GPa did not influence the height of the fracture. The fracture half-length decreased from 345 to 334 m (11 m decrease), while the width decreased from 0.82 to 0.55 cm (0.27 cm decrease). However, the propped half-length increased from 307 to 320 m (13 m), and the propped height also increased from 142 to 153 m (11 m) (Figure 14). The impact on fracture conductivity was not clear in this case. Conductivity increased at low E values and stabilized with a tendency to slightly decrease below 34.6 GPa (Figure 15). However, it is important to mention that in the real formation conditions, conductivity may be varied due to interactions between natural and induced fractures [21], which cannot be simulated in FracPro. Therefore, the variability in fracture half-length, propped half-length, and propped height did not exceed 7.3% of the assumed reference values (Figure 16). The variability in fracture width was much more significant (from about +41.4% for the lowest assumed E to about −5% for the highest). The embedment phenomenon occurred only in the lowest E values and reached a maximum of 0.013 cm for the lowest assumed E . Variability in fracture geometry with increasing Young’s modulus in the pay zone of the Karkonosze Mountains HDR area can be seen in Figure 17.
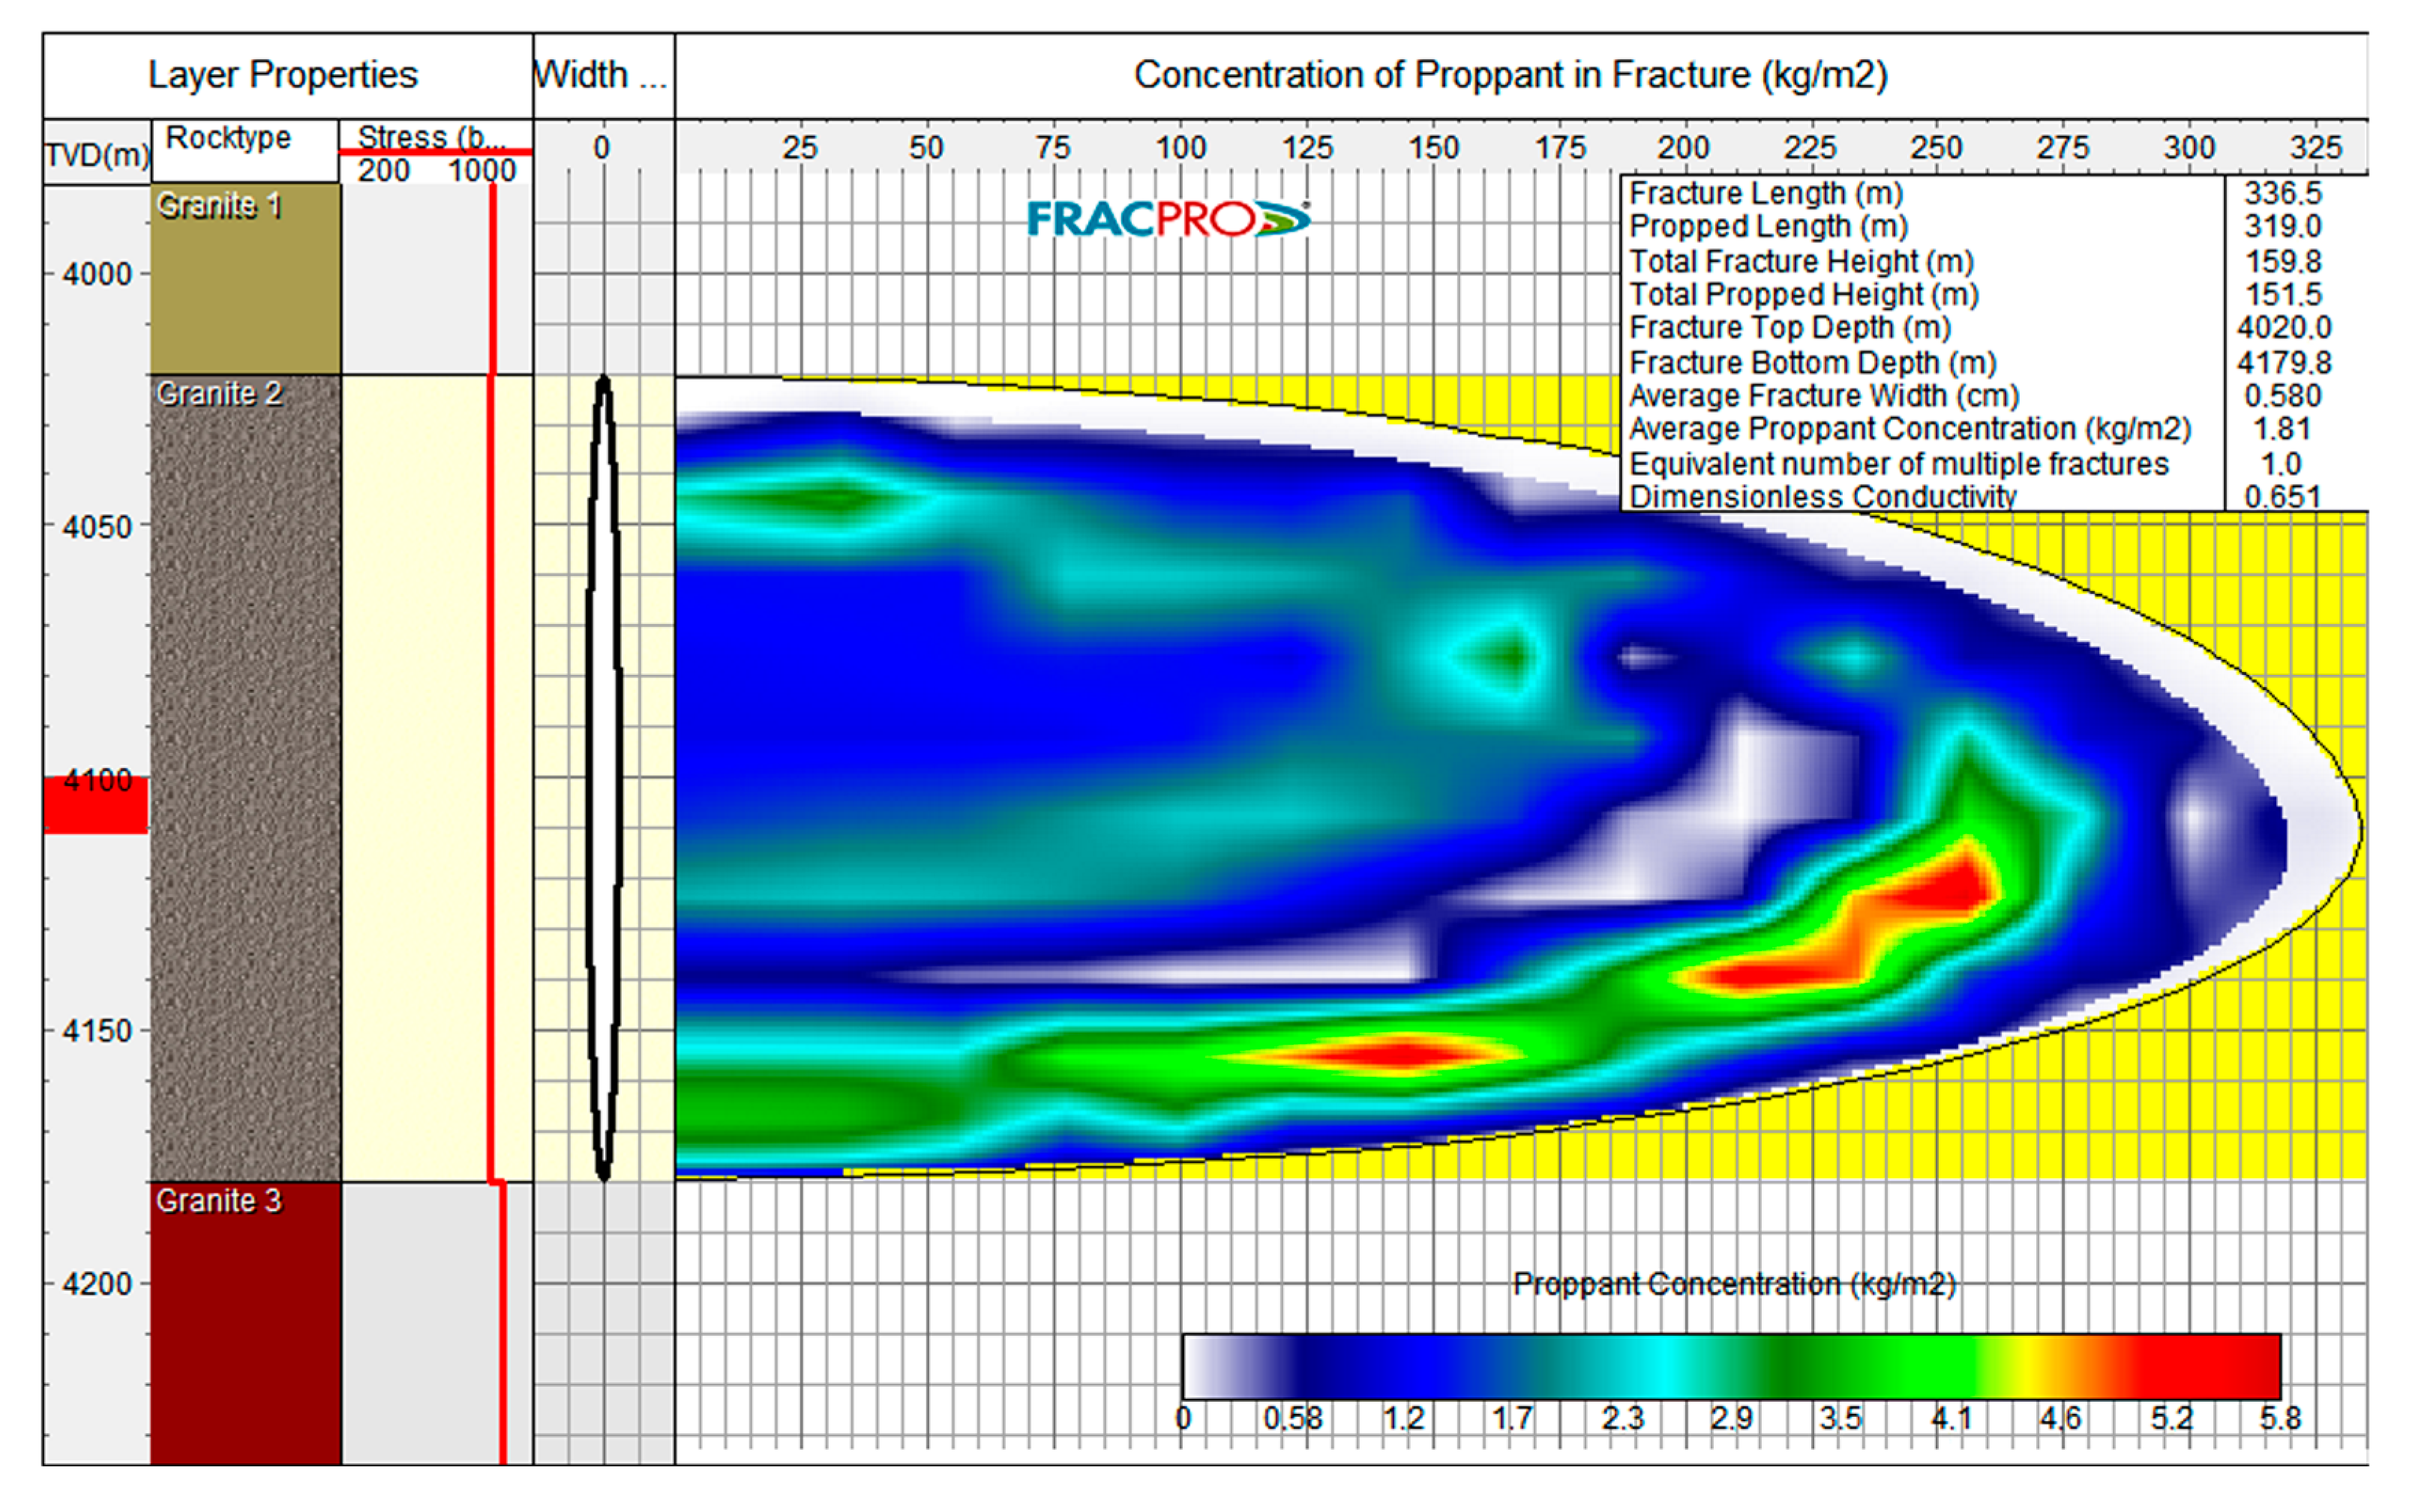
The influence of v on the fracture dimensions in the granite formation was much less significant than that of E , especially in the case of half-length and height. The variation in v from 0.7 to 0.37 led to a change in the half-length and height of the propped fracture in the range below 2.6%. The fracture half-length changed in the range of below 1%, whereas fracture width varied more significantly (7.9%). Embedment was not observed. The influence on the fracture conductivity was unclear, but, in general, it was stable for the entire range of v analyzed. The proppant concentration in the fracture for the average values of E and v are shown in Figure 18.

5. Discussion

No studies have been published to date on the influence of rock elastic parameters on fracture geometry in European HDRs, but data from other locations and rock formations are available. Lei et al. [2] discuss the influence of E and v on the fracture aperture and area in igneous formations. The results show that the fracture aperture decreases significantly with increasing E . Within the tested parameter range of HDRs in the Gonghe Basin (Northwest China), a change in E relative to the average value alters the fracture aperture by 23–52% (decrease with increasing E ). The effects of v on the fracture aperture are minor; it does not change the fracture aperture by more than 6% in the ranges of the tested parameters. Fracture area increases by a maximum of approximately 15% with an increase in E and insignificantly with a change in v . Modeling for shale rocks shows that the lower the v or E obtained, the less the fracture length propagates, while the fracture width increases [61]. Similar results are shown by Suryadinata et al. [62]. Osman and Bilgesu [63] stated that high E values generate shorter and smaller bi-wing fractures in shales, whereas the length of the discrete fracture network increases. Bastos Fernandes et al. [64] pointed out that the higher the E value in shales, the more complicated the fracture networks around the wellbore and the more shear failures observed in natural fractures. When E is relatively small, the width of the fracture decreases a little, while the length slowly increases. Increasing E above 30 GPa leads to dominating shear failure in natural fractures and causes a decrease in fracture length and an increase in width. On the other hand, high v inhibits the growth of shear fractures. As v grows, the fracture length also grows, and its width decreases. Furthermore, E also decreases as the number of thermal cycling increases in EGSs due to the transformation of microfractures into larger ones [65]. With respect to the above-mentioned data, Lei et al. [2] also pointed out that compared to the influences of the in situ stress and the level of natural fracture development, the reservoir properties had a minor effect on the results of the HF treatment.
In the case of the Mogilno-Łódź HDRs, an increase in E caused a change in fracture half-length, height, and width of 4.9% (decrease), 3.7% (increase), and 6.4% (decrease), respectively, which is noticeably lower compared to the data presented by Lei et al. [2]. Differences in the scale of E ’s influence can be explained by the different types of rock being compared: low-strength sandstone on one side and granite of relatively higher strength where the fractures propagate more easily on the other side. On the other hand, the results obtained confirmed that the influence of v on the fracture geometry is minor. Therefore, the variability in E over a relatively wide range leads to change in the fracture geometry parameters, at most by 6.4%, whereas the influence of v can be considered insignificant. The results indicate that despite the variability in rock elastic parameters depending on the used research method and water saturation, in the analyzed sandstone formation, these differences do not strongly affect the final fracture geometry. The directions of correlation (positive or negative) between fracture parameters and rock elastic parameters are shown in Table 1.
In the Karkonosze Mountains granite formation, the increase in E leads to a decrease in width by 46.6%, similar to the data presented by Lei et al. [2], as well as decrease in half-length (3.3%) and does not affect the height of the fracture. However, the propped half-length and propped height increased with E (4.1% and 7.3%, respectively); thus, increasing E in general leads to a decrease in the unpropped part of the fracture. It is important to note that embedment phenomena were expected for E values less than 34.6 GPa only and reached the maximum obtained value of 0.013 cm for the lowest tested E . Therefore, in the tested granite, embedment is only significant in highly altered and fractured parts of the formation characterized by reduced strength.
The variability in half-length and height, both propped and total, due to v change is minor (does not exceed 2,5%), which confirms the literature results [2]. Similar to the Mogilno-Łódź formation, significant variability in elastic parameters was observed for the Karkonosze granites in geomechanical tests, depending on the method used; however, in this case, the large range of E changes leads to relatively small variability in fracture half-length and height but noticeable variability in width. Additional research should be carried out to determine if a significant decrease in fracture width with increasing E also occurs in the case of larger initial fracture width.
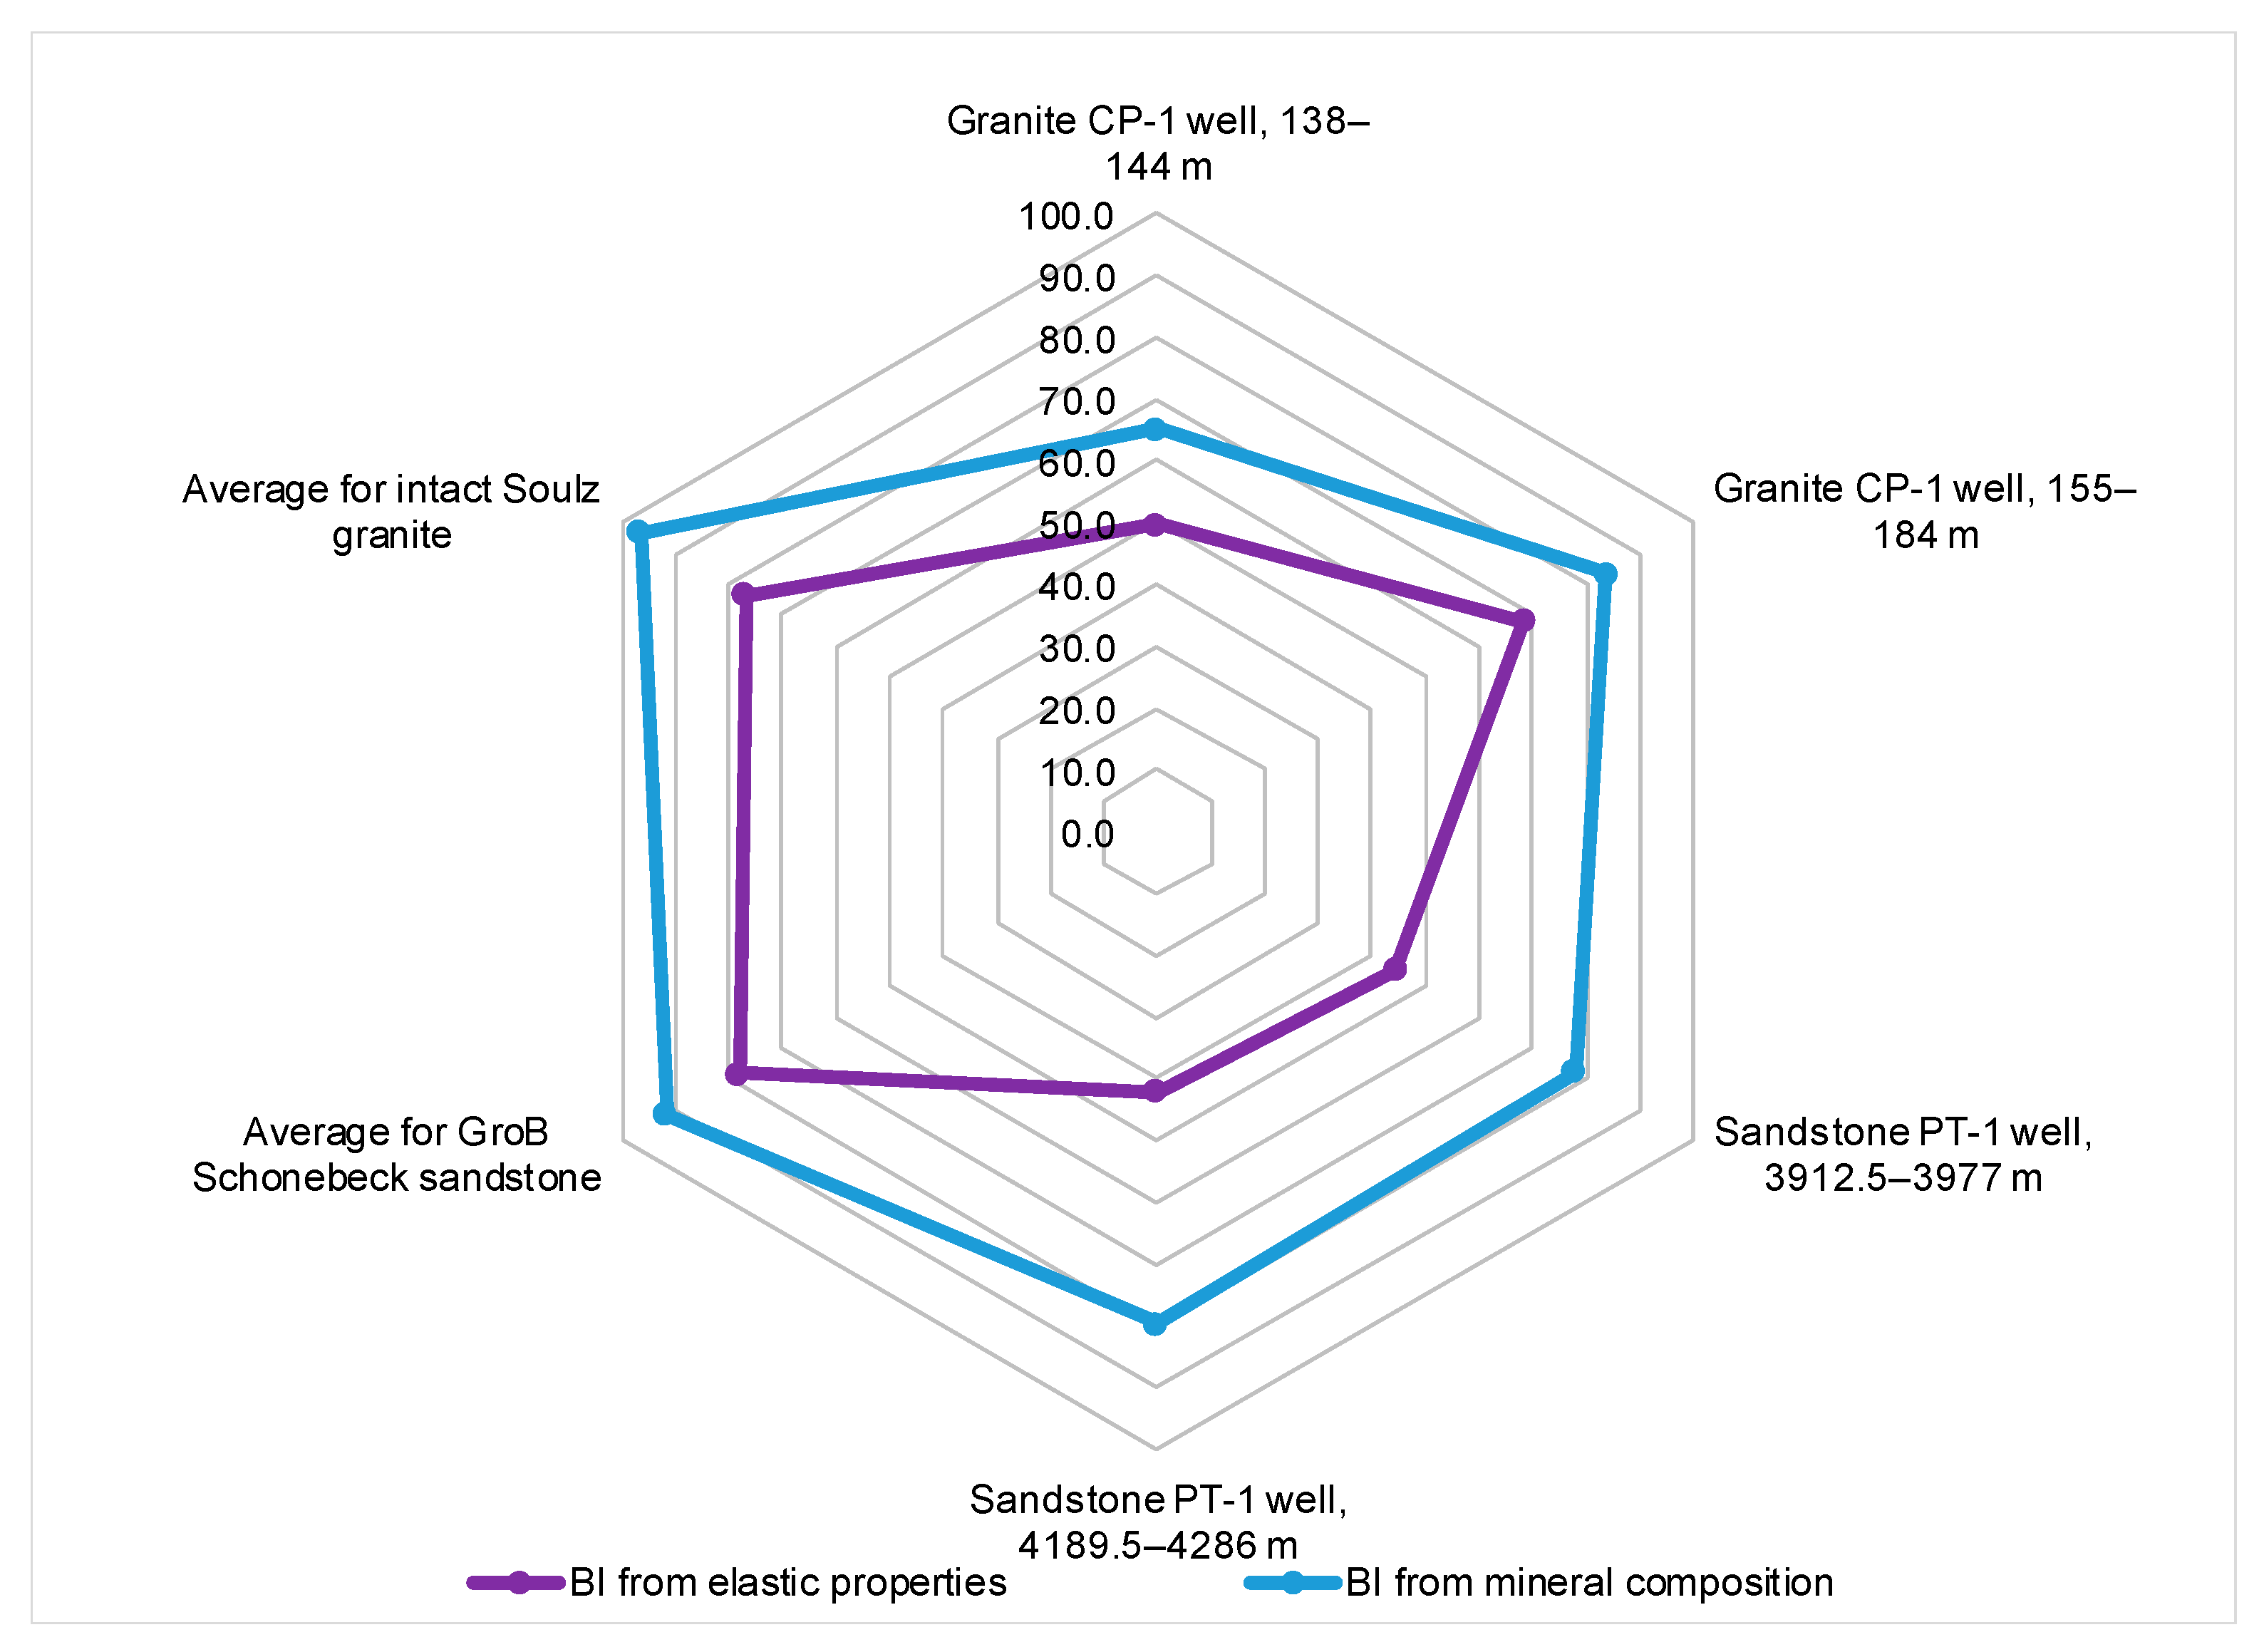
In most of the EGS studies conducted so far, the target zones were igneous formations for which available data for projects in sedimentary strata are limited. The modeling results for the Mogilno-Łódź area indicate that by assuming relatively similar parameters of the fracturing operation to those of the Groß Schönebeck project, in particular the flow rates, fluid volumes, and pumping schedule, relatively similar results can be obtained (Table 2). The average fracture length in the Mogilno-Łódź HDR, taking into account average obtained E and v in the target zone, is 1.0 to 4.0 m lower than that in a fracking project from 2007 in Groß Schönebeck, while the fracture height is noticeably lower. However, the width at the Polish prospective site is almost three times greater (1.4 cm compared to 0.53 cm). These differences may appear due to both the pumping parameters, which were comparable but not identical, and also the petrophysical and geomechanical parameters of the target zone. The greater length and height of the fracture and its lower width correspond to the higher brittleness index of the sandstone formation at the German site (Figure 19). Therefore, assuming a greater distance between injection and production wells, allowing for higher installation efficiency, formations with higher E values are desirable at the Polish site. In the case of sedimentary HDRs, a certain amount of initial water saturation could be also beneficial in order to obtain longer fractures; however, a significant brine inflow can also lead to productivity reduction due to scaling [12] and corrosion issues. The low v in the formation also leads to increased embedment phenomena that can reduce fracture conductivity [26].
Data concerning the geometry of stimulated natural fractures in European igneous EGS formations are difficult to access. Considering the low reservoir in Soultz, the distance between the bottoms of the wells suggests that the natural fracture must be conductive for a distance of at least about 600 m; therefore, it probably has to be stimulated for such a distance. In Landau, the distance between the bottoms of the wells is even greater and reaches 1200 m. The results of the simulations presented in this paper cannot be directly compared with these EGSs because the software used does not take into account the propagation of stimulated natural fractures. Reduced elastic rock parameters and increased permeability and porosity in the pay zone in the presented model constitute only an approximation of the assumed situation in the formation; thus, the presented results may therefore be an indication of how the geometry of the induced fracture depends on the variability in elastic parameters. Natural fractures may have significant initial natural conductivity, and stimulation leads to further improvement of the flow (e.g., the GPK3 well in Soultz). The Karkonosze Mountains EGS in this study can be considered a massive stimulation model containing over 10,000 m3 of fluid in total (Table 3). The obtained fracture half-length would allow for keeping the distance between the bottoms of the wells at about 500–600 m assuming the connection of the fractures in the target zone after treatments in both injection and production wells. Greater fracture length in the model corresponds to lower width, which in turn is related to lower conductivity.
Lei et al. [2] indicated that the variation in the stress magnitude with depth as well as stress difference significantly affected the geometry of the hydraulic fracture network. Therefore, the choice of HF technology, including the type of fluid, proppant, and other parameters, depends on the in situ stresses and also on natural fracture development in the reservoir, as well as petrophysical parameters, i.e., E , v , porosity, and permeability. Unfortunately, concerning the analyzed HDR areas in Central Europe, there are no available data on the natural fractures in the reservoir or on detailed stress patterns. Obtaining these data is critical before designing an HF treatment. Despite incomplete data from the considered formations, and with respect to published data from Western European EGSs, it can be assumed that in the part of the formation containing intact rock or poorly developed natural fractures, gel-proppant fracturing or hybrid treatment would be applicable, while in the well-developed natural fracture network part of the reservoir, massive water fracturing would yield better results.
The design of every HF operation in EGSs should be preceded by comprehensive well-logging data, including the stress state, presence, direction, and conductivity of natural fractures; mineral content; and elastic parameters. The research results presented in this paper indicate that while the elastic parameters of reservoir formations are important for stimulation design, they do not significantly influence the geometry of fractures as modeled in this study. From a geomechanical perspective, in sedimentary formations, the most promising target zones appear to be layers characterized by relatively high E and low v values, which correspond to a high brittleness index. In such rocks, the fracture network after HF operation should be more extensive, the impact of the embedment should be lower, and there should also be a lower likelihood of the unfavorable occurrence of clay minerals, which makes them the most promising. Because high-strength, high-density proppant is required in such deep formations, cross-linked fluids would be appropriate. Currently operating EGSs in igneous rocks in Western Europe indicate that natural fracture zones stimulated by a hydroshearing mechanism are a potential target. In this type of formation, it is essential to understand the orientation and propagation of natural fractures; their lengths, natural conductivities, water inflows; and the interactions between natural and induced fractures. Fractured zones typically exhibit significantly lower E values than intact rock, and this is why such sections can be considered as prospective to stimulation by a hydroshearing mode. The wells drilled should intersect in the direction of the natural fractures so that after stimulation, the optimal workflow can be achieved. Since igneous formations are conducive to self-propping fractures, where the use of proppant is not necessary. The optimum fracturing fluid in this case could be fresh water or a friction-reducer-based proppant.

6. Conclusions

This article discusses for the first time the design of a geothermal collector in prospective hot dry rocks in Poland using the hydraulic fracturing method. For the first time, a comparison of dynamic and static rock mechanics test results in hot dry rocks is also presented, as well as a sensitivity analysis showing the influence of rock elastic parameters on fracture geometry in two different lithologies.
(1)
Rock mechanics tests reveal large differences between the dynamic and static Young’s modulus and the Poisson’s ratio in granite formations from the Karkonosze Mountains, whereas these parameters in the sandstones of the Mogilno-Łódź Trough, especially the Young’s modulus, show less variation. For both lithology types, the best fit is given by a linear trend (R2 from 0.84 to 0.89 for sandstones and granites, respectively).
(2)
The saturation of the samples with brine causes a significant increase in the dynamic Young’s modulus compared to that of dry samples in both formations.
(3)
Sensitivity analysis for Mogilno-Łódź sandstone shows that the increase in Young’s modulus from 14.8 to a 50.0 GPa leads to a decrease in the half-length of the fracture by 4.9% and in the width by 6.4%, as well as an increase in the height by 3.7% and in the conductivity by 12.7%. Variability in Poisson’s ratio (in the tested range from 0.1 to 0.35) leads to negligible changes in the propped fracture half-length and height, in the range below 1.6%.
(4)
In the case of the Karkonosze Mountains granite formation, the increase in Young’s modulus from 16.7 to a 80.0 GPa leads to decrease in half-length by 3.3% and in width by 46.4%, with an increase in propped half-length and height (4.1% and 7.3%, respectively). No influence is observed on the height of the fracture. Variability in Poisson’s ratio (in tested range from 0.7 to 0.37) leads to a negligible change the fracture half-length in the range below 1%, whereas fracture width varies more significantly (decreases by 7.9%).
(5)
Performing sensitivity analysis allows to determine that a relatively great variation in Young’s modulus and Poisson’s ratio leads to relatively little impact on fracture half-length and height in both of the hot dry formations tested. A stronger effect is observed only for fracture width in the granite formation.
(6)
The results of the Mogilno-Łódź hot dry rock model indicate that using similar fracturing operation parameters to those used in the Groß Schönebeck project, similar fracture geometry results can be obtained. However, in the case of the Karkonosze Mountains area, the obtained results should be considered a preliminary approximation due to software limitations, especially the disregarding of natural fracture stimulation.

Author Contributions

Conceptualization, literature review, investigation, manuscript writing, manuscript editing, visualization, R.M.; investigation, manuscript editing, manuscript review, supervision, K.L.; manuscript editing, manuscript review, supervision, P.K. All authors have read and agreed to the published version of the manuscript.

Funding

This paper is based on research carried out at the Silesian University of Technology and the Oil and Gas Institute—National Research Institute (Poland) as a part of the implementation of doctorate program RJO/SDW/005-33, founded by the Ministry of Science and Higher Education of Poland.

Data Availability Statement

The data presented in this study are available on request from the corresponding author.

Conflicts of Interest

The authors declare no conflicts of interest.

Nomenclature

HDRHot dry rock
EGSEnhanced geothermal system
HFHydraulic fracturing
E / E s t a t / E d y n Young’s modulus in general/static/dynamic, Pa
v / v s t a t / v d y n Poisson ratio in general/static/dynamic, dimensionless
K Bulk modulus, Pa
G Shear modulus, Pa
σ Stress, Pa
εStrain, m/m
σ V Vertical principal stress, Pa
σ H Maximum horizontal stress, Pa
σ h Minimum horizontal stress, Pa
ρ Bulk density, g/cm3
V P Compressional wave velocity, m/s
V S Shear wave velocity, m/s
BIBrittleness index, %

References

  1. Lu, S.-M. A global review of enhanced geothermal system (EGS). Renew. Sustain. Energy Rev. 2018, 81, 2902–2921. [Google Scholar] [CrossRef]
  2. Lei, Z.; Zhang, Y.; Zhang, S.; Shi, Y. Numerical study of hydraulic fracturing treatments and geothermal energy extraction from a naturally fractured granitic formation. Geothermics 2023, 111, 102692. [Google Scholar] [CrossRef]
  3. Tester, J.; Anderson, B.; Batchelor, A.; Blackwell, D.D.; DiPippo, R.; Drake, E.M.; Garnish, J.; Livesay, B.; Moore, M.C.; Nichols, K.; et al. The Future of Geothermal Energy-Impact of Enhanced Geothermal Systems (EGS) on the United States in the 21st Century; Massachusetts Institute of Technology: Cambridge, MA, USA, 2006. [Google Scholar]
  4. Brown, D.W.; Duchane, D.V.; Heiken, G.; Hriscu, V.T. Mining the Earth’s Heat: Hot Dry Rock Geothermal Energy; Springer: Berlin/Heidelberg, Germany, 2018. [Google Scholar] [CrossRef]
  5. Olasolo, P.; Juárez, M.C.; Morales, M.P.; D’Amico, S.; Liarte, I.A. Enhanced geothermal systems (EGS): A review. Renew. Sustain. Energy Rev. 2016, 56, 133–144. [Google Scholar] [CrossRef]
  6. Duffield, R.; Nunz, G.; Smith, M.; Wilson, M. Hot Dry Rock Geothermal Energy Development Program Annual Report, Fiscal Year 1980; Los Alamos National Laboratory: Los Alamos, NM, USA, 1980. [Google Scholar] [CrossRef]
  7. Norbeck, J.H.; McClure, M.W.; Horne, R.N. Field observations at the Fenton Hill enhanced geothermal system test site support mixed-mechanism stimulation. Geothermics 2018, 74, 135–149. [Google Scholar] [CrossRef]
  8. Wakahama, H.; Mitoa, S.; Ohsumi, T.; Ueda, A.; Yajima, T.; Satoh, H.; Sugiyama, K.; Ozawa, A.; Ajima, S.; Todaka, N.; et al. A concept of CO2 georeactor sequestration at the Ogachi HDR site, NE Japan. Energy Procedia 2009, 1, 3683–3689. [Google Scholar] [CrossRef]
  9. Hogarth, R.; Holl, H.G. Lessons learned from the Habanero EGS project. GRC Trans. 2017, 41, 865–877. [Google Scholar]
  10. Legarth, B.; Huenges, E.; Zimmermann, G. Hydraulic fracturing in a sedimentary geothermal reservoir: Results and implications. Int. J. Rock. Mech. Min. Sci. 2005, 42, 1028–1041. [Google Scholar] [CrossRef]
  11. Zimmermann, G.; Moeck, I.; Blöcher, G. Cyclic waterfrac stimulation to develop an enhanced geothermal system (EGS)—Conceptual design and experimental results. Geothermics 2010, 39, 59–69. [Google Scholar] [CrossRef]
  12. Blöcher, G.; Reinsch, T.; Henninges, J.; Milsch, H.; Regenspurg, S.; Kummerow, J.; Francke, H.; Kranz, S.; Saadat, A.; Zimmermann, G.; et al. Hydraulic history and current state of the deep geothermal reservoir Groß Schönebeck. Geothermics 2016, 63, 27–43. [Google Scholar] [CrossRef]
  13. Baujard, C.; Genter, A.; Dalmais, E.; Maurer, V.; Hehn, R.; Rosillette, R.; Vidal, J.; Schmittbuhl, J. Hydrothermal characterization of wells GRT-1 and GRT-2 in Rittershoffen, France: Implications on the understanding of natural flow systems in the Rhine Graben. Geothermics 2017, 65, 255–268. [Google Scholar] [CrossRef]
  14. Vidal, J.; Genter, A. Overview of naturally permeable fractured reservoirs in the central and southern Upper Rhine Graben: Insights from geothermal wells. Geothermics 2018, 74, 57–73. [Google Scholar] [CrossRef]
  15. Park, S.; Kim, K.-I.; Xie, L.; Yoo, H.; Min, K.B.; Kim, M.; Yoon, B.; Kim, K.Y.; Zimmermann, G.; Guinot, F.; et al. Observations and analyses of the first two hydraulic stimulations in the Pohang geothermal development site, South Korea. Geothermics 2020, 88, 101905. [Google Scholar] [CrossRef]
  16. Moska, R.; Labus, K.; Kasza, P. Hydraulic fracturing in enhanced geothermal systems—Field, tectonic and rock mechanics conditions—A review. Energies 2021, 14, 5725. [Google Scholar] [CrossRef]
  17. Moska, R.; Labus, K.; Kasza, P.; Moska, A. Geothermal potential of hot dry rock in south-east Baltic Basin countries—A review. Energies 2023, 16, 1662. [Google Scholar] [CrossRef]
  18. Moska, R.; Labus, K.; Kasza, P. Dynamic elastic properties, petrophysical parameters and brittleness of hot dry rocks from prospective areas of Central Europe. Adv. Geo-Energy Sci. 2024, 14, 90–105. [Google Scholar] [CrossRef]
  19. Li, S.; Wang, S.; Tang, H. Stimulation mechanism and design of enhanced geothermal systems: A comprehensive review. Renew. Sustain. Energy Rev. 2022, 155, 111914. [Google Scholar] [CrossRef]
  20. McClure, M.W.; Horne, R.N. An investigation of stimulation mechanisms in enhanced geothermal systems. Int. J. Rock. Mech. Min. Sci. 2014, 72, 242–260. [Google Scholar] [CrossRef]
  21. Zhang, Q.; Zhang, X.-P.; Sun, W. A review of laboratory studies and theoretical analysis for the interaction mode between induced hydraulic fractures and pre-existing fractures. J. Nat. Gas. Sci. Eng. 2021, 86, 103719. [Google Scholar] [CrossRef]
  22. Dixit, N.C.; Hanks, C.L.; Wallace, W.K.; Ahmadi, M.; Awoleke, O. In situ stress variations associated with regional changes in tectonic setting, northeastern Brooks Range and eastern North Slope of Alaska. AAPG Bull. 2017, 101, 343–360. [Google Scholar] [CrossRef]
  23. Economides, M.J.; Nolte, K.G. Reservoir Stimulation, 3rd ed.; Wiley: Chichester, UK; New York, NY, USA, 2000. [Google Scholar]
  24. Rickman, R.; Mullen, M.; Petre, E.; Grieser, W.V.; Kundert, D. A practical use of shale petrophysics for stimulation design optimization: All shale plays are not clones of the Barnett shale. In Proceedings of the SPE Annual Technical Conference and Exhibition, Denver, CO, USA, 21–24 September 2008. [Google Scholar] [CrossRef]
  25. Masłowski, M.; Kasza, P.; Czupski, M.; Wilk, K.; Moska, R. Studies of fracture damage caused by the proppant embedment phenomenon in shale rock. Appl. Sci. 2019, 9, 2190. [Google Scholar] [CrossRef]
  26. Masłowski, M.; Labus, M. Preliminary studies on the proppant embedment in Baltic Basin shale rock. Rock. Mech. Rock. Eng. 2021, 54, 2233–2248. [Google Scholar] [CrossRef]
  27. Shen, S.; Gao, Y.; Jia, L. A Comparison of the relationship between dynamic and static rock mechanical parameters. Appl. Sci. 2024, 14, 4487. [Google Scholar] [CrossRef]
  28. Zoback, M. Reservoir Geomechanics; Cambridge University Press: Cambridge, UK, 2007. [Google Scholar]
  29. AL-Ameri, W.A.; Abdulraheem, A.; Mahmoud, M. Long-term effects of CO2 sequestration on rock mechanical properties. J. Energy Resour. Technol. 2016, 138, 012201. [Google Scholar] [CrossRef]
  30. Moska, R. Wpływ oddziaływania CO2 na dynamiczne parametry geomechaniczne w systemie geotermalnym. Nafta-Gaz 2023, 79, 199–212. [Google Scholar] [CrossRef]
  31. Grieser, B.; Bray, J. Identification of Production Potential in Unconventional Reservoirs. In Proceedings of the Production and Operations Symposium, Oklahoma, OK, USA, 31 March–3 April, 2007. [Google Scholar] [CrossRef]
  32. Brotons, V.; Tomás, R.; Ivorra, S.; Grediaga, A. Relationship between static and dynamic elastic modulus of calcarenite heated at different temperatures: The San Julián’s stone. Bull. Eng. Geol. Environ. 2014, 73, 791–799. [Google Scholar] [CrossRef]
  33. Davarpanah, S.M.; Ván, P.; Vásárhelyi, B. Investigation of the relationship between dynamic and static deformation moduli of rocks. Geomech. Geophys. Geo-Energy Geo-Resour. 2020, 6, 29. [Google Scholar] [CrossRef]
  34. Eissa, E.A.; Kazi, A. Relation between static and dynamic Young’s moduli of rocks. Int. J. Rock. Mech. Min. Sci. Geomech. Abstr. 1988, 25, 479–482. [Google Scholar] [CrossRef]
  35. Brotons, V.; Tomás, R.; Ivorra, S. Improved correlation between the static and dynamic elastic modulus of different types of rocks. Mater. Struct. 2016, 49, 3021–3037. [Google Scholar] [CrossRef]
  36. Bukowska, M.; Kasza, P.; Moska, R.; Jureczka, J. The Young’s modulus and Poisson’s ratio of hard coals in laboratory tests. Energies 2022, 15, 2477. [Google Scholar] [CrossRef]
  37. Meller, C.; Ledésert, B. Is there a link between mineralogy, petrophysics, and the hydraulic and seismic behaviors of the Soultz-sous-Forêts granite during stimulation? A review and reinterpretation of petro-hydromechanical data toward a better understanding of induced seismicity and fluid flow. J. Geophys. Res. Solid. Earth 2017, 122, 9755–9774. [Google Scholar] [CrossRef]
  38. Villeneuve, M.; Heap, M.; Kushnir, A.; Qin, T.; Baud, P.; Zhou, G.; Xu, T. Estimating in situ rock mass strength and elastic modulus of granite from the Soultz-sous-Forêts geothermal reservoir (France). Geotherm. Energy 2018, 6, 11. [Google Scholar] [CrossRef]
  39. Al-Shayea, N.A. Effects of testing methods and conditions on the elastic properties of limestone rock. Eng. Geol. 2004, 74, 139–156. [Google Scholar] [CrossRef]
  40. Lama, R.D.; Vutukuri, V.S. Handbook on Mechanical Properties of Rocks; Trans Tech Publications: Clausthal-Zellerfeld, Germany, 1978; Volume II. [Google Scholar]
  41. Yadali Jamaloei, B. A critical review of common models in hydraulic-fracturing simulation: A practical guide for practitioners. Theor. Appl. Fract. Mech. 2021, 113, 102937. [Google Scholar] [CrossRef]
  42. Legarth, B.; Tischner, T.; Huenges, E. Stimulation experiments in sedimentary, low-enthalpy reservoirs for geothermal power generation, Germany. Geothermics 2003, 32, 487–495. [Google Scholar] [CrossRef]
  43. Zimmermann, G.; Reinicke, A. Hydraulic stimulation of a deep sandstone reservoir to develop an enhanced geothermal system: Laboratory and field experiments. Geothermics 2010, 39, 70–77. [Google Scholar] [CrossRef]
  44. Lei, Z.; Zhang, Y.; Zhang, S.; Fu, L.; Hu, Z.; Yu, Z.; Li, L.; Zhou, J. Electricity generation from a three-horizontal-well enhanced geothermal system in the Qiabuqia geothermal field, China: Slickwater fracturing treatments for different reservoir scenarios. Renew. Energy 2020, 145, 65–83. [Google Scholar] [CrossRef]
  45. Guo, T.; Gong, F.; Wang, X.; Lin, Q.; Qu, Z.; Zhang, W. Performance of enhanced geothermal system (EGS) in fractured geothermal reservoirs with CO2 as working fluid. Appl. Therm. Eng. 2019, 152, 215–230. [Google Scholar] [CrossRef]
  46. Guo, T.; Tang, S.; Liu, S.; Liu, X.; Zhang, W.; Qu, G. Numerical simulation of hydraulic fracturing of hot dry rock under thermal stress. Eng. Fract. Mech. 2020, 240, 107350. [Google Scholar] [CrossRef]
  47. Aliyu, M.D.; Archer, R.A. Numerical simulation of multifracture HDR geothermal reservoirs. Renew. Energy 2021, 164, 541–555. [Google Scholar] [CrossRef]
  48. Cheng, Q.; Wang, X.; Ghassemi, A. Numerical simulation of reservoir stimulation with reference to the Newberry EGS. Geothermics 2019, 77, 327–343. [Google Scholar] [CrossRef]
  49. Xue, Z.; Wei, Z.; Ma, H.; Sun, Z.; Lu, C.; Chen, Z. Exploring the role of fracture networks in enhanced geothermal systems: Insights from integrated thermal-hydraulic-mechanical-chemical and wellbore dynamics simulations. Renew. Sustain. Energy Rev. 2025, 215, 115636. [Google Scholar] [CrossRef]
  50. Ulusay, R.; Hudson, J. The Complete ISRM Suggested Methods for Rock Characterization, Testing and Monitoring:1974–2006; ISRM Turkish National Group: Ankara, Turkey, 2007. [Google Scholar]
  51. Gentier, S.; Rachez, X.; Dezayes, C.; Blaisonneau, A.; Genter, A. How to understand the effect of the hydraulic stimulation in term of hydro-mechanical behavior at Soultz-sous-Forêts (France)? GRC Trans. 2005, 29, 159–166. [Google Scholar]
  52. Schindler, M.; Baumgärtner, J.; Gandy, T.; Hauffe, P.; Hettkamp, T.; Menzel, H.; Penzkofer, P.; Teza, D.; Tischner, T.; Wahl, G. Successful hydraulic stimulation techniques for electric power production in the Upper Rhine Graben, Central Europe. In Proceedings of the World Geothermal Congress, Bali, Indonesia, 25–30 April 2010. [Google Scholar]
  53. Bujakowski, W.; Barbacki, A.; Miecznik, M.; Pająk, L.; Skrzypczak, R. A structural-thermal model of the Karkonosze Pluton (Sudetes Mountains, SW Poland) for Hot Dry Rock (HDR) geothermal use. Arch. Min. Sci. 2016, 61, 917–935. [Google Scholar] [CrossRef]
  54. Lógó, A.; Vásárhelyi, B. Theoretical Relationship between the Confining Pressure and Poisson’s Ratio of Intact Rock. Period. Polytech. Civ. Eng. 2022, 66, 1114–1121. [Google Scholar] [CrossRef]
  55. Molina, O.; Vilarrasa, V.; Zeidouni, M. Geologic carbon storage for shale gas recovery. Energy Procedia 2017, 114, 5748–5760. [Google Scholar] [CrossRef]
  56. Lake, L. Petroleum Engineering Handbook; Society of Petroleum Engineers: Richardson, TX, USA, 2007. [Google Scholar]
  57. Bourbié, T.; Coussy, O.; Zinszner, B. Acoustics of Porous Media; Editions Technip: Paris, France, 1987. [Google Scholar]
  58. Yang, S.; Tian, W.; Elsworth, D.; Wang, J.G.; Fan, L.F. An Experimental Study of Effect of High Temperature on the Permeability Evolution and Failure Response of Granite Under Triaxial Compression. Rock. Mech. Rock. Eng. 2019, 53, 4403–4427. [Google Scholar] [CrossRef]
  59. Guo, L.; Zhang, Y.; Zhang, Y.; Yu, Z.; Zhang, J. Experimental investigation of granite properties under different temperatures and pressures and numerical analysis of damage effect in enhanced geothermal system. Ren. Energy 2018, 126, 107–125. [Google Scholar] [CrossRef]
  60. Paul, S.; Chattopadhyaya, S.; Raina, A.K.; Sharma, S.; Li, C.; Zhang, Y.; Kumar, A.; Tag-Eldin, E. A Review on the Impact of High-Temperature Treatment on the Physico-Mechanical, Dynamic, and Thermal Properties of Granite. Sustainability 2022, 14, 14839. [Google Scholar] [CrossRef]
  61. Waliy, F.; Buntoro, A.; Lukmana, A.H.; Rahma, A.A. The Effect of Poisson’s Ratio and Young’s Modulus on Fracture Geometry of 2D Model PKN: Case Study of Unconventional Reservoir; IATMI: Jakarta, Indonesia, 2020. [Google Scholar]
  62. Suryadinata, M.D.; Ratnaningsih, D.R.; Ariadi, I.K.; Waliy, F.; Nugroho, W.A. Rock mechanics effect on fracture geometry and dimensionless fracture conductivity of 2D model KGD (Khristianovic-Geertsma-de Klerk) in Air Benakat formation, Meruap field. Int. J. Pet. Gas. Explor. Manag. 2021, 5, 1–14. [Google Scholar]
  63. Osman, T.; Bilgesu, H.I. Impact of Geo-Mechanical Properties on the Fracture Treatment of Utica Shale. In Proceedings of the SPE Eastern Regional Meeting, Morgantown, WV, USA, 13–15 October 2015. [Google Scholar] [CrossRef]
  64. Fernando, B.F.; Wellington, C.; Braga, M.B.; Bothelho, M.O.A.; Freitas, A.C.D.; Braga, L.F.Q.F.; Frota, R.A. Hydraulics and geomechanics parameters for hydraulic fracturing optimization in production’s developments of shale gas/shale oil in North America. J. Pet. Environ. Biotechnol. 2020, 11, 399. [Google Scholar] [CrossRef]
  65. Ngoma, M.C.; Kolawole, O.; Olorode, O. Geothermo-mechanical alterations due to heat energy extraction in enhanced geothermal systems: Overview and prospective directions. Deep Undergr. Sci. Eng. 2024, 3, 256–268. [Google Scholar] [CrossRef]
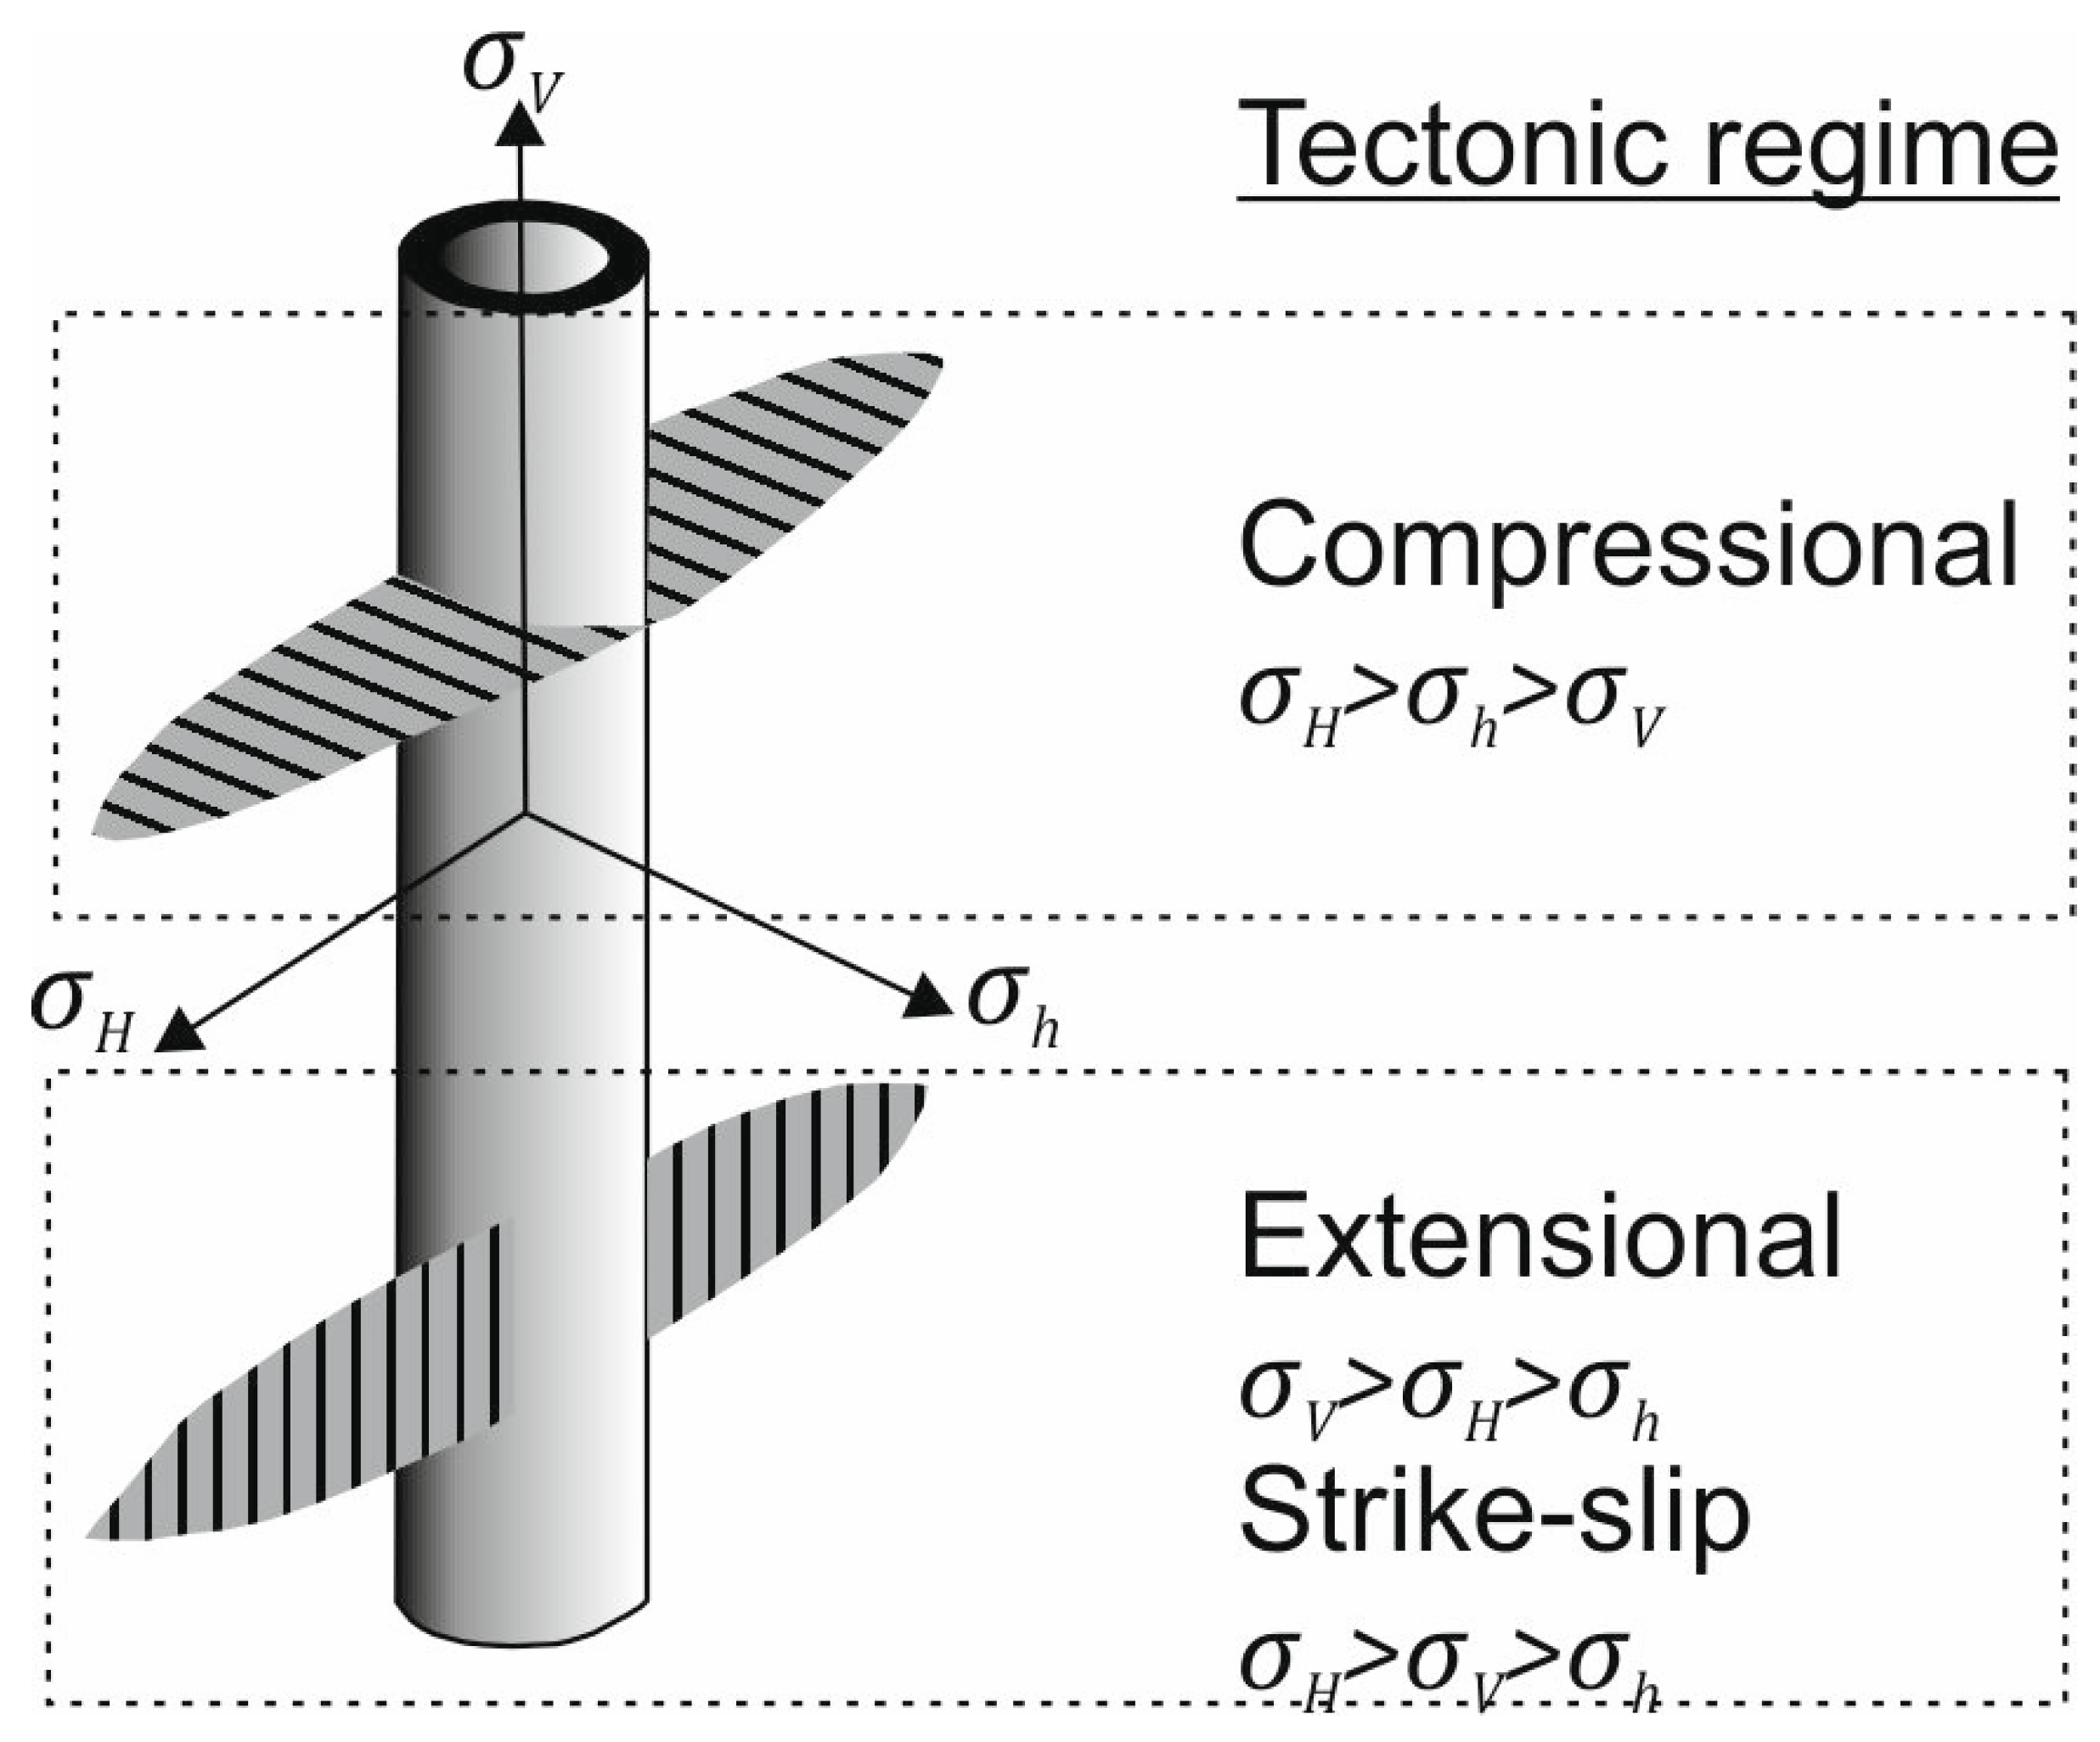
Figure 1. Simplified model of hydraulic fracture geometry depending on the tectonic regime. In the extensional and strike-slip regimes, vertical fractures are formed, whereas in the compressional regime, horizontal fractures dominate. σ V —vertical principals stress, σ H —maximum horizontal stress, σ h —minimum horizontal stress (based on [22]).
Energies 18 02869 g001
Figure 2. Schematic view of the borehole tubing, casing, perforation, and lithology profiles of the Mogilno-Łódź and Karkonosze Mountains area models.
Energies 18 02869 g002
Figure 3. Design of the treatment schedule of the hydraulic fracturing operation in the Mogilno-Łódź area.
Energies 18 02869 g003
Figure 4. Design of the hydraulic fracturing operation in the Karkonosze Mountains area.
Energies 18 02869 g004
Figure 5. Comparison of the average static and dynamic Young’s moduli and Poisson’s ratios of dry rock samples from selected prospective HDR areas in Poland. Dynamic parameters were published by Moska et al. [18].
Energies 18 02869 g005
Figure 6. Relationship between the static and dynamic Young’s moduli of granite from the Karkonosze Mountains and sandstone from the Mogilno-Łódź Trough. Results for dry samples tested under triaxial conditions. Dynamic parameters were published by Moska et al. [18].
Energies 18 02869 g006
Figure 7. A comparison of wave velocities of dry (from [18]) and fully saturated (this study) granite from the Karkonosze Mountains and sandstone from the Mogilno-Łódź Trough in triaxial tests.
Energies 18 02869 g007
Figure 8. A comparison of dynamic Young’s moduli and dynamic Poisson’s ratios of dry (from [18]) and fully saturated (this study) granite from the Karkonosze Mountains and sandstone from the Mogilno-Łódź Trough in triaxial tests.
Energies 18 02869 g008
Figure 9. Variability in the selected fracture geometry parameters as a function of Young’s modulus in the Mogilno-Łódź sandstone formation.
Energies 18 02869 g009
Figure 10. Variability in fracture conductivity, average surface pressure, and embedment as a function of Young’s modulus in the Mogilno-Łódź sandstone formation.
Energies 18 02869 g010
Figure 11. Influence of Young’s modulus on hydraulic fracture characteristics in the Mogilno-Łódź sandstone formation.
Energies 18 02869 g011
Figure 12. Variability in fracture geometry with increasing Young’s modulus in the pay zone of the Mogilno-Łódź HDR area. Fracture shape colors correspond to the following values: green—minimum E s t a t , yellow—average E d y n , navy blue—maximum E d y n for brine-saturated sample, red—hypothetical E for hard sandstone rock above values obtained in the tests (for comparision).
Energies 18 02869 g012
Figure 13. Fracture geometry and visualization of the proppant concentration for a hydraulic fracturing operation in the Mogilno-Łódź sandstone formation, assuming mean values of E and v in the pay zone.
Energies 18 02869 g013
Figure 14. Variability in the selected fracture geometry parameters as a function of Young’s modulus in the Karkonosze Mountains granite formation.
Energies 18 02869 g014
Figure 15. Variability in the fracture conductivity and average surface pressure as a function of Young’s modulus in the Karkonosze Mountains granite formation.
Energies 18 02869 g015
Figure 16. Influence of Young’s modulus on hydraulic fracture characteristics in the Karkonosze Mountains granite formation.
Energies 18 02869 g016
Figure 17. Variability in fracture geometry with increasing Young’s modulus in the pay zone of the Karkonosze Mountains granite formation. Fracture shape colors correspond to the following values: green—minimum E s t a t , navy blue—average E s t a t , blue—average E d y n of fractured samples, yellow—average E d y n of intact samples, red— E of intact granite from the literature [37] for comparision.
Energies 18 02869 g017
Figure 18. Fracture geometry and visualization of proppant concentration for an HF operation in the Karkonosze Mountains granite formation, assuming average values of E and v in the pay zone.
Energies 18 02869 g018
Figure 19. Comparison of mineral and rock mechanics-based brittleness indices of prospective formations in Poland and corresponding rocks in currently operated EGS projects in Western Europe. Based on [16,18].
Energies 18 02869 g019
Table 1. Correlations of fracture parameters and elastic rock parameters. The symbols “−“ and “+” denote negative and positive correlations, respectively.
Induced Fracture ParametersSandstone, Mogilno-Łódź TroughGranite, Karkonosze Mountains
Young’s ModulusPoisson’s RatioYoung’s ModulusPoisson’s Ratio
Half-lengthNo influence
Propped half-length+Not clear
Height+No influenceNo influenceNo influence
Propped height+++Not clear
WidthNo influence
Conductivity+Not clearNot clearNot clear
Surface pressure++++
EmbedmentNo influenceNo influence
Table 2. Comparison of selected data from hydraulic fracturing operations in Groß Schönebeck [12] and Mogilno-Łódź sedimentary HDR numerical modeling (this study).
Treatment ParameterGroßSchönebeck
E GrSk 3/90
Vertical Well
(2002)
Gel/Proppant
Frac I
Groß Schönebeck
Gt GrSk 4/05 A (2)
Horizontall Well
(2007)
Gel/Proppant
Frac I
Groß Schönebeck
Gt GrSk 4/05 A (2)
Horizontal Well
(2007)
Gel/Proppant
Frac II
Mogilno-Łódź Sedimentary HDR Numerical Model, Vertical Well
Gel/Proppant
Frac
Duration, h9.31.521.6
Frac interval, m4140–42004204–42084118–41224060–4080
CompletionOpen holePerforated linerPerforated linerPerforated liner
Max. flow rate, m3/h138240210240
Cumulative volume, m3107280310317
Max. head pressure, bar452350400533
Gel typeHTU/brineCross-linkedCross-linkedCross-linked
Proppant typeCarbo-LtHigh strengthHigh strengthCarboHSP
Mesh size20/4020/4020/4020/40
Proppant mass, kg879695,000113,000103,497
Fracture dimensions
Half-length, m32576061
Height, m721159581
Width, cm0.160.530.531.4 (average)
Table 3. Comparison of selected data from hydraulic fracturing operations in Soultz-sous-Forêts and Landau [52] and Karkonosze Mountains igneous HDR numerical modeling (this study).
Treatment ParameterSoultz GPK2Soultz GPK4Landau GtLa2Landau GtLa2Karkonosze Mountains Igneous HDR Numerical Model, Vertical Well
Massive FracturingLow-Rate InjectionHydraulic StimulationHigh-Rate StimulationMassive Fracturing
Duration, h14484few hoursfew hours55
Max. flow rate, m3/h180108up to 310up to 684252
Cumulative volume m323,40093004060660010,041
Max. net pressure, bar15017010010037
Fluid typeFresh waterFresh waterFresh waterFresh waterSlickwater
Proppant type----High strength
Mesh size/proppant mass, kg----40/70/135,000
Disclaimer/Publisher’s Note: The statements, opinions and data contained in all publications are solely those of the individual author(s) and contributor(s) and not of MDPI and/or the editor(s). MDPI and/or the editor(s) disclaim responsibility for any injury to people or property resulting from any ideas, methods, instructions or products referred to in the content.