Article

The Role of Wastewater Treatment Strategy for Enhancing Energy and Circular Economy in a Residential Building

Department of Building Engineering, College of Architecture and Planning, Imam Abdulrahman Bin Faisal University, Dammam 31451, Saudi Arabia
*
Author to whom correspondence should be addressed.
Energies 2025, 18(11), 2868; https://doi.org/10.3390/en18112868
Submission received: 12 April 2025 / Revised: 21 May 2025 / Accepted: 28 May 2025 / Published: 30 May 2025

Abstract

:
Water scarcity and energy consumption are two pressing global challenges, especially in arid regions, that require sustainable solutions in line with circular economic principles. This study investigates the feasibility of greywater recycling systems for a 10-floor residential building housing 425 occupants by optimizing non-potable water demand and energy consumption. The grey-box modeling approach and energy balance optimization analysis are used to identify effective practices for implementing greywater recycling through the evaluation of environmental and economic effects on the performance of residential buildings. The findings are that there are 18% and 40% savings in water and energy, respectively, with greywater recycling systems. The research concludes that maximum treatment and recovery efficiencies significantly enhance the performance of the systems. Thus, there are 2.25 million kWh of annual energy savings that can repay itself in 4.42 years, as well as savings in the long-term consequences. These findings contribute further to achieving the UN-SDGs on Clean Water and Sanitation (SDG 6) and Affordable and Clean Energy (SDG 7). This study contributes to a better understanding of optimizing greywater recycling systems that are practical and scalable for residential use and promote sustainable urban development with minimal environmental impacts.

1. Introduction

Scarcity of water and sustainable resource use remain among the most urgent environmental issues of the 21st century, particularly in arid zones like Saudi Arabia, where water access is critically constrained [1]. Sustainable Development Goal 6 promotes equitable and efficient water access, encouraging local reuse solutions to support long-term water resilience [2]. Greywater recycling is emerging as a viable solution to reduce freshwater demand and enhance urban sustainability. The subject is particularly notable in Saudi Arabia since water shortage is aggravated in the kingdom by arid desert climatic conditions, scant rainfall, and the excessive utilization of energy-intensive desalting processes. High desalination costs and groundwater depletion further threaten water sustainability in Saudi Arabia [3].
This study contributes a practical framework for evaluating greywater reuse strategies in high-occupancy residential buildings, particularly in regions with limited centralized infrastructure like Saudi Arabia. By using grey-box modeling and energy balance analysis, the work highlights how circular economy principles can be implemented at the building scale to reduce freshwater demand, lower operational energy use, and improve system-level efficiency. The approach serves as a replicable model for resource optimization in other arid regions facing similar constraints.
Greywater reuse plays a growing role in addressing water scarcity in arid regions like Saudi Arabia, where the overall level of reuse remains limited. Treated greywater has been applied in afforestation and irrigation practices [4]. Additionally, international guidelines promote greywater reuse as a strategy for non-potable applications in residential and urban areas, such as toilet flushing and landscape irrigation [5]. Expanding greywater systems could significantly reduce water demand and support the sustainability goals outlined in Saudi Vision 2030 [6].
The concepts of the circular economy have evolved to promote systemic resource efficiency by minimizing waste and maximizing reuse across sectors [7]. With the focus being the reduction of waste and the optimized use of resources, CE principles extend the life cycle of materials through recycling, reuse, and recovery in harmony with sustainable water management strategies [8]. In this respect, greywater recycling within a residential building epitomizes this approach in saving water from showers and sinks, otherwise treated as wastewater for later use in irrigation purposes and flushing toilets. Energy consumption and resource use are further reduced by such usage, especially within arid climates wherein traditional means of water management depend a lot on resource-intensive desalination processes [9]. The circular water economy envisions wastewater to be treated much like any other poorly valued treasure, making greywater one of the cornerstones of sustainable city development [10].
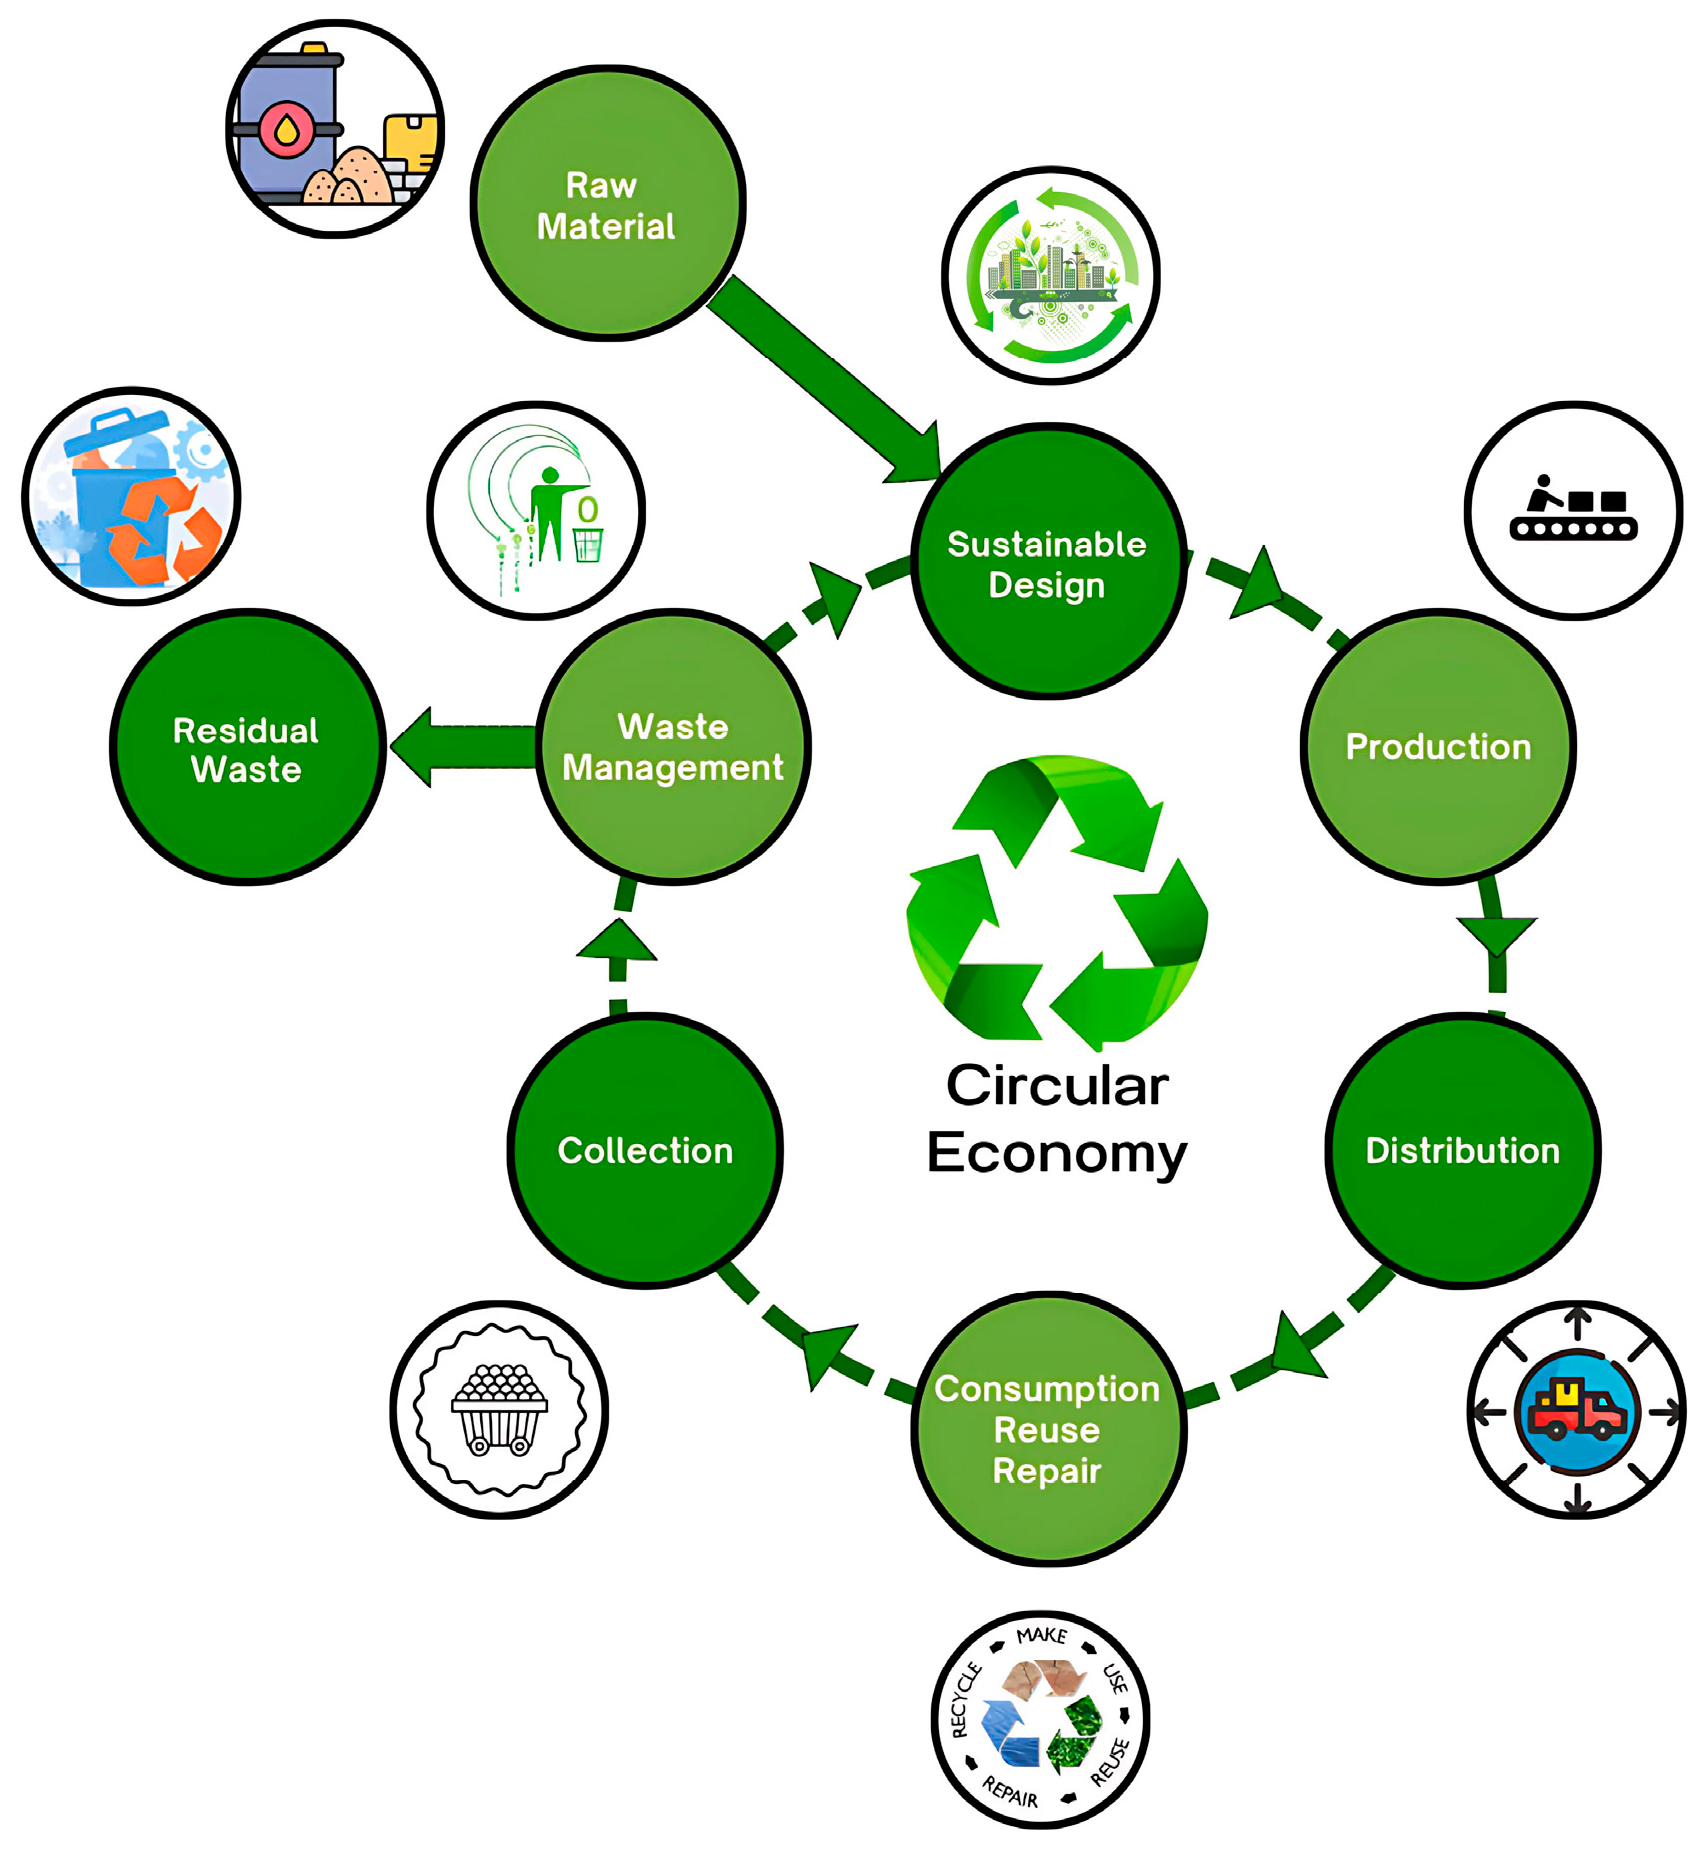
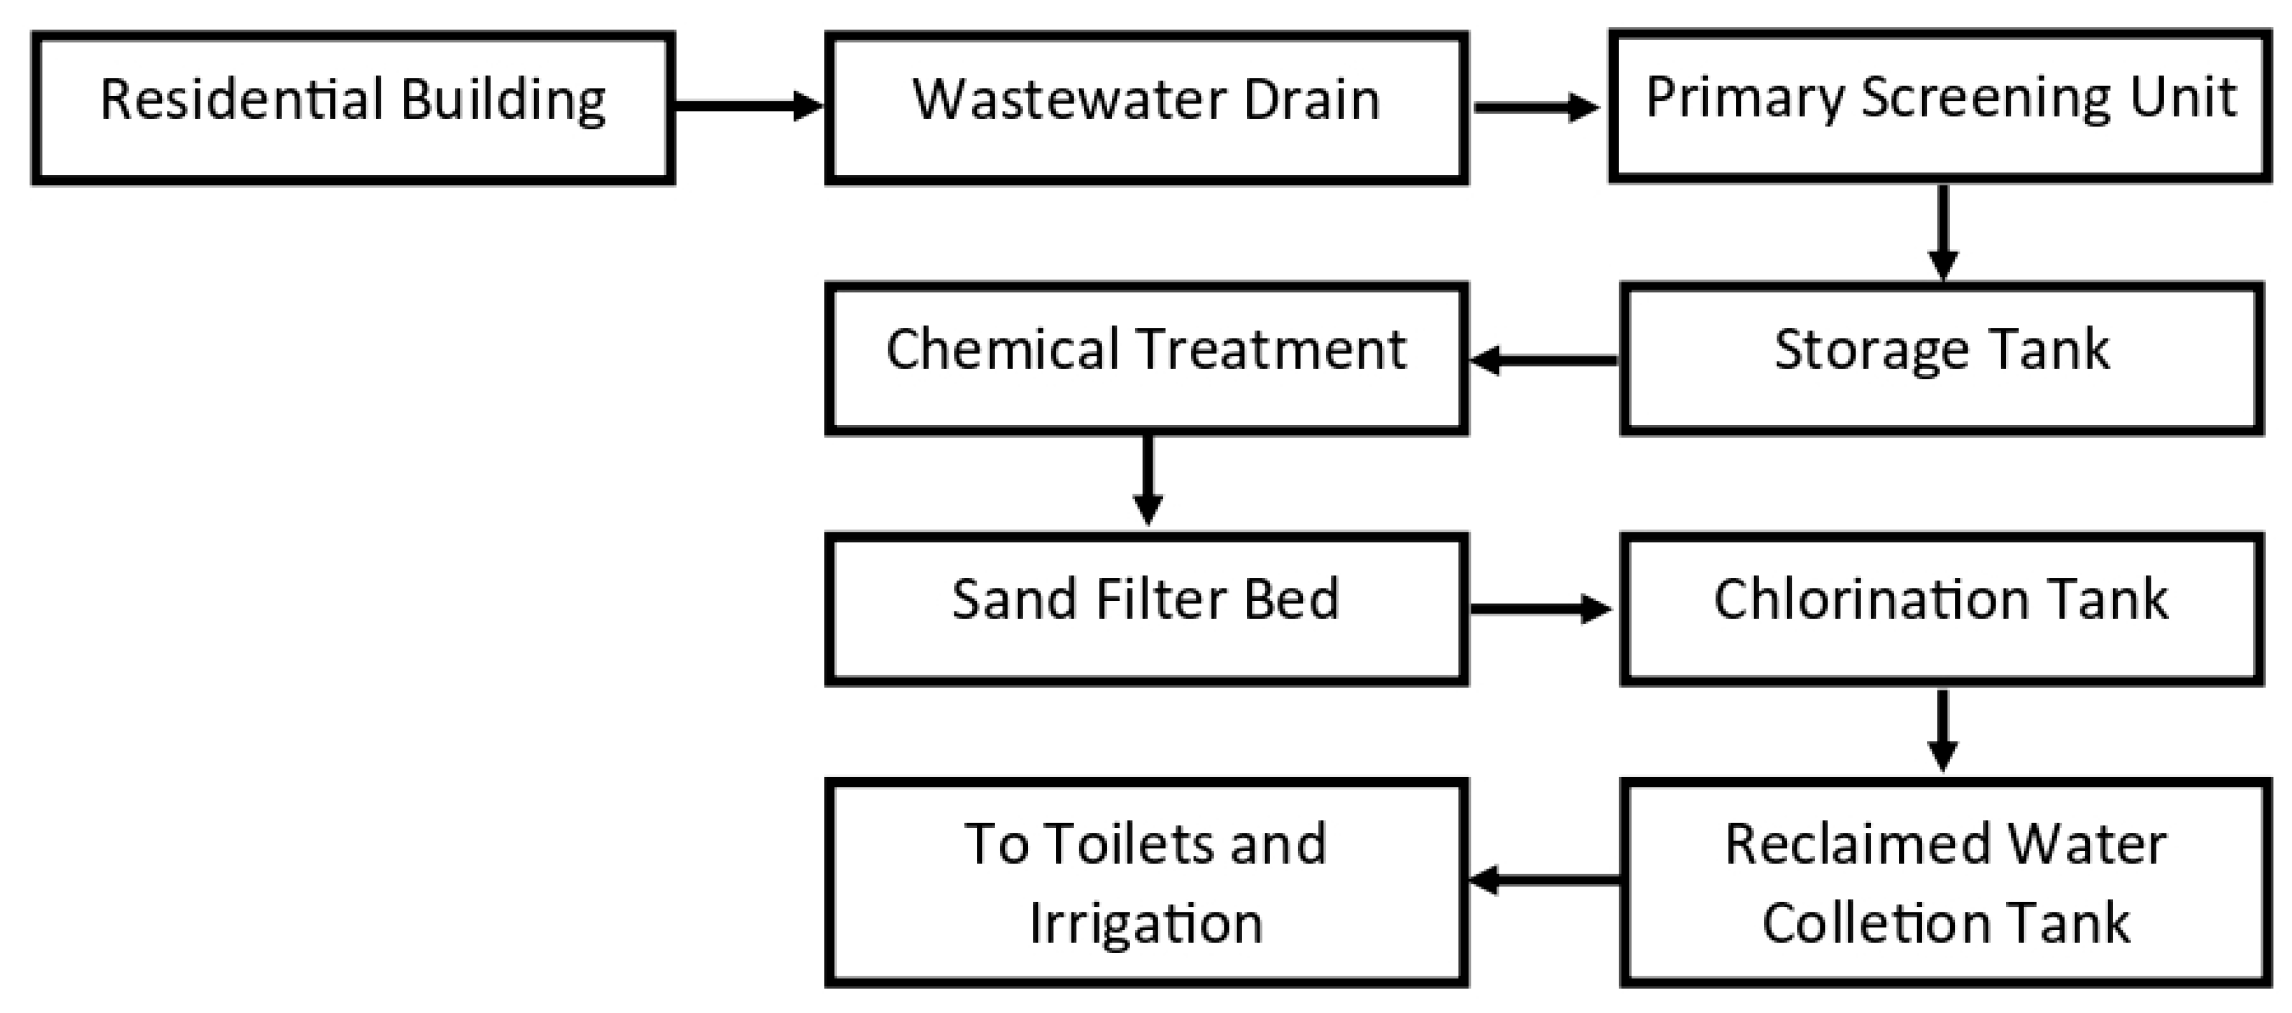
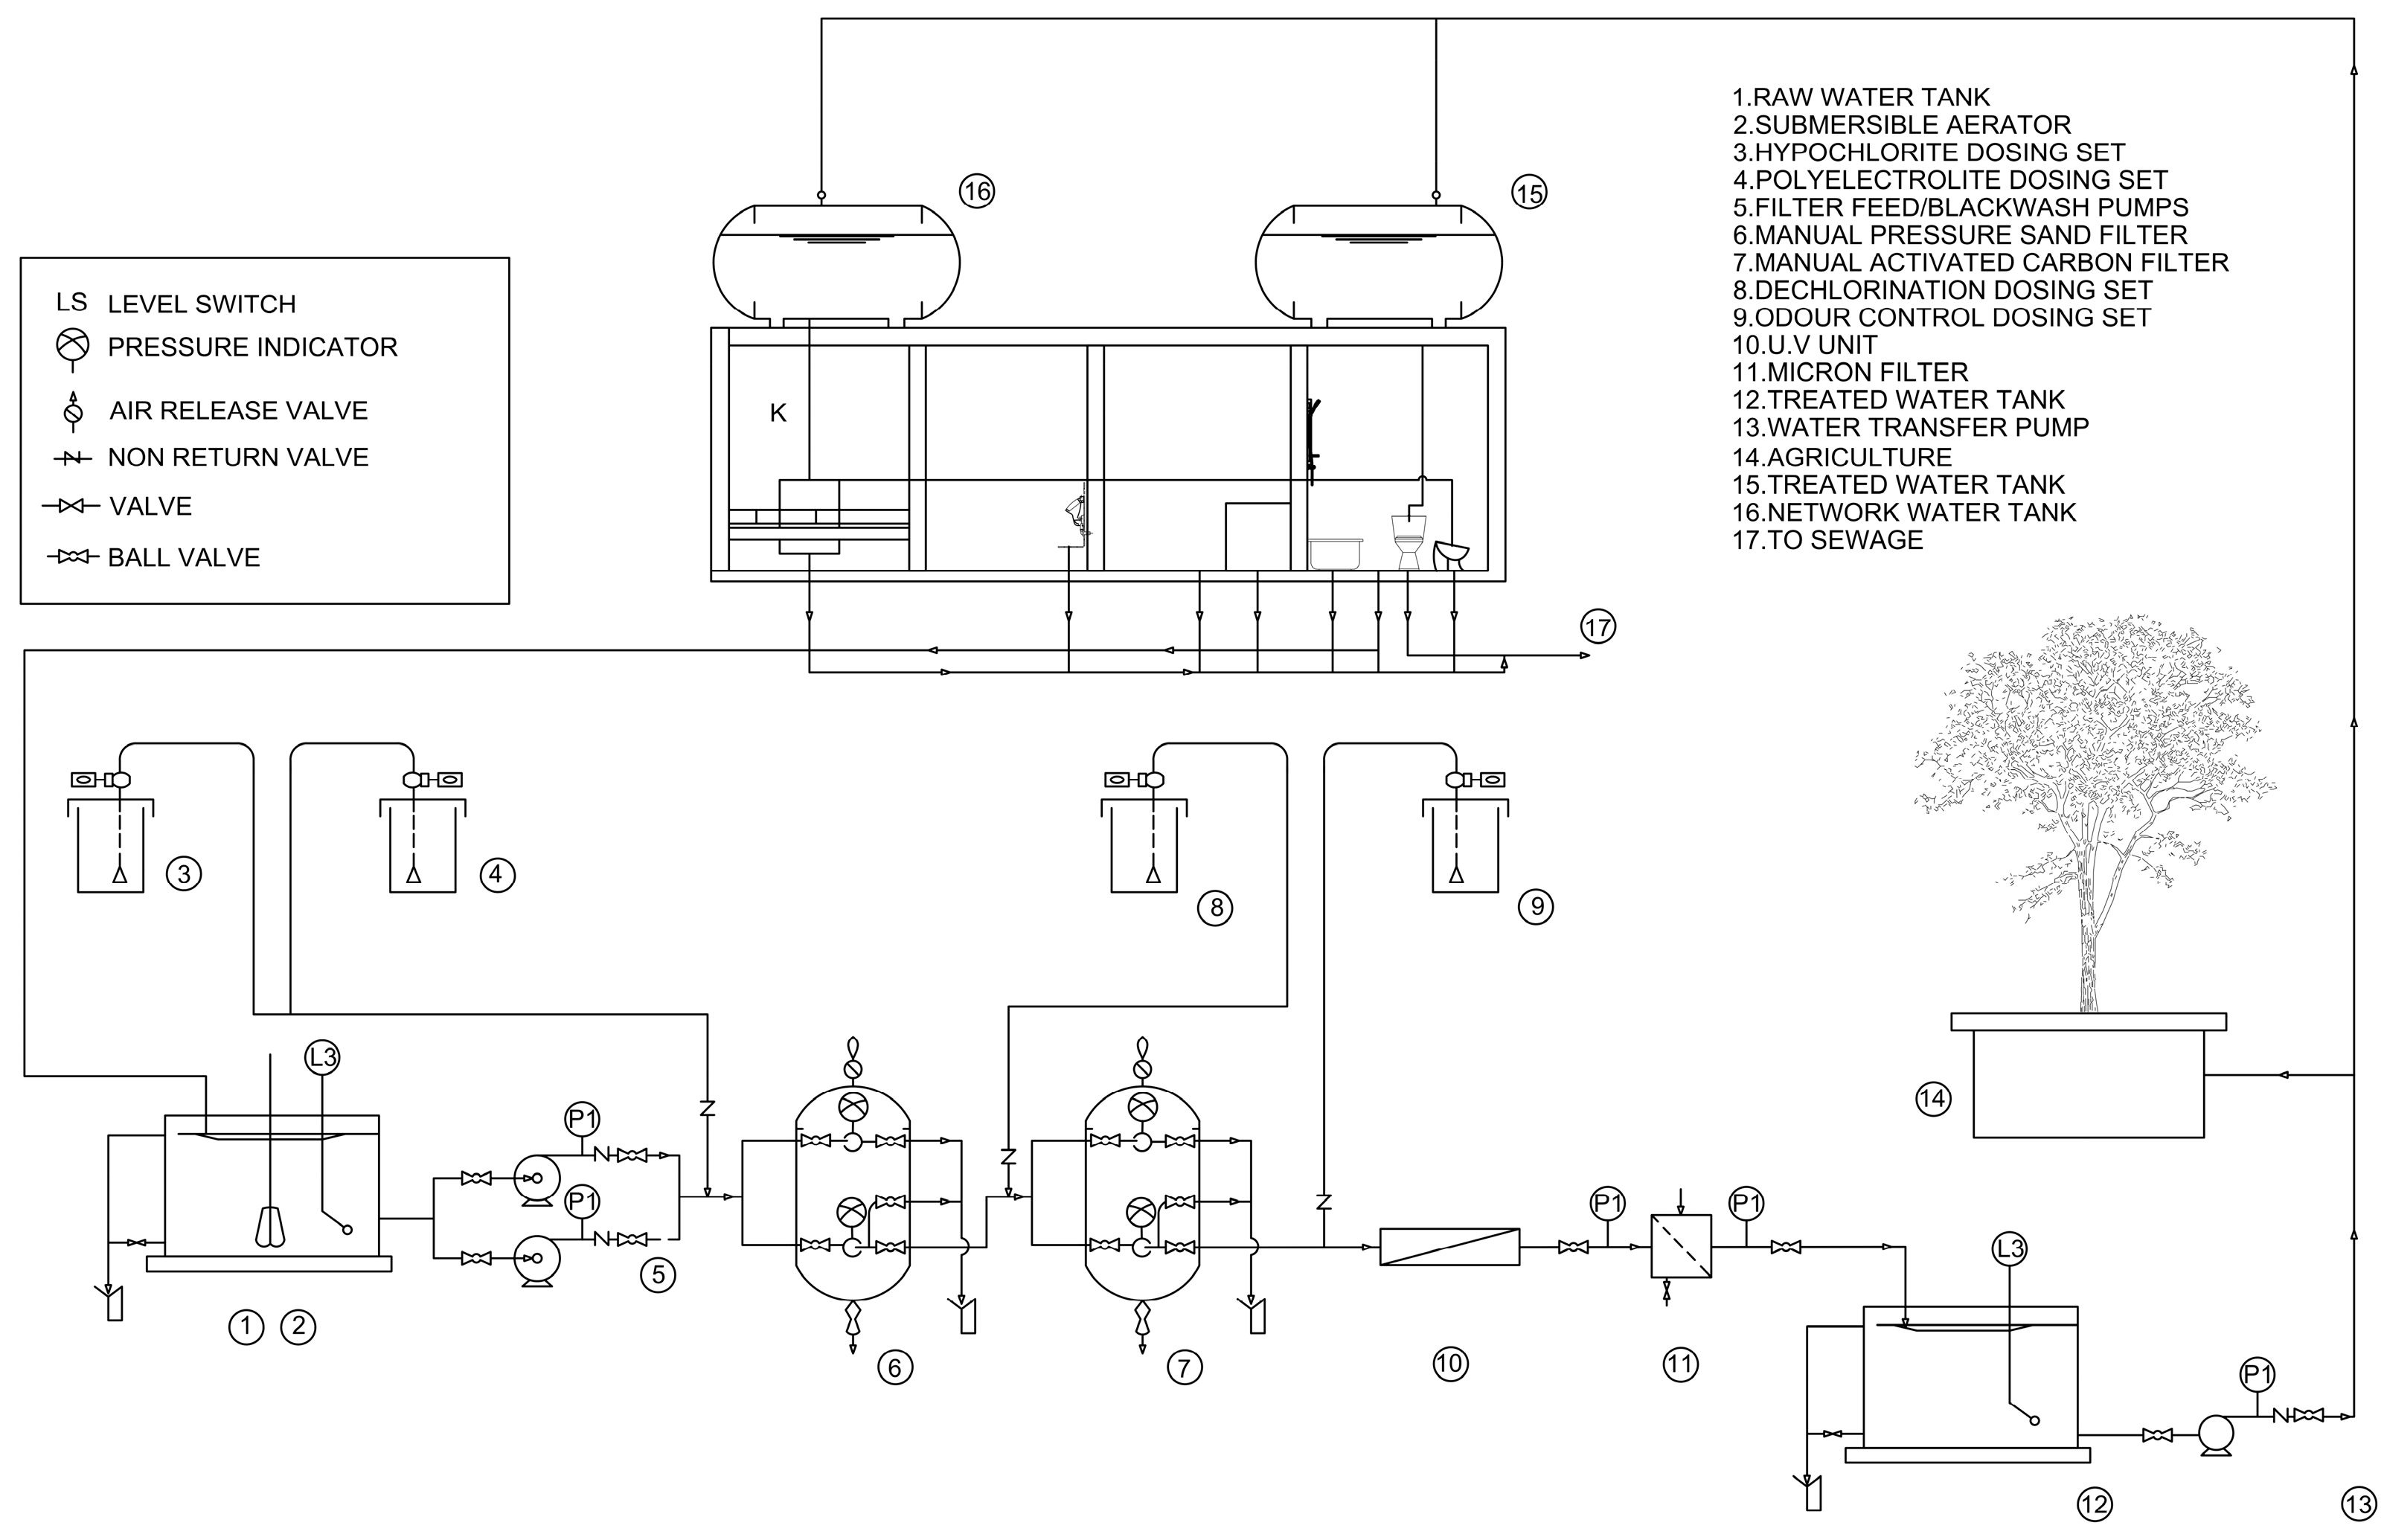
The current domestic water usage in compliance with water resource-friendly usage is indicative of the implementation of water resource-friendly usage. The model aligns with the circular economy principles illustrated in Figure 1, emphasizing greywater separation and decentralized reuse through integrated technologies. Since the guiding philosophy of the CE is to reduce waste, optimize resource use, and extend the life cycle of materials through reusing and recycling, it is in line with sustainable water management. Greywater recycling systems can be regarded as one of the useful applications of the CE in residential buildings by recovering water from non-potable sources, such as showers and sinks, for irrigation and flushing toilets. It will reduce the demand for freshwater, minimize energy consumption, and enhance resource efficiency; hence, CE is in a good position to help solve the issues of water and energy shortage in cities [11]. Apart from that, the approach based on the CE may bring considerable opportunities to reduce GHG emissions from traditional water management systems that include energy-consuming desalination plants, which are extensively used in arid countries such as Saudi Arabia [12]. Although renewable energy sources can mitigate desalination-related emissions in the long run, CE strategies like greywater reuse continue to offer essential advantages, including minimizing freshwater demand and enabling decentralized, resource-efficient systems.
While greywater recycling systems hold great promise, there are certain gaps in economic viability, scaling technologies, and regulatory compliance. Some major challenges are high initial investment costs and advanced treatment technologies that also use a lot of energy to enhance water quality. Such gaps can be achieved through optimization in system performance, energy balance, and economic viability, besides creating awareness among the public and involving policy-level interventions. This will call for an integrated approach using advanced technologies in positioning greywater recycling as a feasible and scalable option for sustainable water management [13].
Water reutilization has become one of the key strategies in combating water scarcity and in realizing sustainable water management because of the increasing pressure on global water resources. It is an approach that contributes to most of the targets of the Goals for Sustainable Development of the United Nations under CE, as it saves resources by minimizing environmental impacts. The literature is quite voluminous on several topics regarding the potential of water reuse in various sectors, embracing technological and policy angles from a regional perspective. This section synthesizes selected insights from five recent studies on the current state of approaches, challenges, and emerging opportunities for water reuse.
Voulvoulis [14] introduced a framework linking water reuse to circular economy (CE) objectives. Fernandes and Marques [15] emphasized CE’s role in reducing water and energy consumption in urban systems. Chen et al. [16] evaluated the feasibility of decentralized greywater reuse through simulation-based analysis. Kordana-Obuch et al. [17] examined the impact of CE principles on end-user behaviors. Dawoud et al. [18] explored the application of treated greywater in GCC countries, highlighting reuse potential under arid conditions. Waly et al. [19] assessed the sustainability of various water reuse strategies for urban areas in the Middle East. Yi-Kai Juan et al. [20] demonstrated how BIM can optimize greywater systems at the building scale. Madhuranthakam et al. [21] analyzed economic and environmental outcomes of integrating hybrid greywater technologies. Mannina et al. [22] investigated drivers of user acceptance and the performance of decision-support tools in greywater reuse projects. Neczaj and Grosser [23] discussed the role of wastewater treatment plants (WWTPs) in circular economy systems, emphasizing their potential for reuse in agriculture and urban areas, as well as for biogas and nutrient recovery in smart cities. A comparative summary of these studies is presented in Table 1.
These studies have established water reuse as a transformative approach across various applications. Progress in technology, policy alignment, and public awareness shows promise for improving adoption. However, key barriers remain, including inconsistent policies, stakeholder fragmentation, and limited acceptance. Addressing these challenges will require harmonized regulations, multi-level cooperation, and innovative design to ensure water reuse contributes effectively to mitigating global water scarcity while minimizing environmental impact.
Water recycling includes three main categories: greywater, blackwater, and stormwater, each with distinct sources and treatment requirements. Greywater, originating from sinks, showers, and laundry, contains fewer contaminants and is easier and cheaper to treat, making it ideal for non-potable uses like flushing and irrigation in residential buildings. In contrast, blackwater, generated from toilets and kitchens, requires advanced treatment due to its high pathogen load. Stormwater reuse depends on rainfall and runoff patterns, making it less predictable. Among these, greywater stands out as the most feasible and reliable option for sustainable residential applications due to its steady availability, lower energy demands, and treatment simplicity. Despite this progress, research gaps persist in optimizing greywater reuse systems for energy efficiency, domestic-scale cost performance, and modeling accuracy.
Accordingly, this study aims to evaluate the performance of a decentralized greywater recycling system in a 10-floor residential building in Saudi Arabia using grey-box modeling. The focus is on assessing energy savings, economic feasibility, and system scalability within the framework of sustainable urban development.

2. Materials and Methods

2.1. Overview

The circular economy (CE) mindset is instrumental in the sustainable utilization of water resources since it makes efficient use of resources, saves freshwater usage, and reduces wastewater discharge. The method is schematically illustrated in Figure 2. It is preceded by screening the current state of the art in the literature and follow-up information collection about water forms for recycling, energy use, and water benchmarks. The water recycling plan will be evaluated based on grey-box modeling and simulation. The optimized solutions will be compared and evaluated statistically in order to recommend top-level strategies for water recycling and energy improvement.

2.2. Data Collection

Table 2 shows the information about the building. Figure 3 illustrates the global and regional water consumption trends, which provide context for water demand within residential sectors. Figure 4 shows the 3D and typical floor plan of the residential building.
Figure 3a is indicative of domestic water usage worldwide for the period 2021–2024. It can be observed that there is a dip in water usage in the year 2024 by 1.28% compared to previous years, indicative of the worldwide conservation movement. Figure 3b is indicative of the domestic water usage trend for the Asia zones. The peak usage rise in the year 2021 is nearly 4.21%, and though it fell to −1.94% in the year 2022, for subsequent years, there is a slight rise in usage in the form of 0.53% and 0.47%. The values indicate that there is still scope for improvement with some interventions like water recycling and water reuse [24]. Domestic water usage in Saudi Arabia is still a serious problem due to excessive usage and the excessive utilization of desalinated water. Even though there are nationwide conservation practices in place, there is still a rise in water demand in the country as a result of population and urbanization [3].

2.2.1. Architectural Design and Energy Consumption

It is estimated that the energy consumption in buildings amounts to 453 kWh/m2/year, a factor of the energy intensity that needs to be maintained indoors to meet comfort and operational needs. This emanates from such aspects as thermal insulation, glazing, orientation, and ventilation efficiency. Though the current research will mainly dwell on water recycling, there is a need to understand this energy consumption baseline since the energy that may be saved in water recycling systems, such as lower pumping and heating demand, will have a great implication for the sustainability of the building.

2.2.2. Water Baseline

Figure 5 shows the building summary generated by Autodesk® Green Building Studio and provides an overview of water usage for various building fixtures. Indoor Water Factors showing occupancy are shown in Table 3, and annual water consumption in Table 3 indicates indoor = 27,640,861 L and outdoor = 444,056 L. Thus, based on the results, indoor water use is very high; therefore, an indoor water-saving strategy should be targeted. Though outdoor water use is very low, it can also be further optimized to be more sustainable.

2.3. Modeling and Analysis

2.3.1. Simulation Approach

This study adopts a Model-Based Operational Performance Optimization method to evaluate greywater recycling under real operational conditions. The approach enables testing various strategies and configurations for energy and water efficiency, allowing for a sensitivity analysis of water demand patterns, energy costs, and treatment technologies. This flexible simulation process aligns with the goal of identifying a cost-effective strategy that supports sustainability and national goals like Saudi Vision 2030.

2.3.2. Grey-Box Modeling (Input)

Grey-box modeling combines theoretical water and energy flow equations with empirical building data to simulate complex interactions between greywater generation, treatment, and reuse. This model supports scenario analysis for system optimization by evaluating the energy and economic efficiency of recycling configurations. Daily greywater from sinks, showers, and laundry is collected and treated for non-potable reuse such as flushing and irrigation. Simulations help identify configurations that maximize water reuse and minimize operational energy and cost. Table 4 provides the model inputs, including consumption values, treatment efficiencies, and energy requirements.
The daily greywater volume was estimated based on 70% of total indoor water consumption, consistent with common residential usage patterns. Treatment energy consumption values were derived from manufacturer specifications for advanced filtration and disinfection systems used in similar residential applications.

2.3.3. Mathematical Modeling (Simulation)

A MATLAB-based model is used to simulate the system’s performance by integrating water consumption, greywater production, recycling efficiency, and energy use. Key performance metrics include recycled water volume, net freshwater savings, energy use, and operational cost. Numerical calculations are essential to solve the system of Equations (1)–(7), which are nonlinear and interdependent. Iterative simulations allow for the dynamic adjustment of parameters such as greywater availability, treatment efficiency, and energy cost under various operational conditions. This ensures the accurate estimation of system performance over time, especially when accounting for fluctuations in water demand, variable treatment rates, and energy tariffs. The use of MATLAB R2024b supports this process through looped calculations and scenario testing, yielding optimized system configurations. Equations (1)–(7) define the mathematical relationships used, and Table 5 describes all the variables.
Greywater Generation [25]:
Q g r e y w a t e r = Q i n d o o r × P
Effective Greywater Collected [25]:
Q c o l l e c t e d   = Q g r e y w a t e r   × η c o l l e c t i o n
Recycled Water Volume [26]:
Q r e c y c l e d   = Q c o l l e c t e d   × η r e c y c l i n g
Net Water Savings [27]:
Q s a v i n g s = Q r e c y c l e d Q f r e s h w a t e r
Energy Consumption [26]:
E r e c y c l i n g = Q r e c y c l e d × e s y s t e m
Operational Cost [28]:
C o p e r a t i o n = ( Q r e c y c l e d × c m a i n t e n a n c e ) + ( Q r e c y c l i n g × c e l e c t r i c i t y )
Cost-Effectiveness [29]:
C n e t = C s a v i n g s C o p e r a t i o n

2.3.4. Water Recycling Strategy

This shall deal comprehensively with the recycling of water and optimizing the reutilization of water at residential buildings by keeping in view the prime factors of energy consumption and cost-effectiveness. Properly combining technical design, efficiency in operation, and economic viability can maximize water savings along with sustainability, as presented in Figure 6. The proposed solution for residential buildings in Riyadh, considering advanced treatment processes and greywater recycling, will be addressed by considering its climatic and regulatory context.
  • Wastewater drain
Wastewater from bathing, washing, and laundry is collected through the HDPE pipe network within the plumbing system. A flow of 140 L/person/day with a building occupancy of 100 residents translates to about 14,000 L/day that can be handled in the pipes. The pipes will be laid underground with a slope of 1.5% to ensure flow by gravity towards the primary screening unit. It is imperative that the draining system be inspected every 90 days and that it can run without interruption.
2.
Primary Screening Unit
A submersible first-order screening unit is placed at a location close to where the wastewater comes out. This retains nearly 98% of the larger solids, including hair, paper, and plastic, thereby preventing them from choking the downstream system with solid elements. Screens have a typical manufacturing size of 7 mm and provide the required international standard for pre-treatment. It ensures the effectiveness of at least 95% efficiency in keeping the solids behind, thereby allowing the major flow through. In this case, 13,720 L/day is the total passing through from the initial flow of 14,000 L/day entering it; meanwhile, around 280 L/day of retained solid wastes are removed by hand at each end of the week. This shall be performed every 7 days.
3.
Storage Tank
It has a 10,000-liter underground storage tank capacity, good for almost one day’s wastewater flow from the building, allowing the sedimentation of fine particles and about 75% removal of suspended solids before the water undergoes chemical treatment. In this case, for example, from 13,720 L/day of pre-treated water, about 10,290 L/day of water becomes clarified after sedimentation. The sludge in the tank is cleaned every 30 days, while daily operations ensure it always meets the demand for the treatment system.
4.
Chemical Treatment
The chemical treatment unit, placed next to the storage tank, has automatic dosing pumps, allowing the dosing of coagulants in water and chlorine. Taking into consideration the minimum required removal efficiency of 95%, the treated effluent reaches the WHO standards for safe non-potable reuse. The removal of 98% of the pathogens and fine particles is done through this unit; therefore, out of the 10,290 L/day fed into the unit, a volume of roughly 10,085 L/day will be treated. The refilling of the chemical dosing system will be performed every 15 days, while processes keep running with a total retention time of 25 min.
5.
Sand Filter Bed
The remaining fine particles and turbidity of the chemically treated water are removed by the sand filter bed that is placed underground in a chamber. It is also filtered using fine sand with an effective particle size of 0.6 mm, with a filtration efficiency of 99%, whereas the international standard for filtration efficiency to be considered for reuse of greywater is 95%. Out of the 10,085 L/day feeding the sand filter, approximately 9985 L/day passes through it, as around 100 L/day is lost in backwashing. Backwashing is performed every 7 days, and the system can be used continuously for daily flows.
6.
Chlorination Tank
A 750-liter chlorination tank has been set underground/inside the treatment room for disinfection of the filtered water. The chlorination dosing system is automated and adjusts up to a residual chlorine of 8 mg/L to kill the remaining pathogens. This is higher than the WHO-recommended standards for water that is non-potable. This tank was 100% disinfected, therefore serving the entire 9985 L/day flow. Chlorine is added to the tank every 15 days, and the tank is checked every 30 days for its proper functioning.
7.
Reclaimed Water Collection Tank
The treated greywater utilized for non-potable purposes is stored in an underground buried reclaimed water collection tank with a volume of 12,000 L. Without recontamination, it is safe for this tank to hold treated water for a maximum of 48 h, supplying 60% for toilet flushing at 5991 L/day and 40% for irrigation at 3994 L/day. The inside of the storage tank is cleaned and disinfected once every 60 days, and continuous level sensors detect how much water is inside the tank to provide a regular supply.
8.
Toilets and Irrigation
The reclaimed water is distributed for non-potable applications, such as toilet flushing and irrigation, reducing the use of fresh potable water.
The overall configuration and flow path of the greywater treatment and recycling system is shown in Figure 7, outlining each stage from greywater collection to treated water reuse.
In this system, greywater is separated at the apartment level using a dedicated HDPE pipe network that isolates wastewater from showers, sinks, and laundry from blackwater sources such as toilets and kitchens. Each apartment unit is connected to a vertical shaft that directs greywater to the centralized treatment system located in the basement. Once treated, the reclaimed water is stored in a dedicated tank and distributed back to the apartments via a dual plumbing system, primarily for toilet flushing. A secondary network supplies surplus water for landscape irrigation. Flow control is managed by automated valves and level sensors to prevent backflow and ensure proper operation.

2.4. Optimization Method

Energy balance is a methodology to quantify the energy inputs and outputs in a system to determine how efficient and productive the system is. Energy inputs were determined based on the energy consumption rates of filtration and UV disinfection systems, expressed in kWh per cubic meter, as provided by equipment manufacturers. Energy outputs represent the avoided energy use from reduced freshwater supply (especially desalination) and domestic water heating. The optimization process used the energy balance method, testing different values of collection and treatment efficiencies to identify the configuration that achieves maximum net energy savings while maintaining the required performance standards. In the context of this research, it means weighing the energy that must be spent operating the greywater recycling system, such as filtration, UV treatment, and membrane bioreactors, against the energy savings due to reduced heat use by water or a decrease in reliance upon external sources of water. The energy balance principle is a consequence of the conservation of energy, based on the assumption that all entering energy is accounted for as useful output, stored energy, or losses.
This would be the approach used in the study since it is very clear concerning the evaluation of energy efficiency for the chosen water recycling system. The quantification of the energy inputs and outputs in the analysis will help in ascertaining how effective a system is with regard to its operation and to ascertain exactly its sustainability and practicality for implementation in residential buildings. The energy balance will fit the research perfectly since it only deals with a single system and meets the objective of the study, ensuring that water gets reutilized with the least consumption of energy. It will ensure that the selected strategy is environmentally sustainable and complies with energy conservation goals.

2.5. Environmental and Economic Assessment Method

This section describes in detail the significant environmental and economic advantages of the greywater recycling system, underlining the sustainability and saving of resources. From the most relevant indicators of savings in freshwater and energy consumption and with an estimation of costs, the results confirm the long-term advantages derived from this type of system in a residential environment.
  • Environmental impact
This greywater recycling system reduces the demand for freshwater supplies through the reutilization of water in non-potable uses, such as irrigation and flushing toilets. Reutilization has, to a certain extent, reduced the natural aeration of water, an important feature of countries with scarce water, such as Saudi Arabia. However, the system has minimized the amount of wastewater that is being discharged into the environment, hence reducing the environmental footprint caused by conventional methods of managing water. The energy balance analysis, therefore, underpins the savings associated with this category with the reduction target, ensuring that the resultant emissions of greenhouse gases contribute to the global efforts on the mitigative aspects of climate change. Hence, the environmental benefits address the sustainability objectives stated in Vision 2030.
  • Economic feasibility
The financial viability of having a greywater recycling system was scrutinized to find out its feasibility, as well as its sustainability. Thereafter, this would be useful to a policy- or decision-maker seeking to invest in water conservation technologies that meet environmental objectives, coupled with reducing costs. The installation and operation costs were priced at average prices from two leading companies involved in water treatment solutions. To improve clarity, Table 4 has been updated to include a new column that shows the actual input values used for the financial evaluation, including capital cost, operating cost per m3, daily capacity, and water tariff assumptions. This will provide a fair and representative market basis for our financial calculations. We use Equations (8)–(12) to represent the payback period [30,31], and Table 6 describes all the variables.
Days in Lifespan [30]:
T = L × D
Daily Capital Cost Per Cubic Meter [31]:
C c a p = I T × C d
Total Daily Treatment Cost Per Cubic Meter [31]:
C t = C c a p + C o p
Annual Savings [30]:
S = C d ×   C n w C t   × d
Payback Period [30]:
P = I S

3. Results

3.1. Water-Saving Result

This section evaluates the annual water savings resulting from using the greywater recycling system. Indeed, it was observed that there was a significant reduction in non-potable water demand and effective apportioning of the treated greywater to various non-potable uses, such as irrigation and toilet flushing. These findings highlight the effectiveness of greywater recycling in promoting sustainable water management.
Figure 8 presents the annual water distribution across indoor use and outdoor use and the total water savings achieved through the greywater recycling system. Indoor water consumption accounts for the largest portion, at over 27.6 million liters per year, while outdoor use totals approximately 444,056 L. The system achieves a substantial savings of 14.8 million liters annually, demonstrating the potential of greywater reuse to reduce freshwater demand and support sustainability goals.
Figure 9a shows the treated greywater apportionment: annual treated greywater apportionment by use. Toilet flushing, at an estimated 8,881,009 L per year, is the largest use, followed by irrigation at an estimated 5,920,672 L per year. For irrigation, the difference between the assumed use of 444,056 L and the greywater allocated shows the capacity to support additional demand for irrigation, accounting for increased landscape size, evaporative losses, and/or contingencies. It is important to note that the 5.9 million liters allocated for irrigation represents the system’s maximum reuse capacity, not the current irrigation demand. This surplus accounts for potential landscape expansion, seasonal irrigation peaks, and contingency storage. Figure 9b shows the distribution of the use of treated greywater: a pie chart showing 60% for toilet flushing and 40% for irrigation. This result shows the flexibility and efficiency of the system in reducing demand for potable water and subsequently improving sustainable water management, in line with Saudi Vision 2030.

3.2. Energy Balance Analysis

The second section balances energy aspects related to the greywater recycling system by putting energy use in perspective with energy savings brought about by the system. The result is that the energy consumption required to run the system balances out against the amount of energy saved because of reduced overall residential water management.
Table 7 presents a summary of annual energy use and the associated savings from the implementation of a greywater recycling system. The total building energy consumption is estimated at 2,265,000 kWh/year. The greywater treatment system consumes approximately 9868 kWh/year, which is minimal compared to the total energy demand. As a result, net annual energy savings from reduced heating and desalination demand amount to 23,025 kWh/year, reflecting the efficiency and impact of the proposed system. Although greywater is not reused for domestic hot water, reducing the overall freshwater consumption decreases the volume of water entering the domestic hot water system, resulting in indirect energy savings. This energy reduction includes indirect savings due to lower freshwater demand for applications that would otherwise involve heating, such as showering or handwashing.
Hence, keeping track of water use and treating it accordingly through a circular economy strategy can also significantly lower energy demand from desalination. Table 7 also presents a comparison of the total building energy, recycling energy, and net energy savings. The results show that greywater recycling strongly reduced energy use, a fact that further solidifies its function in strengthening the energy efficiency of and reducing the overall energy footprint of a building.
It follows that the overall results indicate a minimum energy input for operating this greywater recycling system and, hence, a meaningful energy offset when compared to the system’s energy input, although the impact is small relative to total building energy consumption. The results depict that a feasible energy-efficient residential water recycling system is constructible as a contribution towards the sustainability goals of Saudi Vision 2030. From the energy balance, it is obvious that the greywater recycling system under consideration supports water conservation and energy efficiency; hence, this system belongs to the concept of a sustainable building.

3.3. Economic Results

After a keen economic calculation, a greywater recycling system was seriously considered, not just for its economic returns but also for sustainability. The initial capital expenditure and annual recurring expenditure of the system were approximated based on the average rate of two water treatment companies. From these values and typical economic formulae for infrastructure projects, we approximated the payback period of the system. With precise calculation, we realized that it was exactly 4.42 years. That is, between 4 years and 5 months is the period when the expenditure on the greywater recycling system recovers its savings. The finding indicates that the greywater recycling system can achieve significant economic returns besides its environmental returns, and hence can be a very viable, cost-effective solution for water sustainability. This finding conforms with research conducted by Yi-Kai Juan et al. [20] on the Interior Customized Greywater System for residential buildings, where the same 4-year payback period under rising water rates has been achieved. The closeness of this finding indicates that the use of recycled water from wastewater remains a viable economic solution under other settings, with minimal variations in their payback periods being contributed from variations in the scale of the systems, their expenditure structures, and regional water tariffs.

3.4. Saving Optimization

This section shows how the optimization analysis of the greywater recycling system is performed, relating collection efficiency vs. treatment efficiency and the resulting net energy savings. The results will provide an understanding of the optimal setup for maximum energy efficiency and sustainability.
Figure 10a presents an optimization analysis contour plot showing annual net energy savings as a function of collection and treatment efficiencies. The contour plot indicates that higher collection and treatment efficiencies lead to increased energy savings. Specifically, increasing collection efficiency from 70% to 95% and treatment efficiency from 80% to 95% results in net energy savings remaining constant at approximately 2.258 million kWh annually. These findings underscore the importance of optimizing both parameters to achieve maximum system performance. Figure 10b presents optimization results in 3D representation: a three-dimensional chart illustrating the relationship between collection efficiency, treatment efficiency, and net energy savings. The 3D visualization clearly shows that higher efficiencies in both collection and treatment yield greater energy savings, continuing the trends observed in the contour plot. The interaction between these parameters demonstrates that while efficiency improvements are beneficial, the most significant energy savings are achieved when both are simultaneously optimized.
From the considerations above, the greywater recycling system should be designed to achieve the highest feasible collection and treatment efficiencies. Although a 100% collection efficiency may not be realized for technical and economic reasons, efficiencies above 90% will ensure substantial energy savings while sustaining the reliability and cost-effectiveness of the system. Regular maintenance and monitoring tasks should also be performed on the system to sustain its peak performance over its operating life.
These findings underline the optimization potential of greywater recycling systems in contributing toward significant energy efficiency gains while bearing in mind sustainability goals like Saudi Vision 2030. Therefore, this system will be able to bring maximal benefit both environmentally and economically by way of the strategic optimization of the necessary parameters for the resource management of residential buildings in support of sustainability.

4. Discussion

This research confirms that greywater recycling systems reduce the water and energy demand of residential buildings. It supports previous studies pointing to the promise of greywater recycling in making resource efficiency and sustainability more achievable. For instance, Kordana-Obuch et al. [
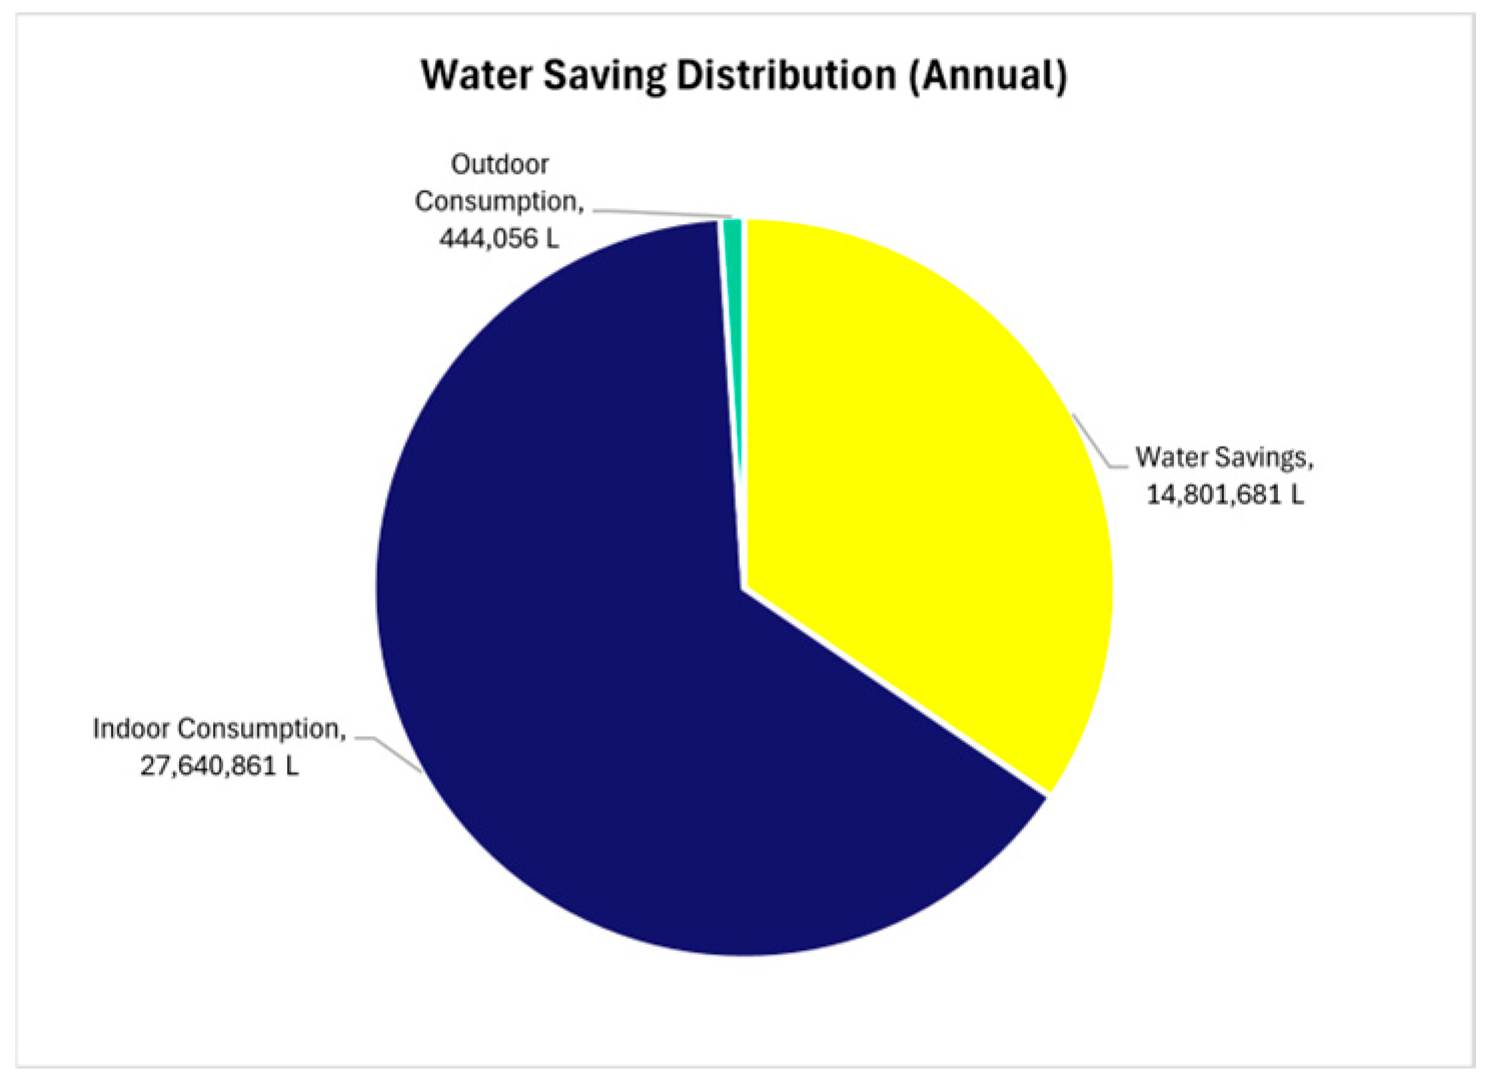
17] highlighted the double dividends of saving potable water demand and greenhouse gas emissions from greywater recycling, and they identified that many key barriers exist, such as high investment costs and public acceptance problems. Similarly, this study corroborates their results, with water savings of 14.8 million liters annually and a net energy savings of more than 2 million kWh, as a result of enhanced collection and treatment efficiencies.
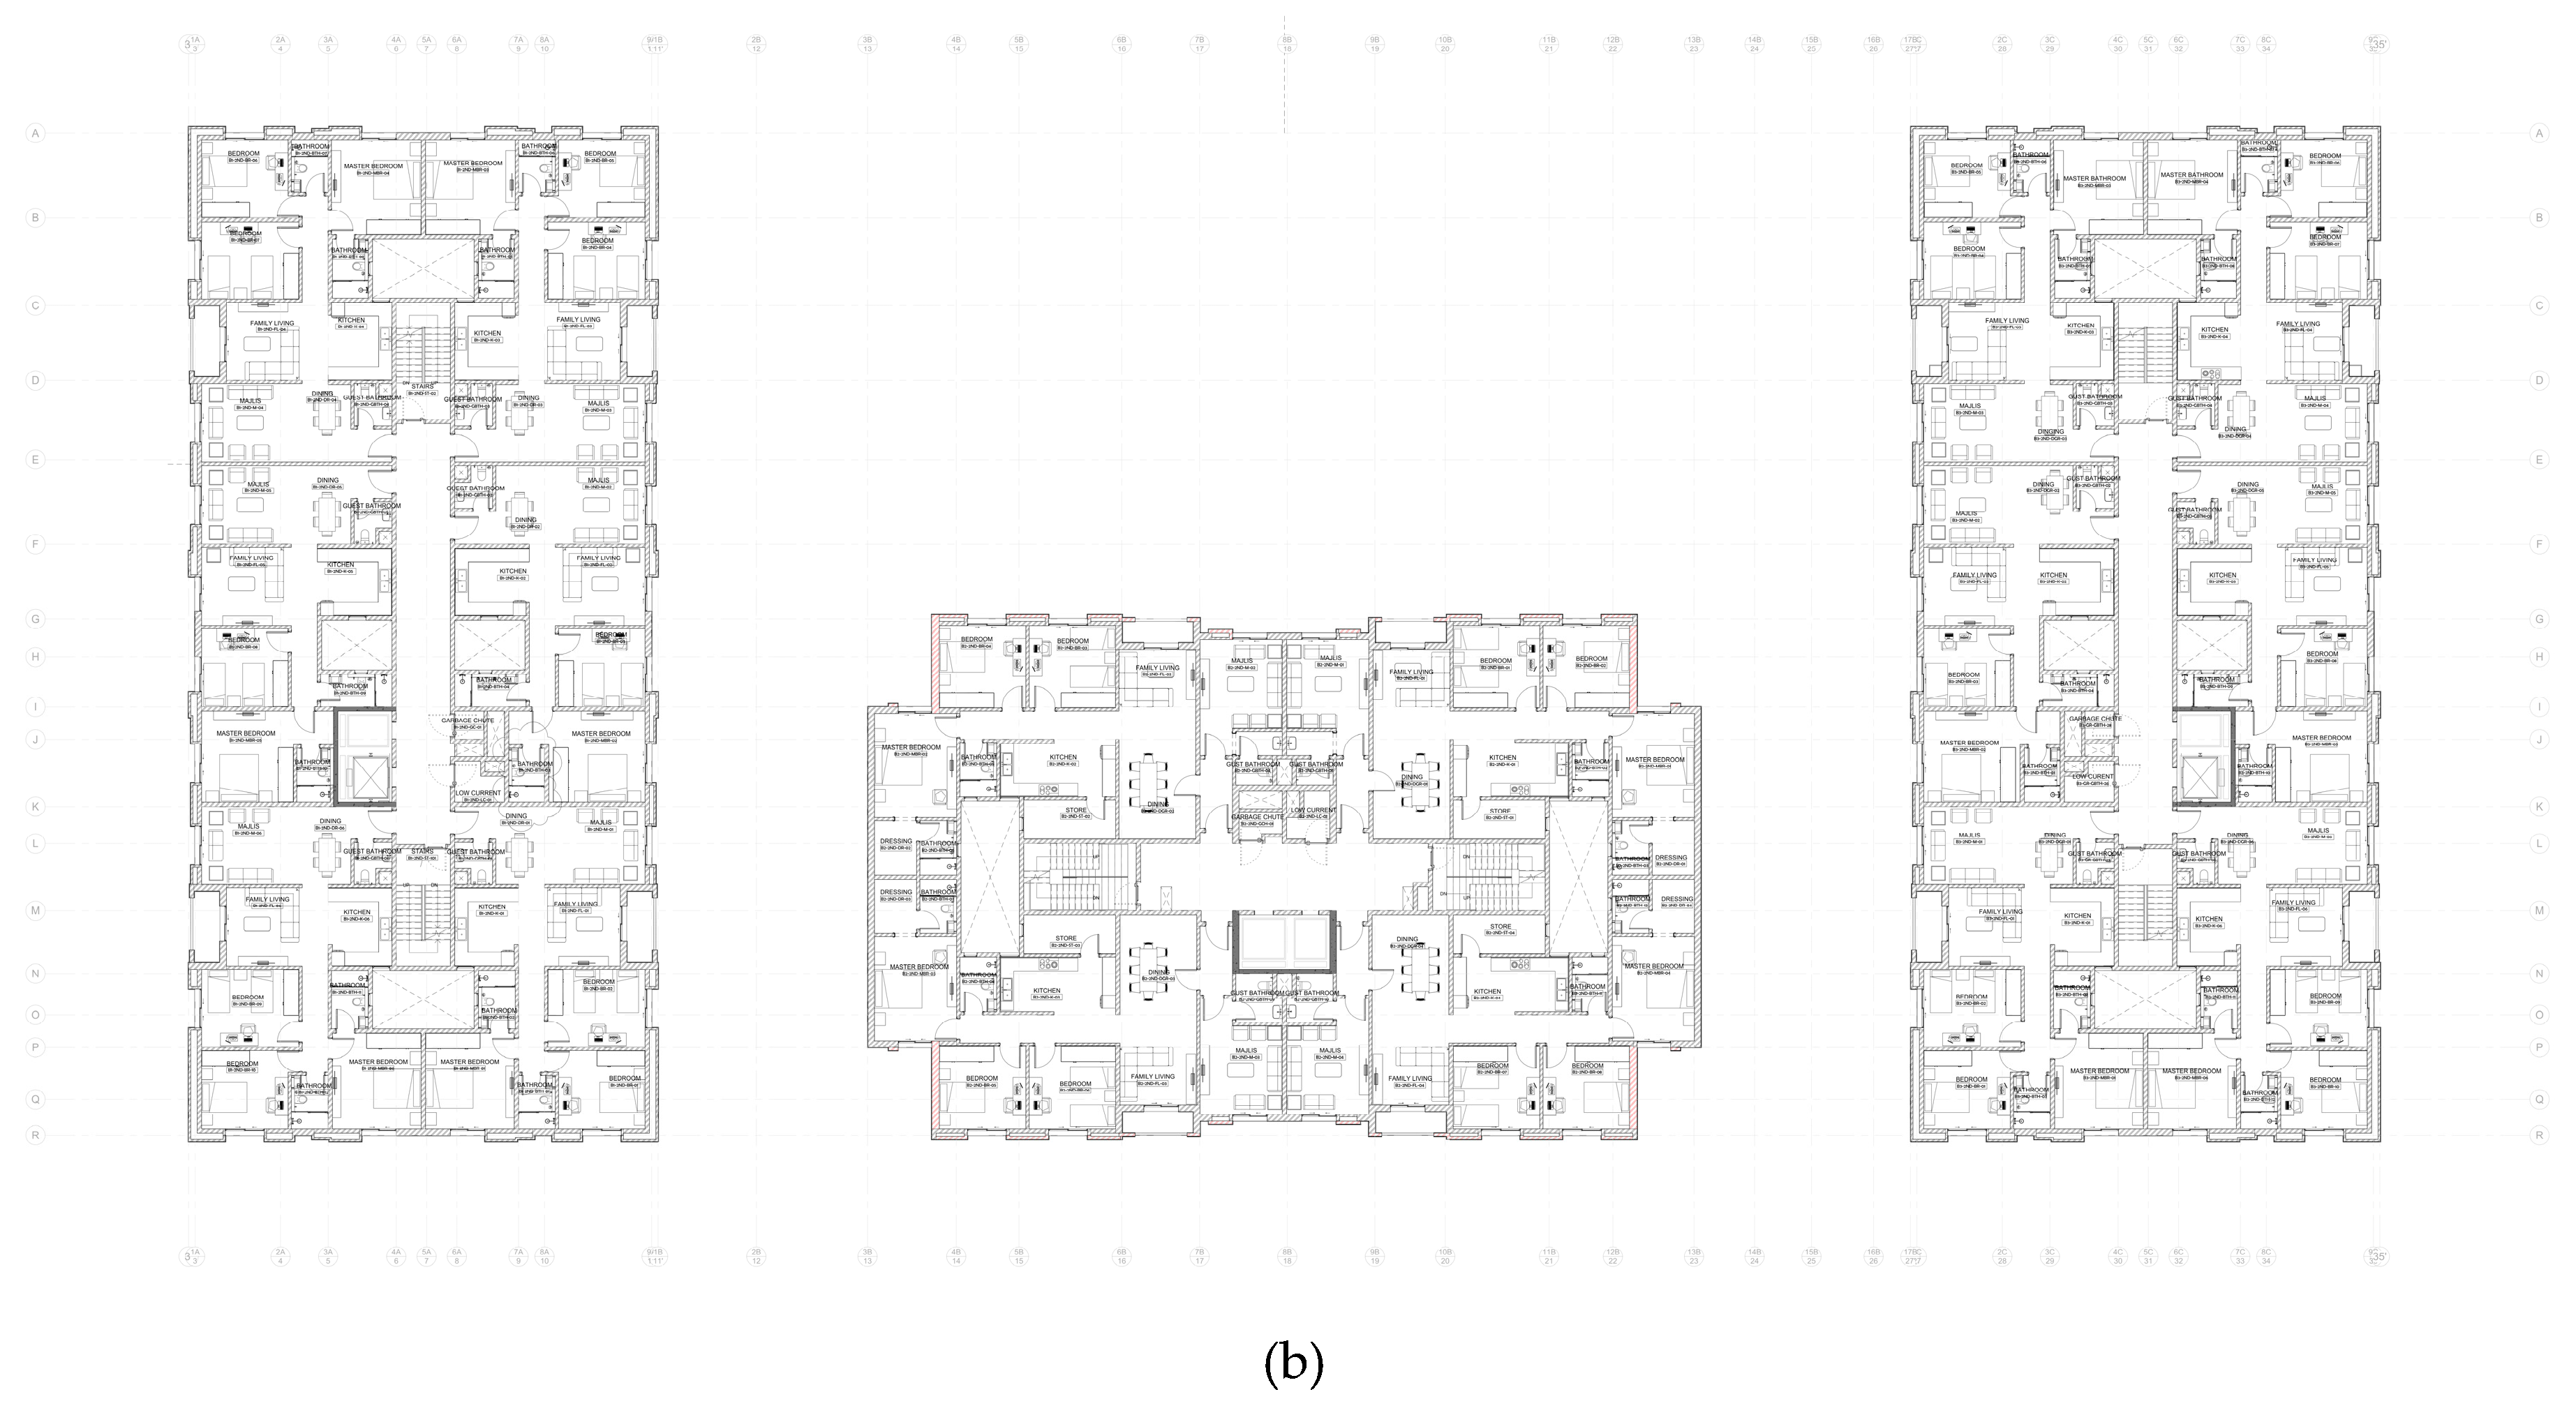
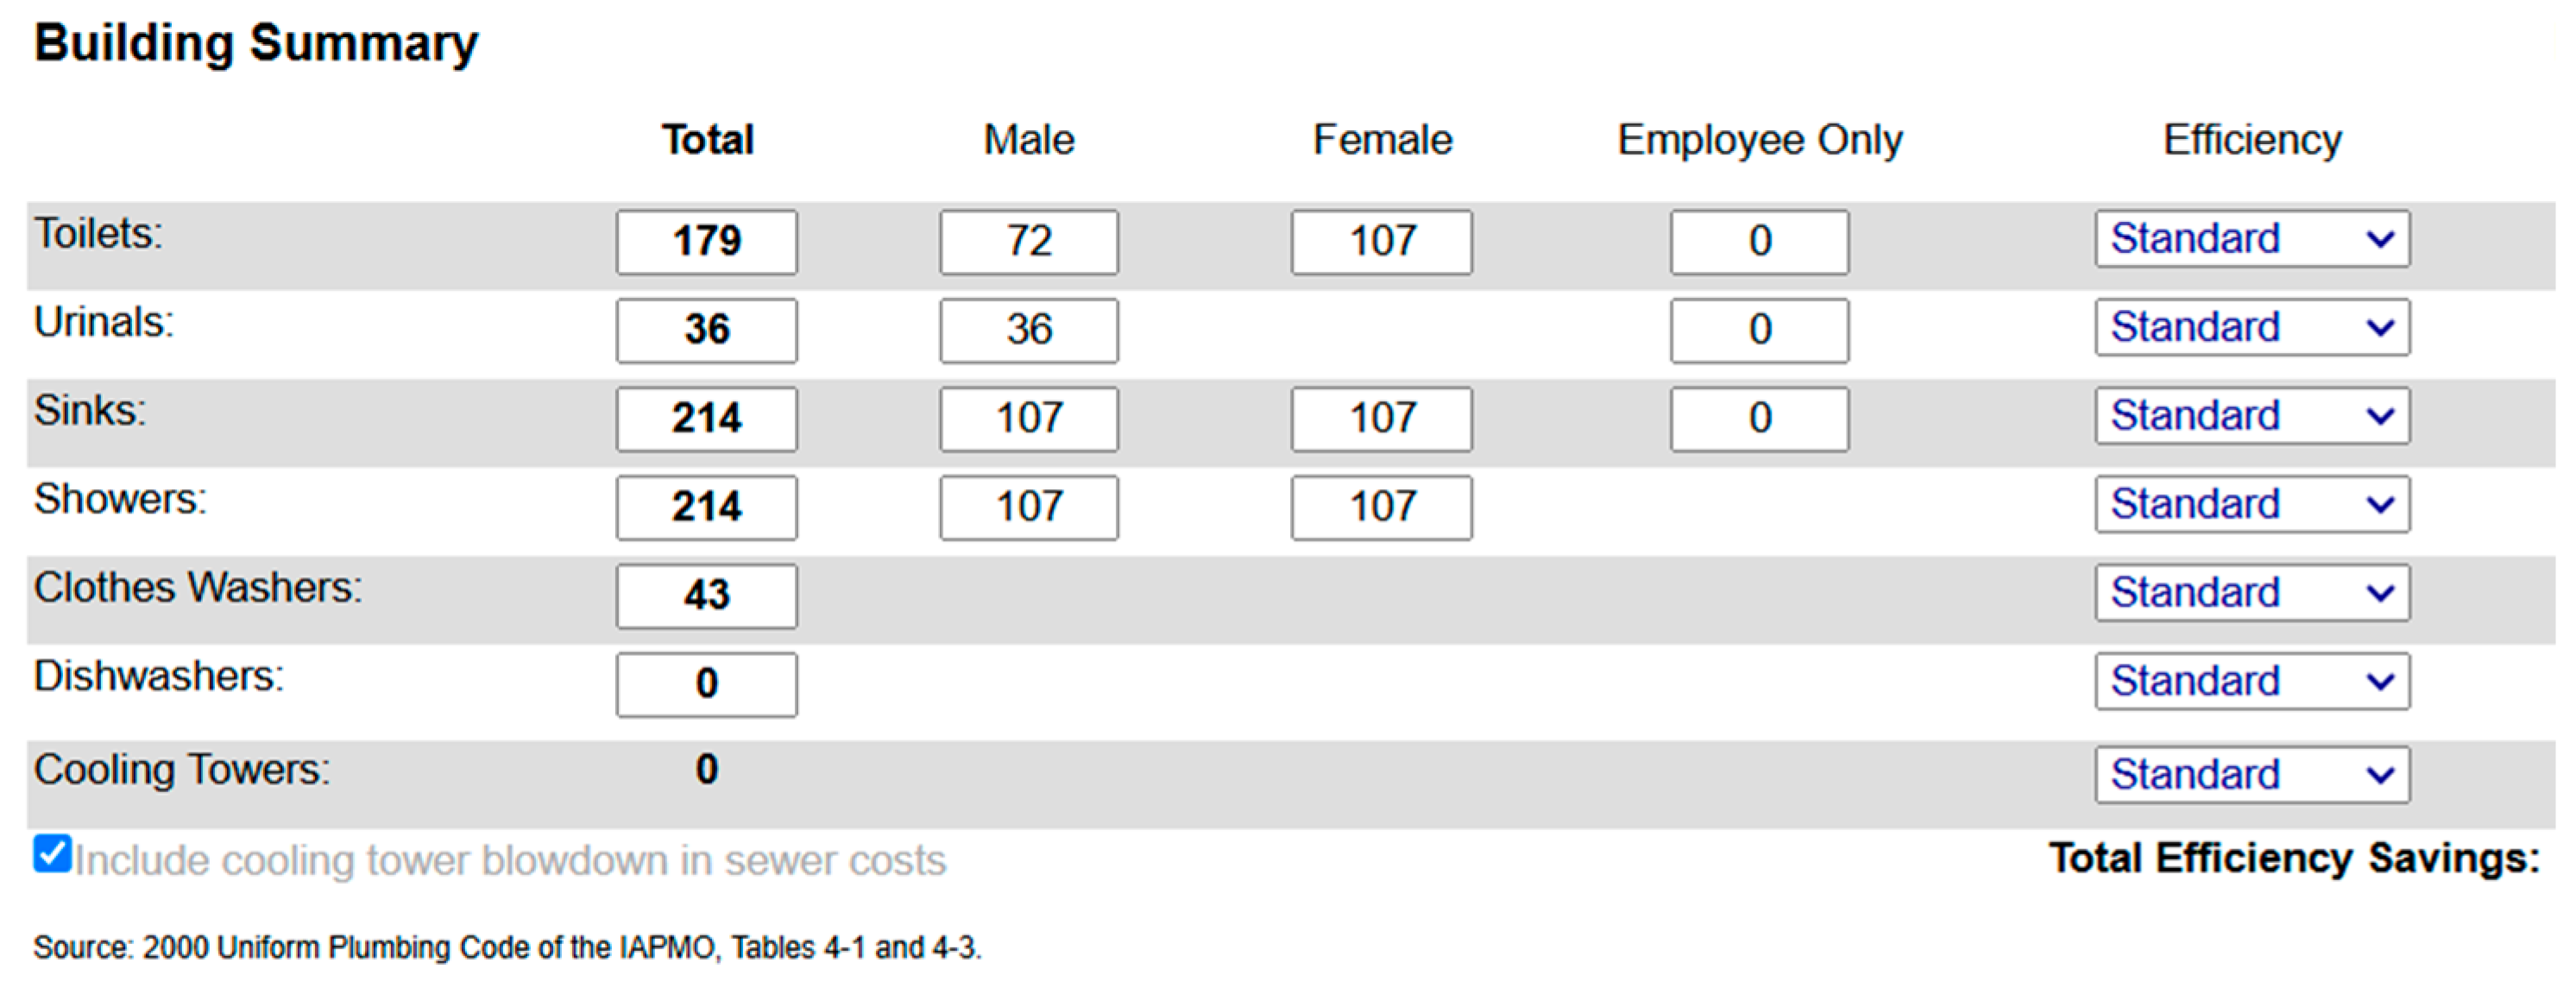
One of the most significant indicators of water sustainability is per capita water consumption. The per capita use of water in Saudi Arabia has been estimated to be 263 L per day, against a world average of 180 L per day [32]. This amply suggests the need for the efficient management of water. In the residential building that was used in the case study, the baseline per capita use before the installation of the greywater recycling system was 178 L per day. Although overall usage is high in absolute values, this is due to heavy building occupancy (425 persons). Per capita usage on a daily basis is less than in the country as a whole, indicating very efficient baseline usage. Following the implementation of the proposed methodology, the per capita consumption was reduced to 142 L per day, a 20% reduction in freshwater consumption. This reduction speaks volumes about the effectiveness of greywater recycling in optimizing water usage and moving toward sustainable urbanization.
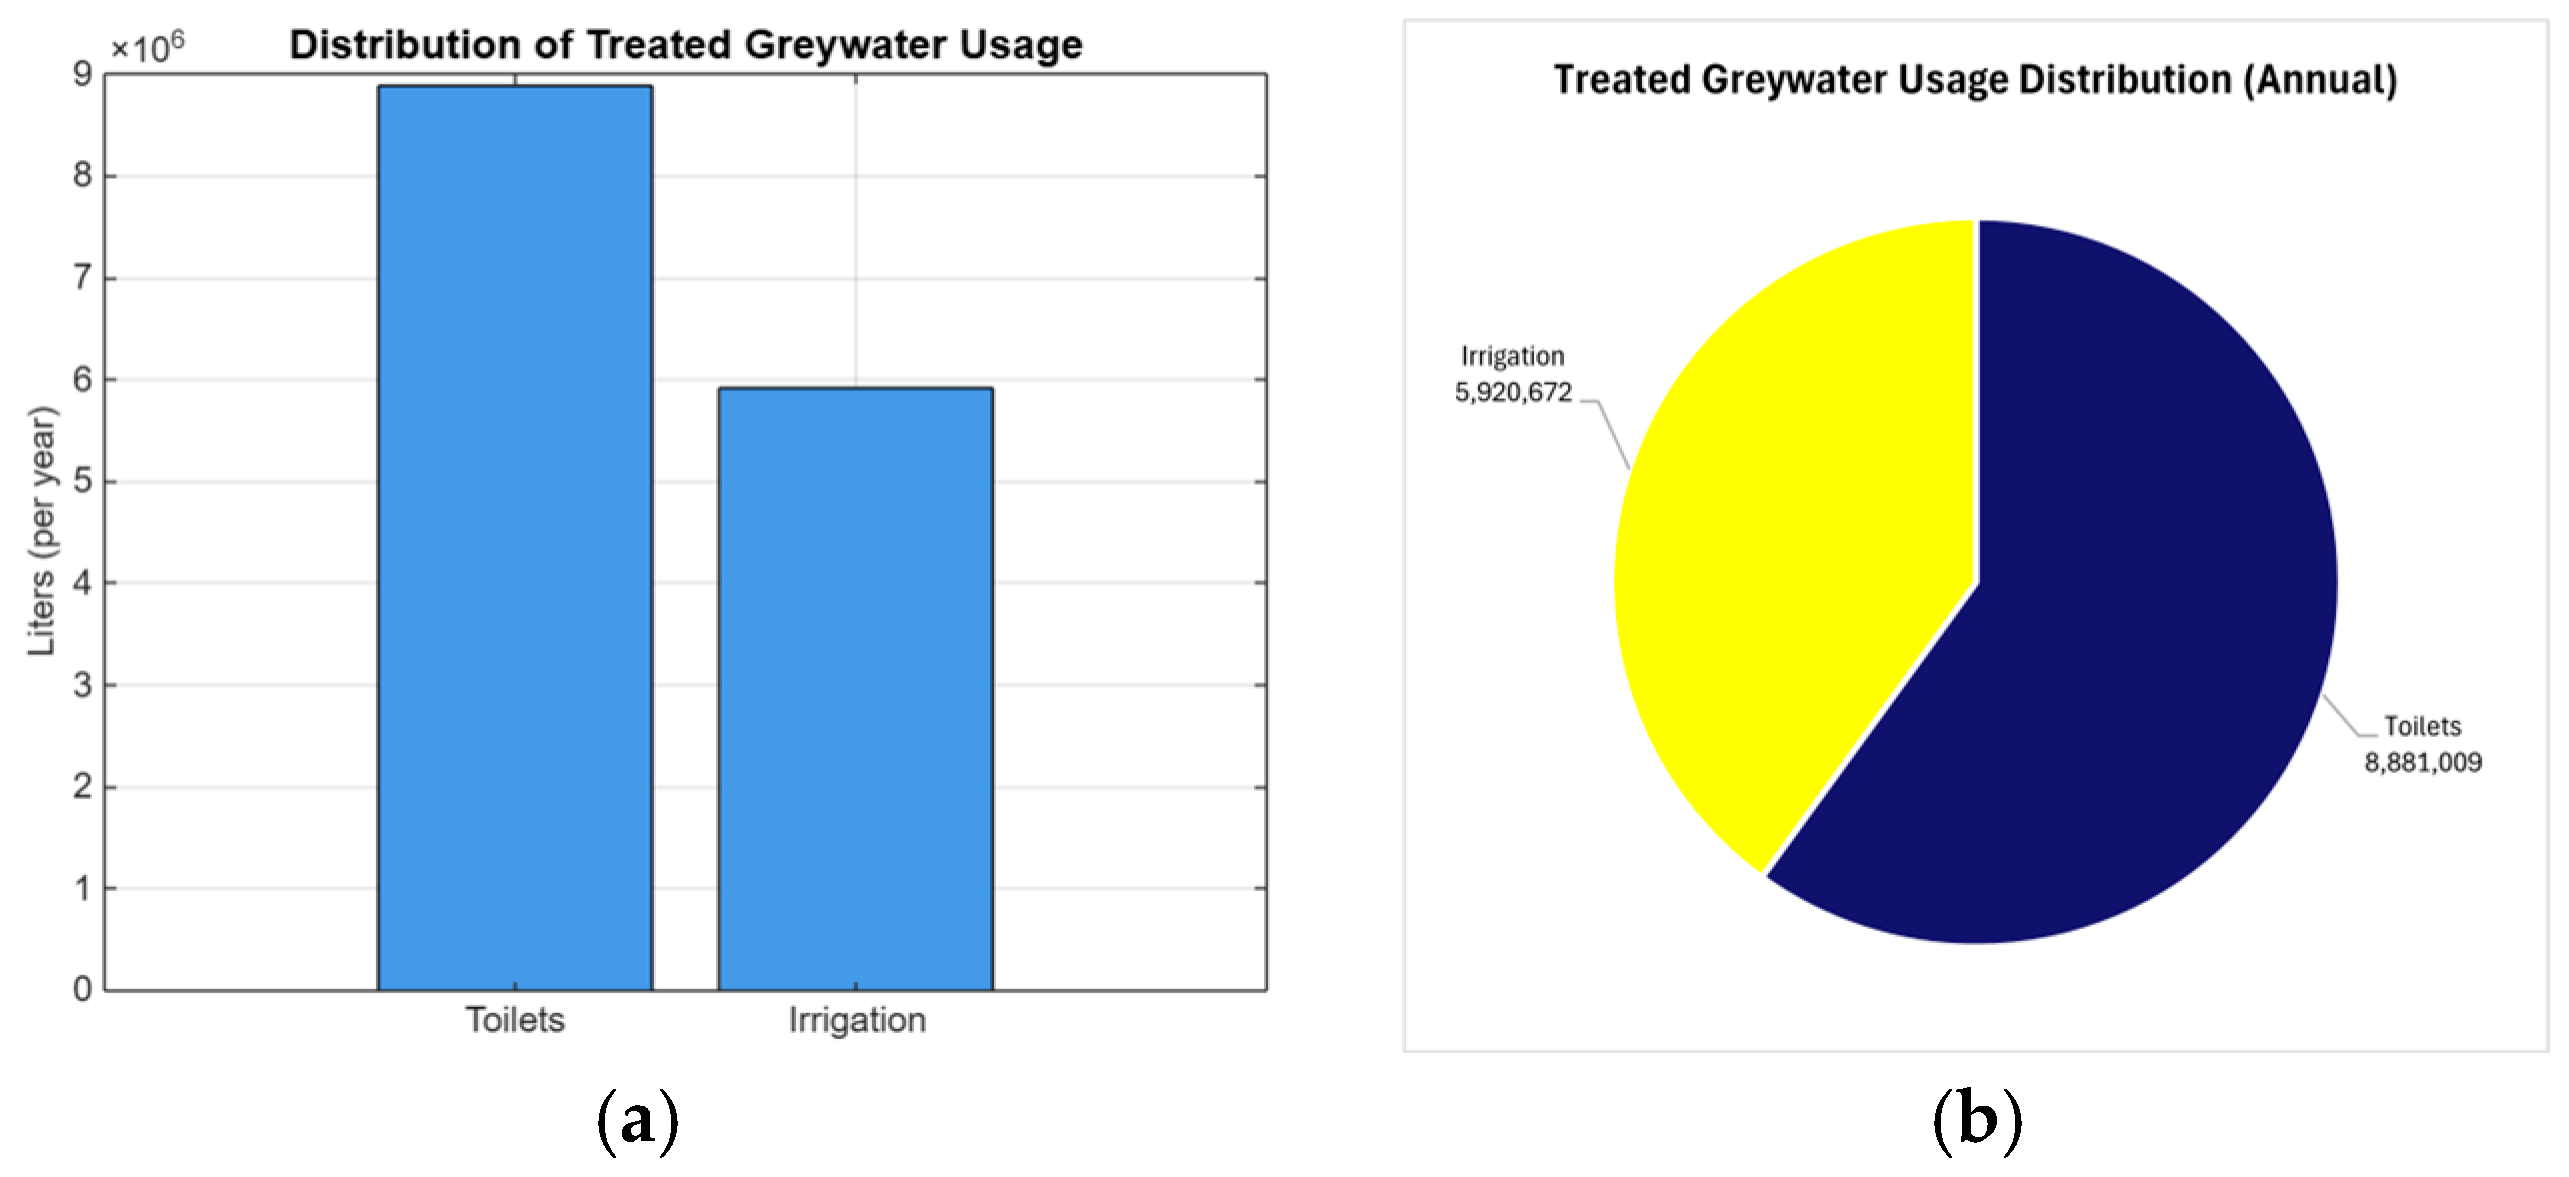
This study adopts an average daily water consumption profile for modeling purposes. However, real-world water usage is subject to daily and seasonal fluctuations, including weekends and holidays. Future research should integrate temporal variability to better capture peak demands, improve system sizing accuracy, and reflect actual operational dynamics. For the treated greywater, the split of this study is likely 60% for flushing toilets and 40% for irrigation, as in comparable literature, e.g., Chen et al. [16], for non-potable purposes at high efficiency by greywater systems. Furthermore, the minimum power consumption by the recycling process, as concluded from this work, supports the arguments of Dawoud et al. [18], who reported the viability of a wastewater reclamation system in an arid country like Saudi Arabia in terms of minimizing dependency on energy-hungry desalination procedures.
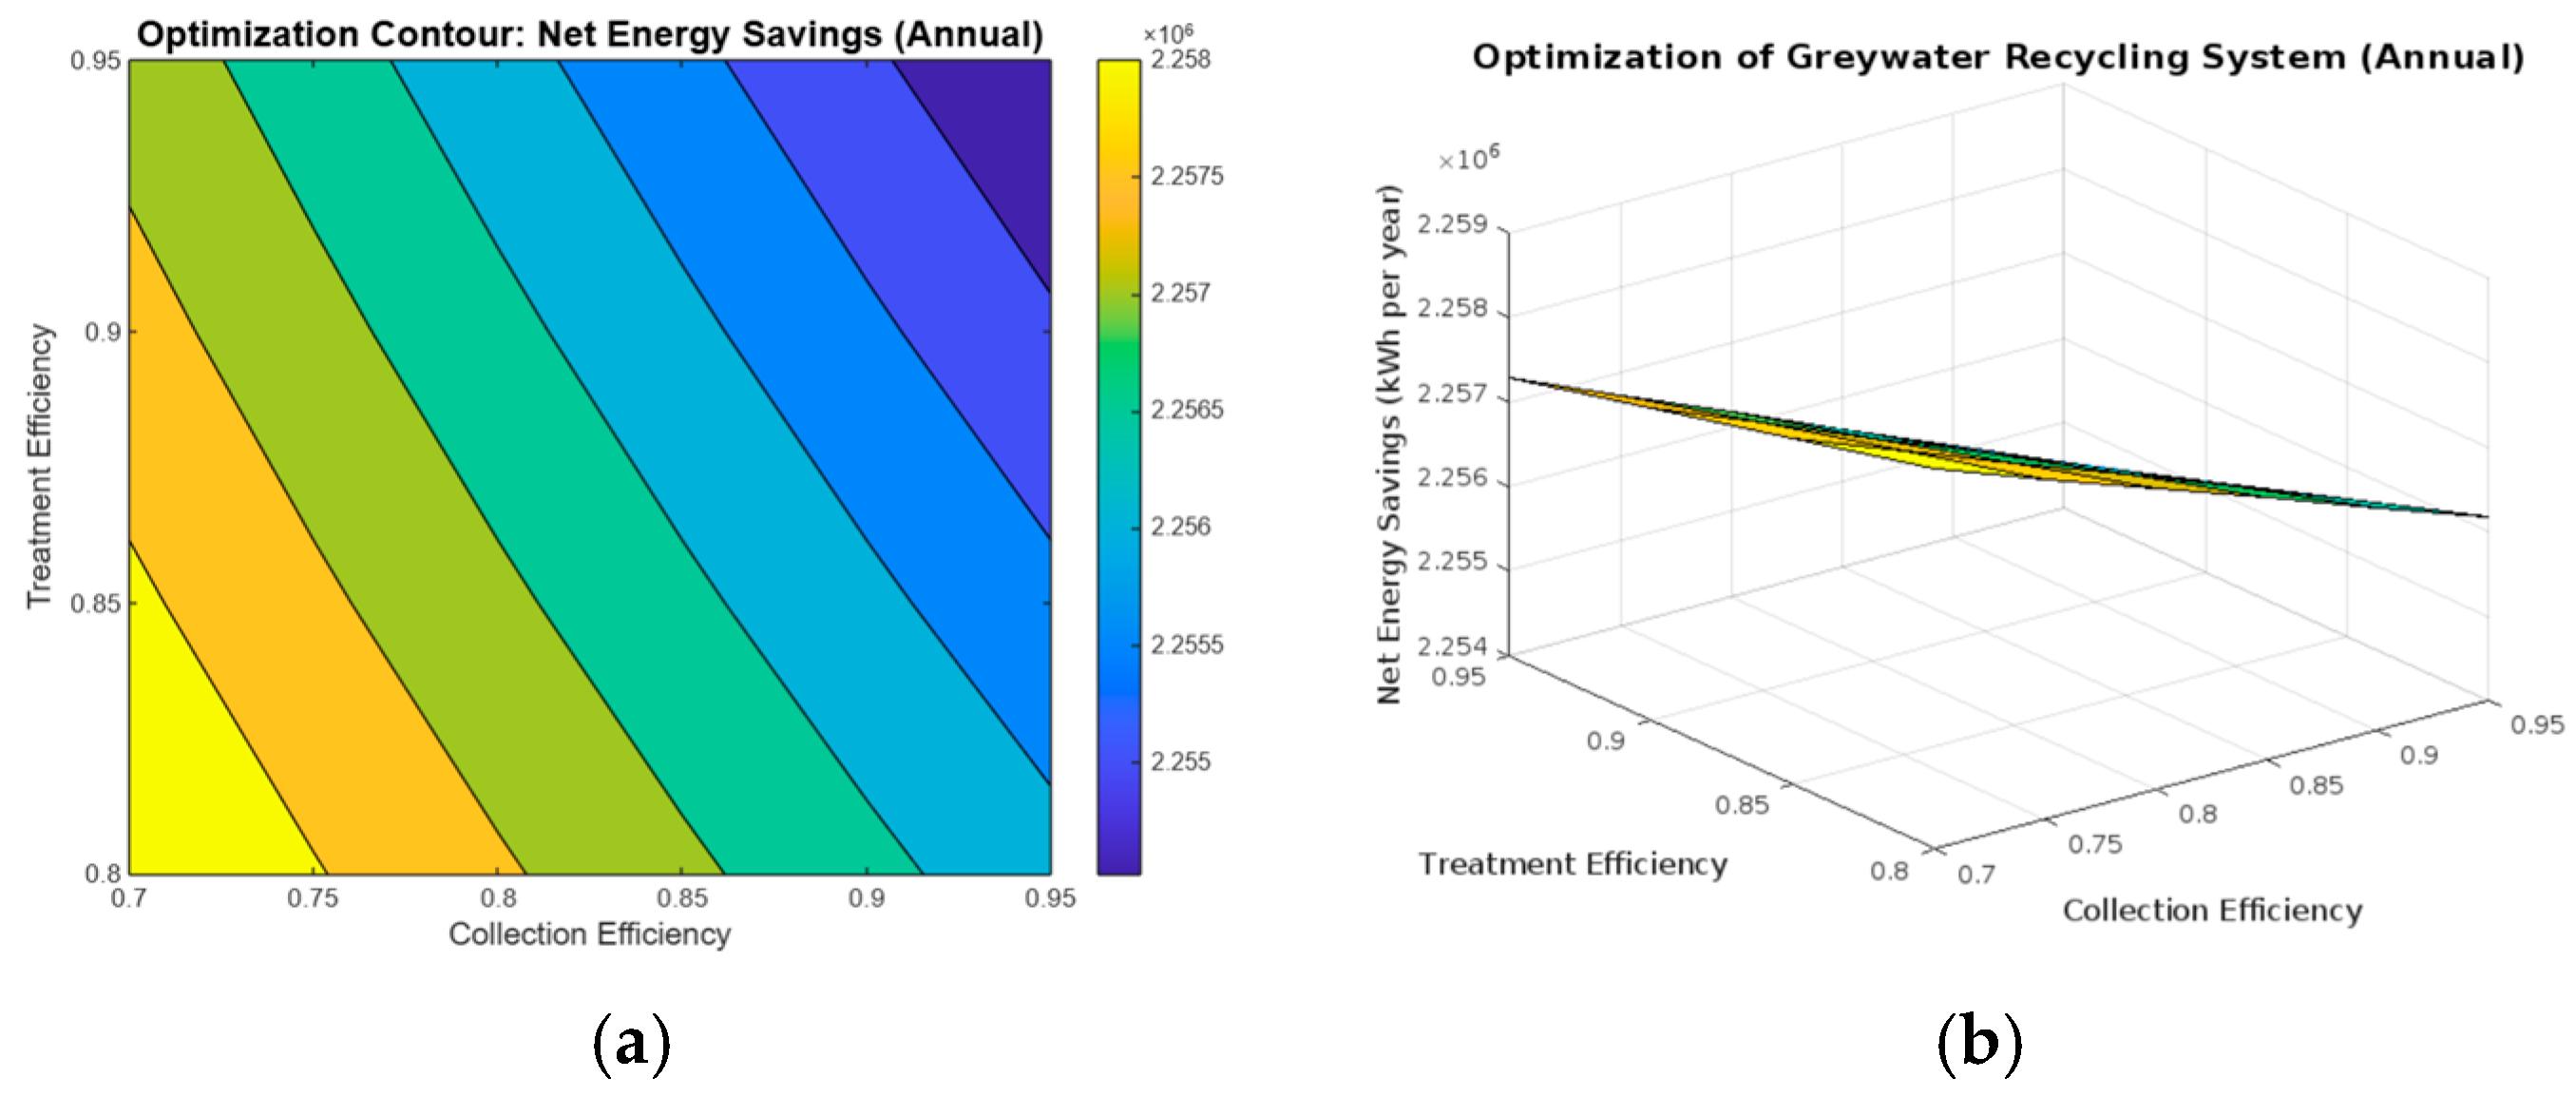
Maximum savings of the resources are demonstrated when collection and treatment efficiencies are higher, i.e., 90–95%, as indicated in the optimization analysis. These trends were corroborated by Fernandes and Marques [15], who established that enhancing the system’s efficiency and diffusion was related to the enhancement of regulatory systems and public awareness. Recent studies also highlight the role of digital control systems in optimizing decentralized greywater performance through better monitoring and feedback loops [33]. Additionally, the contour and 3D optimization analyses from this study demonstrated that any increase in either treatment or collection efficiency will greatly enhance the system’s performance. This attests to Voulvoulis’ [14] assertion that efficient strategies must be developed to attain optimum benefits with the least risks in water reutilization systems.
The economic profitability of the greywater recycling operation is also verified by the calculation of the economic payback period. The study yielded a payback period of 4.42 years for the system, consistent with Yi-Kai Juan et al. [20], whose study yielded a payback period of 4 years for the greywater recycling process for a residential building. The slight difference in results can be justified on the grounds of variations in scales of systems, cost variables, and tariffs of water from various regions. This favors the concept of worthwhile long-term investment with the environmental and economic benefits of recycling greywater and, thereby, a water-sustainability-worthy solution. Although energy savings represent only a small share of the total building consumption, such incremental gains are increasingly relevant as modern systems evolve toward high-efficiency standards with smaller but smarter improvements.
Though greywater recycling has clear merits, several barriers may limit its large-scale adoption. High initial investment costs, the need for infrastructure modifications (e.g., dual piping systems), and public acceptance issues remain major challenges. Additionally, regulatory systems may be non-standardized, which would limit large-scale implementation. However, some factors can overrule these obstacles and encourage adoption. Economic benefits, water subsidies, and policy support for water reuse can lower cost apprehension. Public information campaigns and education programs can enhance user acceptance. Moreover, the integration of smart monitoring systems for water savings can improve the efficiency and feasibility of greywater recycling in residential buildings. Recent urban planning research confirms that decentralized reuse systems play a key role in reducing water-energy demand at the district level, especially when integrated into smart city frameworks [34,35]. By reducing these adoption drivers, the barriers to implementation can be lowered, and greywater recycling can be a scalable and viable solution in water-scarce regions. This study focused on a building-scale greywater system because it was applied to an existing residential building that lacked connections to any centralized greywater networks. The decentralized approach reflects current shortcomings in Saudi Arabia’s water reuse systems. However, future research must explore the feasibility of centralized greywater recycling at the neighborhood or municipal level, which would offer more operational efficiency and easier integration into future urban planning.
In general, this finding supports the working hypothesis that greywater reuse systems can indeed contribute to the achievement of sustainability goals, particularly in water-scarce countries. It reduces the demand for potable water supply with electrical power consumption savings, reflecting the move towards a circular economic model and Saudi Vision 2030. This contrasts with traditional water management practices that are extremely dependent on desalination and groundwater abstraction. The research identifies greywater recycling as a potentially groundbreaking factor in addressing global water and energy crises, validating results from existing research studies and contributing new findings into optimal conditions for the functionality of such systems. The broader implementation of greywater reuse aligns with global strategies for integrated water resource management [28].

5. Conclusions

This study focuses on integrating greywater recycling into a residential building through a circular economy framework aimed at minimizing water and energy consumption. By applying grey-box modeling, energy balance analysis, and simulation tools, the system’s performance was evaluated in the context of sustainability targets outlined in Saudi Vision 2030. The results demonstrate that greywater recycling can significantly contribute to resource efficiency and environmental impact reduction in the residential sector. The findings show that up to 40% of non-potable water demand can be saved, reducing pressure on freshwater supplies. Energy savings of 2.258 million kWh per year were achieved through optimized collection and treatment strategies, confirming the system’s operational efficiency. Environmentally, the system reduces wastewater discharge, lowers dependence on desalination, and contributes to the mitigation of greenhouse gas emissions. Economically, the system is viable, with a payback period of 4.42 years, aligning with findings from similar studies and supporting its feasibility in residential applications. Moreover, the system supports circular economy principles by promoting water reuse, reducing waste, and enabling more efficient resource utilization. Its scalability and adaptability make it suitable for integration into broader urban and residential infrastructures. However, further research is needed to address technological barriers, public acceptance, and economic constraints. The development of a structured framework that includes regulatory policies, financial incentives, and community engagement will be critical for supporting widespread adoption and integration into future urban planning strategies.

Author Contributions

Conceptualization, A.A., H.A., I.N. and S.A.; methodology, A.A., H.A. and I.N.; software, H.A.; validation, A.A., H.A., I.N., S.A. and A.Q.; formal analysis, A.A., H.A. and I.N.; investigation, A.A., H.A. and I.N.; data curation, A.A., H.A. and I.N.; writing—original draft preparation, A.A. and H.A.; writing—review and editing, S.A. and I.N.; visualization, A.A. and H.A.; supervision, S.A. and A.Q. All authors have read and agreed to the published version of the manuscript.

Funding

This research received no external funding.

Data Availability Statement

The data presented in this study are available on request from the corresponding author. The data are not publicly available due to institutional restrictions.

Conflicts of Interest

The authors declare no conflicts of interest.

References

  1. UNESCO. The United Nations World Water Development Report 2022: Groundwater—Making the Invisible Visible; UNESCO: Paris, France, 2022; Available online: https://www.unesco.org/reports/wwdr/2022/en (accessed on 21 December 2024).
  2. United Nations. Transforming Our World: The 2030 Agenda for Sustainable Development. 2015. Available online: https://sdgs.un.org/goals (accessed on 21 December 2024).
  3. Amin Mir, M.; Waqar Ashraf, M. The Challenges and Potential Strategies of Saudi Arabia’s Water Resources: A Review in Analytical Way. Environ. Nanotechnol. Monit. Manag. 2023, 20, 100855. [Google Scholar] [CrossRef]
  4. Hawash, A.; Gray Water Treatment and Afforestation in the KSA. Carewater Solutions. Available online: https://carewater.solutions/%D9%85%D8%B9%D8%A7%D9%84%D8%AC%D8%A9-%D8%A7%D9%84%D9%85%D9%8A%D8%A7%D9%87-%D8%A7%D9%84%D8%B1%D9%85%D8%A7%D8%AF%D9%8A%D8%A9-%D9%88%D8%A7%D9%84%D8%AA%D8%B4%D8%AC%D9%8A%D8%B1/ (accessed on 12 January 2025).
  5. Guidelines for Greywater Reuse. Available online: https://faolex.fao.org/docs/pdf/sau213761.pdf (accessed on 12 January 2025).
  6. Al-Jasser, A.O. Greywater Reuse in Saudi Arabia: Current Situation and Future Potential. In Water and Society; WIT Press: Southampton, UK, 2011; pp. 159–169. [Google Scholar] [CrossRef]
  7. Kirchherr, J.; Reike, D.; Hekkert, M. Conceptualizing the Circular Economy: An Analysis of 114 Definitions. Resour. Conserv. Recycl. 2017, 127, 221–232. [Google Scholar] [CrossRef]
  8. Ellen Macarthur Foundation. Circular Economy in Cities. 2019. Available online: https://www.ellenmacarthurfoundation.org (accessed on 20 December 2024).
  9. World Bank. Water in Circular Economy and Resilience (WICER). Available online: https://www.worldbank.org/en/topic/water/publication/wicer (accessed on 12 January 2025).
  10. Tabibi, A. The Circular Water Economy: Wastewater as a Resource. Available online: https://green.org/2024/01/30/the-circular-water-economy-wastewater-as-a-resource/ (accessed on 12 January 2025).
  11. SI Circular Economy Policies|Water Policy|IWA Publishing. Available online: https://iwaponline.com/wp/pages/si_circular_economy_policies (accessed on 12 January 2025).
  12. Towards a Next Generation of Water Systems and Services for the Circular Economy (NextGen). Available online: https://www.bath.ac.uk/case-studies/towards-a-next-generation-of-water-systems-and-services-for-the-circular-economy-nextgen/ (accessed on 12 January 2025).
  13. Topics European Parliament. Circular Economy: Definition, Importance and Benefits. Available online: https://www.europarl.europa.eu/topics/en/article/20151201STO05603/circular-economy-definition-importance-and-benefits (accessed on 12 January 2025).
  14. Voulvoulis, N. Water Reuse from a Circular Economy Perspective and Potential Risks from an Unregulated Approach. Curr. Opin. Environ. Sci. Health 2018, 2, 32–45. [Google Scholar] [CrossRef]
  15. Fernandes, E.; Cunha Marques, R. Review of Water Reuse from a Circular Economy Perspective. Water 2023, 15, 848. [Google Scholar] [CrossRef]
  16. Chen, L.; Chen, Z.; Liu, Y.; Lichtfouse, E.; Jiang, Y.; Hua, J.; Osman, A.I.; Farghali, M.; Huang, L.; Zhang, Y.; et al. Benefits and Limitations of Recycled Water Systems in the Building Sector: A Review. Environ. Chem. Lett. 2024, 22, 785–814. [Google Scholar] [CrossRef]
  17. Kordana-Obuch, S.; Starzec, M.; Wojtoń, M.; Słyś, D. Greywater as a Future Sustainable Energy and Water Source: Bibliometric Mapping of Current Knowledge and Strategies. Energies 2023, 16, 934. [Google Scholar] [CrossRef]
  18. Dawoud, M.A.; Ewea, H.A.; Alaswad, S.O. The Future of Wastewater Treatment and Reuse in Kingdom of Saudi Arabia. Desalin. Water Treat. 2022, 263, 127–138. [Google Scholar] [CrossRef]
  19. Waly, M.M.; Mickovski, S.B.; Thomson, C. Application of Circular Economy in Oil and Gas Produced Water Treatment. Sustainability 2023, 15, 2132. [Google Scholar] [CrossRef]
  20. Juan, Y.-K.; Chen, Y.; Lin, J.-M. Greywater Reuse System Design and Economic Analysis for Residential Buildings in Taiwan. Water 2016, 8, 546. [Google Scholar] [CrossRef]
  21. Madhuranthakam, C.M.R.; AbuZaid, M.; Chaalal, O.; Ghannam, T. Sustainable Water Management with Design and Economic Evaluation of Recycling Greywater at Abu Dhabi University—A Case Study on Decentralization. Sustainability 2023, 15, 16208. [Google Scholar] [CrossRef]
  22. Mannina, G.; Gulhan, H.; Ni, B.-J. Water Reuse from Wastewater Treatment: The Transition towards Circular Economy in the Water Sector. Bioresour. Technol. 2022, 363, 127951. [Google Scholar] [CrossRef] [PubMed]
  23. Neczaj, E.; Grosser, A. Circular Economy in Wastewater Treatment Plant–Challenges and Barriers. Proceedings 2018, 2, 614. [Google Scholar] [CrossRef]
  24. United Nation. Water and Sanitation Data. Available online: https://www.unwater.org/water-facts (accessed on 18 January 2025).
  25. Davis, M.L.; Masten, S.J. Principles of Environmental Engineering & Science, 4th ed.; McGraw-Hill Education: New York, NY, USA, 2020. [Google Scholar]
  26. Asano, T. (Ed.) Water Reuse: Issues, Technologies, and Applications; McGraw-Hill: New York, NY, USA, 2007. [Google Scholar]
  27. Tchobanoglous, G.; Stensel, D.H.; Tsuchihashi, R.; Burton, F.; Abu-Orf, M.; Bowden, G.; Pfrang, W.; Metcalf & Eddy, Inc.; Albert Einstein College of Medicine (Eds.) Wastewater Engineering: Treatment and Resource Recovery, 5th ed.; McGraw-Hill Education: New York, NY, USA, 2014. [Google Scholar]
  28. Al-Jayyousi, O.R. Greywater Reuse: Towards Sustainable Water Management. Desalination 2003, 156, 181–192. [Google Scholar] [CrossRef]
  29. Friedler, E.; Hadari, M. Economic Feasibility of On-Site Greywater Reuse in Multi-Storey Buildings. Desalination 2006, 190, 221–234. [Google Scholar] [CrossRef]
  30. Hardisty, P.E. Environmental and Economic Sustainability; CRC Press: Boca Raton, FL, USA, 2019. [Google Scholar]
  31. McGivney, W.; Kawamura, S. Cost Estimating Manual for Water Treatment Facilities; John Wiley & Sons: Hoboken, NJ, USA, 2008. [Google Scholar] [CrossRef]
  32. Baig, M.B.; Alotibi, Y.; Straquadine, G.S.; Alataway, A. Water Resources in the Kingdom of Saudi Arabia: Challenges and Strategies for Improvement. In Water Policies in MENA Countries; Zekri, S., Ed.; Global Issues in Water Policy; Springer International Publishing: Cham, Switzerland, 2020; Volume 23, pp. 135–160. [Google Scholar] [CrossRef]
  33. Luo, M.; Zhang, H.; Zhou, P.; Xiong, Z.; Huang, B.; Peng, J.; Liu, R.; Liu, W.; Lai, B. Efficient Activation of Ferrate(VI) by Colloid Manganese Dioxide: Comprehensive Elucidation of the Surface-Promoted Mechanism. Water Res. 2022, 215, 118243. [Google Scholar] [CrossRef] [PubMed]
  34. Ferrero, F.; Perboli, G.; Rosano, M.; Vesco, A. Car-Sharing Services: An Annotated Review. Sustain. Cities Soc. 2018, 37, 501–518. [Google Scholar] [CrossRef]
  35. Nakada, L.Y.K.; Moruzzi, R.B. Corn Starch-Based Treatment Improves Rainwater Quality. Water Supply 2015, 15, 1326–1333. [Google Scholar] [CrossRef]
Figure 1. Circular economy model [11].
Energies 18 02868 g001
Figure 2. Methodology overview.
Energies 18 02868 g002
Figure 3. (a) Water consumption trends in the residential sector globally; (b) water consumption trends in the residential sector in Asia [24].
Energies 18 02868 g003
Figure 4. (a) Three-dimensional building using Autodesk® Revit 25; (b) typical building floor plan using Autodesk® Revit 25.
Energies 18 02868 g004aEnergies 18 02868 g004b
Figure 5. Building summary using Autodesk® Green Building Studio and Autodesk® Revit 25.
Energies 18 02868 g005
Figure 6. Water recycling strategy.
Energies 18 02868 g006
Figure 7. Process flow diagram of the greywater recycling system [5].
Energies 18 02868 g007
Figure 8. Annual water consumption and savings distribution.
Energies 18 02868 g008
Figure 9. Treated greywater usage: (a) distribution of treated greywater; (b) treated greywater usage distribution.
Energies 18 02868 g009
Figure 10. (a) Optimization contour: net energy savings; (b) optimization of greywater recycling system.
Energies 18 02868 g010
Table 1. Comparative literature summary.
StudyResearch FocusMethodologyKey FindingsRef.
Voulvoulis (2018)Water reuse risks in circular economyConceptual risk frameworkIdentified critical risks and policy inconsistencies limiting CE-based reuse.[14]
Fernandes & Marques (2023)Resource efficiency in CE systemsSimulation-based resource analysisDemonstrated 25–40% reductions in resource demand under CE practices.[15]
Chen et al. (2024)Feasibility of decentralized reuseBuilding-scale simulationsConfirmed decentralized reuse systems are feasible and scalable for cities.[16]
Kordana-Obuch et al. (2023)Trends in greywater reuseBibliometric and content analysisRevealed a lack of harmonized modeling and insufficient adoption incentives.[17]
Dawoud et al. (2022)Greywater reuse in arid GCC regionsPolicy and case study reviewFound decentralized systems viable under proper policy frameworks.[18]
Waly et al. (2023)Produced water reuse in oil and gasTreatment modeling and analysisAchieved high reuse rates with reduced environmental impact.[19]
Yi-Kai Juan et al. (2016)Economic analysis of reuse systemsCost–payback modelingReported 4-year payback with 30% water use reduction.[20]
Madhuranthakam et al. (2023)Hybrid greywater reuse strategySimulation in academic settingsValidated cost-effectiveness and strong reuse potential.[21]
Mannina et al. (2022)Decision-making in reuse systemsStakeholder survey and modelingHighlighted the importance of public acceptance and technical efficiency.[22]
Neczaj & Grosser (2018)Role of WWTPs in CE citiesSystem function and integration analysisPositioned WWTPs as central hubs in sustainable smart cities.[23]
Table 2. Building data collection.
LocationRiyadh, KSA
Longitude46.72413° E
Latitude24.69496° N
Building orientation45
Building typeResidential Apartment
Number of floors10
Floor height3.3 m
Number of people425
HVAC systemAll-water System—Fan Coil Unit (FCUs)
Lighting power density (LPD)6 W/m2
Equipment power density (EPD)1 W/m2
Infiltration rate1.8 ACH
Water consumption/indoor27,640,861 L/yr
Water consumption/outdoor444,056 L/yr
Energy consumption453 kWh/m2/yr
Table 3. Summary of indoor water factors and annual net utility consumption.
Indoor Water Factors
Number of People425
Typical People for this Building Type/Size104
Percent of Time Occupied (%)58
Net Utility Consumption
Total Water Use28,084.917 L/year
Indoor Water Use27,640,861 L/ year
Outdoor Water Use444,056 L/ year
Net Utility28,084,917 L/ year
Table 4. Grey-box modeling (input).
Baseline Water Consumption Data
Q i n d o o r 27,640.861 m3/year.
Q d a i l y   i n d o o r 75,718 L/day.
Q p e r   c a p i t a   i n d o o r 178 L/person/day.
Q o u t d o o r 444.056 m3/year.
Q d a i l y   o u t d o o r 1216 L/day.
Greywater Data
Q G r e y w a t e r 53,002 L/day.
Greywater collection efficiency: 85%
Q c o l l e c t e d 45,051.7 L/day.
Water Recycling System Data
System type: Advanced filtration and UV disinfection.
Recycling efficiency (η): 90%.
Q r e c y c l e d 40,546.5 L/day.
Energy Consumption Data
Baseline energy consumption453 kWh/m2/year.
E b a s e l i n e 2,265,000 kWh/year.
Energy consumption for recycling system
Treatment energy consumption0.9 kWh/m3
Daily energy consumption for recycling
E r e c y c l i n g 36.49 kWh/day.
E r e c y c l i n g   a n n u a l 13,321 kWh/year.
Table 5. Variable descriptions.
VariableDescription
Q g r e y w a t e r Volume of greywater generated
Q i n d o o r Total indoor water consumption
P Percentage of indoor water contributing to greywater
Q c o l l e c t e d Effective volume of greywater collected
η c o l l e c t i o n Greywater collection efficiency
Q r e c y c l e d Volume of treated water available for reuse
η r e c y c l i n g Recycling system efficiency
Q s a v i n g s Net water savings due to recycling
Q f r e s h w a t e r Freshwater used after recycling
E r e c y c l i n g Energy consumption for water recycling
e s y s t e m Energy required per cubic meter of treated water
C o p e r a t i o n Daily operational cost of the recycling system
c m a i n t e n a n c e Maintenance cost per cubic meter of treated water
c e l e c t r i c i t y Electricity cost per kilowatt-hour
C n e t Net cost-effectiveness of the recycling system
C s a v i n g s Savings from reduced freshwater consumption
Table 6. Descriptions and values of economic parameters used in cost analysis.
VariableDescriptionValues
L Total lifespan of the project in years20 years
D Number of days per year365 days/year
I Initial investment cost217,500 SAR
C d Daily treatment capacity in cubic meters40.54 SAR/cubic meter
C o p Operational and maintenance costs per cubic meter1.95 SAR/cubic meter
c n w Cost per cubic meter of network water5.35 SAR/cubic meter
S Annual savings4.42 years
Table 7. Summary of annual energy use and net energy savings from greywater recycling.
Energy Use CategoryEnergy kWh (per Year)
Total Building Energy2,265,000
Energy Used in Recycling 9868
Net Energy Savings23,025
Disclaimer/Publisher’s Note: The statements, opinions and data contained in all publications are solely those of the individual author(s) and contributor(s) and not of MDPI and/or the editor(s). MDPI and/or the editor(s) disclaim responsibility for any injury to people or property resulting from any ideas, methods, instructions or products referred to in the content.

