Article

Energy Management for Distributed Carbon-Neutral Data Centers †

by
Wenting Chang
1,
Chuyi Liu
1,2,3,*,
Guanyu Ren
1 and
Jianxiong Wan
1,2,3
1
College of Data Science and Application, Inner Mongolia University of Technology, Hohhot 010080, China
2
Inner Mongolia Autonomous Region Engineering & Technology Research Center of Big Data Based Software Service, Hohhot 010080, China
3
Research Center of Large-Scale Energy Storage Technologies, Ministry of Education of the People’s Republic of China, Hohhot 010080, China
*
Author to whom correspondence should be addressed.
This paper is an extended and enhanced version of our conference work “Distributed Energy Management for Carbon-Neutral Data Centers”, In Proceedings of the 2024 IEEE International Symposium on Parallel and Distributed Processing with Applications (ISPA), Kaifeng, China, 30 October–2 November 2024.
Energies 2025, 18(11), 2861; https://doi.org/10.3390/en18112861
Submission received: 15 April 2025 / Revised: 27 May 2025 / Accepted: 27 May 2025 / Published: 30 May 2025

Abstract

With the continuous expansion of data centers, their carbon emission has become a serious issue. A number of studies are committing to reduce the carbon emission of data centers. Carbon trading, carbon capture, and power-to-gas technologies are promising emission reduction techniques which are, however, seldom applied to data centers. To bridge this gap, we propose a carbon-neutral architecture for distributed data centers, where each data center consists of three subsystems, i.e., an energy subsystem for energy supply, thermal subsystem for data center cooling, and carbon subsystem for carbon trading. Then, we formulate the energy management problem as a Decentralized Partially Observable Markov Decision Process (Dec-POMDP) and develop a distributed solution framework using Multi-Agent Deep Deterministic Policy Gradient (MADDPG). Finally, simulations using real-world data show that a cost saving of 20.3% is provided.

1. Introduction

Significant efforts have been invested into carbon reduction globally as the concept of carbon neutrality has attracted considerable attention. This is particularly critical under China’s ambitious “dual-carbon” policy (carbon peak by 2030 and carbon neutrality by 2060), which implements strict carbon quota systems where exceeding emission limits results in substantial fines or administrative penalties. In this context, corporate environmental responsibility becomes paramount, as enterprises play a pivotal role in achieving sustainable development goals while maintaining economic viability. Data centers, producing around 300 million tons of carbon emissions annually, represent both a major challenge and opportunity in this transition, being one of the largest sources of global carbon emissions [1].
The growing emphasis on environmental stewardship in business operations underscores the need for innovative solutions that balance ecological and economic objectives. With data center scales becoming increasingly larger, a significant number of works have been dedicated to optimizing energy infrastructure while reducing carbon emissions—a dual imperative that reflects the broader sustainability challenges facing modern enterprises. This alignment of environmental responsibility with technological innovation creates new paradigms for sustainable business practices in the digital age.
The use of carbon capture and power-to-gas technology can be an effective way to achieve carbon reduction. Zhang et al. [2] applied the carbon capture (CC) system and reported 12.55% reductions in carbon emissions. Ma et al. [3] applied the power-to-gas (P2G) system and reduced about 16.21% carbon emissions. However, with the scale now increasing, some data centers are moving to distributed data centers. Distributed data centers are difficult to manage and complex to operate, which makes it challenging to implement unified control when applying these state-of-the-art emission reduction technologies. Our research team has attempted to use AC systems in data centers to increase heat reuse and reduce energy consumption [4]. Based on the research, this paper added the CC and P2G systems to increase the fixation and reuse of carbon, further reducing data center operating costs. We formulate a cost minimizing problem for the proposed architecture and leverage Multi-Agent Deep Deterministic Policy Gradient (MADDPG) to obtain the optimal control strategy. Extensive simulations based on real-world trace show that the overall cost, including power and carbon cost, is reduced by 20.3%.
The rest of this article is organized as follows. In Section 3, the distributed carbon-neutral data center architecture is introduced. We formulate the problem in Section 4. The algorithm based on MADDPG is introduced in Section 5, and the simulation results are given in Section 6. Finally, we summarize this paper in Section 7.

2. Relate Work

Replacing brown energy with renewable energy is an effective method for carbon reduction. Designing energy management policies is challenging in this scenario since they have to deal with the intermittency and instability of renewable energy. To bridge this gap, Yan et al. [5] utilized Virtual Power Plants (VPPs) to control both renewable and non-renewable energy sources, enabling flexible allocation and stable energy supply for data centers. On this basis, He et al. [6] minimized the usage of non-renewable energy with the Lyapunov optimization algorithm. However, carbon reduction is not exactly the same as cutting brown energy usage and it often leads to high cost.
In data centers, optimizing cooling energy consumption is another way to achieve carbon reductions. Data centers are densely packed with a large number of servers and other equipment, which generate huge amounts of heat during operation. The cooling system in a data center requires a lot of energy to maintain the normal operating temperature of the equipment, which means that a lot of energy needs to be consumed for cooling. By optimizing cooling energy consumption, overall energy demand can be directly and effectively reduced, thereby reducing carbon emissions. Haywood et al. applied the absorption chiller (AC) system which led to a potentially realizable PUE value of less than one [7]. SafeCool saves up to 13.18% cooling power by employing Model-Based Reinforcement Learning (MBRL) [8]. Leindals et al. proposed Cool-RUDDER, a training-free return decomposition method that leverages future strategies and domain knowledge to maintain server temperature stability while improving the Aquifer Thermal Energy Storage (ATES) system balance from 16.3% to 4.9% imbalance [9]. Similarly, Chen et al. developed a multi-set point cooling control approach based on the deep Q-network algorithm (DQN-MSP) that precisely adjusts the supply air temperature of each air conditioning unit by capturing thermal fluctuations, ensuring dynamic balance between cooling supply and demand. Simulation results demonstrated that this control scheme effectively reduces cooling energy consumption by over 2.4% [10]. In tropical climate conditions, Bin et al. applied deep reinforcement learning algorithms to a hybrid model constructed from high-efficiency data center data, achieving additional energy savings of 3% at full load and 5.5% at partial load [11]. Wang et al. proposed a overall energy consumption method for data centers based on deep reinforcement learning that coordinates task scheduling and refrigeration equipment [12]. Ali et al. proposed a decentralized implementation of reinforcement learning along with a novel state–action representation to perform the VMP in the data centers to optimize energy consumption and keep the host temperature as low as possible while satisfying Service Level Agreements (SLAs). Experimental results showed an over 17% improvement in energy efficiency and 12% reduction in CPU temperature compared to baseline algorithms [13].
The above works collectively demonstrate the considerable potential of reinforcement learning algorithms in thermal management and energy consumption control. However, the current research paradigm remains predominantly confined to conventional energy efficiency optimization and cooling system regulation, failing to establish synergistic integration with rapidly evolving carbon-neutral technologies such as emissions trading systems, power-to-gas conversion and carbon capture.
Economic approaches are another way to reduce carbon emissions, which can balance emissions reduction and economic costs. Some works have proposed setting annual carbon emission caps as carbon quotas based on historical emissions [14]. Companies exceeding their carbon quotas would be punished financially. To mitigate the wastage of carbon quotas resulting from mismatches with actual emissions, Wang et al. [15] proposed redistributing the carbon quotas flexibly through carbon trading, where companies can buy or sell their carbon quotas based on real-time carbon emissions. Meanwhile, Dou et al. [16] proposed carbon taxes to punish excess emissions.
Furthermore, direct carbon capture and utilization is also effective in carbon reduction. The CC system captures and stores carbon emissions, and the P2G system converts carbon emissions into natural gas for secondary utilization. This cutting-edge technology has great potential for development and plays a positive and effective role in carbon reduction, energy structure optimization, environmental improvement, and economic development. Evaluations conducted by Wang et al. [17] demonstrated that CC can reduce carbon emissions by 76.1%. And Zhang et al. [18] demonstrated the effectiveness of P2G in carbon neutrality by combining it with economic approaches.

3. Distributed Carbon-Neutral Data Center Architecture

Distributed data centers consist of multiple geographically dispersed data centers, which can make better use of geographically renewable energy and reduce the loss of energy transmission by spreading workloads across different areas. In addition, distributed carbon-neutral data centers can be achieved in a number of ways, including the use of renewable energy, energy efficiency improvements, carbon capture and storage technologies, and more. This comprehensive approach allows distributed data centers to more effectively reduce carbon emissions across the system and have a greater impact on the sustainability of the energy system. However, the current deployment paradigm remains primarily centralized and fails to adequately accommodate distributed data center requirements. Therefore, we propose a distributed architecture specifically adapted for distributed data centers, providing solutions to critical challenges including energy management in distributed computing environments.The specific details of the distributed data center architecture are illustrated in Figure 1.
The system consists of multiple data centers interconnected by power lines. By transferring power, data centers can collaborate to optimize the cost of the entire system. In addition, a communication facility is also set up in this system. In a distributed carbon-neutral data center architecture, the sub-data centers cannot communicate with one another. Therefore, the core function of the communication facility is to achieve information synchronization and sharing among sub-data centers, ensuring that each data center can collaborate to optimize the energy efficiency and carbon emission management of the entire system. When there are a large number of sub-data centers, the communication facility will collect the information of each sub-data center and then synchronize the collected information to each sub-data center. The controllers of the sub-data centers that obtain information sharing update and optimize energy allocation, transmission strategies, and carbon capture and storage strategies based on the information to ensure the operational efficiency and sustainability of the entire system. This enables each sub-data center to coordinate its energy allocation and transmission, achieve collaborative optimization, and reduce energy consumption and carbon emissions.
Each data center in this carbon-neutral data center architecture is shown on the right side of Figure 1, which primarily considers the dynamic carbon footprint of daily operations [19]. It mainly consists of four parts: an energy subsystem, a thermal subsystem, a carbon management subsystem, and a controller.
Energy Management Subsystem. Energy is supplied from a variety of sources, including a Power Generation Unit (PGU), wind energy, and the grid. PGUs are an important component of distributed data centers, which can use a variety of fuels for power generation, including natural gas, so they also bring high carbon emissions. To obtain natural gas, data centers can purchase gas through the energy market or convert electricity into gas energy using power-to-gas technology. In addition, by installing wind turbines or partnering with wind farms, data centers can harness wind power to supply some or all of their energy needs. By installing wind turbines on site or contracting with wind farms, data centers can use wind energy as a renewable energy source. At the same time, the data center can also be connected to the grid to obtain a stable power supply. The grid can be used as a backup energy source to cope with high loads or other energy supply shortages. By connecting to the power grid, the data center can realize energy deployment and dispatch energy according to its own needs to meet operational needs such as load and cooling. During the scheduling process, energy is mainly distributed to the IT system and the Computer Room Air Conditioner (CRAC) system. The rest is transferred to other data centers. Batteries provide a steady supply of energy as well as buffering, i.e., discharging in case of energy deficit and charging in case of energy surplus.
Thermal Management Subsystem. In a distributed data center, servers are cooled using AC and CRAC. The thermal system is to ensure that the temperature of the servers is maintained within the appropriate range to ensure the performance and safety. The AC system is driven by the hot water cooling technology [20] and the high-quality waste heat generated by the PGU [21]. Hot water cooling technology is an efficient way of cooling by introducing hot water into the server rack, absorbing the heat generated by the server, and taking it away. CRAC systems, on the other hand, rely primarily on electricity for power. These systems are powered by electricity and provide cooling services to maintain server temperatures. CRAC systems typically include components such as air conditioning equipment, fans, and cooling channels to ensure the right temperature in the data center and avoid server overheating.
Carbon Management Subsystem. In a distributed data center, carbon emissions are produced at different rates when different energy sources are used. To combat this, carbon capture (CC) technology can be used to capture and store carbon emissions generated by a PGU, and this process is a key link in the initial treatment of carbon emissions. The  power-to-gas (P2G) system plays a role on this basis, converting the carbonization task into natural gas or other renewable energy forms and realizing the reuse and conversion of carbon emissions. In a carbon market, carbon credits can be bought and sold freely. For uncaptured carbon emissions, data centers should measure and calculate their own carbon emissions. The decision on whether to buy carbon credits or not should be made after considering the cost-effectiveness of purchasing carbon credits on the carbon market and comparing the cost-effectiveness of using electricity to gas technology. If production is optimized through power-to-gas technology so that the data center can achieve carbon emissions below the quota, the excess quota can be sold to other people who need it, thereby making an economic profit. This makes the management of carbon emissions more flexible and market-based.
Controller. The controller is associated with each data center. In each time slot, the controller independently makes decisions on the following. (1) The amount of natural gas and electricity procured from the power grid: Data centers need to determine the amount of gas they purchase and the power they draw from the grid based on their energy needs and available resources. (2) The internal system CRAC, CC, and P2G energy supply and reasonable distribution: The air conditioning system in the equipment room needs enough power to keep the temperature of the server within the appropriate range. The CC system requires energy to run equipment that captures and stores carbon emissions; the P2G system requires electricity to convert energy and produce natural gas; and the energy distribution needs to be based on the needs and priorities of each system to ensure proper operation and optimal performance. (3) The amount of electricity transferred to other data centers: Power transfer between sub-data centers can be carried out, where one data center can transfer excess power to other data centers to meet its energy needs. (4) The energy allocation and transmission strategy and cooperative optimization across the distributed data center network: This involves sharing information on energy supply and demand through experience buffers, coordinating energy distribution and transfer to optimize the energy efficiency of the entire distributed data center network. This data center architecture supports the sharing of real-time information between data centers through communication devices for optimal control policies.

4. Problem Formulation

4.1. Optimization Objective

The optimization objective in this paper is minimizing the accumulated operational cost of the data center for T time slots [ 0 , T 1 ] . A t = [ A 0 , t , A 1 , t , , A N 1 , t ] is the control action set of N sub-data centers. The control action is composed of six components: the power procurement from the power grid (noted as S E M , i , t ), the natural gas procurement (noted as G E M , i , t ), the amount of energy allocated for the CC system (noted as D C C , i , t ), the amount of energy allocated for the P2G system (noted as D P 2 G , i , t ), battery charging and discharging (noted as S B , i , t ), and the power transmitted to other sub-data centers (noted as [ D T R A , i , 0 , t , D T R A , i , 1 , t D T R A , i , j , t , D T R A , i , N , t ] , where j i represents other sub-data centers). When S B , i , t is positive, it indicates discharge, and when S B , i , t is negative, it in suggests charging. The other control actions are non-negative. C t is the operational cost in time slot t, i.e.,
C t = i = 0 N 1 C e , i , t + C c , t ,
where C e , i , t is the energy cost of the sub-data center i and C c , t is the total carbon cost of the distributed data center. The energy cost of sub-data center is formulated as
C e , i , t = S E M , i , t × P e , i , t + G E M , i , t × P g , i , t + j = 0 N 1 D T R A , i , j , t × P T R A , i , j , t ,
where P e , i , t , P g , i , t , and  P T R A , i , j , t are the instant local electricity, gas, and transmission prices for the location of the sub-data center i, respectively.
The carbon cost is the monetary cost for trading carbon quotas, i.e.,
C c , t = i = 0 N 1 R i , t E C C , i , t q × P c , t ,
where R i , t , E C C , i , t , q, and P c , t are the carbon emissions of the sub-data center i, the amount of carbon emissions which is capped in the sub-data center i, the overall carbon quota in a time slot for the distributed data center, and the instant carbon price, respectively. Note that C c , t can be negative, which means that the data center sells the quota to earn profit.
The problem formulation for each distributed carbon-neutral sub-data center is as follows.

4.2. Power Supply Model

The power supplied in a sub-data center consists of wind power, PGU power generation, the power gird, a battery, and total power transmitted from other sub-data centers, which are noted as S R N , i , t , S P G U , i , t , S E M , t , S B , i , t , and S T R A , i , t , respectively. S R N , i , t is modeled by a piece-wise function [22], i.e.,
S R N , i , t = 0 , ν i , t < ν c i or ν i , t > ν c o , f 2 ( ν i , t ) , ν c i ν i , t < ν r , P r , ν r ν i , t ν c o ,
where ν i , t is the wind speed at location of sub-data center i in the time slot t; ν c i , ν c o , and  ν r are the cut-in, cut-out, and rated wind speeds, respectively. P r is the maximum rated power generation. f 2 ( ν i , t ) is a quadratic function about ν i , t .   S P G U , i , t is formulated by [23]
S P G U , i , t = ( G E M , i , t + G P 2 G , i , t ) × η P G U ,
where η P G U is the capacity efficiency of the PGU; G E M , i , t is the amount of natural gas procurement; and G P 2 G , i , t is the amount of natural gas generated by the P2G system.
During the battery charging and discharging process, it should be ensured that the charge level of the battery is within a certain range, i.e.,
S O C min B i , t S B , i , t B max S O C max ,
where S O C min and S O C max are the lower and upper bounds of battery charge level; B i , t is the quantity of the battery; and B max is the battery capacity.
Meanwhile, any sub-data center should obtain the power which could meet its power consumption demand, i.e.,
S R N , i , t + S P G U , i , t + S E M , i , t + S B , i , t + S T R A , i , t D i , t ,
where D i , t is the power demand of the sub-data center i in the time slot t.

4.3. Power Demand Model

In the proposed architecture, the major power consumption of a sub-data center has five components, i.e.,
D i , t = D I T , i , t + D C R A C , i , t + D C C , i , t + D P 2 G , i , t + j i N 1 D T R A , i , j , t ,
where D I T , i , t , D C R A C , i , t , D C C , i , t , D P 2 G , i , t and D T R A , i , j , t are the power demand that the controller allocates to the IT system, CRAC system, CC system, P2G system, and transmission, respectively. D I T , i , t in this paper is modeled by a linear function [24]:
D I T , i , t = N i × P r × f 1 ( U i , t ) ,
where U i , t [ 0 , 1 ] is the average utilization of servers in the sub-data center i, N i is the amount of servers in the sub-data center i, P r is the rated power of each server, and  f 1 ( U i , t ) is a linear function about U i , t .

4.4. Thermal Model

The refrigeration of the sub-data center includes AC and CRAC. The cooling generation of AC is defined as follows [7]:
Q A C , i , t = H i , t × C O P A C ,
where H i , t is the high-quality waste heat absorbed by AC, C O P A C is the Coefficient of performance. High-quality waste heat is generated by the PGU and high-temperature water cooling of the IT system, i.e.,
H i , t = H P G U , i , t + H I T , i , t ,
H P G U , i , t = ( G E M , i , t + G P 2 G , i , t ) × ( 1 η P G U ) × δ P G U ,
H I T , i , t = D I T , i , t × δ I T ,
where H P G U , i , t and H I T , i , t are the heat which can be absorbed and δ P G U and δ I T are the efficiency of heat recovery for the PGU and IT systems, respectively.
If Q A C , i , t cannot meet the cooling demand of the sub-data center, CRAC will cool the data center as a supplement. The cooling capacity of the CRAC system is noted as Q C R A C , i , t . It is defined as follows [7]:
Q C R A C , i , t = D C R A C , i , t × C O P C R A C ,
where C O P C R A C is COP of the CRAC system.
The cooling capacity generated by AC and CRAC should not be less than the heat not absorbed by the IT system, i.e.,
Q CRAC , i , t + Q A C , i , t D I T , i , t × ( 1 δ I T ) .

4.5. Carbon Emission Model

Due to the different power generation methods, the carbon emission rates of different power sources also vary. The overall released carbon emissions, or  R i , t , can be written as
R i , t = S R N , i , t × r R N + G E M , i , t + G P 2 G , i , t × r G + S E M , i , t × r E M ,
where r R N , r G , and r E M are the carbon emission rates for wind power, natural gas, and the power grid, respectively. In our distributed carbon-neutral data center architecture, only the carbon emissions from on-site power generation, noted as R c , i , t , can be captured by the CC system. R c , i , t is the carbon emissions form S R N , i , t , G E M , i , t , and  G P 2 G , i , t .
According to the power allocated by the controller, a fraction of R c , i , t is captured and stored by the CC system, i.e.,
0 E C C , i , t = D C C , i , t × η C C R c , i , t ,
where E C C , i , t is the captured carbon emissions, which should be less then R c , i , t ; η C C is the energy consumption efficiency during the capture process.
Meanwhile, the P2G system can consume a part of stored carbon emissions and convert them into natural gas, i.e.,
0 E P 2 G , i , t = D P 2 G , i , t × η P 2 G ,
where E P 2 G i , t is the carbon emissions consumed; η P 2 G is the efficiency of the P2G system. The conversion process is defined as
G P 2 G , i , t = E P 2 G , i , t × β P 2 G ,
where β P 2 G is the conversion efficiency.
The stock of carbon emissions should not exceed the storage capacity, i.e.,
0 V i , t = V i , t 1 + E C C , i , t E P 2 G , i , t V m a x , i , t ,
where V i , t is the amount of carbon stored in the container.

5. Multi-Agent Control of Distributed Carbon-Neutral Data Centers

5.1. Markov Decision Process

To solve the optimization control in (1), we formulate a Markov Decision Process (MDP) for this problem. We set the time interval for system decision-making to 1 h. The dynamic changes of the system are defined as follows:

5.1.1. State Space

Since the agent can only observe part of the whole process, its observation space contains only part of the information. In order to cover the factors that influence the decision as much as possible, each sub-data center observation space includes the electricity price, natural gas price, carbon price, real-time wind speed of the sub-data center, carbon storage capacity of the sub-data center, and battery capacity of the sub-data center. It is specifically defined as
s i , t = P e , i , t , P g , i , t , P c , t , v i , t , V i , t , B i , t .
The global state is a state set of system states for every sub-data center, which is written as
s t = s 0 , t , s 1 , t , , s N , t .
These observations provide real-time information on energy costs, environmental impacts, and renewable energy supply for agents to make decisions and optimize. By observing these key factors, the agent can make corresponding decisions based on the current energy market conditions and environmental conditions, as well as its own energy reserves, such as adjusting load distribution, energy storage management and energy purchase, in order to achieve the coordinated optimization of energy management.

5.1.2. Action Space for Every Sub-Data Center

Each sub-data center has separate control over its own energy related action. It needs to control its grid purchases, natural gas purchases, CC system distribution, P2G system distribution, battery charging and discharging, and power transfer to other sub-data centers. It is specifically defined as
a i , t = [ S E M , i , t , G E M , i , t , D C C , i , t , D P 2 G , i , t , S B , i , t , D T R A , i , 0 , t , D T R A , i , 1 , t , , D T R A , i , j , t , , D T R A , i , N , t ] ,
where j i .

5.1.3. Reward

The reward in the proposed MDP is the revenue of the distributed data center based on (2), which is defined as
r t = C t .
The optimization problem aims to maximize the accumulated operational reward of the data centers over T time slots [ 0 , T 1 ] , which can be formulated as
min E t = 0 T 1 C t ,
subject to (6), (7), (15), (17), (18) and (20).

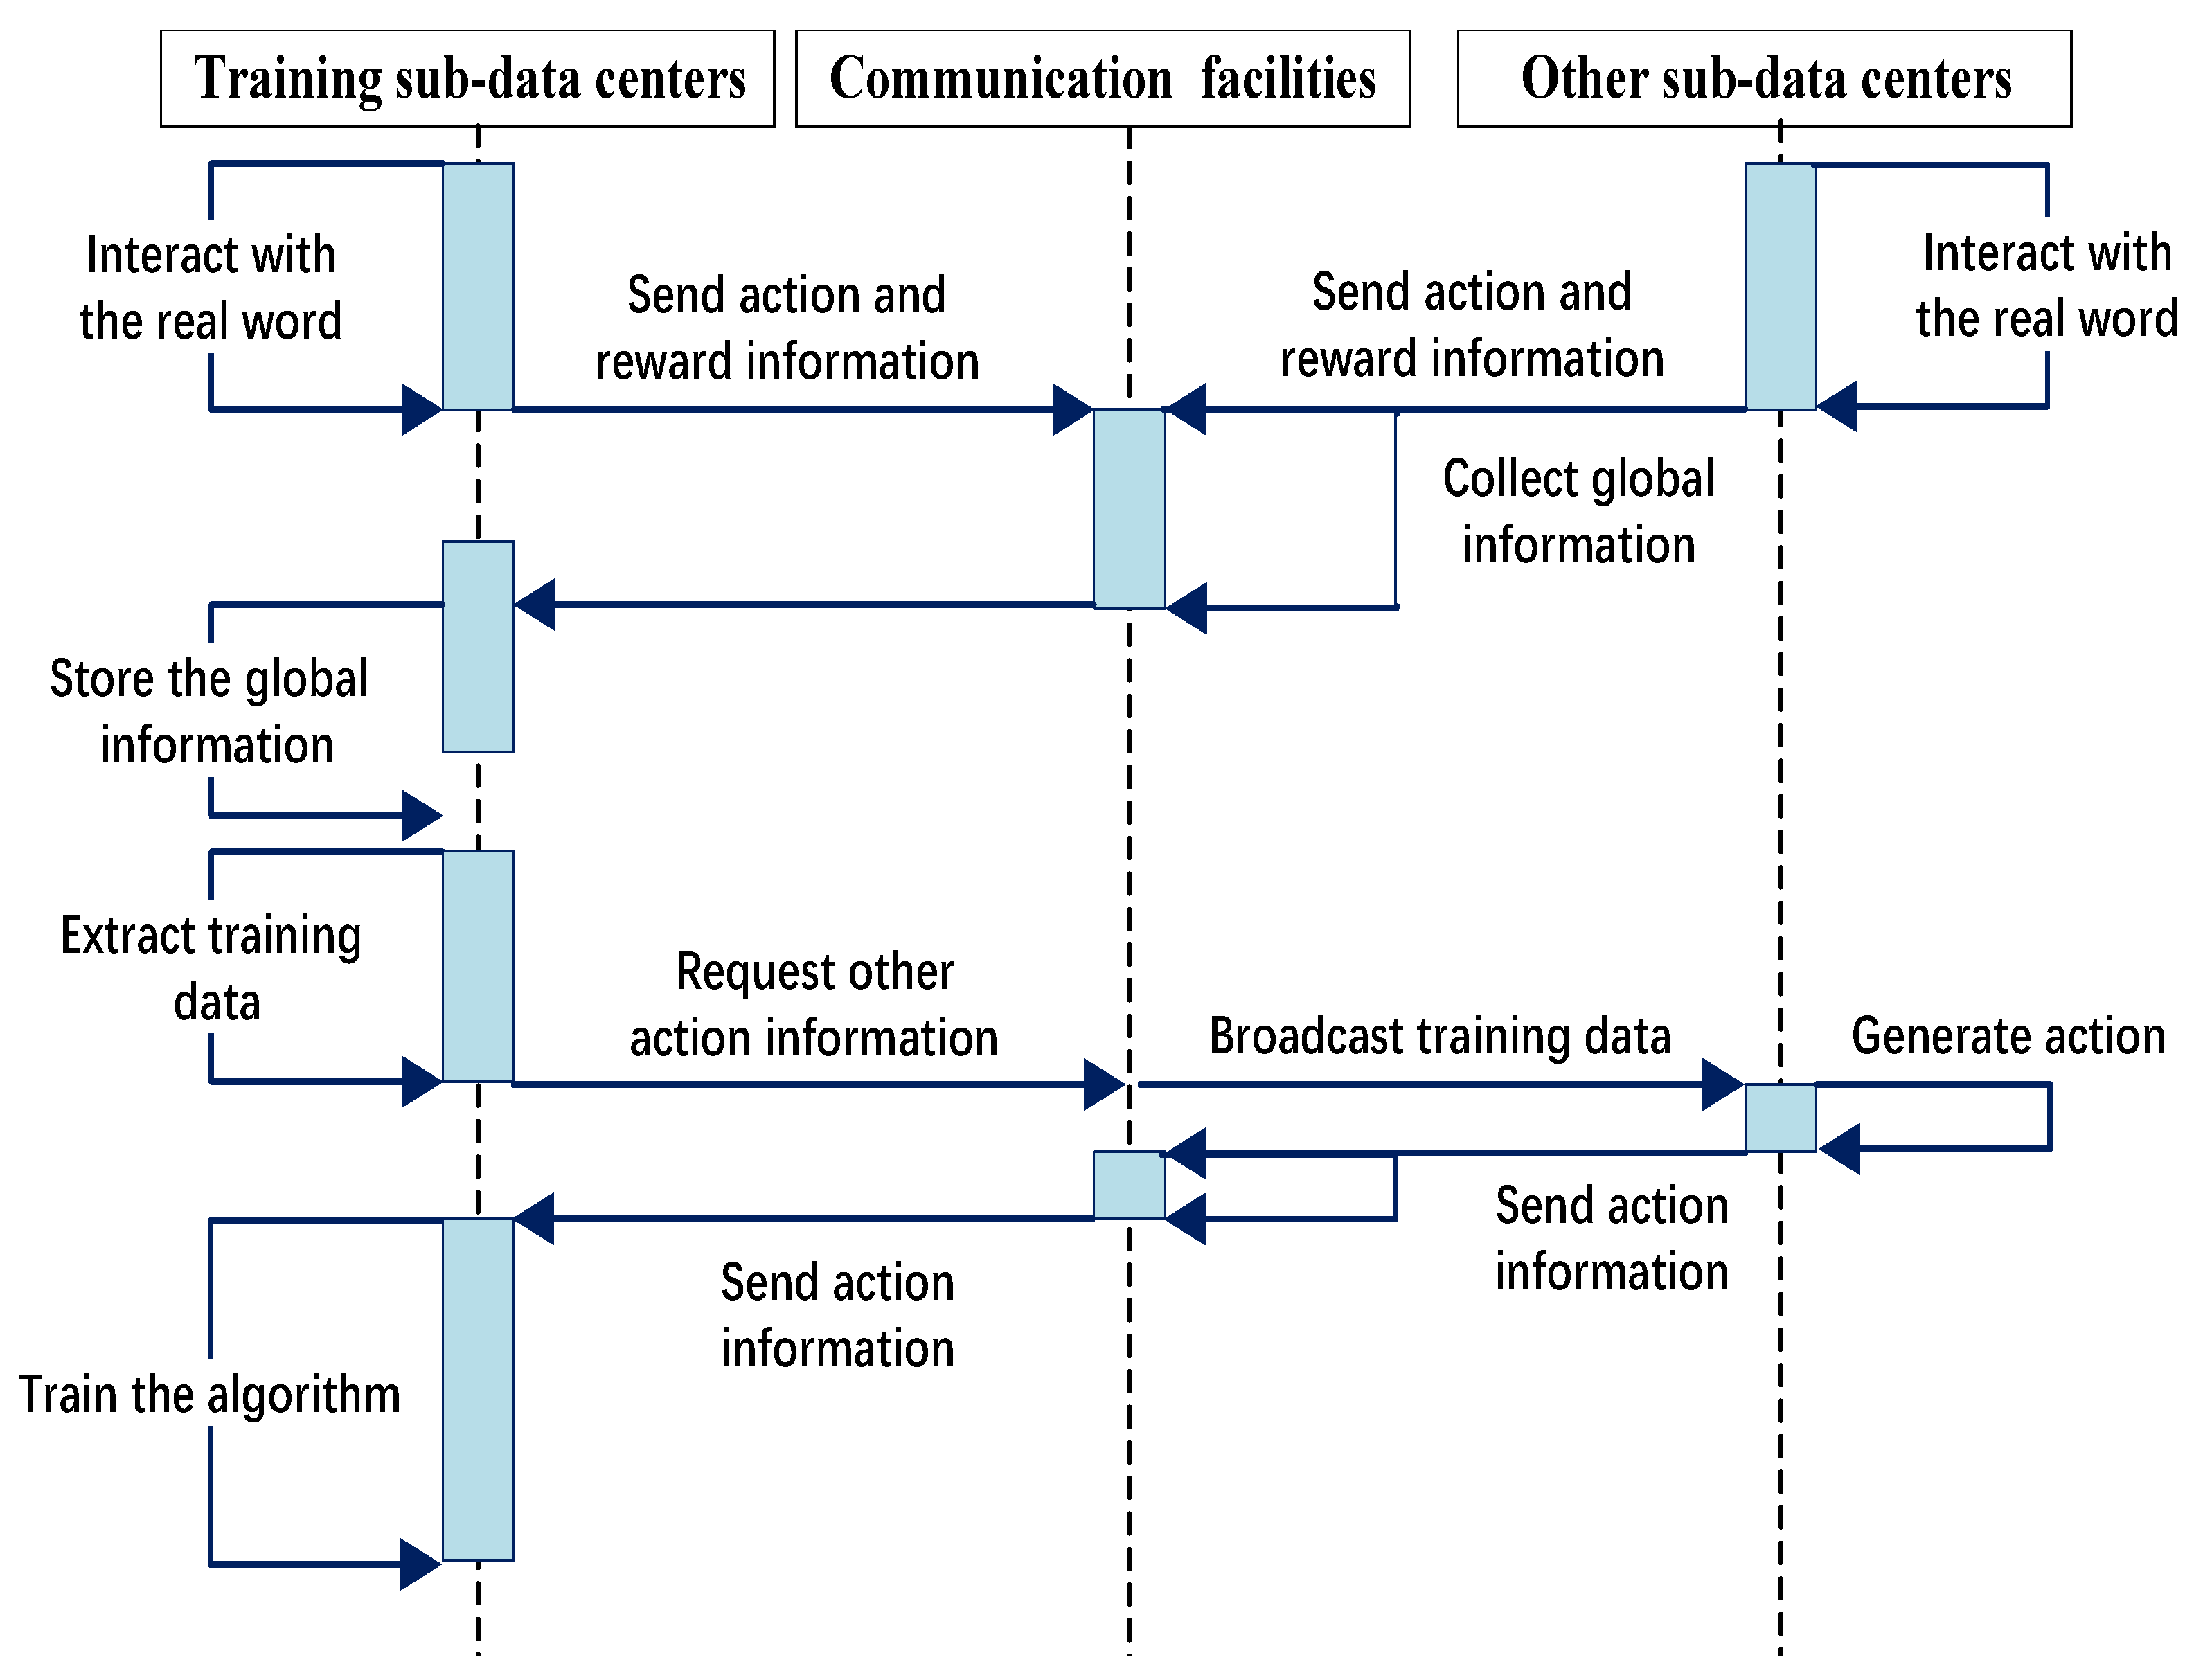
5.2. Communication Mechanism

Based on the MDP of carbon-neutral distributed data center architecture, a multi-agent control algorithm is proposed in this paper, and a communication mechanism is established. Through communication mechanisms, newly generated samples can be mixed with past samples, weakening the temporal correlation between empirical data. In addition, all sub-data center parameters are updated through global status information, and the training process for each sub-data center relies not only on its own experience but also on the experience of all other sub-data centers. Building a communication mechanism ensures that there is no information bias in the training data and that the actions and rewards of each sub-data center are synchronized after the control actions are performed. For each iteration of the algorithm, the communication timing relationship of any sub-data center is shown in Figure 2.
After the control action is performed, the sub-data center sends its action and reward information to the communication facility. When there are a large number of sub-data centers, the communication facility waits until all sub-data centers complete their actions, collects state information from each sub-data center, and uniformly disseminates it across the entire network via broadcast. This one-to-many broadcasting paradigm eliminates the complexity of point-to-point communication while ensuring that all nodes obtain global information in real time. The global information is quadruple, or  s t , a i , t , r t , s t + 1 . To train the multi-agent control algorithm, every sub-data center (noted as training sub-data center) extracts training data and asks for other action information. The communication facilities broadcast the request and send the result to the training sub-data center. After that, the training sub-data center update the multi-agent control algorithm locally.

5.3. Multi-Agent Control Algorithm

Due to the incomplete state information of sub-data centers, a single reinforcement learning algorithm has limited effect in the training and decision-making of multiple independent agents. However, the unified control of all sub-data centers requires a lot of computing resources, and with the increase in the number of sub-data centers under control, the behavior space becomes a dimension explosion problem. Therefore, this paper proposes a multi-agent energy control algorithm based on MADDPG [25]. Each sub-data center uses the global experience for training and calculates its own optimal behavior by guessing the possible behavior of other sub-data centers, so as to ensure the maximalization of the overall revenue in distributed data.
Each sub-data center i contains a network of critics, θ i Q , and a network of actors, θ i π . This section globally enters the status information s t and the behavior a t of all sub-data centers into Q t ( s t , a t ) . The behavior of the child data center i is a i , t = u i s t | θ i π , approximated by θ i π , and the behavior of other sub-data centers requires guessing. Additionally, the algorithm constructs target critic networks, θ i O , and target actor networks, θ i π , with identical neural network architectures to reduce target variability during neural network training. This approach provides more stable feedback, thereby ensuring that the convergence of the proposed algorithm is more stable.

5.3.1. Critic Network Parameter Updates

The critic network in the proposed MADDPG based algorithm is used to approximate the global behavior value function Q t ( s t , a t ) . In this section, the mean square error L θ i Q is used to update the parameters of critic network. Error is defined as
L θ i Q = Q t s t , a t | θ i Q y t 2 ,
where Q t s t , a t | θ i Q is the global behavior value function approximated by the critic network, and  y k , t is the target Q value calculated by Bellman’s formula. The target Q value is defined as
y t = r t s t , a t + γ Q t + 1 s t + 1 , a t + 1 | θ t Q ,
where Q t + 1 is the target critic network θ i π approximated by the next global state s t + 1 and the global behavior a t + 1 , the a t + 1 neutron data center i’s own behavior a i , t is determined by the target actor network θ i π , and other behaviors are guessed by the actor network parameters of other sub-data centers. r t s t , a t is the overall reward of t moments stored in the global buffer. Then, the parameters of critic network are updated by the method of gradient descent, that is,
θ i Q θ i Q + α Q θ i Q L θ i Q .
The target critic network parameters undergo a soft update as follows:
θ l Q τ θ l Q + ( 1 τ ) θ Q ,
where τ 1 indicates the soft update coefficient.

5.3.2. Actor Network Parameter Updates

In this algorithm, the goal of the actor network is to select the most valuable behavior in the current state. In this section, the gradient for actor network updates is defined as
θ i π J ( u i ) = a t Q i s t , a t | θ i Q · θ i π u i o i , t | θ i π ,
where Q i s t , a t | θ i Q , represents the overall reward of the distributed data center evaluated by the ith sub-data center using its own critic network according to its global status and behavior. Its own behavior a i , t is determined by its actor network θ i π , and other sub-data behaviors are obtained by guessing. θ i π can be updated by
θ i π θ i π + α π θ i π J ( u i ) ,
and the target actor network parameters undergo a soft update through the following method:
θ i π τ θ i π + ( 1 τ ) θ i π ,
where τ 1 indicates the soft update coefficient.

5.3.3. Overall Flow of Multi-Agent Algorithm

We formulate the multi-agent control algorithm based on MADDPG, which contains the critic and actor neural network. The critic network evaluates the value of the global state, and the actor network chooses the control action according to the global state. The overall process of the proposed multi-agent control algorithm is shown in Algorithm 1.
Algorithm 1: The Multi-Agent Control Algorithm based on MADDPG.
  Initialize the experience buffer D i for each agent i
  Initialize actor network θ i π and critic network θ i Q for each agent i
  Create target networks θ i π and θ i Q for each agent i by the parameters of θ i π , θ i Q
  1:
  for  t = 0   to  T 1 do
  2:
  Integrate local observations s i , t to get the global state s t
  3:
  Each agent i uses θ i π to generate control behavior a i , t
  4:
  Each agent executes a i , t , receive reward r t
  5:
  Synchronize executed actions a i , t and observed local states s i , t + 1
  6:
  Each agent storage ( s t , a t , r t , s t + 1 ) to the global buffer D i
  7:
  Synchronize actor parameters θ i π for each agent
  8:
  for agent i = 0  to  N 1  do
  9:
     if the number of training samples in D i is greater than M do
  10:
           Sample ( s t , a t , r t , s t + 1 ) from D i
  11:
           According to s t + 1 , use θ i π to generate the behavioral a i , t + 1
  12:
          Communicate with other agents and obtain the other a t
  13:
          Calculate the Q value of s t
  14:
          Update θ i Q by Formulas (26) and (28)
  15:
          Use θ i π to generate behavior a i , t
  16:
          Compute the action gradient by Formula (30)
  17:
          Update θ i π by Formula (31)
  18:
          Soft update θ i π and θ i Q by Formulas (29) and (32)
  19:
       end if
  20:
   end for
  21:
end for

6. Simulation and Results

6.1. Experimental Parameters

To evaluate the performance of the proposed architecture and control algorithm, we implemented the simulation using Python 3.7 with the PyTorch 2.1.1 framework, incorporating multiple real-world data sources including IT workload traces from [26], wind speed measurements obtained from the Inner Mongolia Meteorological Bureau, and electricity pricing data from the Inner Mongolia regional grid. Carbon prices were derived from our previously established hybrid model [27]. Meanwhile, we gathered real-word price information. In the experiment, we assumed that the CO2 containers could store 30% of the average daily carbon emissions and the carbon quota was 70% of the estimated historical emissions [28]. The parameter settings used in the simulation are shown in Table 1.

6.2. Experimental Method

The comparison models included two categories: algorithm comparison and architecture comparison.

6.2.1. Comparison Algorithms

For algorithm comparison, this experiment first compared the MADDPG-based algorithm proposed in this paper with the Centralized DDPG algorithm at the level of a small number of agents (distributed data center contained three sub-data centers). A Centralized DDPG algorithm means that in a distributed data center, all sub-data centers are trained and controlled by a unified global DDPG algorithm. In contrast, the algorithm proposed in this paper introduces a multi-agent collaboration and communication mechanism to optimize the global control strategy through information sharing and collaboration among sub-data centers. Secondly, the multi-agent control algorithm based on MADDPG was compared with the DDPG algorithm independently deployed in each sub-data center. In the independent deployment of DDPG algorithms in each sub-data center, each data center trains and controls its own DDPG algorithm independently, with no information sharing and collaboration. In contrast, the algorithm proposed in this paper enables each data center to learn and optimize the global control strategy through the communication mechanism between sub-data centers. By comparing these three algorithms, we could evaluate the advantages and performance of the MADDPG-based multi-agent algorithm for distributed data center control.

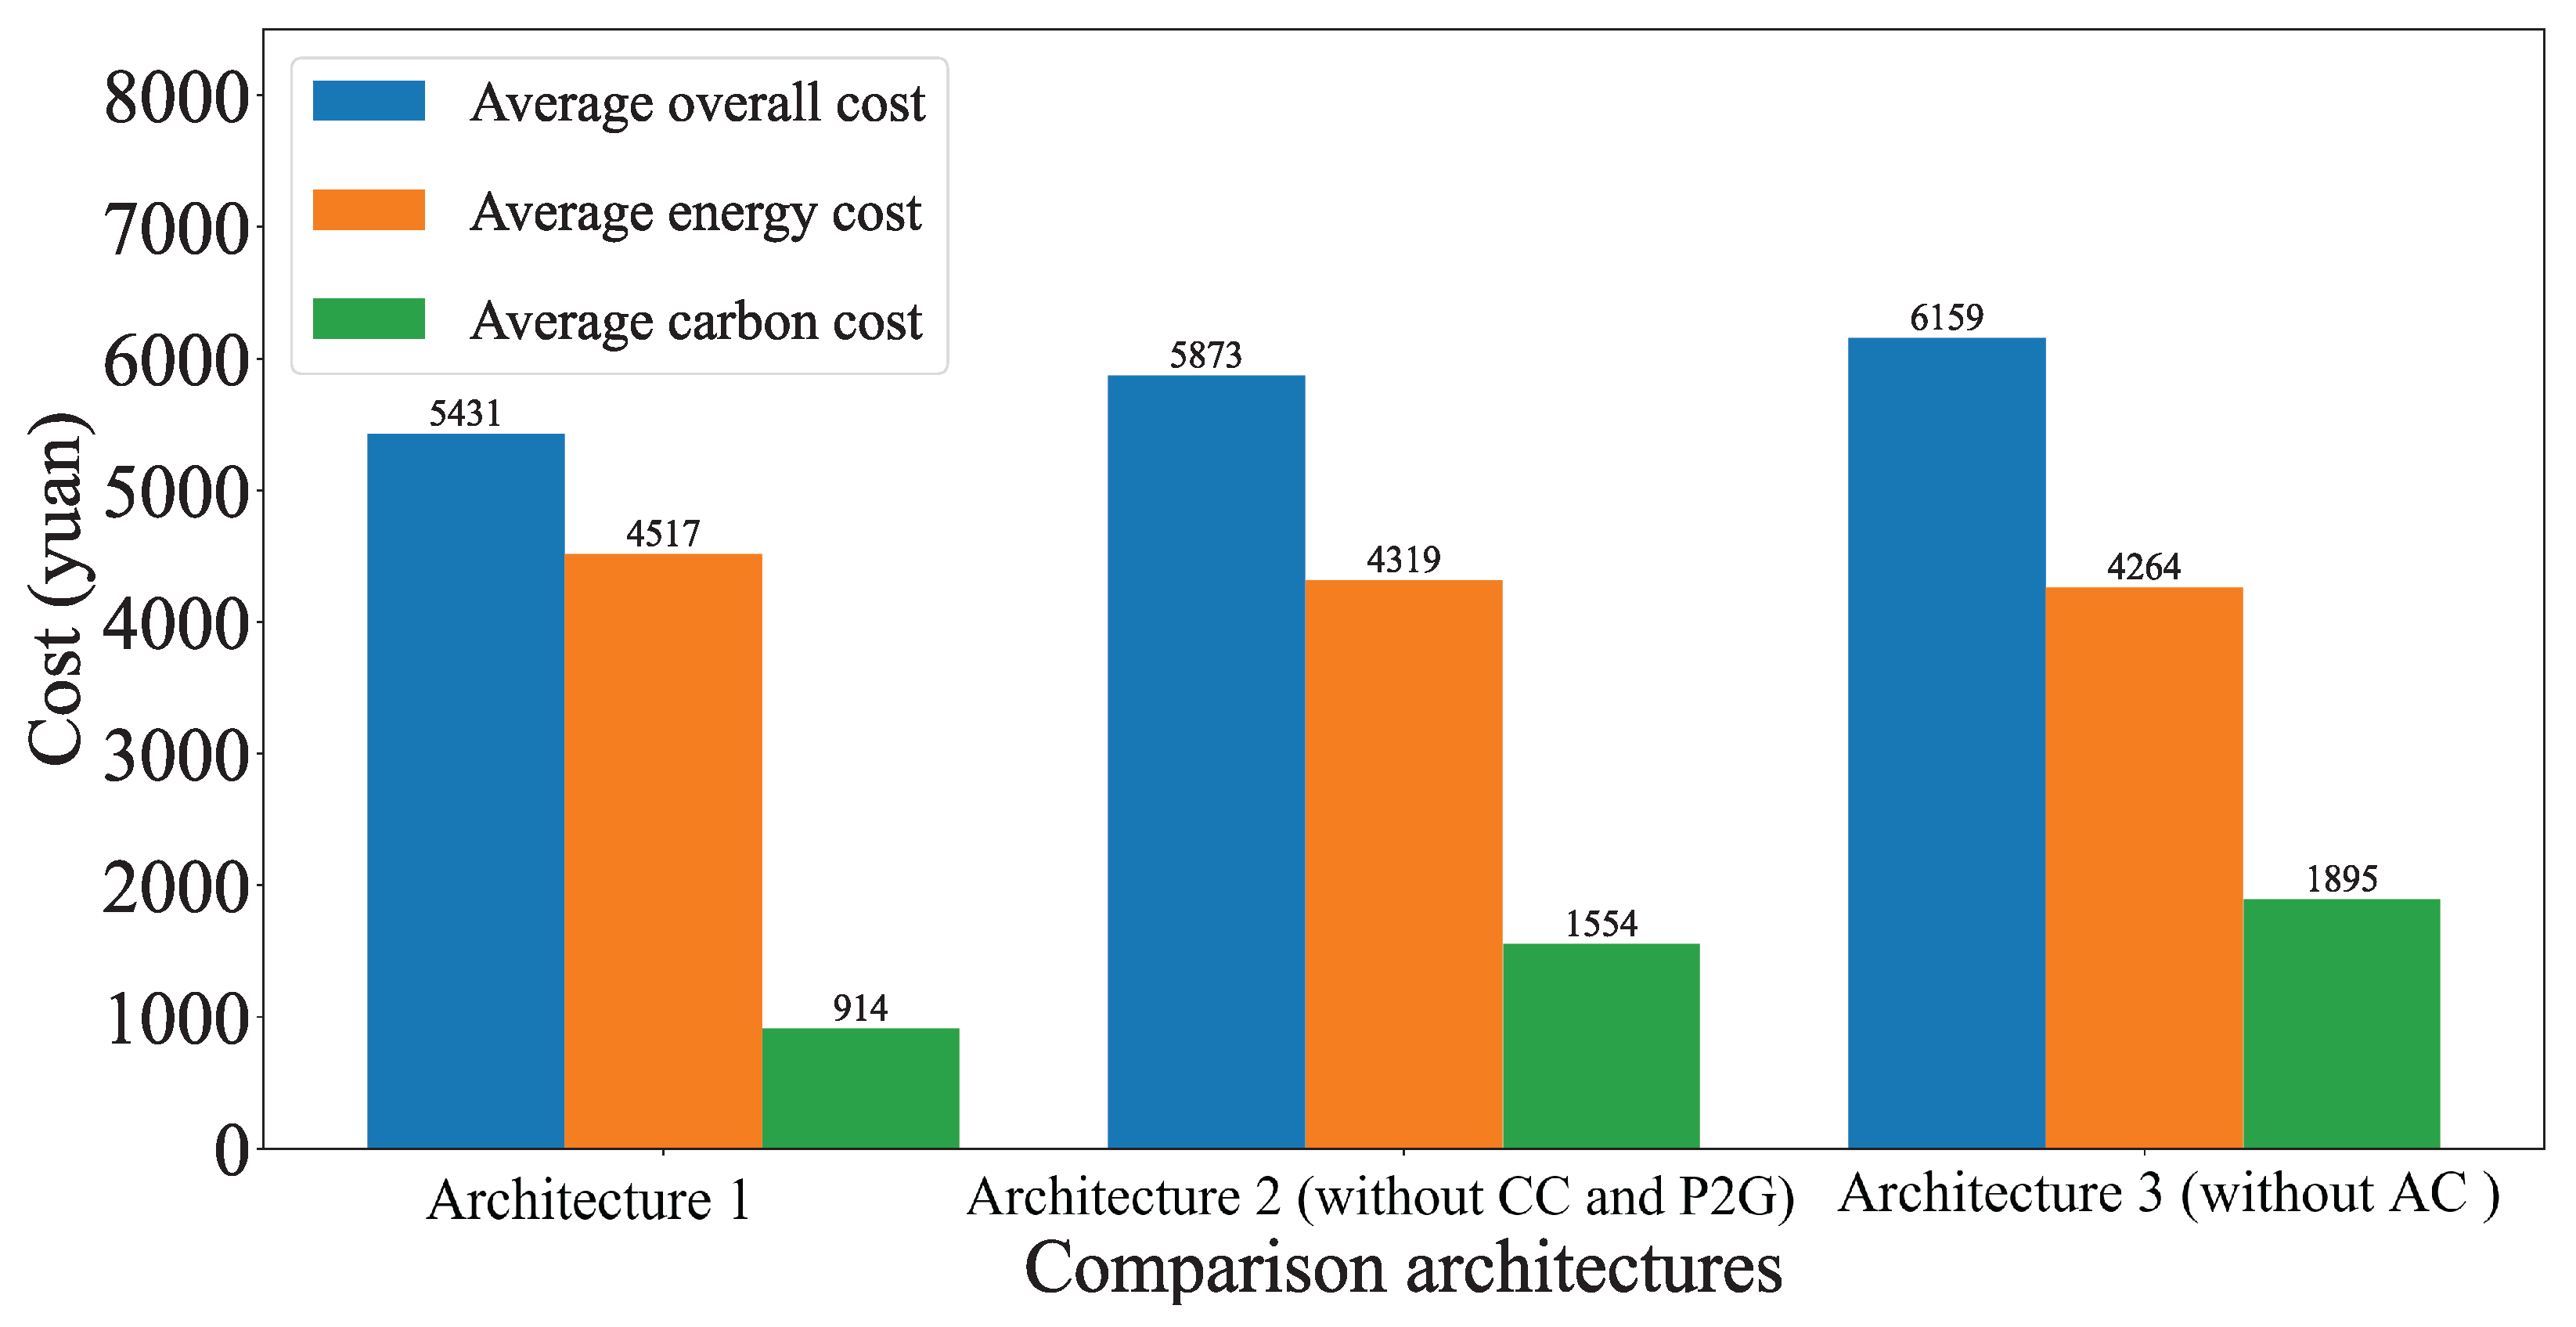
6.2.2. Comparison Architectures

For data center architecture performance evaluation, this chapter details how we set ablation experiments for the proposed distributed carbon-neutral data center architecture, as shown in Table 2. Architecture 1 contains all the components of the proposed distributed carbon-neutral data center architecture; Architecture 2 eliminates data center CC and P2G systems to validate the impact of these two carbon-neutral technologies on distributed data centers. Architecture 3 eliminates the data center AC system to verify the impact of cooling energy consumption on carbon neutrality in distributed data centers.
This section compares the multi-agent control algorithm based on MADDPG with other algorithms in terms of total cost, energy cost, and carbon cost to evaluate economic benefits, resource utilization, and environmental impact.

6.3. Performance Analysis

Figure 3 shows the loss of these algorithms. During the initial training phase (steps 200–300), the critic network losses of all three algorithms remained relatively high and exhibited significant fluctuations. This indicates that the models’ predictions of reward values were insufficiently accurate during the exploratory phase, necessitating gradual optimization through continued learning. As the number of training steps increased, the loss values began to decline rapidly, demonstrating that the training methodology enabled the algorithms to efficiently learn effective control policies.
In the intermediate training phase (steps 400–1200), the loss values of all algorithms stabilized, with MADDPG and Centralized DDPG exhibiting particularly outstanding performance. By step 1200, the loss values of MADDPG and Centralized DDPG nearly converged, with their loss curves closely overlapping and stabilizing at an extremely low level (<0.035). This demonstrates their superior stability and optimization capability, indicating that their reward value predictions achieved a high degree of consistency.
Although Centralized DDPG exhibits theoretical superiority, its fully centralized architecture poses significant challenges for practical implementation in distributed systems. Consequently, the hybrid framework of MADDPG emerges as a more feasible alternative, combining the benefits of centralized training with decentralized execution to achieve both performance and practicality
The cost of these algorithms is shown in Figure 4. The simulation results reveal significant differences in cost-effectiveness among the three algorithms. A detailed cost breakdown demonstrates that compared to Independent DDPG, MADDPG achieved a 12.5% reduction in energy costs and a 7.2% decrease in carbon emission costs. Although MADDPG exhibited 7.3% higher energy costs and 3.7% higher carbon costs than Centralized DDPG, its practical implementability in distributed data centers—where Centralized DDPG is difficult to deploy—renders it a valuable solution despite these relatively minor performance gaps.
In terms of total costs, Centralized DDPG achieved the lowest value due to its global optimization capability, representing the theoretical optimum. The proposed MADDPG algorithm showed a 6.1% higher total cost than Centralized DDPG but demonstrated an 11.6% reduction compared to Independent DDPG. This performance validates MADDPG’s effectiveness in balancing system optimization with the practical implementation requirements of distributed environments. The optimization results further indicate that MADDPG maintains near-optimal performance while overcoming the deployment limitations inherent in fully centralized approaches.
The comparative analysis suggests that while Centralized DDPG remains the theoretical benchmark, MADDPG offers the optimal trade-off between performance and practicality for real-world distributed systems. Its ability to significantly outperform Independent DDPG while approaching Centralized DDPG’s optimal results, combined with its feasible implementation in distributed architectures, establishes MADDPG as a solution for data center optimization challenges.
Figure 5 shows the overall cost, energy cost, and carbon cost of these architectures. The experimental results clearly demonstrate the value of implementing AC, CC, and P2G technologies in distributed data centers. The deployment of CC, P2G, and AC carbon reduction technologies necessitates additional energy expenditures to facilitate carbon fixation and reuse processes, representing an energy-for-carbon tradeoff. Specifically, the implementation of CC and P2G systems incurs a 4.58% increase in energy costs, while AC systems require a 5.93% energy cost increment. However, these technologies deliver substantial environmental benefits: the combined CC and P2G system achieved a 41.18% reduction in carbon emission costs, with the AC system demonstrating even greater efficacy at 61.77% carbon emission reduction. Crucially, the proportional savings in carbon costs significantly outweigh the relative increases in energy consumption. Comprehensive cost analysis confirmed the economic viability of this approach, with CC and P2G deployment yielding a net 7.52% reduction in total operational costs, and the full integration with AC technology generating 11.82% total cost savings.
These findings validate the strategic adoption of these technological frameworks, where targeted energy investments in carbon fixation and reuse processes ultimately produce both environmental and economic gains through substantial net cost reductions.

7. Conclusions

In this paper, we present a novel carbon-neutral architecture for distributed data centers that complies with carbon trading policies while incorporating emerging technologies such as CC and P2G to enable energy and carbon quota sharing. Our proposed multi-agent control algorithm, based on MADDPG with communication mechanisms, effectively optimizes overall costs.
The algorithm’s performance was rigorously evaluated through comprehensive simulations. As shown in Figure 3, the training process demonstrated stable convergence, with MADDPG achieving near-optimal performance (loss < 0.035) comparable to Centralized DDPG while maintaining practical implementability. Comparative cost analysis (Figure 4) revealed that MADDPG reduced energy costs by 12.5% and carbon emissions by 7.2% compared to Independent DDPG, with only a 6.1% higher total cost than the theoretical optimum of Centralized DDPG.
The integration of AC, CC, and P2G technologies proved particularly impactful (Figure 5). Deploying the CC and P2G system for the distributed data center increased the energy cost by 4.58%, reduced the carbon cost by 41.18%, and thus achieved an overall cost reduction of 7.52%. In addition, when the data center had the AC system, the overall cost was reduced by 11.82%, including an increase in energy cost by 5.93% and a decrease in carbon cost by 61.77%.

8. Limitations and Future Work

The current study presents several limitations that suggest valuable directions for future research. First, while we provide a comparative analysis of three architectural configurations, the evaluation does not consider geographical variations in cooling system efficiency. The performance of AC and CRAC systems is known to be sensitive to local climate conditions, but incorporating this dimension would require detailed temperature data from each data center location. We plan to further explore and study solutions to this limitation in subsequent research.
Second, our economic analysis currently focuses on operational expenditures without accounting for the capital costs of deploying carbon-neutral technologies. Future work will model the fixed costs associated with equipment procurement (absorption chillers, carbon capture systems, and power conversion devices) and evaluate their return on investment timelines. This extension will provide more comprehensive guidance for operators considering the adoption of these emerging technologies.
The communication architecture represents another area for improvement. Our current implementation requires full state information sharing across all nodes, which may introduce practical latency in large-scale deployments. We intend to investigate decentralized optimization strategies where nodes can make local decisions based on partial system states, potentially using federated learning techniques to maintain coordination while reducing communication overhead.
Finally, Condition (7) simplifies battery modeling by neglecting degradation effects. In actual operation, battery capacity typically decreases with charge/discharge cycles and calendar aging. Our next research phase will incorporate empirical degradation models to improve the long-term accuracy of energy storage predictions, including factors like depth-of-discharge impacts and thermal stress coefficients.

Author Contributions

W.C.: Conceptualization, Formal analysis, Software, Writing—original draft. C.L.: Methodology, Validation, Writing—review and editing. G.R.: Data curation, Software. J.W.: Writing—review and editing. All authors have read and agreed to the published version of the manuscript.

Funding

This research was funded in part by the scientific research project of the National Natural Science Foundation of China (62362055), the Inner Mongolia Autonomous Region Key R&D and Achievement Transformation Program Project (2022YFSJ0013, 2023YFHH0052, 2023KJHZ0001, 2024SKYPT0012), the Research Program for Young Talents of Inner Mongolia Colleges (NJYT22084, NJYT23055), the Natural Science Foundation of Inner Mongolia (2023MS06008, 2025QN06026), the Key Research & Development Program of Erdos (YF20232328), the Scientific Research Program for Inner Mongolia Colleges (JY20240060, JY20250066) and Special Programs for Research in First-Class Disciplines (YLXKZX-NGD-026).

Data Availability Statement

Data will be made available on request.

Conflicts of Interest

The authors declare that they have no known competing financial interests or personal relationships that could have appeared to influence the work reported in this paper.

Nomenclature

Acronyms
Dec-POMDPDecentralized Partially Observable Markov Decision Process
MADDPGMulti-Agent Deep Deterministic Policy Gradient
CCCarbon capture
P2GPower-to-gas
ACAbsorption chiller
VPPVirtual Power Plant
PUEPower Usage Effectiveness
MBRLModel-Based Reinforcement Learning
ATESAquifer Thermal Energy Storage
DQN-MSPDeep Q-Network algorithm
SLAService Level Agreement
PGUPower Generation Unit
CRACComputer Room Air Conditioner
MDPMarkov Decision Process
ITInformation Technology
Parameters and Variables
A t Control action set of N sub-data centers
S E M , i , t Power procurement from power grid
G E M , i , t Natural gas procurement
D C C , i , t Amount of energy allocated for CC system
D P 2 G , i , t Amount of energy allocated for P2G system
S B , i , t Battery charging and discharging
D T R A , i , N , t Power transmitted to other sub-data centers
C t Operational cost
C e , i , t Energy cost of sub-data center
C c , t Total carbon cost of distributed data center
P e , i , t Instant local electricity prices for location of sub-data center i
P g , i , t Instant local gas prices for location of sub-data center i
P T R A , i , i , t Instant local transmission prices for location of sub-data center i
R i , t Carbon emissions of sub-data center i
E C C , i , t Amount of carbon emissions captured
qOverall carbon quota in time slot for distributed data center
P c , t Instant carbon price
S R N , i , t Electricity generated by wind power from other sub-data centers
S P G U , i , t Electricity generated by PGU from other sub-data centers
S E M , t Electricity generated by power grid from other sub-data centers
S T R A , i , t Total power transmitted from other sub-data centers
ν i , t Wind speed at location of sub-data center
ν c i Cut-in wind speed
ν c o Cut-out wind speed
ν r Rated wind speed
P r Maximum rated power generation
f 2 ( ν i , t ) Quadratic function about ν i , t
η P G U Capacity efficiency of PGU
G P 2 G , i , t Amount of natural gas generated by P2G system
S O C min Lower bound of battery charge level
S O C max Upper bound of battery charge level
B i , t Quantity of battery
B max Battery capacity
D i , t Power demand of sub-data center i in time slot t
D I T , i , t Power demand allocated to IT system in sub-data center i at time t
D C R A C , i , t Power demand allocated to CRAC system in sub-data center i at time t
N i Number of servers in sub-data center i
f 1 ( U i , t ) Linear function of server utilization in sub-data center i at time t
U i , t Average server utilization in sub-data center i at time t ( [ 0 , 1 ] )
Q A C , i , t Cooling capacity of AC system in sub-data center i at time t
Q C R A C , i , t Cooling capacity of CRAC system in sub-data center i at time t
H i , t High-quality waste heat absorbed in sub-data center i at time t
H P G U , i , t Heat from Power Generation Unit in sub-data center i at time t
H I T , i , t Heat from IT system in sub-data center i at time t
C O P A C Coefficient of performance for AC system
C O P C R A C Coefficient of performance for CRAC system
δ P G U Heat recovery efficiency for PGU system
δ I T Heat recovery efficiency for IT system
R c , i , t Capturable carbon emissions in sub-data center i at time t
V i , t Carbon storage level in sub-data center i at time t
V m a x Maximum carbon storage capacity
η C C Carbon capture efficiency
η P 2 G Power-to-gas conversion efficiency
β P 2 G Natural gas generation efficiency in P2G system
r R N Carbon emission rate for renewable energy
r G Carbon emission rate for natural gas
r E M Carbon emission rate for grid power
s i , t State observation for sub-data center i at time t
s t Global system state at time t
a i , t Action vector for sub-data center i at time t
r t Reward (opposite of cost)
( s t , a i , t , r t , s t + 1 ) Quadruple global information (state, action, reward, next state)
θ i Q Critic network parameters for sub-data center i
θ i π Actor network parameters for sub-data center i
θ i Q Target critic network parameters for sub-data center i
θ i π Target actor network parameters for sub-data center i
Q t ( s t , a t ) Global behavior value function at time t
u i ( s t | θ i π ) Policy function for sub-data center i
L θ i Q Mean square error for critic network update
y t Target Q-value calculated by Bellman equation
γ Discount factor for future rewards
α Q Learning rate for critic network
α π Learning rate for actor network
τ Soft update coefficient ( τ 1 )
θ i π J ( u i ) Policy gradient for actor network update
o i , t Local observation for sub-data center i at time t
a t + 1 Next global action vector
r t ( s t , a t ) Immediate reward at time t
Q t + 1 ( s t + 1 , a t + 1 ) Next state–action value estimate

References

  1. International Energy Agency. Data Centers and Data Transmission Networks. 2023. Available online: https://www.iea.org/reports/data-centres-and-data-transmission-networks (accessed on 20 March 2023).
  2. Zhang, R.; Yan, K.; Li, G.; Jiang, T.; Li, X.; Chen, H. Privacy-preserving decentralized power system economic dispatch considering carbon capture power plants and carbon emission trading scheme via over-relaxed ADMM. Int. J. Electr. Power Energy Syst. 2020, 121, 106094. [Google Scholar] [CrossRef]
  3. Ma, Y.; Wang, H.; Hong, F.; Yang, J.; Chen, Z.; Cui, H.; Feng, J. Modeling and optimization of combined heat and power with power-to-gas and carbon capture system in integrated energy system. Energy 2021, 236, 121392. [Google Scholar] [CrossRef]
  4. Liu, C.; Wan, J.; Li, L.; Ren, G.; Wang, X. Distributed Energy Management for Carbon-Neutral Data Centers. In Proceedings of the 2024 IEEE International Symposium on Parallel and Distributed Processing with Applications (ISPA), Kaifeng, China, 30 October–2 November 2024. [Google Scholar]
  5. Yan, Q.; Zhang, M.; Lin, H.; Li, W. Two-stage adjustable robust optimal dispatching model for multi-energy virtual power plant considering multiple uncertainties and carbon trading. J. Clean. Prod. 2022, 336, 130400. [Google Scholar] [CrossRef]
  6. He, H.; Shen, H. Minimizing the operation cost of distributed green data centers with energy storage under carbon capping. J. Comput. Syst. Sci. 2021, 118, 28–52. [Google Scholar] [CrossRef]
  7. Haywood, A.; Sherbeck, J.; Phelan, P.; Varsamopoulos, G.; Gupta, S.K. Thermodynamic feasibility of harvesting data center waste heat to drive an absorption chiller. Energy Convers. Manag. 2012, 58, 26–34. [Google Scholar] [CrossRef]
  8. Wan, J.; Duan, Y.; Gui, X.; Liu, C.; Li, L.; Ma, Z. SafeCool: Safe and energy-efficient cooling management in data centers with model-based reinforcement learning. IEEE Trans. Emerg. Top. Comput. Intell. 2023, 7, 1621–1635. [Google Scholar] [CrossRef]
  9. Leindals, L.; Grønning, P.; Dominković, D.F.; Junker, R.G. Context-aware reinforcement learning for cooling operation of data centers with an aquifer thermal energy storage. Energy AI 2024, 17, 100395. [Google Scholar] [CrossRef]
  10. Chen, Y.; Guo, W.; Liu, J.; Shen, S.; Lin, J.; Cui, D. A multi-setpoint cooling control approach for air-cooled data centers using the deep Q-network algorithm. Meas. Control 2024, 57, 782–793. [Google Scholar] [CrossRef]
  11. Bin Mahbod, M.H.; Chng, C.B.; Lee, P.S.; Chui, C.K. Energy saving evaluation of an energy efficient data center using a model-free reinforcement learning approach. Appl. Energy 2022, 322, 119432. [Google Scholar] [CrossRef]
  12. Wang, S.; Qin, L.; Ma, C.; Wu, W. Research on overall energy consumption optimization method for data center based on deep reinforcement learning. J. Intell. Fuzzy Syst. 2023, 44, 7333–7349. [Google Scholar]
  13. Aghasi, A.; Jamshidi, K.; Bohlooli, A.; Javadi, B. A decentralized adaptation of model-free Q-learning for thermal-aware energy-efficient virtual machine placement in cloud data centers. Comput. Netw. 2023, 224, 109612. [Google Scholar] [CrossRef]
  14. Chen, B.; Zhang, H.; Li, W.; Du, H.; Huang, H.; Wu, Y.; Liu, S. Research on provincial carbon quota allocation under the background of carbon neutralization. Energy Rep. 2022, 8, 903–915. [Google Scholar] [CrossRef]
  15. Wang, Y.; Li, Z.; Wen, F.; Palu, I.; Sun, Y.; Zhang, L.; Gao, M. Energy management for an integrated energy system with data centers considering carbon trading. In Proceedings of the 2020 IEEE Power & Energy Society General Meeting (PESGM), Montreal, QC, Canada, 2–6 August 2020; pp. 1–5. [Google Scholar]
  16. Dou, H.; Qi, Y.; Wei, W.; Song, H. Carbon-aware electricity cost minimization for sustainable data centers. IEEE Trans. Sustain. Comput. 2017, 2, 211–223. [Google Scholar] [CrossRef]
  17. Wang, R.; Wen, X.; Wang, X.; Fu, Y.; Zhang, Y. Low carbon optimal operation of integrated energy system based on carbon capture technology, LCA carbon emissions and ladder-type carbon trading. Appl. Energy 2022, 311, 118664. [Google Scholar] [CrossRef]
  18. Zhang, R.; Jiang, T.; Li, F.; Li, G.; Chen, H.; Li, X. Bi-level strategic bidding model for P2G facilities considering a carbon emission trading scheme-embedded LMP and wind power uncertainty. Int. J. Electr. Power Energy Syst. 2021, 128, 106740. [Google Scholar] [CrossRef]
  19. Reel, S.; Rouse, S.; Obe, W.V.; Doherty, P. Estimation of stature from static and dynamic footprints. Forensic Sci. Int. 2012, 219, 283.e1–283.e5. [Google Scholar] [CrossRef]
  20. Zimmermann, S.; Tiwari, M.K.; Meijer, I.; Paredes, S.; Michel, B.; Poulikakos, D. Hot water cooled electronics: Exergy analysis and waste heat reuse feasibility. Int. J. Heat Mass Transf. 2012, 55, 6391–6399. [Google Scholar] [CrossRef]
  21. Li, L.; Mu, H.; Gao, W.; Li, M. Optimization and analysis of CCHP system based on energy loads coupling of residential and office buildings. Appl. Energy 2014, 136, 206–216. [Google Scholar] [CrossRef]
  22. Carrillo, C.; Montaño, A.O.; Cidrás, J.; Díaz-Dorado, E. Review of power curve modelling for wind turbines. Renew. Sustain. Energy Rev. 2013, 21, 572–581. [Google Scholar] [CrossRef]
  23. Li, L.; Yu, S.; Mu, H.; Li, H. Optimization and evaluation of CCHP systems considering incentive policies under different operation strategies. Energy 2018, 162, 825–840. [Google Scholar] [CrossRef]
  24. Dayarathna, M.; Wen, Y.; Fan, R. Data center energy consumption modeling: A survey. IEEE Commun. Surv. Tutor. 2015, 18, 732–794. [Google Scholar] [CrossRef]
  25. Lowe, R.; Wu, Y.I.; Tamar, A.; Harb, J.; Pieter Abbeel, O.; Mordatch, I. Multi-agent actor-critic for mixed cooperative-competitive environments. In Proceedings of the Advances in Neural Information Processing Systems 30 (NIPS 2017), Long Beach, CA, USA, 4–9 December 2017; pp. 6382–6393. [Google Scholar]
  26. Wan, J.; Gui, X.; Zhang, R.; Fu, L. Joint cooling and server control in data centers: A cross-layer framework for holistic energy minimization. IEEE Syst. J. 2018, 12, 2461–2472. [Google Scholar] [CrossRef]
  27. Ren, G.; Luan, H.; Wan, J.; Li, L.; Wang, X. Hybrid carbon price prediction model based on signal decomposition. J. Inn. Mong. Univ. Technol. 2023, 42, 355–362. [Google Scholar]
  28. Shi, B.; Li, N.; Gao, Q.; Li, G. Market incentives, carbon quota allocation and carbon emission reduction: Evidence from China’s carbon trading pilot policy. J. Environ. Manag. 2022, 319, 115650. [Google Scholar] [CrossRef]
  29. Le, T.; Wright, D. Scheduling workloads in a network of datacentres to reduce electricity cost and carbon footprint. Sustain. Comput. Inform. Syst. 2015, 5, 31–40. [Google Scholar] [CrossRef]
Figure 1. Distributed carbon-neutral data center architecture.
Energies 18 02861 g001
Figure 2. Communication timing relationship between sub-data centers.
Energies 18 02861 g002
Figure 3. Comparison of loss for critic networks in different algorithms.
Energies 18 02861 g003
Figure 4. Comparison of cost for different algorithms.
Energies 18 02861 g004
Figure 5. Comparison of cost for different architectures.
Energies 18 02861 g005
Table 1. Simulation parameter settings.
ParameterValueParameterValue
N i 4000 P r 320 (W)
η P G U 0.3 [23] δ P G U 0.8 [21]
v c i 2.5 (m/s) [22] v r 12.5 (m/s) [22]
v C O 25 (m/s) [22] C O P A C 0.7 [7]
C O P C R A C 4 [7] δ I T 0.2 [20]
r R N 10 (kg/kWh) [29] r G 433 (kg/kWh) [29]
r E M 185 (kg/kWh) [29] n c c 2 (kg/kWh) [3]
η P 2 G 1.02 (kg/kWh) [3] β P 2 G 0.55
Table 2. Whether the architecture include CC, P2G, and AC systems.
CCP2GAC
Architecture 1
Architecture 2××
Architecture 3×
Disclaimer/Publisher’s Note: The statements, opinions and data contained in all publications are solely those of the individual author(s) and contributor(s) and not of MDPI and/or the editor(s). MDPI and/or the editor(s) disclaim responsibility for any injury to people or property resulting from any ideas, methods, instructions or products referred to in the content.

