Article

Dynamic Characteristics Analysis of a Multi-Pile Wind Turbine Under the Action of Wind–Seismic Coupling

1
School of Mechanical Engineering and Automation, Fuzhou University, Fuzhou 350108, China
2
Fujian Provincial Key Laboratory of Terahertz Functional Devices and Intelligent Sensing, Fuzhou University, Fuzhou 350108, China
3
Department of Mechanical and Automation Engineering, The Chinese University of Hong Kong, Hong Kong 999077, China
*
Authors to whom correspondence should be addressed.
Energies 2025, 18(11), 2833; https://doi.org/10.3390/en18112833
Submission received: 28 December 2024 / Revised: 19 May 2025 / Accepted: 22 May 2025 / Published: 29 May 2025
(This article belongs to the Special Issue Recent Advances in Wind Turbines)

Abstract

:
When analyzing the dynamics of wind turbines under the action of wind and ground motion, mass–point models cannot accurately predict the dynamic response of the structure. Additionally, the coupling effect between the pile foundation and the soil affects the vibration characteristics of the wind turbine. In this paper, the dynamic response of a DTU 10 MW wind turbine under the coupling effect of wind and an earthquake is numerically studied through the combined simulation of finite-element software ABAQUS 6.14-4 and OpenFAST v3.0.0. A multi-pile foundation is used as the foundation of the wind turbine structure, and the interaction between the soil and the structure is simulated by using p-y curves in the numerical model. Considering the coupling effect between the blade and the tower as well as the soil–structure coupling effect, this paper systematically investigates the vibration response of the blade–tower coupled structure under dynamic loads. The study shows that: (1) the blade vibration has a significant impact on the tower’s vibration characteristics; (2) the ground motion has varying effects on blades in different positions and will increase the out-of-plane vibration of the blades; (3) the SSI effect has a substantial impact on the out-of-plane vibration of the blade, which may cause the blade to collide with the tower, thus resulting in the failure and damage of the wind turbine structure.

1. Introduction

With the rapid advancements in new energy technologies, wind power has become a favored option for diversifying energy sources in many countries [1]. In addition, wind power technology can aid in achieving the carbon neutrality goals set by many nations. However, maximizing wind energy generation involves increasing tower heights and rotor diameters, which may require establishing wind farms in seismically active zones. Wind turbines in seismically functional areas are vulnerable to simultaneous wind loads and earthquakes, and seismic ground motion can significantly affect the vibration characteristics of the wind turbine, potentially leading to turbine failure [2].
In previous studies about wind turbines, researchers have typically utilized various numerical analysis tools to investigate the dynamics of wind turbines under wind, seismic, or wave action. Nuta et al. [3] conducted the first incremental dynamic analysis of a 1.65 MW wind turbine tower using the finite element software ABAQUS to examine its dynamic response under near-field and far-field seismic effects. The studies indicated that the fundamental vibration period of the tower is significantly longer than the dominant period of most earthquakes. When the tower exceeds its elastic limit under higher peak earthquake acceleration (PGA), it may collapse due to underground motion. Sadowski et al. [4,5] also used ABAQUS to perform seismic analysis of a 1.5 MW tower with actual geometric defects. The results revealed that the tower exhibits high membrane stiffness under seismic excitation. However, once outside the elastic range, the development of plastic hinges due to changes in thickness may lead to tower collapse, and the fundamental modes mainly influence the wind turbine.
With the widespread use of wind turbine software in the wind power industry, Witcher et al. [6] used GH Bladed [7] software several years ago to develop a seismic analysis model of a tower with a 2 MW wind turbine model as a reference to study the response of the tower under three load conditions: parking, operation, and emergency stop under the action of ground motion. Prowell et al. [8,9] simulated the dynamic response of a 5 MW wind turbine under seismic action using the wind turbine software FAST [10], which showed that the bending moment at the base of the tower under seismic action is the primary influence in the design of the wind turbine tower. While blade and FAST analysis can effectively save computational costs and create more accurate models of the wind speed spectrum, they calculate the dynamic response by modal superposition, making it impossible to consider structural non-linearities in software such as FAST. In contrast, ABAQUS numerical studies can accurately reflect the nonlinear dynamic response of the wind turbine structure. Finite element software is now widely used for the collapse analysis of wind turbines. Recently, instead of studying the vibration characteristics of wind turbines by building only the wind turbine tower, whole machine models have often been created for research and analysis. Chen et al. [11] proposed a multi-objective optimal design method for wind turbines by establishing an accurate blade–tower coupling model to determine the coupling effects between blades and improve wind turbine performance. Asareh et al. [12,13] considered the effect of rotor–tower interaction to study the nonlinear dynamic behavior of wind turbines under coupled seismic and wind loads. The results show that seismic loads considerably influence the design and analysis of wind turbines.
Meanwhile, Maes et al. [14] and Meng et al. [15,16] investigated the effect of blades on the dynamic characteristics of wind turbines by building a multi-body coupled model to study the impact of the blade model on wind turbines under seismic action. However, these studies focused only on stopping conditions, ignoring the effect of blade position change and stiffness change during rotation. Prowell et al. [8] investigated the seismic response of an operating wind turbine through shaker tests and observed additional damping in the forward-backward direction compared to the shutdown condition. Furthermore, it is essential to revisit the effects of soil–structure interaction (SSI) on seismic analysis, particularly in soft soil foundations. The interaction between the pile foundation and the surrounding soil is inevitable for slender and flexible foundations. It can lead to a reduction in vibration frequency and mode, ultimately affecting the structure’s dynamic behavior [17]. Numerous studies have investigated the impact of soil foundations on wind turbine structures, including studies on rigid soil foundations and flexible soil foundations. In studies by Andersen et al. [18] and Arany et al. [19], soil–structure interaction was found to impact the first-order natural frequency of wind turbines.
Conversely, experimental studies of wind turbine models by Bhattacharya [20] and Lombardi et al. [21] revealed a strong correlation between the intrinsic frequency of the wind turbine and soil flexibility. In a study by Zuo Haoran et al. [22,23], the effect of SSI coupling was considered to investigate the dynamic behavior of wind turbines during operation and shutdown. Amani et al. [24] proposed linking the soil layer’s free field response to the deep foundation’s response through an appropriate p-y curve. This method treats the pile as a beam on a nonlinear Winkler foundation (BNWF), where the pile-soil interaction is modeled using discrete nonlinear p-y springs. The results show that this method can more accurately consider the soil structure’s influence on wind turbines’ vibration characteristics after earthquakes. The study found that wind turbines exhibited greater response under operating conditions than under stopping conditions and that SSI had a more significant impact on tower vibration. However, most studies have focused only on monopile foundations for offshore wind turbines [25], and few studies have considered the effect of land-based multi-pile foundations on wind turbine structures. While the impact of multi-pile foundations may be less significant than that of monopile foundations in analysis, it is still essential to consider SSI when assessing seismic effects [26].
In this paper, a flexible multi-body coupled dynamics model of the DTU 10 MW wind turbine is developed using the commercial ABAQUS software. In contrast to previous models, this paper considers the effects of blade and tower coupling by building a detailed blade geometry model in numerical modeling. Additionally, the nonlinear behavior of the blades concerning the tower structure is also considered. The effect of SSI on the wind turbine response under coupled wind and seismic action is investigated by developing a refined finite element model. The data sets consist of 3 different wind speeds, three different soil base conditions, and ten sets of natural seismic waves, resulting in 99 sets of data (9 sets for wind action and 90 sets for coupled wind–seismic action). In numerous previous studies on wind turbines, each approach has its own advantages and disadvantages. Some studies using blade and FAST analysis can save computational costs and create more accurate wind speed spectrum models. However, they calculate the dynamic response by modal superposition, which cannot consider structural nonlinearities. Although ABAQUS numerical studies can accurately reflect the nonlinear dynamic response of wind turbine structures, when dealing with soil–structure interaction, the existing p-y curve model has the “pile diameter effect”. The advantage of this study is that when using ABAQUS software to build the model, it not only considers the blade–tower coupling and blade nonlinear behavior but also adopts multi-pile foundations and uses the nonlinear soil spring method to simulate pile–soil interaction, effectively avoiding the “pile diameter effect” and enabling more accurate research on the impact of soil–structure interaction on wind turbines under wind–seismic coupling. The disadvantage is that the model construction and calculation process are relatively complex, involving the setting of multiple parameters and calculation methods, which require high computational resources and time. At the same time, the experimental verification part is relatively weak, mainly relying on numerical simulation results and lacking more field-measured data for comparison and verification.
This paper is organized as follows: Section 2 describes the development of the DTU 10 MW finite element model, and the definition of the failure criterion; Section 3 deals with the calculation of wind loads and the selection of ground motions; Section 4 discusses the dynamic response of the structure under wind load alone; and Section 5 investigates the vibration characteristics of the structure under coupled wind–seismic action.

2. Numerical Models

2.1. Wind Turbine Geometry Model

The wind turbine model used in this study is based on the DTU 10 MW wind turbine as a reference model [27]. The height of the wind turbine nacelle hub from the ground is 119 m, and the total height is 115.663 m. The wind turbine tower has a minimum diameter-to-thickness ratio (d/t) of 218 and a maximum diameter-to-thickness ratio (d/t) of 275. The outer diameter of the tower at the bottom is 8.3 m, and at the top is 5.5 m. The thickness of the tower at the bottom is 0.038 m, and at the top is 0.02 m. The wind turbine support structure is made of a conical steel cylinder. The hub radius is 2.8 m, and the blade length is 86.35 m. The safety value regulates the limit distance, which is set at L = 18.26 to avoid a possible collision between the blade tip and the tower tube. The blade airfoil data and the total rotor mass of 227,962 kg are taken from Ref. [27]. The main dimensions of the wind turbine are shown in Figure 1, and details are provided in Table 1.

2.2. Finite Element Model for Wind Turbines

The finite element software ABAQUS 6.14-4 was used to build the DTU 10 MW wind turbine model. Figure 2 shows the finite element model of the tower. The wind turbine tower was divided into ten segments connected via welding. To simplify the model, the details of the tower doorway and the flange’s influence on the tower were neglected. As the tower is a thin-shell structure, it was modeled using linear reduced integral S4R shell elements. In this study, stress concentrations at welded joints were addressed through localized mesh refinement (element size reduced to 1/8th of adjacent regions). This approach limits maximum principal stresses to 82% of yield strength under combined loading, as validated by Sadowski et al. [5] for similar tubular connections. The wind turbine blade was accurately modeled as a shell unit based on airfoil data from the literature [27], divided into 40 subsections. However, for cost reduction, the internal plates of the blade were neglected, which decreases the shear and bending resistance. To ensure sufficient resistance to shear and bending, the blade thickness was increased to 0.06 m [27]. The blade was connected to the tower to consider blade–tower interaction, utilizing a solid element model with material density specified to match the nacelle’s mass action. To consider soil–structure interaction, a finite element model of the pile deck was necessary. The pile deck comprised a square platform, 30 m long, 30 m wide, and 2 m high, and four pile bases, 20 m long and 2 m in diameter. To account for the effect of engine room and hub mass on the tower cylinder, this study leverages the equal mass method to analyze engine room and hub equivalent replacement by establishing a solid model that simulates both engine room and hub. The details of the DTU 10 MW wind finite element model are illustrated in Figure 2. The wind turbine blade was made of polyester fiber with a density of 1850 kg/m3, and the tower and pile foundation had material densities of 8500 kg/m3 and 2400 kg/m3, respectively. Material properties are provided in Table 2.
To accurately determine whether the wind turbine is susceptible to failure under wind load and ground movement, it is essential to establish wind damage failure criteria. The criteria include the yield stress of the tower and blade materials, where the tower failure stress is 355 MPa, and the blade failure stress is 700 MPa. Another criterion is the blade safety distance, which is the distance between the blade tip and the tower. During operation, the blade rotates at high speeds, and if the maximum displacement of the blade exceeds the safety distance, the blade may collide with the tower, leading to blade failure. In this study, even though the blades are not rotating, this particular scenario is still considered to assess the potential for blade failure.

2.3. SSI Model

The interaction between the pile foundation and the soil has a significant impact on the vibration characteristics of the wind turbine structure. When considering seismic effects (SSI) in numerical analysis, it is necessary to re-evaluate the soil-based action of the pile. In this study, ten groups of natural seismic waves with different pulse periods (including short-period and long-period seismic waves) from the Pacific Earthquake Engineering Research Center (PEER) were selected as vibration sources to fully study the vibration characteristics and failure modes of wind turbines under wind–seismic coupling. Previous studies have identified three widely used models to evaluate SSI effects [25]. (1) In the finite element model, the solid unit directly simulates the soil and uses the Mohr-Coulomb contact between the pile foundation and the soil layer to consider the interaction. This method can reach accurate calculation results, but in the analysis will bring huge calculation cost; (2) The SSI effect is considered by the linear spring model, which is small in calculation cost but inaccurate in calculation result; (3) The nonlinear soil spring method is used to consider the interaction of soil structure, which can ensure the calculation accuracy and low calculation cost. However, recent studies have also found that currently, large diameter single pile fans mostly exhibit rigid and flexible pile characteristics [28]. Existing studies have shown that the p-y curve recommended by API specifications will seriously underestimate the pile stiffness and ultimate bearing capacity during analysis, and the degree of underestimation will become more significant with the increase of single pile diameter D, which will lead to a decrease in the aspect ratio L/D. Thus, the “pile diameter effect” [29] is produced, which has some shortcomings. In this paper, to avoid the “pile diameter effect” generated in the p-y curve model, multiple pile foundations are adopted, each with a diameter of 2 m and a small pile foundation diameter, to reduce the “pile diameter effect” as much as possible.
The nonlinear soil spring method is employed in this study to simulate the interaction between the pile foundation and soil precisely. Within the finite element model, the lateral resistance of an individual pile foundation is symbolized by the p-y spring, as illustrated in Figure 2. Additionally, the axial friction force and the bearing capacity of the pile end are, respectively, portrayed by the t-z and q-z springs. The single pile within the foundation has an overall length of 20 m, with springs positioned at 4-m intervals, resulting in the utilization of 24 spring units within the numerical model. To develop the p-y curves for clay under cyclic loading, the recommended guidelines by API [30] and DNV [31] were referenced. The p-y curve was defined using the following equation at times.
When X > X R , the following equation can define this:
p = 0.5 c u y / y c 1 / 3   for   y 3 y c 0.72 c u   for   y > 3 y c
When X < X R , the following equation can define this:
p = 0.5 c u y / y c 1 / 3   for   y 3 y c 0.72 c u 1 1 X / X R y 3 y c / 12 y c   for   3 y c < y 15 y c 0.72 c u X / X R   for   y > 15 y c
The ultimate soil resistance c u on the side of the pile is determined by the depth of the monopile and is defined as follows:
c u = 3 s u + γ X + J s u X / D   for   X < X R 9 s u   for   X X R
where s u is the undrained shear strength index in KPa, and X is the depth of the monopile. X R is the depth below the mud surface to the bottom of the soil resistance reduction zone obtained by the following equation:
X R = 6 D / γ D / c + J
where γ is the effective mass of the soil, D is the diameter of the monopile, J is an empirical constant, which is estimated by field tests to vary from 0.25 to 0.5, and y is the actual lateral horizontal variation. y c can be obtained by the following equation:
y c = 2.5 ε c D
where ε c is the strain occurring at one-half of the maximum stress during an undisturbed soil sample undrained compression test.
The axial shear force is transferred to the pile at any depth in the soil, and a curve can represent the pile’s displacement. Similarly, the relationship between the bearing resistance and the axial displacement of the pile end can be described by a curve, as well. The values of z / D and t / t max , as well as Q / Q P , are known from the literature by the API [30]. The p y , t z and q z curves at the undrained shear strength index s u = 100 KPa are shown in Figure 3.

2.4. System Damping

As wind turbine systems are flexible multi-body structures, the system’s damping is complex and can be broadly divided into three categories: structural damping of the tower and blades, wind-generated aerodynamic damping, and soil damping. Previous studies have suggested that the damping ratio of the blade structure can be 0.5% [32], and the damping ratio of the tower structure is 1% [33]. Aero damping is generated by the relative velocity between the wind and the rotating blades and is related to the wind speed, blade rotation speed, blade geometry, and airflow around the blades [34]. Although the value of aero damping is complex and difficult to estimate accurately, past research has found that the aerodynamic damping of wind turbines in the fore and aft direction generally falls within the range of 1% to 6% [35]. This study adopts a constant value of 3.5% for aero damping, as suggested by Bisoi and Haldar [25]. Meanwhile, air damping generated in the left and right directions can be neglected as it is negligible. The support structure’s damping ratio comprises the support structure material’s damping and soil’s damping effect. In some cases, the damping of the subgrade medium may be as high as 20% [22]. Due to the effect of soil–structure interaction (SSI), different soil damping is used in different flexible soil foundations: (1) the damping ratio of the support structure is taken to be 15% for soil undrained shear strength index of 100 KPa, and (2) the damping ratio of the support structure is taken to be 3% for soil undrained shear strength index of 50 KPa. The damping characteristics of the wind turbine are treated in the numerical model using the equivalent of the Rayleigh damping method [36], where the first-order out-of-plane and first-order in-plane vibration frequencies of the tower and blade are used to calculate the mass and stiffness coefficients of the tower and blade, respectively.

3. Wind Loads and Ground Motion

3.1. Turbulent Wind Fields
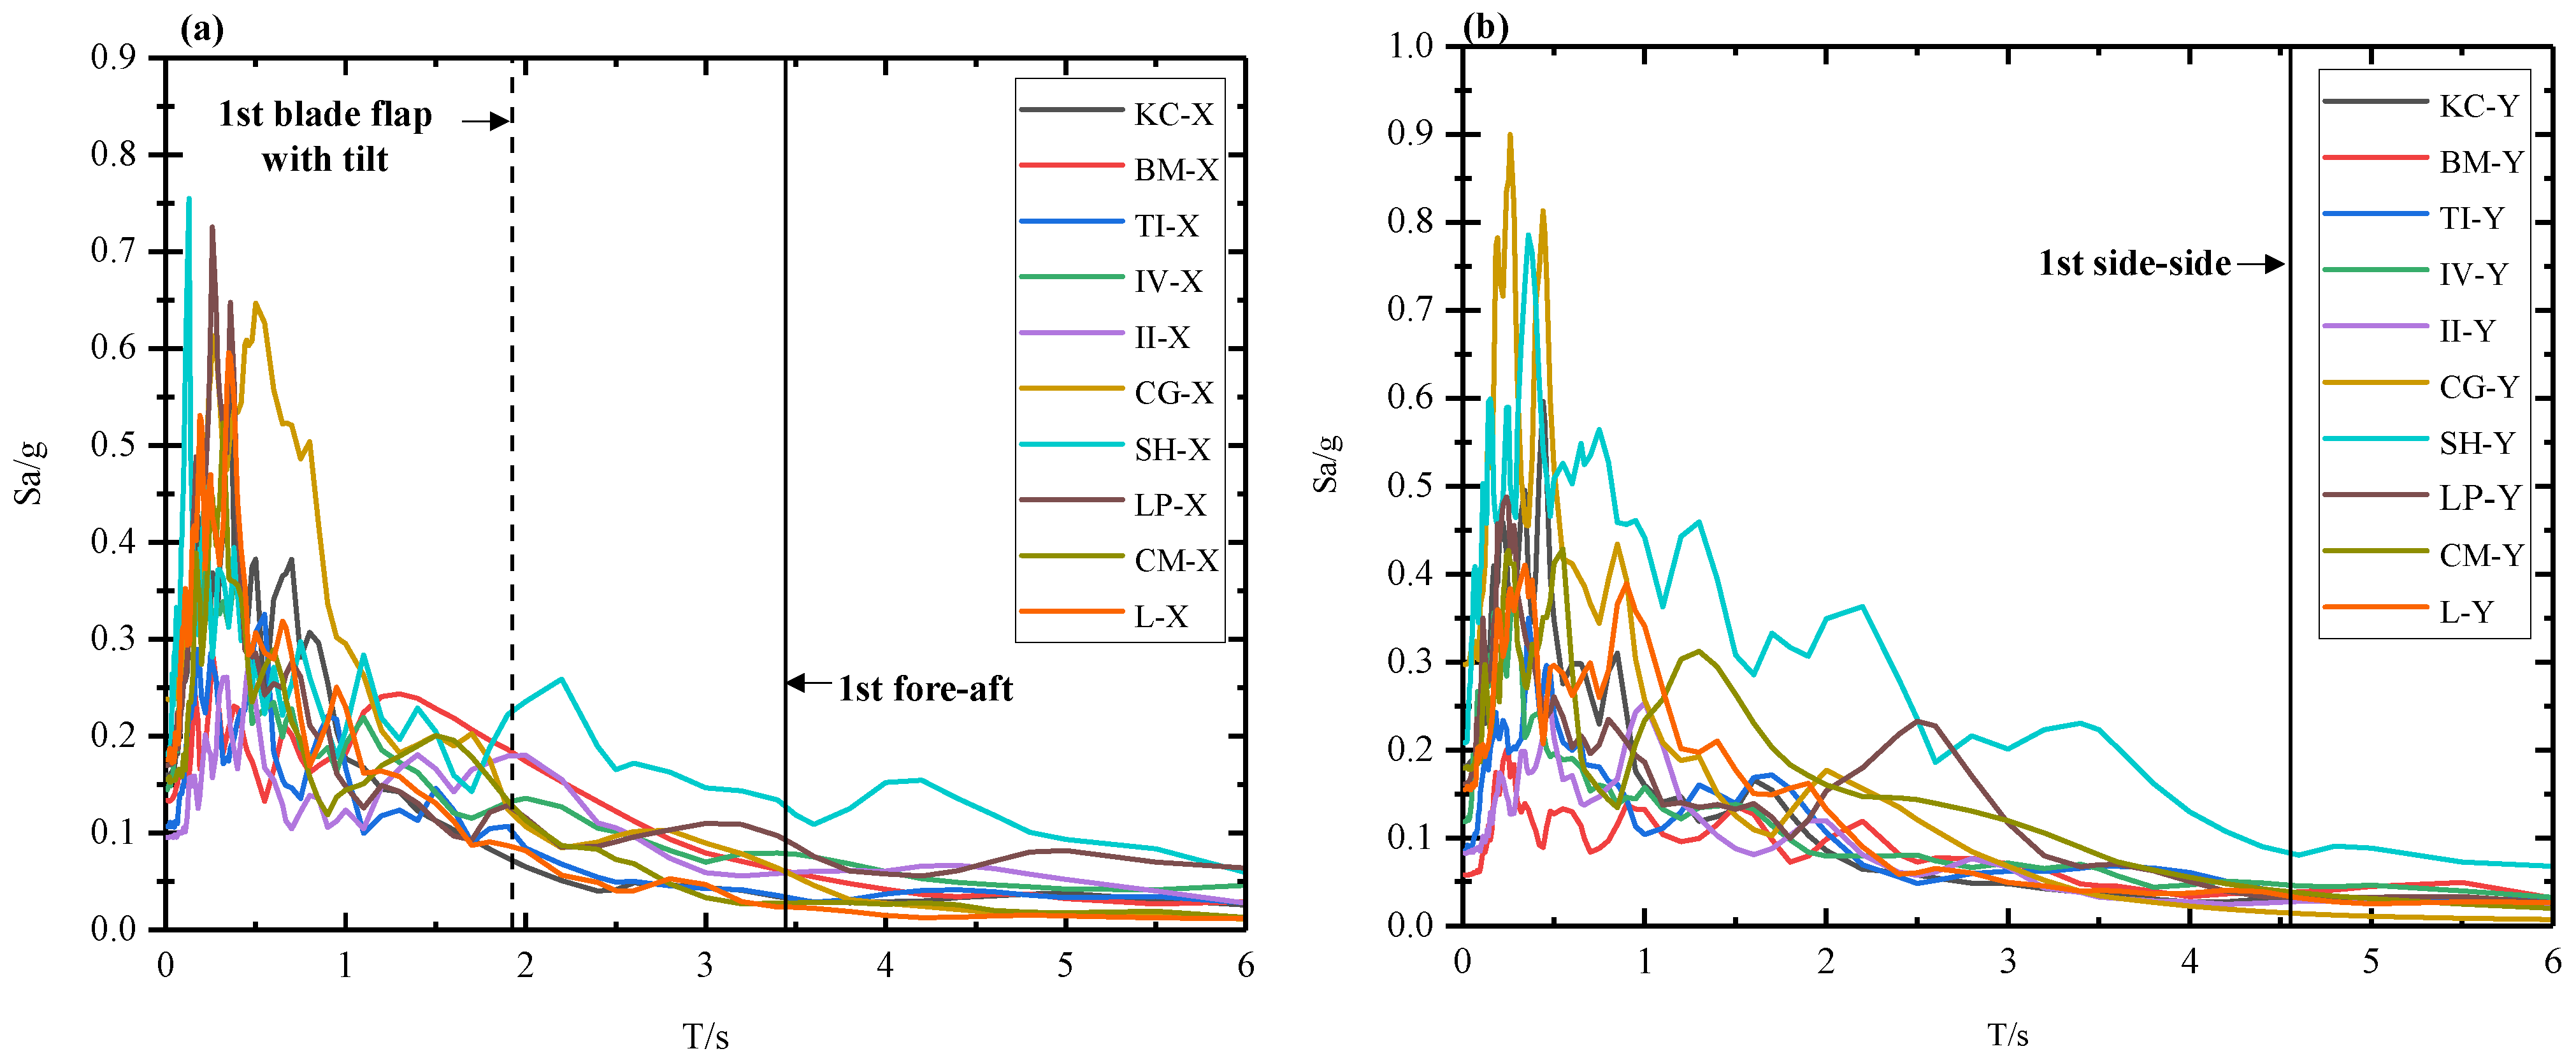
The wind speed can be separated into a constant mean wind speed and a pulsating wind speed. The turbulence model for each point in space can be obtained by taking the Fourier inverse transformation of the IEC Kaimal [37] turbulence spectrum, which considers the spatial coherence of the wind speed and wind shear [38]. Consequently, the wind velocity field is discrete at finite grid points in the vertical and horizontal directions. The equation for the Kaimal turbulence spectrum is derived as follows:
E u ( f ) = 4 σ u 2 L u v 1 1 + 6 f L u v 1 5 / 3
where f is the frequency, σ u is the standard deviation of the wind speed field, v is the mean wind speed, and L u is the scaling parameter for each wind speed component.
The wind turbine wind speed field is generated by TurbSim [10] based on the Kaimal turbulence model with turbulence class C and a wind speed field reference height of hub height. Figure 4 shows the wind speed of 11.4 m/s, which indicates that the wind speed is non-uniform and exhibits turbulent characteristics [39]. OpenFAST, a wind turbine software, is used to obtain the blade loads and the tower loads based on the wind speed field generated by Turbsim. The loads are then equivalently applied to the numerical model.
The force generated by the wind on the blade can be divided into two main components: in-plane force and out-of-plane force. The in-plane force primarily drives the blade to rotate and convert wind energy into electrical energy. Moreover, the in-plane vibration of the blade has minimal impact on the overall wind turbine as it mainly provides kinetic energy for the rotation of the wind turbine impeller. Hence, in this paper, the in-plane force is neglected. The external force has a significant influence on blade and tower vibrations. When the wind speed reaches a certain intensity, it can lead to blade fracture and wind turbine collapse failure. OpenFAST is used to calculate the out-of-plane blade loads and tower wind loads. The wind load is discretized into several load components acting on the tower and blade in ABAQUS, where three load components are applied to each blade and the tower.

3.2. Ground Motion

Due to the slender and flexible structures of both the tower tube and blades, which have long self-vibration periods [40], ground motion can significantly impact the structural response of the wind turbine tower and blades. Ten natural seismic loads were selected as vibration sources to investigate wind turbines’ vibration characteristics and failure modes under wind–seismic coupling. In this study, to fully consider the impact of different pulse periods on wind turbines, ten groups of natural earthquake waves with varying periods of the pulse (including short-period and long-period earthquake waves) are selected from the Pacific Earthquake Engineering Research Center (PEER) [41] to study the vibration characteristics of wind turbines. It also eliminates the single influence of the same pulse period on the results. In addition, to consider the impact of earthquakes on wind turbines under different PGAs in the same period earthquake waves, we amplified some of the same period earthquake waves and controlled the amplification ratio to meet the range of each acceleration peak value. The main range considered in the paper is PGA less than 0.1 g and PGAs of 0.1–0.2 g, 0.2–0.3 g, 0.3–0.4 g, 0.4–0.5 g, 0.5–0.6 g, and above 0.7 g. However, based on practical considerations, weak earthquakes still dominate most earthquake waves, and strong earthquakes are infrequent. Therefore, in the paper, PGAs in the range of 0.1–0.2 g earthquake waves are the majority. The different proportions have been given in Table 3 for the ten groups of earthquake waves. Figure 5 shows the mean ground motion response spectrum acceleration versus the wind turbine modal period. It is observed that seismic wave pulse periods mainly occur in higher modes of the tower in both X and Y directions. However, in the X direction, seismic waves in the 1st order mode of the tower still have a high response spectrum acceleration, whereas in the Y direction, seismic response spectrum acceleration is relatively low. According to the modal analysis results, it can be seen that the tower is primarily damaged in the 1st order mode. Thus, the input of seismic waves in the X-direction may significantly affect the performance of the wind turbine structure under wind loads, whereas the Y-direction seismic waves have a lesser effect on the wind turbine structure. Ground motion in the X-direction still has a high response spectral acceleration at the first-order blade tilting mode, indicating that the impact of ground motion on the out-of-plane vibration of the blade is higher than that on the tower.

4. Vibration Characteristics of Wind Turbines During Wind Interaction

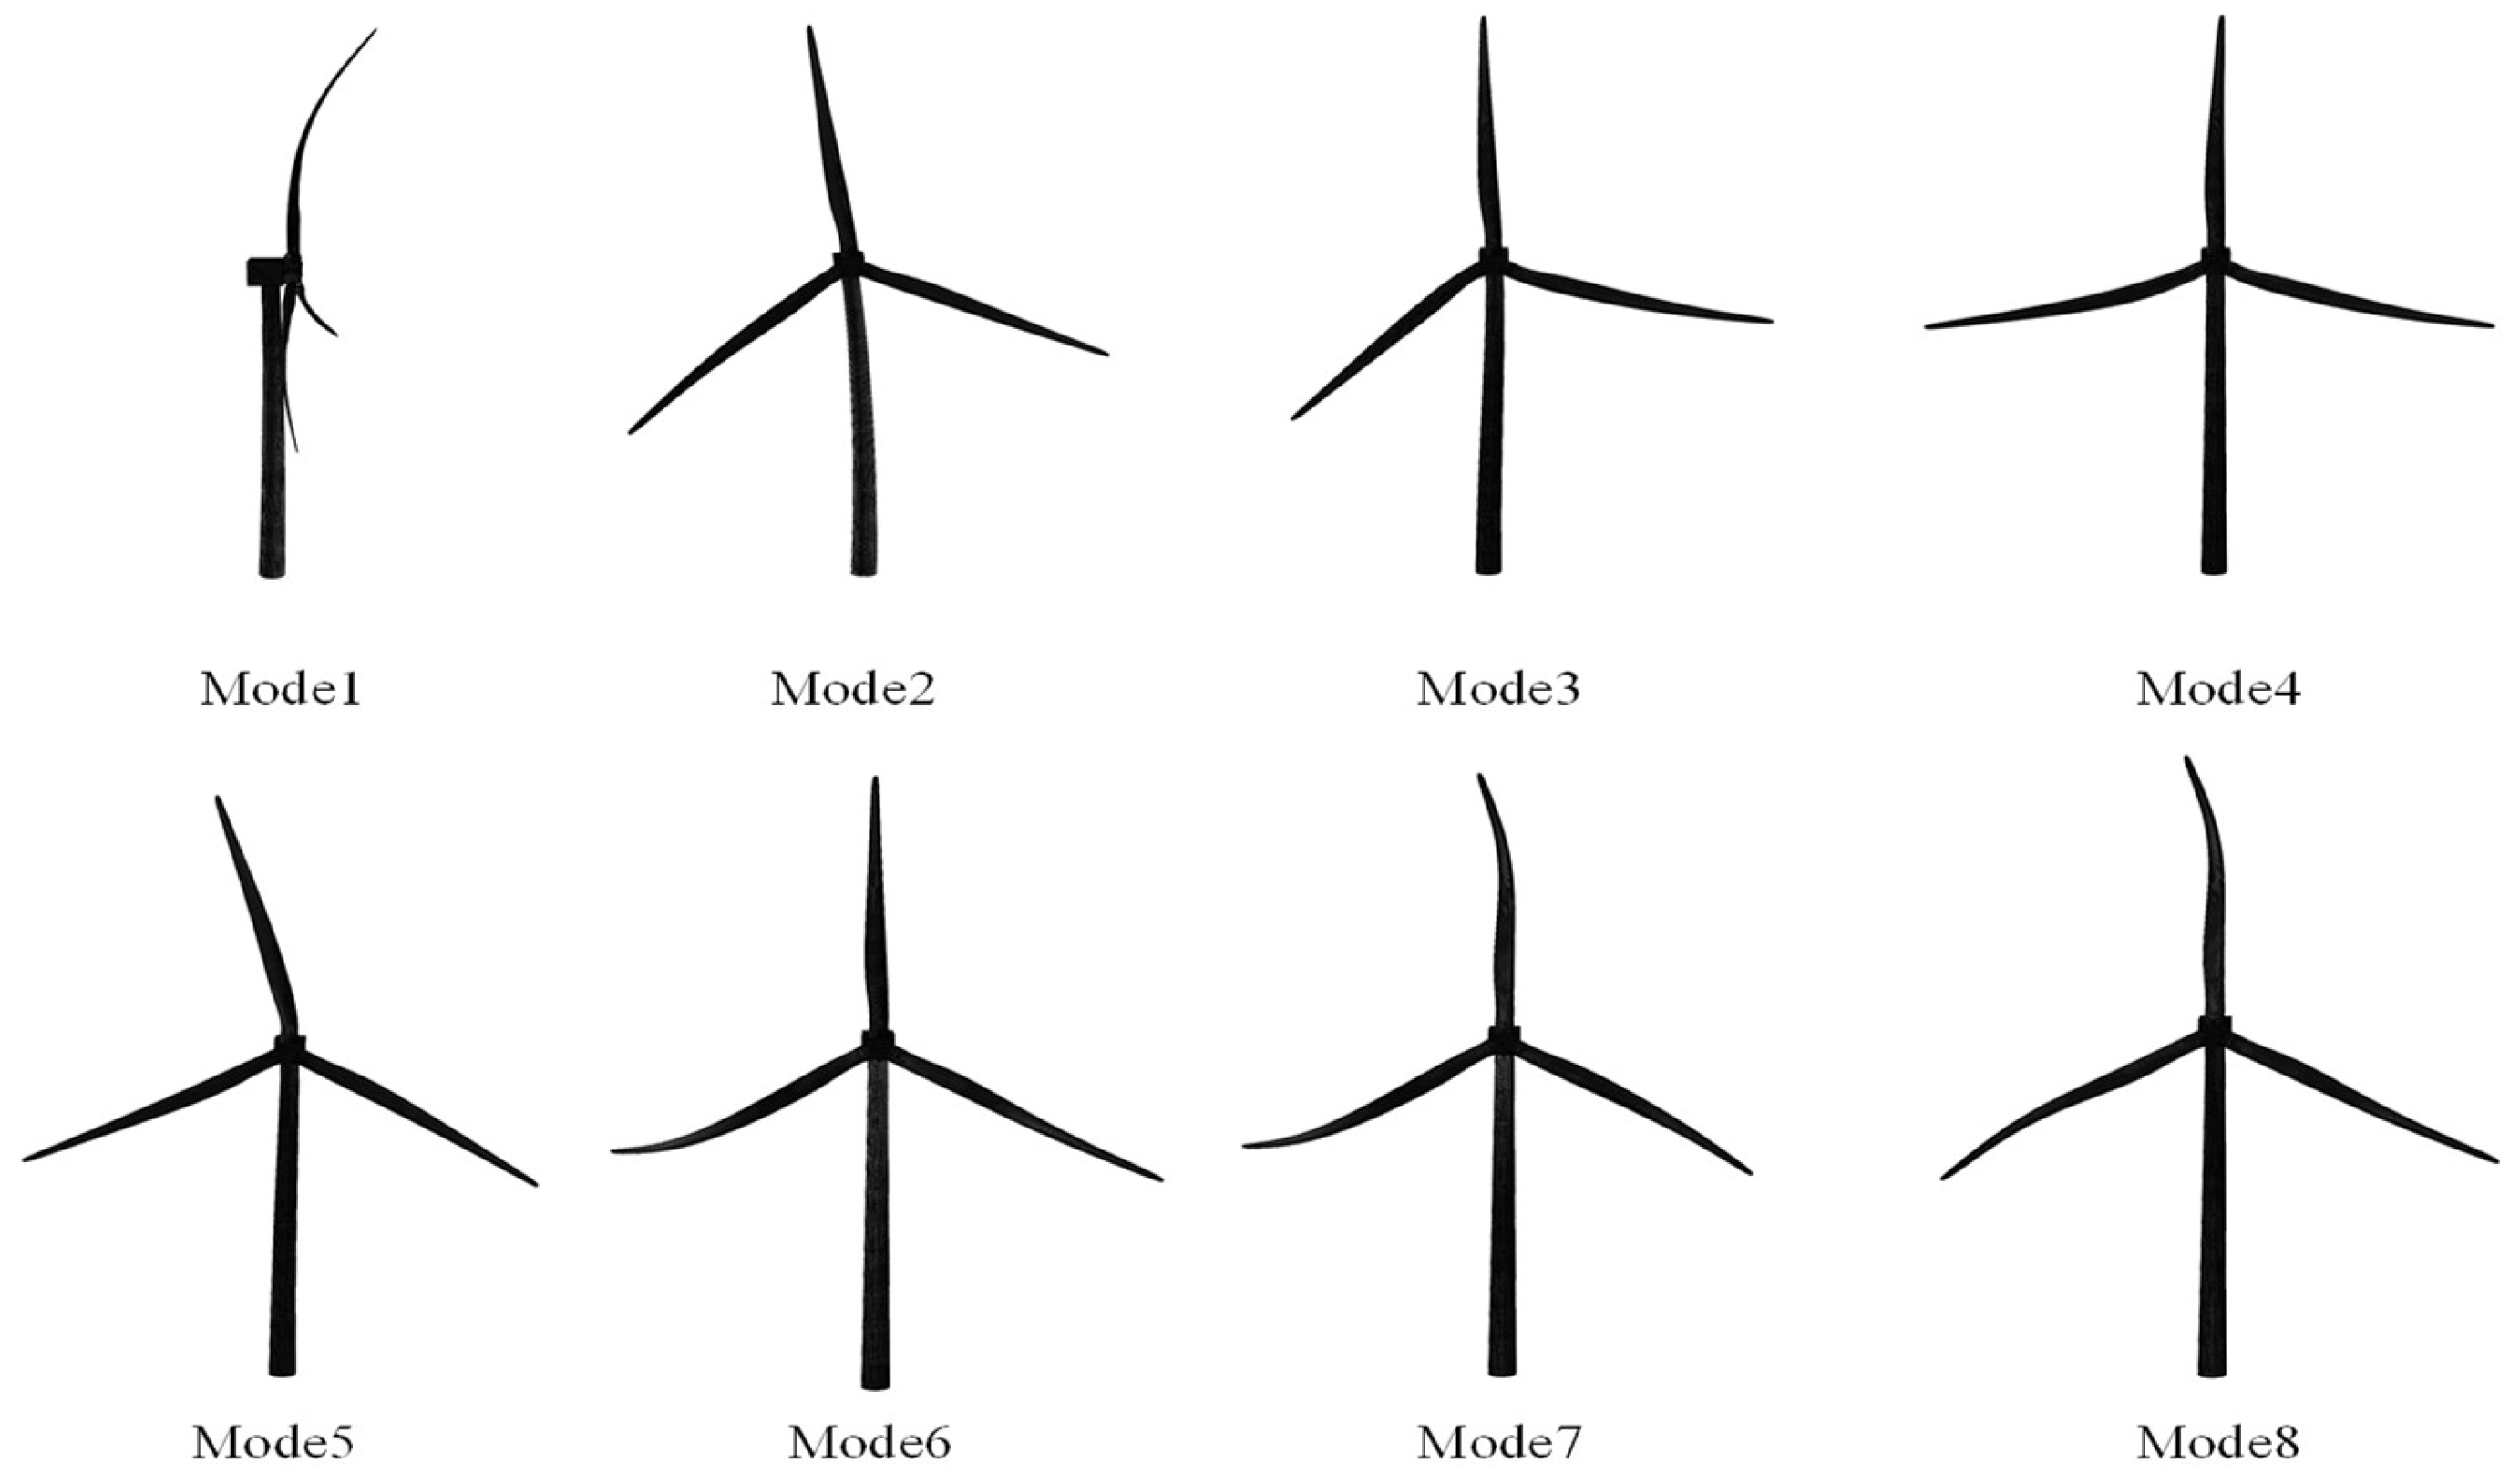
4.1. Analysis of the Natural Frequency of Wind Turbines

The natural frequencies of the wind turbine without SSI were obtained through modal analysis. Table 4 shows that the first-order natural frequency in the side-to-side direction of the tower is 0.22 Hz with a 12.0% error compared to the literature [26], while it is 0.29 Hz in the fore-and-aft direction with a 16% error. The first-order yaw mode of the blade has a natural frequency of 0.47 Hz with a 14.5% error, and the largest error of 25.5% is observed for the blade yaw mode, which has a natural frequency of 0.68 Hz. The numerical model does not consider the reinforcement plates inside the blade to reduce the computational cost. However, the blade is suitably thickened to provide sufficient bending and shear resistance, which increases its mass and stiffness compared to the literature [26], thus contributing to the observed errors. Table 4 shows that the inherent flatness of the wind turbine is not the same at different blade thicknesses (60 mm and 30 mm), resulting in a change in the structural mass of the tower top. While the inherent frequency error of the wind turbine is small for a blade thickness of 34 mm in Table 4, at a wind speed of 11.4 m/s, the blade will break, which is inconsistent with the original initial model. There are not enough references to determine the thickness of the blade, so the thickness of the blade can be determined by first trying to conduct a modal analysis on the model. In this paper, load analysis is carried out on the initial blade thickness model. In the analysis, the blade breaks when the wind speed reaches 11.4 m/s, indicating that the blade model cannot meet the requirements. This also affects the structural quality of the tower top. The modal vibration pattern of the wind turbine without SSI is presented in Figure 6. Mode 1 in Figure 6 is not a single first-order before-and-after mode of the blade but a first-order mode of the entire wind turbine, which is the same mode as the first-order before-and-after mode of the wind turbine in Table 4.
Upon comparing the eigenvalue analyses with and without SSI (multi-pile foundation), Table 5 shows that the effect of SSI (multi-pile foundation) on the first-order inherent frequency of the wind turbine tower and blade is minor. This observation is the main reason why multi-pile foundations are considered more stable than monopile foundations, even in soft soil conditions.

4.2. Vibration Characteristics Under Wind Load

To investigate wind turbine vibration characteristics under wind loads, it is necessary to consider two different states of wind turbines: shutdown and operation. However, in Haoran Zuo et al.’s study [22], the wind turbine power response in the parked condition is smaller than during operation. Therefore, wind loads generated during wind turbine operation were used in this study, but the blades did not rotate because no in-plane blade loads were applied. The wind turbine operated with cut-in, rated, and cut-out wind speeds of 4 m/s, 11.4 m/s, and 25 m/s, respectively. When the wind speed exceeded the rated wind speed, the wind turbine reduced the wind load on the blades by changing the pitch angle, and at 25 m/s, the wind changed the pitch angle shortly after start-up. It can be observed that the load on the wind turbine blades is greatest at a wind speed of 11.4 m/s. The numerical analysis assumed a turbulent wind field duration of 300 s. In this section, to compare the effect of SSI on wind turbines under wind alone versus under a coupled wind–seismic situation, only the impact of wind on wind turbines is considered.
Based on previous studies [16], it has been found that the wind turbine experiences maximum response at the top of the tower and the tip of the blade. In this paper, we only focus on discussing the maximum dynamic response of the wind turbine to determine if it meets safe operating conditions. Additionally, to eliminate the transient effects of wind during start-up, we have removed the first 50 s of wind turbine vibration response. Figure 7 presents the acceleration and displacement trajectory of the top of the tower under different soil conditions at a wind speed of 11.4 m/s. Figure 7 shows that when the SSI effect is considered, the acceleration amplitudes of the tower top in the fore-and-aft and side-to-side directions are greater than when SSI is not considered. Moreover, due to the variation in soil resistance and damping, there is a substantial difference in the dynamic response of wind turbine towers on soft soil (50 KPa) and hard soil (100 KPa), where the response of wind turbine towers on soft soil is the highest among the three different soil conditions. Figure 8 shows the maximum displacement of the top of the tower under other conditions, with a maximum of 1.406 m in the fore-and-aft direction and 0.747 m in the side-to-side direction. It is apparent from Figure 8 that the maximum displacement at the top of the tower is generally greater when the SSI effect is considered. However, the greatest impact of SSI on wind turbine tower dynamic response occurs at wind speeds of 25 m/s. This is due to the abrupt change in blade load resulting from the change in wind turbine blade pitch angle when wind speed exceeds the rated wind speed of 11.4 m/s. Table 6 compares the maximum bending moments at the base for wind loads. The table indicates a substantial increase in the base moment of the tower on soft soils, with a 27% increase in the base moment at a wind speed of 4 m/s. The maximum stress in the tower is significantly less than the material yield stress under different conditions, resulting in no tower collapse.
In Figure 9, acceleration spectrum curves for the tower tops of 10 MW multi-pile wind turbine towers were obtained using the Welch spectrum method for three soil simulation scenarios. The first-order natural frequency primarily influences the vibration response of the wind turbine tower structure, causing the curve graph to peak at 0.29 Hz in the fore-and-aft direction and 0.22 Hz in the side-to-side direction. It is worth noting that when the SSI effect is not considered, the PSD curve amplitude in 100 KPa is significantly less than 50 KPa, indicating that soil strength and soil damping have a more significant impact on the structural vibration of the tower on soft soil foundations. Secondly, the curve without SSI better matches the curve at 100 KPa due to the relatively high soil hardness and soil damping at 100 KPa, and also because the multi-pile foundation structure is relatively stable compared to the monopile foundation. A peak in the Welch curve at the first-order blade mode also indicates that the blade vibration in the tower–blade interaction affects the tower response.
Figure 9a shows that the PSD curves peak at 0.18 Hz and 0.20 Hz. This is due to the wind turbine model, where each of the three blades is connected to the rotor, and a constraint is introduced, resulting in a vibration frequency of 0.18 Hz for blade 0 alone in the fore-and-aft direction and 0.20 Hz for blades 1 and 2 alone in the fore-and-aft direction. These frequencies were not included in the modal analysis comparison. The PSD curves’ peak at 0.18 Hz and 0.20 Hz in Figure 9 further confirms that blade vibration significantly impacts the tower’s structural response.
Figure 10 presents the displacement of the blade tip in the fore-and-aft direction under different soil conditions. The impact of the blade on the tower was neglected because it has a minimal effect on in-plane vibration. As each blade has a different initial position and changes position constantly during operation, they are not subjected to the same loads. To analyze the effect of seismic loads on blade position, the blade position is assumed to be constant in this study. Figure 10 shows a significant difference in displacement time domain curves between blade 0 and blades 1 and 2. This is because blade 0 is in line with the tower tube in the vertical direction and is more affected by the tower tube vibration. In contrast, blades 1 and 2 are located symmetrically and are less influenced by the tower tube, resulting in similar displacement time amplitudes. Blade vibration varies under different soil base conditions, with the strength of 50 KPa having a greater influence on blade 1, resulting in a significant increase in vibration amplitude. Conversely, the increase in displacement of blades 0, 1, and 2 is not significant at a soil strength of 100 KPa, indicating that soil strength and damping have varying effects on blade vibration in a flexible soil base.
Table 7 displays the maximum out-of-plane displacement of the wind turbine blade under different soil foundations. When considering SSI, the maximum out-of-plane displacement of the blade increases at various wind speeds, indicating the influence of SSI on blade vibration. At a wind speed of 25 m/s, the largest increase in displacement was 44.81%. This is attributed to the change in the pitch angle of the blades at 25 m/s, resulting in a change in blade load. Additionally, because the initial position of the blade is different from the load, the structural response produced by the blade is also distinct.
At wind speeds of 4 m/s and 11.4 m/s, blade 1 exhibits the maximum structural response, while blade 2 has the minimum response. However, at a wind speed of 25 m/s, the maximum structural response occurs in blade 0, and the location of the minimum response remains in blade 2. This is because at 25 m/s, the blade load (blade pitch) changes shortly after the wind turbine starts, resulting in a different location of maximum response. The blades did not experience material failure at different wind speeds and soil foundation conditions, as can be seen from Table 7, which shows that the maximum out-of-plane displacement of the blade is 16.824 m, occurring at a soil strength of 50 KPa and a wind speed of the blade and the tower (L = 18.26 m), indicating that the wind turbine can operate safely under different conditions without experiencing structural failure.
Figure 11, Figure 12 and Figure 13 display the blade’s acceleration power spectral density (PSD) under different wind speeds and soil conditions. Soil conditions have a significant effect on the structural response of the blade, with peaks occurring at frequencies above 1 Hz when the soil strength is 50 KPa. The blade acceleration PSD varies with wind speed, with a similar frequency of peak PSD observed at wind speeds less than the rated wind speed. Above the rated wind speed, there is a significant change in the frequency of peak acceleration PSD due to the influence of load changes. The acceleration PSDs of the three blades differ due to their different initial positions and loads, but the peak frequencies in the acceleration PSDs remain similar because blades 1 and 2 are in symmetrical positions. Additionally, the PSD curves of blade 0 at wind speeds of 11.4 m/s and 4 m/s exhibit peaks at 0.44 Hz and 0.47 Hz for both blade first-order modes, with larger peaks occurring in blades 1 and 2, and a minor peak in blade 0. This suggests that the blade’s first-order vibration frequency has a greater influence on blades 1 and 2. At different wind speeds, blades 0, 1, and 2 have a peak at the tower frequency, indicating the blade and tower coupling effect during wind turbine operation, which can affect blade vibration. At wind speeds of 4 m/s and 11.4 m/s, the maximum peak of blade acceleration appears in blade 1, with a frequency of 0.47 Hz. At 25 m/s, the maximum peak appears in blade 0, which is consistent with the position of maximum blade displacement.

5. Vibration Characteristics Under Wind–Seismic Interaction

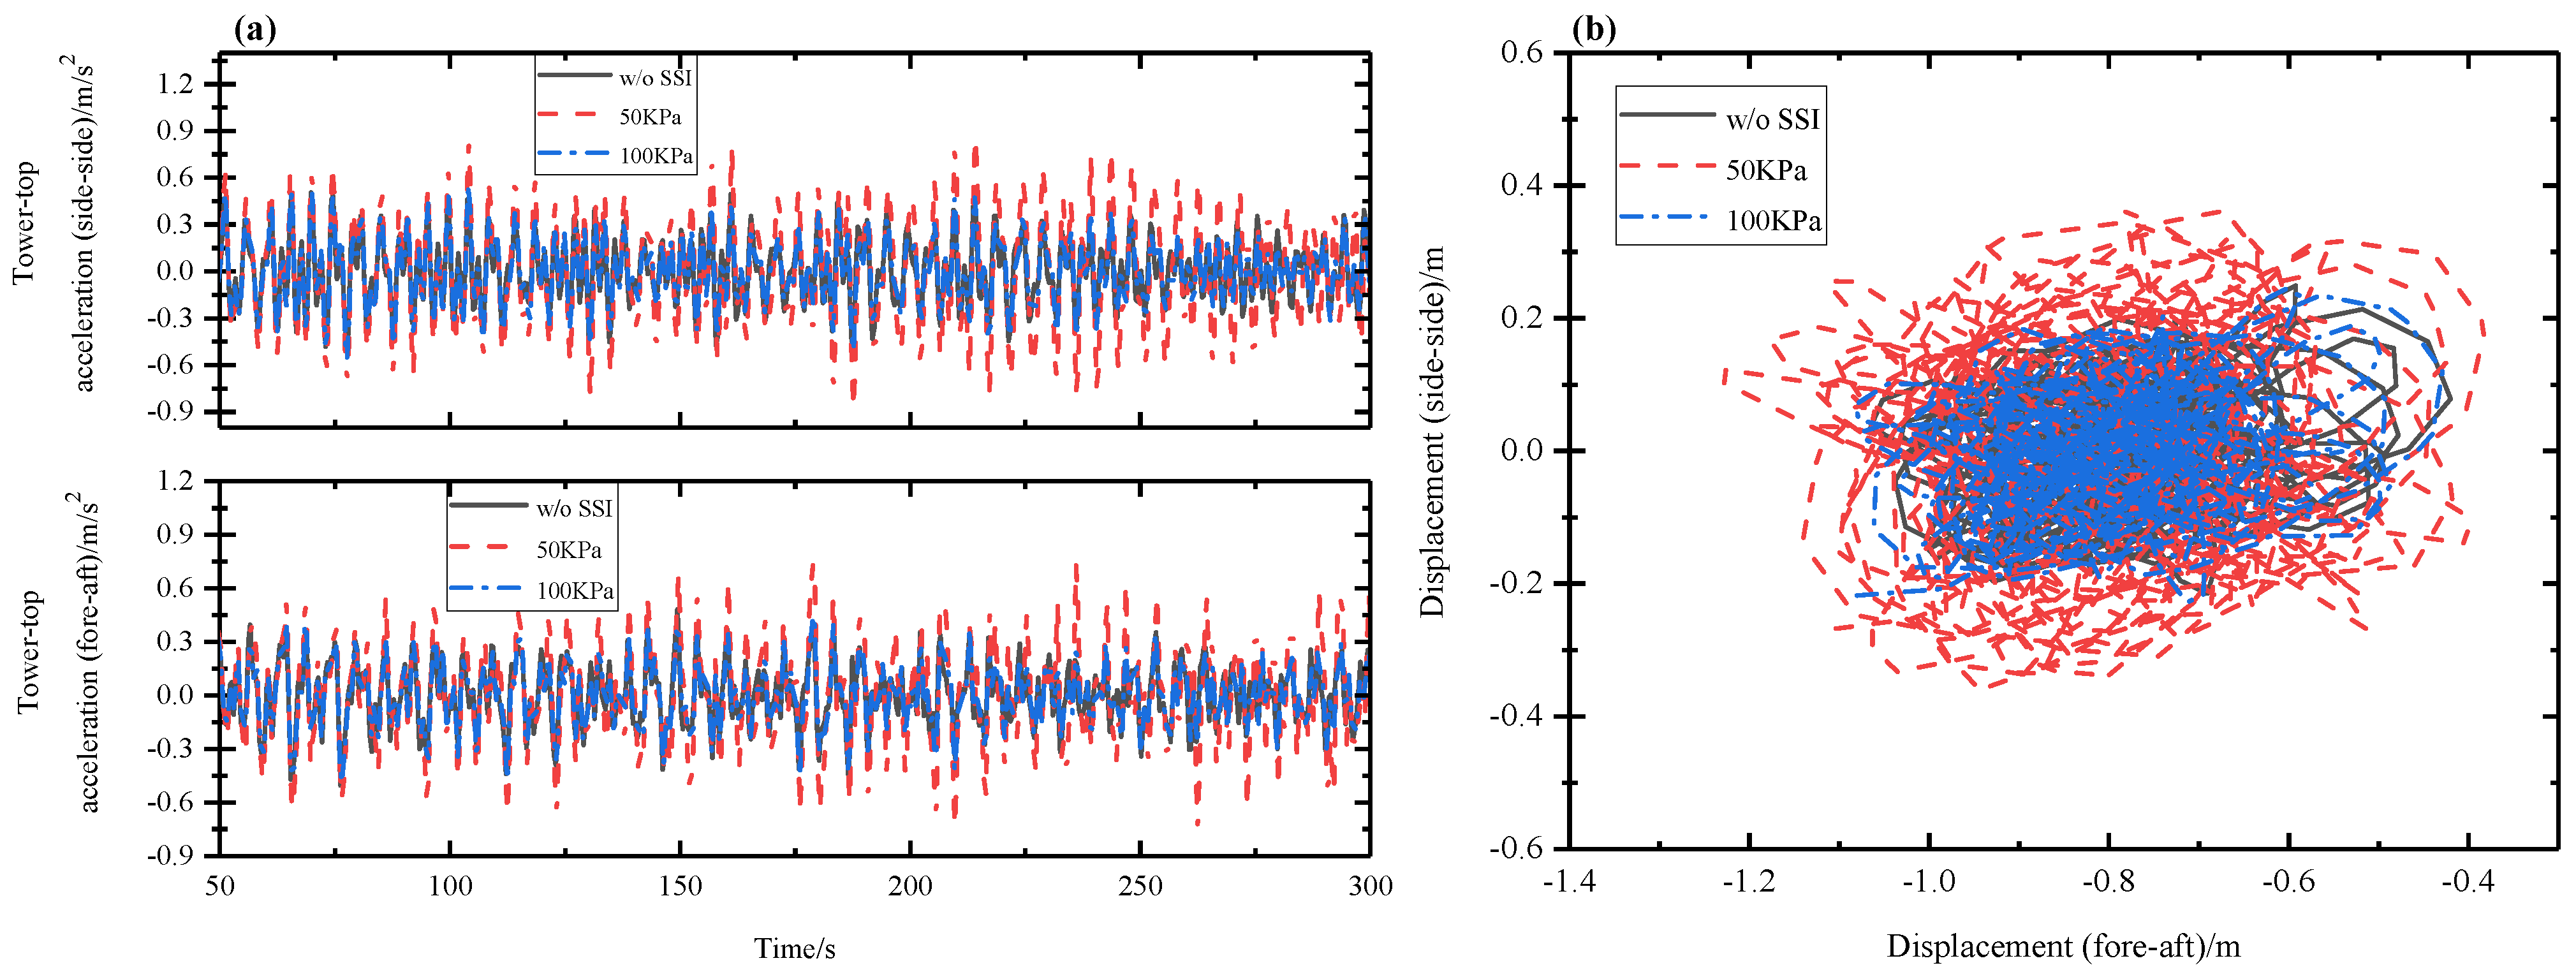
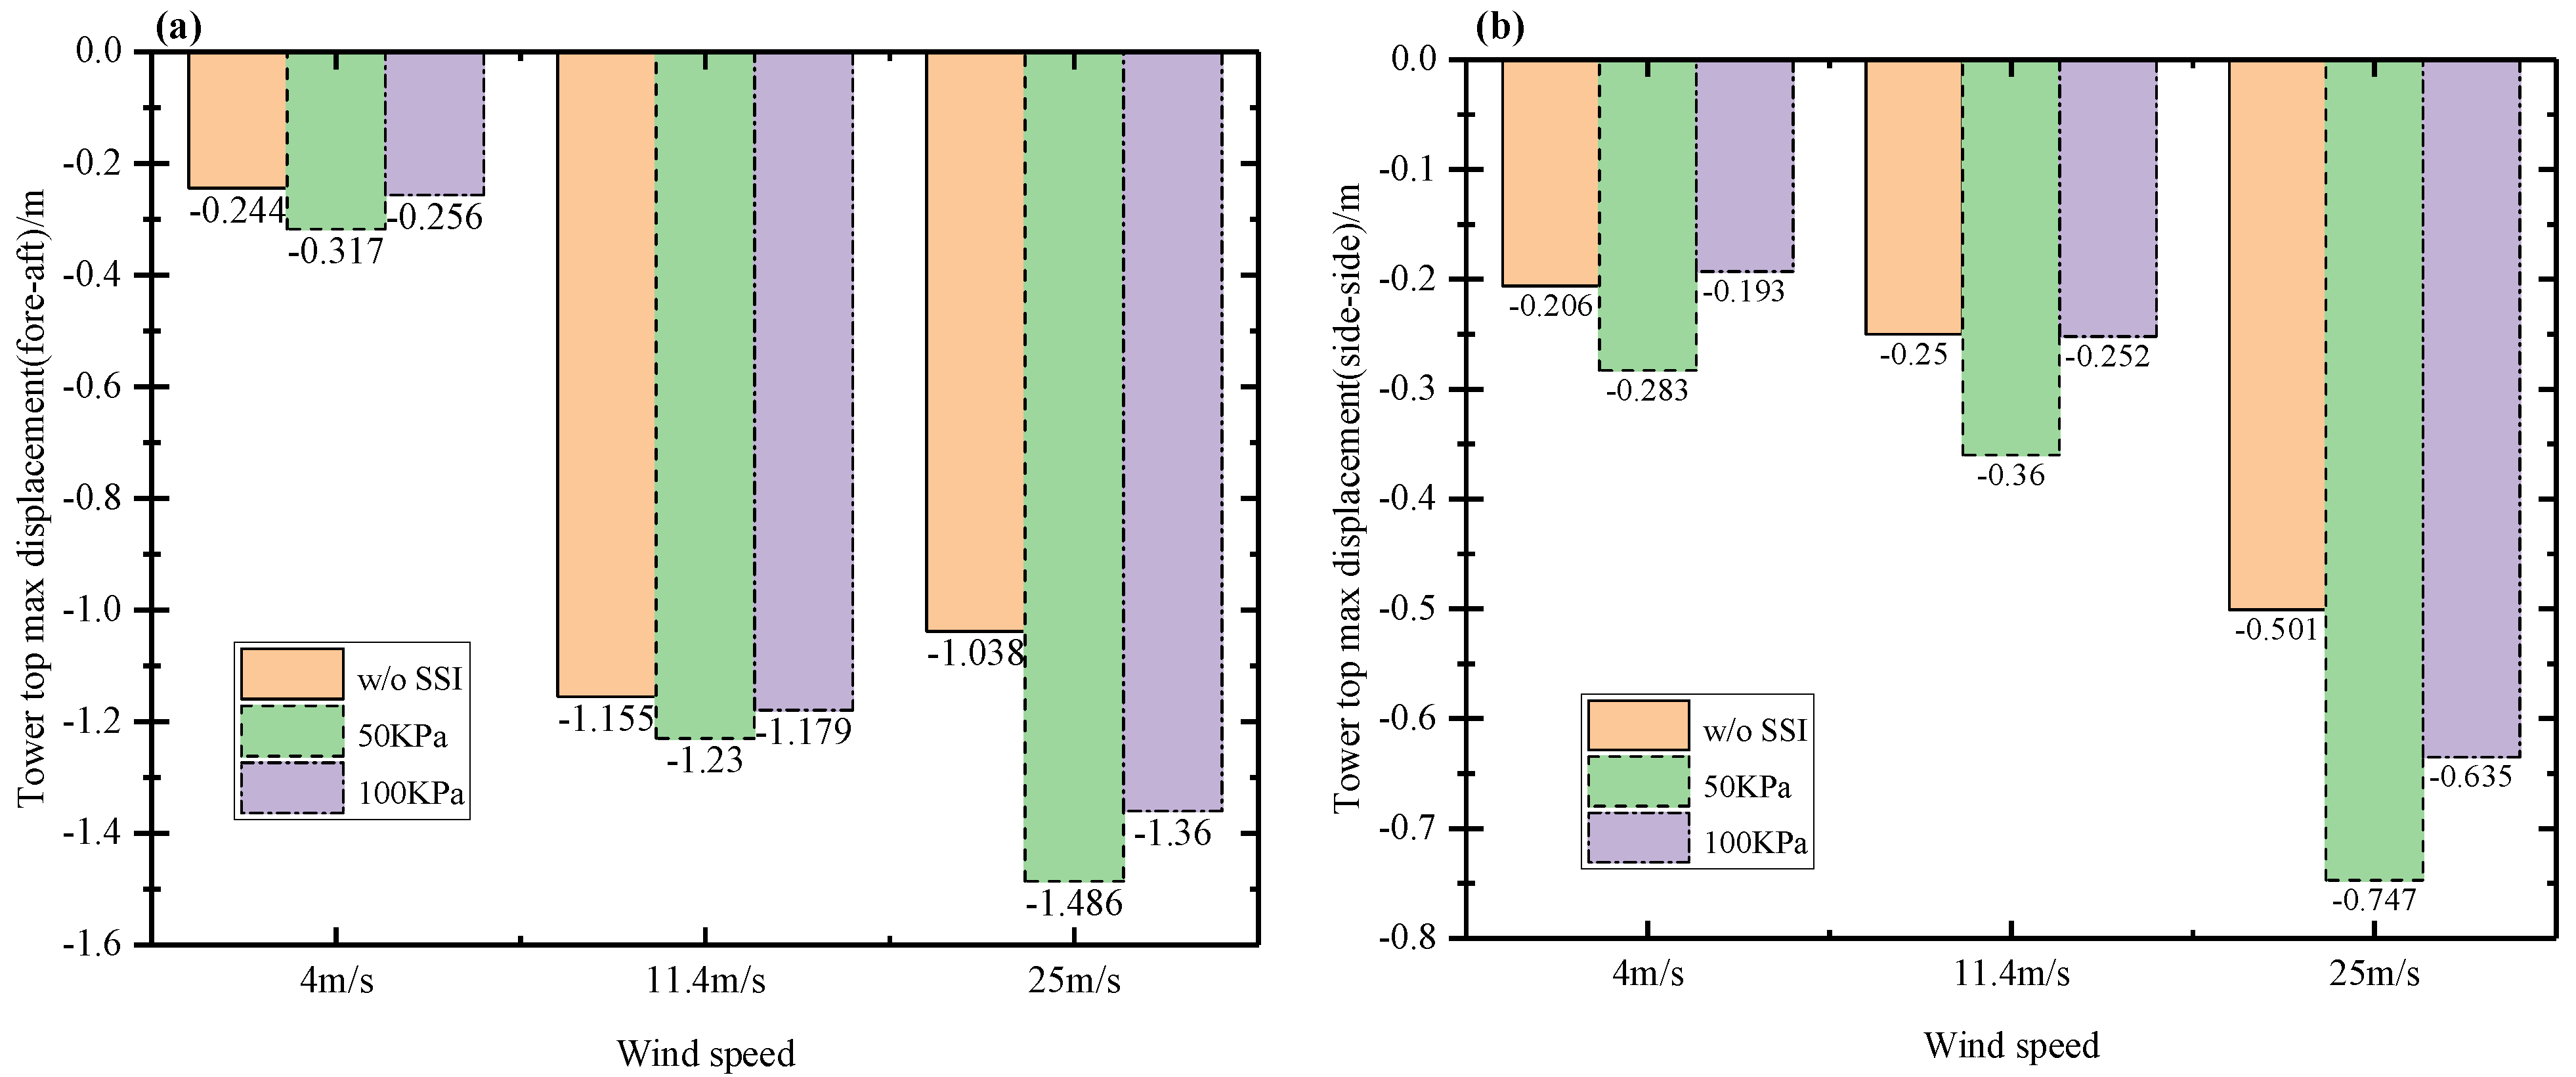
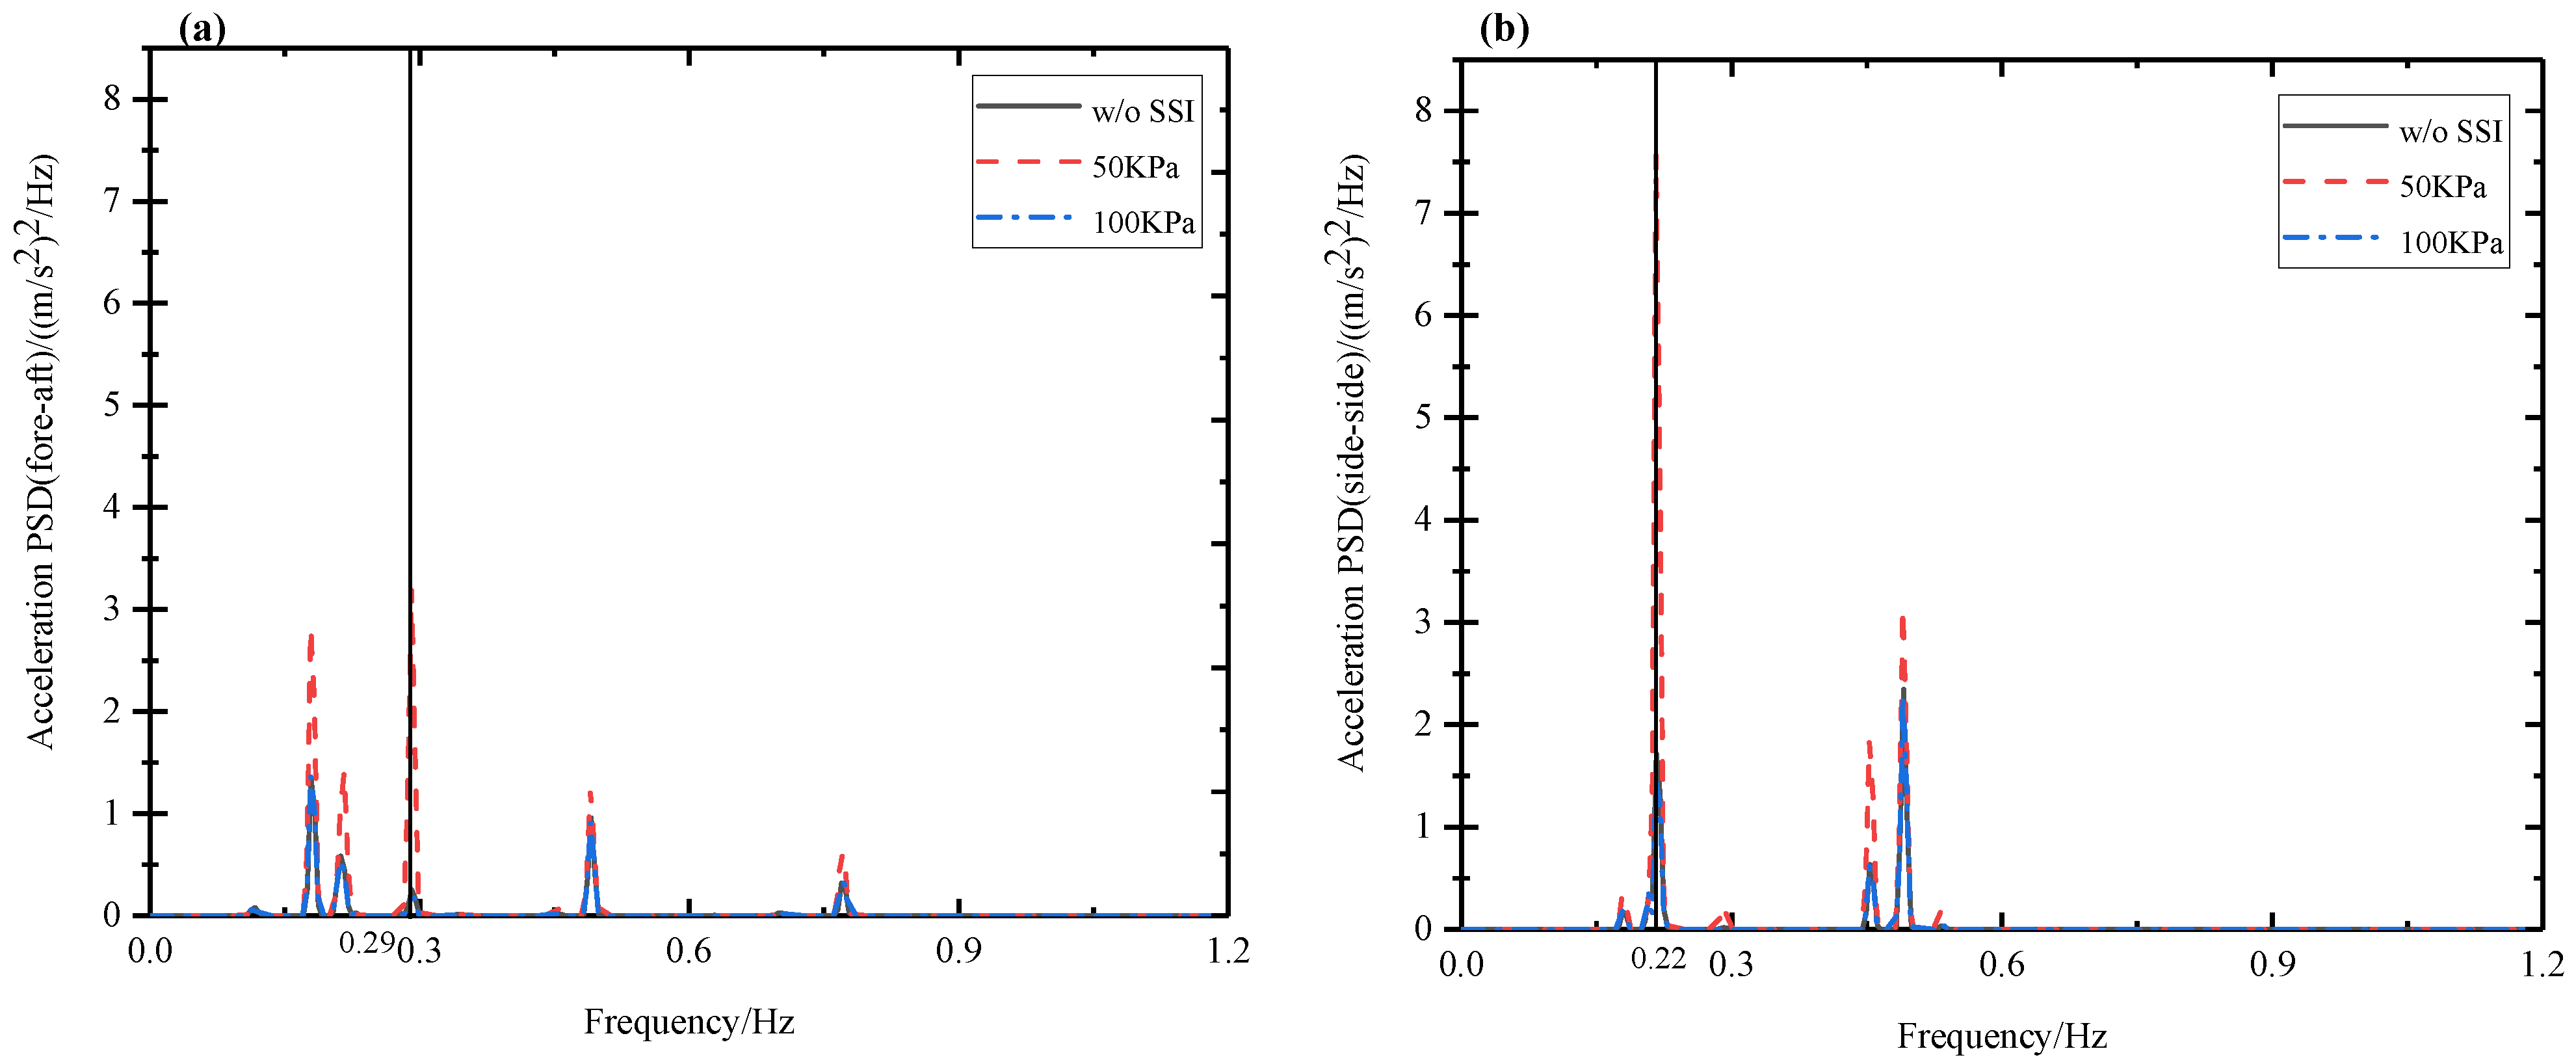
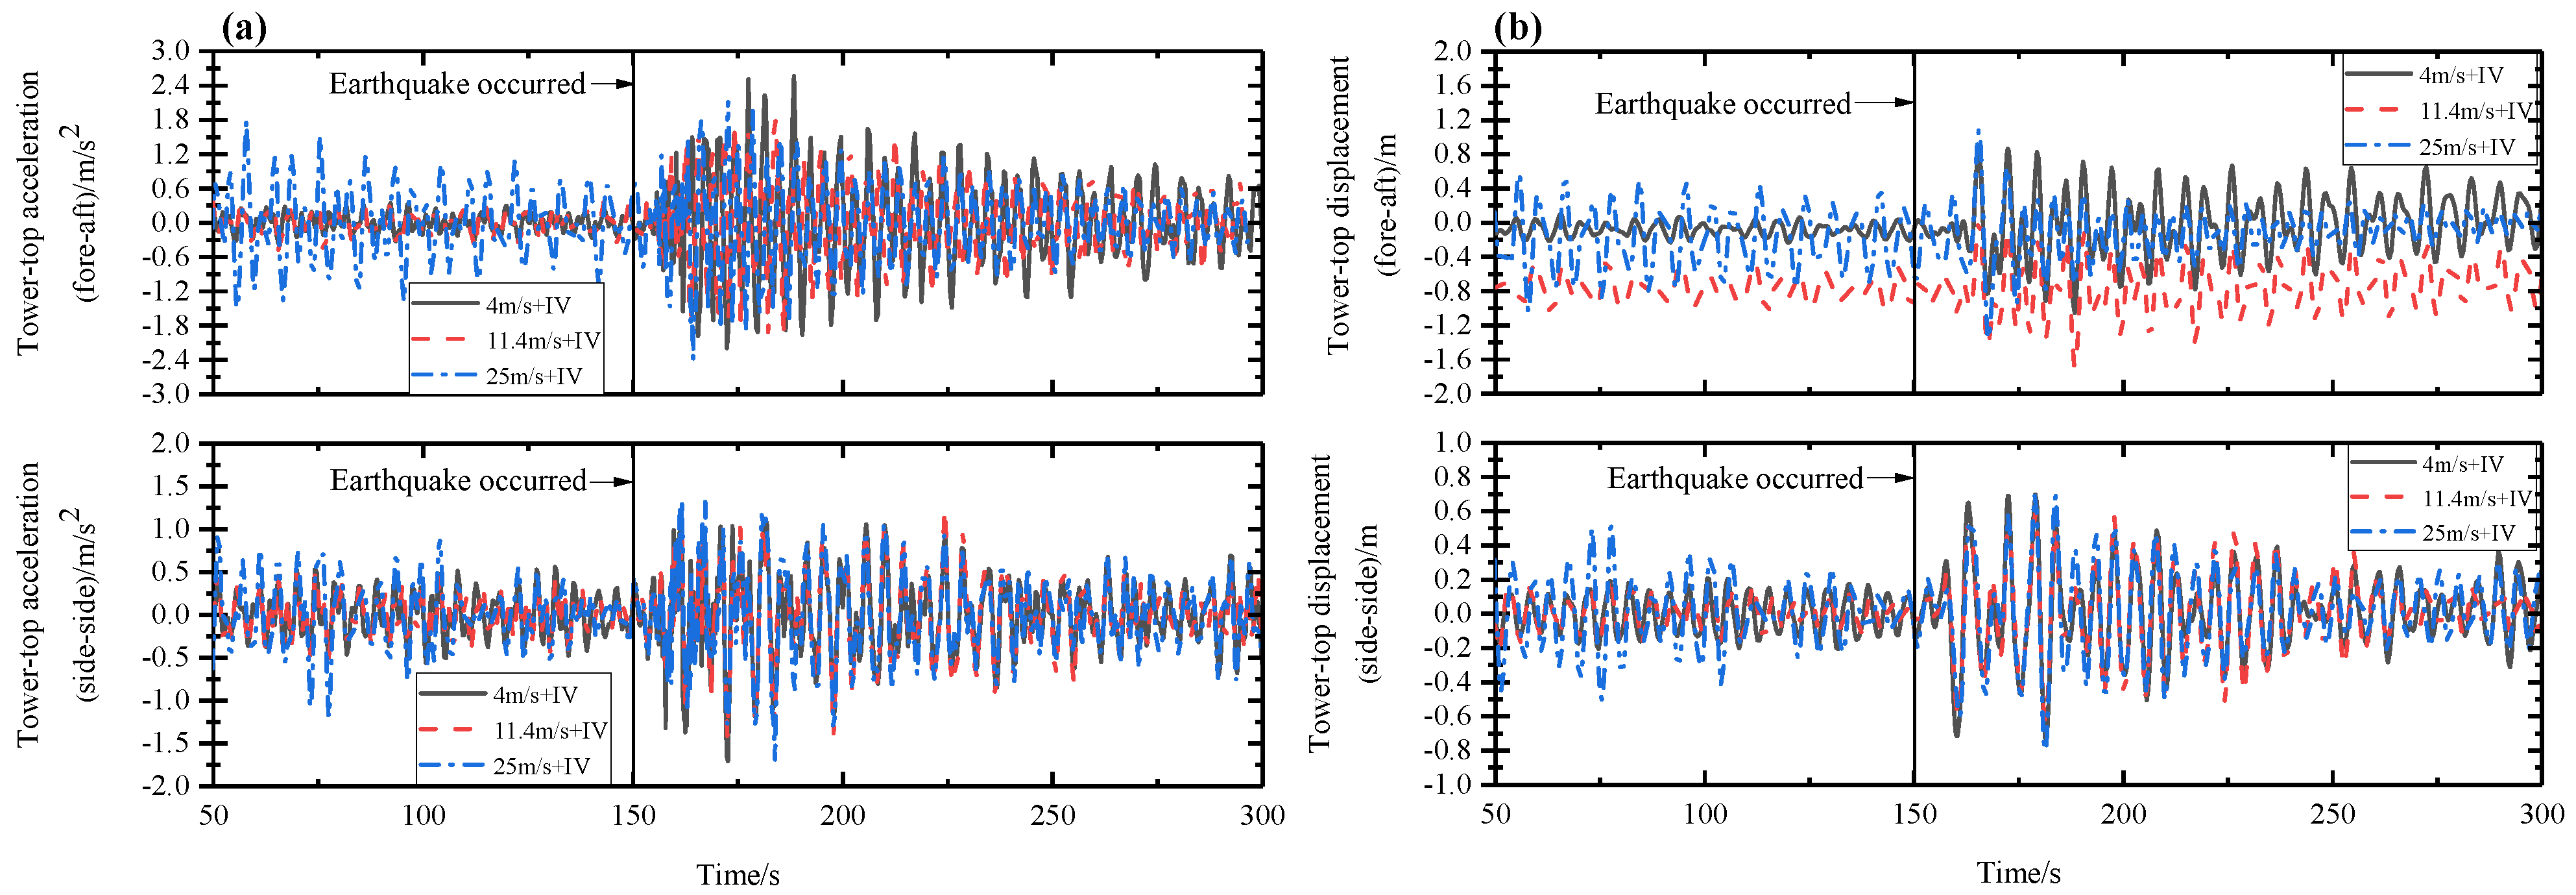
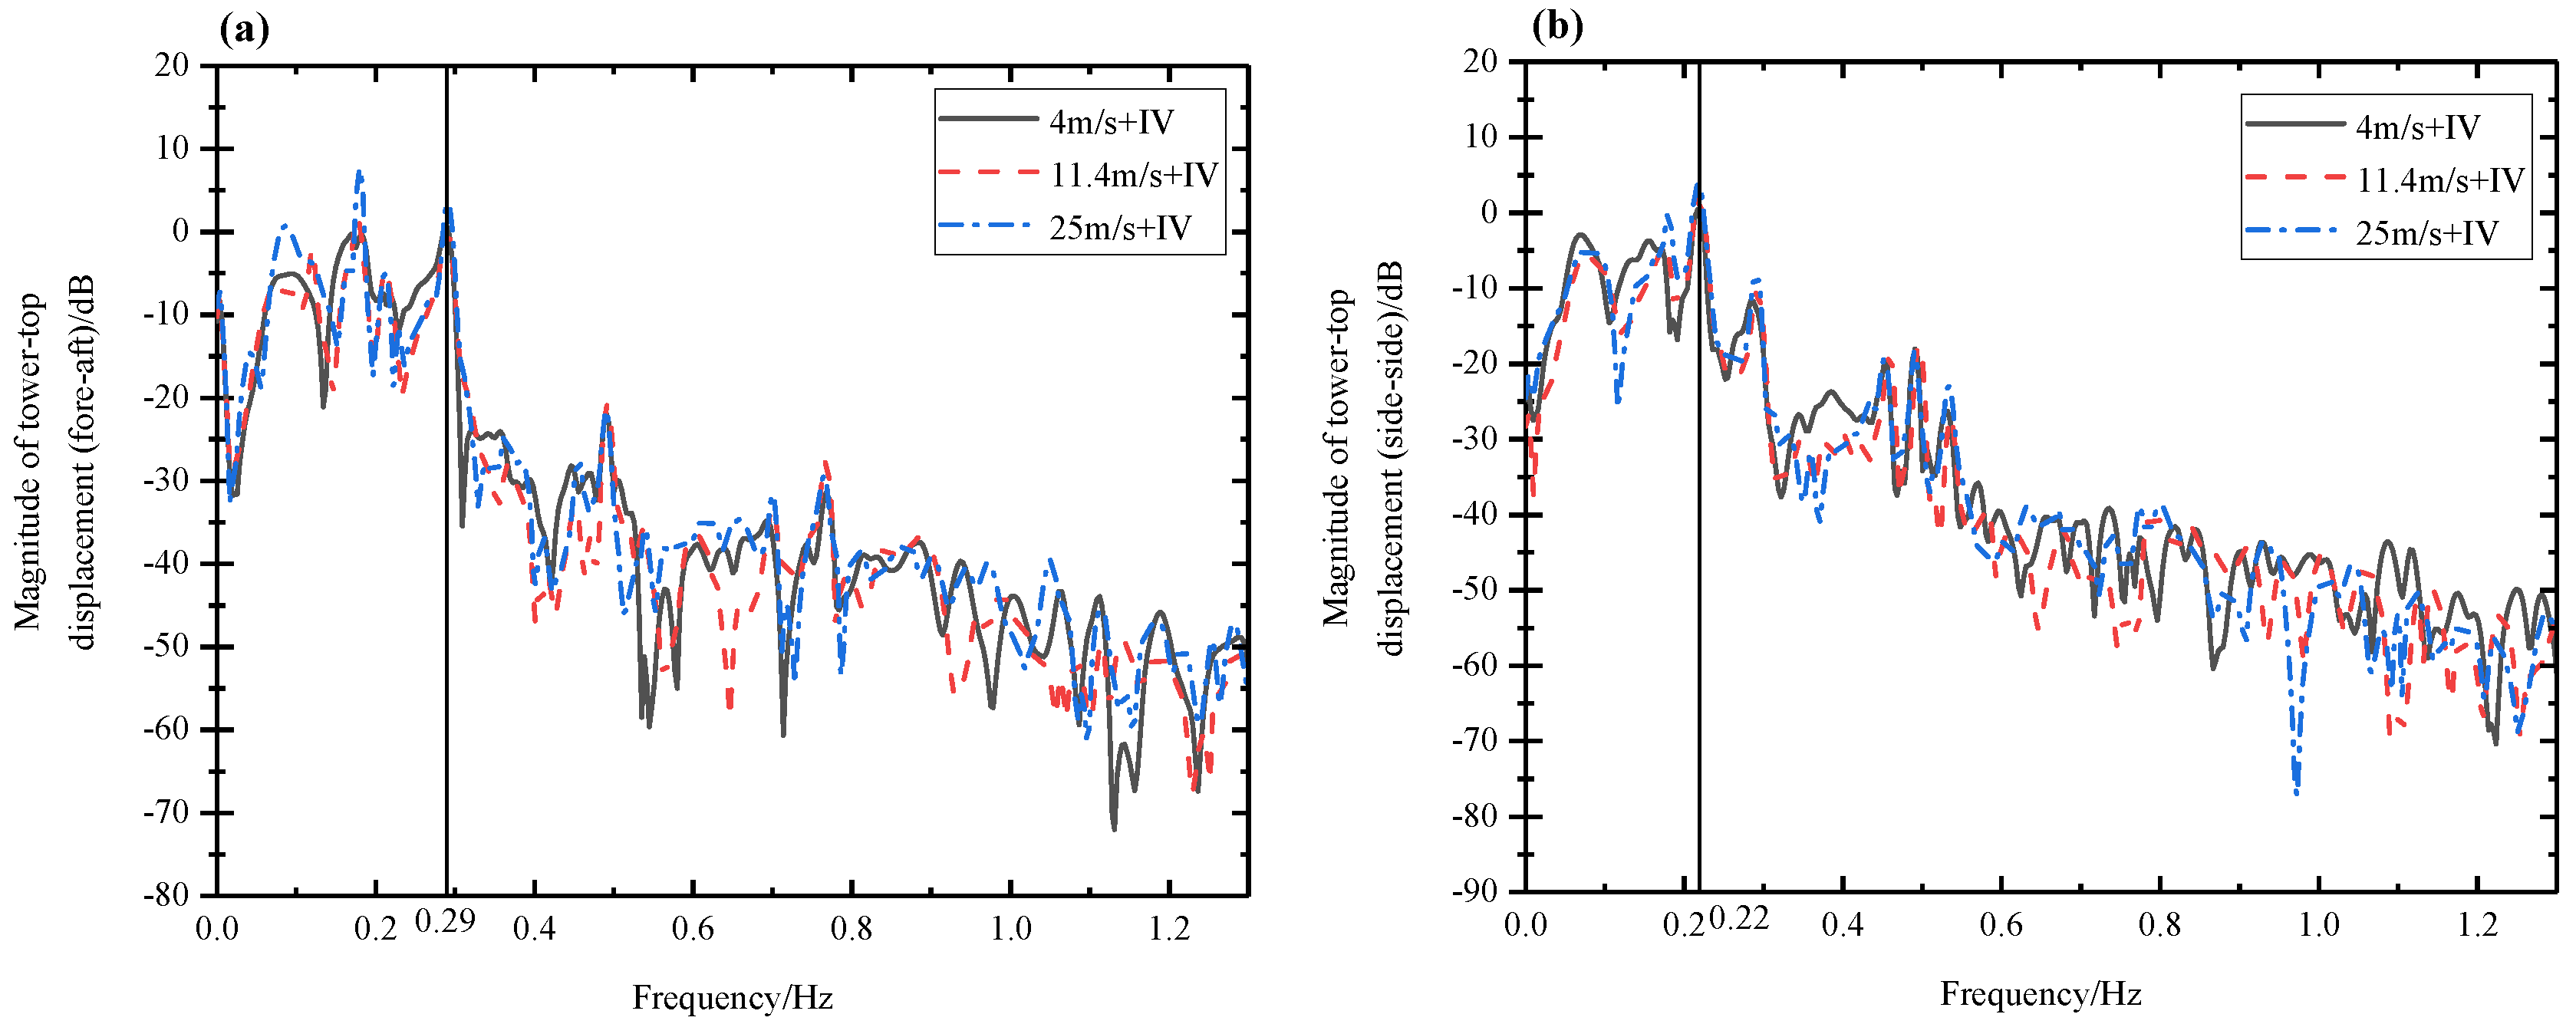
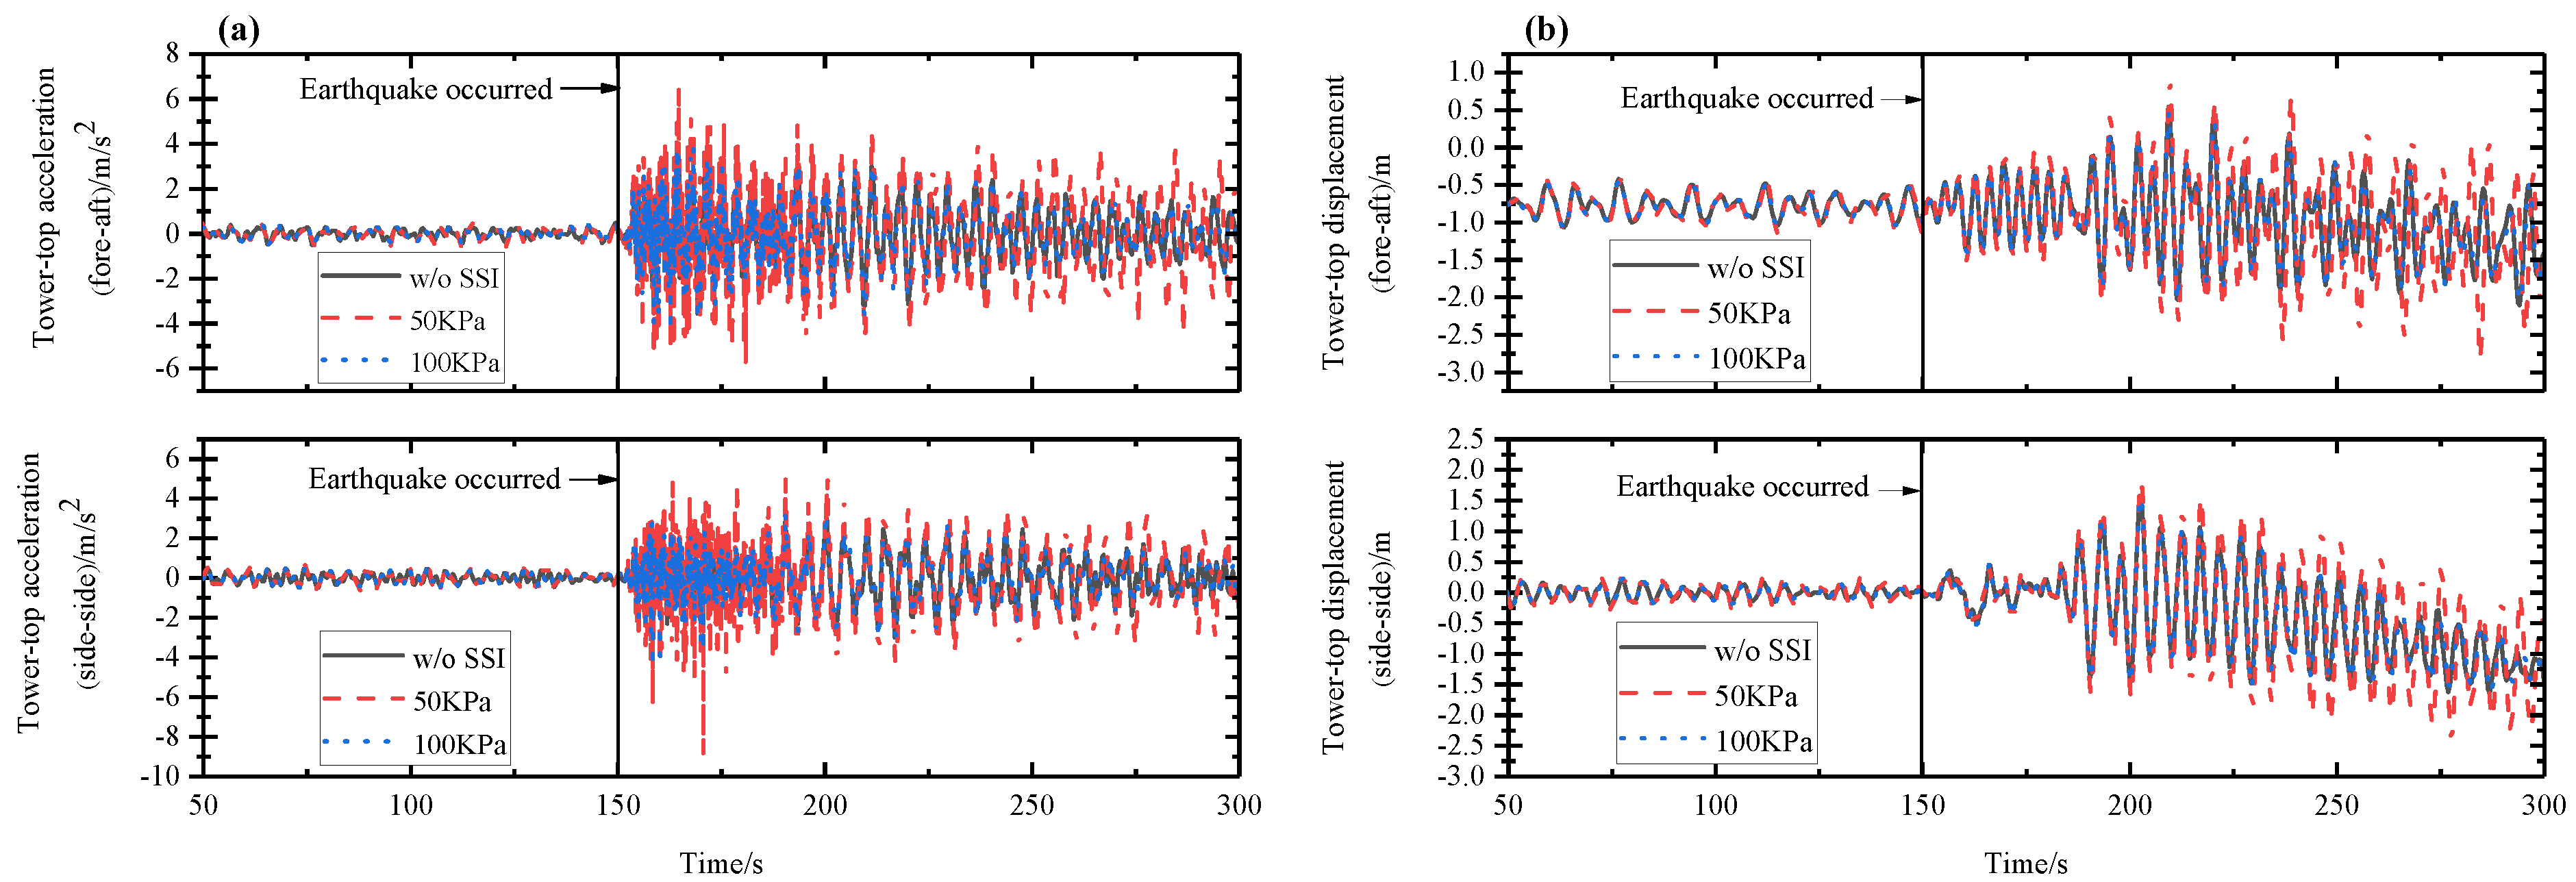
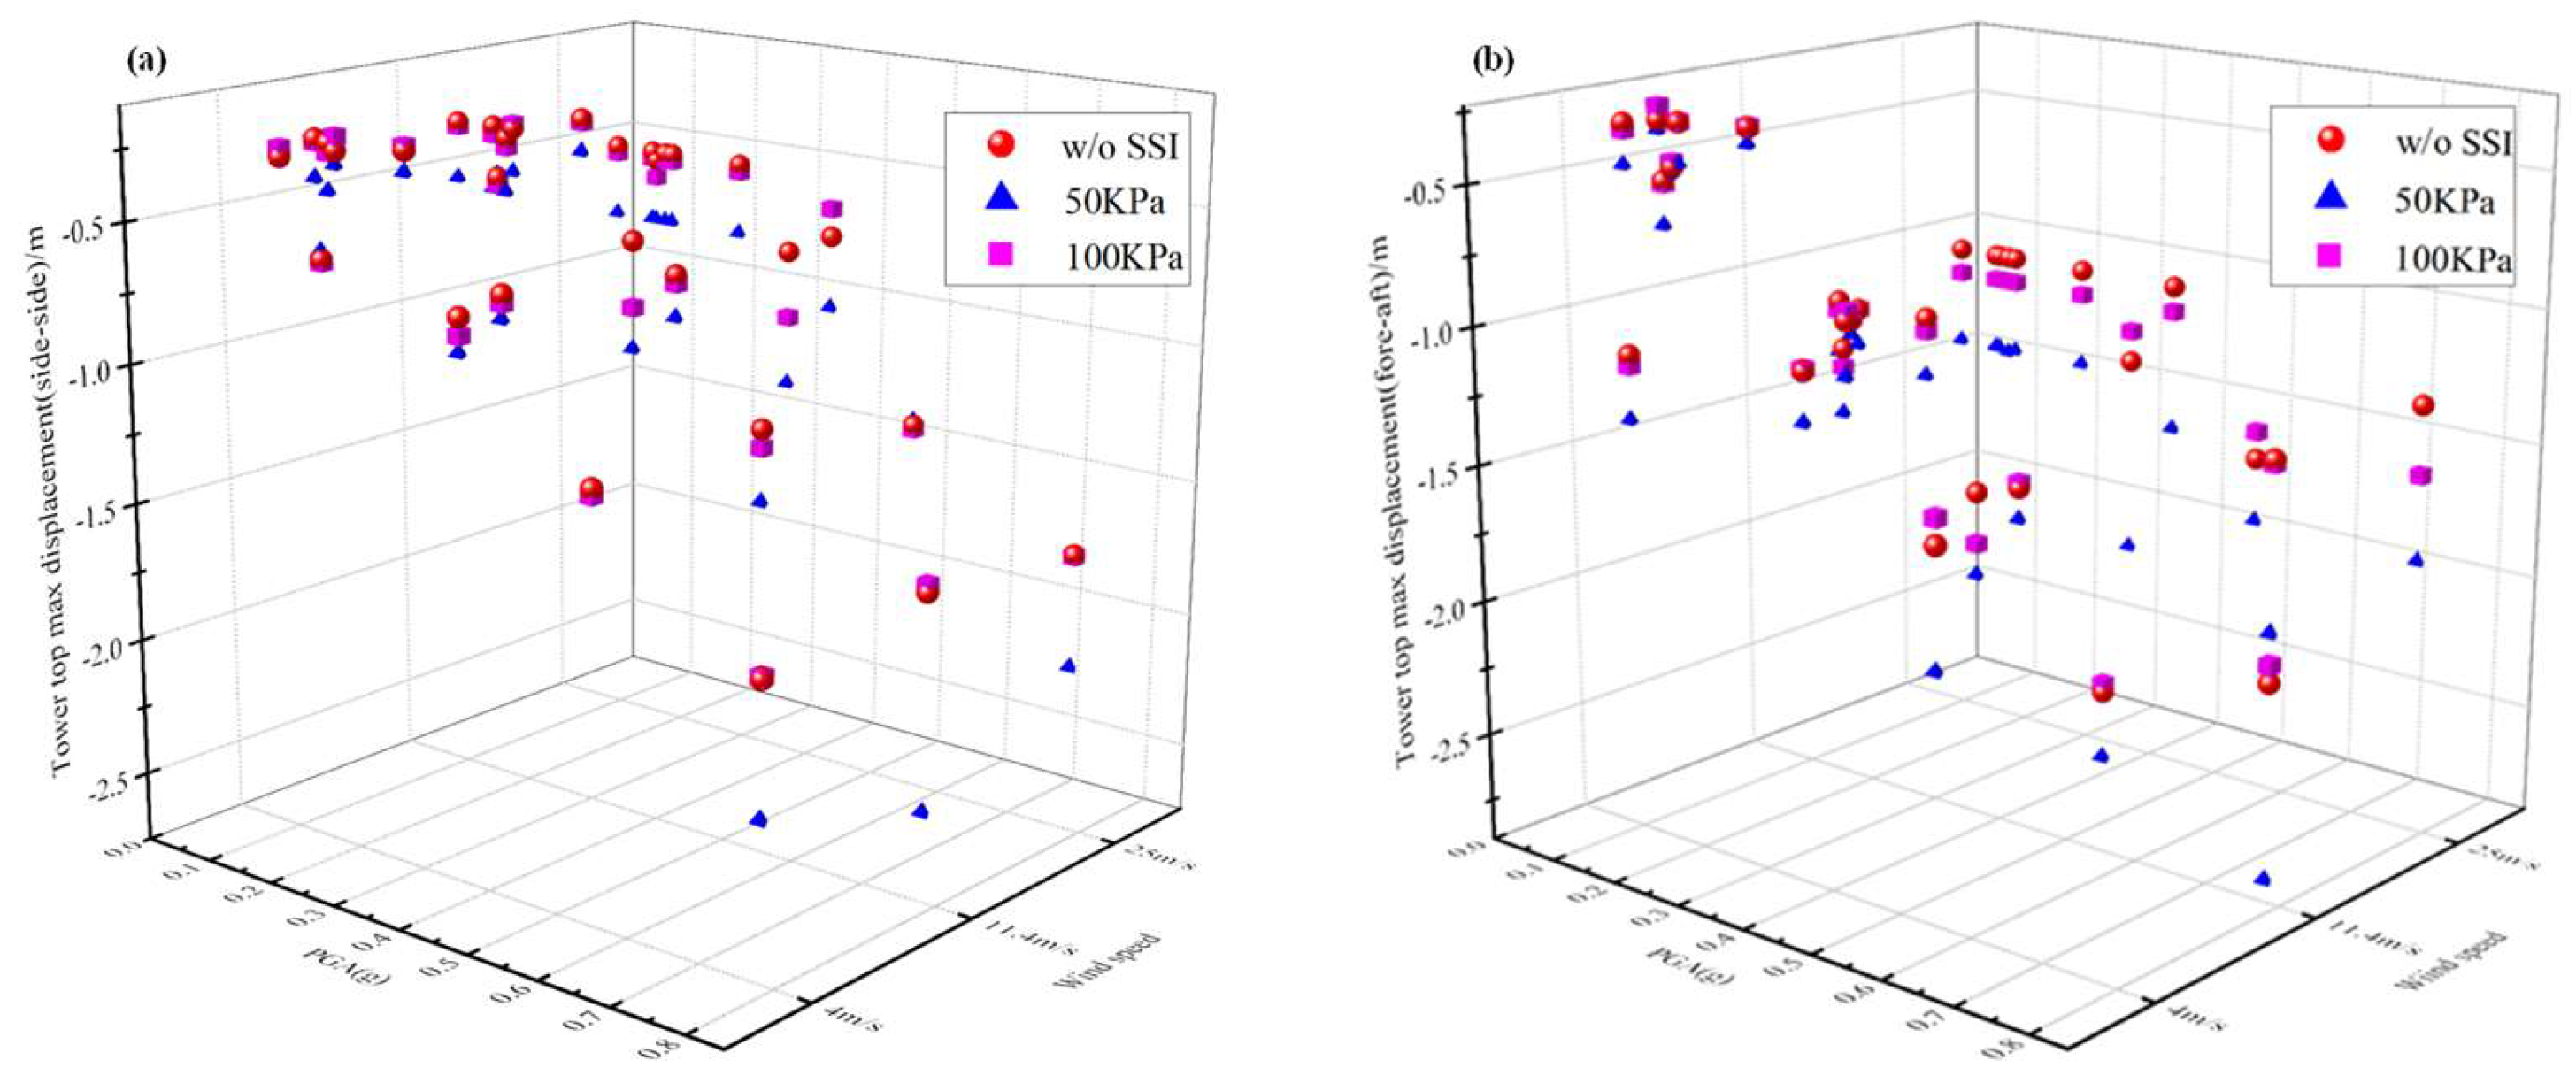
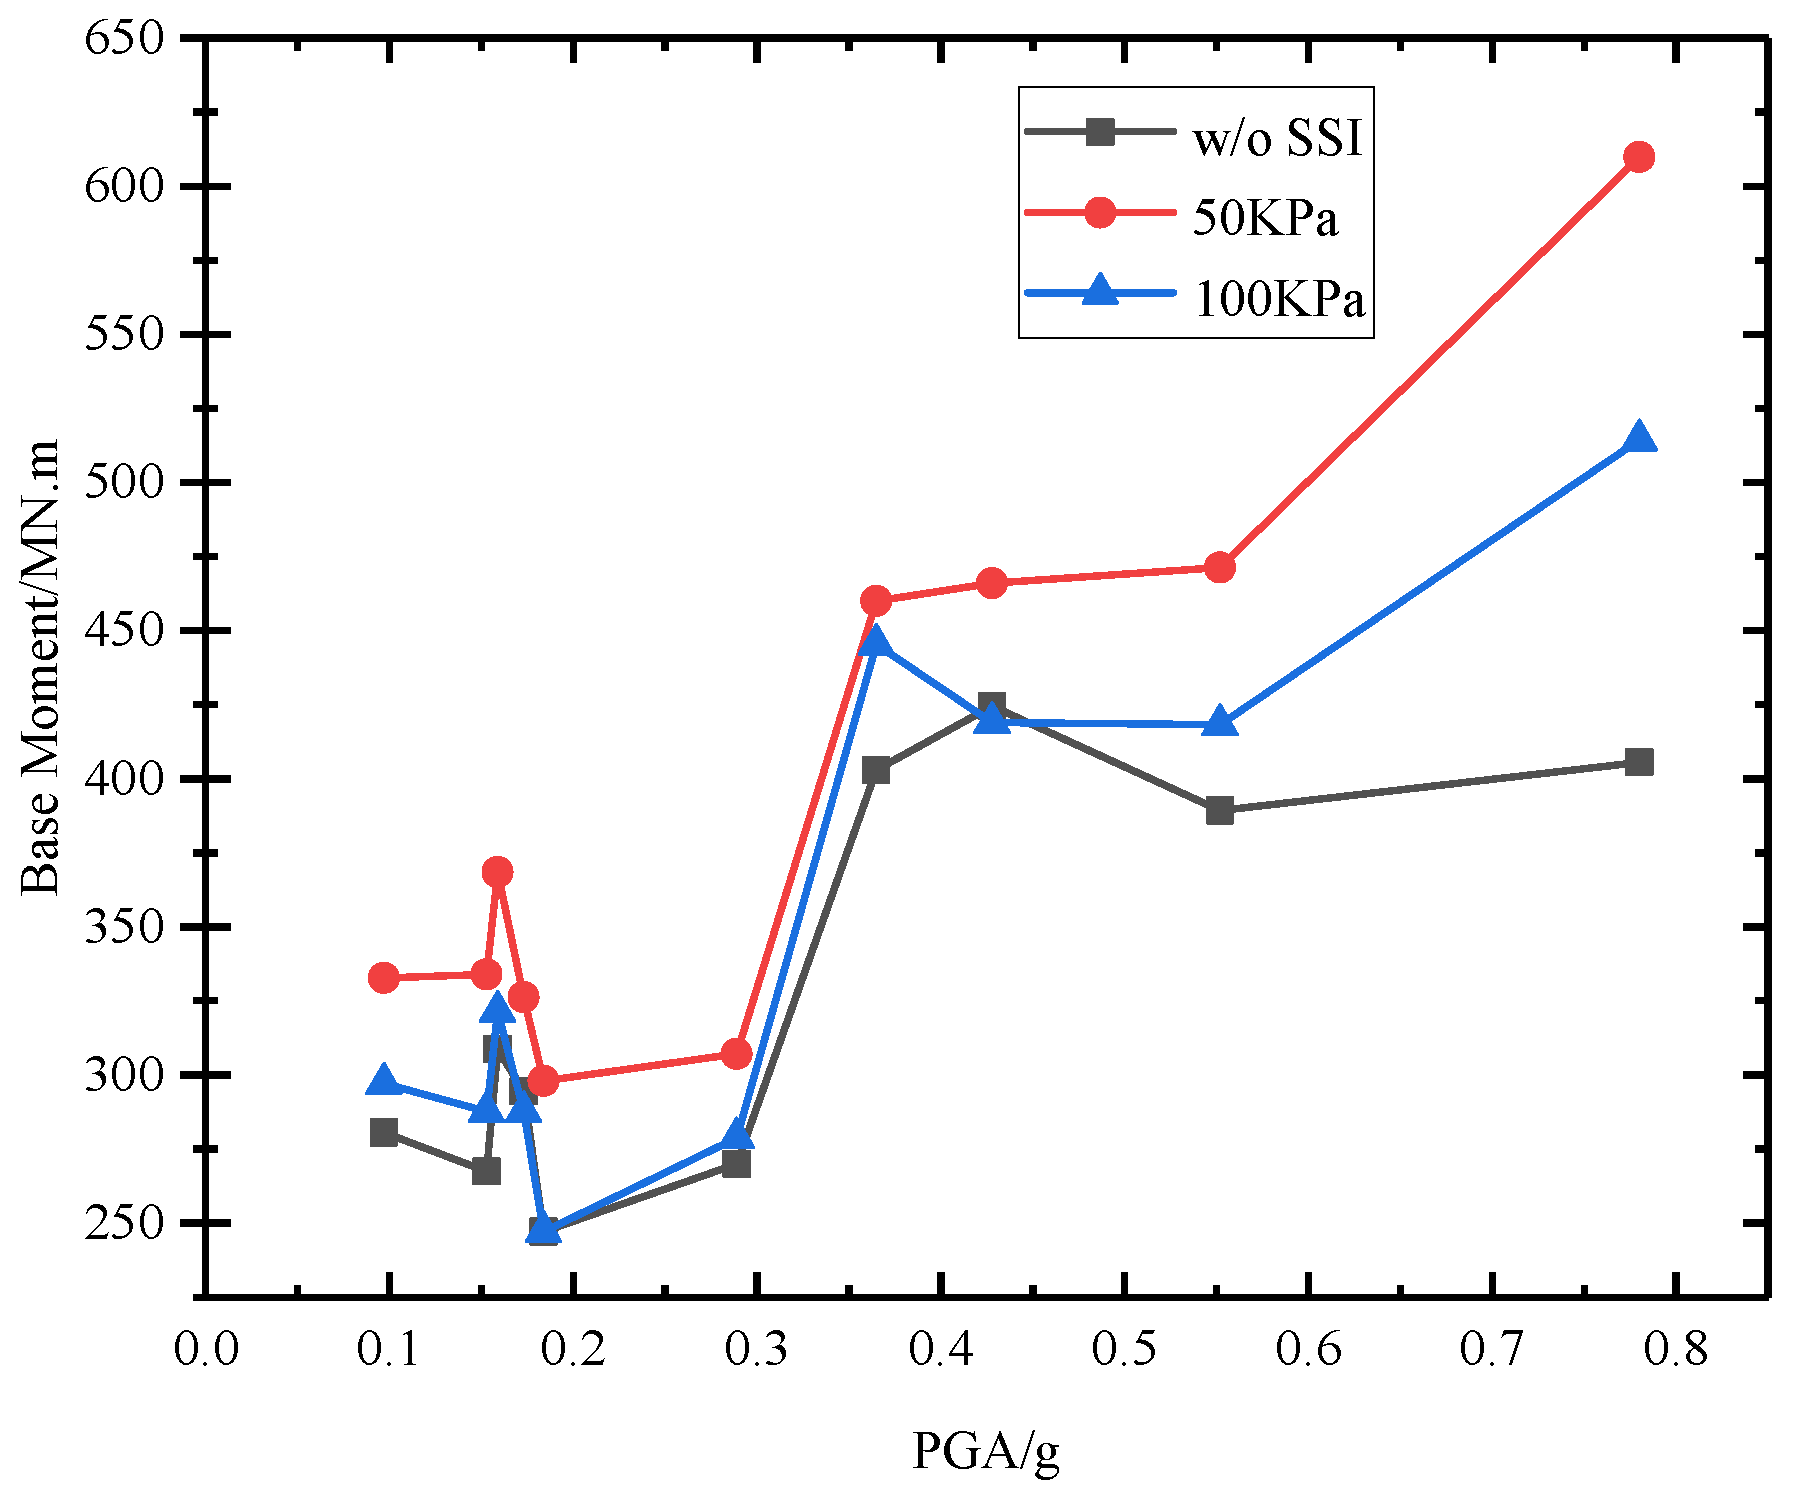
5.1. Wind–Seismic Coupled Tower Vibration Behavior

To investigate the structural response of a 10 MW wind turbine under coupled loads, the vibration sources are divided into wind-alone and wind–seismic coupled effects, while the role and influence of SSI effects in ground motion are also analyzed. Ground motion input during wind turbine operation is used in the investigation, and to eliminate the transient response during start-up, the seismic load is applied 150 s after the wind load has been applied. Table 3 provides information on the seismic loads. Figure 14 shows the tower top time curves for different wind speeds and seismic coupling effects without SSI. At a wind speed of 25 m/s, when the wind load acts alone, the acceleration time-domain curve indicates that the acceleration at the top of the tower is greater in the fore and aft direction. When a wind turbine starts, and the wind speed exceeds the rated wind speed, the pitching change of the wind turbine causes a large, sudden change in blade load, leading to increased vibration at the top of the wind turbine. Even after eliminating the early transient effect, a large acceleration amplitude remains. However, the displacement curve in Figure 14b indicates that the maximum displacement at the top of the tower still occurs at the rated wind speed of 11.4 m/s. This is because the blade load at the rated wind speed is greater than that at a wind speed of 25 m/s.
Furthermore, the amplitude of vibration at the top of the tower increases significantly after the seismic load, with the maximum acceleration occurring at 4 m/s, followed by 25 m/s, and the minimum at 11.4 m/s. Simultaneously, the amplitude of displacement vibration in the displacement-time curve is notably greater at 4 m/s wind speed than under other working conditions following seismic activity. This finding further confirms that wind loadings have a positive effect in mitigating earthquake-induced vibration. In Figure 15, the Welch spectrum describes the tower top displacement of the 10 MW wind turbine for the entire wind speed time range. It can be observed that the maximum tower response amplitude does not occur at the first-order natural frequency of 0.29 Hz during the whole wind–seismic action period due to the sudden change in blade load caused by the wind turbine pitch at 25 m/s. Additionally, the response amplitude at 0.29 Hz at 11.4 m/s is lower than that at 4 m/s due to the wind load, indicating that an increase in wind load reduces the seismic response of the tower during wind–seismic coupling.
Figure 16 illustrates the tower top time profile at 11.4 m/s coupled to KC ground motion. The figure reveals a significant increase in acceleration and displacement at the top of the tower during seismic loading. Moreover, different soil types have varying effects, with the structural response greater than without SSI for both soft and hard soil foundations. Figure 17 displays the maximum displacement of the tower top under wind–seismic coupling. The figure demonstrates that the maximum structural response of the tower occurs at an SSI of 50 KPa, a wind speed of 11.4 m/s, and a ground motion PGA of 0.78 g. The maximum displacement of the structure occurs during wind–seismic coupling. Furthermore, due to the various types of ground motion, the structural response does not increase with peak seismic acceleration (PGA) at the same wind speed. The structure’s response with a soft soil base is the largest under the same wind–seismic conditions, while the structure without a soil base has the smallest response. Figure 18 shows that the maximum bending moment occurs at the base of the tower during the coupled wind–seismic action. Moreover, the maximum bending moment at the base of the tower does not increase with an increasing peak seismic load acceleration (PGA) due to the various effects of ground motion on the wind turbine structure. The figure also demonstrates that SSI effects have a considerable impact on the seismic analysis of structures, and it is necessary to consider the interaction between soil and structure when analyzing soft soil foundations for seismic response. Finally, the wind turbine tower structure does not experience material-yielding failure during wind–seismic coupling.

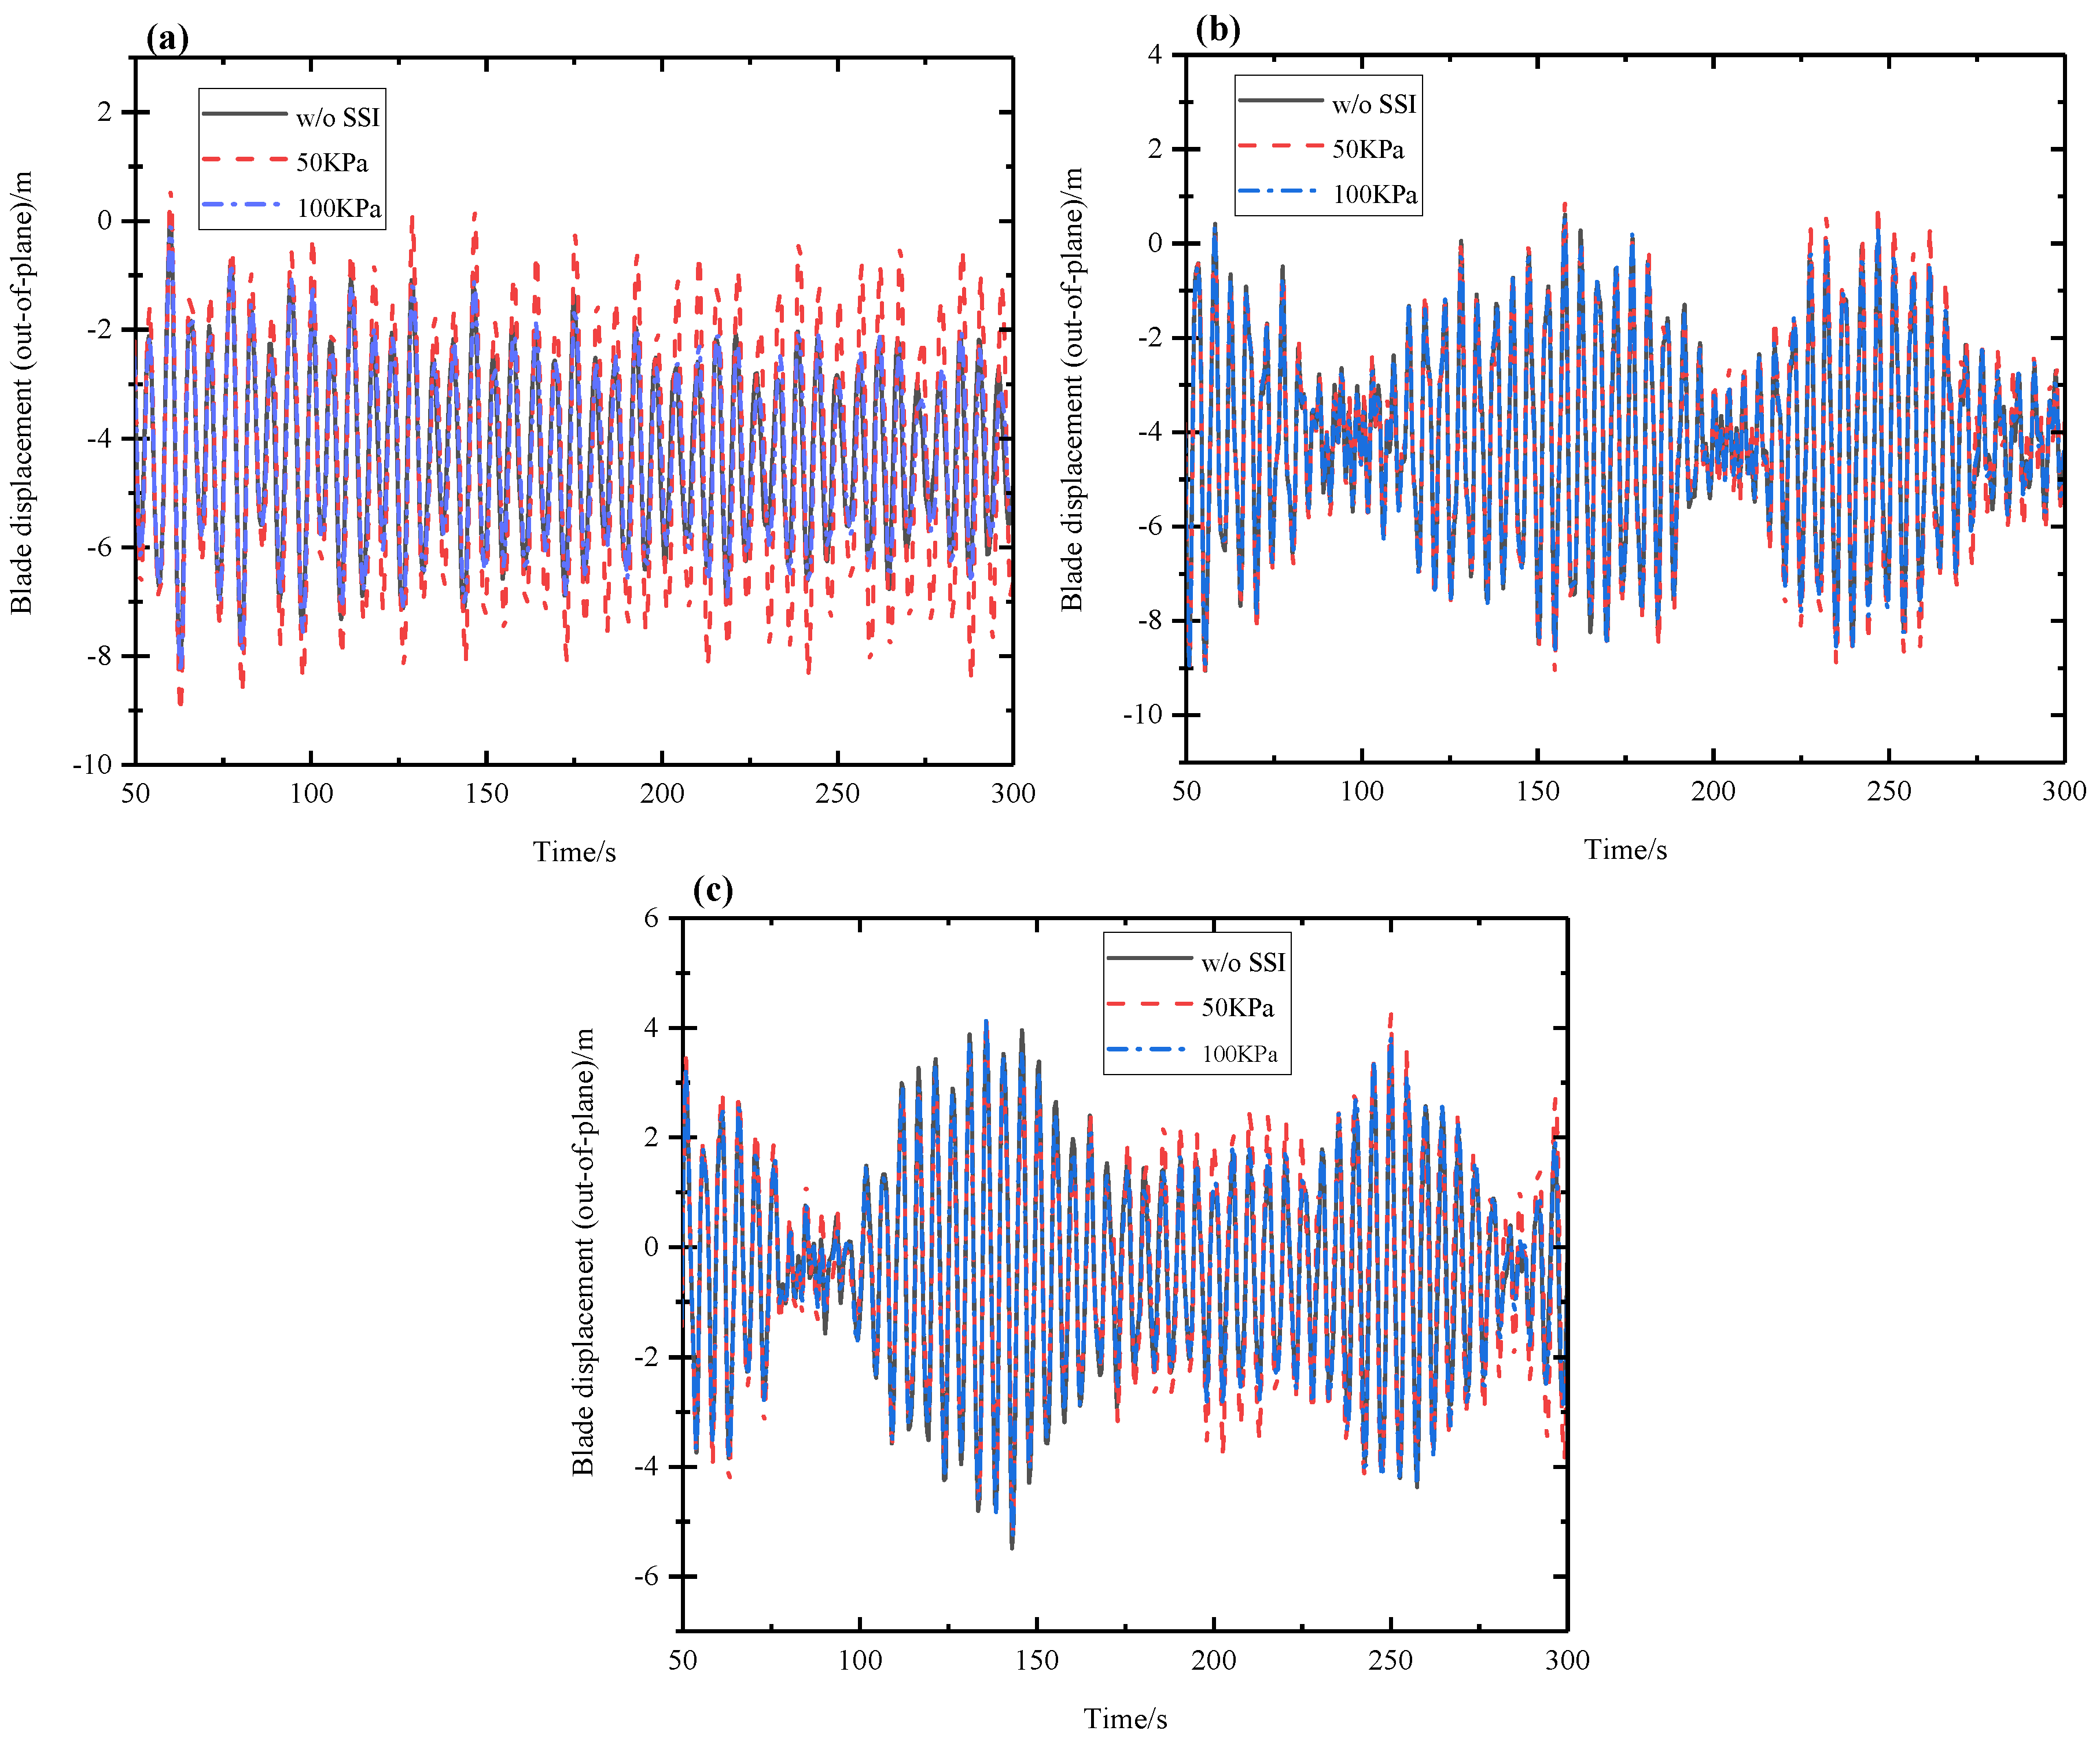
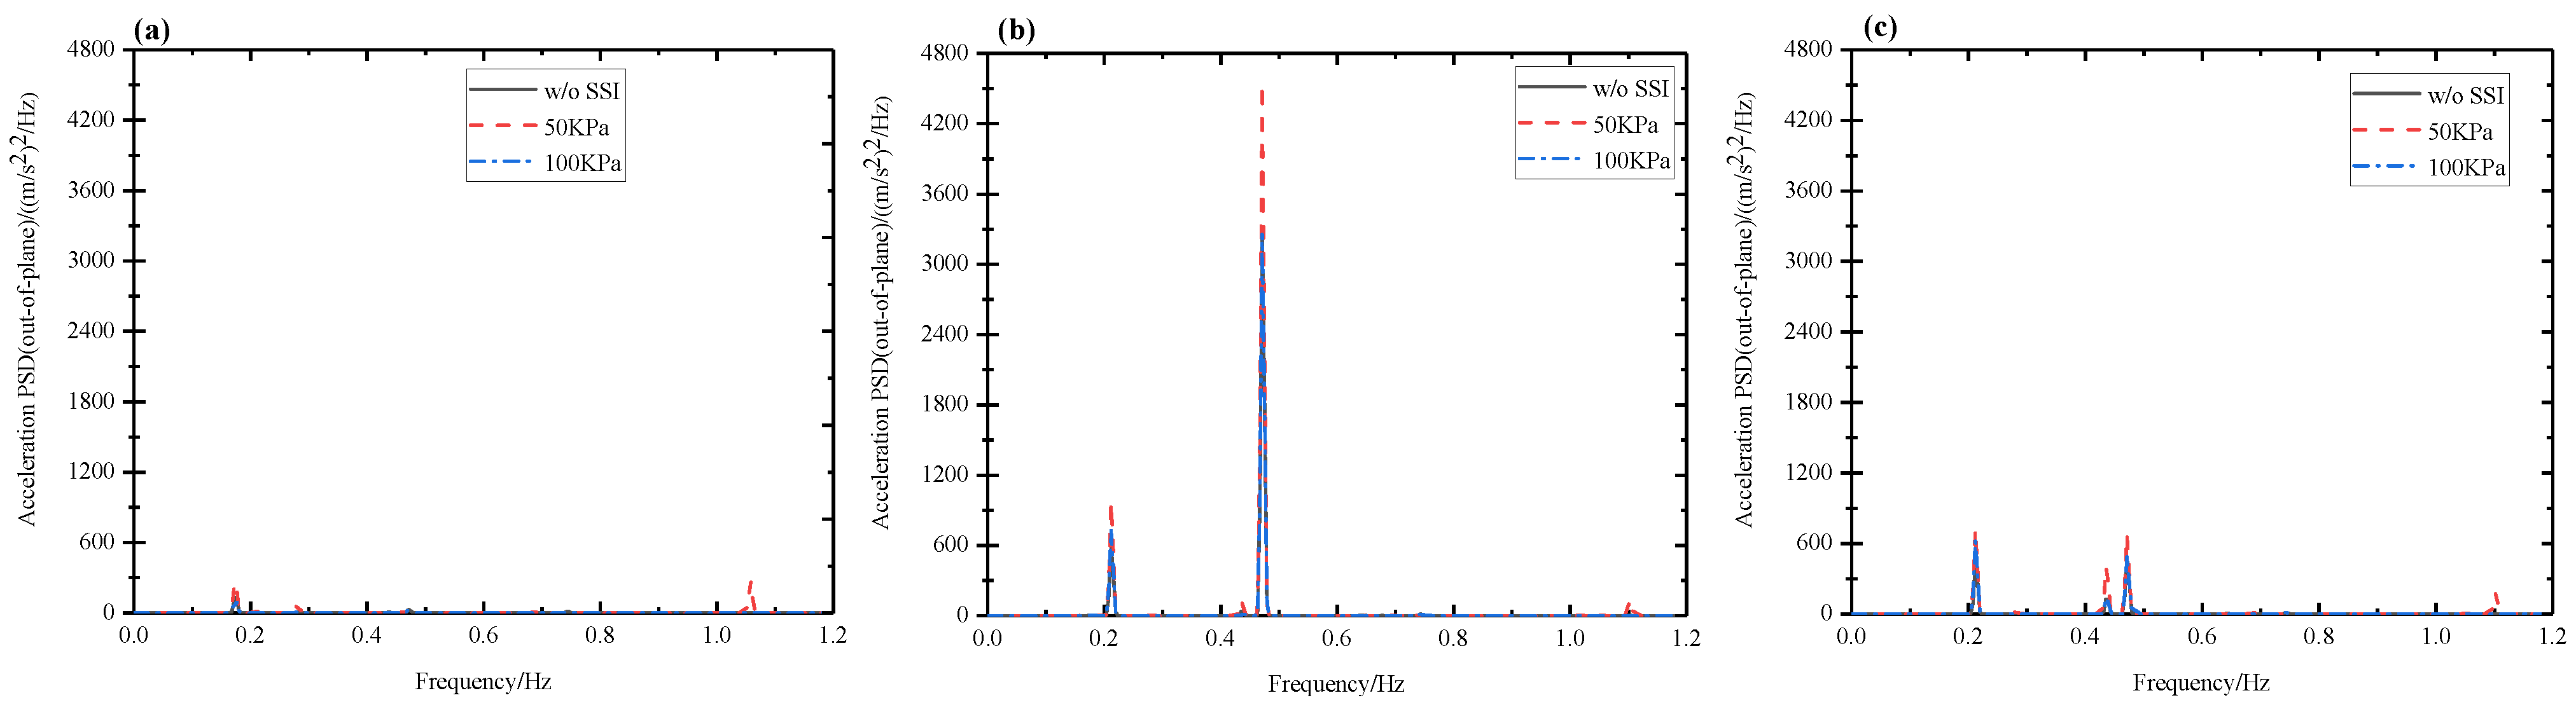
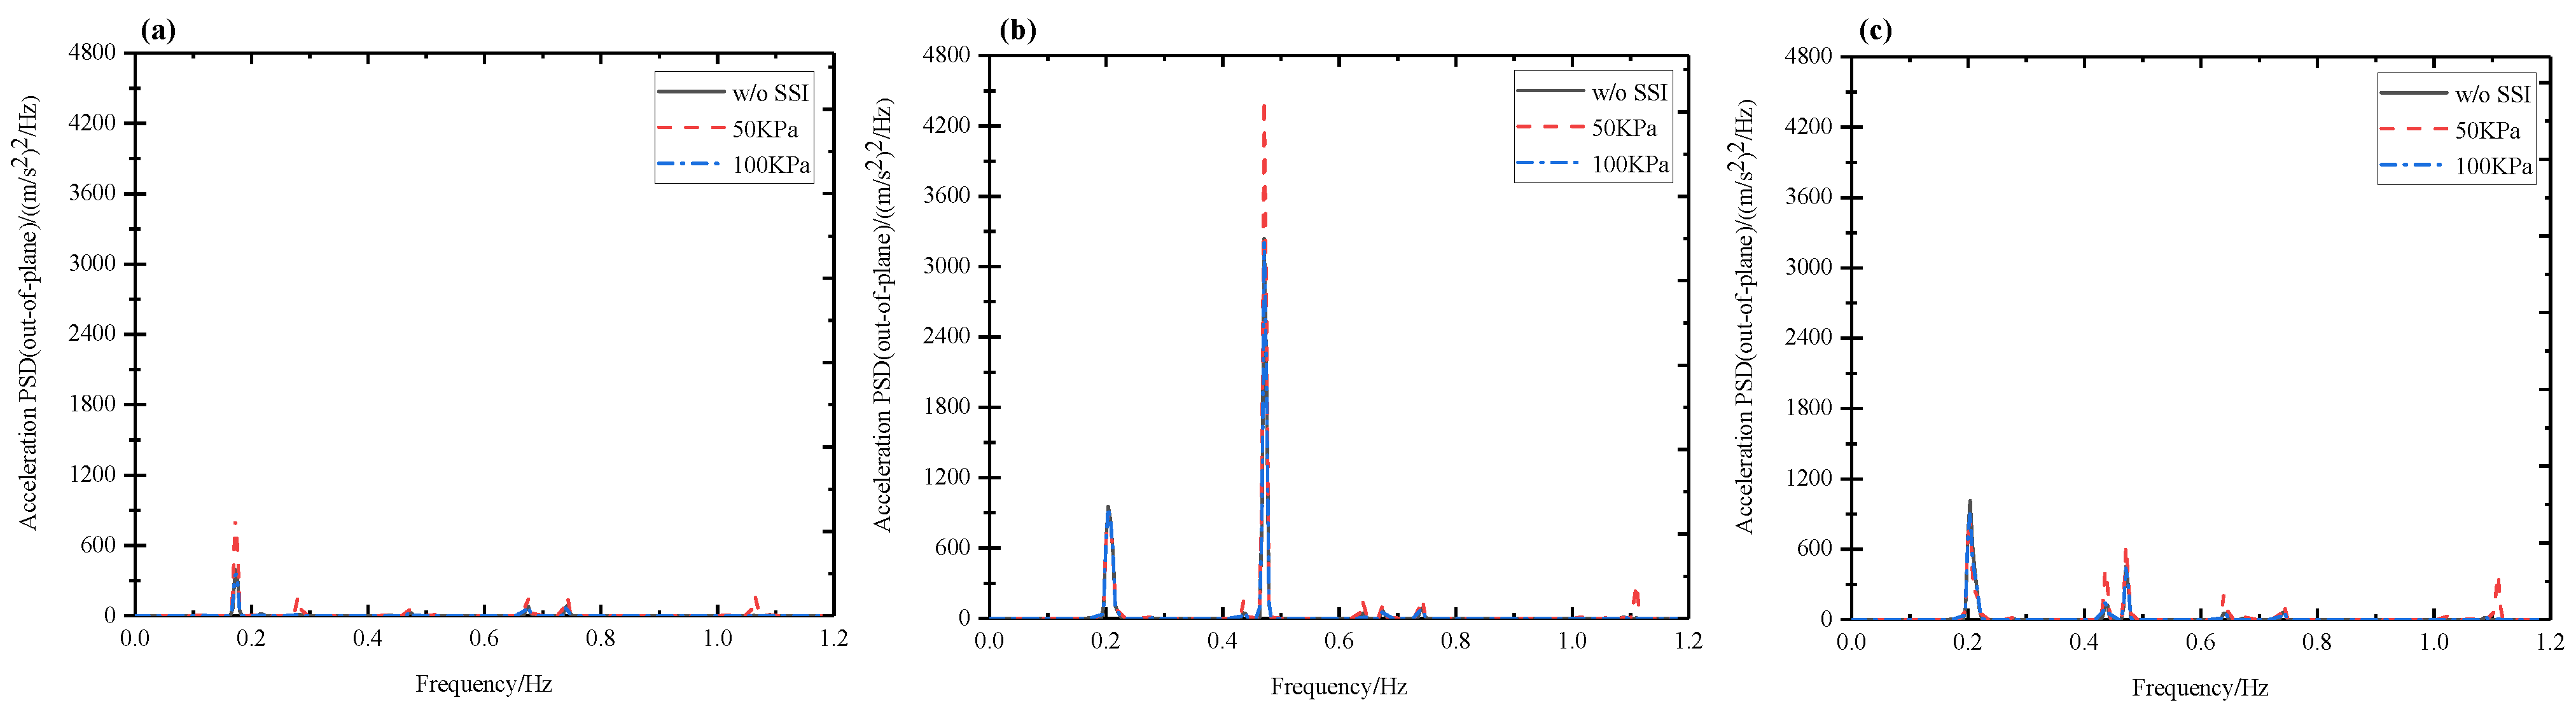
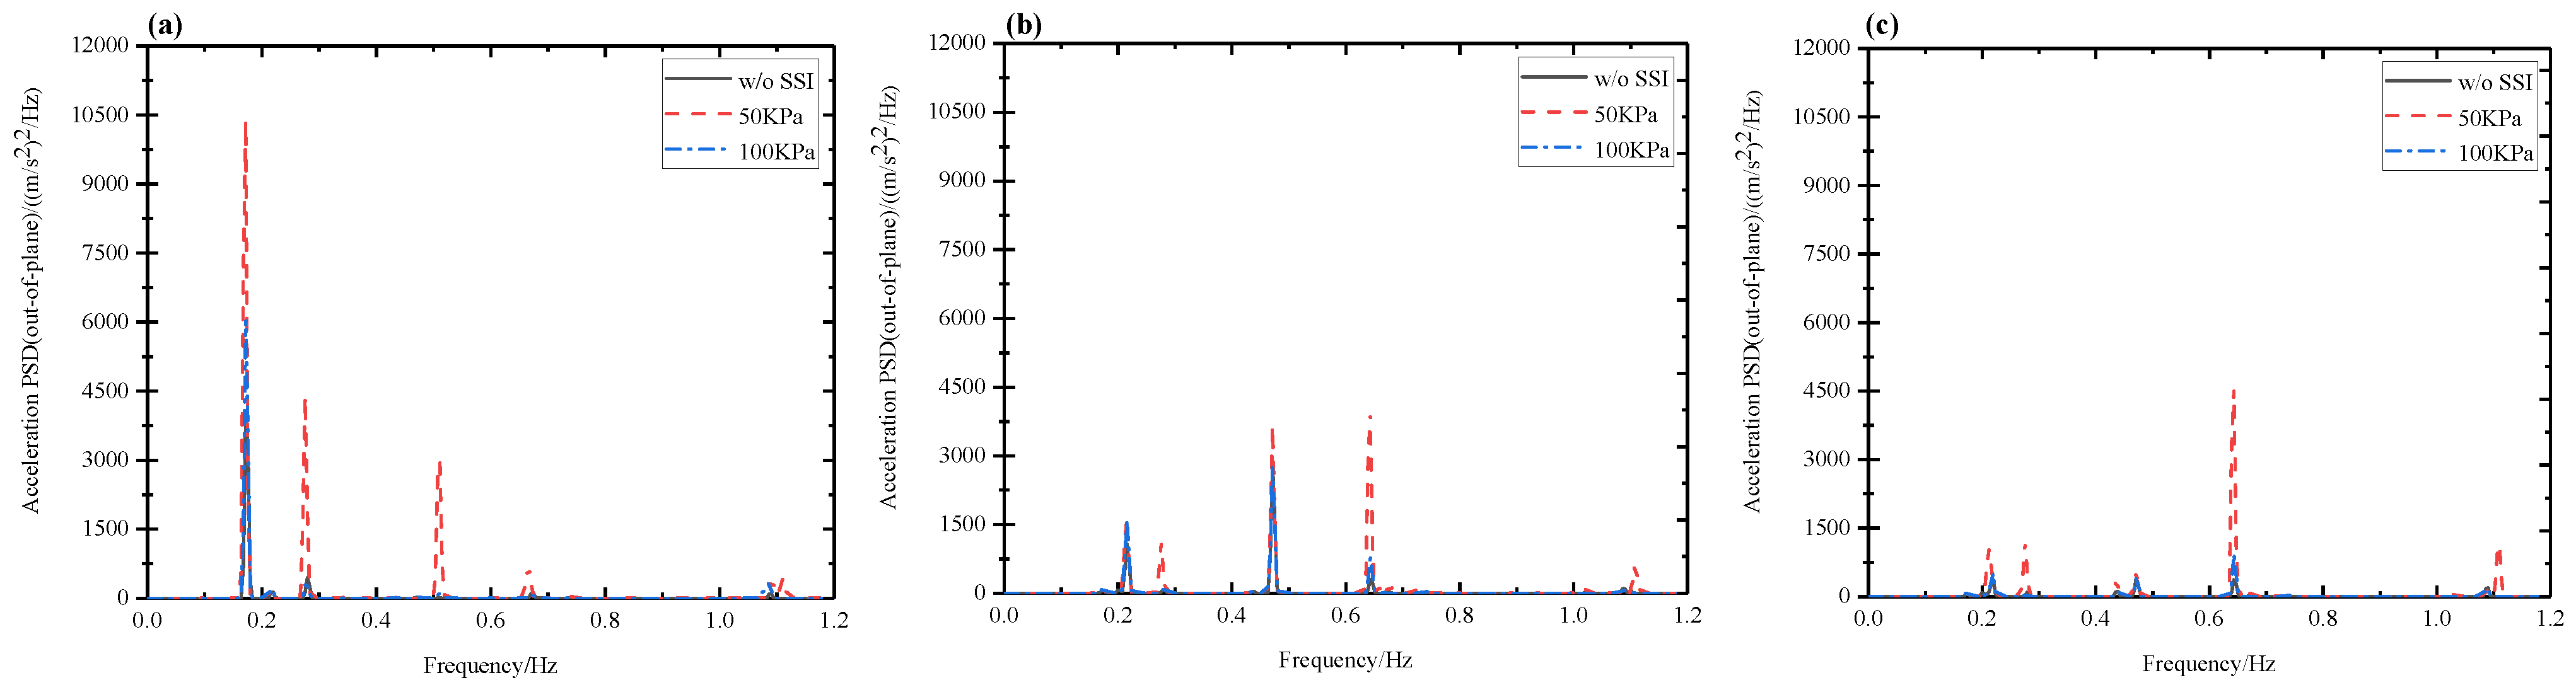
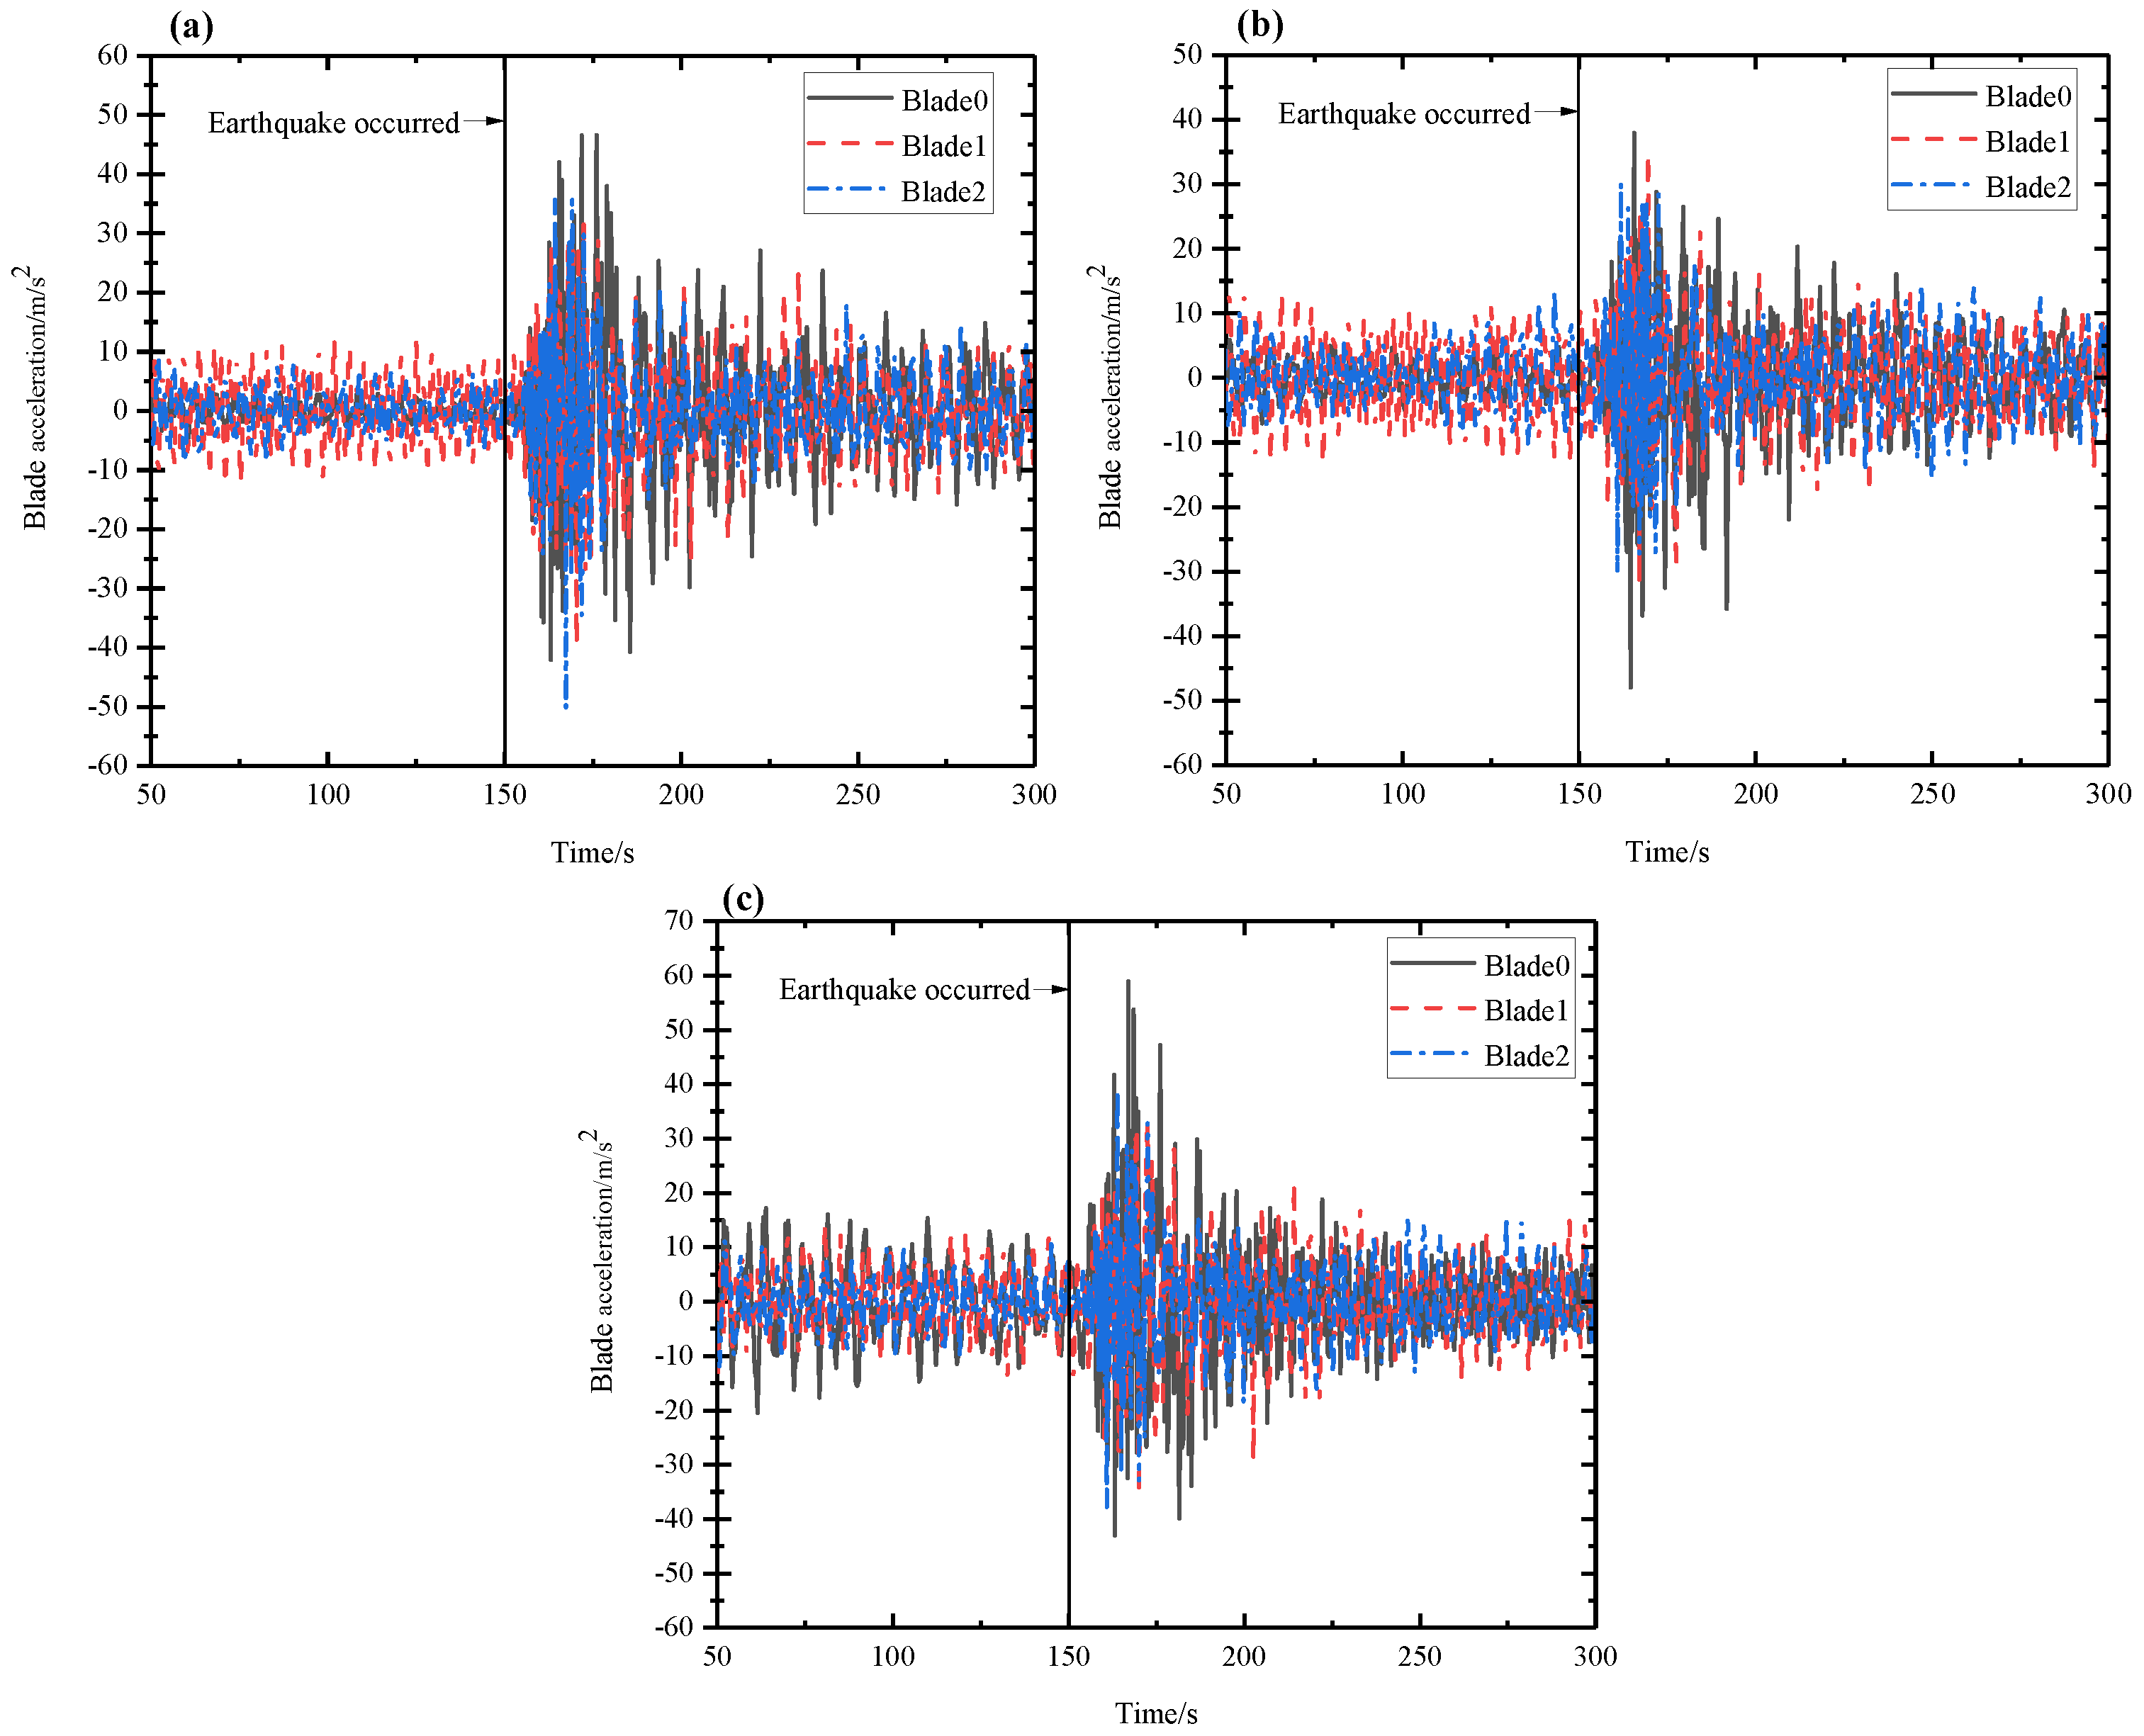
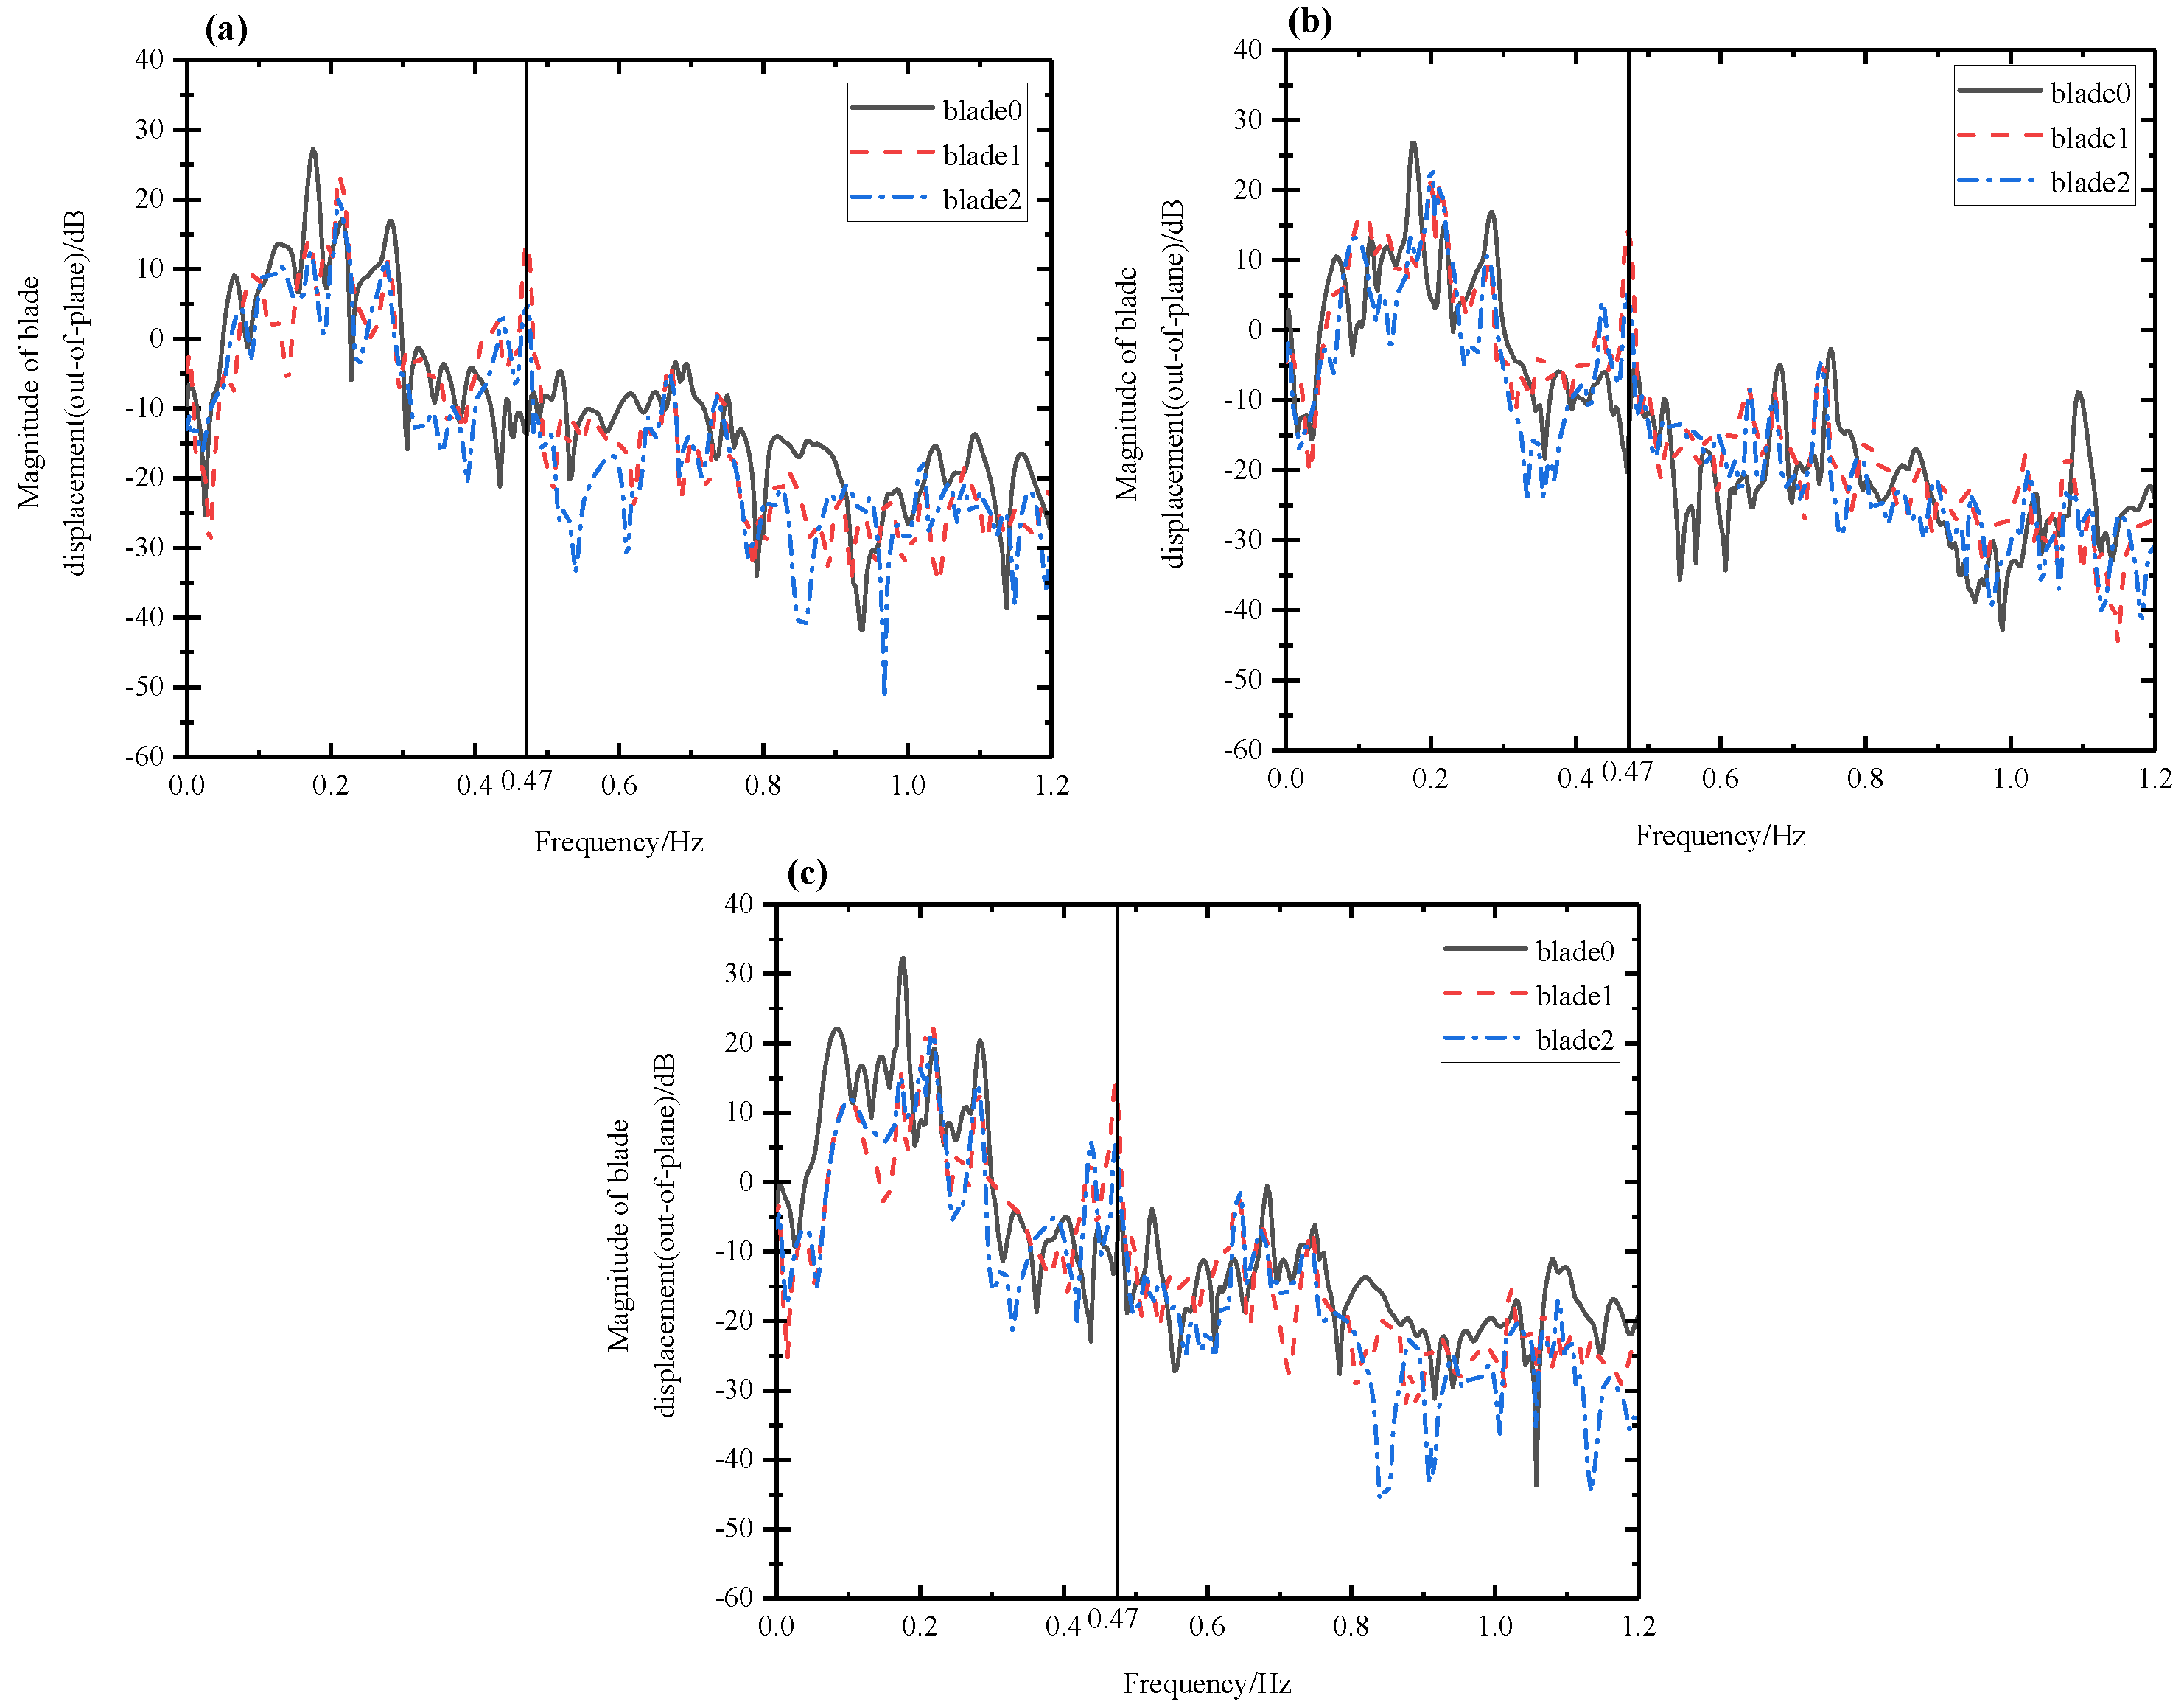
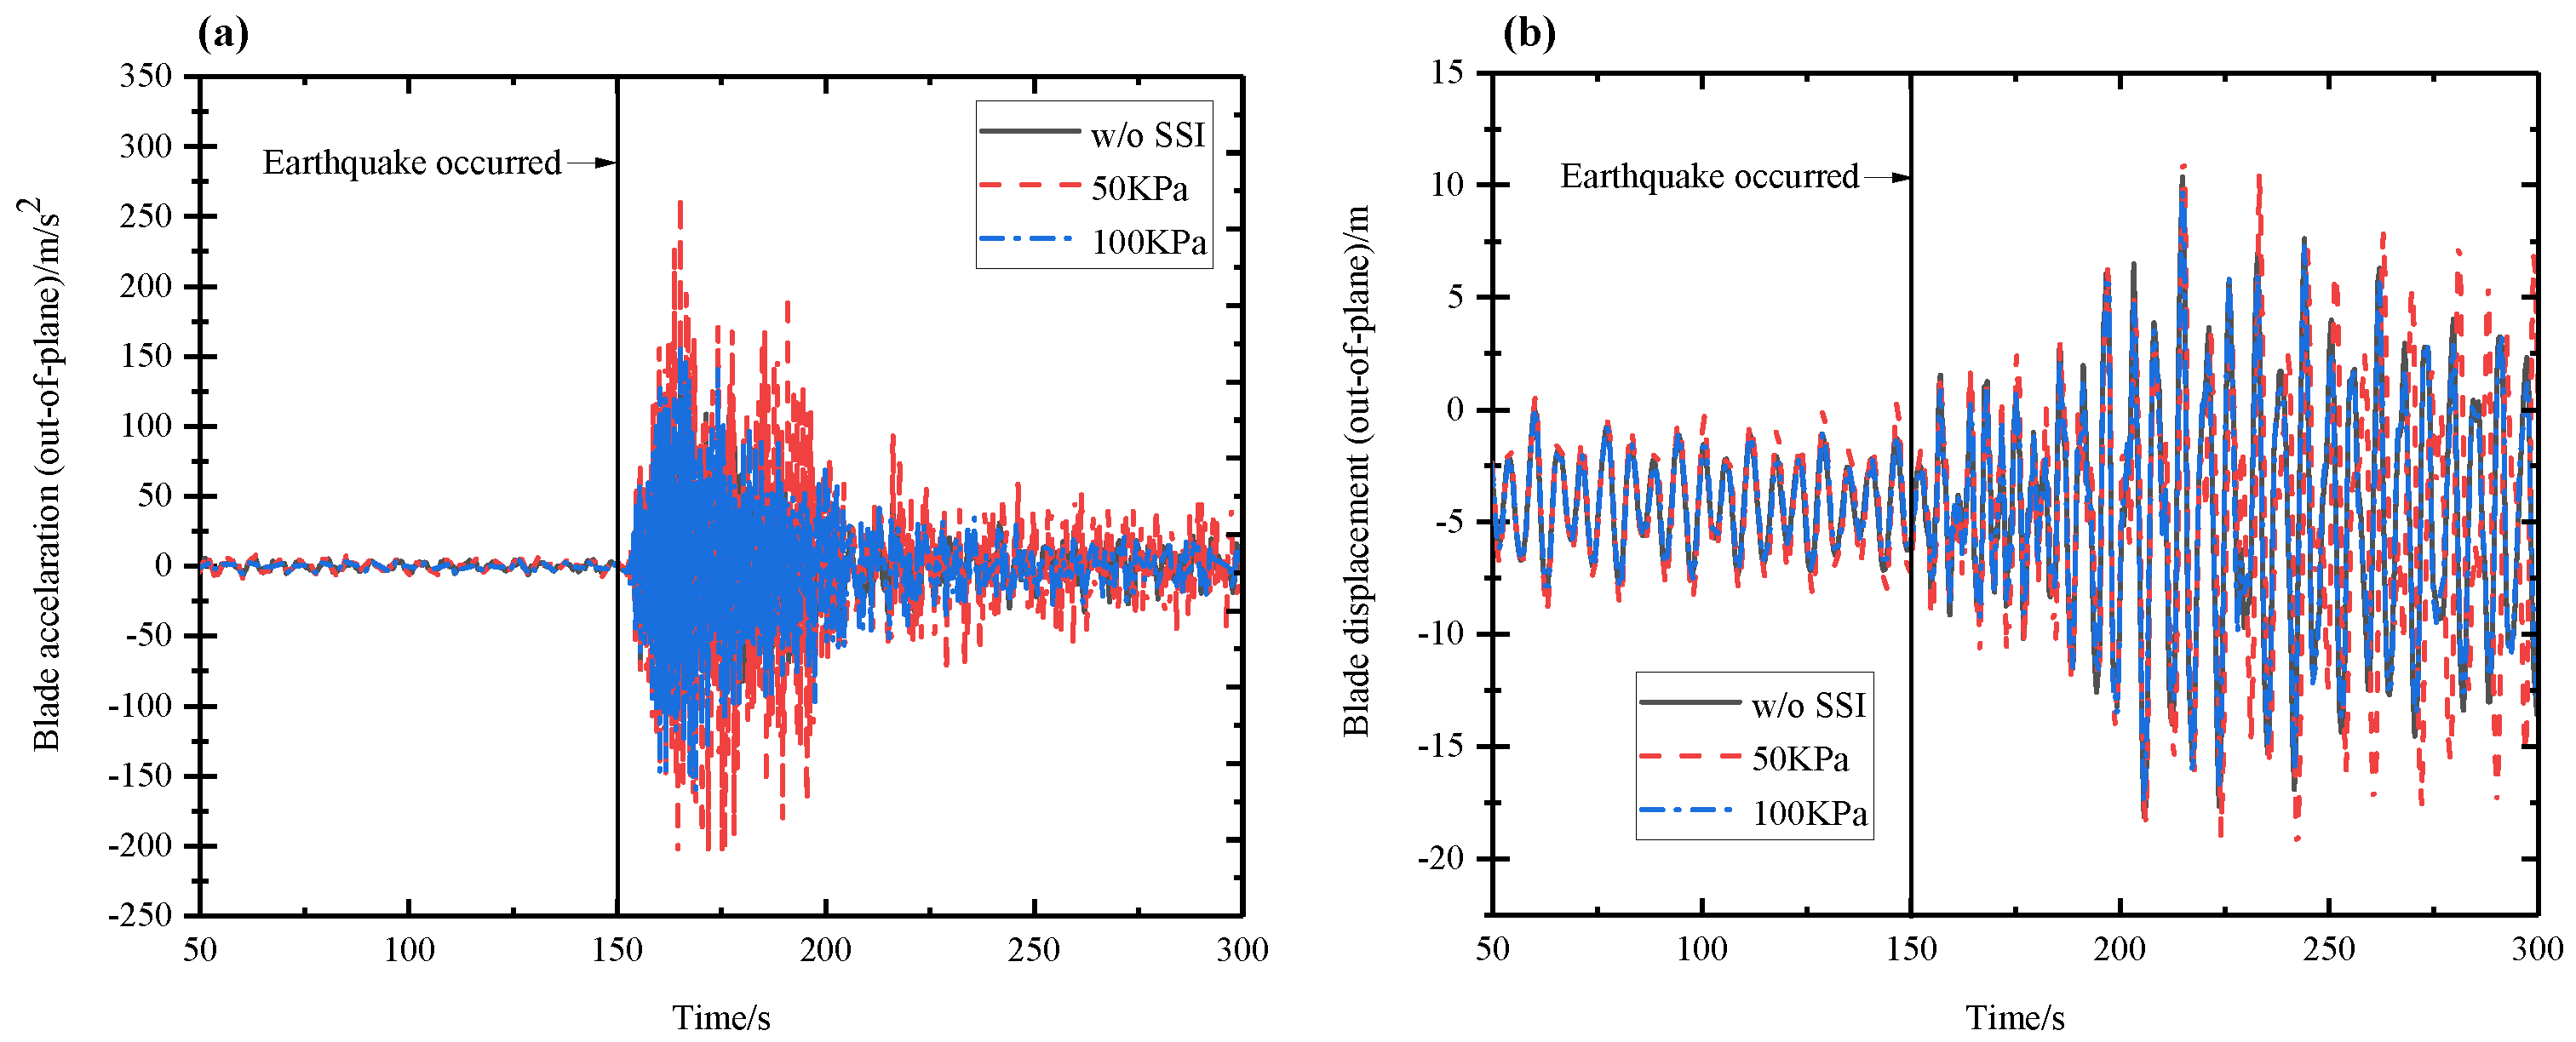
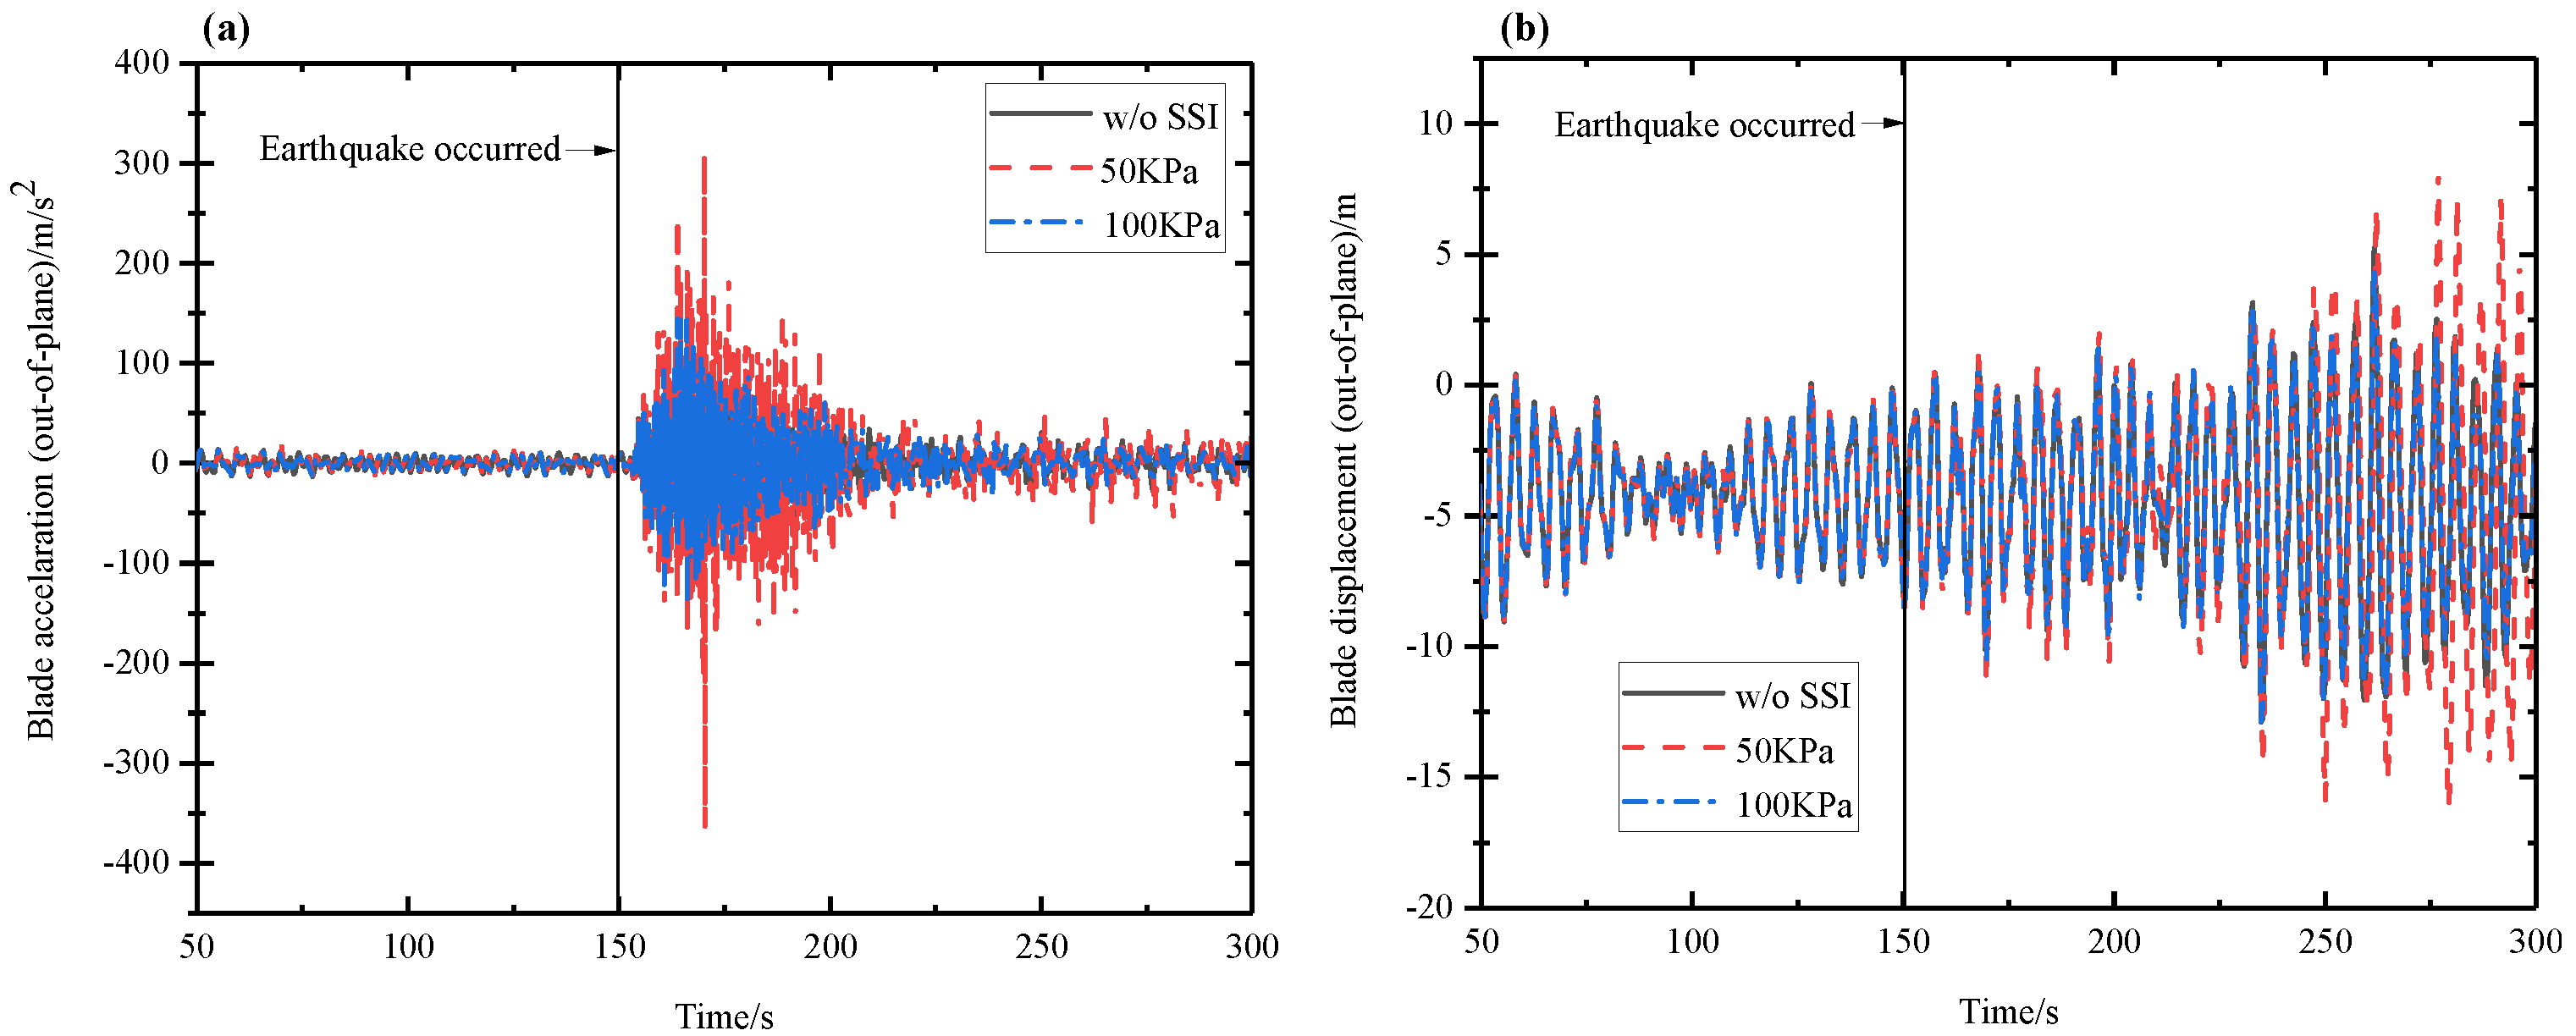
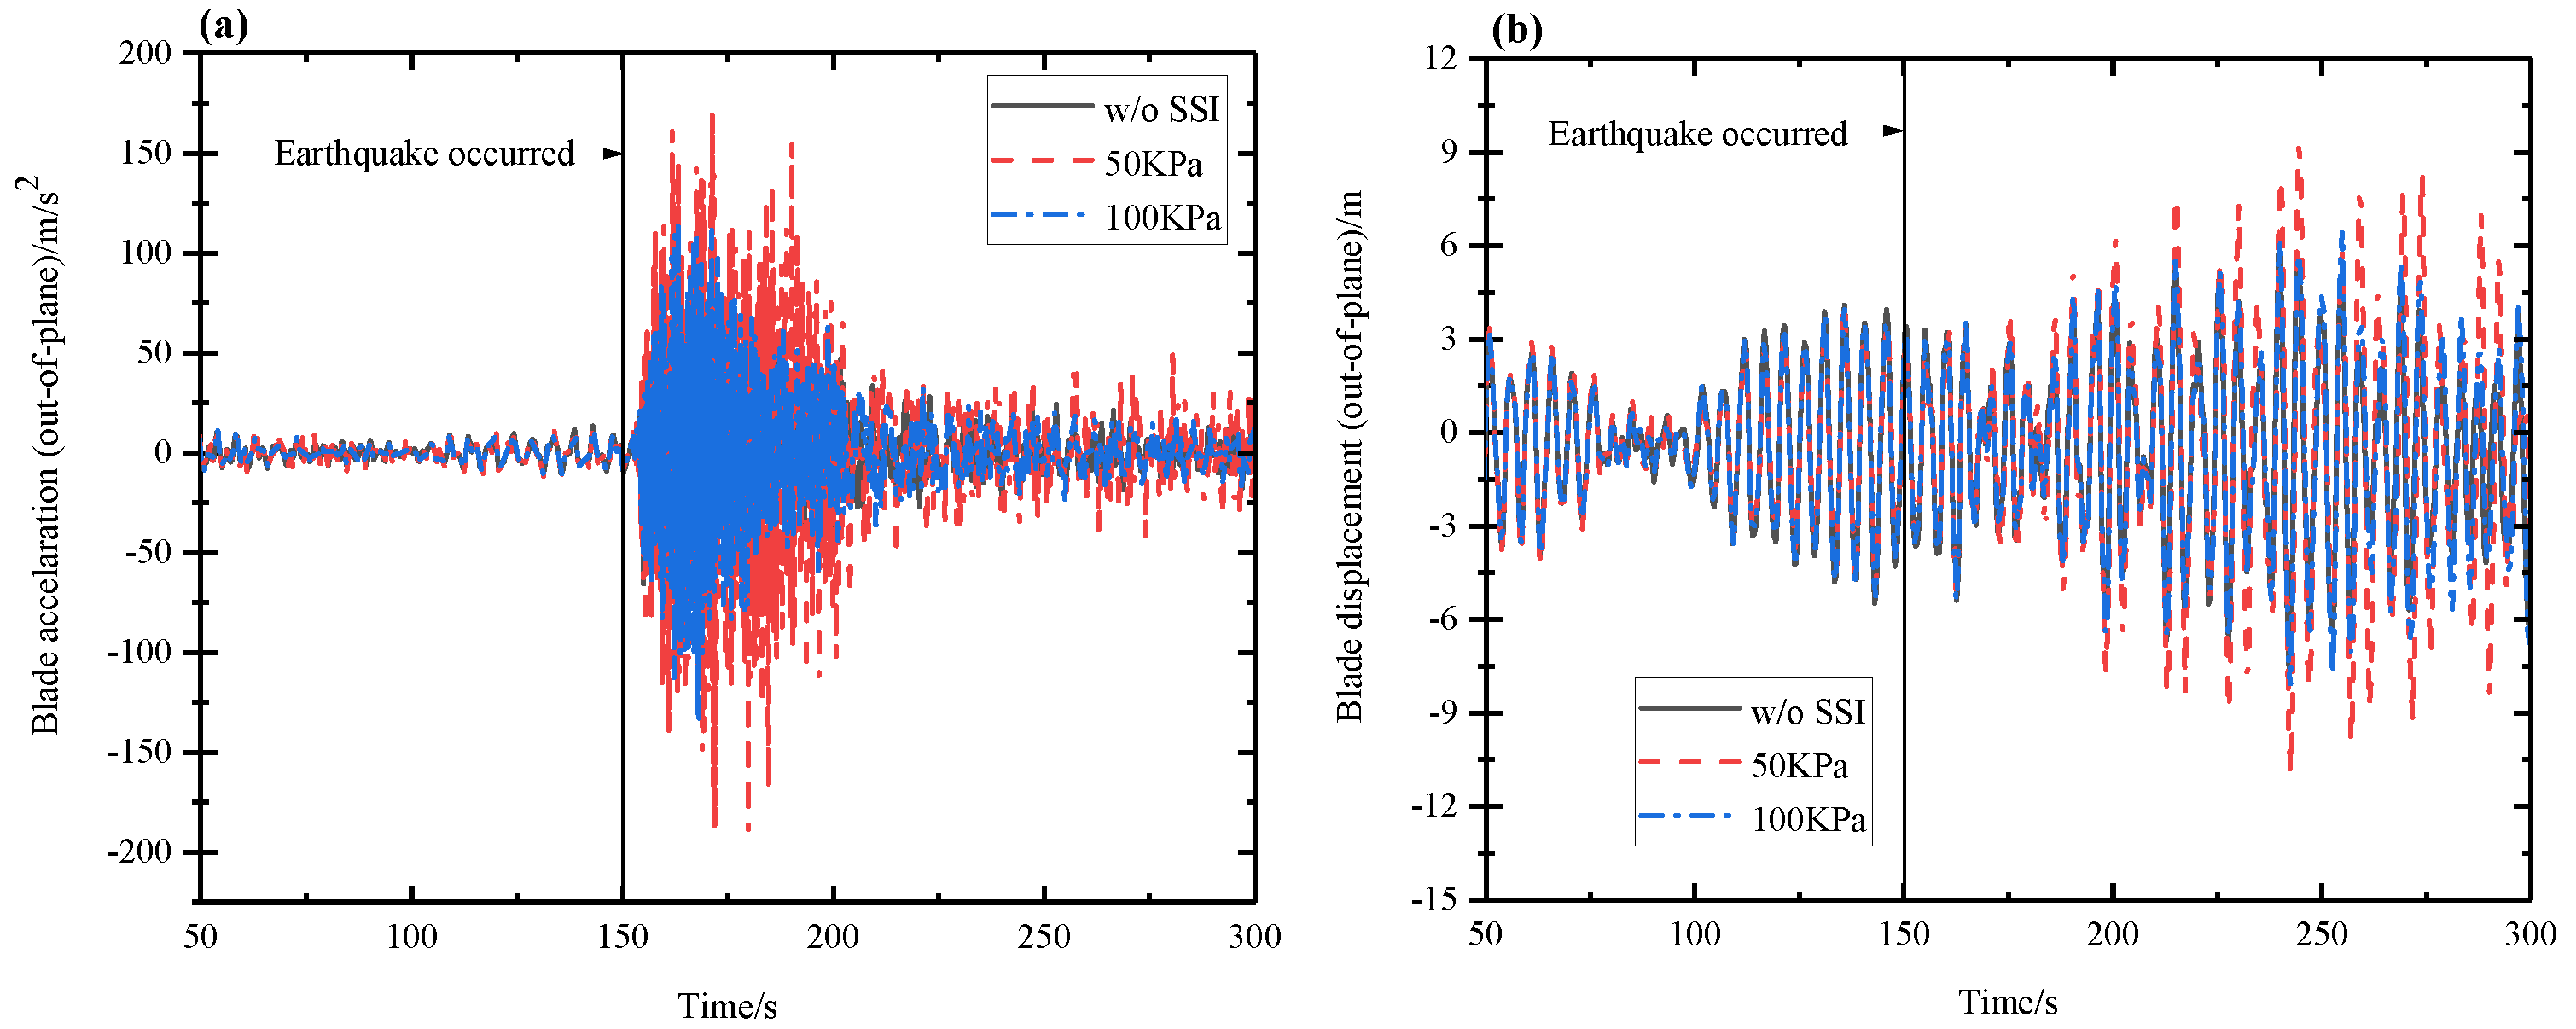
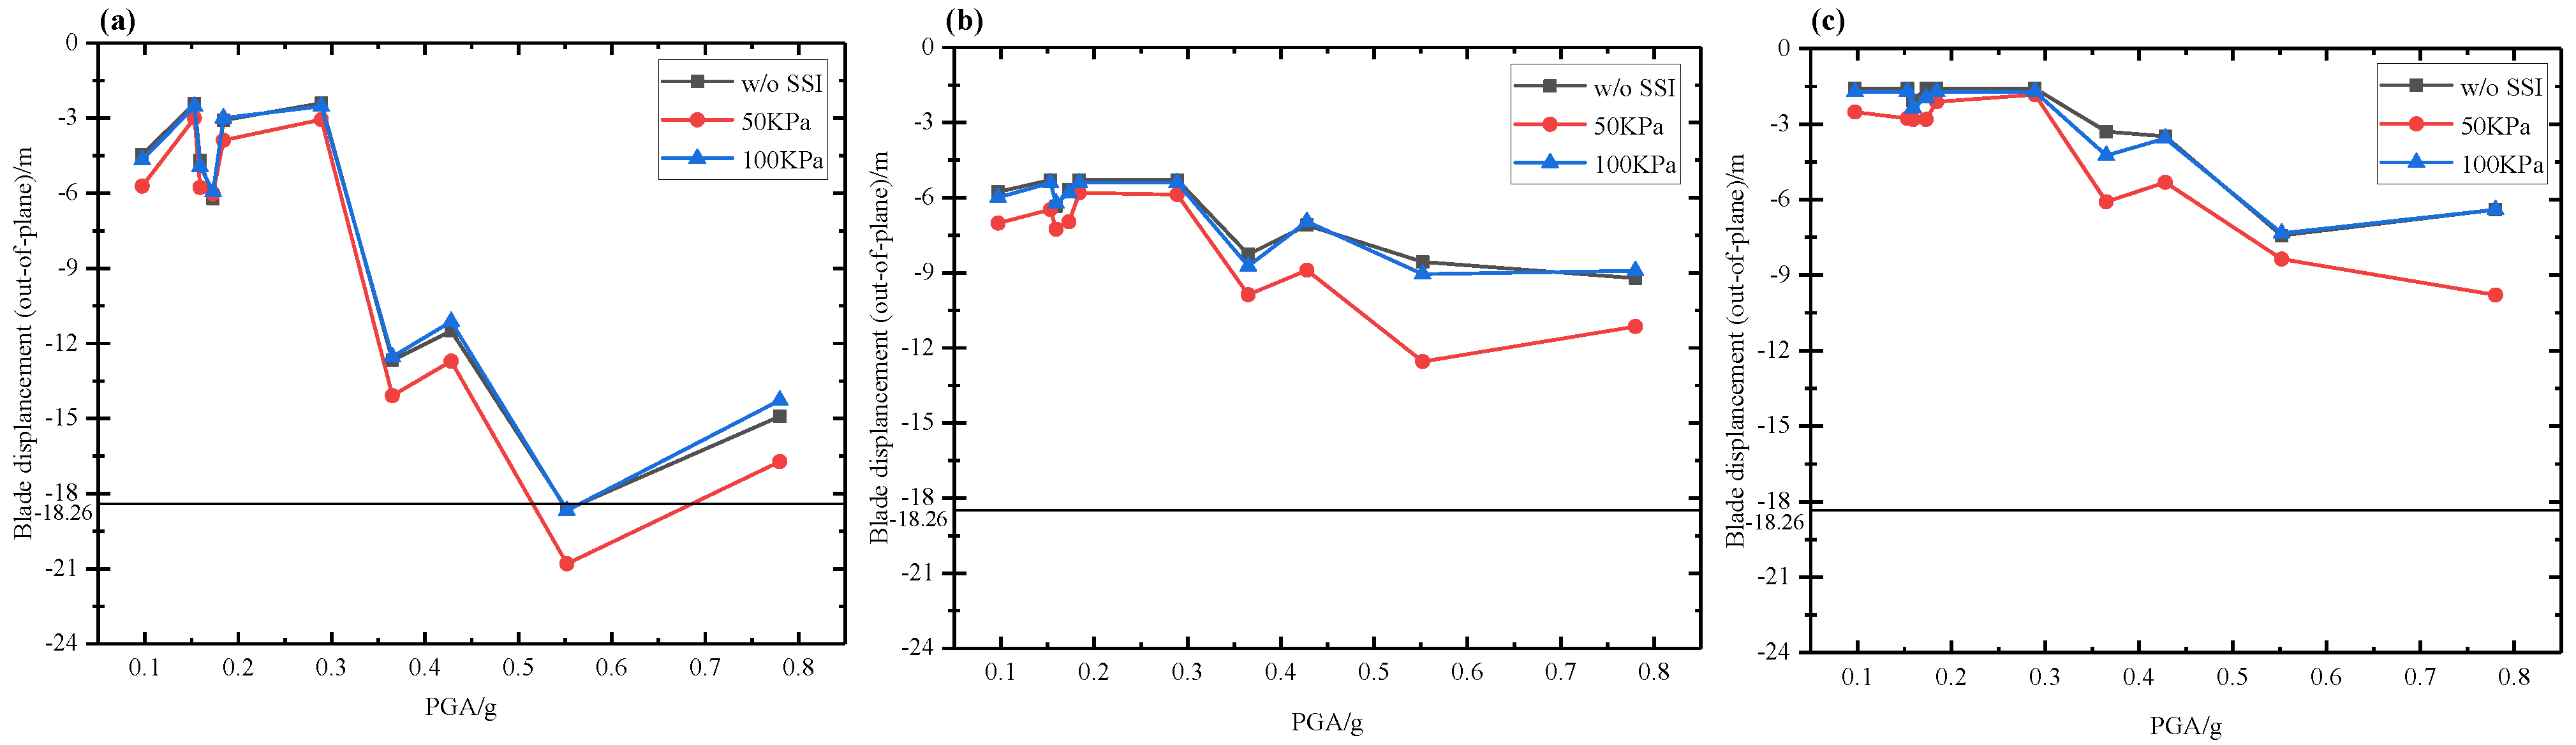
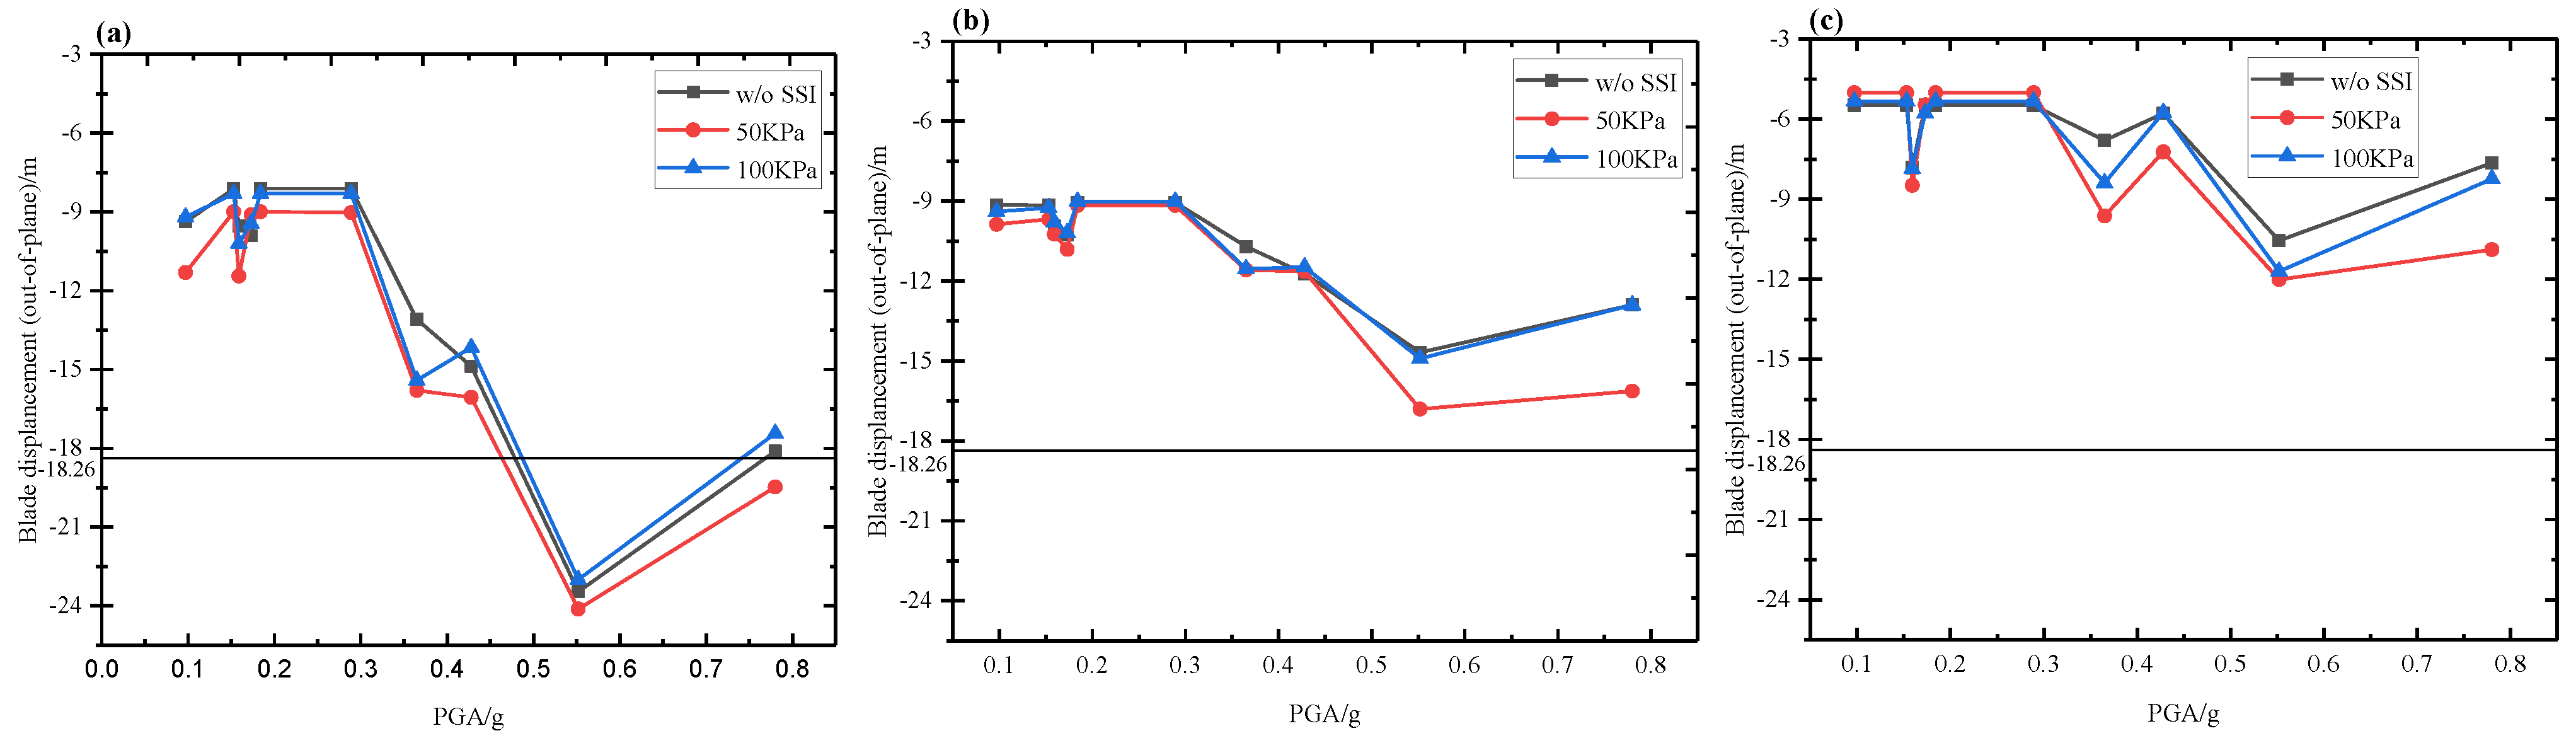
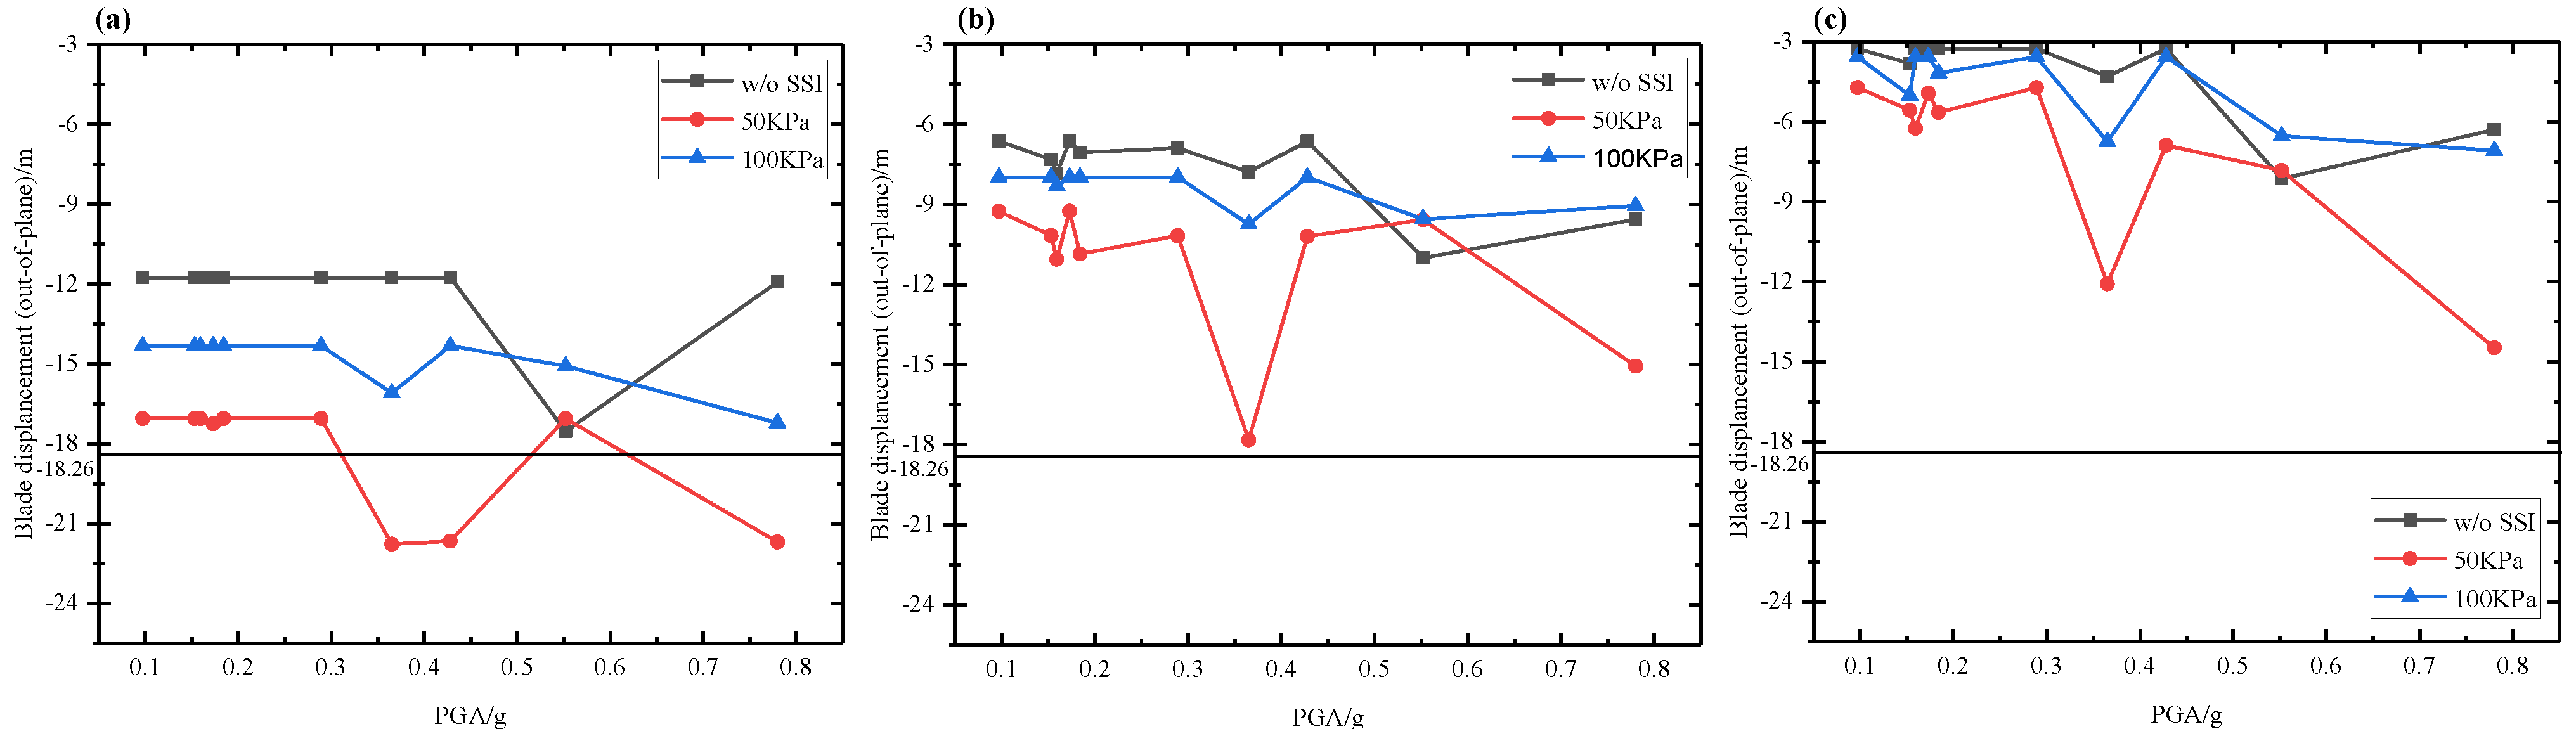
5.2. Wind–Seismic Coupled Blade Vibration Behavior

Figure 19 depicts the acceleration time curve of the blade without SSI. The dynamic response of the blade varies during wind and seismic loading due to the different initial positions of the turbine blades. Specifically, before the seismic load, blade 1 exhibits the largest acceleration response, while blade 0 shows the smallest response when the wind speed is 4 m/s and 11.4 m/s. At a wind speed of 25 m/s, blade pitch occurs just after the wind turbine starts, leading to blade load changes that cause a certain difference in the structure’s response. During the 50–100 s, the curve of maximum response of the structure occurs at blade 0. Between 100–150 s, the maximum curve of acceleration response varies at blade 1, while the maximum acceleration response occurs at blade 0 after the seismic load is applied at 150 s. Furthermore, the blade response significantly increases after the ground motion is applied, with the blade’s maximum response occurring in the blade 0 position under all three different wind conditions. The smallest response occurs in blade 1, which is a considerable difference before the seismic load’s application. This phenomenon is because blade 0 is aligned with the tower structure, resulting in a stable coupling between the blade and the tower. However, when blade 0 is combined with the tower, it forms a more elongated structure that is less rigid and more flexible, leading to a more sensitive response to ground motion at the blade 0 position. Although the wind load is greater than 4 m/s at a wind speed of 11.4 m/s in the loading calculations, the amplitude of blade acceleration at 11.4 m/s is found to be less than that at 4 m/s during wind–seismic coupling by comparing the time course curves of the blade at 4 m/s and 11.4 m/s. This indicates that the wind load can reduce the impact of ground motion on the blade.
To investigate the interaction of the wind turbine under wind–seismic coupling when the blade is coupled to the tower, a Welch spectrum curve is obtained from the blade displacement time curve, as shown in Figure 20. The Figure shows that the blade is influenced by the first-order model of the tower structure, with the lateral first-order model (0.22 Hz) having a greater effect on blade 1 and blade 2, while the maximum influence of the first-order mode in the front and rear direction of the tower (0.29 Hz) occurs at blade 0. Despite being in symmetrical positions, blades 1 and 2 exhibit certain differences in their vibration characteristics under seismic action. Additionally, in the first-order blade mode (0.47 Hz) at different wind speeds, blade 0 hardly shows a peak, indicating large differences in the wind–seismic coupling effect, where ground motion affects the position of the blades in the wind turbine.
To investigate the effect of SSI on the blades of a 10 MW wind turbine during wind–seismic coupling, this paper studied the vibration characteristics of the blades under different SSIs. The time course curves of the blade under different SSI effects are shown in Figure 21, Figure 22 and Figure 23. One may observe that there is a significant increase in blade acceleration during seismic action. The acceleration amplitude is largest in the soft soil foundation (50 KPa), followed by the hard soil foundation (100 KPa), which indicates that the SSI effect on the blade out-of-plane vibration is greater. By comparing the displacement-time curves of the blades at different positions, it is evident that blade 0 experiences the highest overall displacement amplitude during an earthquake, while the amplitudes of blades 1 and 2 are relatively small. This indicates that seismic loads have varying effects on blades positioned differently, with blade position 0 likely to be more susceptible to seismic loads. Additionally, Figure 21b, Figure 22b and Figure 23b demonstrate the blade displacement changes only at the end of the seismic loading action due to the large flexibility of the wind turbine system, and there is a certain lag effect of seismic waves on the top of the tower cylinder and the blade.
In this paper, blade safety failure is considered a material yield failure and blade operating safety distance failure to ensure safe blade operation. The results indicate that the blade does not experience material yield failure under wind–seismic coupling, thus satisfying the operating conditions. However, using the blade’s safety distances to determine failure revealed that a failure could occur during partial wind–seismic coupling. Figure 24, Figure 25 and Figure 26 illustrate the blade’s maximum displacement in the X-negative direction under wind–seismic coupling, showing that at a wind speed of 4 m/s coupled with BM ground motion (PGA = 0.55 g), the blade displacement exceeds the safe distance (18.26 m) for different soil foundations.
Under BM seismic action, at a wind speed of 11.4 m/s, blade displacements in different soil bases exceed the safe distance. Meanwhile, under KC ground motion, only soft soil bases experience blade displacements greater than the safe distance. At a wind speed of 25 m/s, the blade displacements exceed the safe distance for KC, TI, and IV ground movements, but failure only occurs in soft soil foundations. These findings demonstrate that wind turbine failure damage is more likely to occur in soft soil foundations under the action of ground motions, highlighting the importance of considering the effects of SSI on wind turbines in seismically active zones. Moreover, due to the small wind load at low wind speeds, seismic loads significantly influence wind turbines and blades, making failure likely under strong earthquakes. Additionally, when the rated wind speed is exceeded, soft soil bases have a more pronounced impact on blades due to the pitch-induced change in blade load. Analysis results suggest that the blade is more vulnerable to seismic loads in the 0 position. This susceptibility stems from the blade and tower barrel being part of a slender structure, leading to coupling and increased impact from earthquakes on blade 0.

6. Conclusions

This study aims to examine the dynamic response of the DTU 10 MW wind turbine under wind and wind–seismic coupling. To fully consider the effects of seismic waves and turbulent wind on the wind turbine, we analyze the vibration characteristics of 10 sets of seismic waves with different pulse periods and three sets of typical wind speeds. At the same time, we analyze the effect of soil–structure coupling on the wind turbine structure by establishing a multi-pile foundation model. Finally, the study systematically investigates the impact of the turbulent wind field, soil–pile interaction, and blade–tower coupling characteristics on the wind turbine structure. The numerical results show that the soil–structure interaction has little influence on the vibration characteristics of wind turbines in multi-pile foundations. The rated wind speed must not be exceeded as it results in significant differences in the wind turbine tower and the blade’s out-of-plane vibration characteristics due to changes in blade pitch and load. Moreover, variable blade loads increase the risk of wind turbine failure after seismic action. Therefore, during the design and manufacture of wind turbines, the effects of pitch change on the structure must be considered. The material yield strength is typically the criterion in wind turbine failure studies. However, this paper suggests that the blade tip’s out-of-plane displacement may still exceed the safety distance even when the structure meets the material strength criteria. This discrepancy can result in a collision between the blade and the tower, potentially causing wind turbine failure. Hence, it is necessary to consider the safety distance between the blade and the tower during wind turbine safety verification. The wind turbine blades’ different rotational positions under wind alone and wind–seismic coupling led to distinct vibration characteristics under external vibration sources. Blade position 0 displays greater sensitivity to seismic activity. Additionally, due to the large flexibility of the wind turbine system, blade displacement changes only at the end of the seismic loading action, demonstrating a delayed effect of ground motion on wind turbine blades.
The results of this study can provide a reference for the design and site selection of wind turbines in seismic-prone areas. According to different wind speeds and seismic risks, reasonable maintenance plans can be arranged to ensure the safe and stable operation of wind turbines. This study is mainly based on numerical simulations. Although a relatively refined model was established, there is a lack of sufficient field-measured data for verification, and the reliability of the model’s accuracy in the actual complex environment remains to be further improved. Future research can carry out more field monitoring and experimental studies to obtain data of actual operating wind turbines under wind–seismic coupling for verifying and improving numerical models.

Author Contributions

C.Z.: Conceptualization, methodology, software; Y.W.: Data curation, writing—Original draft preparation; J.W.: Writing—reviewing and editing; B.D.: Editing, Supervision, J.Z.: Editing, methodology. All authors have read and agreed to the published version of the manuscript.

Funding

This research was funded by Fujian Provincial Science and Technology Project (2023J01387).

Data Availability Statement

The original contributions presented in this study are included in the article. Further inquiries can be directed to the corresponding authors.

Conflicts of Interest

The authors declare no conflict of interest.

References

  1. Meng, D.; Yang, S.; de Jesus, A.M.; Zhu, S.-P. A novel Kriging-model-assisted reliability-based multidisciplinary design optimization strategy and its application in the offshore wind turbine tower. Renew. Energy 2022, 203, 407–420. [Google Scholar] [CrossRef]
  2. Li, H.; Diaz, H.; Guedes Soares, C. A developed failure mode and effect analysis for floating offshore wind turbine support structures. Renew. Energy 2021, 164, 133–145. [Google Scholar] [CrossRef]
  3. Nuta, E.; Christopoulos, C.; Packer, J.A. Methodology for seismic risk assessment for tubular steel wind turbine towers: Application to Canadian seismic environment. Can. J. Civ. Eng. 2011, 38, 293–304. [Google Scholar] [CrossRef]
  4. Sadowski, A.J. On the advantages of hybrid beam-shell structural finite element models for the efficient analysis of metal wind turbine support towers. Finite Elem. Anal. Des. 2019, 162, 19–33. [Google Scholar] [CrossRef]
  5. Sadowski, A.J.; Camara, A.; Málaga-Chuquitaype, C.; Dai, K. Seismic analysis of a tall metal wind turbine support tower with realistic geometric imperfections. Earthq. Eng. Struct. Dyn. 2017, 46, 201–219. [Google Scholar] [CrossRef]
  6. Witcher, D. Seismic analysis of wind turbines in the time domain. Wind Energy 2005, 8, 81–91. [Google Scholar] [CrossRef]
  7. Bossanyi, E.A. Bladed for Windows User Manual; Garrad Hassan and Partners: Bristol, UK, 2000. [Google Scholar]
  8. Prowell, I.; Elgamal, A.; Uang, C.-M.; Luco, J.E.; Romanowitz, H.; Duggan, E. Shake table testing and numerical simulation of a utility-scale wind turbine including operational effects. Wind Energy 2014, 17, 997–1016. [Google Scholar] [CrossRef]
  9. Prowell, I.; Uang, C.-M.; Elgamal, A.; Luco, J.E.; Guo, L. Shake Table Testing of a Utility-Scale Wind Turbine. J. Eng. Mech. 2012, 138, 900–909. [Google Scholar] [CrossRef]
  10. Jonkman, J.M.; Buhl, M.L., Jr. FAST User’s Guide; National renewable energy Laboratory: Golden, CO, USA, 2005; EL500-38230. [Google Scholar]
  11. Zhu, J.; Zhou, Z.; Cai, X. Multi-objective aerodynamic and structural integrated optimization design of wind turbines at the system level through a coupled blade-tower model. Renew. Energy 2020, 150, 523–537. [Google Scholar] [CrossRef]
  12. Asareh, M.-A.; Schonberg, W.; Volz, J. Fragility analysis of a 5-MW NREL wind turbine considering aero-elastic and seismic interaction using finite element method. Finite Elem. Anal. Des. 2016, 120, 57–67. [Google Scholar] [CrossRef]
  13. Asareh, M.-A.; Schonberg, W.; Volz, J. Effects of seismic and aerodynamic load interaction on structural dynamic response of multi-megawatt utility scale horizontal axis wind turbines. Renew. Energy 2016, 86, 49–58. [Google Scholar] [CrossRef]
  14. Prowell, I.; Veletzos, M.; Elgamal, A.; Restrepo, J. Experimental and Numerical Seismic Response of a 65 kW Wind Turbine. J. Earthq. Eng. 2009, 13, 1172–1190. [Google Scholar] [CrossRef]
  15. Meng, D.B.; Yang, H.F.; Yang, S.Y.; de Jesus, A.M.P.; Zhu, S.P. Kriging-assisted hybrid reliability design and optimization of offshore wind turbine support structure based on a portfolio allocation strategy. Ocean Eng. 2023, 203, 407–420. [Google Scholar] [CrossRef]
  16. Meng, D.B.; Yang, H.F.; Yang, S.Y.; de Jesus, A.M.P.; Correia, J.; Zhu, S.P. Intelligent-inspired framework for fatigue reliability evaluation of offshore wind turbine support structures under hybrid uncertainty. Ocean Eng. 2024, 307, 118213. [Google Scholar] [CrossRef]
  17. Guo, S.X.; Li, Y.L.; Chen, W.M. Analysis on dynamic interaction between flexible bodies of large-sized wind turbine and its response to random wind loads. Renew. Energy 2021, 163, 123–137. [Google Scholar] [CrossRef]
  18. Andersen, L.V.; Vahdatirad, M.J.; Sichani, M.T.; Sorensen, J.D. Natural frequencies of wind turbines on monopile foundations in clayey soils-A probabilistic approach. Comput. Geotech. 2012, 43, 1–11. [Google Scholar] [CrossRef]
  19. Arany, L.; Bhattacharya, S.; Macdonald, J.H.G.; Hogan, S.J. Closed form solution of Eigen frequency of monopile supported offshore wind turbines in deeper waters incorporating stiffness of substructure and SSI. Soil Dyn. Earthq. Eng. 2016, 83, 18–32. [Google Scholar] [CrossRef]
  20. Bhattacharya, S.; Adhikari, S. Experimental validation of soil-structure interaction of offshore wind turbines. Soil Dyn. Earthq. Eng. 2011, 31, 805–816. [Google Scholar] [CrossRef]
  21. Lombardi, D.; Bhattacharya, S.; Wood, D.M. Dynamic soil-structure interaction of monopile supported wind turbines in cohesive soil. Soil Dyn. Earthq. Eng. 2013, 49, 165–180. [Google Scholar] [CrossRef]
  22. Zuo, H.; Bi, K.; Hao, H. Dynamic analyses of operating offshore wind turbines including soil-structure interaction. Eng. Struct. 2018, 157, 42–62. [Google Scholar] [CrossRef]
  23. Zuo, H.; Bi, K.; Hao, H.; Li, C. Influence of earthquake ground motion modelling on the dynamic responses of offshore wind turbines. Soil Dyn. Earthq. Eng. 2019, 121, 151–167. [Google Scholar] [CrossRef]
  24. Amani, S.; Prabhakaran, A.; Bhattacharya, S. Design of monopiles for offshore and nearshore wind turbines in seismically liquefiable soils: Methodology and validation. Soil Dyn. Earthq. Eng. 2022, 157, 107252. [Google Scholar] [CrossRef]
  25. Bisoi, S.; Haldar, S. Dynamic analysis of offshore wind turbine in clay considering soil–monopile–tower interaction. Soil Dyn. Earthq. Eng. 2014, 63, 19–35. [Google Scholar] [CrossRef]
  26. Filho, H.A.N.C.; Avila, S.M.; de Brito, J.L.V. Dynamic analysis of onshore wind turbines including soil–structure interaction. J. Braz. Soc. Mech. Sci. Eng. 2021, 43, 143. [Google Scholar] [CrossRef]
  27. Bak, C.; Bitsche, R.; Kim, T.; Hansen, M.H.; Zahle, F. Light Rotor: The 10-MW reference wind turbine. In Proceedings of the European Wind Energy Association (EWEA) Annual Event, Copenhagen, Denmark, 16–19 April 2012. [Google Scholar]
  28. Hong, Y.; He, B.; Wang, L.Z.; Wang, Z.; Ng, C.W.W.; Mašín, D. Cyclic lateral response and failure mechanisms of semi-rigid pile in soft clay: Centrifuge tests and numerical modelling. Can. Geotech. J. 2017, 54, 806–824. [Google Scholar] [CrossRef]
  29. Wang, L.; Lai, Y.; Hong, Y.; Mašín, D. A unified lateral soil reaction model for monopiles in soft clay considering various length-to-diameter (L/D) ratios. Ocean. Eng. 2020, 212, 107492. [Google Scholar] [CrossRef]
  30. ISO 19901-10:2021; Petroleum and Natural Gas Industries-Specific Requirements for Offshore Structures. ISO: Geneva, Switzerland, 2021.
  31. DNV-OS-J101; Design of Offshore Wind Turbine Structures. DNV: Copenhagen, Denmark, 2014.
  32. Meng, J.; Dai, K.; Zhao, Z.; Mao, Z.; Camara, A.; Zhang, S.; Mei, Z. Study on the aerodynamic damping for the seismic analysis of wind turbines in operation. Renew. Energy 2020, 159, 1224–1242. [Google Scholar] [CrossRef]
  33. Bajrić, A.; Høgsberg, J.; Rüdinger, F. Evaluation of damping estimates by automated Operational Modal Analysis for offshore wind turbine tower vibrations. Renew. Energy 2018, 116, 153–163. [Google Scholar] [CrossRef]
  34. Hu, W.-H.; Thöns, S.; Rohrmann, R.G.; Said, S.; Rücker, W. Vibration-based structural health monitoring of a wind turbine system. Part I: Resonance phenomenon. Eng. Struct. 2015, 89, 260–272. [Google Scholar] [CrossRef]
  35. Valamanesh, V.; Myers, A.T. Aerodynamic Damping and Seismic Response of Horizontal Axis Wind Turbine Towers. J. Struct. Eng. 2014, 140, 04014090. [Google Scholar] [CrossRef]
  36. Dai, J.C.; Liu, Z.Q.; Liu, X.; Yang, S.Y.; Shen, X.B. Structural parameters multi-objective optimisation and dynamic characteristics analysis of large-scale wind turbine towers. Aust. J. Mech. Eng. 2017, 16, 43–49. [Google Scholar] [CrossRef]
  37. International Electrotechnical Commission. Wind Turbines-Part 1: Design Requirements, 3rd ed.; International Electrotechnical Commission: Geneva, Switzerland, 2005. [Google Scholar]
  38. Yang, Y.; Ye, K.; Li, C.; Michailides, C.; Zhang, W. Dynamic behavior of wind turbines influenced by aerodynamic damping and earthquake intensity. Wind Energy 2018, 21, 303–319. [Google Scholar] [CrossRef]
  39. Yang, Y.; Bashir, M.; Li, C.; Michailides, C.; Wang, J. Mitigation of coupled wind-wave-earthquake responses of a 10 MW fixed-bottom offshore wind turbine. Renew. Energy 2020, 157, 1171–1184. [Google Scholar] [CrossRef]
  40. Yang, Y.; Li, C.; Bashir, M.; Wang, J.; Yang, C. Investigation on the sensitivity of flexible foundation models of an offshore wind turbine under earthquake loadings. Eng. Struct. 2019, 183, 756–769. [Google Scholar] [CrossRef]
  41. Ancheta, T.D.; Darragh, R.B.; Stewart, J.P. PEER NGA-West2 Database, PEER Report 2013/03; Pacific Earthquake Engineering Research Center: Berkeley, CA, USA, 2013. [Google Scholar]
Figure 1. Simplified geometric model of the DTU 10 MW wind turbine (Unit: m).
Energies 18 02833 g001
Figure 2. Detail of DTU 10 MW wind finite element model.
Energies 18 02833 g002
Figure 3. Soil base cyclic loading: (a) p-y; (b) t-z; (c) q-z curves.
Energies 18 02833 g003
Figure 4. Wind turbine space wind speed field: (a) wind speed time series at hub height; (b) wind field distribution of wind speed.
Energies 18 02833 g004
Figure 5. Ground motion response spectrum acceleration: (a) X-direction; (b) Y-direction.
Energies 18 02833 g005
Figure 6. Wind turbine modal vibration patterns when SSI is not included.
Energies 18 02833 g006
Figure 7. Structural response of the top of the tower at a wind speed of 11.4 m/s: (a) acceleration time-domain curve; (b) displacement trajectory curve.
Energies 18 02833 g007
Figure 8. Maximum displacement of the tower top under different conditions: (a) fore–aft; (b) side–side.
Energies 18 02833 g008
Figure 9. Welch spectra of the 11.4 m/s tower top acceleration; (a) fore-and-aft direction, (b) side-to-side direction.
Energies 18 02833 g009
Figure 10. Blade tip displacement under different tower foundation conditions: (a) blade 0; (b) blade 1; (c) blade 2.
Energies 18 02833 g010
Figure 11. PSD of blade acceleration at 4 m/s in different soil foundations: (a) blade 0; (b) blade 1; (c) blade 2.
Energies 18 02833 g011
Figure 12. PSD of blade acceleration at 11.4 m/s in different soil foundations: (a) blade 0; (b) blade 1; (c) blade 2.
Energies 18 02833 g012
Figure 13. PSD of blade acceleration at 25 m/s in different soil foundations: (a) blade 0; (b) blade 1; (c) blade 2.
Energies 18 02833 g013
Figure 14. Time-domain curve of the top of the tower for different wind speeds and seismic coupling without SSI: (a) acceleration; (b) displacement.
Energies 18 02833 g014
Figure 15. Welch spectrum curves for 10 MW wind turbine tower top acceleration in (a) fore-and-aft direction and (b) side-to-side direction.
Energies 18 02833 g015
Figure 16. Time-domain curve of the top of the tower at 11.4 m/s coupled with KC ground motion: (a) acceleration; (b) displacement.
Energies 18 02833 g016
Figure 17. Maximum displacement of the top of the wind turbine tower during wind–seismic coupling: (a) fore–aft direction; (b) side–side direction.
Energies 18 02833 g017
Figure 18. Maximum bending moment at the base of the tower during wind–seismic coupling.
Energies 18 02833 g018
Figure 19. Blade acceleration time-domain curve without SSI: (a) 4 m/s-KC; (b) 11.4 m/s-KC; (c) 25 m/s-KC.
Energies 18 02833 g019
Figure 20. Welch spectrum curves for blade displacement of 10 MW wind turbine for: (a) 4 m/s-KC; (b) 11.4 m/s-KC; (c) 25 m/s-KC.
Energies 18 02833 g020
Figure 21. Blade 0 time-domain curves for different soil foundation conditions (11.4 m/s-KC): (a) acceleration; (b) displacement.
Energies 18 02833 g021
Figure 22. Blade 1 time-domain curves for different soil foundation conditions (11.4 m/s-KC): (a) acceleration; (b) displacement.
Energies 18 02833 g022
Figure 23. Blade 2 time-domain curves for different soil foundation conditions (11.4 m/s-KC): (a) acceleration; (b) displacement.
Energies 18 02833 g023
Figure 24. Maximum negative displacement of blade 0 X-axis under 4 m/s wind vibration coupling: (a) blade 0; (b) blade 1; (c) blade 2.
Energies 18 02833 g024
Figure 25. Maximum negative displacement of blade 1 X-axis under 4 m/s wind vibration coupling: (a) blade 0; (b) blade 1; (c) blade 2.
Energies 18 02833 g025
Figure 26. Maximum negative displacement of blade 2 X-axis under 4 m/s wind vibration coupling: (a) blade 0; (b) blade 1; (c) blade 2.
Energies 18 02833 g026
Table 1. DTU 10 MW wind turbine primary dimensional data.
DTU 10 MW Baseline Wind Turbine Properties
Basic descriptionRated power10 MW
BladeNumber of blades3
Rotor Diameter178.3 m
Cut in wind speed4 m/s
Cut out wind speed25 m/s
Rated wind speed11.4 m/s
Rotor Mass227,962 kg
Structural damping ratio0.5%
Hub and NacelleHub Diameter5.6 m
Hub Height119.0 m
Nacelle Mass446,036 kg
TowerHeight115.663 m
Tower Mass628,442 kg
Structural damping ratio1%
Table 2. Wind turbine material properties.
ComponentMaterialDensity (kg/m3)Young’s Modulus (GPa)Poisson’s RatioYield Strength (MPa)
BladePolyester fiber1850380.3700
TowerSteel85002100.3355
Pile -2400310.3-
Table 3. Ground motion information.
No.Earthquake NamesYearScale FactorPGA(g)
1Kern County195250.78
2Borrego Mtn196840.55
3Tabas-Iran197840.43
4Imperial Valley-0619792.50.37
5Irpinia-Italy-01198010.01
6Corinth- Greece198110.29
7Superstition Hills-02198710.16
8Loma Prieta198910.17
9Cape Mendocino199210.15
10Landers199210.18
Table 4. Wind turbine natural frequencies without SSI.
ModalDescriptionLiterature [27] (Hz)In Paper (60 mm) (Hz)Difference (%)In Paper (34 mm) (Hz)Difference (%)
11st tower fore–aft mode0.250.2916.00.2812.0
21st tower side–side mode0.250.22−12.00.24−4.0
31st fix-free mode0.500.44−12.00.48−4.0
41st blade flap with yaw0.550.47−14.50.51−7.2
51st blade flap with tilt0.590.52−11.80.54−5.0
61st collective flap mode0.630.641.60.687.9
71st blade edge10.920.68−25.50.72−21.7
81st blade edge20.940.75−20.20.76−19.1
92nd blade flap with yaw1.381.412.21.455.0
102nd blade flap with tilt1.551.475.21.512.6
Table 5. Intrinsic frequencies of wind turbines in different soil conditions.
ModalDescriptionw/o SSI50 KPa100 KPa
Frequency (Hz)Frequency (Hz)Difference (%)Frequency (Hz)Difference (%)
11st tower fore–aft mode0.290.2900.290
21st tower side–side mode0.220.214.50.214.5
31st fix-free mode0.440.4400.440
41st blade flap with yaw0.470.4700.470
51st blade flap with tilt0.520.5200.520
61st collective flap mode0.640.6400.640
71st blade edge10.680.6800.680
81st blade edge20.750.7500.750
92nd blade flap with yaw1.411.4101.410
102nd blade flap with tilt1.471.47014.70
Table 6. Comparison of maximum bending moments at the base under the effect of wind.
Wind Speed (m/s)w/o SSI50 KPa100 KPa
Max Bending Moment (MN · m)Max Bending Moment (MN · m)Difference (%)Max Bending Moment (MN · m)Difference (%)
481.310427.9854.6
11.426530715.82670.8
2528233518.82882.1
Table 7. Maximum displacement of wind turbine blades under different soil foundations.
Wind Speed
(m/s)
Bladew/o SSI50 KPa100 KPa
Max Displacement
(m)
Max Displacement
(m)
Difference (%)Max Displacement (m)Difference (%)
402.4032.98924.382.5395.6
15.2925.7979.545.3841.74
21.5811.8416.381.6796.2
11.408.1169.05511.578.3052.28
19.0519.1481.079.048−0.03
25.4835.175−5.65.261−4.05
25011.75616.82443.1114.23721.1
17.01910.16444.818.08115.13
23.2644.69743.93.68913.02
Disclaimer/Publisher’s Note: The statements, opinions and data contained in all publications are solely those of the individual author(s) and contributor(s) and not of MDPI and/or the editor(s). MDPI and/or the editor(s) disclaim responsibility for any injury to people or property resulting from any ideas, methods, instructions or products referred to in the content.

