Article

Experimental Analysis on a Commercial Power Electronic Converter in Power-to-Hydrogen System Based on PEM Electrolysis and Metal Hydrides

by
Paolo Pilati
1,
Federico Ferrari
2,
Riccardo Alleori
3,
Francesco Falcetelli
2,
Maria Alessandra Ancona
2,
Francesco Melino
2,
Michele Bianchi
2 and
Mattia Ricco
1,*
1
Department of Electrical, Electronic and Information Engineering (DEI), Alma Mater Studiorum Università di Bologna, Viale del Risorgimento 2, 40136 Bologna, Italy
2
Department of Industrial Engineering (DIN), Alma Mater Studiorum Università di Bologna, Viale del Risorgimento 2, 40136 Bologna, Italy
3
Inter-Departmental Center for Industrial Research on Renewable Sources, Environment, Sea and Energy (CIRI–FRAME), Alma Mater Studiorum Università di Bologna, Via Zamboni 33, 40131 Bologna, Italy
*
Author to whom correspondence should be addressed.
Energies 2025, 18(11), 2831; https://doi.org/10.3390/en18112831
Submission received: 30 April 2025 / Revised: 22 May 2025 / Accepted: 27 May 2025 / Published: 29 May 2025
(This article belongs to the Section A5: Hydrogen Energy)

Abstract

:
As the presence of renewable energy production grows, so does the need to find alternative solutions for long–term energy storage. One solution may be hydrogen, and more generally, power-to-gas systems, which could allow energy storage for longer periods than batteries. However, the problem of hydrogen storage remains a limitation to the deployment of this technology. A possible solution for the hydrogen storage could be metal hydrides. In this work, a power-to-gas system based on a 2.5 kW commercial electrolyzer coupled to a pair of AB2-type metal hydride cylinders with a total volume of 4 L is studied. A special focus is placed on the electrolyzer power converter. In particular, the current ripple generated on the side connected to the stack and the efficiency of the converter are studied. A series of tests are carried out to verify the behavior of the system with varying types of thermal conditioning of the hydrides. The results show that the converter used is not optimized for the chosen application, and the thermal conditioning influences the hydrogen adsorption rate and thus the electrolyzer’s behavior. Finally, a technique to operate the system at maximum efficiency is proposed.

1. Introduction

Fossil fuels are currently the primary energy resource behind any human activity. However, their intensive use leads to various negative effects, including air pollution, stratospheric ozone depletion, and global warming, which leads to climate change [1]. In this context, hydrogen has attracted the attention of the scientific community, industry, and policy makers in recent years because it can be used both as an energy carrier to store renewable energy and as a fuel to decarbonize hard-to-abate industrial processes [2,3]. Nowadays, hydrogen is mainly produced starting from fossil fuels [4]. In these cases, the process leads to climate-changing emissions. The currently most widely used technique to produce hydrogen in a sustainable manner is renewable-electricity-powered electrolysis [5,6]. Electrolysis is a non-spontaneous chemical reaction that takes place thanks to the input of electrical energy; the conversion of electrical energy into chemical energy therefore takes place. It is used in many industries, from the production of aluminum [7] to the production of chlorine. In this study, the electrolysis reaction of water, the products of which are oxygen and hydrogen, is considered. Hydrogen production through water electrolysis is a well-established technology, with industrial-scale systems exceeding 100 MW installed as early as the first half of the twentieth century. As reported by the International Energy Agency (IEA), the global installed capacity for water electrolysis is expected to reach approximately 5 GW by 2024 [4]. According to IEA data, around 71% of the global operational capacity utilizes alkaline electrolysis, while 20% relies on proton exchange membrane (PEM) electrolysis. This is because alkaline technology is the more mature and economical option of the two [8]. The interest in the use of PEM-type electrolyzers can be attributed to their ability to respond more quickly to changes in load demand than alkalines [9,10]. This makes them more suitable for uses connected to renewable energy sources, where production can vary rapidly. However, both alkaline and PEM electrolysis are classified as mature technologies and have reached commercial operation in relevant environments in line with IEA standards [11]. Despite advancements in electrolysis technologies, a major barrier to the widespread adoption of hydrogen as an alternative fuel remains its storage. There are mainly three possibilities for storing hydrogen used or under study: in a compressed gaseous, liquid, and solid state within chemical compounds such as metal hydrides (MHs). Regarding compressed hydrogen, it is the most mature technology among those listed above. Currently, the most advanced technology available on the market employs cylinders able to allow pressures of up to 800 bar [12]. Such high pressures pose problems concerning safety and the risk of explosion. It is also possible to store hydrogen in a liquid state using cryogenic systems operating at temperatures below 253 ° C . In this way, even higher concentrations per unit volume can be achieved than with compressed hydrogen. However, boil-off phenomena associated with the evaporation of hydrogen from tanks must be carefully managed to prevent excessive pressure buildup. This could lead to unwanted hydrogen venting once the maximum tank pressure is reached [13,14]. The last type of storage technology mentioned concerns MHs. Compared to the other storage methods already discussed, they offer some important advantages in terms of safety and performance. These allow high volumetric energy densities, even higher than those of liquid hydrogen [15], while operating at relatively low pressures. Nevertheless, high operating temperatures are often required to achieve high energy release efficiency. This is a condition that can prove particularly energy intensive [16,17]. A further problematic aspect of this storage technology is its weight, as it is based on metal powders. This currently limits this technology for stationary use.
In practical operating conditions, hydrogen is generated and delivered to the storage system at flow rates that vary based on the available power and the electrolyzer’s control strategy. Currently, most applications are connected to the grid for hydrogen production as a raw material, and therefore the electrolyser is operated at a fixed set point. In the future, however, to also perform grid-balancing services, it could also be operated more intermittently [18]. Under these circumstances, analyzing the system’s dynamic response becomes essential for developing an effective optimization approach. Extensive research is being conducted on various key aspects of PEM electrolyzers’ operation. One of the most explored areas is the numerical modeling of the stack [19], the core component where water electrolysis occurs. Given that these electrolyzers are often designed to be integrated with renewable energy sources (RESs), several models have been developed to accurately simulate the stack’s dynamic behavior [20]. Given that the electrolyzer is designed to operate in conjunction with RESs, the integration of a power electronic converter is almost mandatory. A direct coupling of an RES to an electrolyzer, although cost-saving, can lead to both operating at a suboptimal point [21,22,23]. Power electronics, depending on the converter topologies and logics implemented, allow direct control over the system, optimizing production [24,25]. Consequently, this paper focuses on a specific issue associated with the use of power electronics to supply the stack: the current ripple. This phenomenon, inherently introduced by power electronic converters, manifests as fluctuations in voltage or current around their intended average value. The amplitude and frequency of these oscillations depend on the converter’s design parameters and the control strategies implemented. Typically, it is desirable to limit the ripple within a predefined threshold to ensure stable and efficient operation. The current ripple appears to have a degrading effect on the polymer membrane of PEM electrolyzers, and more generally on PEM cells [26,27,28,29]. This is because fluctuations in the current cause fluctuations in the flow rates of the reagents, which can lead to mechanical stress on the membrane. Some studies have already investigated the phenomenon in more detail. In [30], the ripple effects were analysed over a 100 Hz to 10 kHz frequency range. Experimental tests showed that ripple at low frequencies ( 100 Hz ) leads to premature cell aging compared to cases at higher frequencies. The authors in [31] conducted aging tests on PEM fuel cells with high ripple frequencies ( 20 kHz ) and concluded that these frequencies do not significantly impact cell aging. In [32], the impact of ripple was analyzed in terms of both membrane lifespan and efficiency. Tests conducted with low-frequency ripple (50–400 Hz) revealed a decline in both the membrane’s durability and its performance. In [33], the effects of current ripple on the efficiency of the electrolyzer were tested. A reduction in efficiency was found for ripple with a frequency in the order of a few hundred Hz , regardless of the ripple waveform. An increase in ripple amplitude, on the other hand, always leads to a deterioration in performance. In [34], the authors tested the ripple effects over a frequency range from 10 kHz to 50 kHz , with the ripple amplitude also being varied for each frequency. The tests carried out showed a deterioration in cell performance, with a reduction in output voltage, for all frequencies as the ripple amplitude increased. This phenomenon is most evident at the lowest of the frequencies considered ( 10 kHz ). Some studies have tried to model the mechanisms of ageing due to ripple [35], but the literature on the subject is currently focused solely on fuel cells. To summarize, a converter for a PEM electrolyzer in a stationary application must have high efficiency, be economical, have high reliability (in case of power switch failures), and have a low current ripple on the stack side to ensure a longer service lifetime, allowing a better cost payback [36].
Based on the above, this article’s objective is to study and characterize a power electronic converter used on a commercial PEM-type electrolyzer and to formulate a strategy to operate the system at maximum efficiency. In particular, the converter’s parameters of interest are the current ripple on the stack and its overall efficiency. In order to then evaluate the system’s behavior under real operating conditions, some tests are conducted by changing the system’s thermal conditioning.
The article is organized as follows: in Section 2, a generic system description is provided; in Section 3, the used methodology is defined; in Section 4, the experimental setup is described in more detail; and in Section 5, the experimental results are reported with commentary.

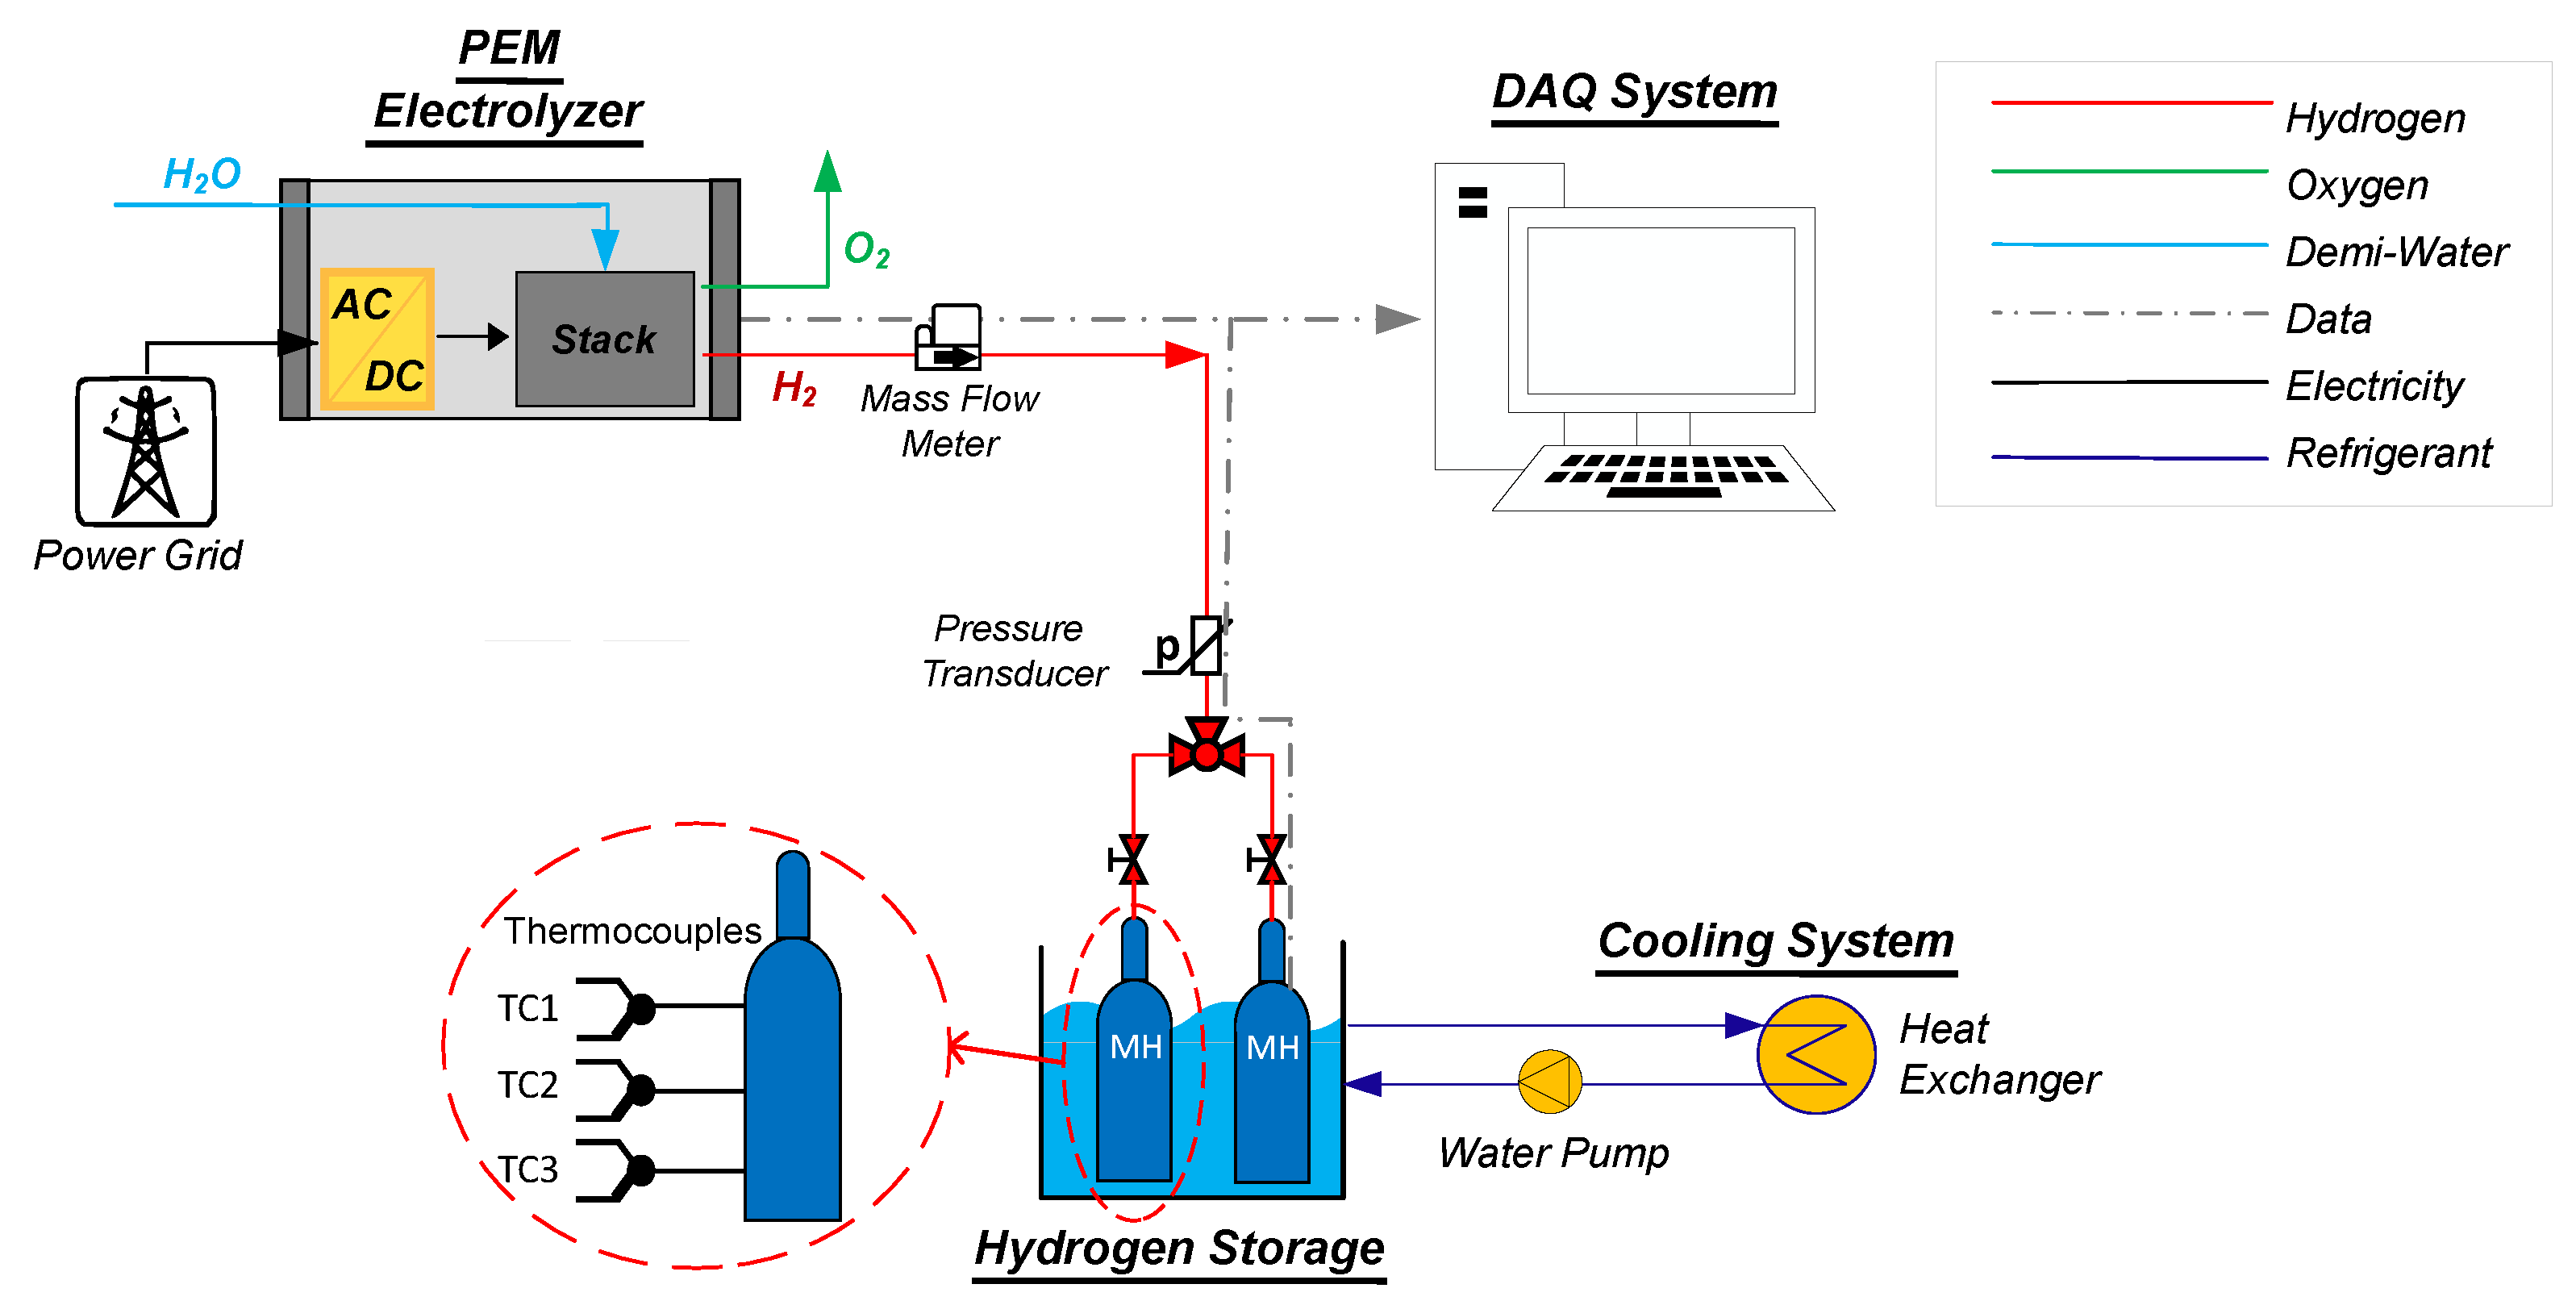
2. System Description

The considered power-to-gas (P2G) system is based on a PEM electrolyzer that produces and sends hydrogen to two MH canisters. A general scheme of the considered system is given in Figure 1. It can be divided into four main parts:
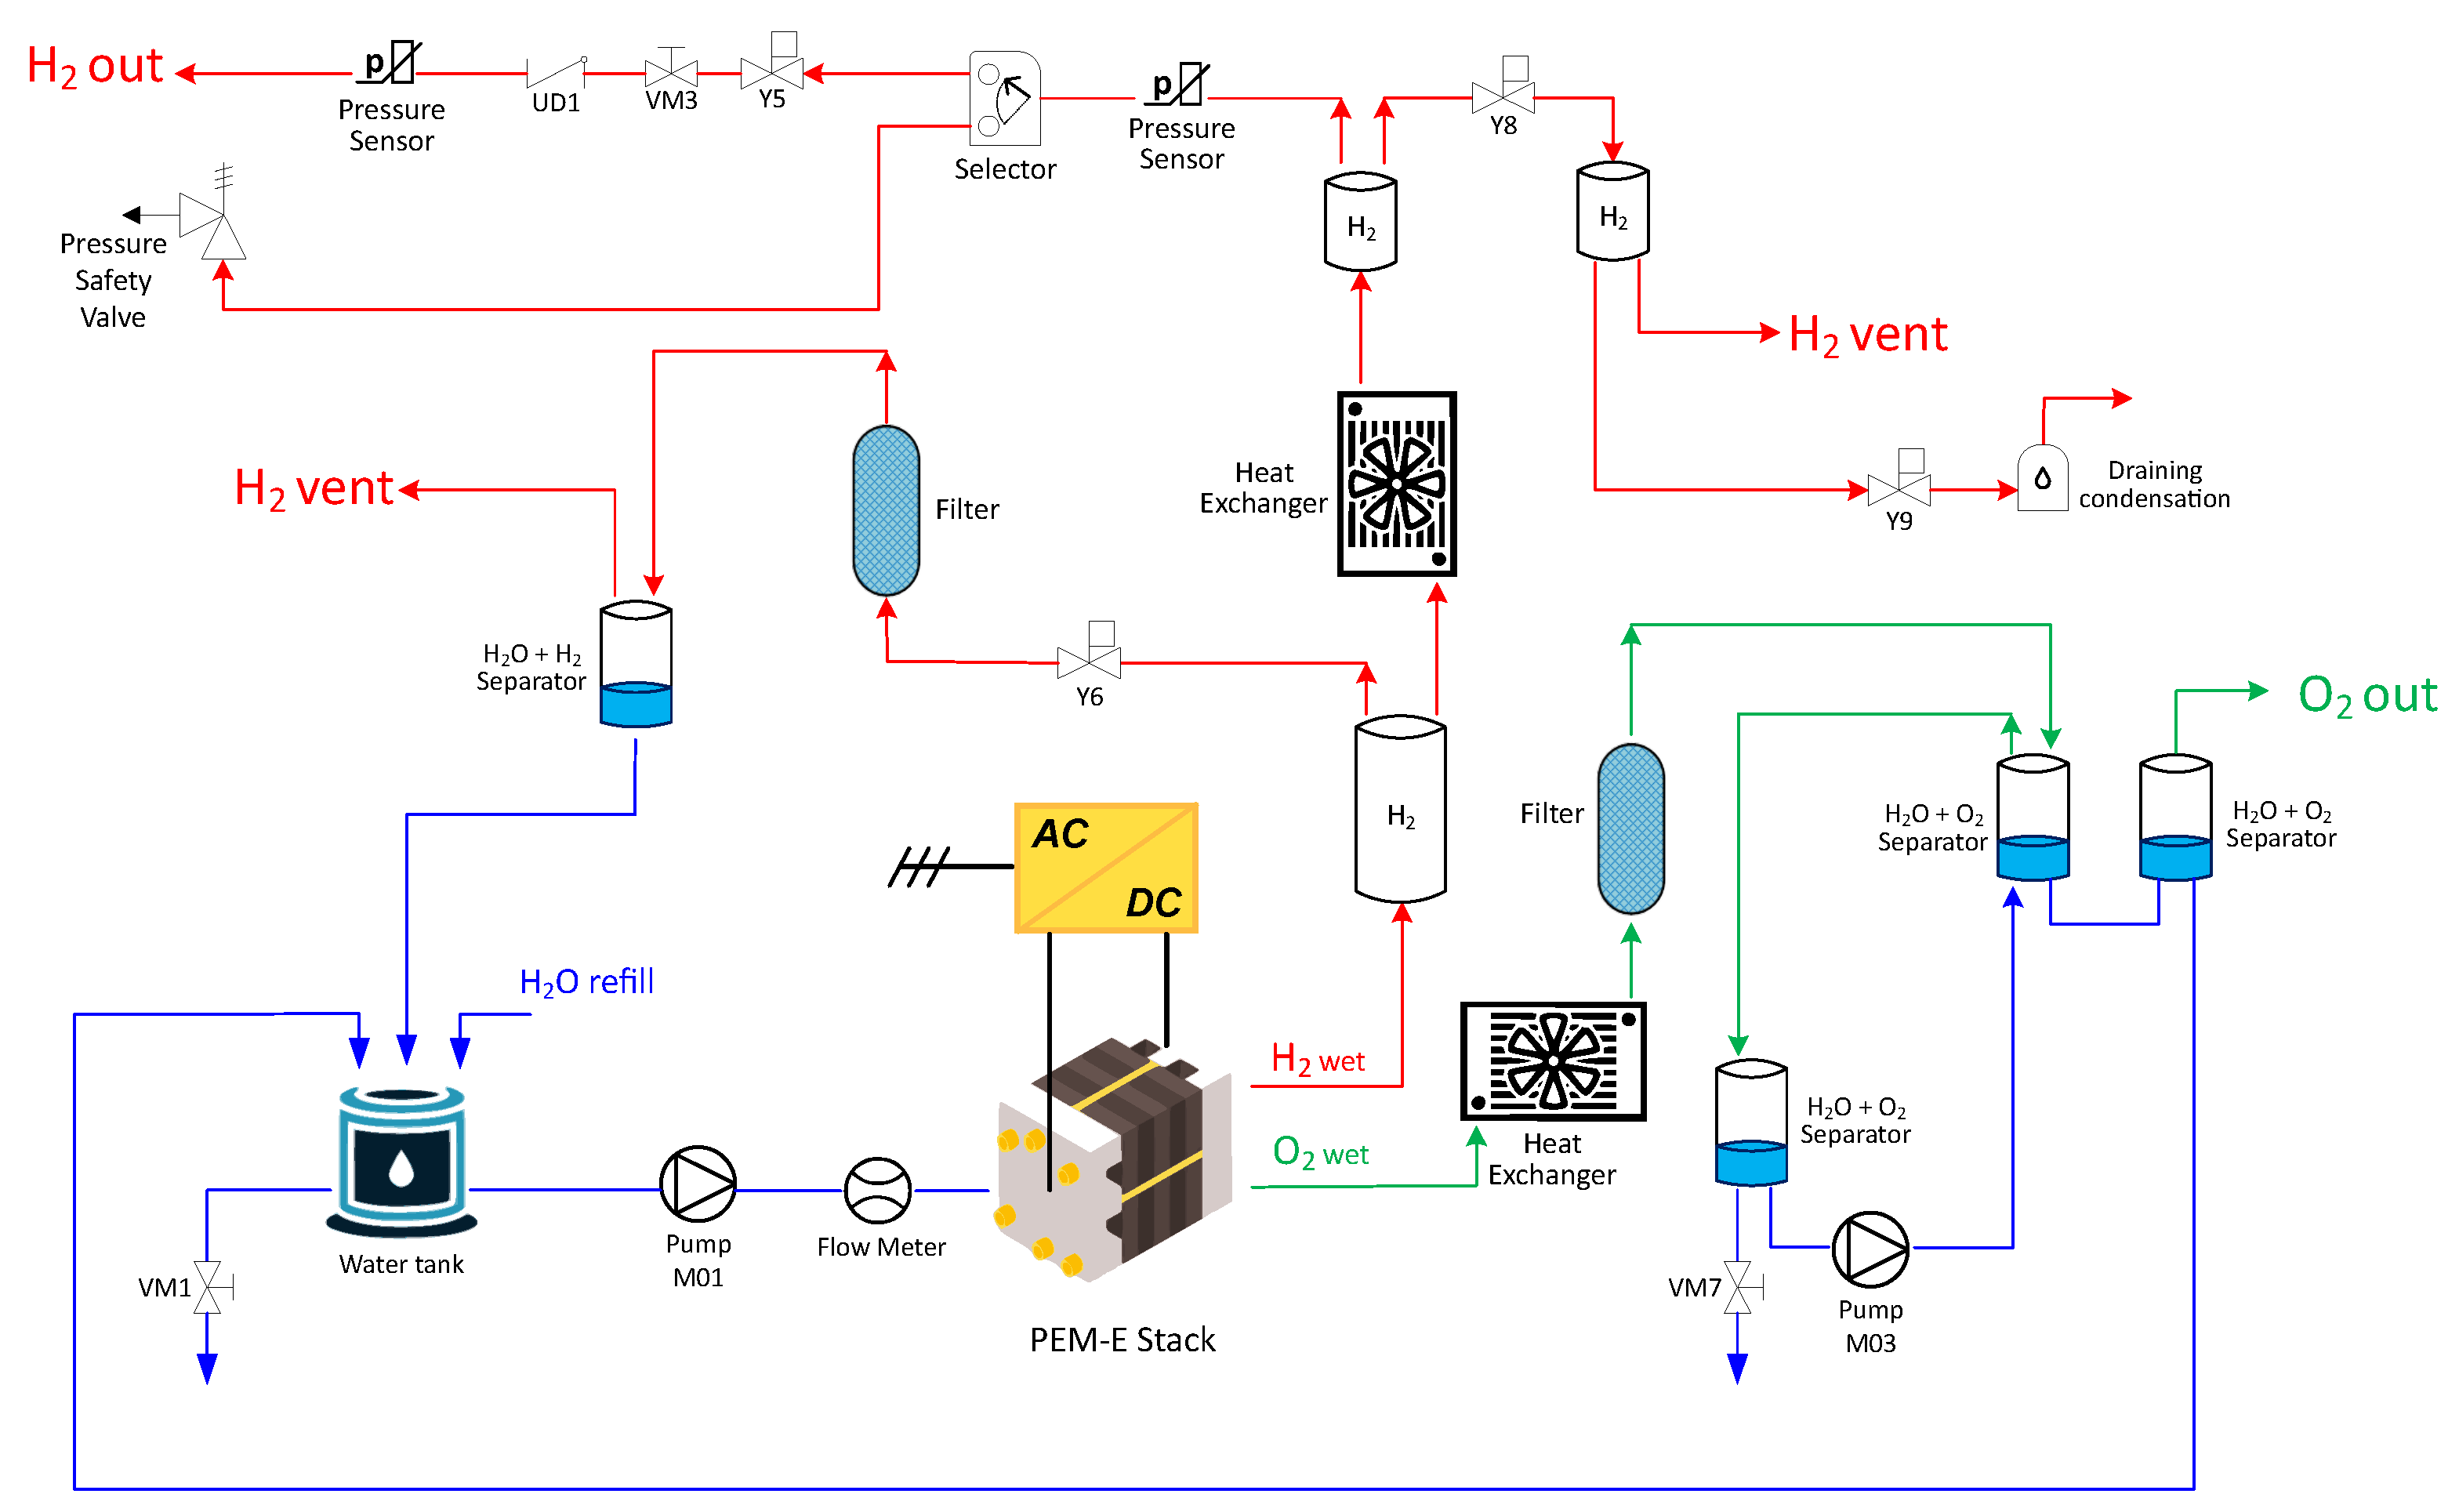
  • The electrolyzer—In more detail, the considered electrolyzer internally comprises the stack, all the auxiliaries required for its proper functioning, the programmable logic controller (PLC) for control, and the power supply. These form the electrolyzer balance of plant (BoP). A more detailed diagram of the BoP is shown in Figure 2.
  • The hydrogen storage system—In this case, an MH-based storage system is considered. MHs are classified according to the materials of which the metal alloy is composed. This study specifically considers interstitial MHs. These hydrides are typically non-stoichiometric compounds in which hydrogen is incorporated into the crystal lattice of a metal or metal alloy. The abbreviations AB, AB2, and AB5 indicate the predominant elements in the base alloy and provide an approximate representation of their relative proportions. These hydrides generally function within a temperature range of 50 to 200 ° C and exhibit storage capacities of approximately 2% by weight, depending on the alloy composition [37,38]. However, it is necessary to consider that the rate of hydrogen adsorption depends on the chemical kinetics of the metal hydride considered and the relative conditions of the system in which it is placed. In the considered system, the storage consists of two AB2-type MH canisters based on TiMg alloy.
  • The cooling system—Since the adsorption phase is an exothermic reaction, the storage system is integrated with a thermal conditioning system used to cool down the MH canisters during the charging phase. This is a water-based cooling circuit consisting of a centrifugal water pump, a thermal buffer tank, and a self-built water-bath heat exchanger.
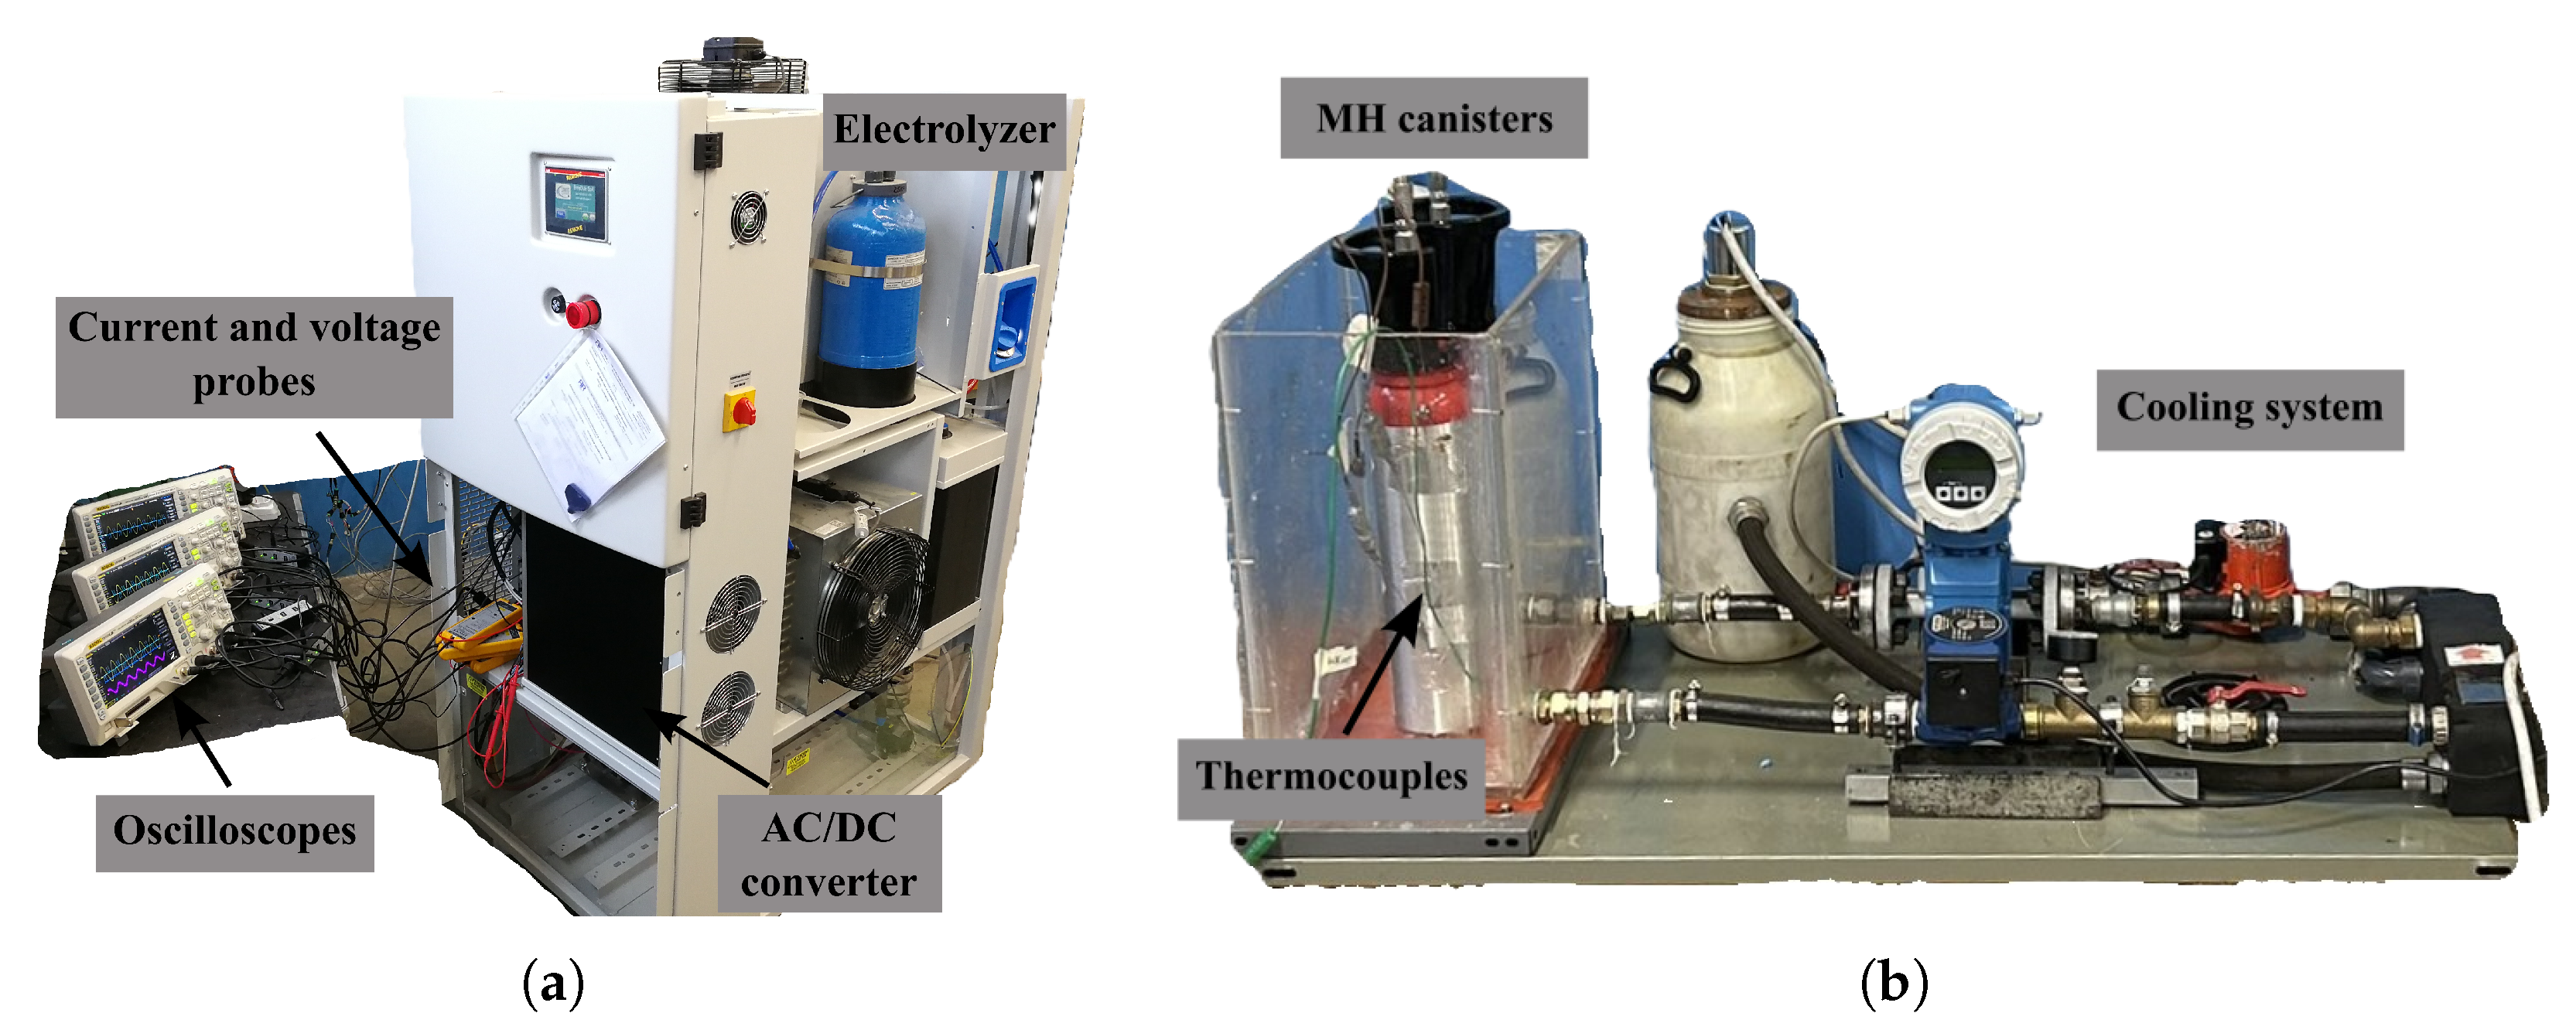
  • The data acquisition and control (DAQ) system—This part is developed in the MATLAB environment and based on Arduino hardware, which is able to communicate with the electrolyzer PLC. The acquisition of the voltage and current waveforms is made using oscilloscopes. The system has also been equipped with transducers and sensors to monitor the main thermodynamic and electric quantities, similarly to other articles [39].

3. Methodology

In the considered system, to enable more precise measurements of the portion of power absorbed by the stack and that absorbed by the auxiliaries, the electrolyzer power supply is divided into two independent parts: one for the auxiliaries and one for the stack. In general, they are both supplied from the AC grid. The converter for the auxiliaries is single-phase at 230 Vrms , while that of the stack is three-phase, without neutral, with a line-to-line voltage of 400 Vrms . The grid’s frequency is 50 Hz . The interface between the stack and the grid is an AC/DC converter that takes the three phases mentioned above as input and gives as an output a DC voltage to power solely the stack. This converter is the focus of the study. To characterize the converter, its efficiency and the current ripple produced on the DC side are evaluated. About the converter’s efficiency, the characterization is performed by acquiring the waveforms of currents and voltages at certain operating points on both the AC grid side and the DC side. Then, the efficiency is calculated as the ratio between AC input active power and DC output power. Because the voltage and current waveform are acquired for a time period in the order of hundreds of milliseconds and because the electrolyzer has longer characteristic times, the power measured can be considered constant during the acquisition. From the points obtained, the efficiency curve of the converter is then derived by interpolation. In the case of the converter, the incoming power is considered to come from a symmetrical, balanced system. Thus, the grid power P AC was calculated as:
P AC = 3 · E · i · c o s ( ϕ ) ,
E and i are the rms value of the phase voltage and the line current, respectively, and ϕ is the angular displacement between E and i. Equation (1) is only valid for a single frequency, in this case the fundamental component at 50 Hz . Not considering the contribution of higher-order harmonics results in an underestimation of P AC . However, considering the application discussed in this article, the contribution of voltage harmonics can be considered negligible. With regard to line currents, on the other hand, if these are distorted due to the converter, they are decomposed using the fast Fourier transform (FFT) algorithm. This made it possible to derive all harmonic components to isolate the fundamental at 50 Hz , and thus it is possible to calculate the angular displacement ϕ . The measurement of the power of the auxiliary P aux is similar. The difference is that, in that case, the system is single-phase.
In order to quantify the current ripple on the stack current, two indicators were used: the ripple factor Y and the peak-to-peak factor Δ . The first is a method that is also proposed in other works [40,41] and is the ratio between the rms value X rms and the desired mean value X m of the magnitude, as follows:
Y = X rms X m .
If the ripple factor is bigger than 1, it means that ripple is present. The greater the deviation from 1, the more severe the phenomenon is in amplitude. Therefore, the second method is the ratio between the peak-to-peak value of the oscillation X pp and the mean value of the magnitude, as follows:
Δ = X pp X m .
The more Δ deviates from 0, the greater the amplitude of the oscillation. The difference between the two lies in the fact that Y also depends on the frequency and the waveform of the quantity considered, while Δ only takes into account the amplitude of the oscillation. The second therefore allows the effects of amplitude alone to be better quantified.
For the characterization of the system, on the other hand, the overall efficiency and the behavior of the MH as a function of the type of thermal conditioning used are evaluated. To calculate the overall efficiency of the system η tot , the efficiency is taken as the ratio between the power converted into hydrogen and stored inside the canisters P H 2 and the total electrical power supplied to the system P in . The latter will include both the electrical power supplied to the stack’s converter P AC and that used for the operation of the auxiliaries P aux . Therefore, the η tot can be computed as:
η tot = P H 2 P AC + P aux .
P H 2 can be calculated by referring to the low heating value (LHV) of hydrogen as:
P H 2 = m ˙ H 2 · L H V ,
where m ˙ H 2 is the instantaneous mass flow rate of hydrogen produced and stored inside the canisters. The use of LHV instead of high heating value (HHV) allows a more conservative estimate of efficiency. However, this is only a part of the total hydrogen produced, as a fraction is regularly vented by the electrolyzer to ensure the proper functioning of the stack. Thus, the flow rate of hydrogen stored in the canisters can be seen as:
m ˙ H 2 = m ˙ H 2 tot m ˙ H 2 loss .
where m ˙ H 2 tot is the total hydrogen flow rate produced and m ˙ H 2 loss is the vented portion. Thus, from the Equations (4)–(6), if the total power supplied by the grid and the various hydrogen flow rates are known, it is possible to calculate the system’s overall efficiency. To obtain a more detailed view of the main components, in addition to the converter, the conversion efficiency of the stack η stack is also calculated as:
η stack = m ˙ H 2 tot · L H V P DC ,
where P DC is the power output from the converter and supplied to the stack.
Finally, to evaluate the effect of the thermal conditioning system on the overall system, two tests are carried out using different hydride cooling methods: the first test is performed with the cylinders in air, while in the second, they are immersed in water. In the first case, therefore, there is no control over the temperature, while in the second, an attempt is made to keep the water temperature as constant as possible to ensure the cooling of the canisters. Both tests are concluded when the pressure inside the canisters reaches the same value. To assess the effect on the system of the type of thermal conditioning on MH, the energy efficiency of the test η test is used as an indicator, calculated as:
η test = m H 2 · L H V E in ,
where m H 2 is the mass of hydrogen accumulated in the canisters at the end of the test and E in is the total electrical energy supplied to the system. In this way, the tests’ duration can also be considered if they differ.

4. Experimental Setup

The experimental setup consists of a PEM electrolyzer able to produce up to 500 NL / h ( 44.5 g / h ) of hydrogen at 15 bar maximum, with a rated power consumption of 2.5 kW . The AC/DC converter can output a DC voltage of up to 300 V and a current of up to 75 A . It can therefore handle a power of up to 22.5 kW . However, the maximum electrical load of the stack is around 3.5 kW ; consequently, the converter is oversized for the application, which may have been a design choice intended to enhance the modularity of the product and reduce production costs. This implies that the converter is forced to operate only in a limited load region, away from what is perhaps the nominal operating point for which it was sized. Realistically, therefore, the efficiency at which it operates is less than the maximum efficiency at which it could operate. The single MH canister can store 71.2 g ( 800 NL ) of hydrogen at a maximum pressure of 25 bar in a physical volume of 2 L . A couple of them are used in parallel. The air test is conducted at an ambient temperature of about 25 ° C , while the water test is conducted at about 20 ° C and cooled by regularly adding ice to the cooling system buffer. Both tests are concluded when a pressure of 15 bar is reached inside the canisters. Regarding the acquired measurements and the used sensors, a summary is given in Table 1. The electrical quantities are acquired through three Rigol oscilloscopes, two DS1054Z and one DS1074Z, respectively. The remaining physical quantities are acquired with a prototype acquisition system based on an Arduino Mega 2560. The acquired data are transmitted via Ethernet cable using the UDP protocol to the master computer, on which they are displayed and saved in a local .mat file in the MATLAB R2023b environment. For security reasons, the acquired data are displayed on a specially developed graphic interface, also in the MATLAB environment. For redundancy, data transmitted by the electrolyser’s PLC are also acquired. In this case, the Modbus protocol is used. A photo of the experimental setup is shown in Figure 3.

5. Results and Discussions

Figure 4, Figure 5 and Figure 6 show the waveforms of the currents and voltages measured at the input and output of the converter at the point of maximum, 50%, and 20% of power absorption of the stack, respectively.
It can be seen that the input system appears to be symmetrical and balanced. Additionally, the input line current to the converter, under steady-state conditions, exhibits a highly impulsive behavior. On the DC side, the voltage oscillates around its mean value with an oscillation of approximately 1 V and a frequency around 50 Hz , while the current has a ripple at a frequency of about 300 Hz . The amplitude of the current ripple on the DC side changes based on the power request from the stack. From these tests, it is therefore supposed that the converter includes a rectifier (AC/DC) followed by a buck-type converter (DC/DC) to adjust the voltage to the level necessary for powering the stack at the selected operating point. With only a diode rectifier, the voltage applied to the stack would be higher than the measured value and would remain constant. Figure 7 shows the values of the ripple factor and peak–to–peak factor at the points where the waveforms were acquired and their relative trends.
In both cases, as the power required by the stack increases, the impact of the ripple decreases. This is because, proportionally, the mean value of the stack current increases more than the amplitude of the ripple. In both cases, however, the amplitude of the ripple is small, as Y is close to 1 and Δ is close to 0. However, the aspect to be considered is the frequency of the oscillations, which is in the range that the literature shows to be the most damaging to the stack. Given that the converter has already been built and assuming that its existing structure will remain unchanged, ripple mitigation can be addressed through control adjustments. This can be achieved either by increasing the switching frequency of the buck converter or, if the buck employs an interleaved topology, by operating it at points where the ripple naturally cancels out [42].
In terms of converter efficiency, it remains within a fairly narrow range, ranging from 65% to 68%. In general, this is quite low for a commercial power converter. This may be because the converter is sized for much higher powers, and coupled with this stack, it can only deliver a fraction (maximum 15%) of the power it could process. Therefore, within the range of interest for this application, its efficiency can be considered constant, with a mean value of 66%. As an example, Figure 8 shows the trend of the power consumption of the auxiliaries for the test carried out with the canisters in the water.
The power consumption of the auxiliaries varies within a very small range, and in general, when the stack is running, it never falls below 220 W . The results on the conversion efficiency of the stack η stack and the overall efficiency of the system η tot (including losses due to the auxiliaries and vent logic) are shown in Figure 9.
The system thus has a maximum efficiency of about 37% when the stack is operating at about 40% of its maximum power. Over this threshold, the system has a nearly constant efficiency, while at lower loads, the system’s efficiency drops drastically. At low loads, therefore, the system suffers more from the effect of losses due to auxiliaries and vent logic.
As for the tests performed to observe the overall behavior of the system when varying the type of thermal conditioning, the results are shown in Figure 10 and Figure 11, for the air and water tests, respectively. As can be seen, the electrolyzer has an initial power peak due to the pressurization of all the volumes inside the BoP. Thereafter, it remains stable around 3.3 kW and then gradually decreases. In the case of the test carried out in air, the drop in power is more rapid, while in the cooled case, it is slower. This is because in the air case, the canisters heat up more rapidly and are therefore less prone to adsorb hydrogen, whereas for those in water, this effect is attenuated. The various peaks present during the operation of the electrolyzer are due to the purging logic. This leads to a reduction in the internal pressure of the electrolyzer and thus to a consequent increase in power to produce hydrogen to repressurize the system. The electrolyzer generally operates with the same logic, so the output hydrogen flow rate is governed only by the adsorption capacity of the MHs. In the beginning, when the canisters are empty, the electrolyzer is free to produce the maximum. However, as the canisters fill up, and their internal pressure and temperature increase, their capacity to adsorb hydrogen is reduced.
As a result, the electrolyzer is forced to reduce its output. With this setup, then, the converter is free to work anywhere in the range allowed by the stack. For the air test, the system is brought to work most of the time in the region with the lowest system efficiency, and the highest ripple-factor and peak-to-peak factor. In the water test, on the other hand, the system can work for more time in the region of almost constant efficiency. Table 2 shows the results for the hydrogen stored in the canisters at the end of the tests and the respective energy efficiency η test . Although the test in water lasts longer than the test in air, the fact that the system can work for longer in higher-efficiency zones allows it to store more hydrogen and provides a higher overall efficiency.
If the objective is to maximize the efficiency of the production system, an option with this setup could be to limit the hydrogen output using a mass flow controller or a valve. In this way, the electrolyzer will be forced to operate at this level, until the canisters reach the point where they begin to reduce their adsorption capacity. However, this would greatly increase the time required to achieve the same amount of hydrogen output.

6. Conclusions

This article focused on the study of the electrolyzer power converter of a power-to-gas system with metal hydride storage. The system comprises a commercial grid-connected PEM-type electrolyzer with a nominal power of 2.5 kW , an AB2-type metal hydride storage system with a total volume of 4 L , and their associated thermal conditioning system. The interface between the grid and the electrolyzer is an AC/DC converter. Its characteristics with regard to DC-side current ripple and efficiency were studied at various operating points. It is noted that the ripple amplitude is small over the entire load range. In general, it tends to decrease as the load increases. The frequency of the current ripple, on the other hand, appears to be in the range of frequencies that most affect the ageing of PEM cells ( 300 Hz ). As far as converter efficiency is concerned, this is quite low by current commercial standards (around 66%). This may be because it is oversized for the stack to which it is coupled. This reduces the efficiency of the overall system over the entire possible power range. On the other hand, at low loads, the overall efficiency is more affected by the effects of auxiliaries and vent logic. Two tests were carried out to verify the behavior of the system with varying thermal conditioning of the hydrides: one with canisters in air and the other with canisters in temperature-controlled water. As noted, system operation depends solely on the ability of hydrides to adsorb hydrogen. These, if not cooled, force the system to work in the region of lower efficiencies most of the time. This results in the converter also being forced to work at a higher ripple factor and peak-to-peak factor. However, the results show that conditioning in water allows the converter to operate at higher system efficiencies for a longer time. This leads to an increase in the energetic efficiency of around 1%. Therefore, if the objective is to operate the system at maximum efficiency, without making changes to the electrolyzer, one could use a mass flow controller between the electrolyzer and the canisters. In this way, the maximum flow rate could be imposed, forcing the electrolyzer to work at the desired point. Future studies could verify this proposal or could look at the effects of different storage sizes with the same boundary conditions.

Author Contributions

Conceptualization, P.P. and M.R.; methodology, P.P. and M.R.; software, P.P. and R.A.; validation, Federico Ferrari, R.A., Francesco Falcetelli, and M.R.; formal analysis, P.P., F.F. (Federico Ferrari), R.A., F.F. (Francesco Falcetelli) and M.R.; investigation, P.P., F.F. (Federico Ferrari), R.A. and F.F. (Francesco Falcetelli); resources, P.P., F.F. (Federico Ferrari), R.A., and Francesco Falcetelli; data curation, P.P. and R.A.; writing—original draft preparation, P.P.; writing—review and editing, P.P., F.F. (Federico Ferrari), R.A., F.F. (Francesco Falcetelli), M.A.A., M.B., and M.R.; visualization, P.P. and M.R.; supervision, F.M., M.B., and M.R.; project administration, M.A.A., F.M., M.B., and M.R.; funding acquisition, F.M. and M.B. All authors have read and agreed to the published version of the manuscript.

Funding

This research received no external funding.

Data Availability Statement

The original contributions presented in the study are included in the article, further inquiries can be directed to the corresponding author.

Conflicts of Interest

The authors declare no conflicts of interest.

Abbreviations

The following abbreviations are used in this manuscript:
IEAInternational Energy Agency
PEMProton exchange membrane
SOCSolid oxide cell
MHMetal hydride
RESRenewable energy source
P2GPower-to-gas
DAQData acquisition and control
PLCProgrammable logic controller
BoPBalance of plant
ACAlternate current
DCDirect current
LHVLow heating value
HHVHigh heating value
FFTFast Fourier transform
TCThermocouple
p.u.Per unit

References

  1. Houghton, J. Global warming. Rep. Prog. Phys. 2005, 68, 1343. [Google Scholar] [CrossRef]
  2. Farias, C.B.B.; Barreiros, R.C.S.; da Silva, M.F.; Casazza, A.A.; Converti, A.; Sarubbo, L.A. Use of hydrogen as fuel: A trend of the 21st century. Energies 2022, 15, 311. [Google Scholar] [CrossRef]
  3. Van Hoecke, L.; Laffineur, L.; Campe, R.; Perreault, P.; Verbruggen, S.W.; Lenaerts, S. Challenges in the use of hydrogen for maritime applications. Energy Environ. Sci. 2021, 14, 815–843. [Google Scholar] [CrossRef]
  4. IEA. Global Hydrogen Review 2024. Available online: https://www.iea.org/reports/global-hydrogen-review-2024 (accessed on 27 January 2025).
  5. Mohammadi, A.; Mehrpooya, M. A comprehensive review on coupling different types of electrolyzer to renewable energy sources. Energy 2018, 158, 632–655. [Google Scholar] [CrossRef]
  6. Dawood, F.; Anda, M.; Shafiullah, G. Hydrogen production for energy: An overview. Int. J. Hydrogen Energy 2020, 45, 3847–3869. [Google Scholar] [CrossRef]
  7. Ilyushin, Y.V.; Boronko, E.A. Analysis of Energy Sustainability and Problems of Technological Process of Primary Aluminum Production. Energies 2025, 18, 2194. [Google Scholar] [CrossRef]
  8. Nejadian, M.M.; Ahmadi, P.; Houshfar, E. Comparative optimization study of three novel integrated hydrogen production systems with SOEC, PEM, and alkaline electrolyzer. Fuel 2023, 336, 126835. [Google Scholar] [CrossRef]
  9. Benghanem, M.; Almohamadi, H.; Haddad, S.; Mellit, A.; Chettibi, N. The effect of voltage and electrode types on hydrogen production powered by photovoltaic system using alkaline and PEM electrolyzers. Int. J. Hydrogen Energy 2024, 57, 625–636. [Google Scholar] [CrossRef]
  10. Sayed-Ahmed, H.; Toldy, Á.I.; Santasalo-Aarnio, A. Dynamic operation of proton exchange membrane electrolyzers—Critical review. Renew. Sustain. Energy Rev. 2024, 189, 113883. [Google Scholar] [CrossRef]
  11. Hydrogen Europe. Clean Hydrogen Production Pathways Report 2024. Available online: https://www.keei.re.kr/library/10110/contents/6883588 (accessed on 27 January 2025).
  12. Elberry, A.M.; Thakur, J.; Santasalo-Aarnio, A.; Larmi, M. Large-scale compressed hydrogen storage as part of renewable electricity storage systems. Int. J. Hydrogen Energy 2021, 46, 15671–15690. [Google Scholar] [CrossRef]
  13. Ghaffari-Tabrizi, F.; Haemisch, J.; Lindner, D. Reducing hydrogen boil-off losses during fuelling by pre-cooling cryogenic tank. Hydrogen 2022, 3, 255–269. [Google Scholar] [CrossRef]
  14. Zhang, T.; Uratani, J.; Huang, Y.; Xu, L.; Griffiths, S.; Ding, Y. Hydrogen liquefaction and storage: Recent progress and perspectives. Renew. Sustain. Energy Rev. 2023, 176, 113204. [Google Scholar] [CrossRef]
  15. Klopčič, N.; Grimmer, I.; Winkler, F.; Sartory, M.; Trattner, A. A review on metal hydride materials for hydrogen storage. J. Energy Storage 2023, 72, 108456. [Google Scholar] [CrossRef]
  16. Førde, T. Theoretical and Experimental Studies of Metal Hybride Storage Units. Ph.D. Thesis, Norwegian University of Science and Technology, Trondheim, Norway, 2007. [Google Scholar]
  17. Nivedhitha, K.; Beena, T.; Banapurmath, N.; Umarfarooq, M.; Ramasamy, V.; Soudagar, M.E.M.; Ağbulut, Ü. Advances in hydrogen storage with metal hydrides: Mechanisms, materials, and challenges. Int. J. Hydrogen Energy 2024, 61, 1259–1273. [Google Scholar] [CrossRef]
  18. Nguyen, E.; Olivier, P.; Péra, M.C.; Pahon, E.; Roche, R.; Lefranc, O.; Claudel, F. Impact of short-term intermittent operation on experimental industrial PEM and alkaline electrolyzers. Int. J. Hydrogen Energy 2025, 126, 516–530. [Google Scholar] [CrossRef]
  19. Marangio, F.; Santarelli, M.; Calì, M. Theoretical model and experimental analysis of a high pressure PEM water electrolyser for hydrogen production. Int. J. Hydrogen Energy 2009, 34, 1143–1158. [Google Scholar] [CrossRef]
  20. Guilbert, D.; Vitale, G. Experimental validation of an equivalent dynamic electrical model for a proton exchange membrane electrolyzer. In Proceedings of the 2018 IEEE International Conference on Environment and Electrical Engineering and 2018 IEEE Industrial and Commercial Power Systems Europe (EEEIC/I&CPS Europe), Palermo, Italy, 12–15 June 2018; pp. 1–6. [Google Scholar]
  21. Arriaga, L.; Martinez, W.; Cano, U.; Blud, H. Direct coupling of a solar-hydrogen system in Mexico. Int. J. Hydrogen Energy 2007, 32, 2247–2252. [Google Scholar] [CrossRef]
  22. Clarke, R.; Giddey, S.; Ciacchi, F.; Badwal, S.; Paul, B.; Andrews, J. Direct coupling of an electrolyser to a solar PV system for generating hydrogen. Int. J. Hydrogen Energy 2009, 34, 2531–2542. [Google Scholar] [CrossRef]
  23. Di Caro, A.; Vitale, G. Direct-Coupled Improvement of a Solar-Powered Proton Exchange Membrane Electrolyzer by a Reconfigurable Source. Clean Technol. 2024, 6, 1203–1228. [Google Scholar] [CrossRef]
  24. Chen, M.; Chou, S.F.; Blaabjerg, F.; Davari, P. Overview of power electronic converter topologies enabling large-scale hydrogen production via water electrolysis. Appl. Sci. 2022, 12, 1906. [Google Scholar] [CrossRef]
  25. Guilbert, D.; Collura, S.M.; Scipioni, A. DC/DC converter topologies for electrolyzers: State-of-the-art and remaining key issues. Int. J. Hydrogen Energy 2017, 42, 23966–23985. [Google Scholar] [CrossRef]
  26. Pahon, E.; Péra, M.C.; Bouquain, D.; Hissel, D. Impact of current ripples on the durability of proton exchange membrane fuel cells based on two ageing datasets. Data Brief 2022, 45, 108601. [Google Scholar] [CrossRef] [PubMed]
  27. Parache, F.; Schneider, H.; Turpin, C.; Richet, N.; Debellemanière, O.; Bru, É.; Thieu, A.T.; Bertail, C.; Marot, C. Impact of power converter current ripple on the degradation of PEM electrolyzer performances. Membranes 2022, 12, 109. [Google Scholar] [CrossRef]
  28. Wahdame, B.; Girardot, L.; Hissel, D.; Harel, F.; François, X.; Candusso, D.; Pera, M.C.; Dumercy, L. Impact of power converter current ripple on the durability of a fuel cell stack. In Proceedings of the 2008 IEEE International Symposium on Industrial Electronics, Cambridge, UK, 30 June–2 July 2008; pp. 1495–1500. [Google Scholar]
  29. Zhan, Y.; Guo, Y.; Zhu, J.; Li, L. Input current ripple reduction and high efficiency for PEM fuel cell power conditioning system. In Proceedings of the 2017 20th International Conference on Electrical Machines and Systems (ICEMS), Sydney, NSW, Australia, 11–14 August 2017; pp. 1–6. [Google Scholar]
  30. Kim, J.; Lee, I.; Tak, Y.; Cho, B. Impedance-based diagnosis of polymer electrolyte membrane fuel cell failures associated with a low frequency ripple current. Renew. Energy 2013, 51, 302–309. [Google Scholar] [CrossRef]
  31. Jarry, T.; Jaafar, A.; Turpin, C.; Lacressonniere, F.; Bru, E.; Rallieres, O.; Scohy, M. Impact of high frequency current ripples on the degradation of high-temperature PEM fuel cells (HT–PEMFC). Int. J. Hydrogen Energy 2023, 48, 20734–20742. [Google Scholar] [CrossRef]
  32. Zhan, Y.; Guo, Y.; Zhu, J.; Liang, B.; Yang, B. Comprehensive influences measurement and analysis of power converter low frequency current ripple on PEM fuel cell. Int. J. Hydrogen Energy 2019, 44, 31352–31359. [Google Scholar] [CrossRef]
  33. Buitendach, H.P.; Gouws, R.; Martinson, C.A.; Minnaar, C.; Bessarabov, D. Effect of a ripple current on the efficiency of a PEM electrolyser. Results Eng. 2021, 10, 100216. [Google Scholar] [CrossRef]
  34. Valdez-Resendiz, J.E.; Rosas-Caro, J.C.; Sanchez, V.M.; Lopez-Nuñez, A.R. Experimental study of a fuel cell stack performance operating with a power electronics converter with high-frequency current ripple. Int. J. Hydrogen Energy 2024, 108, 66–75. [Google Scholar] [CrossRef]
  35. Gerard, M.; Poirot-Crouvezier, J.P.; Hissel, D.; Péra, M.C. Ripple Current Effects on PEMFC Aging Test by Experimental and Modeling. J. Fuel Cell Sci. Technol. 2010, 8, 021004. [Google Scholar] [CrossRef]
  36. Guilbert, D.; Sorbera, D.; Vitale, G. A stacked interleaved DC-DC buck converter for proton exchange membrane electrolyzer applications: Design and experimental validation. Int. J. Hydrogen Energy 2020, 45, 64–79. [Google Scholar] [CrossRef]
  37. Drawer, C.; Lange, J.; Kaltschmitt, M. Metal hydrides for hydrogen storage—Identification and evaluation of stationary and transportation applications. J. Energy Storage 2024, 77, 109988. [Google Scholar] [CrossRef]
  38. Pasquini, L.; Sakaki, K.; Akiba, E.; Allendorf, M.D.; Alvares, E.; Ares, J.R.; Babai, D.; Baricco, M.; Von Colbe, J.B.; Bereznitsky, M.; et al. Magnesium-and intermetallic alloys-based hydrides for energy storage: Modelling, synthesis and properties. Prog. Energy 2022, 4, 032007. [Google Scholar] [CrossRef]
  39. Folgado, F.J.; González, I.; Calderón, A.J. Data acquisition and monitoring system framed in Industrial Internet of Things for PEM hydrogen generators. Internet Things 2023, 22, 100795. [Google Scholar] [CrossRef]
  40. Keddar, M.; Zhang, Z.; Periasamy, C.; Doumbia, M.L. Power quality improvement for 20 MW PEM water electrolysis system. Int. J. Hydrogen Energy 2022, 47, 40184–40195. [Google Scholar] [CrossRef]
  41. Mohanpurkar, M.; Luo, Y.; Terlip, D.; Dias, F.; Harrison, K.; Eichman, J.; Hovsapian, R.; Kurtz, J. Electrolyzers enhancing flexibility in electric grids. Energies 2017, 10, 1836. [Google Scholar] [CrossRef]
  42. Drobnic, K.; Grandi, G.; Hammami, M.; Mandrioli, R.; Ricco, M.; Viatkin, A.; Vujacic, M. An output ripple-free fast charger for electric vehicles based on grid–tied modular three-phase interleaved converters. IEEE Trans. Ind. Appl. 2019, 55, 6102–6114. [Google Scholar] [CrossRef]
Figure 1. General scheme of the considered system.
Energies 18 02831 g001
Figure 2. Detailed schematic BoP of the electrolyzer. The water circuit is reported in blue, the oxygen in green, and the hydrogen in red.
Energies 18 02831 g002
Figure 3. View of the whole experimental setup: (a) electrolyzer, (b) MH and cooling system.
Energies 18 02831 g003
Figure 4. Measured current (top) and voltage (bottom) converter’s waveforms when the stack is at maximum power: (a) grid side, (b) stack side.
Energies 18 02831 g004
Figure 5. Measured current (top) and voltage (bottom) converter’s waveforms when the stack is at 50% of its maximum power: (a) grid side, (b) stack side.
Energies 18 02831 g005
Figure 6. Measured current (top) and voltage (bottom) converter’s waveforms when the stack is at 20% of its maximum power: (a) grid side, (b) stack side.
Energies 18 02831 g006
Figure 7. Parameters to quantify ripple intensity and their linear fitting curve: (a) ripple factor, (b) peak-to-peak factor.
Energies 18 02831 g007
Figure 8. Trend of power consumption by auxiliary systems.
Energies 18 02831 g008
Figure 9. Comparison between the efficiency of the AC/DC converter, the stack, and the overall system.
Energies 18 02831 g009
Figure 10. Measured quantities during the air-cooled test: (a) voltage and current on the stack, (b) power absorbed by the stack, (c) temperatures, (d) hydrogen flow rate.
Energies 18 02831 g010
Figure 11. Measured quantities during the water-cooled test: (a) voltage and current on the stack, (b) power absorbed by the stack, (c) temperatures, (d) hydrogen flow rate.
Energies 18 02831 g011
Table 1. Investigated physical quantities and corresponding sensors installed in the test bench.
Physical QuantitySymbolMeasuring RangeSensor TypeSensor Used
H2 pressure p H 2 0 ÷ 15 bar Pressure transducerImpress Sensors and Systems IMP–1502 (Berkshire, UK)
H2 flow m ˙ H 2 0.1 ÷ 85 NL / min Thermal mass flow meterBronkhorst F–112AC (Ruurlo, The Netherlands)
Ambient temperature T amb 20 ÷ 350 ° C T–type thermocoupleTC
Heat exchanger water temperature T H 2 O IN / OUT 20 ÷ 350 ° C T–type thermocoupleTC
Canister temperature (top) T top 75 ÷ 250 ° C K–type thermocoupleTC
Canister temperature (middle) T middle 75 ÷ 250 ° C K–type thermocoupleTC
Canister temperature (bottom) T bottom 75 ÷ 250 ° C K–type thermocoupleTC
Stack voltage V stack 70 ÷ 70 V Differential voltage probePico Technology TA041
Stack current I stack 0 ÷ 100 A DC/AC current probeTeledyne T3CP100–2 (Chestnut Ridge, NY, USA)
Grid voltageE 700 ÷ 700 V Differential voltage probePico Technology TA041 (Cambridgeshire, UK)
Grid currenti 0 ÷ 100 A DC/AC current probeTeledyne T3CP100–2 (Chestnut Ridge, NY, USA)
Table 2. Comparison between the performed tests in terms of stored hydrogen and energetic efficiency.
Cooling TypeHydrogen Stored (g)Energy Efficiency
Air59.30.4037
Water118.20.4113
Disclaimer/Publisher’s Note: The statements, opinions and data contained in all publications are solely those of the individual author(s) and contributor(s) and not of MDPI and/or the editor(s). MDPI and/or the editor(s) disclaim responsibility for any injury to people or property resulting from any ideas, methods, instructions or products referred to in the content.

