1. Introduction
Excessive carbon dioxide (CO
2) emissions are considered to be the main cause of global warming [
1]. However, reducing CO
2 emissions from energy consumption without curbing economic growth has become a global challenge [
2]. At present, countries are collectively faced with the problem of balancing energy consumption and environmental protection, which is particularly important for developing countries [
3]. As the world’s largest developing country, China’s rapid economic development has led to a significant increase in its energy production and consumption [
4,
5]. The key challenge now is to ensure China’s economic growth while simultaneously reducing carbon emissions.
China has long attached considerable importance to climate change and has undertaken a series of actions in response to this issue [
6]. In September 2020, it committed to peaking CO
2 emissions by 2030 and achieving carbon neutrality by 2060, marking its entry into a critical period of comprehensive carbon reduction [
7]. At present, China’s economy has shifted from a stage of rapid growth to a stage of high-quality development [
8]. On the one hand, the dual-carbon goal will promote high-quality economic development, continuously reduce China’s dependence on high-carbon energy sources, and lead to the comprehensive low-carbon transformation of society [
9]. On the other hand, the dual-carbon goal creates higher requirements for energy consumption, including reducing energy consumption, increasing the unit capacity, and reducing pollution emissions, which will bring about a series of changes in industrial development and become a new driving force for economic growth [
7,
10]. Therefore, given this systemic economic and social change, the promotion of mutual coordination between economic and social development and low-carbon emission reduction is essential in achieving the dual-carbon goal.
Research on low-carbon development has expanded from low-carbon development to a comprehensive evaluation of its quality, development efficiency, and development performance. Wang et al. [
11] conducted a bibliometric analysis of Web of Science. They found that the number of published papers on low-carbon urban development grew from 2006 to 2022, with the most significant research contribution from Chinese scholars. Li [
12] evaluated the stage of low-carbon economic development in Sichuan Province and compared it with those in other provinces and regions. Luo and Tong [
13] calculated the national capacity for low-carbon economic development. They analyzed the reasons for the differences based on data related to economic development, energy consumption, and carbon emissions using a combination of factor analysis and entropy weighting. Pan [
14] showed a large gap between China’s level of low-carbon economic development and those of western developed countries. A pattern of gradual enhancement was observed from the west to the east and from the north to the south of the country. Liu [
15] comprehensively evaluated the low-carbon development process in 34 low-carbon pilot cities in terms of drivers, states, pressures, impacts, and responses. The results showed that the cities generally scored low, and the gap between the starting points of development was relatively small. Wang et al. [
16] constructed an evaluation index system for the quality of urban low-carbon development from the perspectives of economy, society, urban planning, energy use, and environment. Their results showed that provinces in the central and eastern parts of the country have higher-quality low-carbon development. In addition to research at the national level, at the Yangtze River Delta [
17], Beijing–Tianjin–Hebei [
18], Nanjing [
19], and Wuhan [
20], many studies have shown that the level of low-carbon development is gradually increasing everywhere.
A low-carbon economy emphasizes reductions in carbon emissions to address the impacts of climate change on the economy, society, and human survival. It promotes the harmonious development of the economy, society, resources, and the environment [
14]. Therefore, when evaluating low-carbon development in China’s provinces, the coordination between the level of economic and social development and the level of low-carbon development in each province needs to be analyzed. Currently, there are relatively few analyses of the coupling and coordination between the energy system and the socioeconomic system. Chai et al. [
21] employed the coupling coordination degree and spatial panel model to calculate the coupling coordination degree of the economy–energy–environment (3E) system in 29 provinces. The results showed that, although the coupling and coordination degree of the 3E system has increased, the “polarization” has been aggravated. However, present research still focuses on the current situation of the energy system and fails to conduct in-depth analyses of the low-carbon transformation of the energy system. Meanwhile, current research rarely incorporates spatial visualization expression, making it challenging to obtain regional differences.
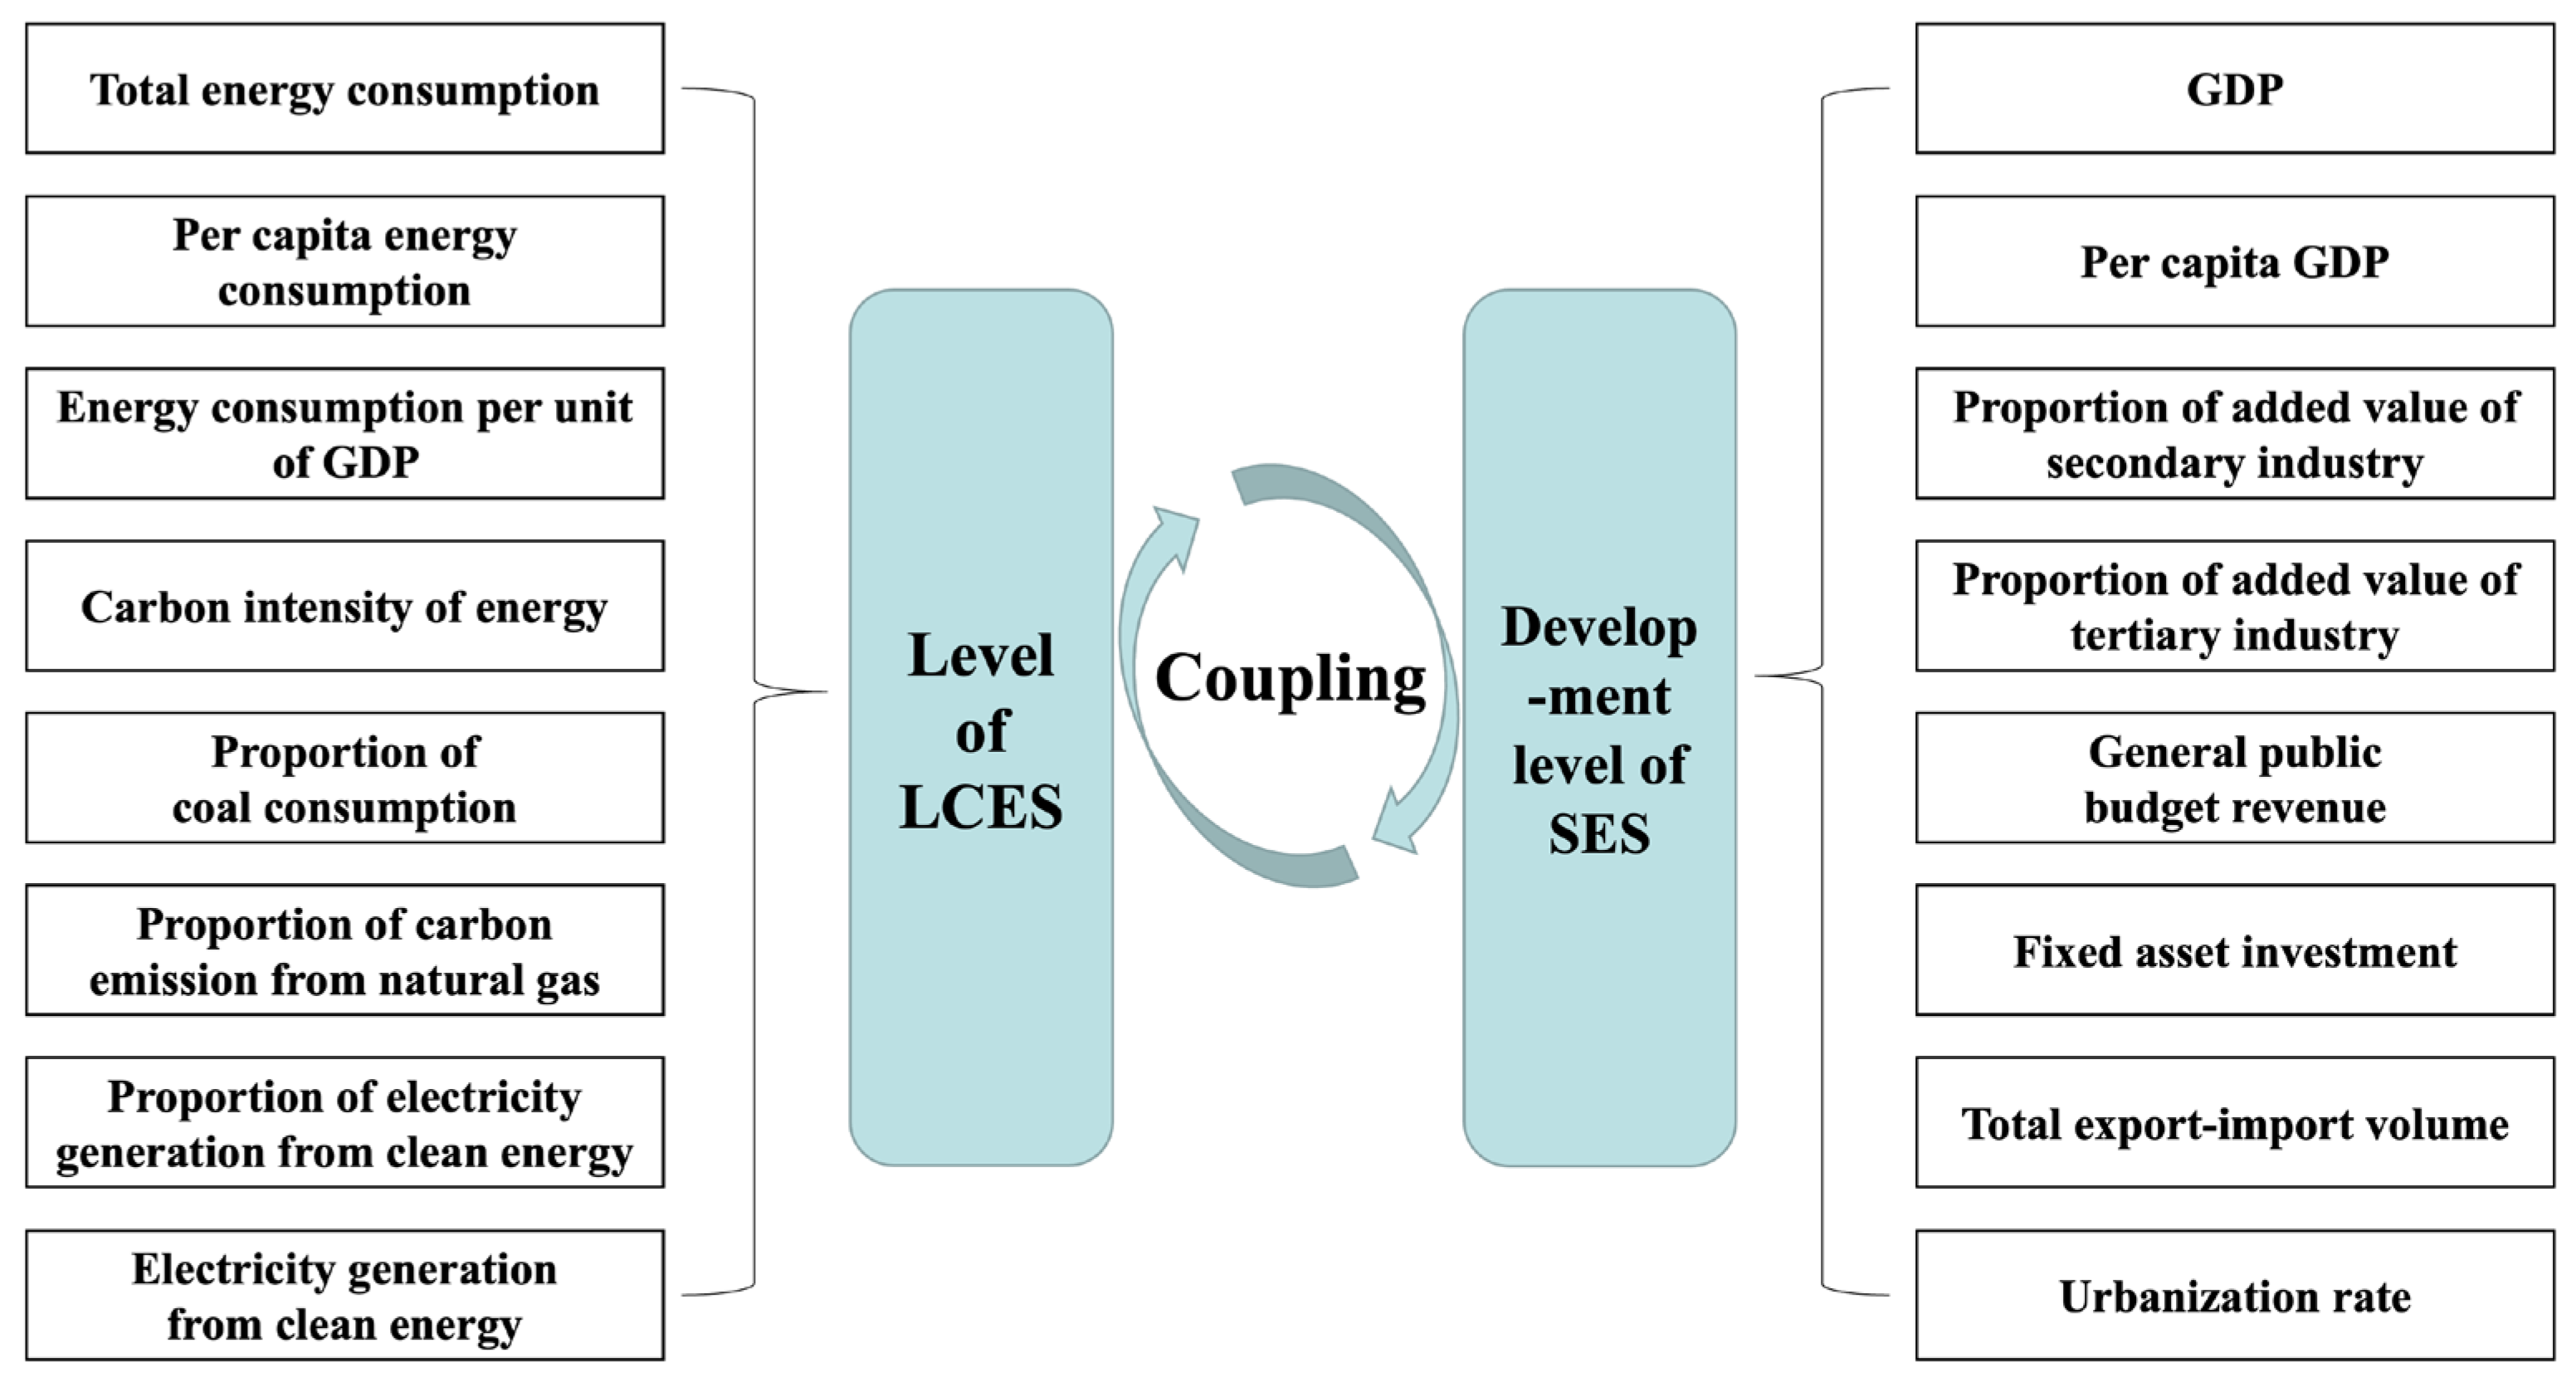
This research focuses on the dual-carbon goal and constructs a coupled and coordinated evaluation system for the development of the low-carbon energy system (LCES) and socioeconomic system (SES). Data support is provided by analyzing and comparing the level of coupling coordination between the LCES and the development of the SES in each province to promote the coupled and coordinated development of the energy and economic systems.
3. Results
3.1. Evaluation of Low-Carbon Level of Energy System
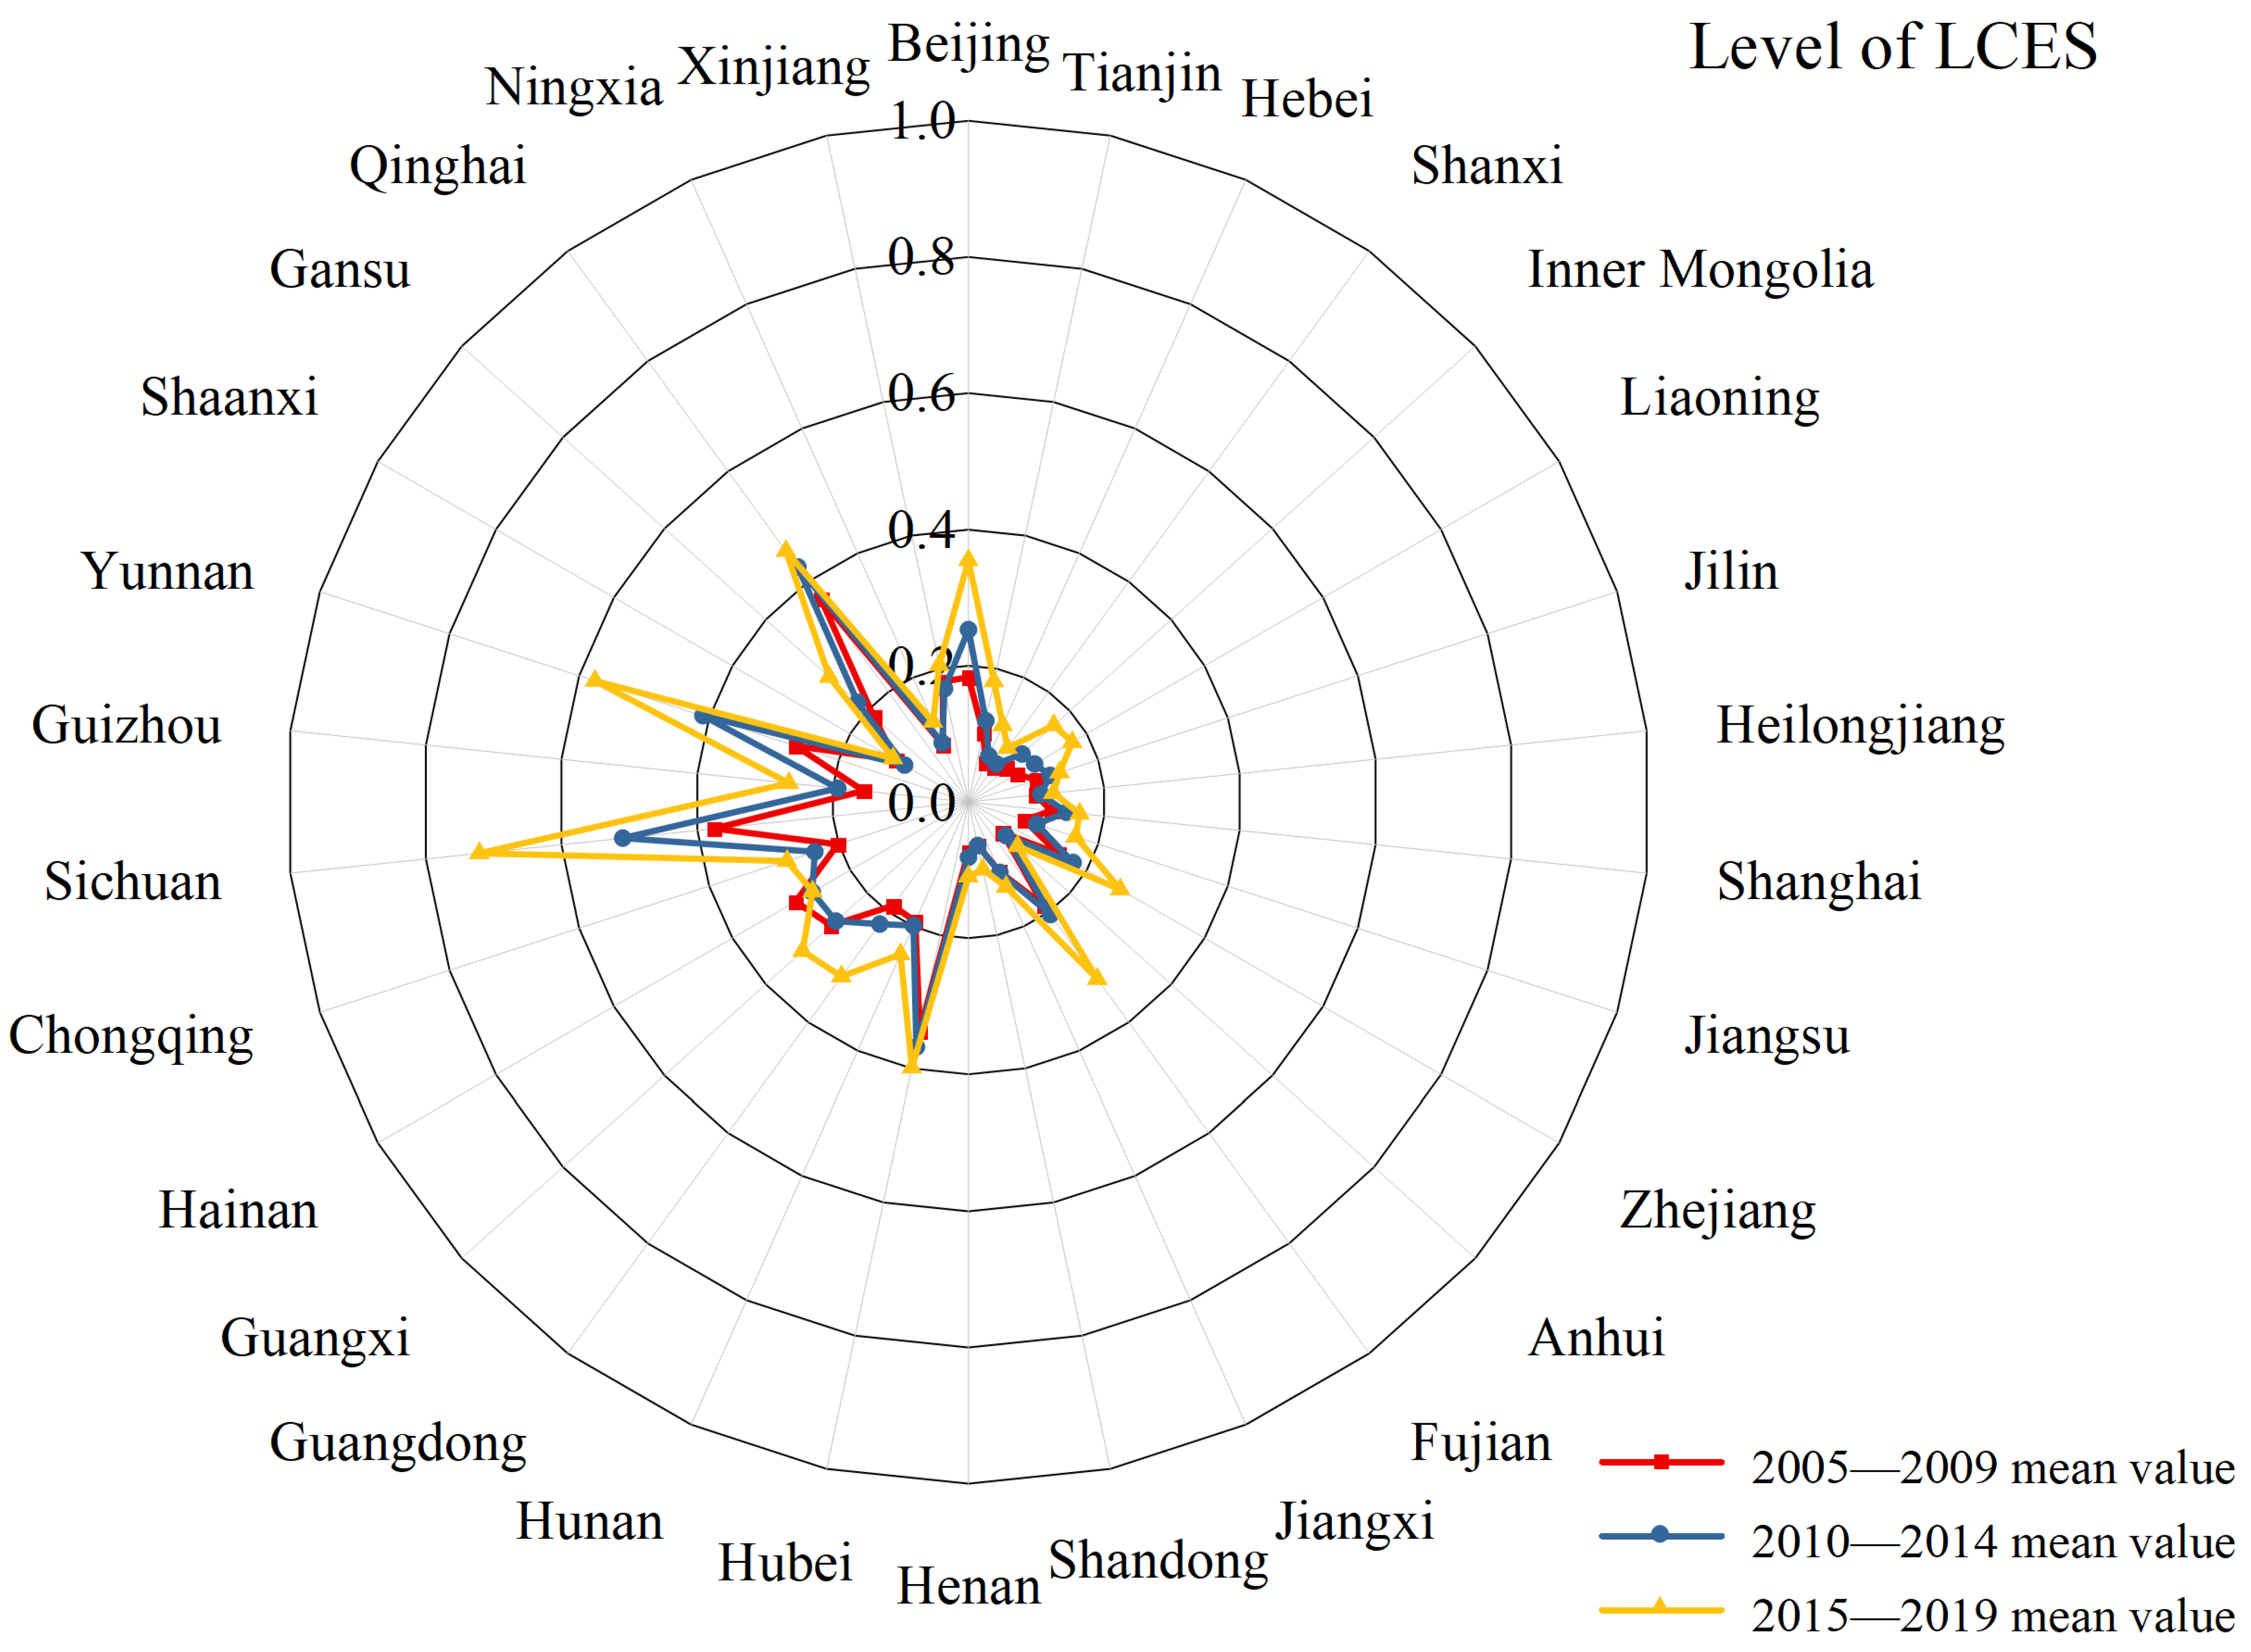
The results show that the level of the LCES in the 30 provinces was unbalanced and insufficient, distributed between 0.06 and 0.75, as shown in the results for Hebei 2007 and Sichuan 2019, respectively. Overall, the level of the LCES was generally low, mostly at the lower–middle level, with only Sichuan, Yunnan, and Qinghai exceeding 0.5.
The results of the time series dynamic evolution analysis (
Figure 2) showed that the levels of all provinces had increased to varying degrees, showing an excellent development trend. This outcome was mainly due to the rapid development of clean energy and a gradual shift from China’s dependence on fossil energy consumption. Most provinces had larger increases in the second five-year cycle compared to the changes in the first five-year cycle. The growth rate during the research period varied slightly among different provinces. Those of Sichuan, Yunnan, Guangdong, Beijing, and Fujian significantly increased between 2005 and 2019. By contrast, Qinghai, Shanxi, Shandong, Anhui, and Heilongjiang not only had low levels of low carbonization of energy and small growth rates but also needed to focus on, adjust, and develop their strategies.
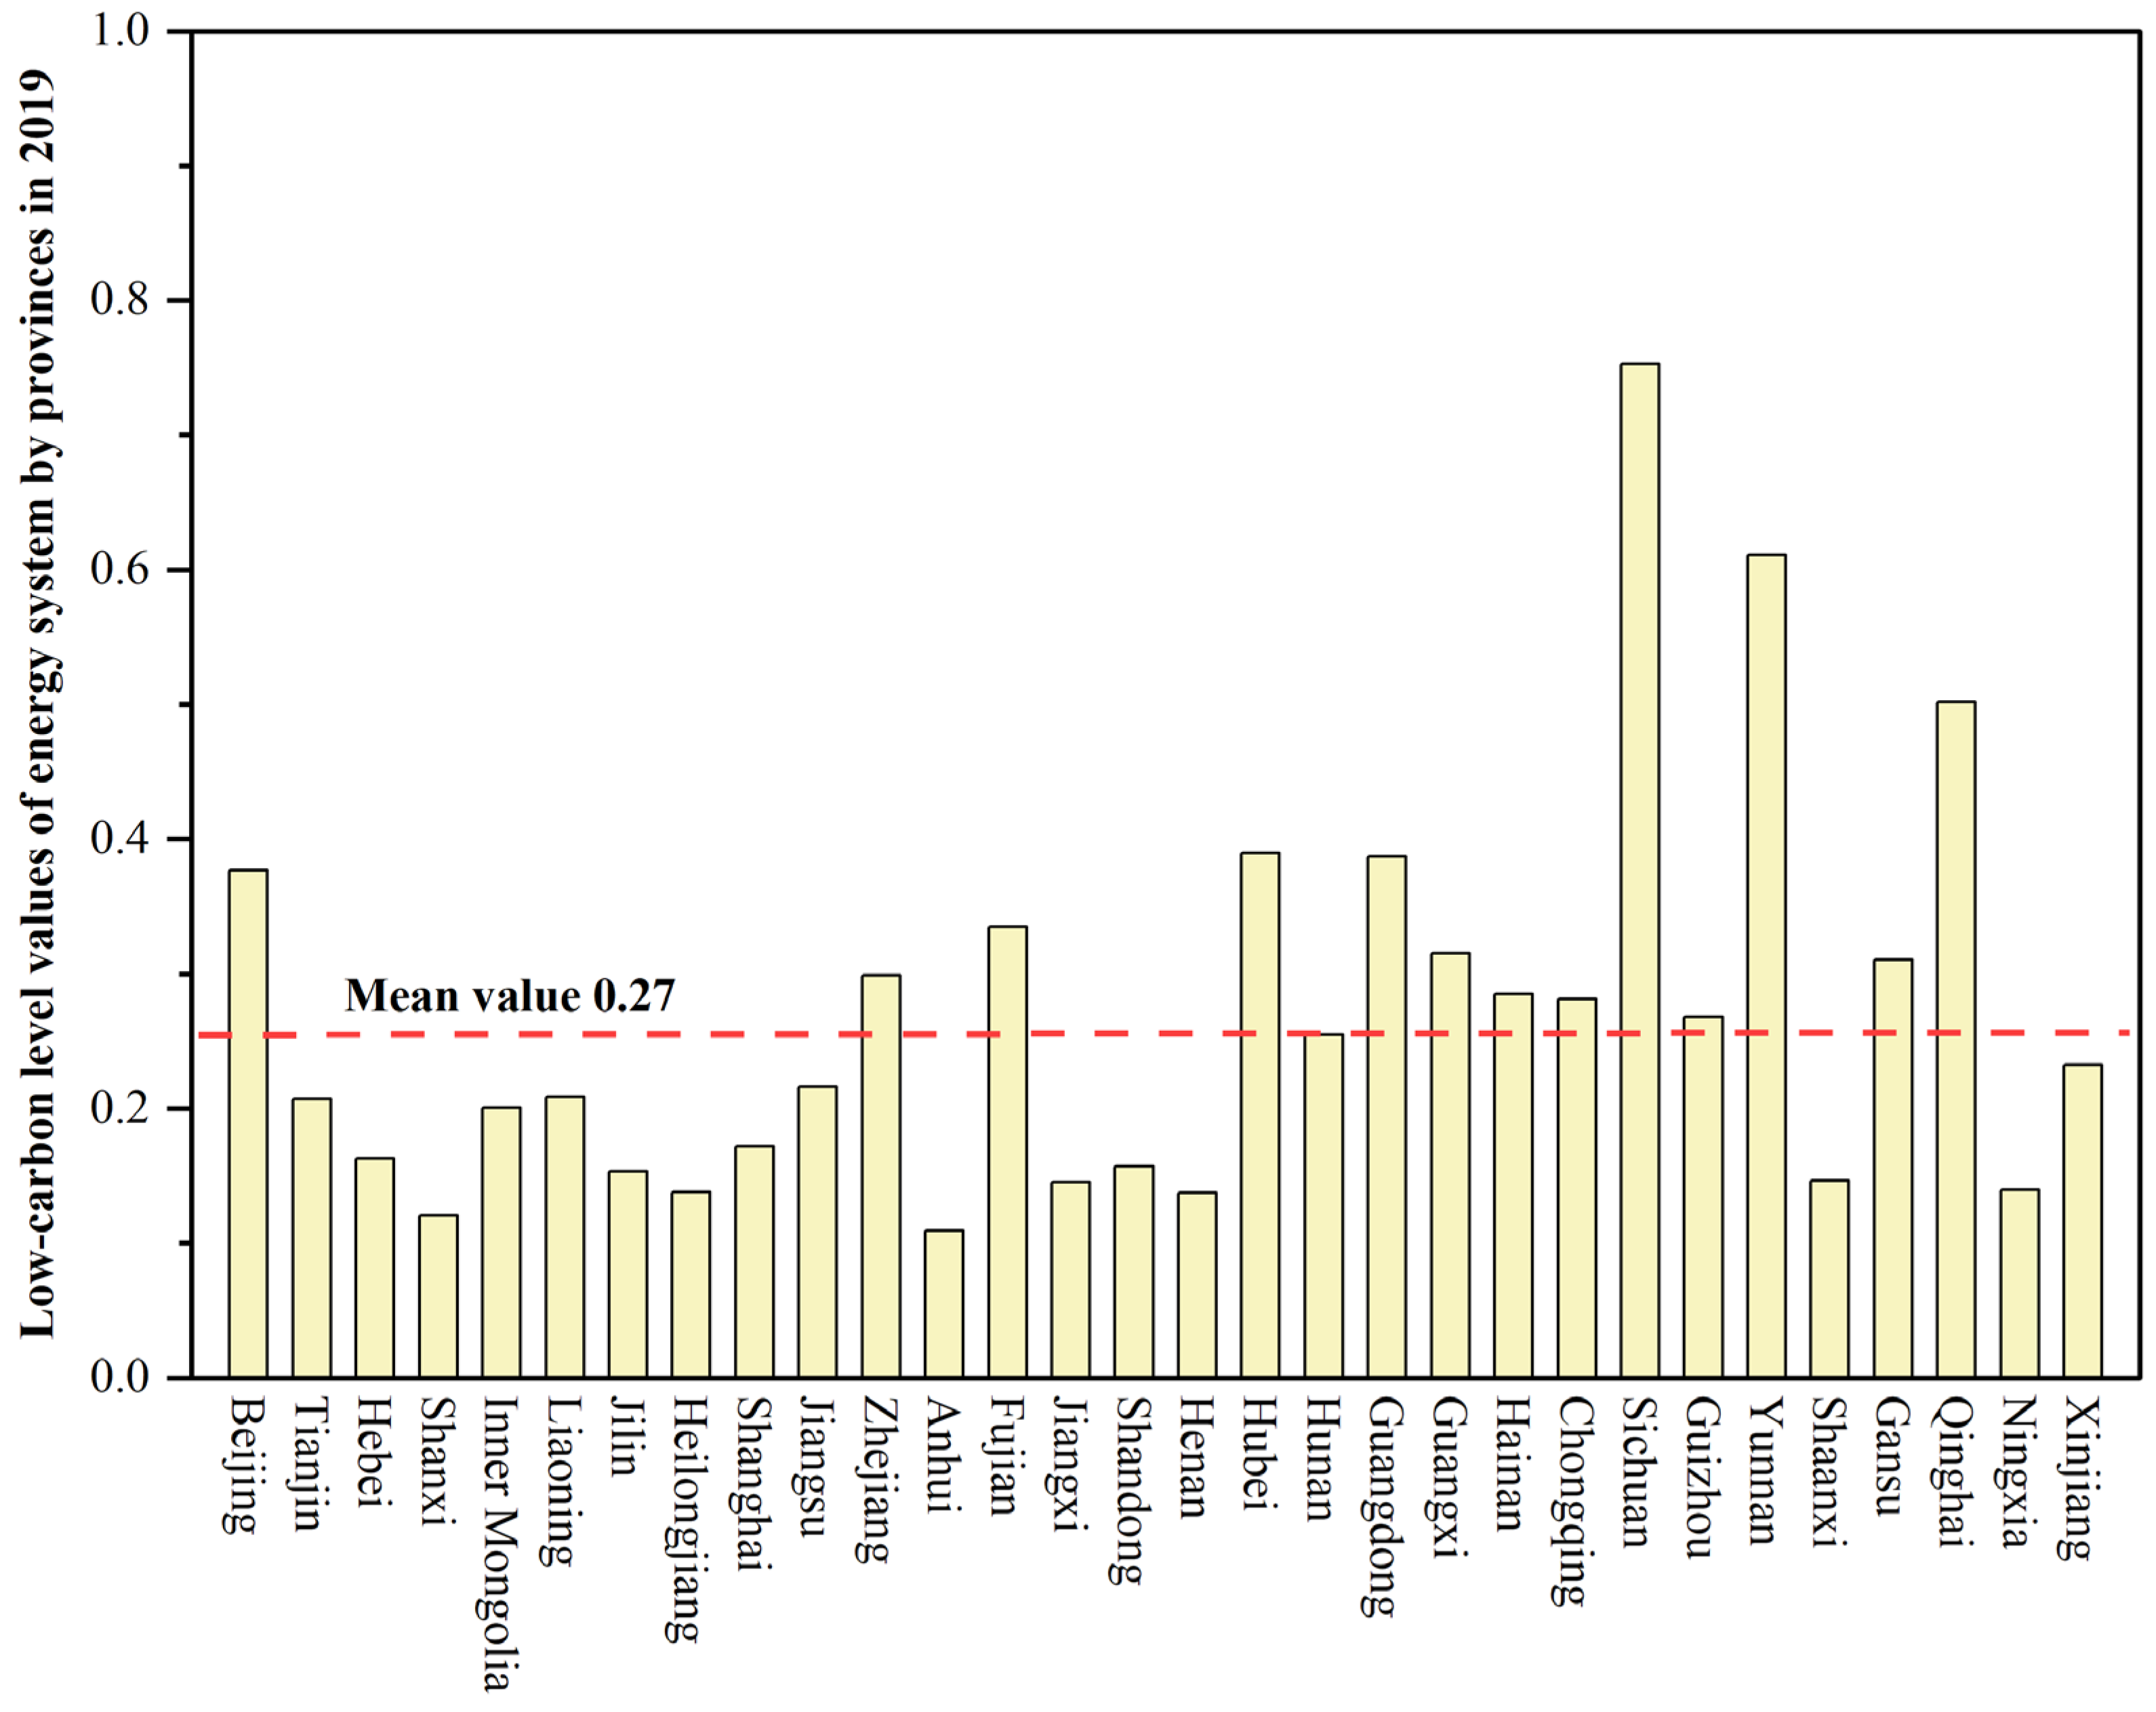
As shown in
Figure 3, in 2019, the top three provinces in terms of the low-carbon level of the energy system were Sichuan, Yunnan, and Qinghai. These three provinces were all major clean energy power generation provinces, whose clean power accounted for over 85% of the total in 2019. All three took hydropower as the main source of power generation while considering the development of wind power and photovoltaic power generation, forming wind–scenery–water complementarity. Although the total energy consumption of Sichuan and Yunnan was in the mid-range, they ranked low in terms of the energy consumption per unit of GDP, energy carbon intensity, and share of coal. The difference was that the share of carbon emissions from natural gas was higher in Sichuan and lower in Yunnan. Qinghai was at the bottom of the list in terms of its total energy consumption, energy consumption per capita, energy consumption per unit of GDP, energy carbon intensity, and share of coal consumption. In recent years, Qinghai has been vigorously developing clean energy, and its non-fossil energy resources have been developed and utilized on a large scale; it has become the first province in the country where new energy is the primary source of power generation. Although the total amount of clean energy generation in Qinghai was still in the upper mid-range, the high share of carbon emissions from natural gas and clean energy sources placed the overall energy system firmly in the top three with regard to low carbonization.
Anhui, Shanxi, and Ningxia were at the bottom of the LCES list. Specifically, the clean energy shares of all three provinces were at the lower end of the scale, with no more than 13% in 2019. The total amount of clean energy was mainly in the middle to lower reaches of the scales. The per capita energy consumption of Anhui was high, and other negative indices were in the upper–middle range, while the positive indices were at the bottom, resulting in a lower comprehensive level. As a coal-producing province, Shanxi had low per capita energy consumption and energy consumption per unit of GDP. However, the intensity of energy carbon emissions and share of coal consumption were among those of the top 30 provinces, and the proportion of natural gas carbon emissions was low. Although the total and per capita energy consumption of Ningxia were among the lowest of the 30 provinces, the proportion of coal consumption in terms of the energy carbon intensity was among the highest, and the total amount and proportion of clean energy were not high. The low-carbon levels of the three provinces mentioned above urgently need to be improved, primarily by increasing their clean energy production and usage ratios.
In summary, there are obvious differences in the LCES levels of the 30 provinces. Provinces with a high proportion of clean energy were mostly those with a high degree of low carbonization. The overall performance of provinces with high carbon emissions is at a low level and urgently needs to be improved.
3.2. Level of SES Development
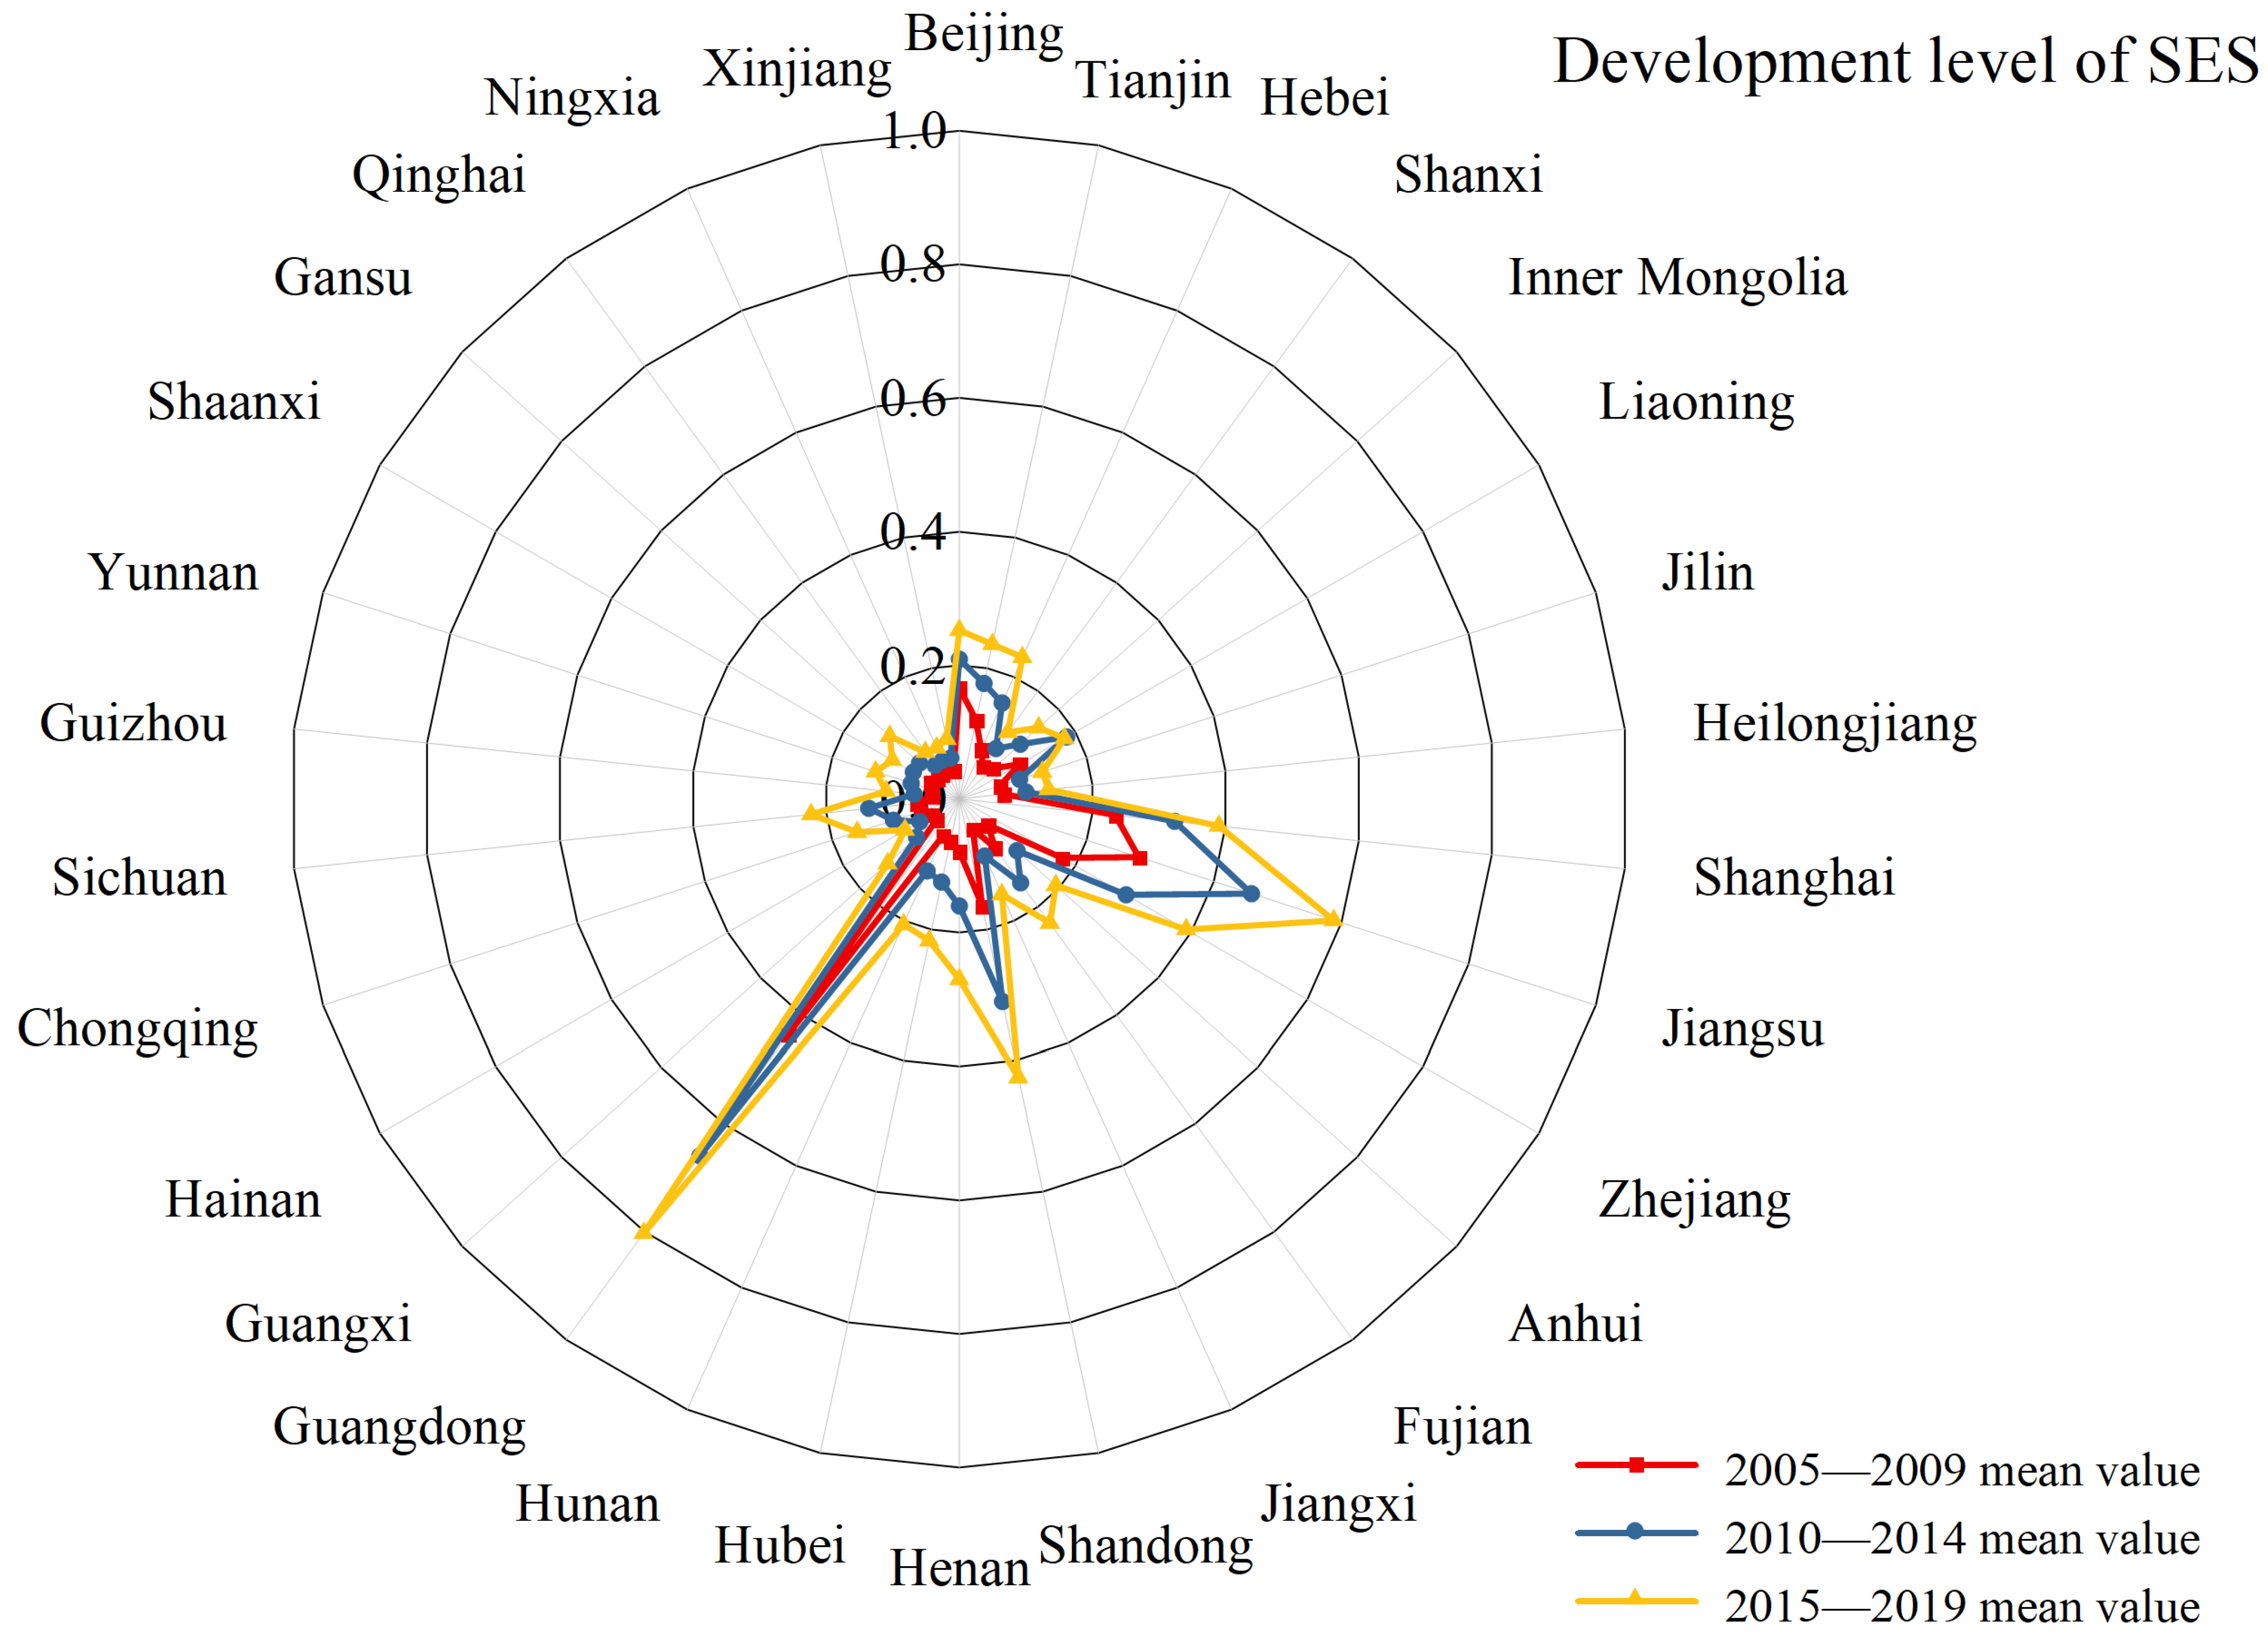
The results regarding the level of SES development by province are shown in
Figure 4. Growth was recorded in each five-year cycle, with the second five-year cycle generally showing slightly lower growth than the previous one. At the same time, regional differences in the level of SES were significant and uneven. Guangdong, Jiangsu, Shanghai, Zhejiang, and Shandong ranked among the top five in terms of economic development. Among them, Guangdong maintained first place during the study period, with an absolute advantage and with high rankings in all indices, especially in the GDP, import and export of goods, public revenue, and fixed asset investment, ranking first or within the top five of the 30 provinces.
As shown in
Figure 4, the level of SES development maintained a similar pattern over the study period. In particular, the overall level of development remained low, especially in the western provinces, where it was generally below 0.3. From 2005 to 2009, Guizhou, Yunnan, and Xinjiang had the lowest average levels of SES development. In the two subsequent five-year cycles, the three provinces with the lowest average values were Qinghai, Ningxia, and Xinjiang. Their development level was, at most, 0.1, representing a large gap compared with Guangdong and other provinces. Consequently, particular attention should be paid to the economic development of these three provinces in the future.
3.3. CCD of the Social Economy and Energy System
3.3.1. CCD of the Two Systems by Province
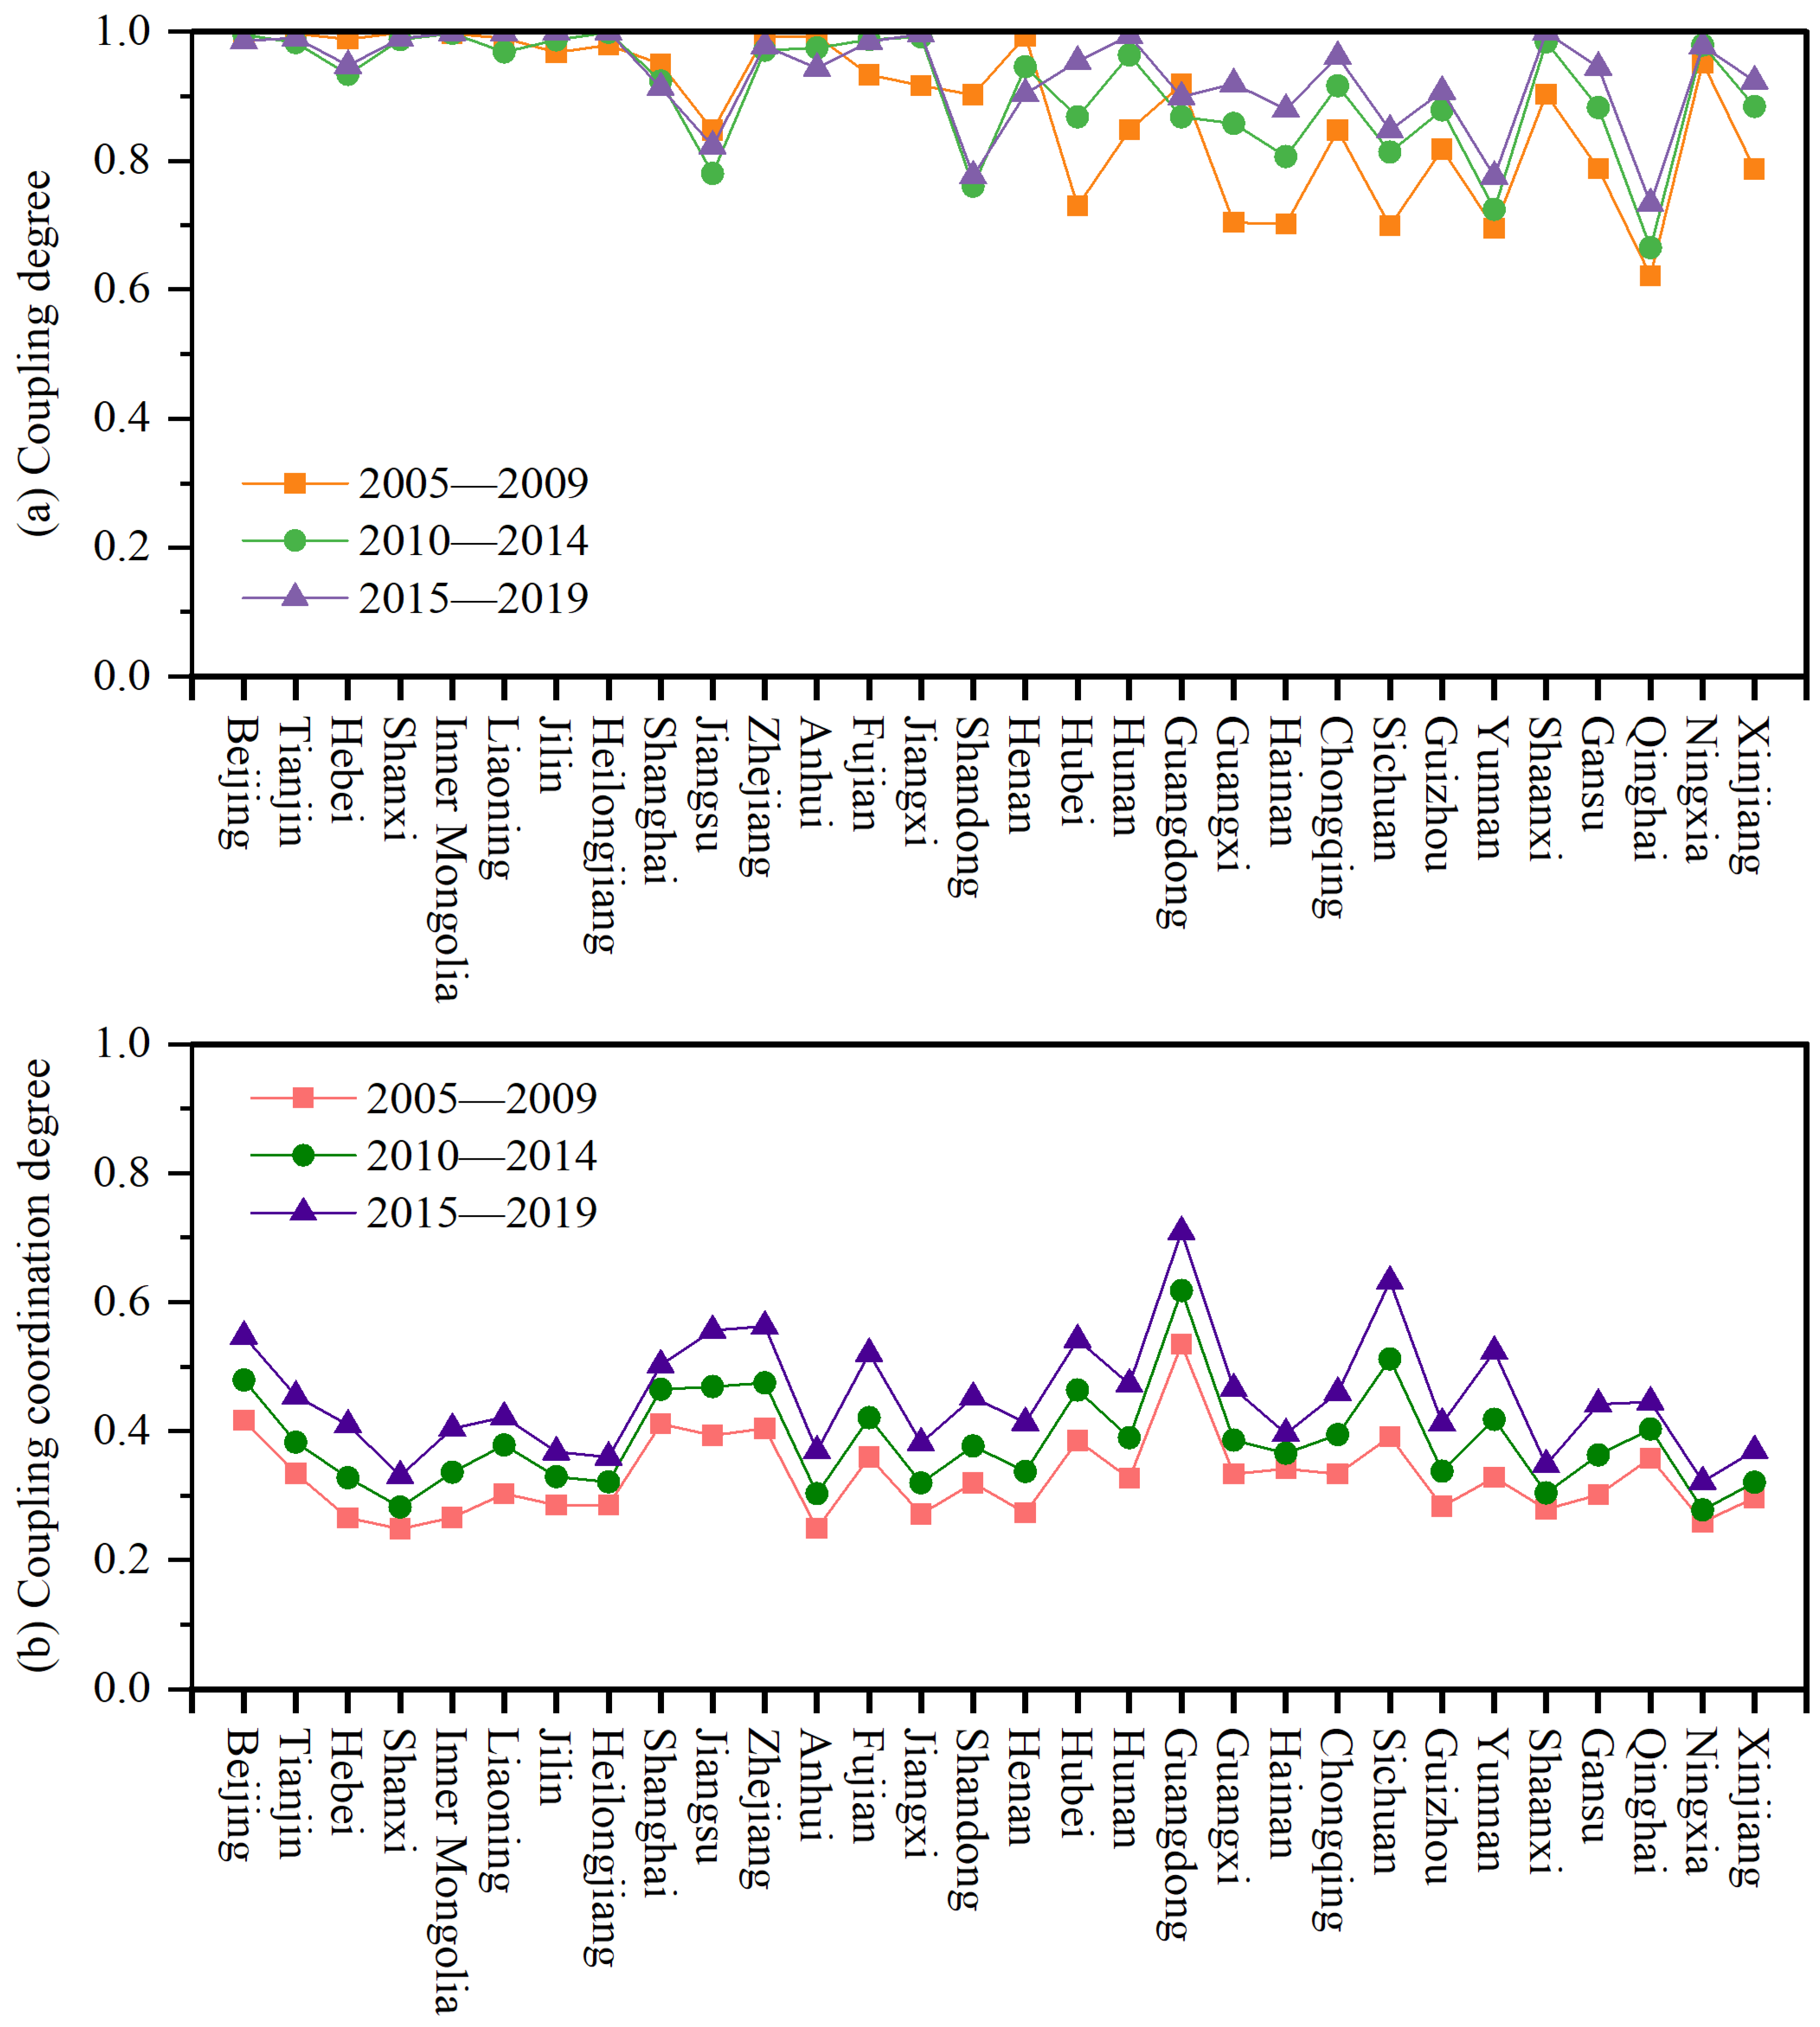
As shown in
Figure 5, the coupling results for the 30 provinces were in the range of 0.5955–0.9999. Despite the differences in the relationship between the two systems by province, the coupling levels were generally high (all above 0.5), with a medium–high coupling level, including running-in and high-level coupling.
From the perspective of the time series, the difference in the coupling degree between the provinces did not change fundamentally. Most provinces showed an increase in coupling over the study period, with slight decreases in Shandong, Shanghai, Henan, Jiangsu, and Hebei. After 2010, most provinces entered a high level of coupling. Most of the provinces with high levels of coupling belonged to the north, while the coupling of the western provinces was slightly lower. This result indicates that it is still a challenge for the less economically developed western provinces to make good use of their resource advantages to achieve the coupling of economic development and energy low-carbonization.
The coupling degree results show an obvious interaction between the LCES and the development of the SES. Through the CCD results, we further analyzed whether the coupling relationship between the two systems in each province was benign and sustainable and more comprehensively reflected the degree of correlation between the two systems.
As shown in
Figure 5 the mean values of the CCD for the 30 provinces over the 15-year study period ranged from 0.3 to 0.4 (moderate incoordination). However, all provinces showed an increasing trend. The CCDs of the two systems in the 30 provinces were different. Guangdong was at a leading level and its value was above 0.5 for a long time. The shift from basic coordination in 2005 to good coordination (after 2017) indicates that the economic and social development of Guangdong and the level of the LCES has been in effective coupled development for a long time. The most significant number of provinces—13 in total—were in the range of 0.4–0.5, indicating mild incoordination. Seven provinces had CCDs between 0.3 and 0.4, namely Shanxi, Jilin, Heilongjiang, Anhui, Shaanxi, Ningxia, and Xinjiang. These provinces were mainly regions with low levels of LCES and uneven economic development. There was a mismatch between low-carbon energy and economic development, and the two systems could not form a good interaction for coordinated development. After more than a decade of development, it changed from severe incoordination to moderate incoordination, and the overall trend was good. In the future, the government departments of each province should formulate corresponding development strategies according to the actual local situation and promote socioeconomic development and low-carbon energy to achieve a higher level of coupling and coordination.
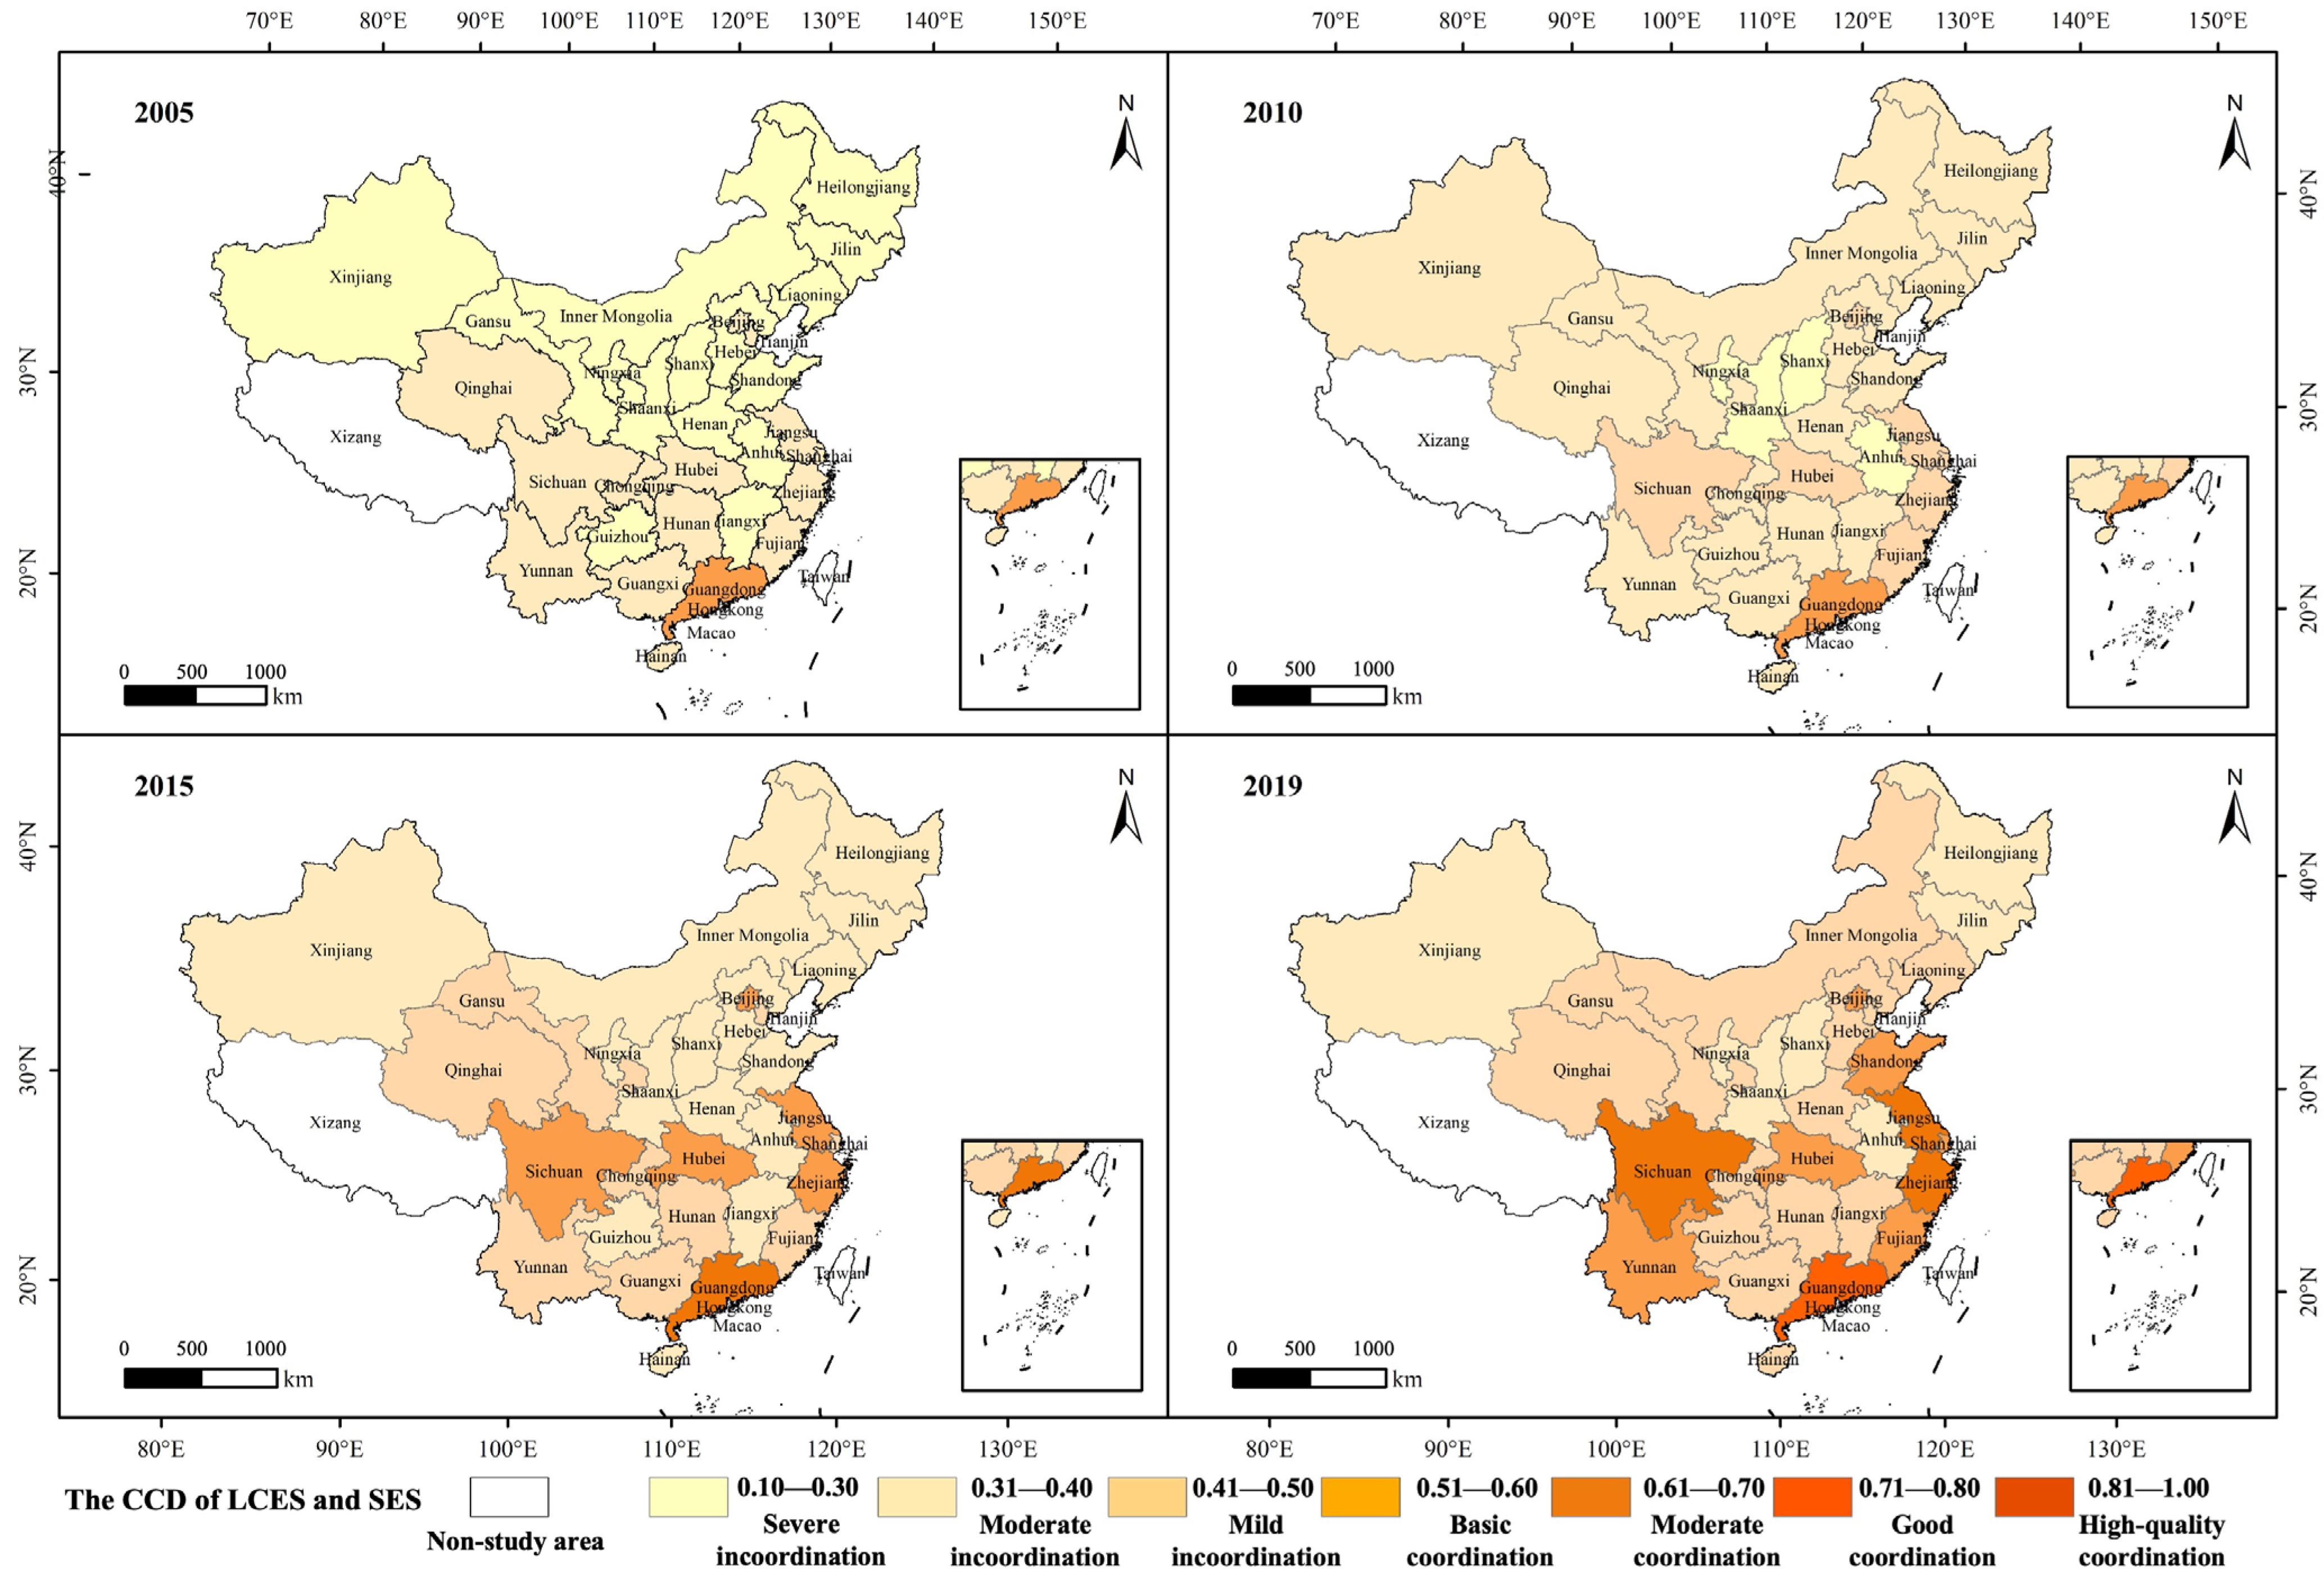
ArcGIS 10.8 was used to visually express the CCDs of socioeconomic development and the LCES in different years (
Figure 6). The CCD between the two systems varied more significantly, showing geographical differences. The level of the CCD in the eastern coastal areas was generally higher than that in the central western and northeastern provinces.
In 2005, only Guangdong achieved basic coordination between its systems, while 14 provinces had moderate incoordination, and the remaining 15, mainly in the north, had severe incoordination. From 2005 to 2010, Guangdong maintained basic coordination, but the value of its CCD increased. Beijing, Shanghai, Jiangsu, Zhejiang, Fujian, Hubei, and Sichuan achieved a shift from moderate incoordination to mild incoordination. Shanxi, Anhui, Shaanxi, and Ningxia remained at the level of severe incoordination. Clearly, the CCDs of economically developed regions changed rapidly, while the CCDs of energy-rich regions changed slowly. Between 2010 and 2015, the CCD of each province increased again, and there were no longer any provinces where the CCD indicated severe incoordination. From 2015 to 2019, the provincial CCD continued to improve, with seven provinces remaining at moderate incoordination and six provinces remaining at mild incoordination. Seven provinces, mainly in the country’s center, shifted from moderate incoordination to basic coordination.
3.3.2. CCD of Two Systems by Province
According to the criteria defined in
Table 2 and the research results, the CCD was divided into 10 types (
Table 4).
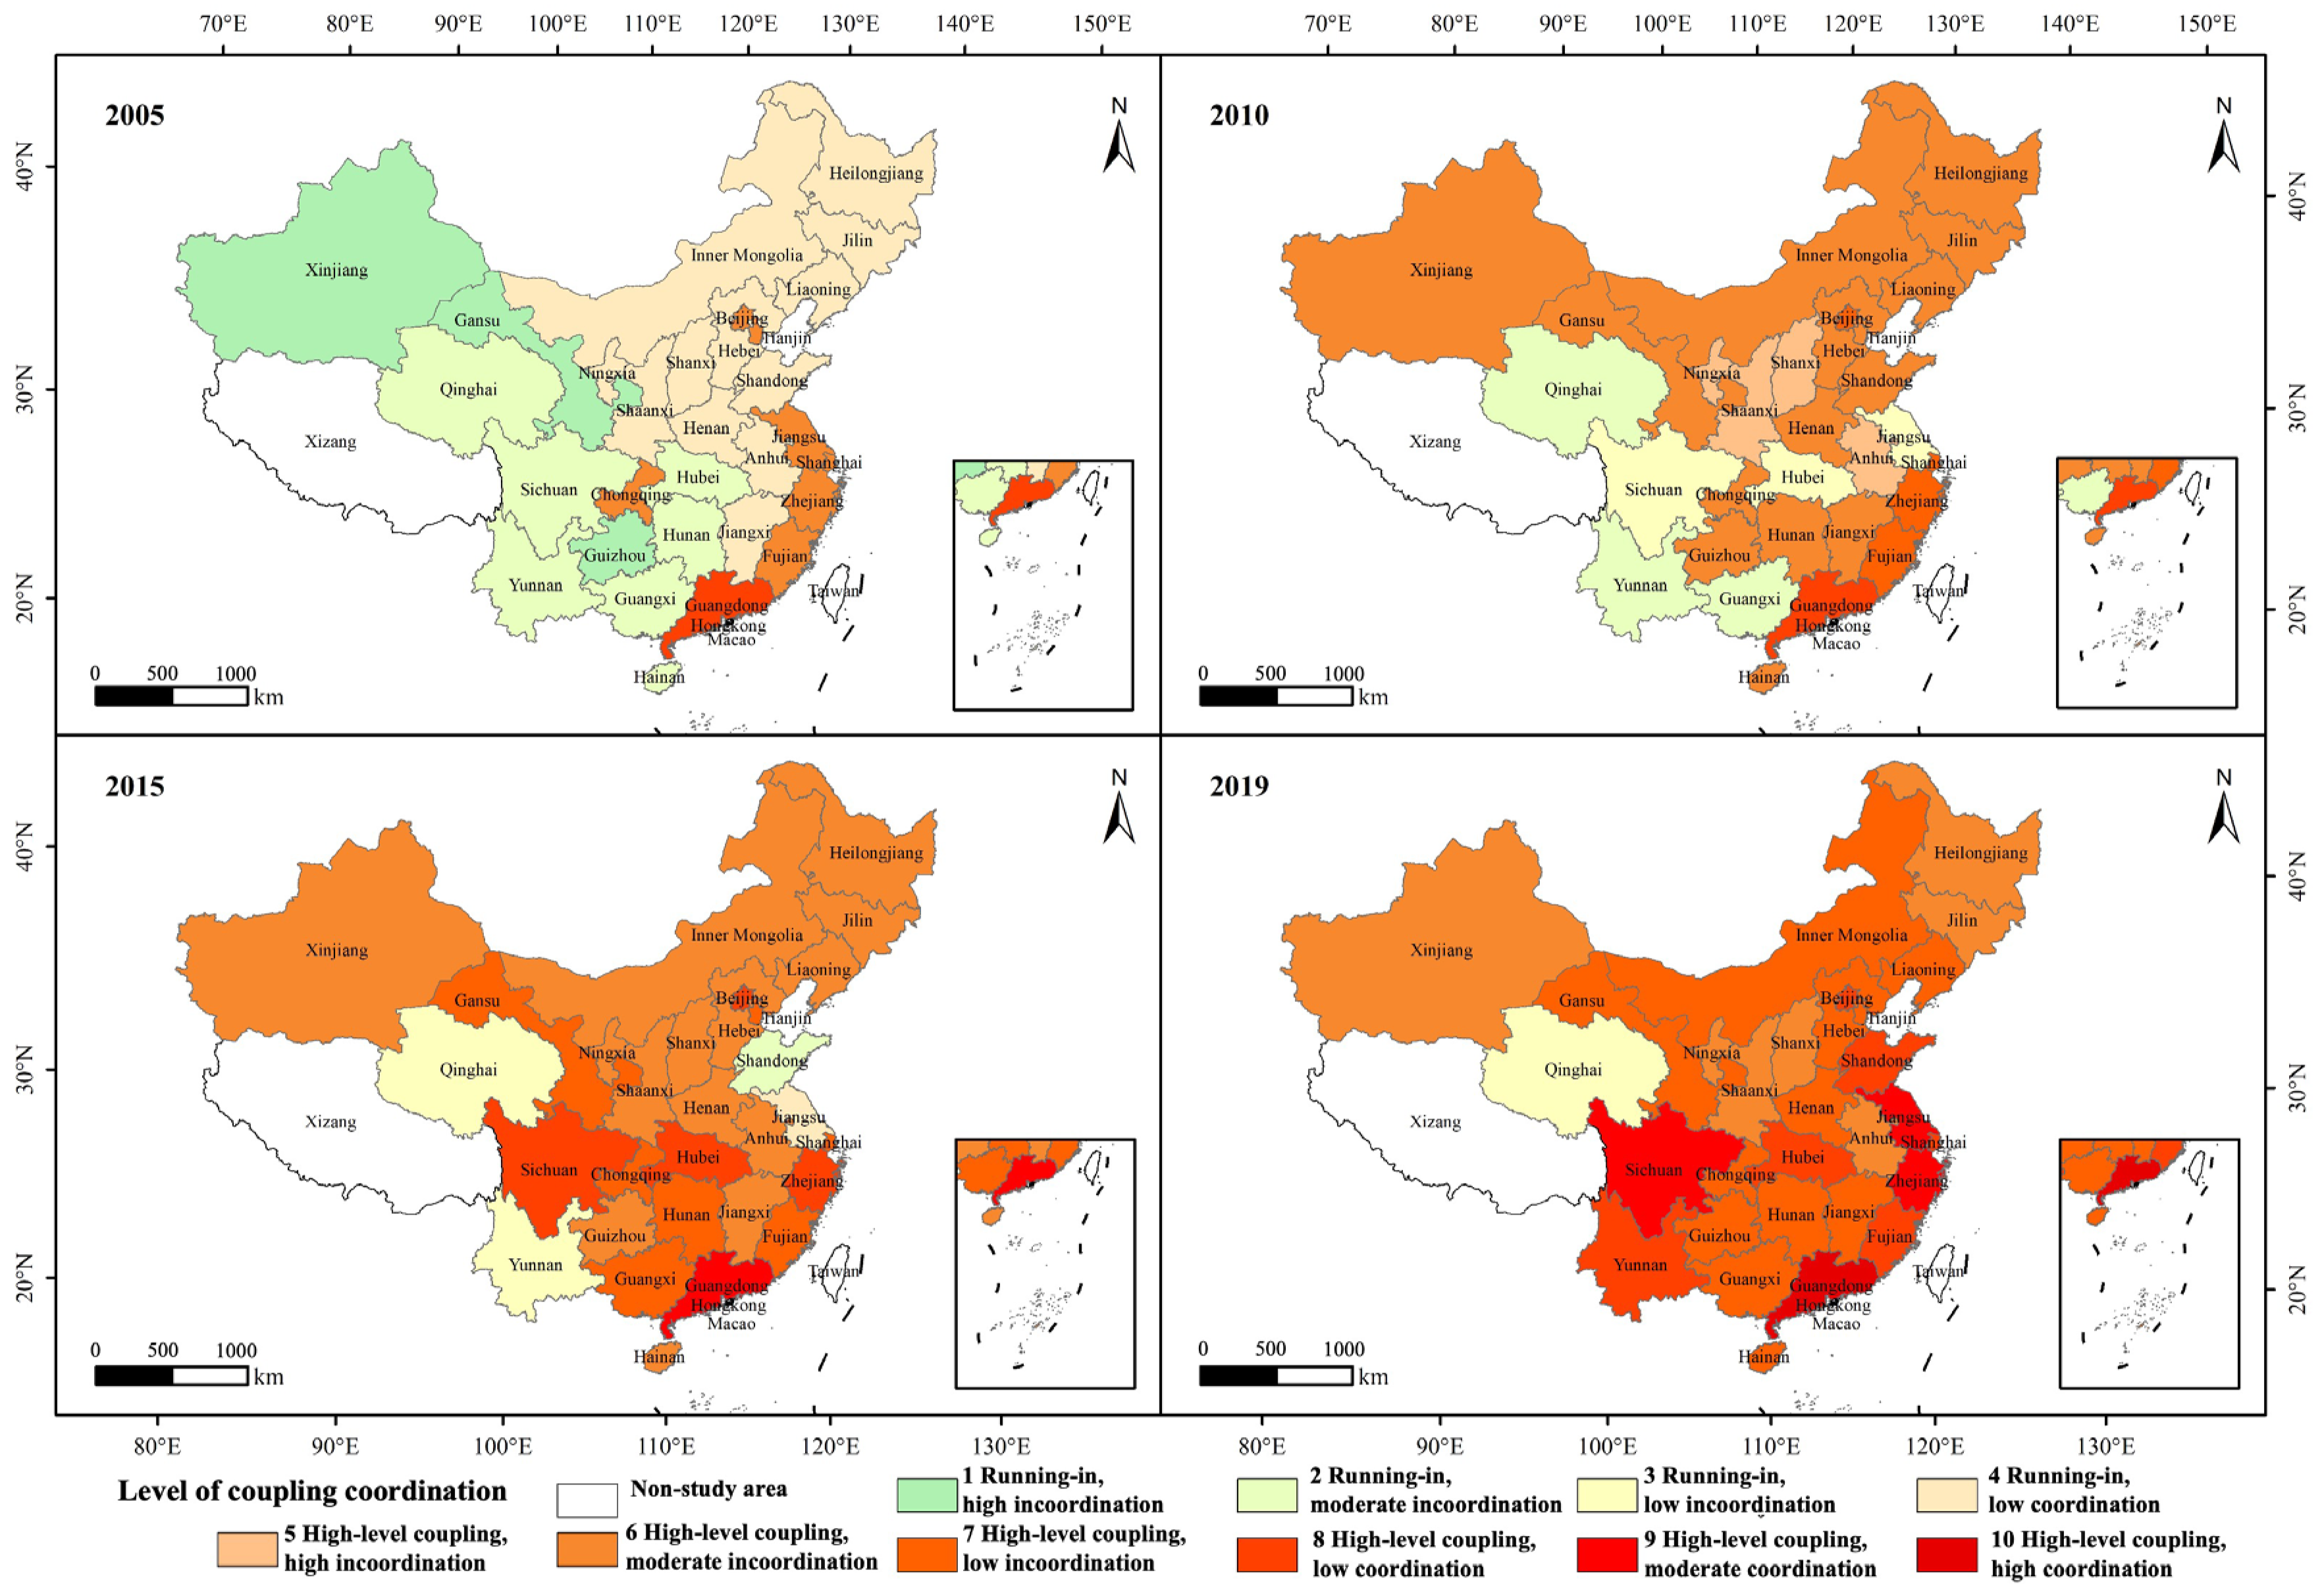
ArcGIS 10.8 was further used to create spatial distribution maps (
Figure 7). All provinces were moving toward a higher CCD, indicating that the interaction between the two systems had strengthened and was increasingly mutually reinforcing. In terms of time series, there were only five types of coupling coordination in 2005. Of the 12 provinces with the high-level coupling high-incoordination type, most were distributed in North China and Northeastern China. The second most prevalent types were running-in moderate incoordination and high-level coupling moderate incoordination, with seven provinces each, which were distributed in the southwestern and eastern coastal areas, respectively.
Based on the results of this study, combined with the prediction results of domestic scholars regarding the peak in carbon emissions, we posit that some provinces will still find it challenging to achieve the goal of peak carbon emissions by 2030. These provinces are mostly those with low CCDs, such as Tianjin, Qinghai, Shanxi, Inner Mongolia, Liaoning, Jilin, Shandong, Heilongjiang, Guangxi, Hainan, Shaanxi, Gansu, Ningxia, and Xinjiang.
3.4. Scenario Prediction Regarding Target of Carbon Intensity Reduction
The above research reveals that the CCD between the LCES and SES in China needs to be improved. According to the goal put forward in a guiding document on the country’s work to achieve carbon peaking and carbon neutrality goals under the new development philosophy, by 2030, the CO2 emissions per unit of GDP should be reduced by more than 65% compared with that in 2005. This study formulates multiple scenarios to analyze the feasibility of achieving the goal of reducing the carbon emission intensity by 2030.
3.4.1. Baseline Scenario Prediction Based on ARIMA
At the overall level of the 30 provinces, the annual increase in carbon emissions between 2020 and 2030 ranged from 2.30% to 3.97%, with an average annual increase of 3.10% (
Table 5). By 2030, the total carbon emissions would be 22.071 billion tons. The total GDP of the 30 provinces will increase by 4.80% to 6.16% in the forecast years, with an average annual increase of 5.43%, reaching CNY 145.40 trillion by 2030. For the per capita GDP to reach the level of a moderately developed country in 2035, the GDP will need to maintain a specific growth rate. The slowdown in GDP growth predicted in this study aligns with the expectation of the new development phase regarding the national GDP. According to the prediction results, the carbon emission intensity in 2030 will be 1.52 tons/CNY 10,000, a reduction of 59.19% from 2005 (3.72 tons/CNY 10,000). Therefore, without more specific carbon emission reduction measures, achieving the 2030 national-level carbon intensity reduction in the baseline scenario will be challenging, and so greater carbon emission reduction efforts are needed.
3.4.2. Multi-Scenario Prediction Based on Policy Constraints
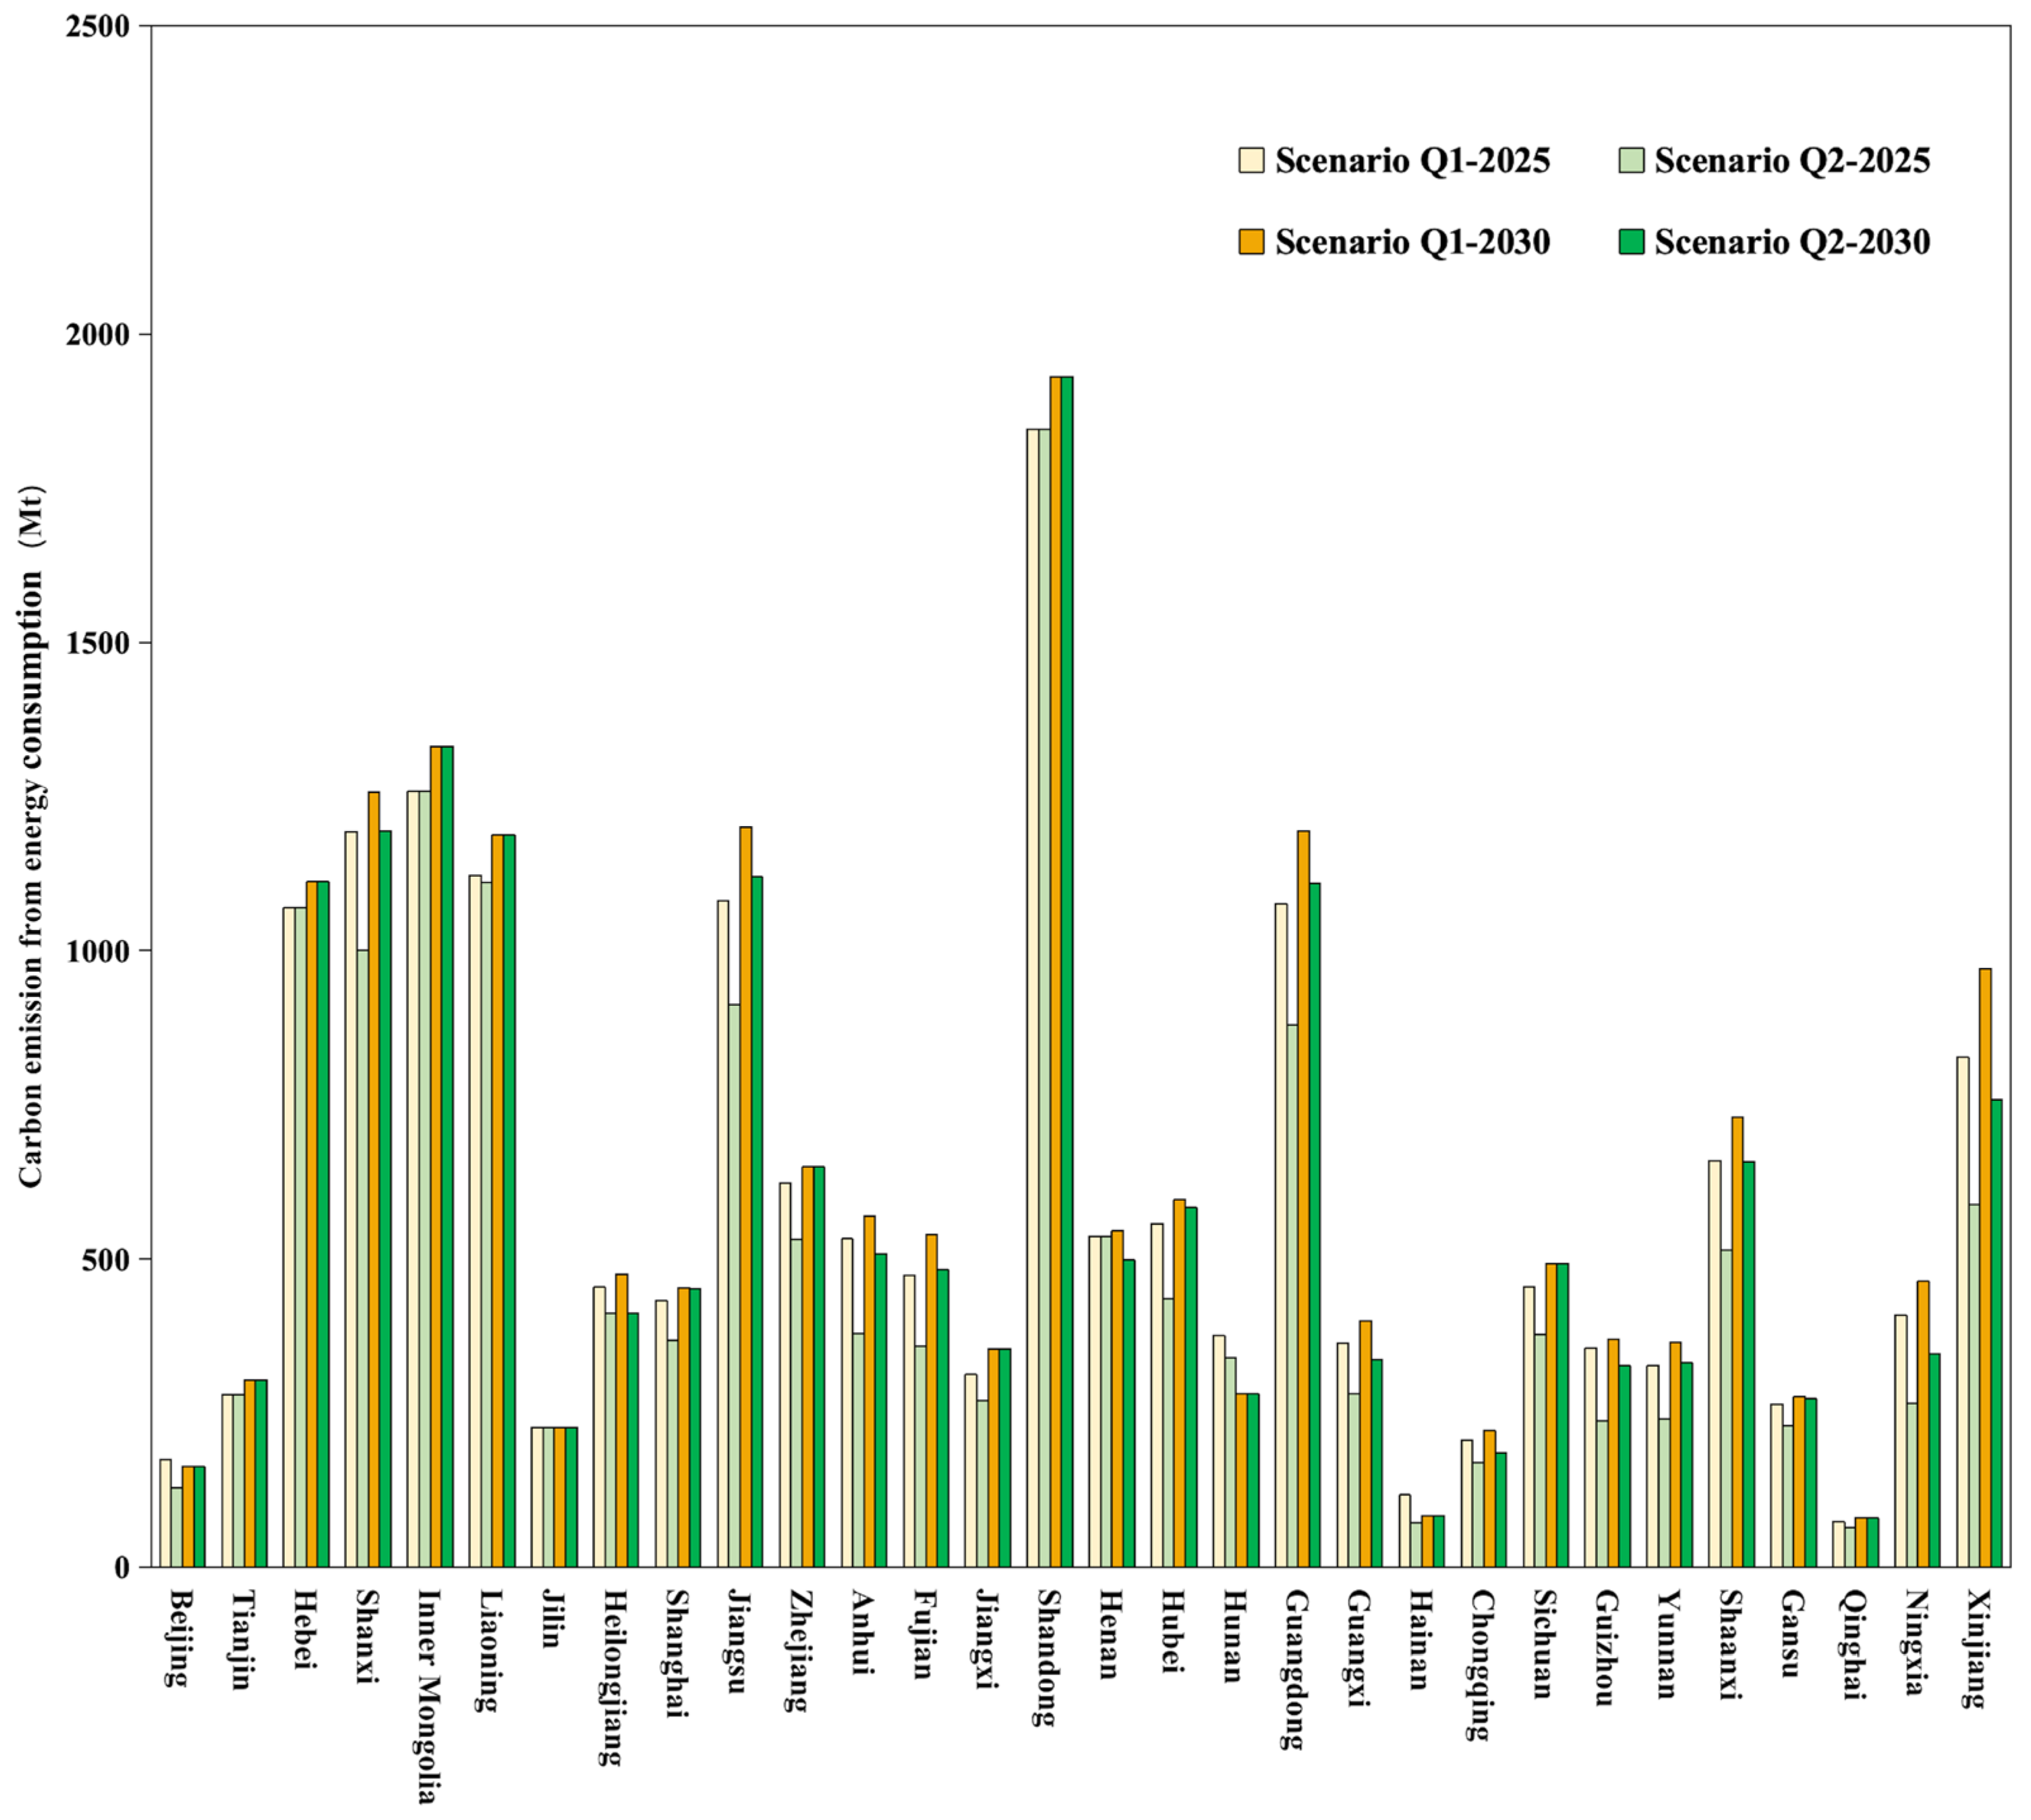
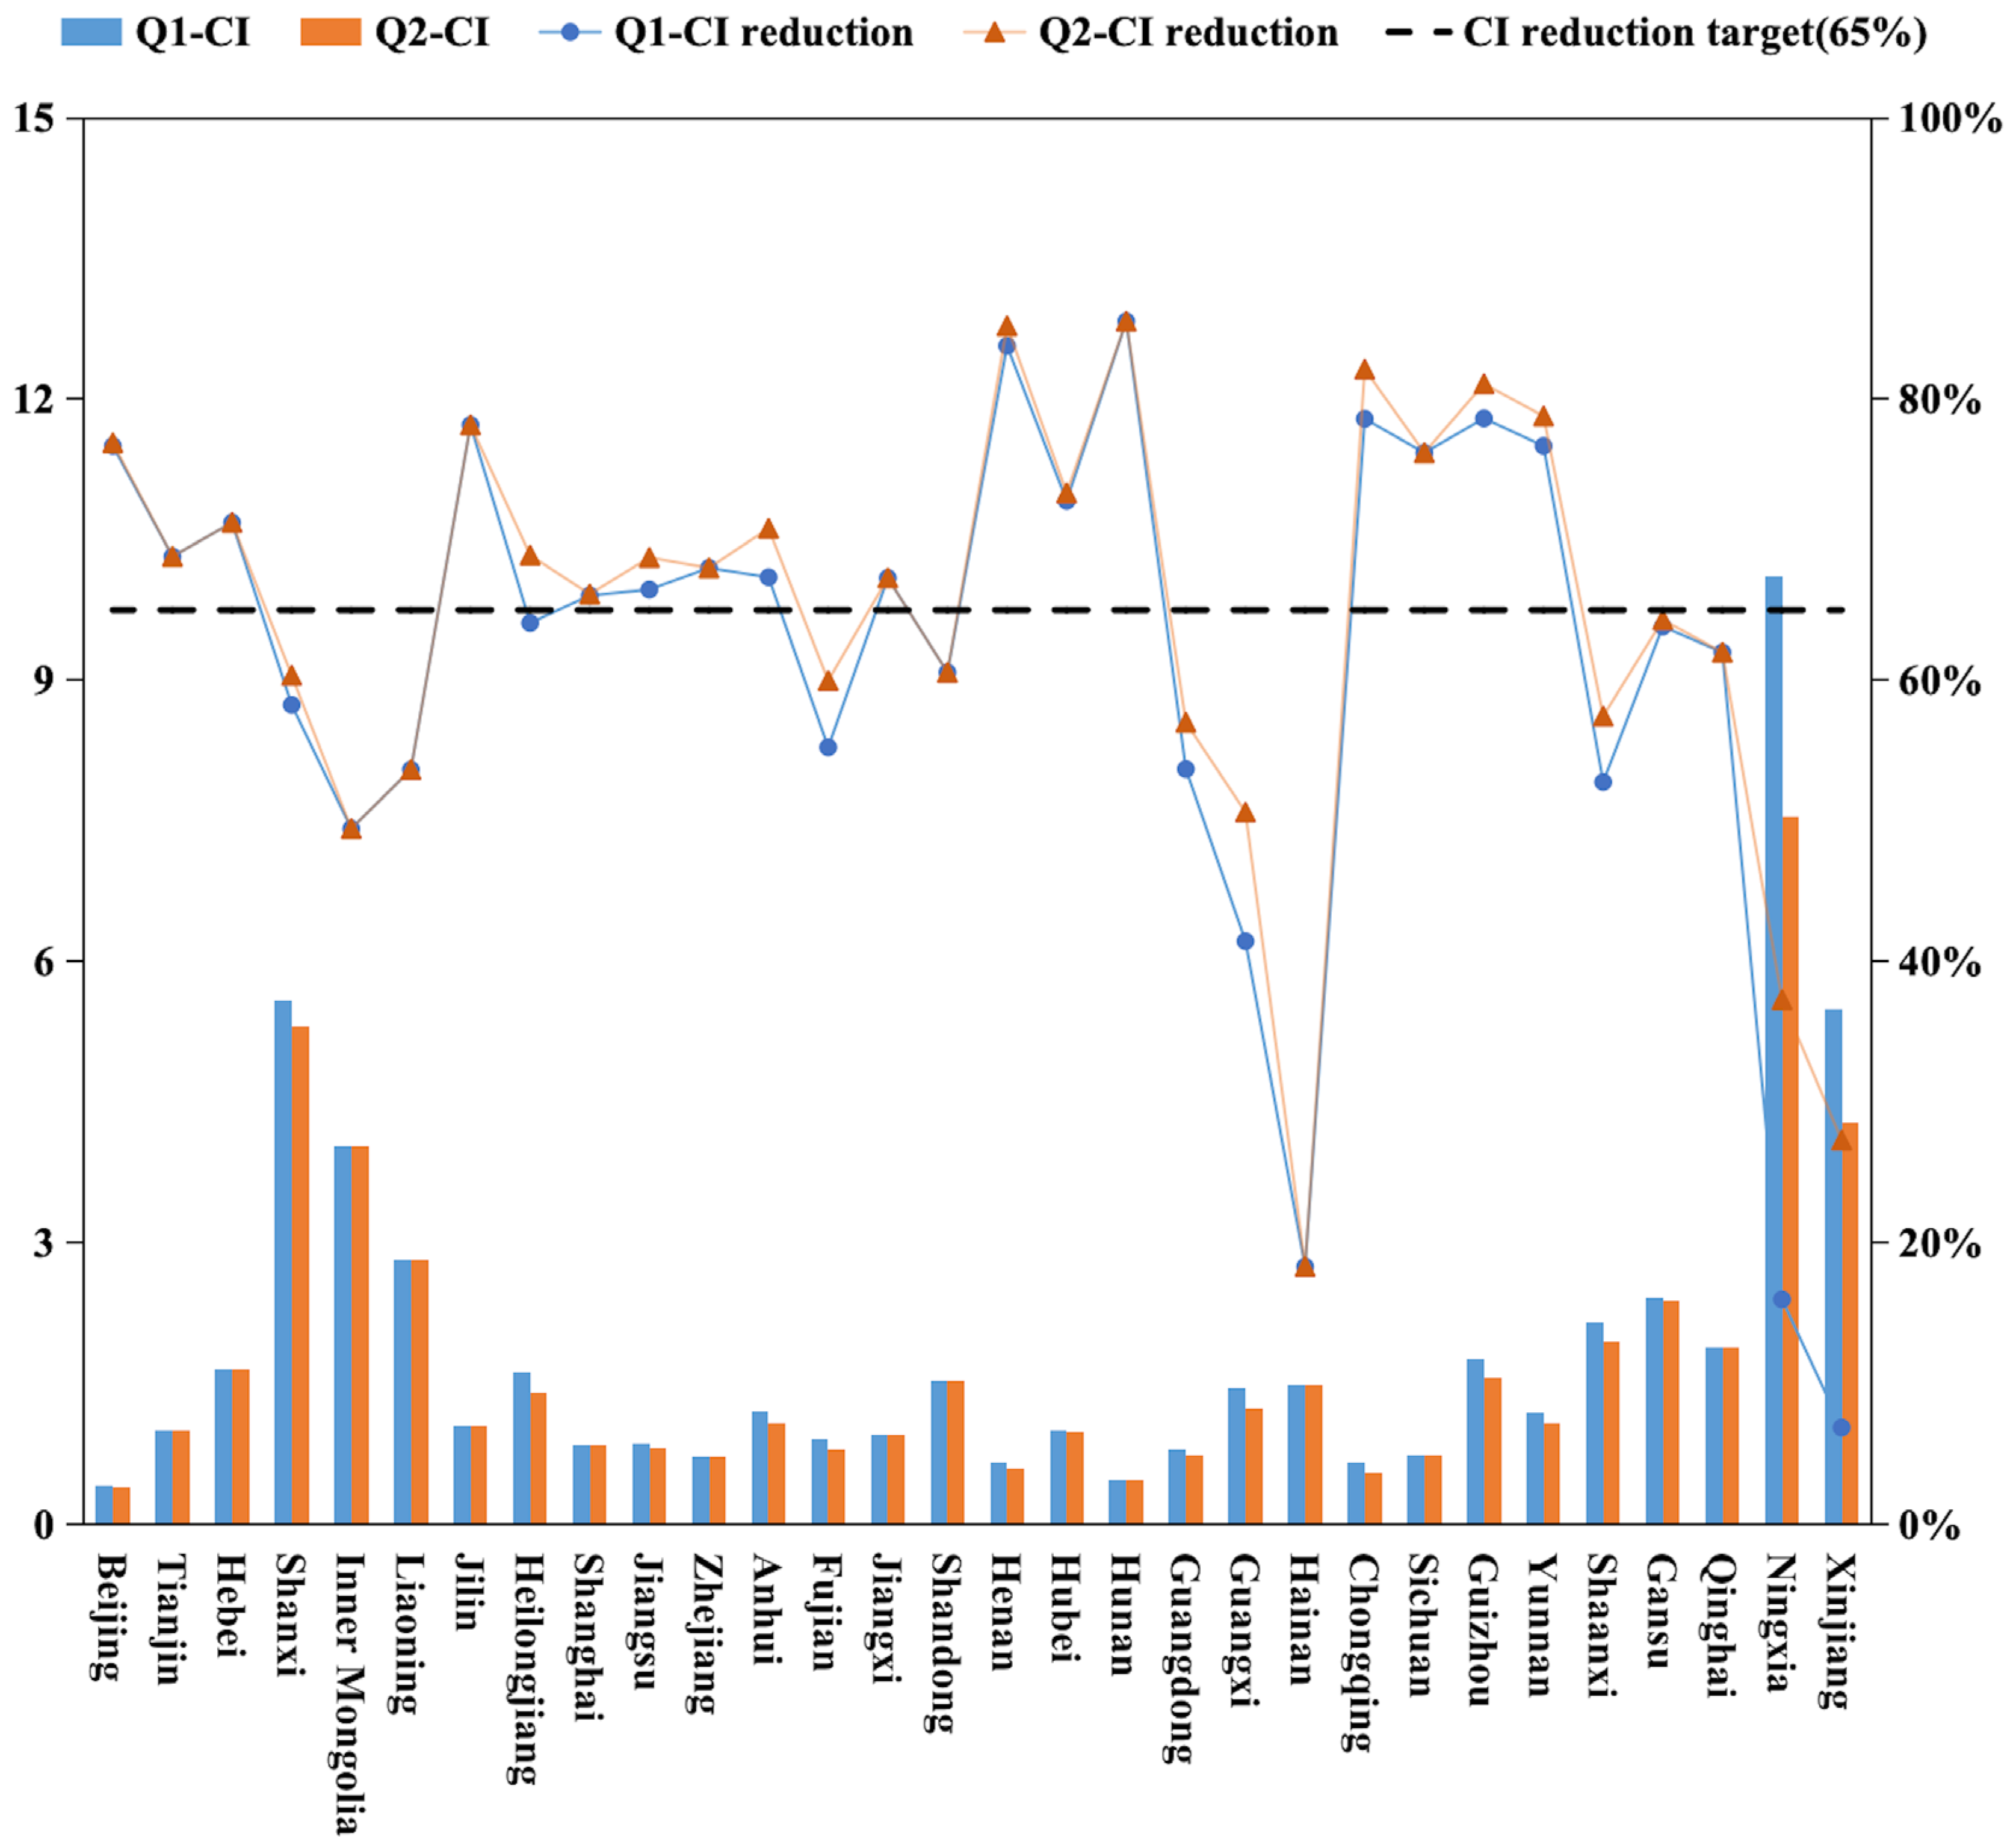
As shown in
Figure 8, the results indicate that, if all provinces can achieve the established non-fossil energy substitution policy targets (Scenario Q1), the average carbon emission intensity of the 30 provinces will decrease by 65.17% in 2030 compared with 2005, and the predetermined targets will be achieved. Specifically, the achievement of this target will be due to 17 provinces completing the reduction task, with Henan, Hunan, Chongqing, and other places exceeding the reduction target by more than 80%. However, 13 provinces still need to achieve the established reduction target.
Scenario Q2 is an enhanced constraint on Scenario Q1. As shown in
Figure 9, if all provinces can achieve the reduction in energy consumption intensity in 2025 and continue to maintain this reduction, the carbon emission intensities of the 30 provinces could be reduced by 67.13% in 2030 compared with those in 2005. Regarding the total carbon emissions, in Scenario Q2, it can be reduced by 2297.44 Mt in 2025 compared to Scenario Q1 and by 1056.75 Mt in 2030. In Scenario Q2, the number of provinces that achieve their carbon intensity targets is 18. Compared to Scenario Q1, Heilongjiang is able to achieve the target, and Shanxi achieves a decrease of more than 60%. Under the constraint of the energy consumption intensity, the reduction in the carbon emission intensity in Xinjiang and Ningxia increases significantly.
In addition, in the implementation plan for carbon peaking in each province, most provinces mentioned that the CO2 emissions target per unit of GDP in 2030 should be reduced by 65% or meet the national requirements. Meanwhile, Sichuan, Shanghai, Shandong, and other provinces put forward higher requirements for themselves. According to the predicted results of Scenarios 1 and 2, it will be difficult for Shandong to achieve a 68% reduction by 2030 and for Shanghai to achieve a 70% reduction target. Only the planned 70% reduction in Sichuan can be exceeded.
In summary, differences appear in the predicted achievement of this goal due to the different resource endowments and development conditions of the provinces. According to this study’s results, achieving the carbon intensity target requires comprehensive cooperation across the country, especially when multiple provinces exceed their targets, to mitigate the difficulties faced by some provinces in achieving their targets.
4. Discussion
4.1. “Unlimited Wind and Light”: Promoting Low-Carbon and Cleaner Energy Sources
The calculation results show that the proportion of clean energy has a more significant impact on the development level of the LCES. Achieving carbon neutrality requires constructing a green power system primarily based on renewable energy sources [
28]. In recent years, China has been actively developing clean energy to reduce its dependence on fossil fuels [
29]. Photovoltaic power generation and onshore wind power in most provinces can already compete with newly built coal-fired power generation. Achieving low-carbon energy transformation and ensuring energy security go hand in hand. Places such as Qinghai and Inner Mongolia are fertile lands characterized by “unlimited light and wind”, and the proper utilization of renewable energy resources can also help to improve the security of the energy system. In terms of offshore wind power, for example, China has become the nation with the largest total installed wind power capacity in the world. Driven by technological advancements, the cumulative installed capacity of offshore wind power in China increased from 0.67 GW in 2014 to 9.39 GW in 2020 [
30]. Coastal areas are densely populated, with high economic levels and high electricity demands. Their unique geographical locations provide favorable conditions for the development of offshore wind power [
31]. According to the LCA accounting for the first phase of the Xinghua Bay offshore wind farm, the carbon emissions during the construction phase accounted for about half of the entire lifecycle GHG emissions of the wind farm. Moreover, recycling some equipment at the end of its service life can reduce carbon emissions. Compared to coal-fired power, this project can reduce energy consumption by 6.46 × 10
10 MJ and GHG emissions by 5.37 × 10
6 t CO
2-eq [
32]. Offshore wind undoubtedly offers a cleaner, low-carbon, and promising option for power supply and is a key path for China’s green power transition. To achieve carbon emission reduction, we should pay attention to the construction stage of offshore wind farms, accelerate the cooperation pace of the offshore wind power industry, and promote the upgrading of the entire wind power industry chain [
33].
4.2. Enclave Cooperation: Providing Pairing Assistance to Achieve a Low-Carbon Economy
According to the predicted results, it is unreasonable to require each province to achieve the same intensity reduction targets as the country. A significant gap exists in the carbon emissions, socioeconomic development levels, and LCES levels among the four major regions of China. The responsibility for emission reduction should also follow the principle of “common but differentiated”. In particular, the fact that the western region is facing an outstanding contradiction between economic development and carbon emission reduction should not be overlooked.
The “enclave economy” is a regional economic development model that breaks through regional restrictions and achieves a mutual benefit and win–win results through the complementary advantages of “flying out” and “flying in”. Taking Qinghai as an example, substantial clean electricity can be exported to provide favorable economic growth. On the one hand, major economically developed provinces such as Jiangsu, Zhejiang, and Shandong should invest more funds in low-carbon energy development to guide the transformation and upgrading of high-energy-consuming industries. On the other hand, we can also use clean energy from Qinghai and other regions to adjust the energy consumption structure toward low-carbon transformation. Electricity is the primary form of energy consumed by the information and communication industry. Provinces can promote resource allocation, increase the use of renewable energy, and promote the green and low-carbon development of data centers by constructing enclave economic parks.
4.3. Acting According to Local Conditions: Fostering Regional Synergy and Differentiated Development
The prediction results regarding the accessibility of the carbon intensity reduction target confirm that, if it is allocated and controlled according to the national balanced carbon intensity reduction target, some provinces will not be able to achieve the target according to the baseline scenario prediction. Therefore, different regions should adopt differentiated strategies according to the local conditions.
The 14 provinces that will fail to reach the target can be divided into four categories. The first category includes Hainan, Ningxia, and Xinjiang. This category has difficulty in achieving the carbon intensity reduction target under the baseline scenario and requires focused assistance and policy support. The second category includes economically strong provinces such as Guangdong, Shandong, and Fujian. These provinces should seize the opportunity provided by the new energy industry track. The third category comprises Shanxi, Inner Mongolia, Liaoning, and Shaanxi, provinces with abundant coal resources and a medium-level economy. Promoting energy transformation and controlling coal consumption in key industries are priorities. The fourth category consists of Heilongjiang, Guangxi, Gansu, and Qinghai, which should apply the “1 + N” policy system well and take multiple measures simultaneously. In addition to their efforts, these provinces must pay more attention to regional synergy development.
4.4. Limitations
This study has some limitations, primarily attributable to the limitations in data collection and research methods. First, due to the limitations in the collection of energy-related data, some areas in China were not included in the study. In the future, with the enrichment of and improvements in statistical data, Southwest China and the Guangdong–Hong Kong–Macao Greater Bay Area can also be included in such studies. Second, the strategies presented in this study primarily focus on general principles. Data from specific areas will be collected and analyzed to give more targeted recommendations. Finally, to enhance the reliability and accuracy of the data, a sensitivity analysis will be conducted on the evaluation system and policy scenarios in the future.
5. Conclusions and Implications
This study used the entropy-weighted TOPSIS method and the coupling coordination model to explore the coupling degree and CCD of the LCES and SES. A multi-scenario prediction was also set up to analyze the accessibility of the carbon intensity reduction targets for 2030. The main conclusions of this study are as follows. (1) The level of the LCES had improved to varying degrees in all provinces, although there were significant differences among provinces. Provinces with high levels of LCES, such as Sichuan, Yunnan, and Qinghai, had a large proportion of clean energy. Provinces with high carbon emissions, such as Shandong, Shanxi, and Anhui, need to improve the levels of their LCES. (2) The coupling degrees of 30 provinces were in the range of 0.5955–0.9999, which is generally high. Moreover, the trend of differences had not changed fundamentally, belonging to the running-in high-level coupling stage. The average CCD was between 0.3 and 0.4 (moderate incoordination), and each province showed an increasing trend with significant changes. The CCD in eastern coastal areas was higher than that in the central–western areas and northeastern areas, especially in Guangdong, which was far ahead and has been in effective coupling development for a long time. (3) Overall, the CCDs among the provinces are developing toward a higher level. The interaction between the two systems has intensified and is becoming increasingly mutually reinforcing. In 2019, only Qinghai was in the running-in low-incoordination stage, while the rest of the provinces exhibited high-level coupling with varying degrees of coordination. (4) In the baseline scenario, reaching the carbon intensity reduction target by 2030 would be challenging. However, the target is expected to be achieved under two scenarios in which the policy constraint targets of the provinces are reached. This outcome is due to multiple provinces exceeding their target levels and supplementing some lagging provinces.
Based on the above conclusions, this study proposes differentiated low-carbon development and synergy emission reduction strategies.
First, from a policy perspective, when formulating regional collaborative emission reduction plans, it is essential to consider the characteristics of the LCES and SES, as well as the development levels of different regions. Adhering to the principle of “common but differentiated” can ensure that policies are region-specific and effective. Regarding the “enclave cooperation” model, governments should play a guiding role. They should encourage economically developed regions to pair-assist underdeveloped regions. For the construction of “enclave economy” parks, inter-regional government cooperation in investment attraction and the joint provision of preferential policies are necessary. Regular consultations should be institutionalized to promptly address any emerging issues. These policy-driven measures can facilitate resource allocation and promote coordinated regional development.
Second, in terms of economic feasibility, various regions should increase their investments in the research and development of new energy storage systems. By formulating special development plans, regions can promote the commercialization of energy storage technologies. Constructing energy storage systems in a multi-scenario and diversified manner, with a focus on compatibility with new power systems, can bring long-term economic benefits. Additionally, the establishment of “enclave economic” parks can optimize resource deployment, increase the utilization of renewable energy, and promote the green and low-carbon development of data centers. This not only reduces the long-term energy costs but also stimulates economic growth in underdeveloped regions through industrial agglomeration.
Finally, regarding energy equity, the “enclave cooperation” model can significantly contribute. By promoting paired assistance between developed and underdeveloped regions, it helps to narrow the energy gap. The joint establishment of “enclave economic” parks ensures the more equitable distribution of energy resources, allowing underdeveloped regions greater access to renewable energy. This enables underdeveloped regions to leapfrog into a more sustainable future, ensuring that the benefits of the energy transition are shared more equitably across society.
