Article

Research on the Development Mechanism of Air Thermal Miscible Flooding in the High Water Cut Stage of Medium to High Permeability Light Oil Reservoirs

1
Tarim Oilfield Company, PetroChina, Korla 841000, China
2
R&D Center for Ultra-Deep Complex Reservoir Exploration and Development, China National Petroleum Corporation, Korla 841000, China
3
School of Energy Resources, China University of Geosciences (Beijing), Beijing 100083, China
4
National Key Laboratory of Enhanced Oil and Gas Recovery, Beijing 100083, China
5
PetroChina Research Institute of Petroleum Exploration & Development, Beijing 100083, China
*
Authors to whom correspondence should be addressed.
Energies 2025, 18(11), 2783; https://doi.org/10.3390/en18112783
Submission received: 28 April 2025 / Revised: 20 May 2025 / Accepted: 22 May 2025 / Published: 27 May 2025

Abstract

Currently, the development of oil reservoirs with high water cut faces numerous challenges, including poor economic efficiency, difficulties in residual oil recovery, and a lack of effective development technologies. In light of these issues, this paper conducts research on gas drive development during the high water cut stage in middle–high permeability reservoirs and introduces an innovative technical approach for air thermal miscible flooding. In this study, the Enhanced Oil Recovery (EOR) mechanism and the dynamic characteristics of thermal miscible flooding were investigated through laboratory experiments and numerical simulations. The N2 and CO2 flooding experiments indicate that gas channeling is likely to occur when miscible flooding cannot be achieved, due to the smaller gas–water mobility ratio compared to the gas–oil mobility ratio during the high water cut stage. Consequently, the enhanced recovery efficiency of N2 and CO2 flooding is limited. The experiment on air thermal miscible flooding demonstrates that under conditions of high water content, this method can form a stable high-temperature thermal oxidation front. The high temperature, generated by the thermal oxidation front, promotes the miscibility of flue gas and crude oil, effectively inhibiting gas flow, preventing gas channeling, and significantly enhancing oil recovery. Numerical simulations indicate that the production stage of air hot miscible flooding in reservoirs with middle–high permeability and high water cut can be divided into three phases: pressurization and drainage response, high efficiency and stable production with a low air–oil ratio, and low efficiency production with a high air–oil ratio. These phases can enable efficient development during the high water cut stage in medium to high permeability reservoirs, with the theoretical EOR range expected to exceed 30%.

1. Introduction

The non-marine reservoir, with its complex geological conditions, poses significant development challenges. After decades of exploitation, most continental middle–high permeability oilfields have reached a stage characterized by ultra-high water cuts and ultra-high recovery ratios, presenting considerable challenges for maintaining stable production and further enhancing recovery efficiency. In the high water cut stage, middle–high permeability reservoirs still contain a significant amount of recoverable oil, indicating great development potential [1]. However, several challenges persist in the development of these reservoirs, including high water cuts, numerous flow channels, scattered residual oil distribution, and the difficulty of achieving effective development with conventional technologies such as water flooding [2,3,4]. Realizing the effective development of middle–high permeability reservoirs is of great significance for oil field companies to increase production and improve economic benefits during the high water cut stage.
A significant amount of research has been conducted on the development of middle-high permeability reservoirs during the high water cut stage. Wettability changes and the water–oil mobility ratio are considered key factors affecting the efficiency of water flooding development in the high water cut stage of middle–high permeability reservoirs [5,6,7,8]. Studies have found that altering reservoir wettability and adjusting the water–oil mobility ratio can effectively increase oil displacement efficiency and significantly improve oil recovery [9,10,11]. Hydrodynamic methods—such as unsteady water injection, depressurization exploitation, redirection of flow, and adjustment of the work scheme—have also been explored [12,13,14,15]. Studies have shown that these methods hold some potential for enhancing oil recovery, but their effectiveness has been limited. In addition, gas flooding technology has been deeply investigated. It has been found that CO2 is superior to other gases, such as N2 and CH4, in terms of oil displacement efficiency [16,17,18,19]. Under high pressure conditions, CO2 can form near-miscible and miscible phases with crude oil through multi-stage contact, thus significantly enhancing oil recovery. Furthermore, CO2 flooding has achieved good results in field applications [20,21,22]. These research results provide important theoretical and technical support for the effective development of middle–high permeability reservoirs in the high water cut stage.
Although numerous technical studies have been conducted on middle–high permeability reservoirs in the high water cut stage, the focus of these studies has primarily been on water flooding profile control, production scheme adjustment, and CO2 miscible flooding. Water drive profile control and production scheme adjustments cannot effectively resolve the issues of severe water channeling and the challenges associated with the use of residual oil in the high water cut stage. CO2 miscible flooding can effectively address the aforementioned problems, but it often encounters difficulties in achieving miscibility within oil reservoirs that contain low-quality oil products in onshore fields. In conclusion, the development of reservoirs with high water cut requires further innovation and exploration of new technologies [23,24]. Based on existing knowledge and understanding of miscible flooding, this paper innovates in the research on miscible flooding for high water cut oil and gas reservoirs. It proposes a technical approach for the air thermal miscible development of such reservoirs. The production characteristics and dynamics are studied and analyzed through a combination of experimental data and digital modeling, providing a theoretical foundation for air injection development technology, particularly in the high water cut stage of medium to high permeability reservoirs. Nevertheless, the application of thermal miscible flooding in medium-to-high permeability reservoirs with high water-cut conditions warrants further investigation to optimize its enhanced oil recovery (EOR) potential.

2. Experiments

2.1. Experimenta Materials

(1)
Oil sample: The crude oil is first filtered through a 200-mesh stainless steel screen at temperatures below 80 °C and then dehydrated at 130 °C to ensure a water content below 0.3%. The viscosity of the degassed crude oil at surface conditions is 20 mPa·s, and the viscosity of the underground crude oil ranges from 5~6 mPa·s.
(2)
Quartz sand: Three types of quartz sand with particle sizes of 80 mesh, 100 mesh, and 160 mesh were utilized.
(3)
Experimental water: Distilled water was utilized in this experiment.
(4)
Experimental Gases: The purity of nitrogen and carbon dioxide used in the experiment is greater than 99.9%. The mass content of impurities in the air, such as water vapor, dust, and oil, does not exceed 0.5%.

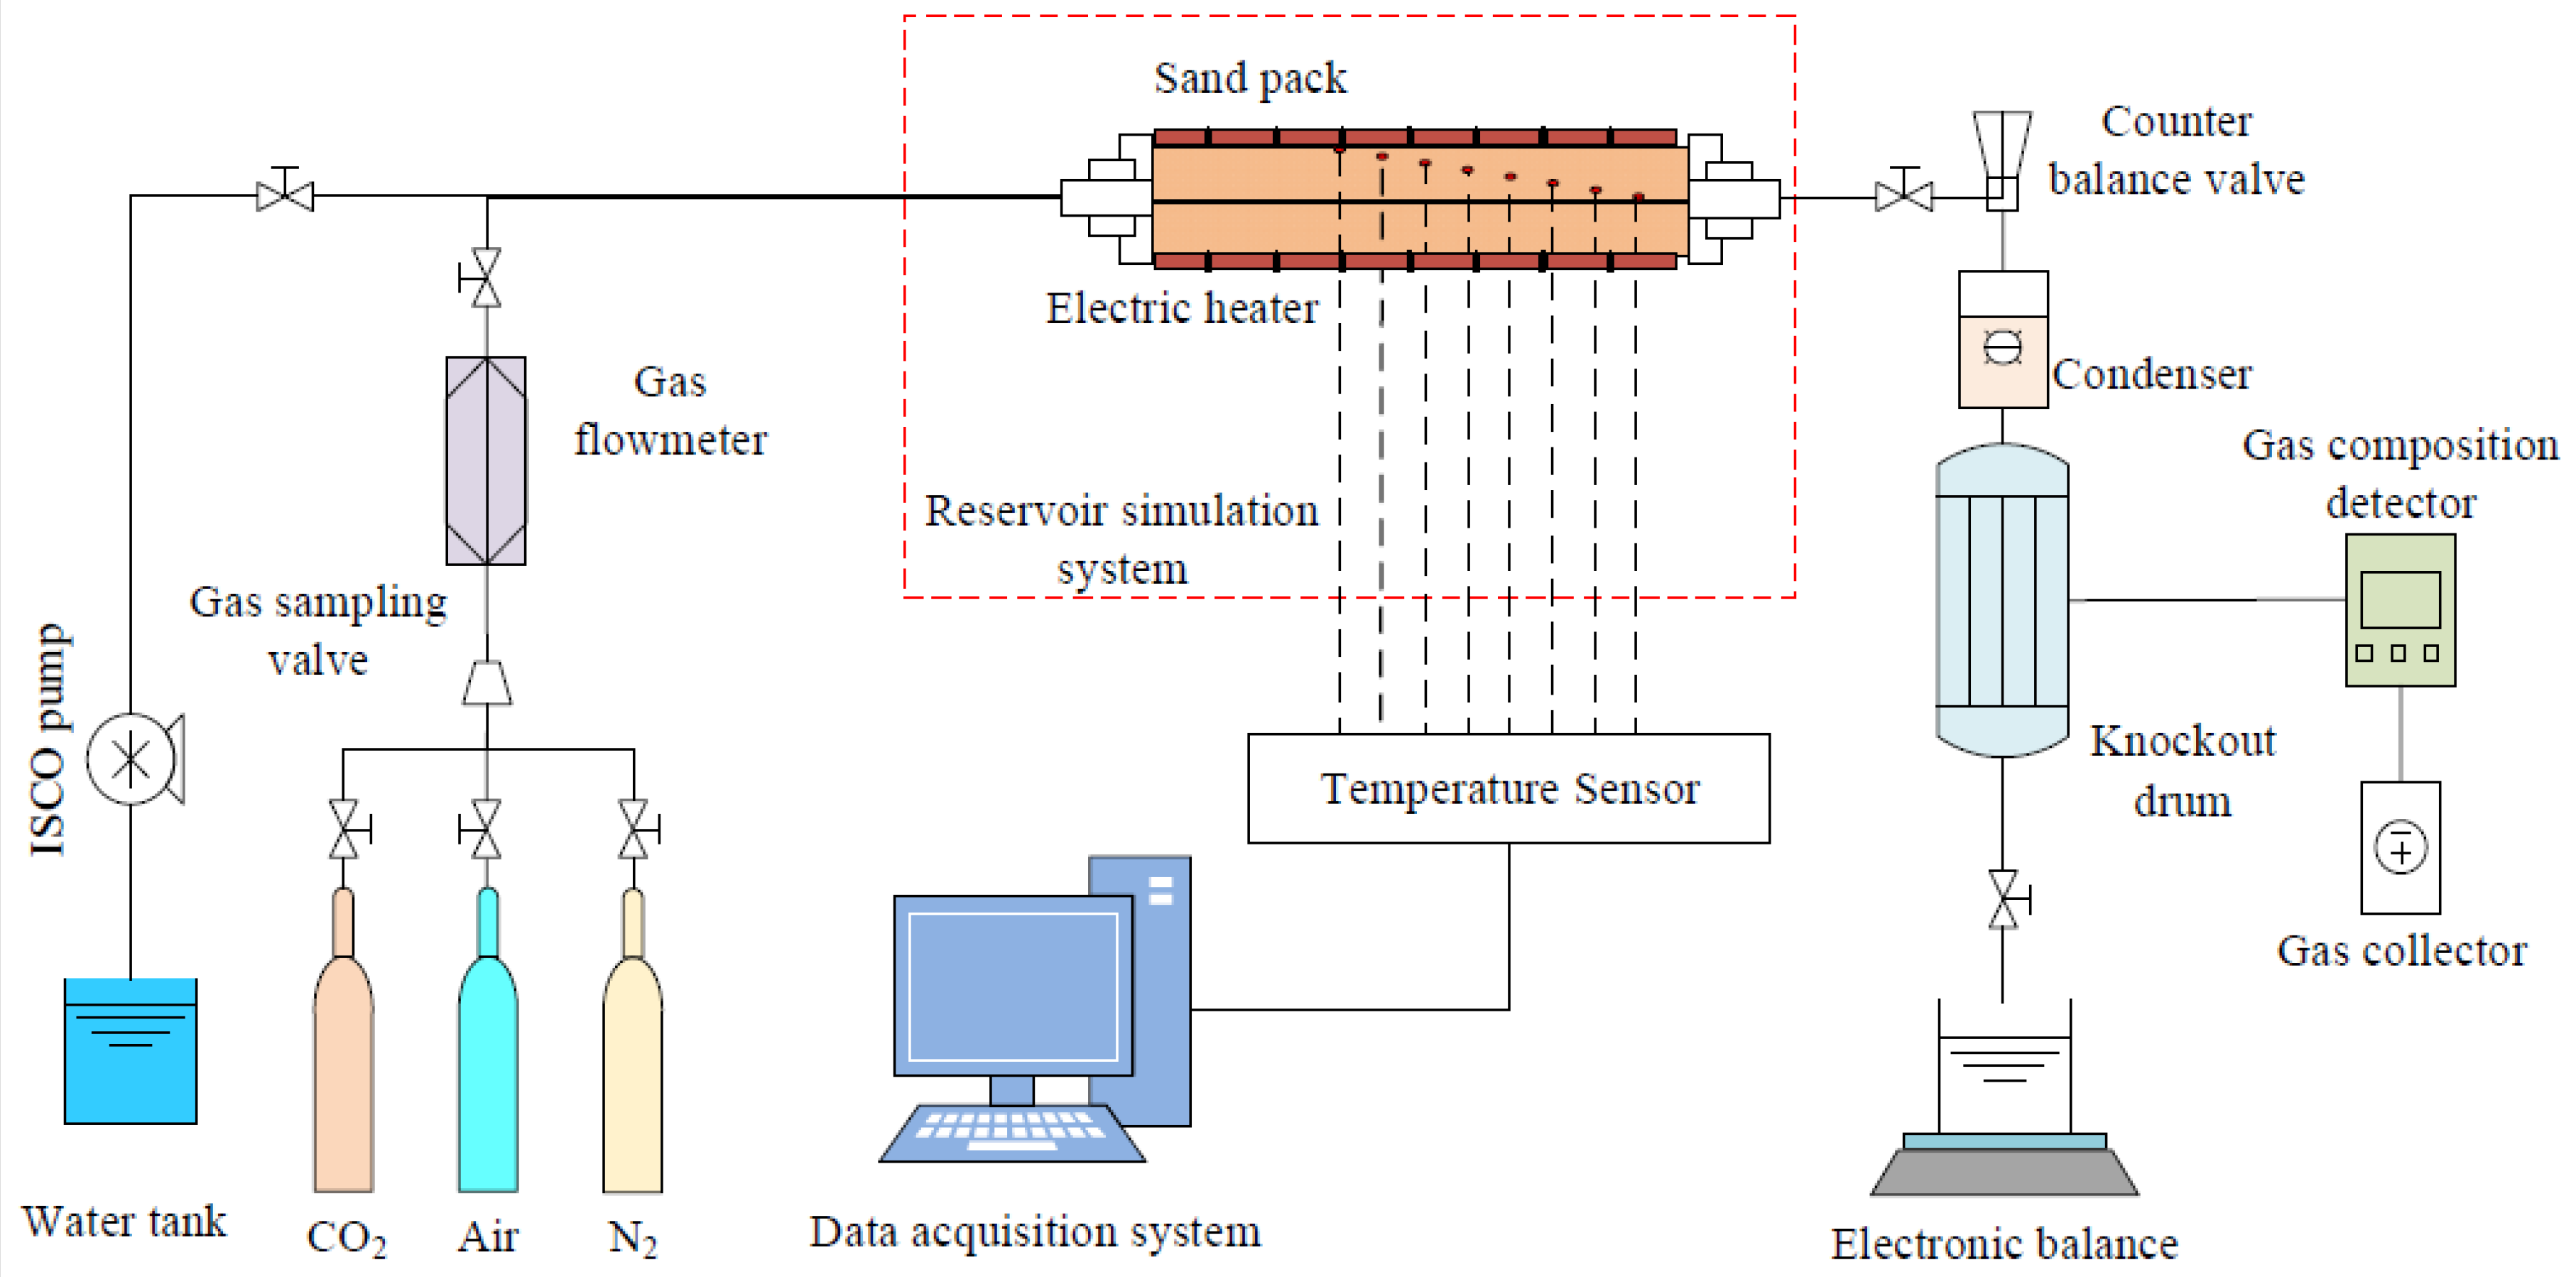
2.2. Experimental Apparatus

Figure 1 displays the schematic diagram of the experimental platform utilized in this experiment. The platform consists of four components: the reservoir simulation system, the injection system, the data acquisition system, and the output collection and processing system. This platform is capable of simulating the hot zone process under near-adiabatic conditions for one-dimensional linear displacement. Additionally, it can monitor various parameters in real time, including temperature, pressure, produced gas composition, and produced liquid dynamics during the experiment. The equipment’s parameter is detailed in Table 1.
(1)
Injection system: The system is primarily used for the stable injection and accurate measurement of various fluids. It consists of an ISCO pump, gas cylinders, a gas pressure reducing valve, and a gas mass flow controller. (1) ISCO pump: It can achieve precise liquid injection in the range of 0–20 mL/min, with a control accuracy of 1%FS. (2) Gas cylinder: It must provide a stable air source with a pressure higher than the experimental design pressure of 1 MPa, with a maximum pressure of 30 MPa. (3) Gas pressure reducing valve: It can achieve a stable gas supply to the downstream manifold, maintaining a pressure fluctuation range of less than 1%FS. (4) Gas mass flow controller: It can achieve quantitative gas supply within the range of 0–10 L/min, with a control gas flow accuracy of 0.5%FS.
(2)
Reservoir Simulation System: The system is primarily used to simulate the underground environment of the reservoir, ensuring the accuracy of the experiment. It consists of a back pressure valve, a sand pipe, and a wall heater. (1) Back Pressure Valve: It can be used to simulate high-pressure environments, with a pressure range of 0.0–15.0 MPa. (2) Combustion Tube Model: The combustion tube has a length of 150 cm, an inner diameter of 6.4 cm, and a wall thickness of 3 mm. Its operating temperature range is –20 to 650 °C. (3) Wall Heater: It can rapidly heat the wall of the combustion tube model, achieve real-time temperature tracking, and ensure that the difference between the wall surface temperature of the model tube and the core temperature is less than 5 °C. This fully simulates the insulating ability of the formation. The heater has a power rating of 600 W, a width of 6.5 cm, and a total length of 24 cm.
(3)
Data Acquisition System: The system is primarily used for the collection and storage of data and consists of a temperature sensor, a pressure sensor, a gas component analyzer, and a data acquisition and processing system. (1) Temperature Sensor: This experiment uses a K-type thermocouple, which is installed along with heating tiles on the outer wall of the sand-filled pipe. Its accuracy is ±1 °C, and the measurement range is −20 to 1300 °C, with a total of 47 sensors. (2) Gas Component Analyzer: It performs online detection of CO, CO2, N2, H2, and O2 gas volume percentage content, with an accuracy of ±0.5% FS. (3) Data Acquisition Processor: With a minimum data acquisition interval of 1 s, it can achieve accurate measurement of data.

2.3. Experimental Scheme and Procedure

In this experiment, the production dynamic characteristics of various gas flooding technologies during the high water cut stage were thoroughly investigated, and the specific experimental design parameters are presented in Table 2. The detailed steps of the experiment are as follows:
(1)
Sand packed model filling and porosity measurement: The experimental sand was evenly and tightly packed into the model. After the sand filling is completed, the air in the sand-filled pipe is evacuated using a vacuum pumping device. When the pressure in the sand-filled tube drops below 10 Pa, the injection section of the tube is connected to an intermediate vessel filled with water, allowing enough experimental water to be automatically drawn into the model. The volume of the saturated water and the porosity are then calculated.
(2)
Saturated crude oil: Experimental oil is used to displace water in a sand-filled tube model. When the oil content of the produced liquid reaches 99.0%, the amount of oil injected and the amount of water produced are precisely measured. Subsequently, the initial oil saturation and irreducible water saturation are calculated.
(3)
Water flooding: Water flooding is conducted according to the experimental requirements. When the water cut of the produced liquid reaches 95%, the displacement is halted to calculate the output oil volume and determine the recovery degree of water flooding. The saturated crude oil and water flooding parameters of the experiment are presented in Table 3.
(4)
Establish the initial temperature: To ensure the internal temperature of the combustion tube meets the experimental setting, the tube’s wall heater is heated to the designated temperature and maintained for over 4 h.
(5)
Displacement Experiment: According to the experimental design, different types of gas are injected to perform development experiments at the high water cut stage using various displacement methods. Data such as gas flow rate, temperature measurement point temperatures, and exhaust gas composition are recorded in real time. At fixed time intervals, the produced liquid in the gas–liquid separator is collected in different glass containers for detection and measurement.
(6)
Repeat the aforementioned steps to complete all experiments.

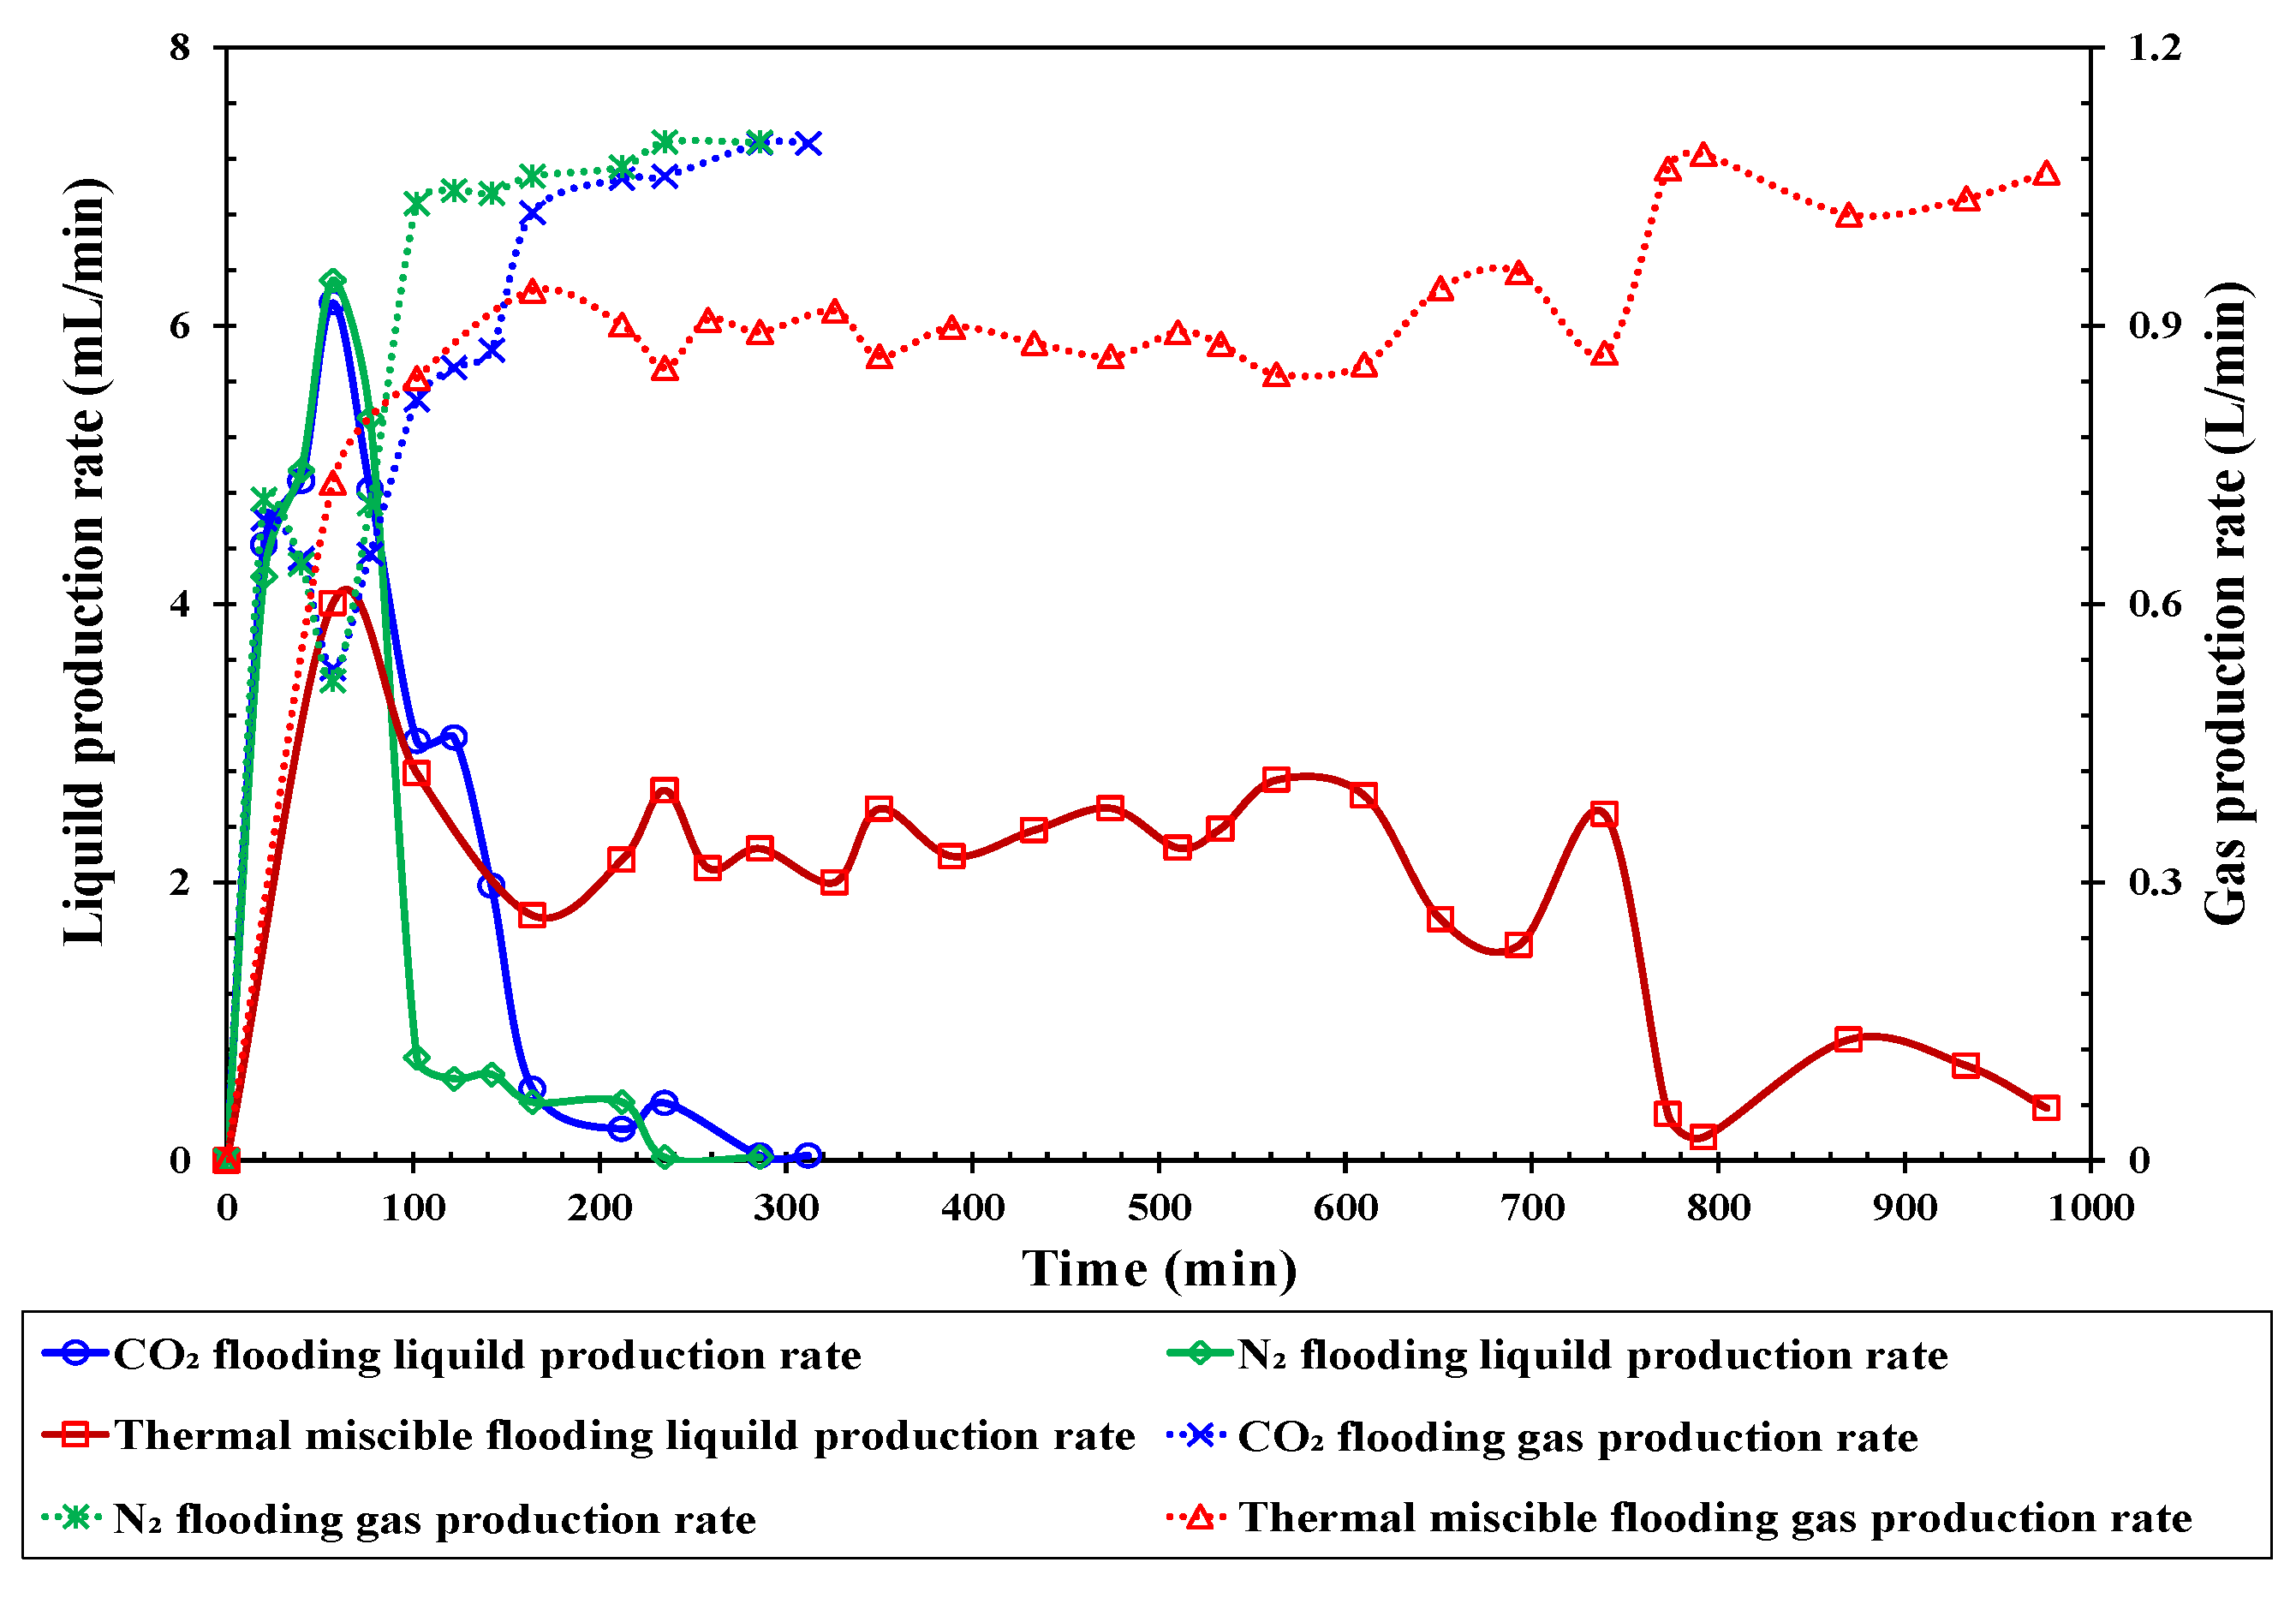
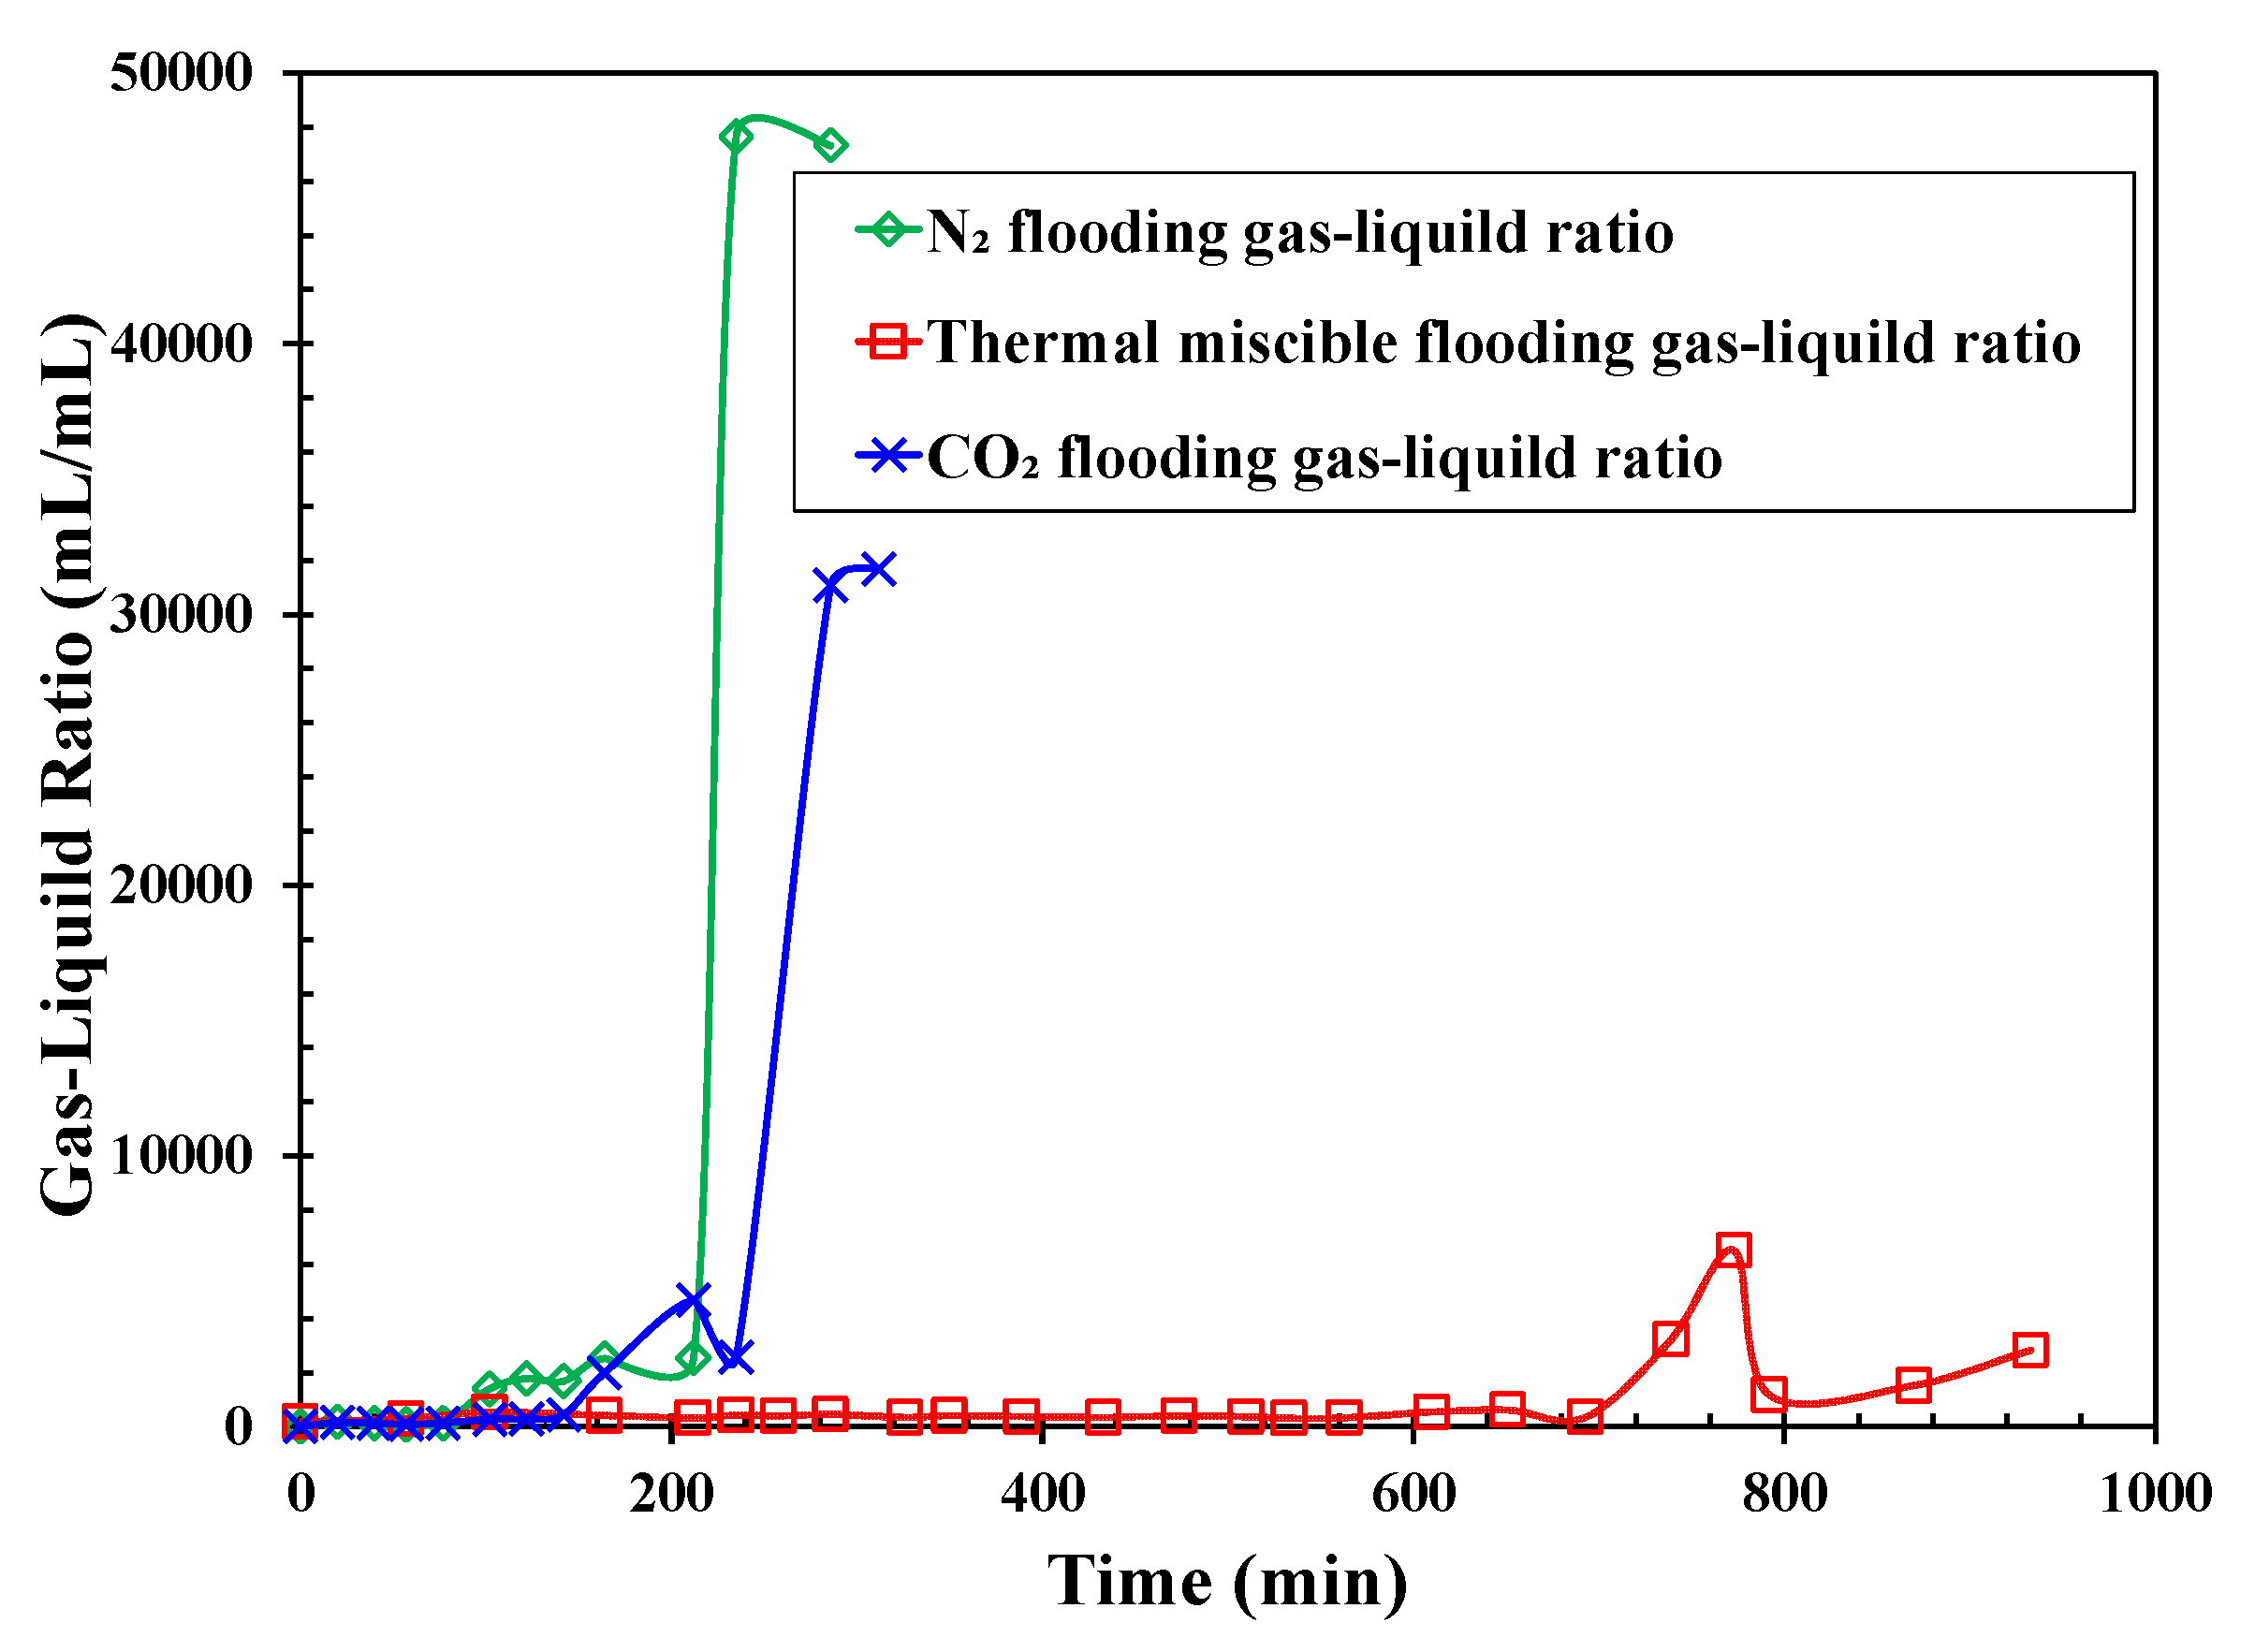
2.4. Results and Discussion

(1)
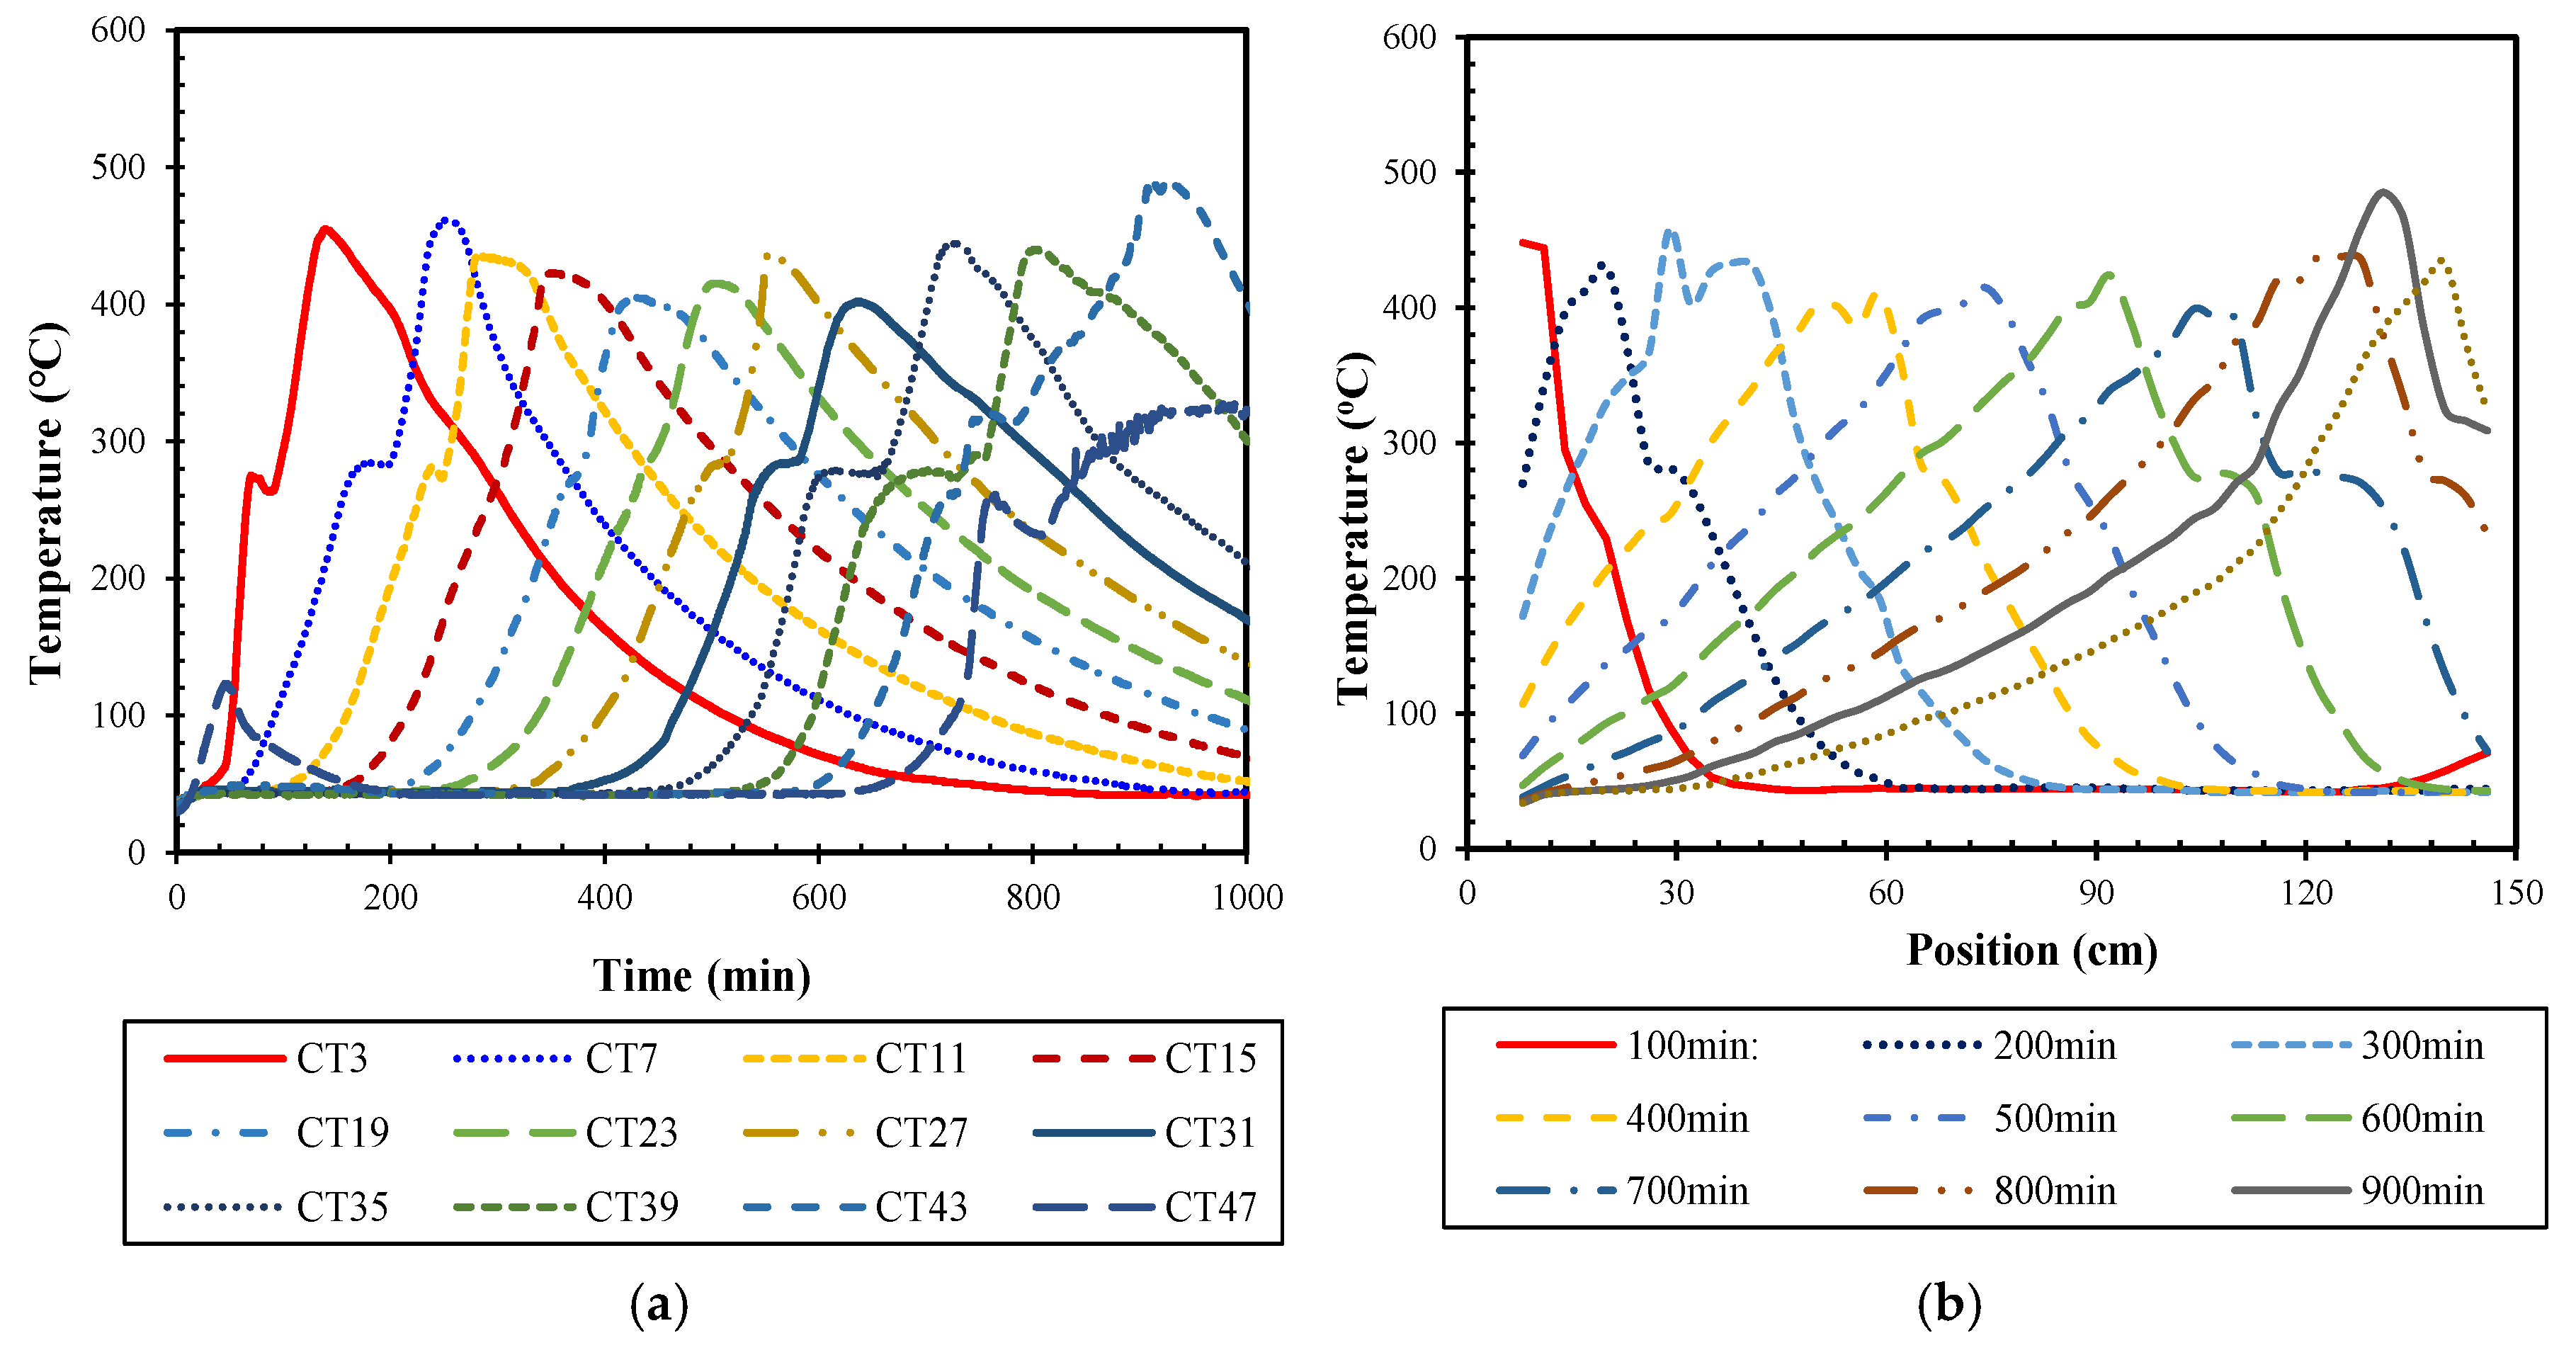
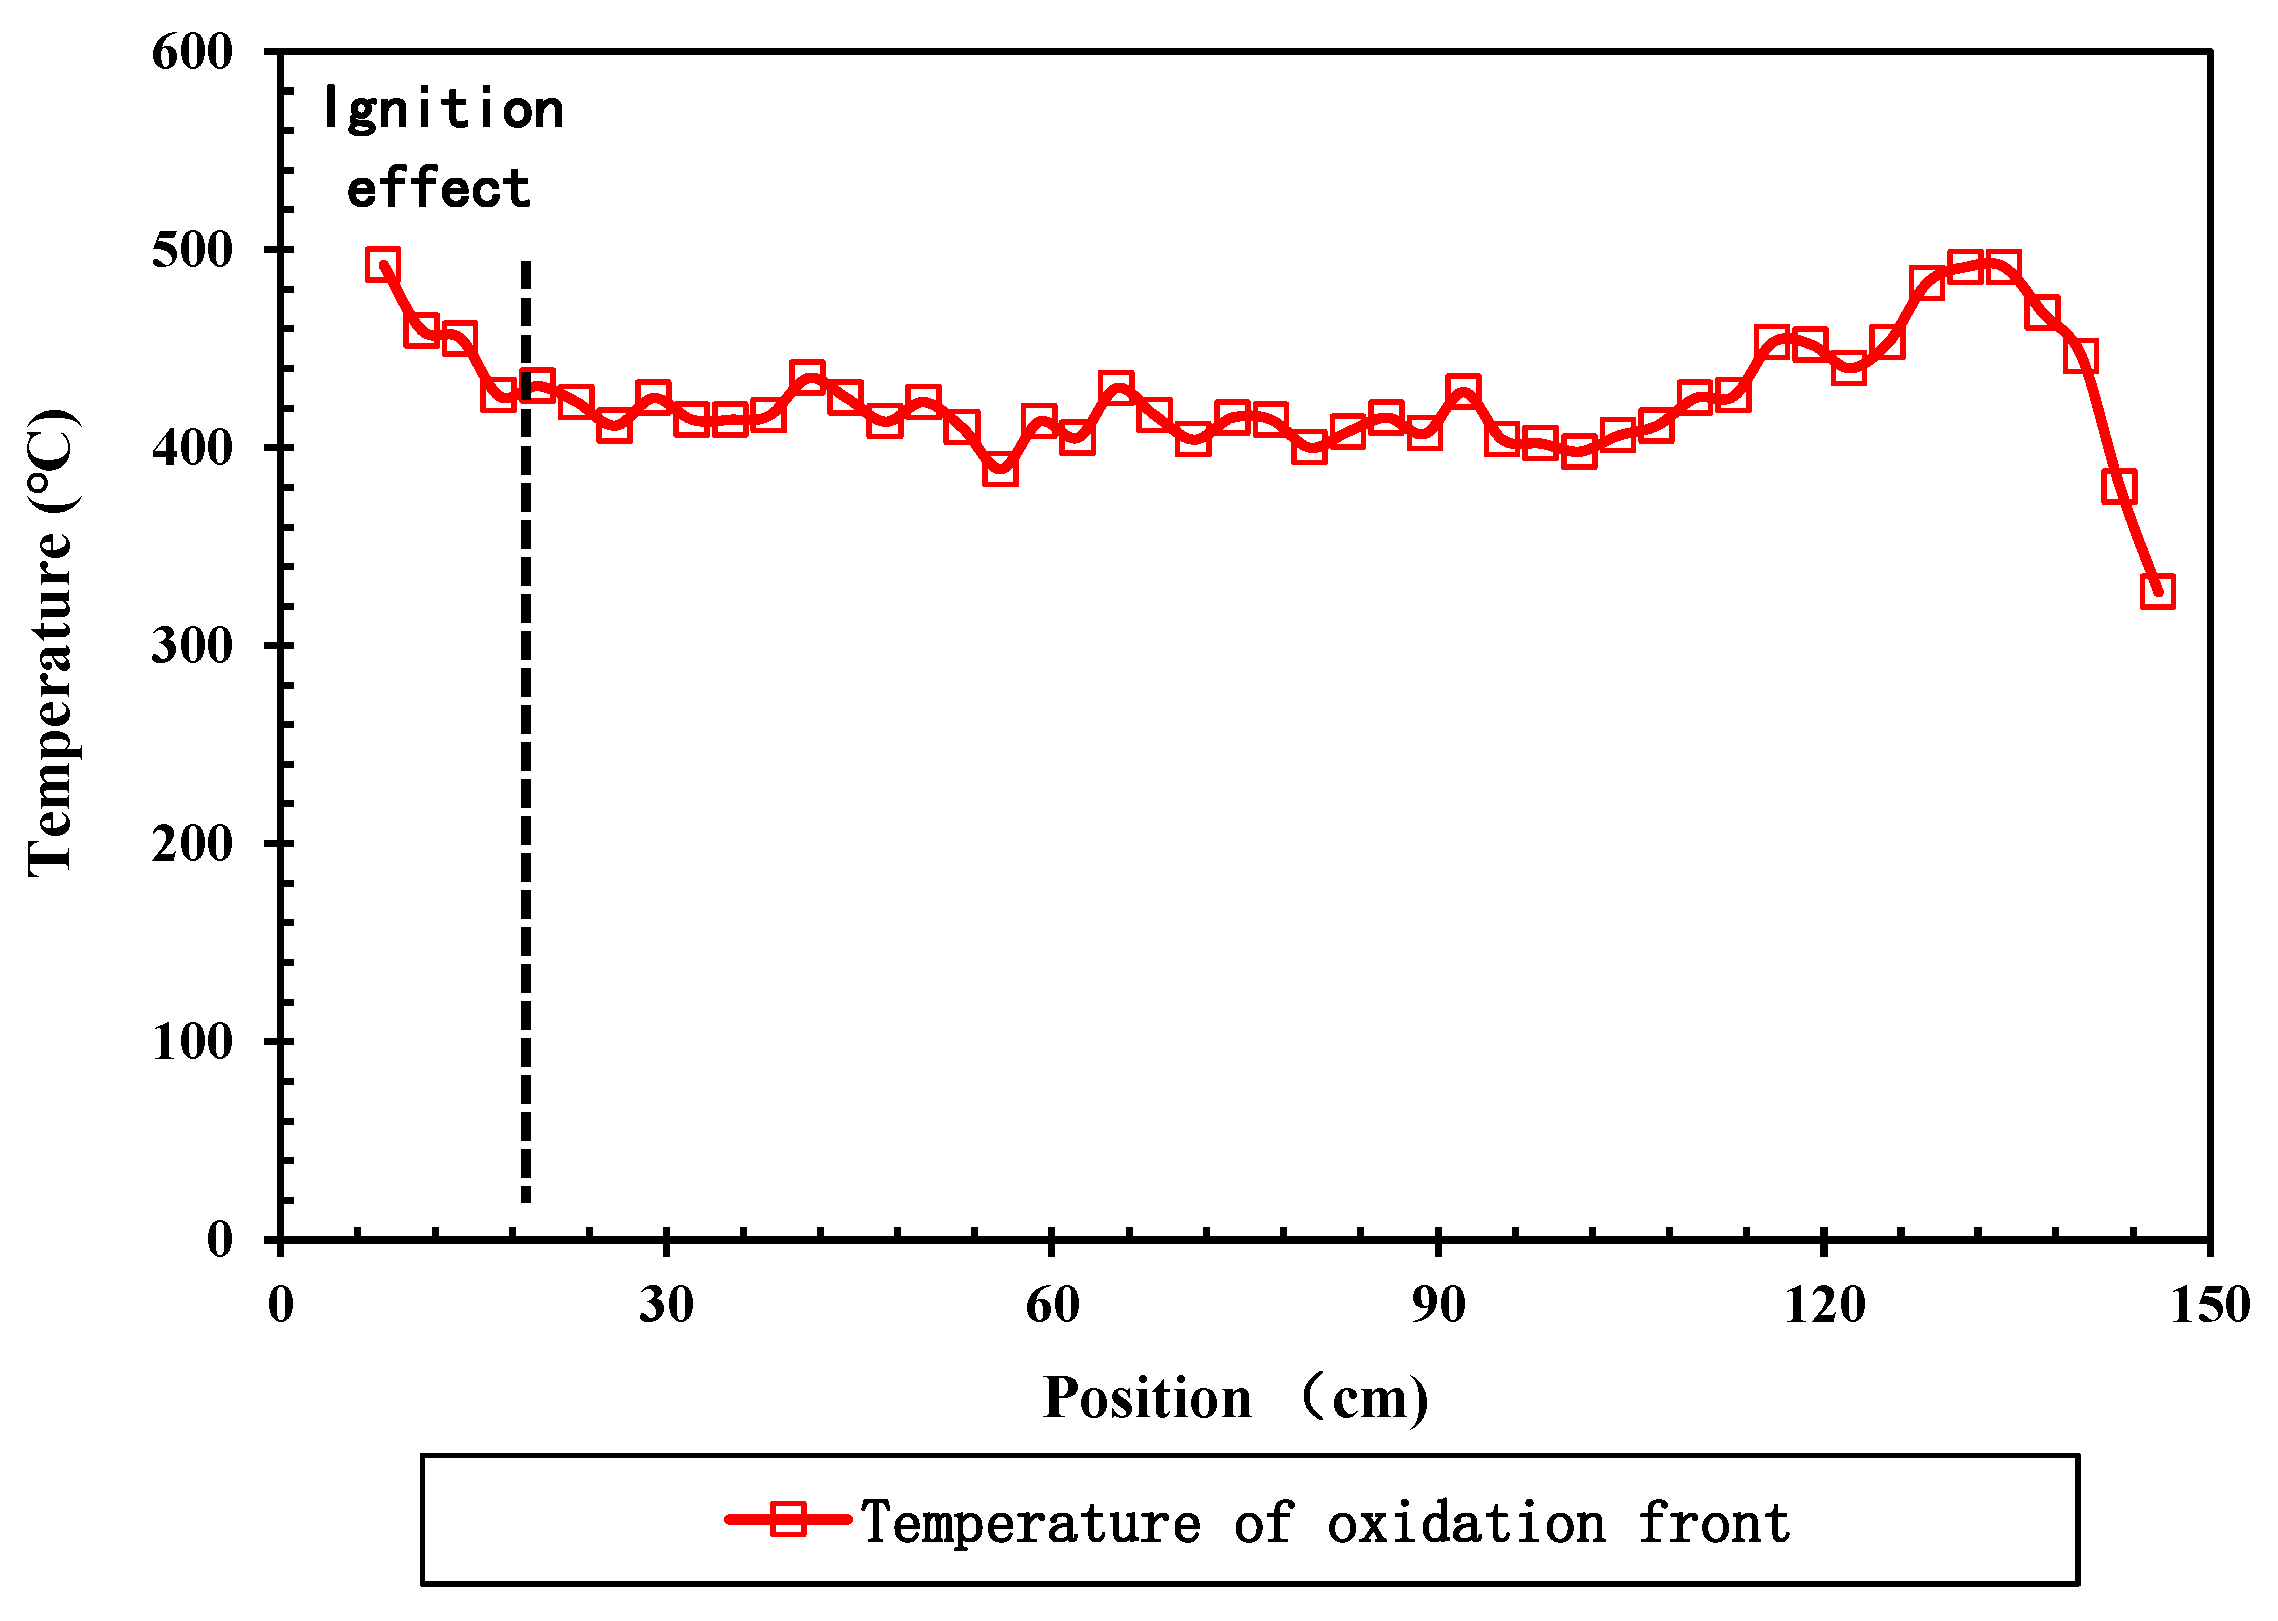
Analysis of temperature in the thermal miscible flooding
Figure 2 displays the temperature change curve of thermal miscible flooding in the high water cut stage. Figure 2a clearly shows that there is a stable heat propagation process during the experiment, which can form a stable thermal oxidation front. The advance speed of this thermal oxidation front is 19.5 mm/min. This phenomenon indicates that stable thermal miscible displacement can still be achieved in the high water cut stage. Figure 2b shows that thermal miscible flooding has a distinct constant-temperature interval at about 240 °C. During the process of thermal miscible flooding, high temperatures can cause water to change phase into water vapor. This constant-temperature interval is caused by the accelerated temperature transfer of water vapor.
Figure 3 displays the highest temperature curve of measuring points in the thermal miscible flooding experiment. From Figure 3, it is observed that due to the ignition effect, the temperatures at measuring points 1 to 4 (represented by dotted lines in Figure 3) contain an error, which is higher than the actual temperatures. However, this error does not compromise the accuracy and reliability of the experiment. As shown in Figure 3, the peak temperature of the hot oxidation front during the air hot miscible drive’s steady advance is consistently stable at 390–430 °C. This indicates that the hot miscible drive can rapidly transition into a medium- to high-temperature oxidation state and maintain a stable, sufficient thermal oxidation reaction, allowing for a stable advance. At the later stage of the experiment, an area between the production port and the sand-filled pipe remained undisturbed, preventing effective displacement of the crude oil. This increased the supply of hot oxidation fuel, causing the temperature to gradually rise to 460 °C. Once the fuel was exhausted, the temperature dropped rapidly.
(2)
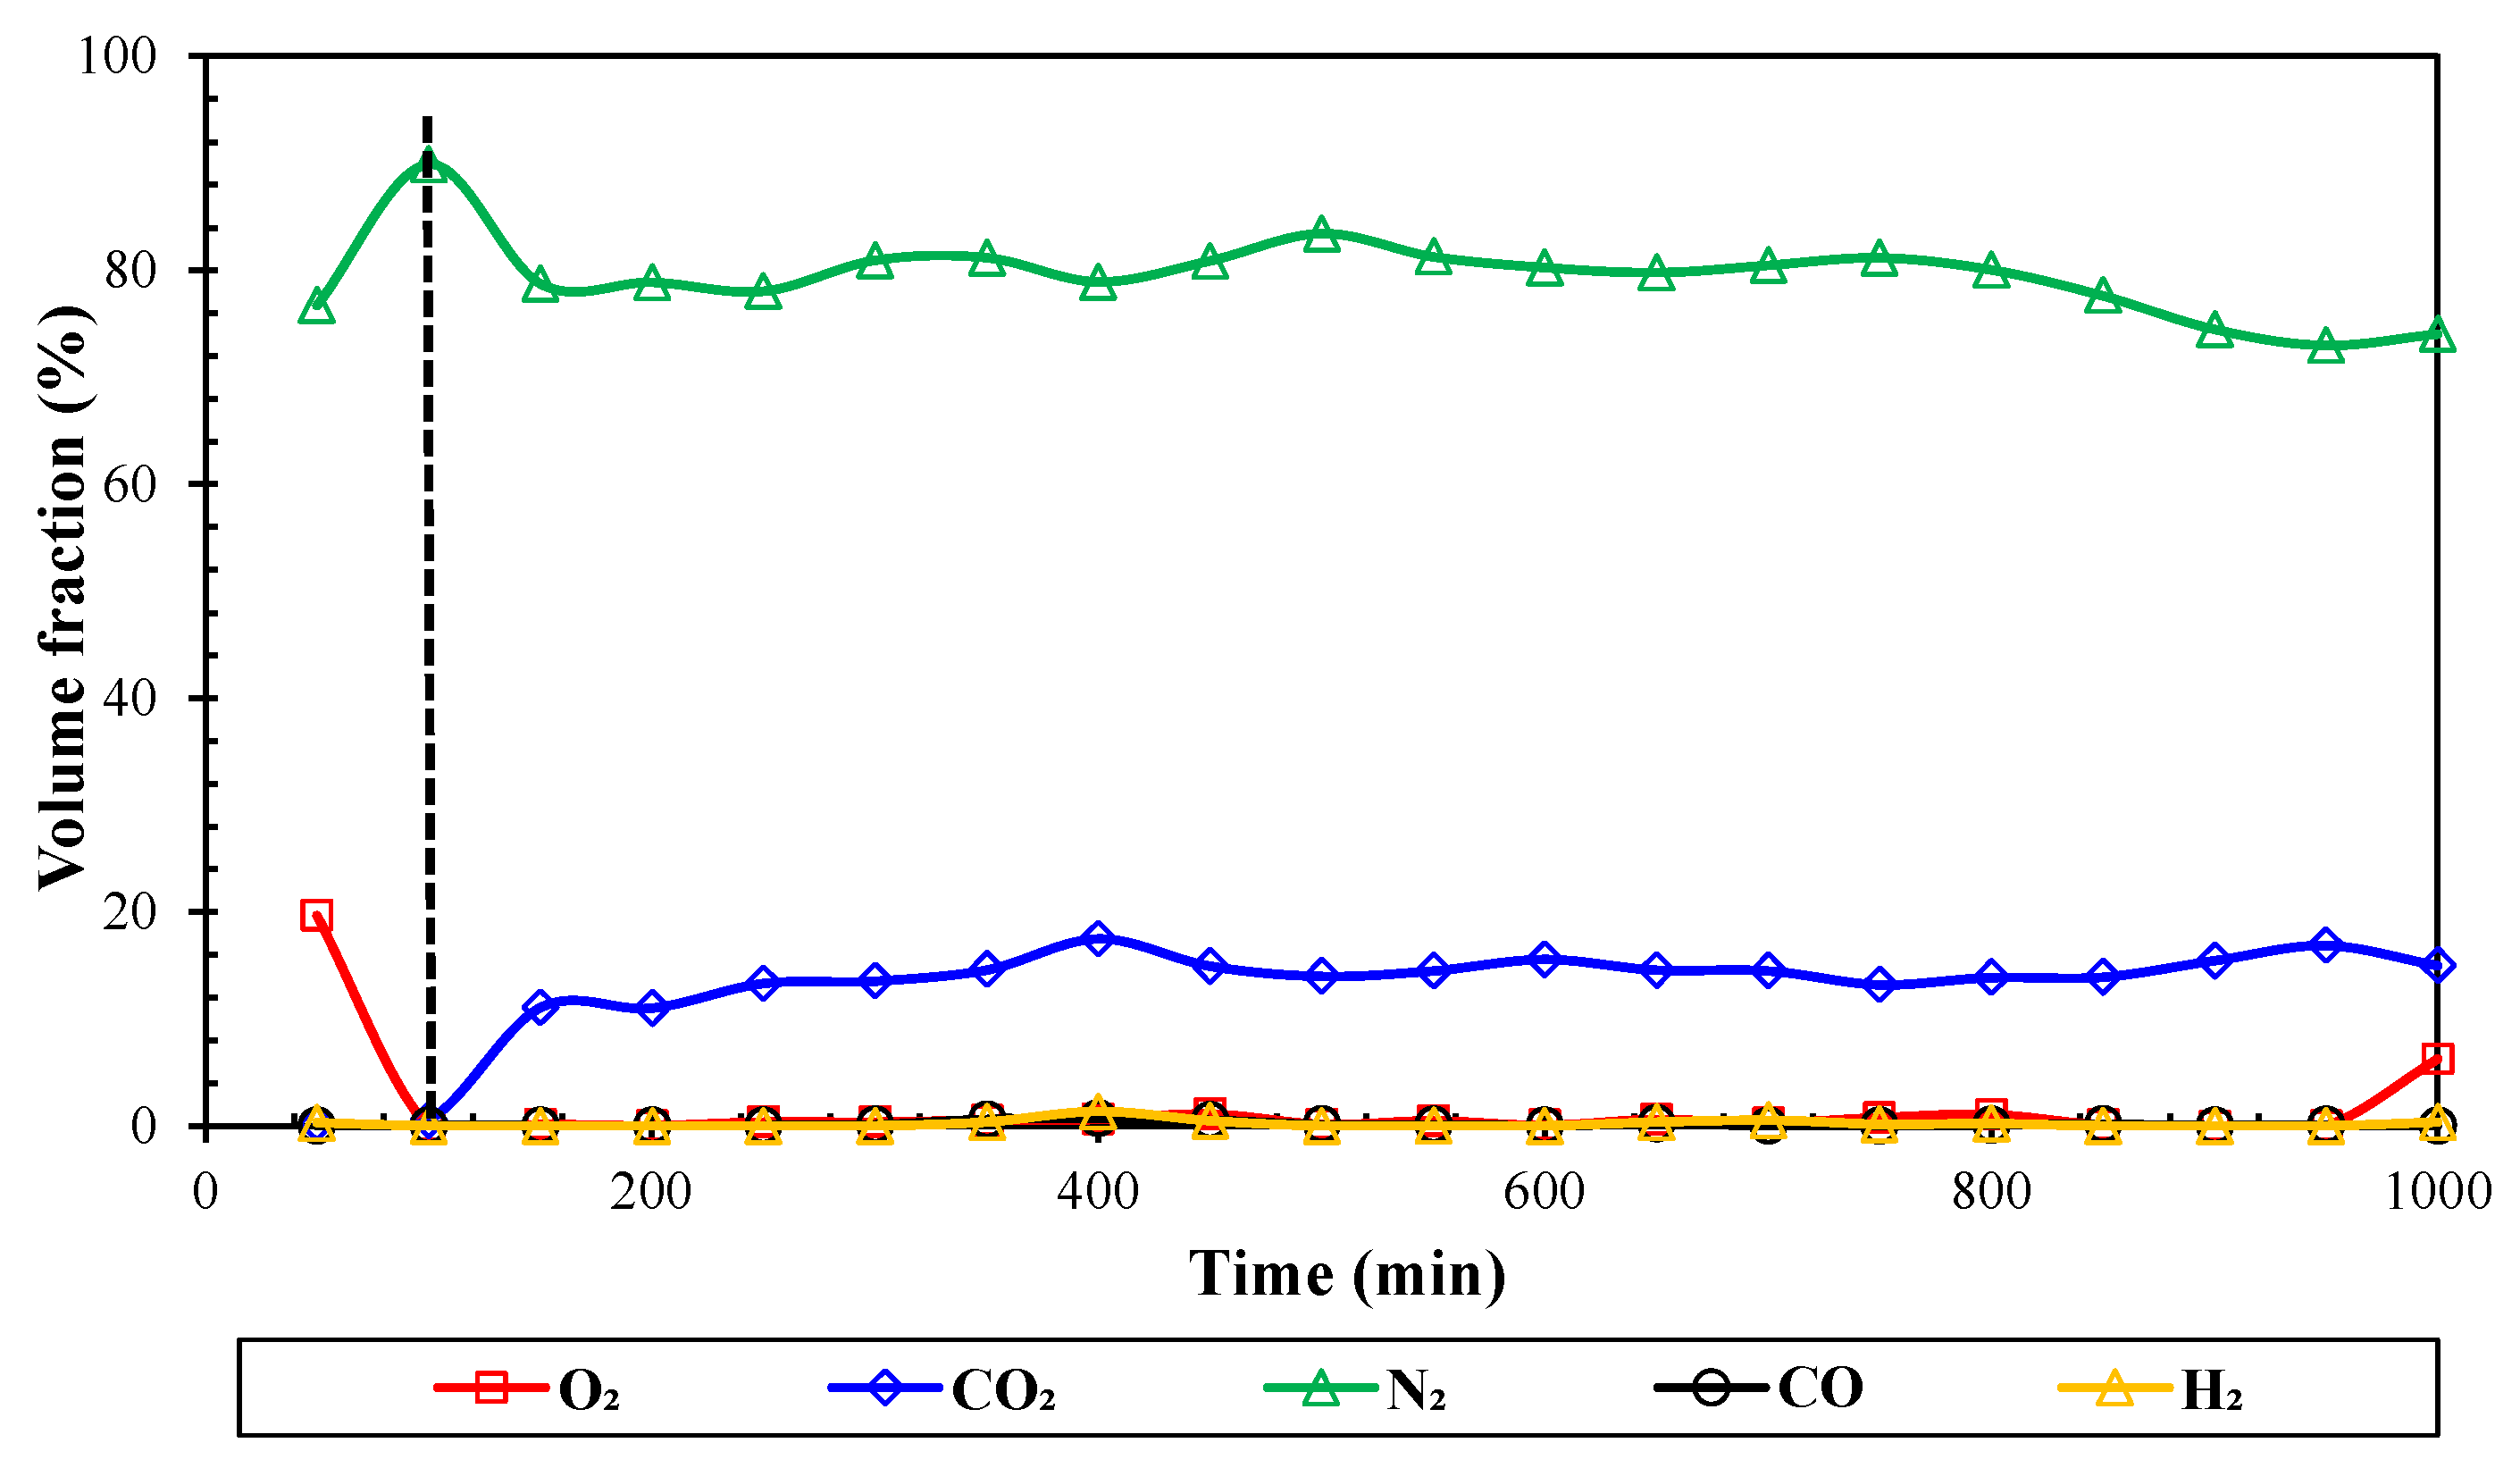
Analysis of produced gas component in the thermal miscible flooding
Figure 4 shows the produced gas component change curve of thermal miscible flooding with time in the high water cut stage.
From Figure 4, during the first 100 min of the experiment, the presence of some air in the gas–liquid separator and the experimental pipeline caused errors in the component detection results. Therefore, the gas data were analyzed with emphasis starting from 100 min after the experiment commenced. At the beginning of the experiment, the concentration of CO2 increased rapidly and remained stable at 11.1–15.9% during the middle and late stages. Meanwhile, the concentration of O2 and CO stabilized at 0–2% throughout the experiment. This phenomenon indicates that sufficient oxidation of crude oil occurs during the process of thermal miscible flooding. In addition, a H2 concentration of 0.5–2.0% was detected in the experiment, which suggests that pyrolysis reactions occurred during the thermal miscible flooding process, and that this process has the effect of improving the quality of crude oil.
(3)
Comparative analysis of production dynamics for different gas flooding methods
Figure 5 illustrates the curves of liquid and gas production rates over time for different gas flooding methods. Initially, within the first 150 min of the experiment, the liquid production rate increased rapidly for all methods and then decreased. Similarly, the gas production rate increased rapidly and subsequently stabilized. At this stage, the maximum liquid production rates were 6.3 mL/min for CO2 flooding, 4.7 mL/min for N2 flooding, and 4.1 mL/min for thermal miscible flooding. Correspondingly, the maximum gas production rates were 1.05 L/min for CO2 flooding, 1.02 L/min for N2 flooding, and 0.89 L/min for thermal miscible flooding.
As the experiment progresses, the gas production rates for N2 flooding and CO2 flooding continue to rise until they reach the gas injection rates, forming distinct preferential flow channels. When substantial gas production begins for both N2 and CO2 flooding, the liquid production rate drops to nearly zero. Gas channeling occurs at 235 min for N2 flooding and at 286 min for CO2 flooding, respectively. For thermal miscible flooding, the gas production exceeds 80% of the gas injection rate at 102 min, and the liquid production rate decreases significantly. At this time, the gas production rate for thermal miscible flooding stabilizes at 0.85–0.95 L/min, while the liquid production rate stabilizes at 2.0–3.0 mL/min. Stable production is maintained for a long period under a gas-to-oil ratio of about 400 mL/mL, which is considered a low gas-to-oil ratio stable production stage. Subsequently, at 773 min, the gas production for hot miscible flooding increases to 1.0 L/min, and the liquid production decreases to 0.2–1.0 mL/min, marking a high gas-to-liquid ratio production stage. Ultimately, at 976 min, the liquid production rate for hot miscible flooding becomes zero.
Figure 6 displays the curves of oil production rate and recovery degree over time for different gas flooding methods during the high water cut stage. From the figures, it can be observed that during the N2 and CO2 flooding processes, there was virtually no crude oil production, with the recovery degree only increasing by 1.02% and 1.43%, respectively. In contrast, thermal miscible flooding experienced an initial water drainage period, after which the oil production rate rapidly increased starting from 326 min, reaching a maximum oil production rate of 2.34 mL/min. At 739 min, the oil production rate of thermal miscible flooding decreased, entering a high gas–liquid ratio production phase, with the recovery degree increasing by 44.45%. The final recovery degree of the combustion tube reached 96.54%.
Figure 7 illustrates the variation curves of gas–liquid ratios under different gas displacement methods. During the initial experimental stage (0–200 min), both N2 flooding and CO2 flooding exhibited a gradual increase in gas–liquid ratios, followed by a rapid escalation phase where the ratios exceeded 10,000 mL/mL, indicating pronounced gas channeling. In contrast, thermal miscible flooding showed a slow rise in gas–liquid ratio to 400 mL/mL within 0–150 min, followed by a stable low gas–liquid ratio production phase (300–800 mL/mL) maintained between 300 and 800 min. The gas–liquid ratio only began to rise near the end of the displacement process at 773 min. This phenomenon demonstrates that thermal miscible flooding effectively achieves miscibility between the gas and crude oil under high-temperature conditions, forming a piston-like displacement pattern that significantly suppresses gas channeling. This mechanism not only sustains a low gas–liquid ratio but also ensures high liquid displacement efficiency, highlighting the technical advantages of thermal miscible flooding in enhancing oil recovery during high water-cut stages.
Figure 8 shows the curve of water cut changing over time. From Figure 8, in conjunction with Figure 5 and Figure 6, it can be observed that the initial stages of N2 flooding, CO2 flooding, and thermal miscible flooding are all characterized by a distinct water drainage period. In the absence of miscible displacement, because the mobility ratio of water to gas is lower than that of oil to gas, gas tends to preferentially breakthrough along water channels, leading to gas fingering. Consequently, during the later stages of the nitrogen and carbon dioxide flooding experiments, there is a rapid decline in both water cut and liquid production, indicating a severe gas fingering phenomenon. After the drainage period, the water cut in thermal miscible flooding decreases rapidly and then stabilizes, eventually rising quickly as the experiment concludes. The extended periods of stable production and drainage in thermal miscible flooding are attributed to the significant reduction in flue gas miscibility pressure due to the heat effect, which facilitates miscible displacement during the process. The high oil displacement efficiency of miscible displacement creates a high oil saturation “oil wall,” which can resaturate the crude oil in water-favored channels, significantly reducing the gas relative permeability and suppressing gas flow. This phenomenon indicates that thermal miscible flooding possesses the ability for self-profile control.

3. Numerical Simulation Study of Thermal Miscible Flooding

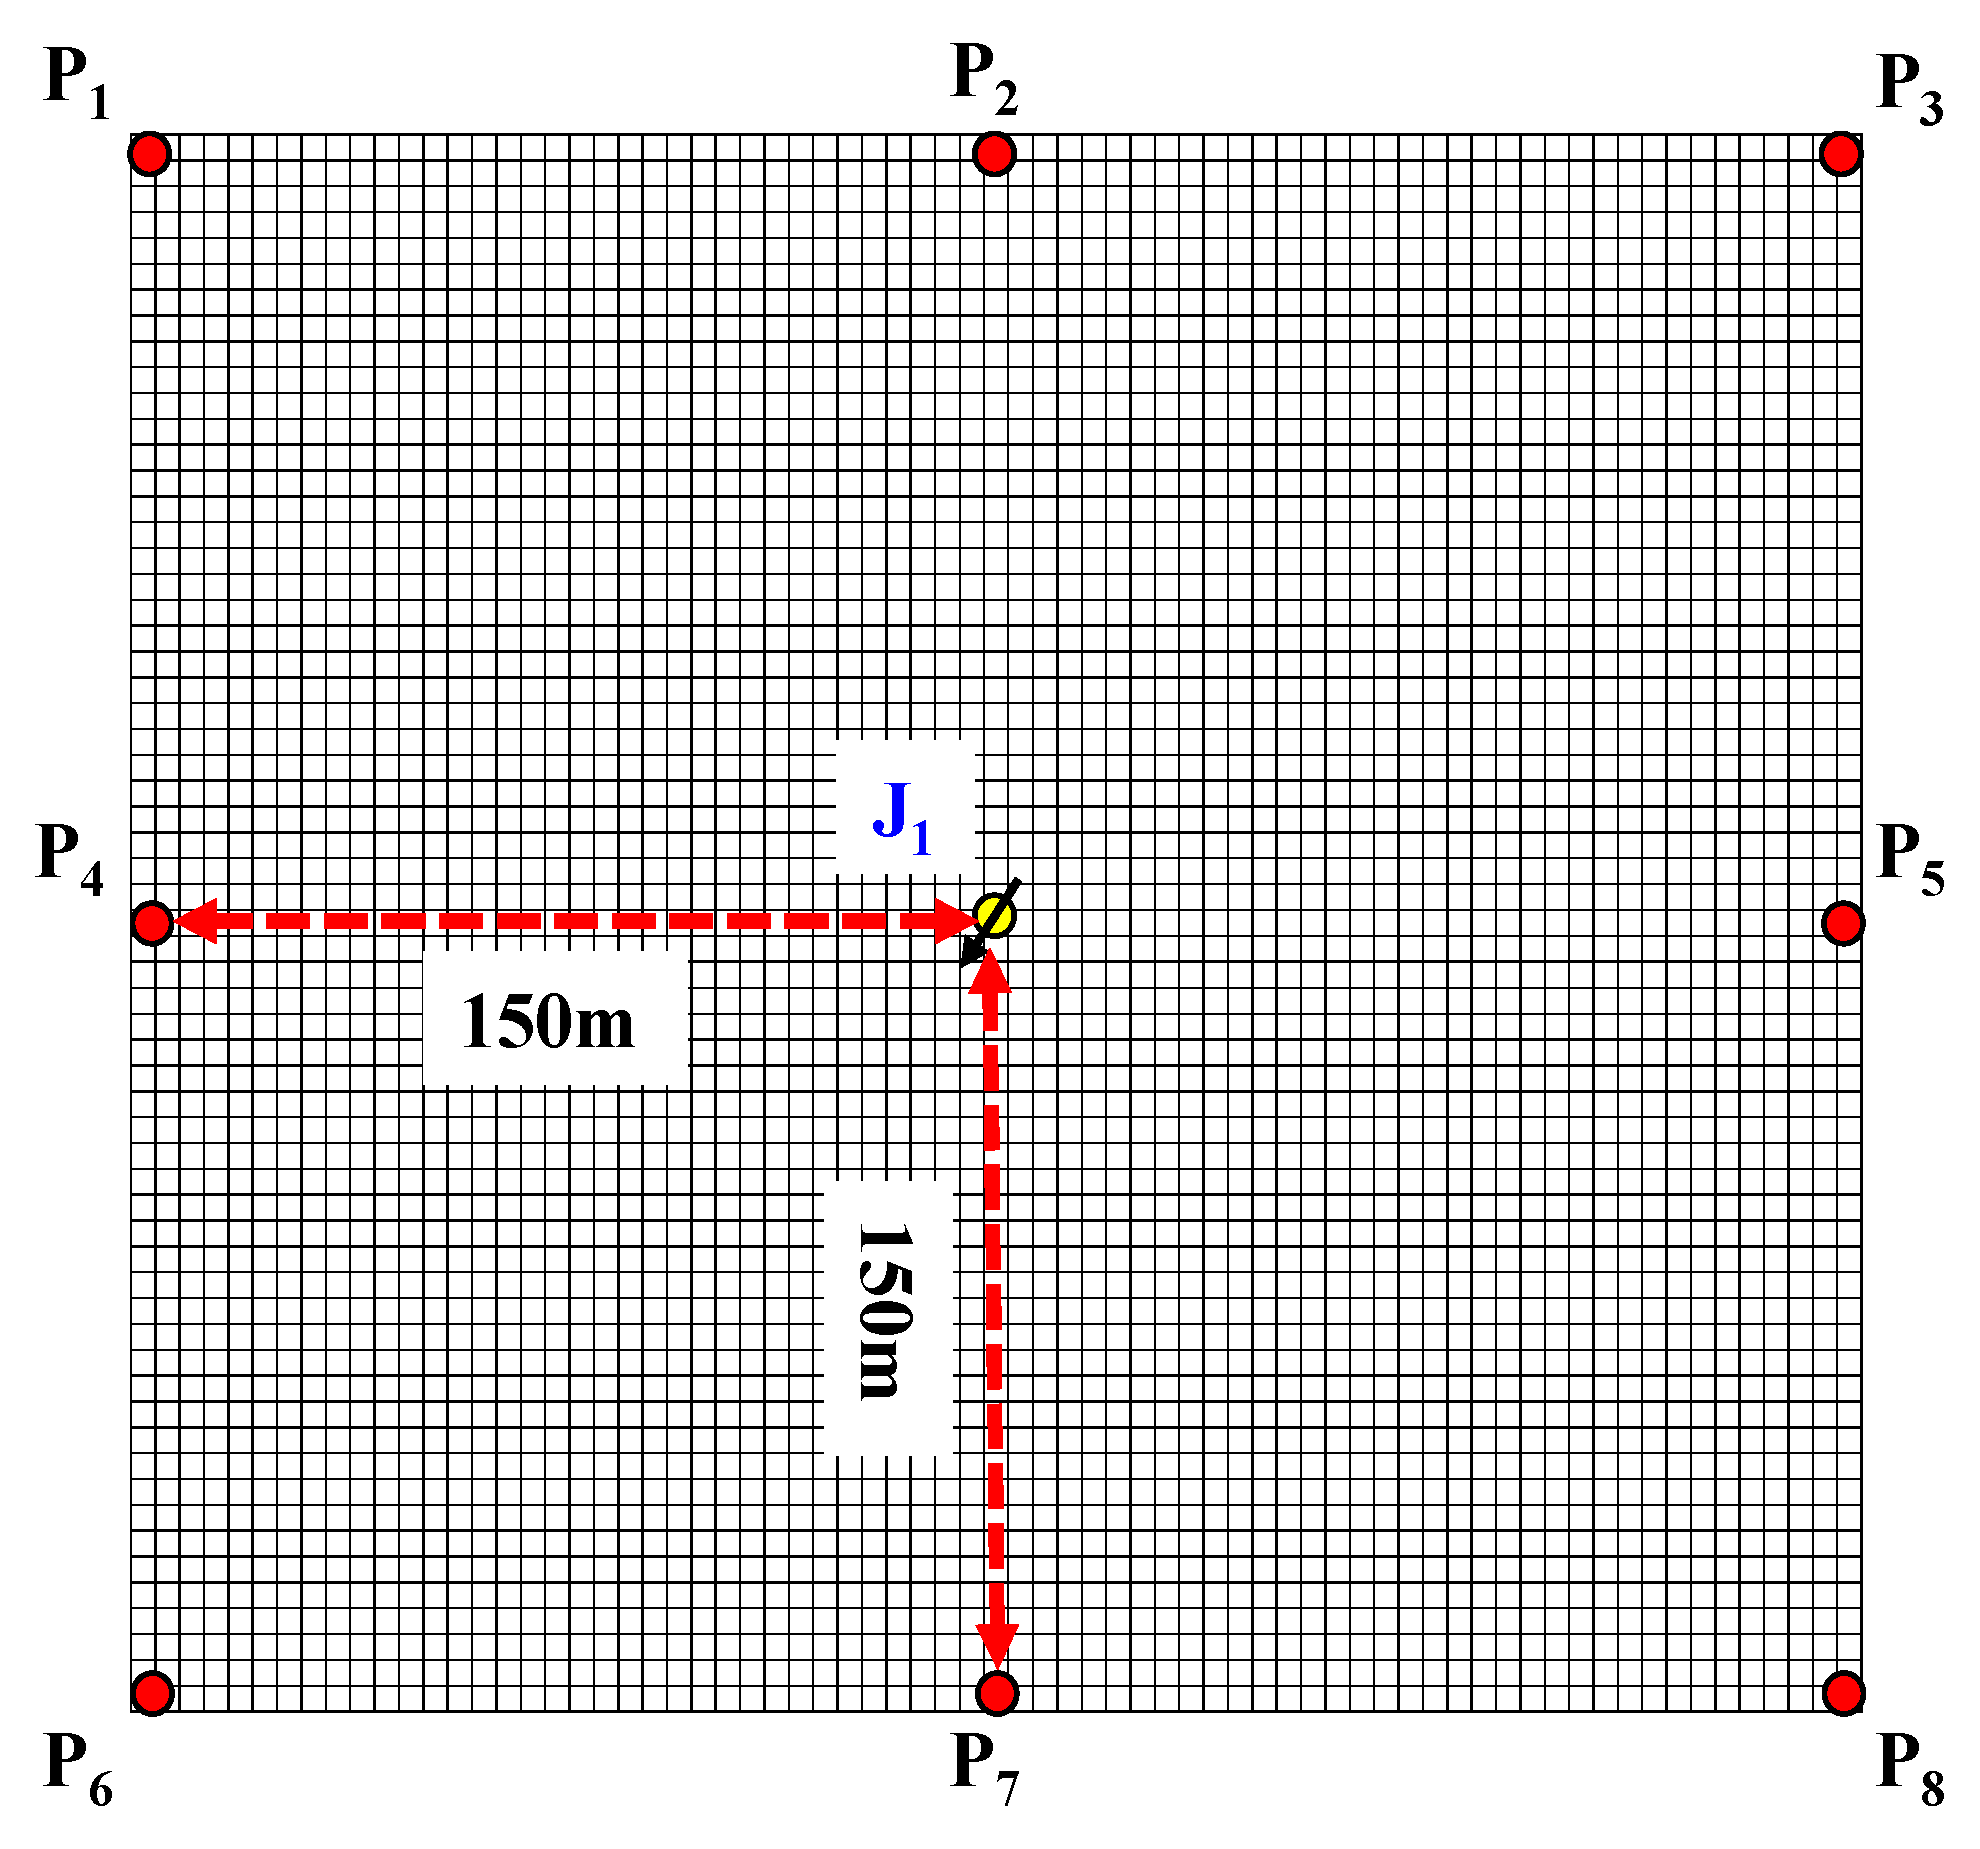
3.1. Establishment of Numerical Models

Based on the reservoir property parameters, fluid parameters, and well network conditions of high water cut oil reservoirs in the late development stage of Chinese oilfields, a dynamic study of air thermal oxidation miscible displacement in high water cut reservoirs was conducted. The model initially undergoes primary depletion and water flooding development, achieving an ultimate recovery rate of 45.5%, with a water cut in the production wells reaching 98%. The numerical simulation was carried out using the 2023 version of CMG-STARS multi-component thermal recovery numerical simulation software. During the simulation, research from “Oxidization characteristics and thermal miscible flooding of high-pressure air injection in light oil reservoirs.” [23] was referenced, and the specific parameters and reaction equations are shown in Table 4, Table 5 and Table 6.
This model was established using a differential simulation algorithm to simulate an alternating well pattern (see Figure 9), which includes a total of 1 injection well and 8 production wells, with a well spacing of 150 m. The injection parameters for the injection wells are shown in Table 7.

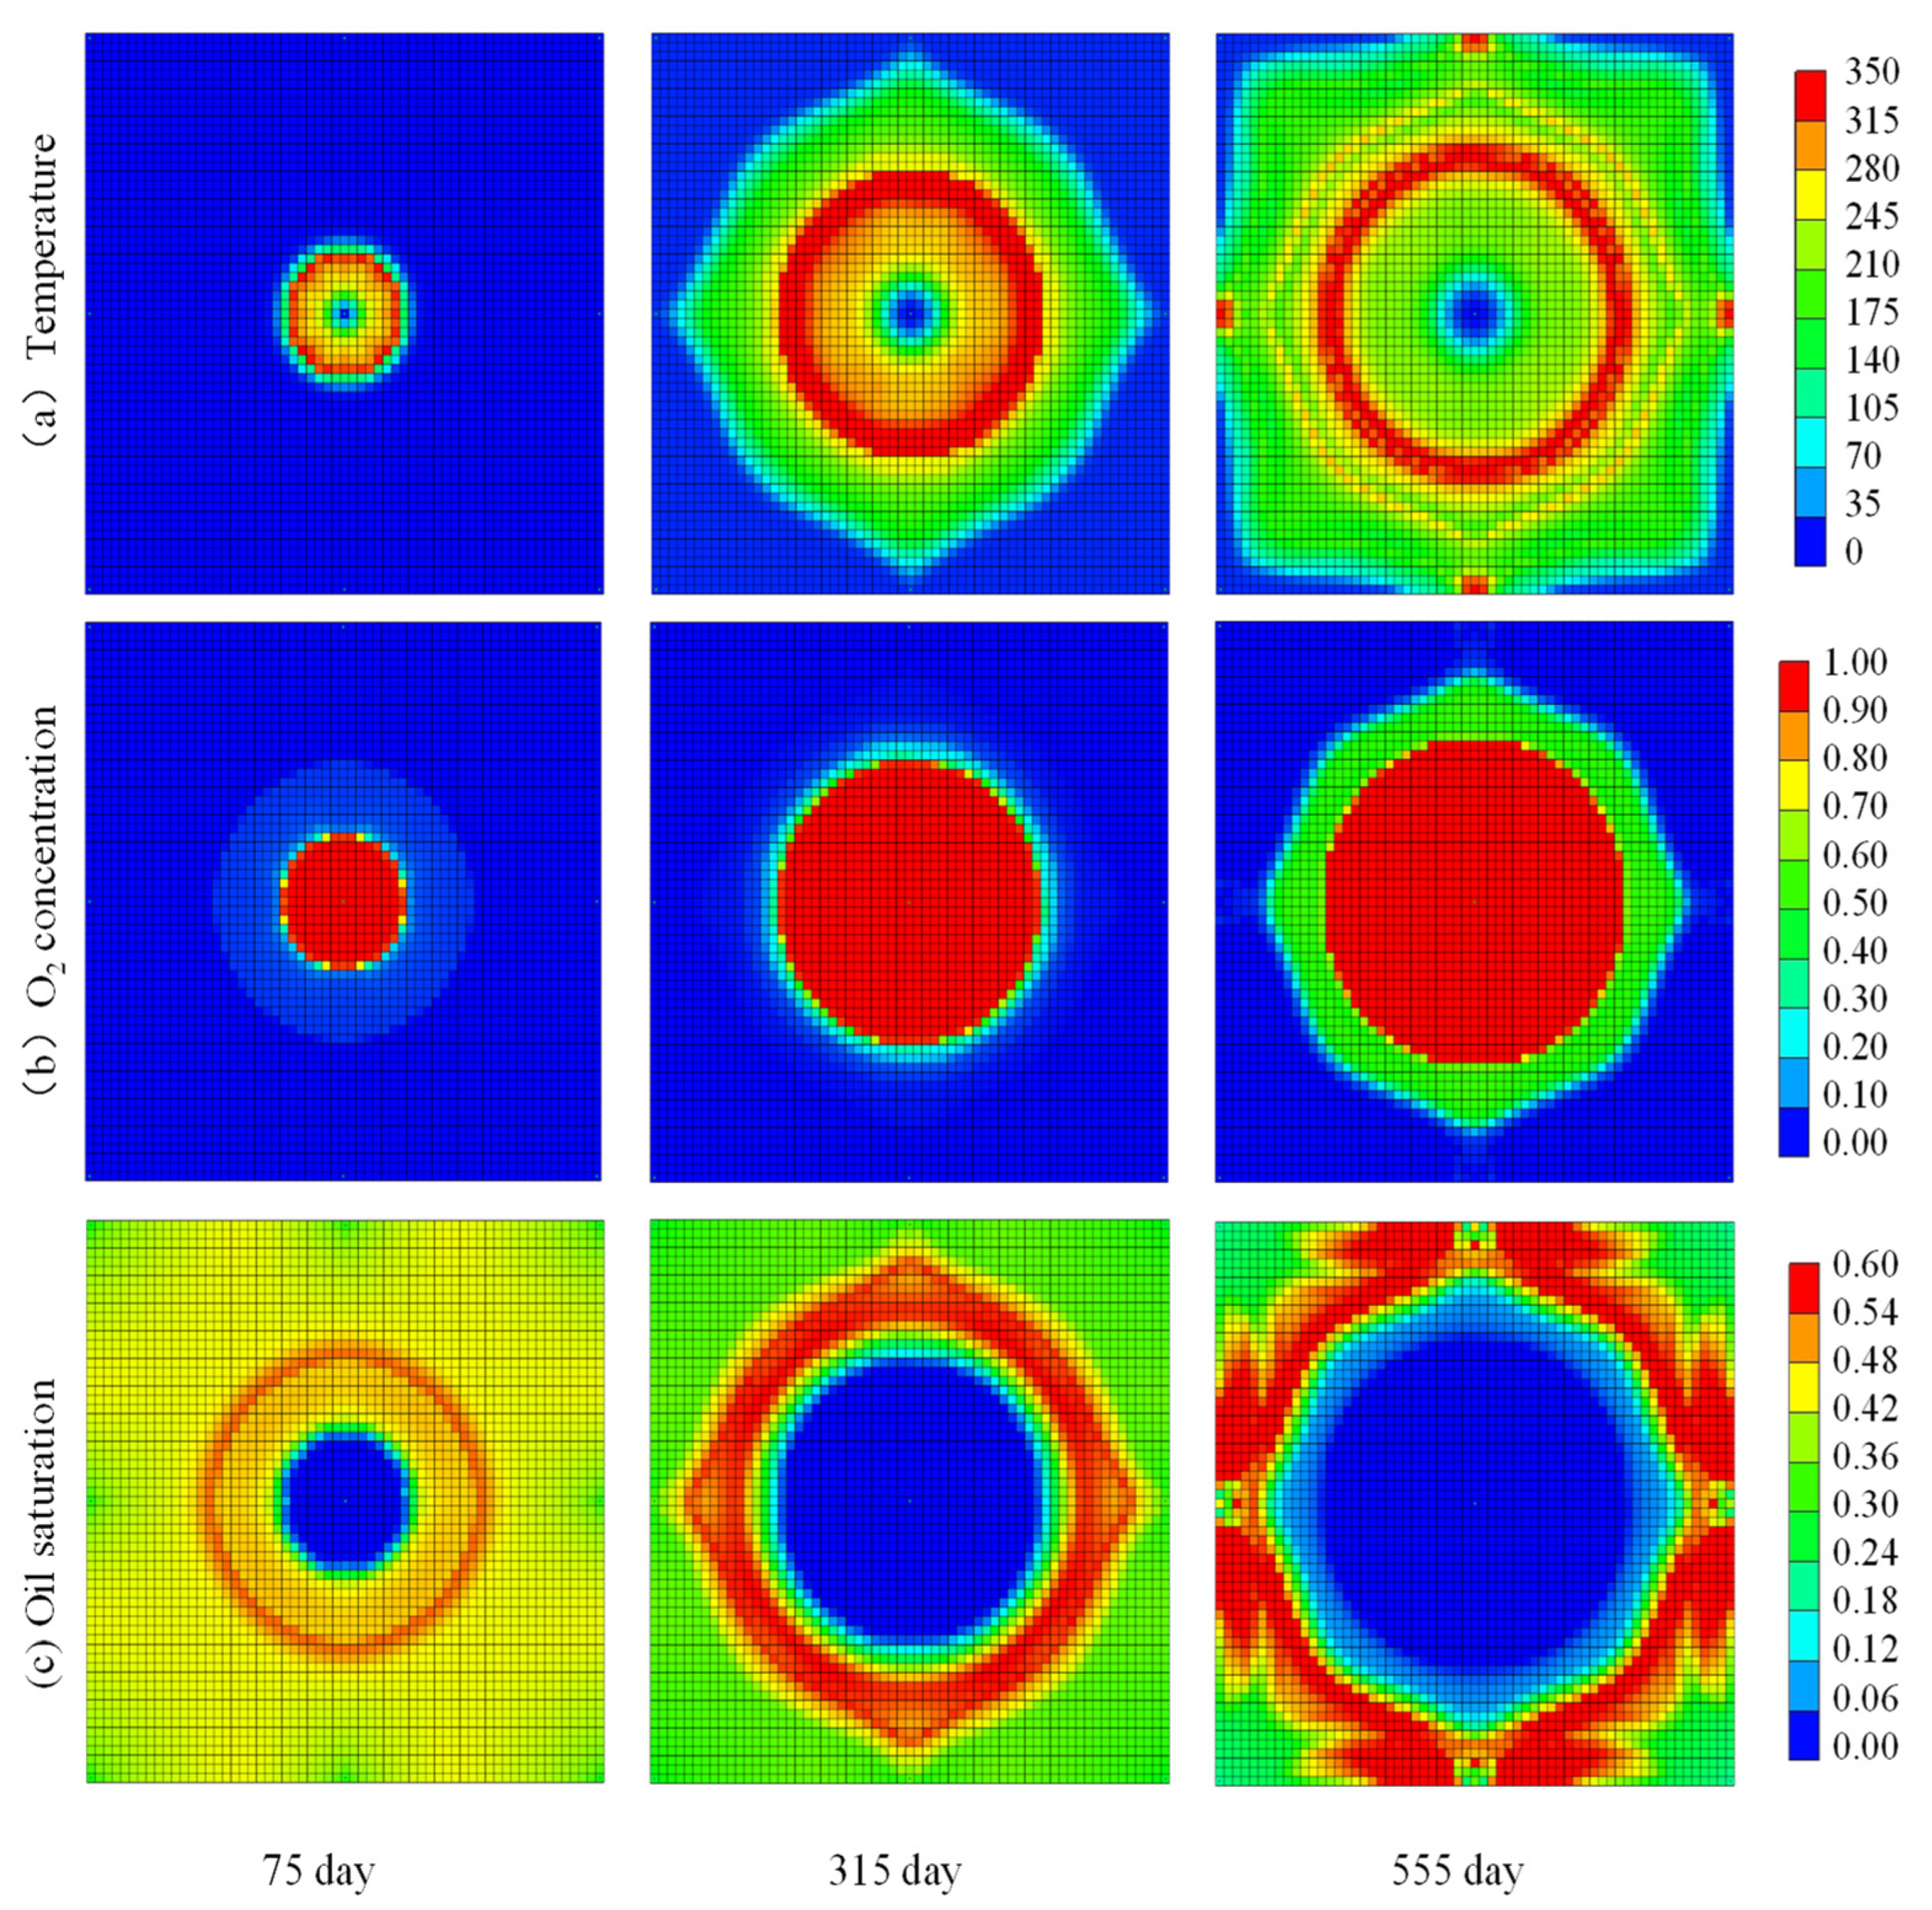
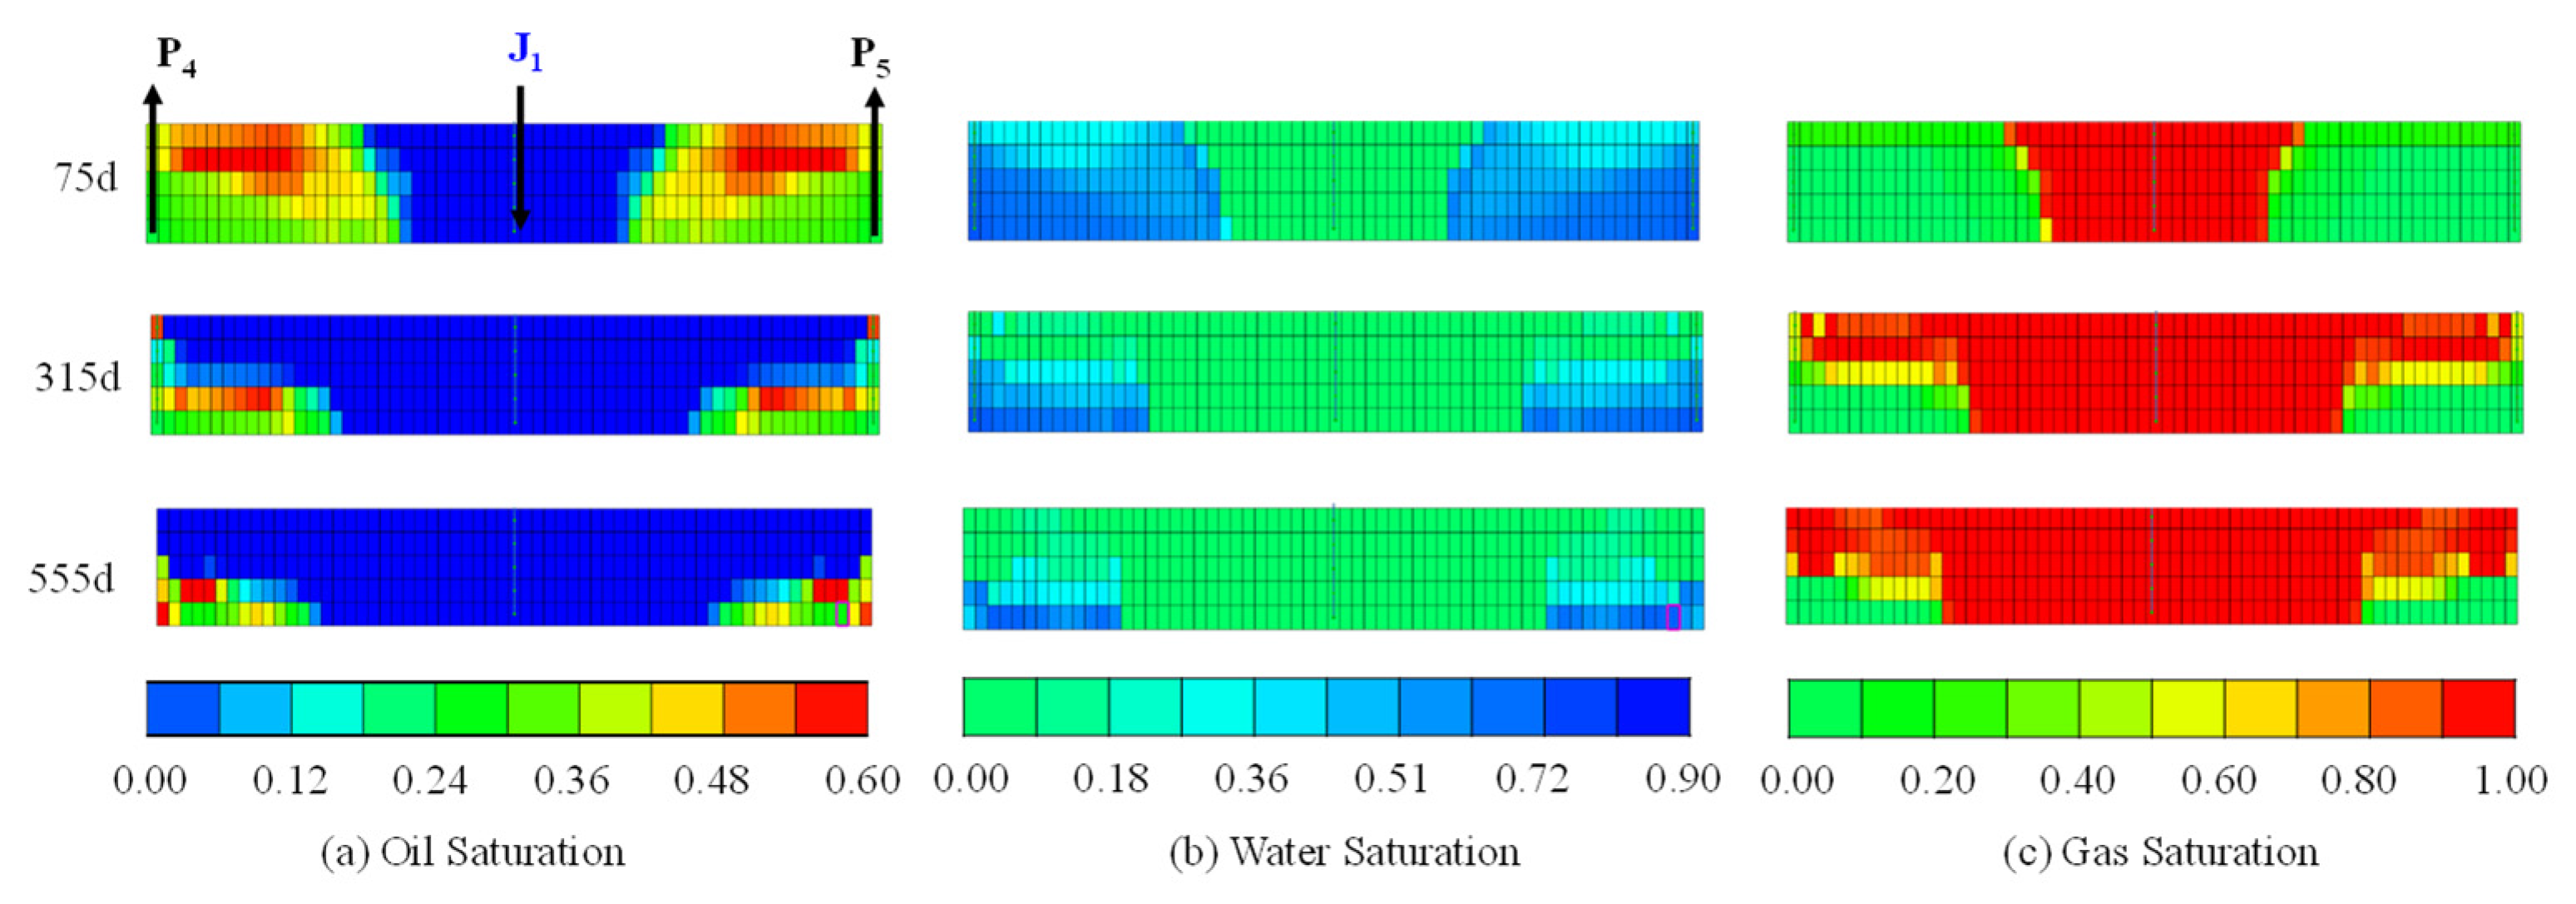
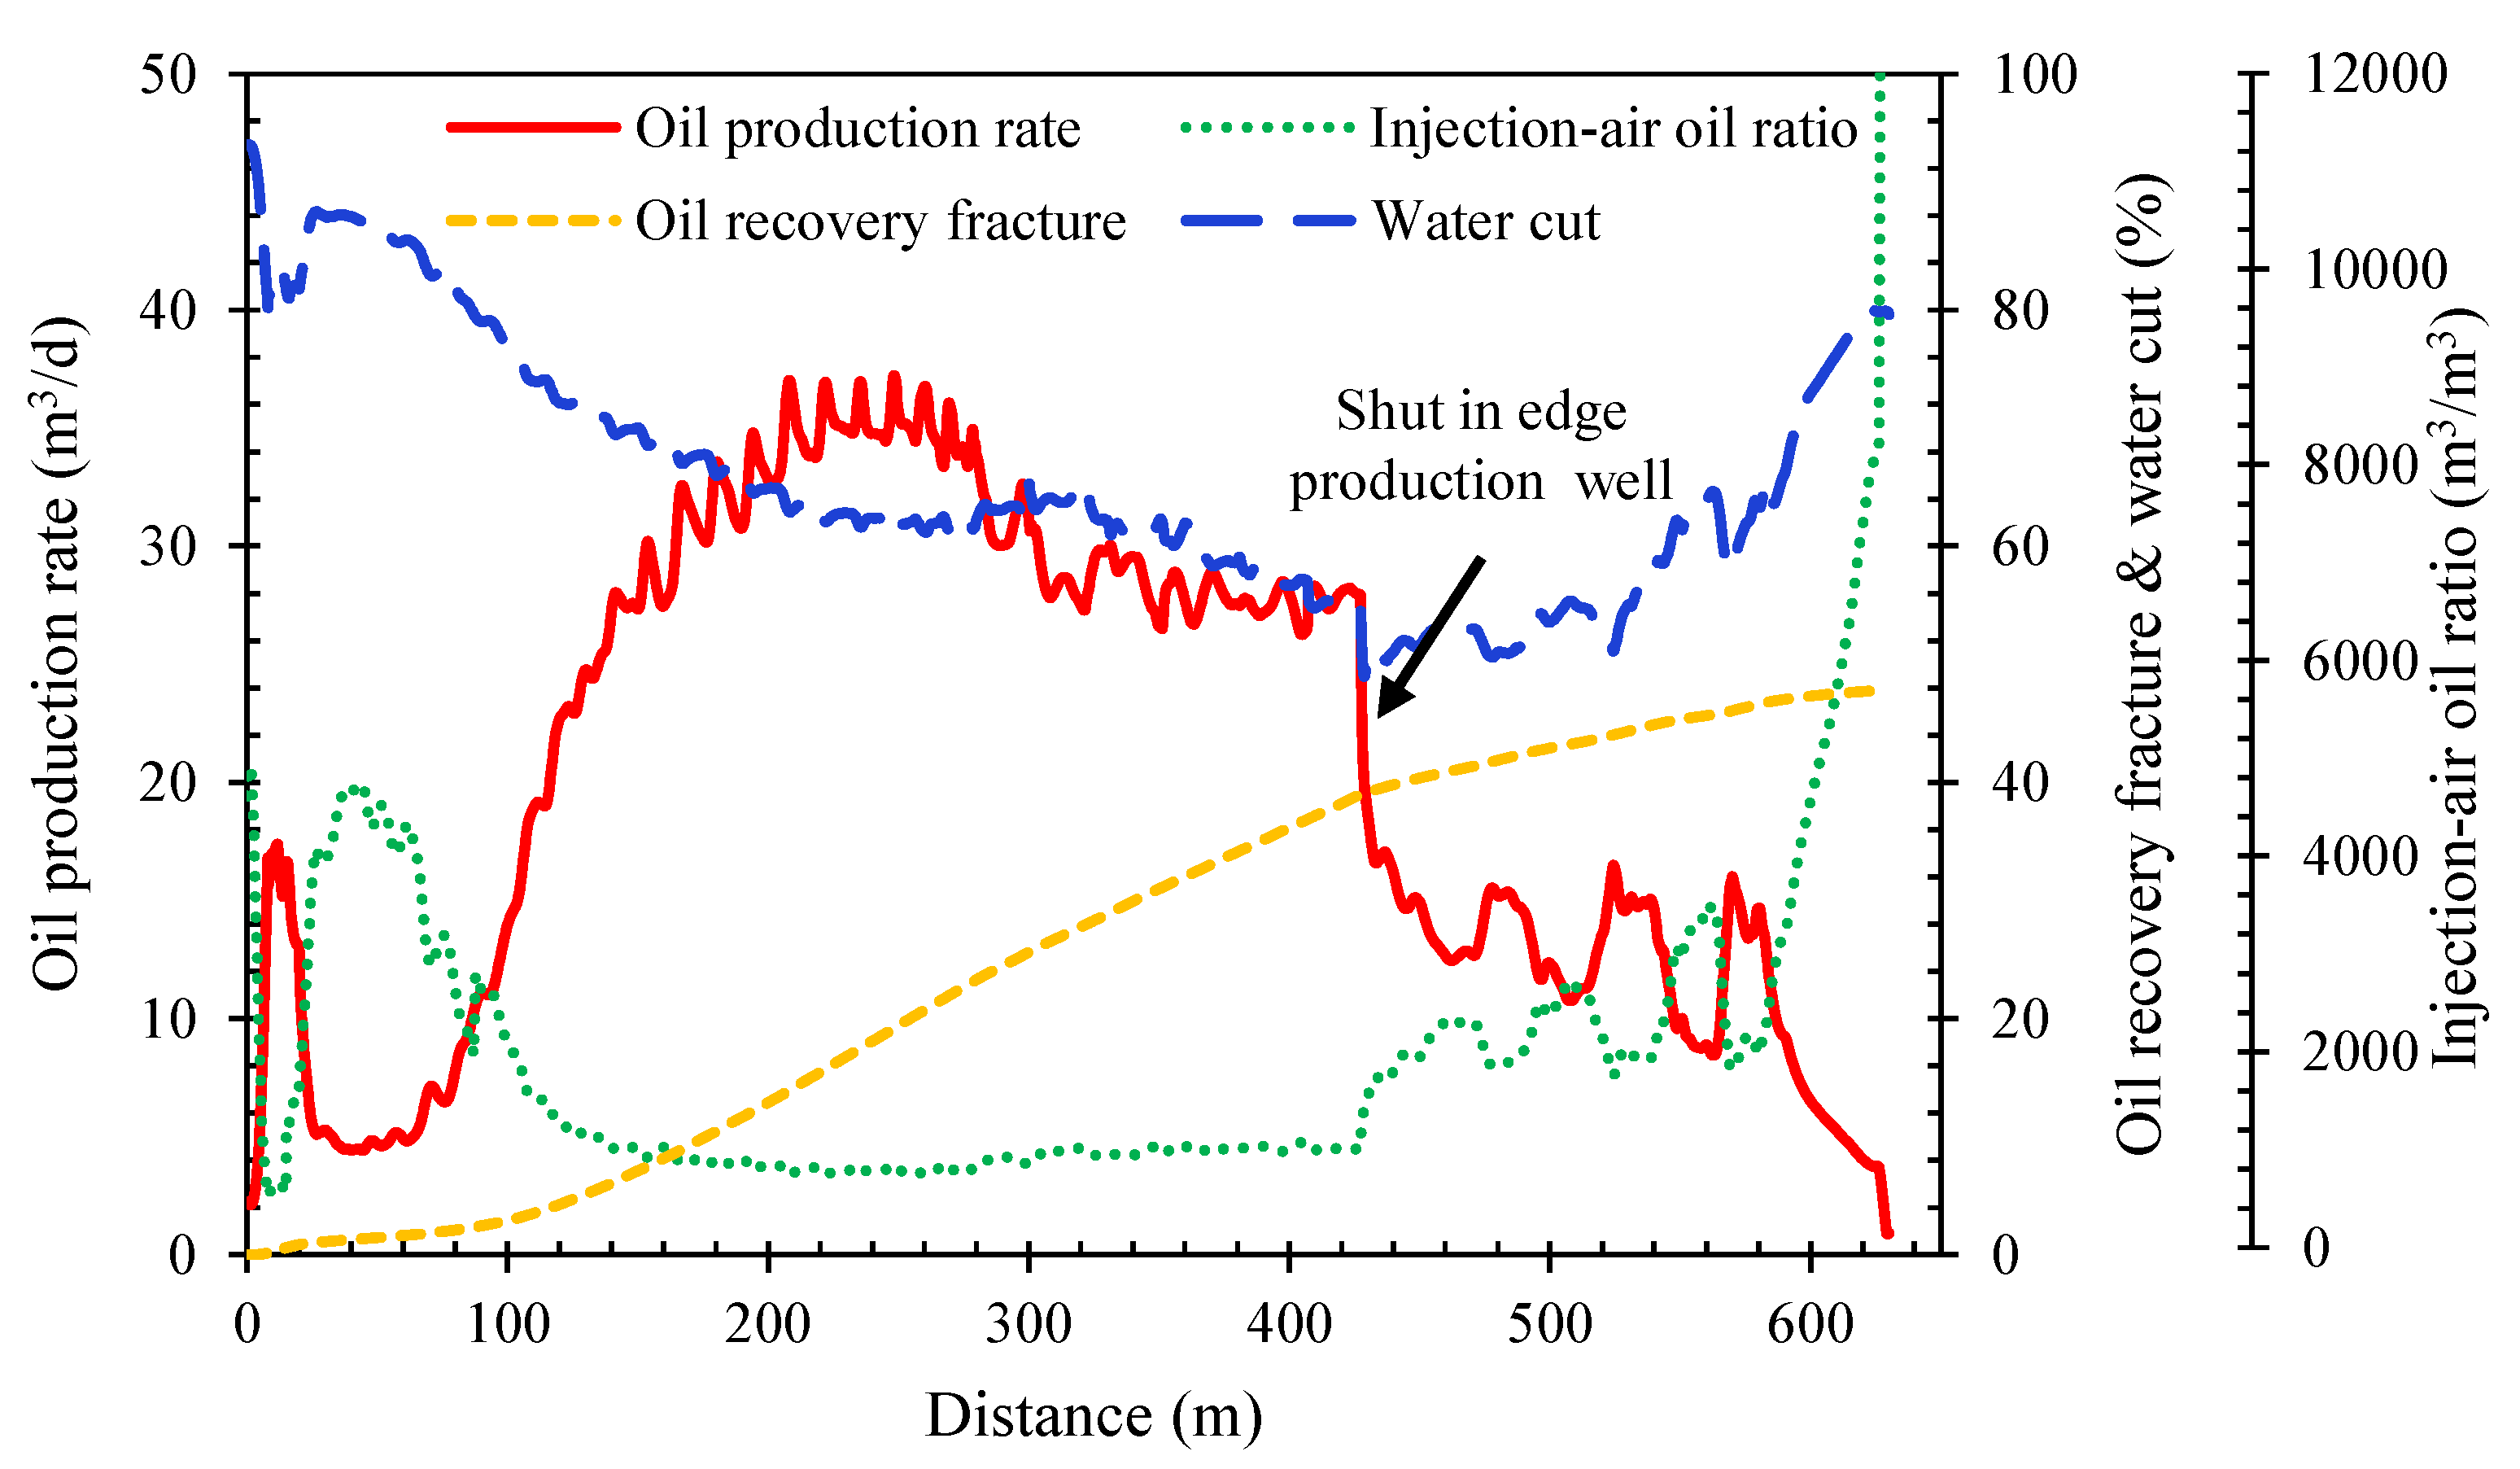
3.2. Results and Discussion

Figure 10 shows the temperature, oil saturation, and gas phase oxygen concentration fields during the air thermal miscible flooding at different periods in Layer 4. From Figure 10a, it can be seen that during the production in the high water cut stage, the air thermal miscible flooding can form a stable thermal oxidation front at 200~350 °C and steadily advance towards the production well, achieving stable progression within a single layer. At the same time, it can be observed from the figure that due to the effect of gravity differentiation, an overshoot of air occurs, resulting in a stratified thermal oxidation front in the temperature field. From Figure 10b, it can be observed that the oxygen in the injected gas is rapidly consumed at the position of the thermal oxidation front, with virtually no oxygen passing through it. Production wells can operate for an extended period with an oxygen concentration in the produced gas of less than 5%, ensuring the safety of field operations.
Figure 11 demonstrates the vertical distributions of oil, gas, and water during thermal miscible flooding at different stages. The results reveal significant gas overriding behavior, with gas chambers exhibiting an inverted triangular distribution. In the vertical profile, thermal miscible flooding forms a continuous oil bank that migrates toward the production well as gas injection increases. Most gas remains confined within the oil bank, while bound water is displaced and produced by gas under thermal effects. This indicates that thermal miscible flooding effectively suppresses chaotic gas migration through oil bank formation, thereby enhancing displacement efficiency.
Figure 12 displays the oil saturation profile curve of production wells P4 to P5 in Layer 4 at 315 days. In conjunction with Figure 10c, it can be seen that within the area affected by the high-temperature thermal oxidation front during the thermal miscible flooding process, the residual oil saturation is essentially zero. With this high efficiency of oil displacement, a stable oil-rich zone, commonly referred to as an ‘oil bank’, can form at the position of the thermal oxidation front. The width of this oil bank continues to increase as the thermal oxidation front advances.
Figure 13 illustrates the production dynamics of air miscible flooding in high water content reservoirs. The production curves indicate that air thermal miscible flooding in high water content reservoirs can be divided into three stages: pressure build-up and water displacement, efficient steady production at low air-oil ratio, and low-efficiency production. Air thermal miscible flooding is characterized by its rapid effect, good oil displacement efficiency, and a long period of high and stable production. The maximum daily oil production from air thermal miscible flooding can reach 37.2 cubic meters per day, with an average daily production of 35.2 cubic meters during the steady production period, and the recovery rate can exceed 47.8%. Numerical simulation results show that, based on the early development, air thermal miscible flooding can increase the reservoir’s recovery rate by 25.6%, and the ultimate recovery rate for the entire area can be as high as 71.1%.

4. Conclusions

This study conducted comparative analyses of one-dimensional indoor physical simulation experiments to evaluate various development methods for high water-content reservoirs. The experimental results demonstrate that gas flooding preferentially displaces mobile water within the reservoir. Under immiscible flooding conditions, gas channeling becomes a predominant issue, significantly limiting the enhanced oil recovery potential. Consequently, neither nitrogen nor carbon dioxide flooding yields substantial improvements in recovery rates for most high water-content reservoirs.
The one-dimensional indoor thermal miscible flooding experiments revealed that light oil reservoirs can maintain stable thermal front advancement even under high water-content conditions. This process facilitates efficient oxygen consumption while sustaining high oil saturation, leading to the formation of a distinct “oil bank”. The establishment of this oil bank plays a critical role in reservoir dynamics by: (1) substantially reducing gas relative permeability, (2) effectively suppressing gas flow, and (3) preventing gas channeling. These combined effects enable automatic reservoir profile adjustment, optimizing the displacement process.
Numerical simulation studies further confirm that air thermal miscible flooding generates a stable thermal oxidation front in high water-content reservoirs. The production mechanism can be systematically categorized into three distinct phases: (1) pressure build-up and water displacement phase, (2) efficient steady production phase characterized by low air-oil ratios, and (3) declining production phase. This innovative approach demonstrates significant potential for efficiently developing high water-content reservoirs, with theoretical calculations indicating a remarkable recovery rate enhancement exceeding 25%.

Author Contributions

D.H.: Methodology, Software, Investigation, Writing—original draft; C.X.: Resources, Investigation, Methodology; P.L.: Investigation, Visualization; T.L.: Conceptualization; F.Z.: Conceptualization; Y.W.: Writing—review and editing; H.D.: Visualization; H.G.: Conceptualization; M.W.: Investigation. All authors discussed the results and critically reviewed the manuscript. All authors have read and agreed to the published version of the manuscript.

Funding

This work was supported by the Research Project on Thermally Assisted Miscible Flooding Technology of PetroChina Oil and Gas Corporation (No. 2023ZG18) and the Major Development and Test Project on Pilot Test of Gas Injection Gravity Drainage in the Liaohe Dongshengpu Subsurface Reservoir (2023YQX10413ZK).

Data Availability Statement

Data presented in this study are available from the corresponding author upon reasonable request.

Conflicts of Interest

Daode Hua, Hongbao Du and Mimi Wu were employed by the Tarim Oilfield Company, PetroChina and R&D Center for Ultra-Deep Complex Reservoir Exploration and Development, China National Petroleum Corporation; Heng Gu was employed by the R&D Center for Ultra-Deep Complex Reservoir Exploration and Development, CNPC. The remaining authors declare that the research was conducted in the absence of any commercial or financial relationships that could be construed as a potential conflict of interest.

References

  1. Xue, L.; Liu, P.; Zhang, Y. Status and Prospect of Improved Oil Recovery Technology of High Water Cut Reservoirs. Water 2023, 15, 1342. [Google Scholar] [CrossRef]
  2. He, L.; Shujun, B.; Zixiu, Y.; Fuchao, S.; Jiaqing, Y.; Deli, J.; Yang, G. Practices of the Integrated Management System for Injection Water in Brown Field–Case Study. In Proceedings of the SPE Asia Pacific Oil & Gas Conference and Exhibition, Perth, Australia, 25–27 October 2016. [Google Scholar]
  3. Jamaloei, B.Y. Effective Conformance Control Strategies in Mature Waterfloods with Comingled Injection. In Proceedings of the SPE Annual Technical Conference and Exhibition, Houston, TX, USA, 3–5 October 2022. [Google Scholar]
  4. Lu, X.G.; Sun, S.Q.; Xu, J.H. Best Practice Case to Improve Oil Recovery: Revisit of the Largest Oilfield in China. In Proceedings of the SPE Caspian Technical Conference and Exhibition, Astana, Kazakhstan, 26–28 November 2024. [Google Scholar]
  5. Moradpour, H.; Chapoy, A.; Tohidi, B. Bimodal model for predicting the emulsion-hydrate mixture viscosity in high water cut systems. Fuel 2011, 90, 3343–3351. [Google Scholar] [CrossRef]
  6. Lin, H.; Hua, C.Z.; Li, M. Surface wettability control of reservoir rocks by brine. Pet. Explor. Dev. 2018, 45, 145–153. [Google Scholar] [CrossRef]
  7. Ma, K.; Sun, Z.; Shi, H. Maximize the Recovery Factor of Offshore High Water Cut Reservoir. In Proceedings of the Offshore Technology Conference, Houston, TX, USA, 6–9 May 2019. [Google Scholar]
  8. Amaro, I.P.; Chelhod, N.C.-Y.; Laprea-Bigott, M. Workflow for Optimization of Waterflood Performance: Field Example from El Furrial Field—East Venezuela Basin. In Proceedings of the SPE Latin American and Caribbean Petroleum Engineering Conference, Bogota, Colombia, 17–19 March 2020. [Google Scholar]
  9. Zhu, Y.; Gao, W.; Li, R.; Li, Y.; Yuan, J.; Kong, D.; Liu, J.; Yue, Z. Action laws and application effect of enhanced oil recovery by adjustable-mobility polymer flooding. Pet. Explor. Dev. 2018, 39, 189–200. [Google Scholar]
  10. Wei, Y.; Lu, X.; Xu, J. A Systematical Review of the Largest Alkali-Surfactant-Polymer Flood Project in the World: From Laboratory to Pilots and Field Application. SPE J. 2024, 29, 4147–4165. [Google Scholar] [CrossRef]
  11. Mahruqi, D.; Karpan, V.; Rawahi, H.; Abri, M.; Aamri, N.; Farsi, S.; Battashi, M.; Amri, S. Integrating ASP Flooding into Mature Polymer Flooding in Marmul Field in Southern Oman. In Proceedings of the SPE Conference at Oman Petroleum & Energy Show, Muscat, Oman, 22–24 April 2024. [Google Scholar]
  12. Gan, L.; Dai, X.; Zhang, X.; Li, L.; Du, W.; Liu, X.; Gao, Y.; Lu, M.; Ma, S.; Huang, Z. Key technologies for the seismic reservoir characterization of high water-cut oilfields. Pet. Explor. Dev. 2012, 39, 365–377. [Google Scholar] [CrossRef]
  13. Song, K.P.; Wang, C.C.; Fu, C.; Wu, X.H. The Research of Water Flooding Measures in Late High Water Cut Period of Secondary Reservoirs. Appl. Mech. Mater. 2014, 703, 308–311. [Google Scholar] [CrossRef]
  14. Zhao, X.J.; Zuo, S.L.; Wu, J.W. Study and application of strata and well pattern reconstruction technique at extra high water cut stage in Daqing Oilfield. Pet. Geol. Recovery Effic. 2019, 26, 82–87. [Google Scholar]
  15. Wang, H.; Hou, J.; Guo, Z.; He, S.; Du, Q.; Li, C. Evaluation of Different Well Converting Patterns with the Distribution of Streamlines on Ultra High Water Cut Reservoir. In Proceedings of the Offshore Technology Conference Asia, Kuala Lumpur, Malaysia, 48–55 November 2020. [Google Scholar]
  16. Liu, J.; Cheng, R.; Zhang, Z.; Chen, B. Numerical Simulation of N2 Foam Flooding in Medium-Permeability Light-Oil Reservoir with Ultra-High Water Cut. Chem. Technol. Fuels Oils 2017, 53, 286–295. [Google Scholar] [CrossRef]
  17. Gao, J.; Yao, Y.; Bao, H.; Shen, J. Laboratory Evaluation Experiment for Adaptability Analysis of Nitrogen Injection in Yanchang Oil Field. In Proceedings of the Abu Dhabi International Petroleum Exhibition & Conference, Abu Dhabi, United Arab Emirates, 15–18 November 2022. [Google Scholar]
  18. Jiang, T.; Zhou, D.; Lian, L.; Wu, Y.; Wu, Z.; Fan, K.; Zhou, W.; Bian, W.; Shao, G.; Fan, J.; et al. Research of Phase Behavior in Natural Gas Drive Process and Its Application in T_D Reservoir with HTHP. In Proceedings of the SPE Middle East Oil & Gas Show and Conference, Sanabis, Bahrain, 28 November 2021. [Google Scholar]
  19. Zhang, Y.; Li, B.; Lu, T.; Li, Z.; Zeng, X.; Song, Y. Adaptation study on nitrogen foam flooding in thick reservoirs with high water cut and high permeability. Colloids Surfaces A 2023, 657, 130539. [Google Scholar] [CrossRef]
  20. Srivastava, R.K.; Huang, S.S. Laboratory investigation of weyburn CO2 miscible flooding. In Proceedings of the Technical Meeting/Petroleum Conference of the South Saskatchewan Section, Regina, SK, Canada, 18–21 October 1997. [Google Scholar]
  21. Qin, J.; Zhang, K.; Chen, X. Mechanism of the CO2 flooding as reservoirs containing high water. Acta Pet. Sin. 2010, 31, 797–800. [Google Scholar]
  22. Wu, X.; Zhang, Y.; Zhang, K.; Liu, B.; Zuo, J.Y.; Chen, G. An experimental investigation of liquid CO2-in-water emulsions for improving oil recovery. Fuel 2020, 288, 119734. [Google Scholar] [CrossRef]
  23. Xi, C.; Wang, B.; Zhao, F.; Liu, T.; Qi, Z.; Zhang, X.; Tang, J.; Jiang, Y.; Guan, W.; Wang, H.; et al. Oxidization characteristics and thermal miscible flooding of high pressure air injection in light oil reservoirs. Pet. Explor. Dev. 2022, 49, 874–885. [Google Scholar] [CrossRef]
  24. Xi, C.; Wang, B.; Zhao, F.; Hua, D.; Qi, Z.; Liu, T.; Zhao, Z.; Tang, J.; Zhou, Y.; Wang, H. Miscibility of light oil and flue gas under thermal action. Pet. Explor. Dev. 2024, 51, 164–171. [Google Scholar] [CrossRef]
Figure 1. The schematic diagram of the experimental platform.
Energies 18 02783 g001
Figure 2. The temperature curves of the thermal miscible flooding. (a) The curve of different measuring points with time. (b) The curve at different locations at the same time.
Energies 18 02783 g002
Figure 3. The highest temperature curve of measuring points in the thermal miscible flooding experiment.
Energies 18 02783 g003
Figure 4. The gas composition curve in the thermal miscible flooding experiment.
Energies 18 02783 g004
Figure 5. The liquid and gas production curves of different gas flooding methods.
Energies 18 02783 g005
Figure 6. The oil production and oil recovery curves of different gas flooding methods.
Energies 18 02783 g006
Figure 7. The gas–liquid ratio curves of different gas flooding methods.
Energies 18 02783 g007
Figure 8. The water cut curves of different gas flooding technology.
Energies 18 02783 g008
Figure 9. Schematic diagram of thermal miscible flooding numerical simulation model.
Energies 18 02783 g009
Figure 10. Field maps of high water cut air thermal miscible flooding at different times (Sub-layer 4).
Energies 18 02783 g010
Figure 11. Field maps of high water cut air thermal miscible flooding at different times (cross-section).
Energies 18 02783 g011
Figure 12. Oil saturation profile curve from production wells P4 to P5 at 315 days (layer 4).
Energies 18 02783 g012
Figure 13. Production dynamics curve of air thermal miscible flooding in the high water cut phase.
Energies 18 02783 g013
Table 1. Parameter table of the experimental platform.
Pressure range, MPa0~15Pressure accuracy, %FS0.25
Temperature range, °C0~650Temperature accuracy, °C±1
Porous mediaCore, Glass beads, QuartzInjection fluidGas, Water, Chemical reagents
Table 2. The experimental parameters.
No.Temperature, °CPressure, MPaPressure, %Gas Flooding TechnologiesGas Injection Rate, L/min
1451050~55N2 flooding1.1
2451050~55CO2 flooding1.1
3451050~55Thermal miscible flooding1.1
Table 3. The parameters of saturated crude oil and water flooding.
No.Porosity,
%
Injection Water,
mL
Saturated Water,
mL
Injection Oil,
mL
Saturated Oil,
mL
Oil Saturation,
%
Water Flooding Recovery Factor,
%
139.64000.01909.93000.01608.184.252.89
238.93000.01876.23000.01587.384.653.26
338.53500.01856.93000.01589.585.653.02
Table 4. The parameters of numerical simulation model.
ParametersValue
Grid Number61 × 61 × 7
Reservoir Depth (m)1000.00
Formation Thickness (m)70
Initial Formation Pressure (MPa)10.00
Formation Temperature (°C)45.00
Formation Porosity (f)0.30
Formation Permeability (mD)779.00
Crude Oil Viscosity (@20 °C, mPa·s)10.00
Initial Oil Saturation (%)55%
After Water Flooding Average Oil Saturation (%)30.00
Heavy Component Ratio (%)0.16
Table 5. The parameters of components of air thermal miscible flooding.
ParametersWaterHeavy OilLight OilCO2CH4N2O2Coke
Molecular weight (g/mol)18.00479.00162.0044.0016.0028.0032.0013.00
Critical pressure (kPa)22,0481496.492852.907376.4646003394.39506.62/
Critical tempareture (°C)374.15962.02321.5631.05−82.55−146.95−118.55/
KV1 (kPa)0.000.003.95 × 1068.621 × 1085.455 × 105///
KV2 (°C)0.000.000.002.6072.85 × 10−7
KV3 (°C)0.000.000.006.14154.46
KV4 (°C)0.000.00−3999.90−3112−919.2///
KV5 (°C)0.000.00−273.15−191.2−149.9///
Table 6. Reaction equation and specific parameters of numerical simulation.
Reaction EquationPre-Exponential Factor (s−1)Activation Energy (kJ/mol)Heat of Reaction (kJ/mol, O2)
13 heavy oil→26 light oil + 155 coke2.167 × 1091.828 × 1050.000
1 heavy oil+ 4 O2→6 water + 3 light oil + 1 CO2 + 1 coke1.51 × 1064.058 × 1042.127 × 106
2 light oil + 37O2→30 water + 22CO21.200 × 1077.183 × 1042.033 × 108
4 coke + 5O2→2 water + 4CO28.870 × 1055.262 × 1045.960 × 105
Table 7. Injection and production parameters of the numerical simulation.
PhaseGas Injection Rate (m3/d)Production and Injiection Ratio (f)Injection Gas Composition Ratio (N2:O2:CO2) (f)
Starup phase25,000.000.850.79:0.21:0.00
Stable phase50,000.000.850.79:0.21:0.00
Disclaimer/Publisher’s Note: The statements, opinions and data contained in all publications are solely those of the individual author(s) and contributor(s) and not of MDPI and/or the editor(s). MDPI and/or the editor(s) disclaim responsibility for any injury to people or property resulting from any ideas, methods, instructions or products referred to in the content.

