
PSA-Optimized Compressor Speed Control Strategy of Electric Vehicle Thermal Management Systems


Abstract

1. Introduction
2. VTM Experimental Platform
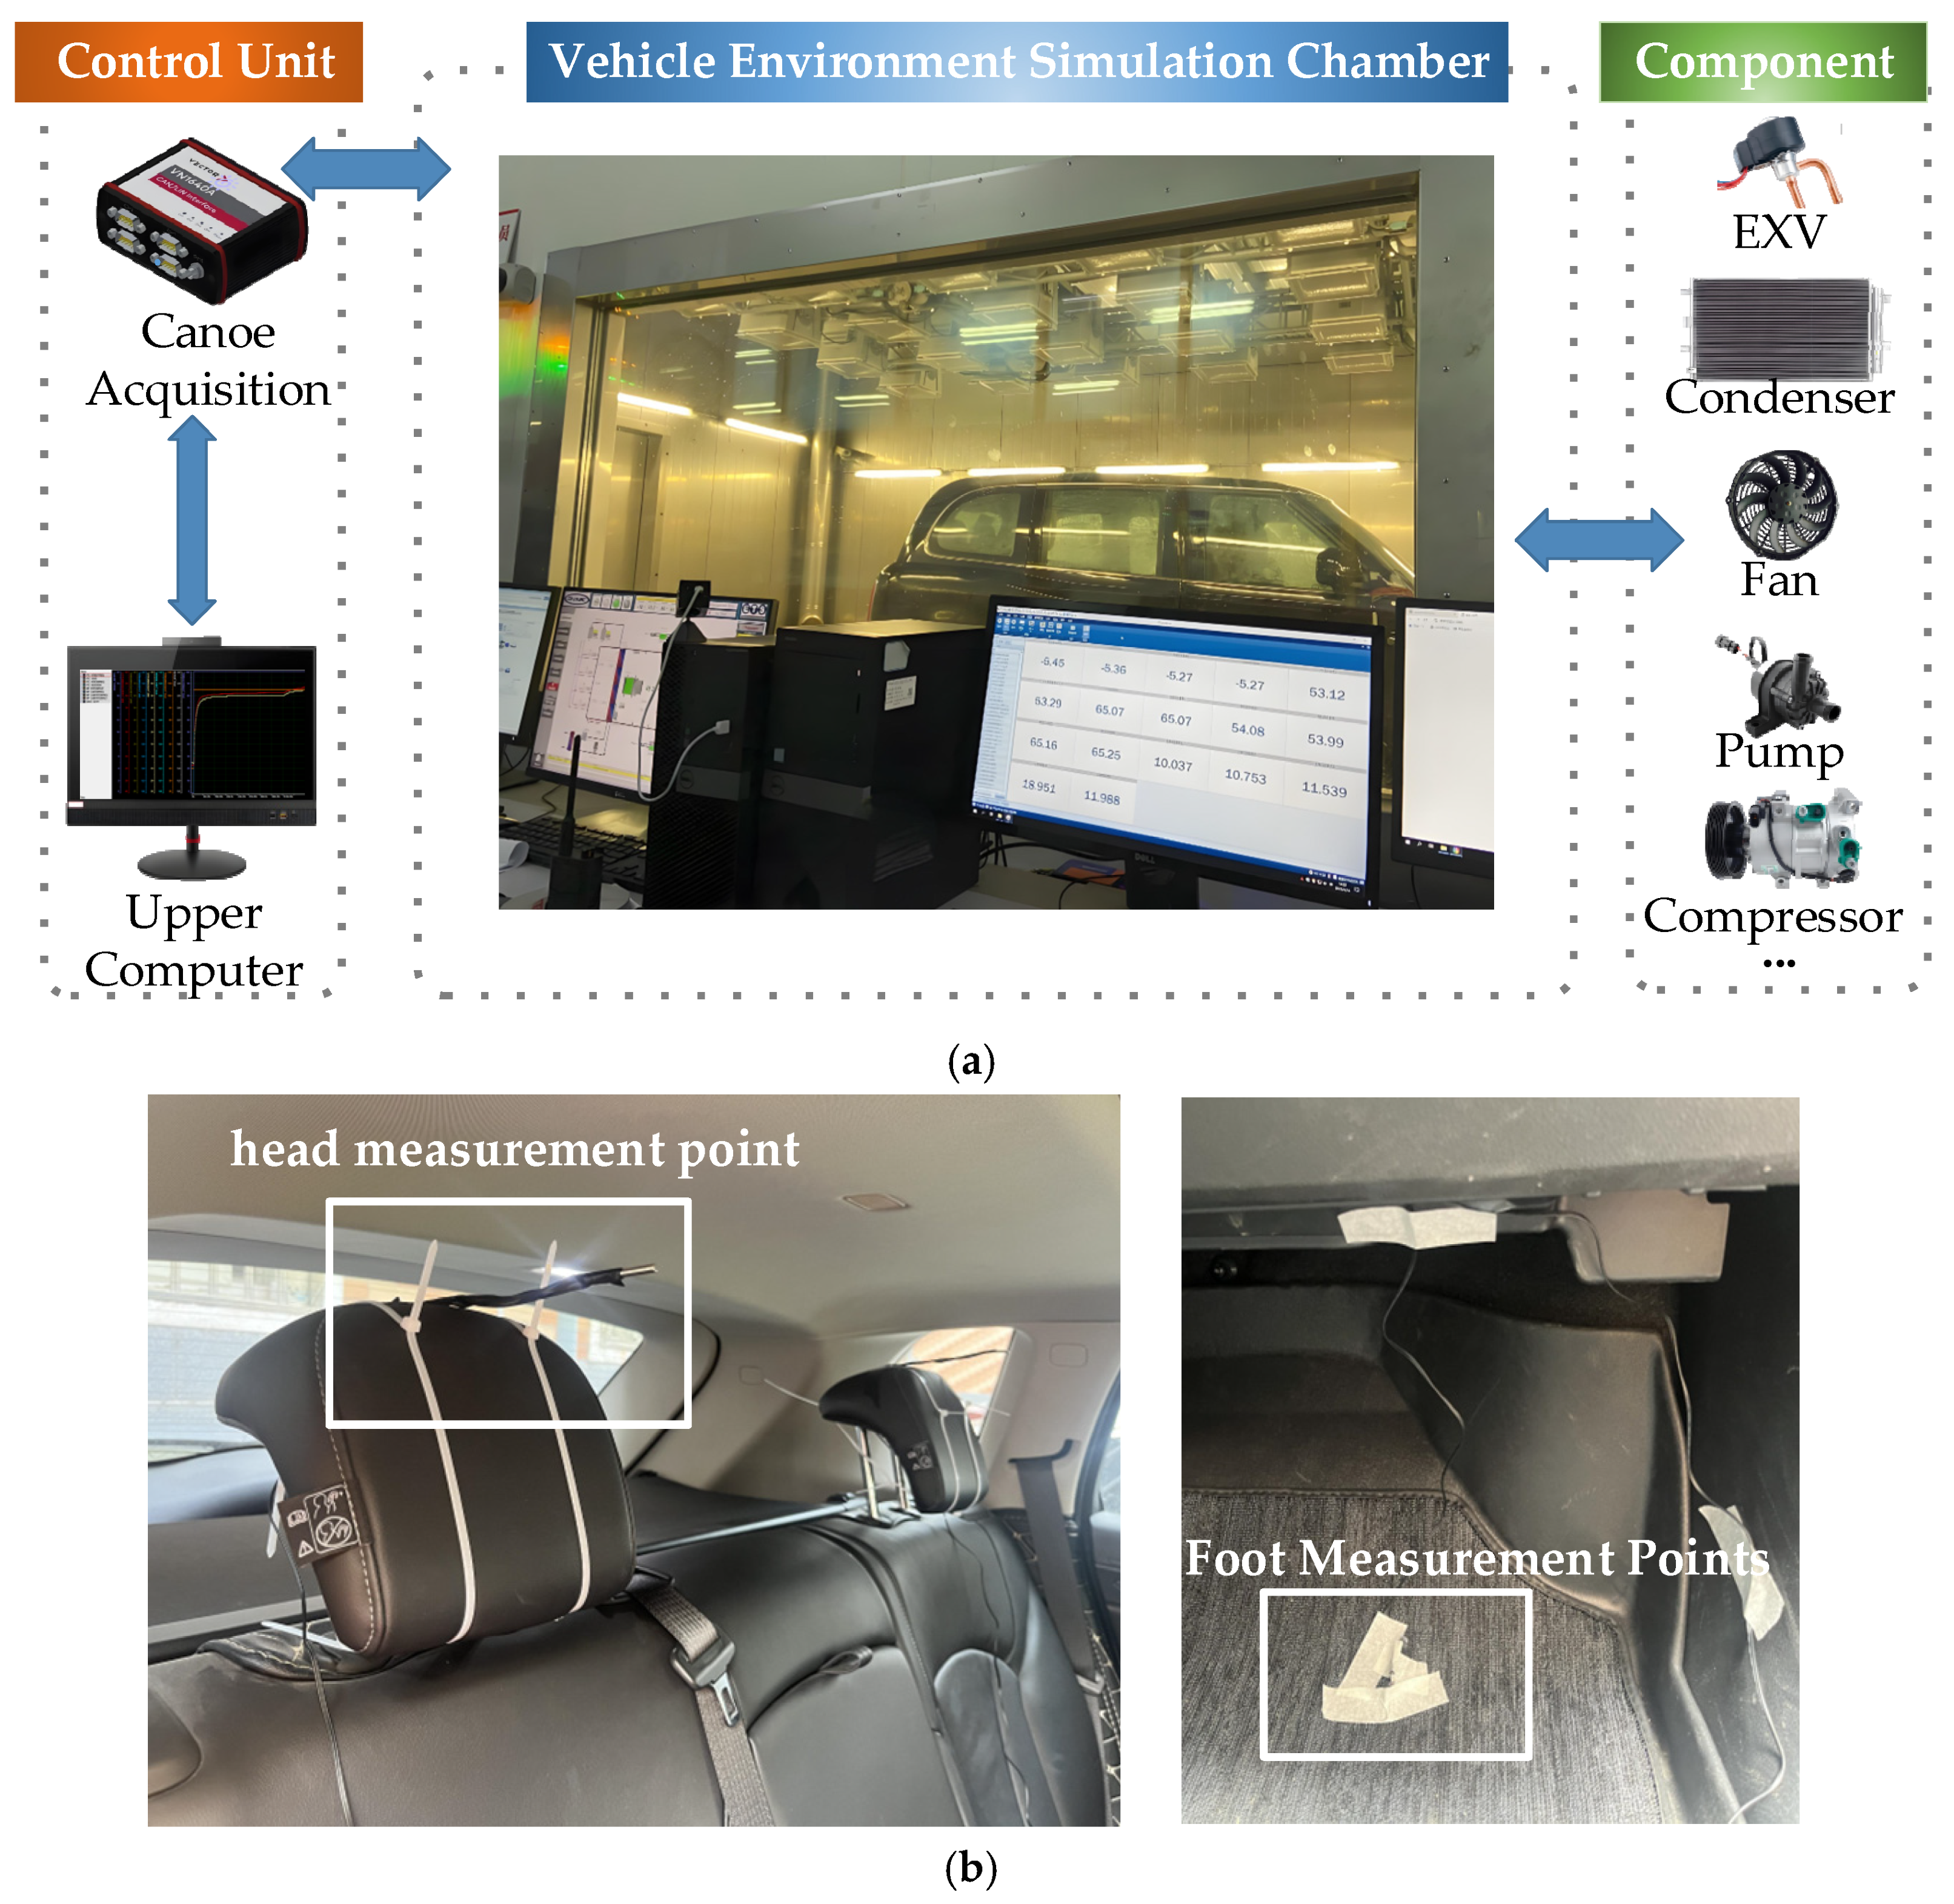
2.1. Experimental Platform and Setup
- (1)
- Vehicle preparation and soaking: Before formal testing, the test vehicle undergoes a comprehensive safety inspection. It is then placed on a roller dynamometer inside the environmental chamber set to a constant ambient temperature of 40 °C. The vehicle is soaked in this environment for a period ranging from 6 to 36 h to ensure thermal equilibrium. This means all internal components and fluid temperatures (e.g., coolant, refrigerant) stabilize and match the chamber temperature, which is crucial for ensuring repeatable and comparable test starting conditions.
- (2)
- Dynamic driving cycle execution: Following the soaking period, the vehicle is driven on the roller dynamometer strictly according to the prescribed vehicle speed profile of the defined driving cycle.
- (3)
- Data acquisition and analysis: Throughout the driving cycle, relevant data from various key measurement points and sensors on the vehicle and thermal management system are continuously collected. This includes, for example, cabin temperature, heat exchanger inlet/outlet temperatures, refrigerant pressures, compressor speed, and power consumption. After the test is completed, the collected data are analyzed to assess the thermal management system’s control performance and energy efficiency under dynamic conditions.
2.2. Closed-Loop Control System Architecture
- (1)
- Parameter setting and adjustment: Operators use the Upper Computer to set up target conditions and controller parameters before and during the experiment and to make adjustments when needed (e.g., by changing target temperatures).
- (2)
- Monitoring and data acquisition: For monitoring and logging, the Upper Computer displays live data, including important measurements, internal controller information, and commands. Simultaneously, related control and feedback signals are transmitted via the CAN bus to CANoe. Within CANoe, the Graphics function is utilized to log and visually display signal waveforms, facilitating detailed analysis later on for the control logic and system response.
3. Thermal Management System Architecture and Model Validation
3.1. Thermal Management System Architecture and Modes
3.2. Mathematical and Thermal Models
3.2.1. Cabin Thermal Load Analysis
- Solar Radiation Heat Load
- 2.
- Heat exchange between the external environment and the vehicle
- 3.
- Heat Load from Occupant Metabolism and Electronic Devices
- 4.
- Ventilation heat load
- 5.
- Cabin Temperature Change Rate
3.2.2. Battery Heat Generation
3.2.3. Required Cooling Capacity
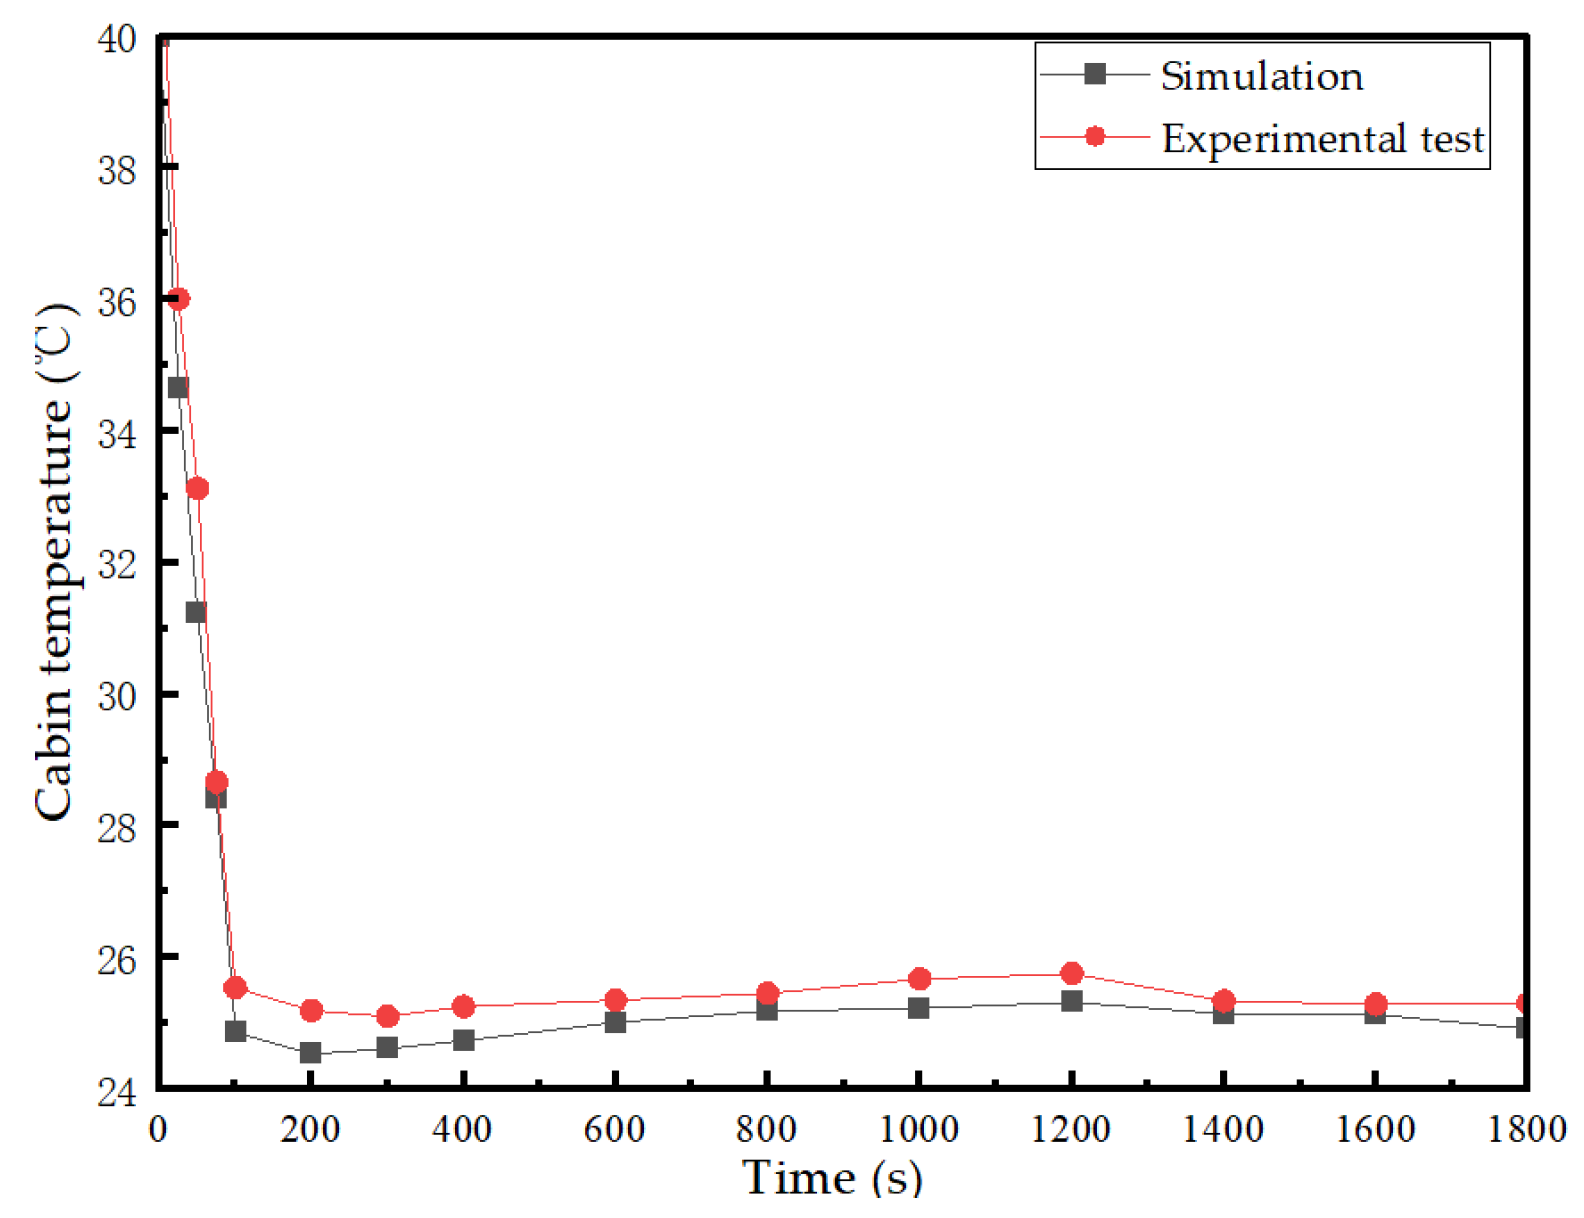
3.3. Model Validation: Comparison of Cabin Temperature Simulation and Experimental Test Results
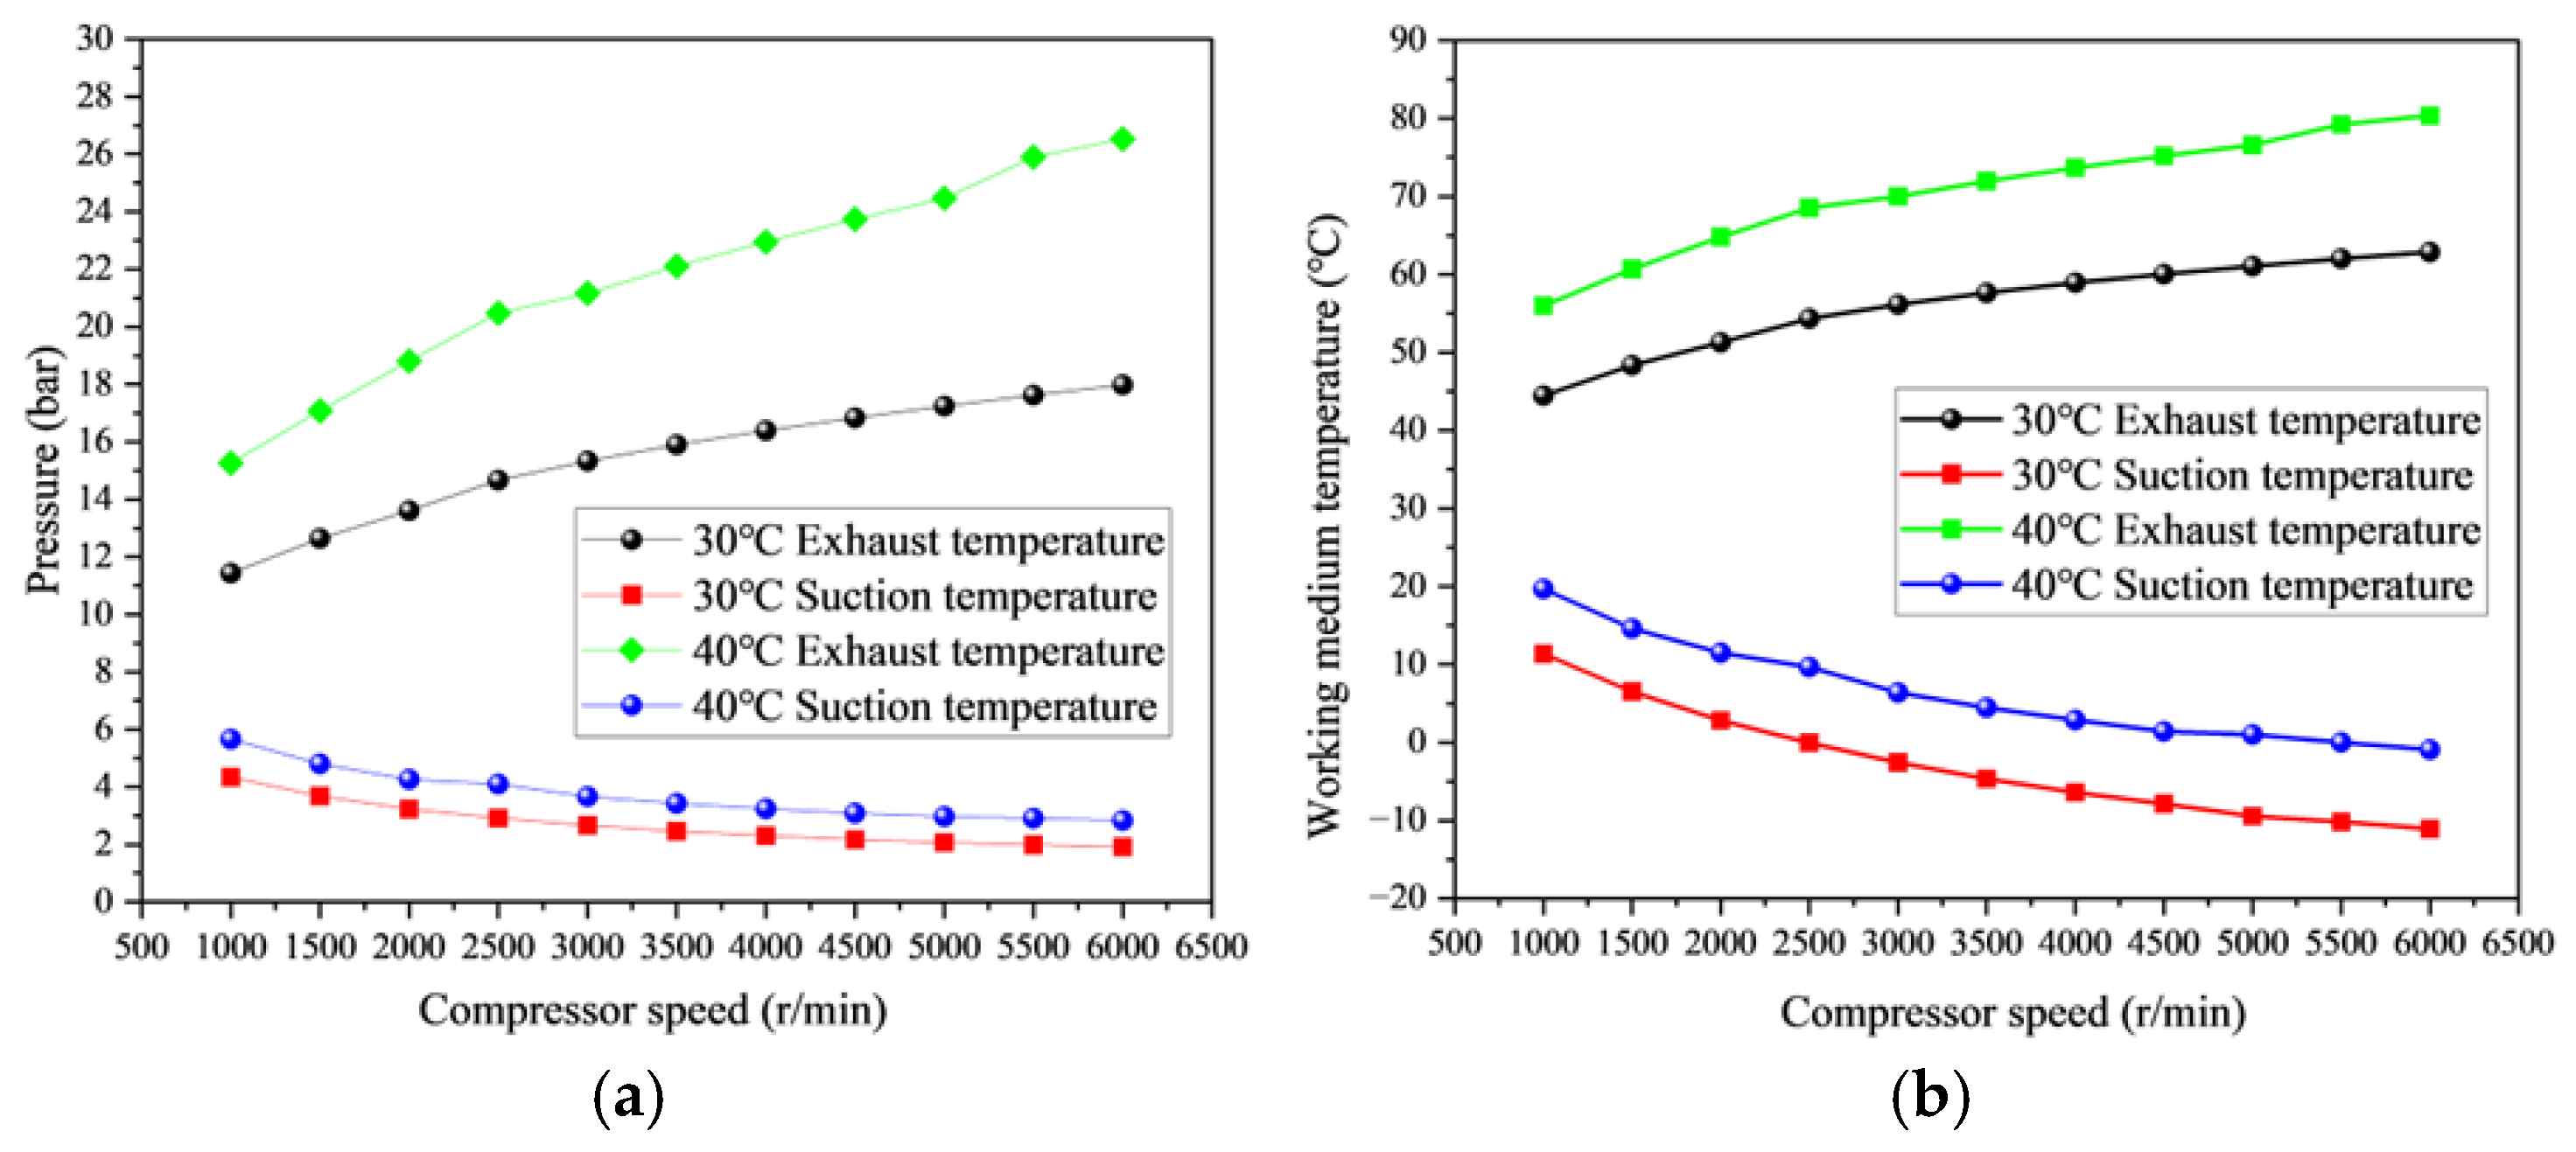
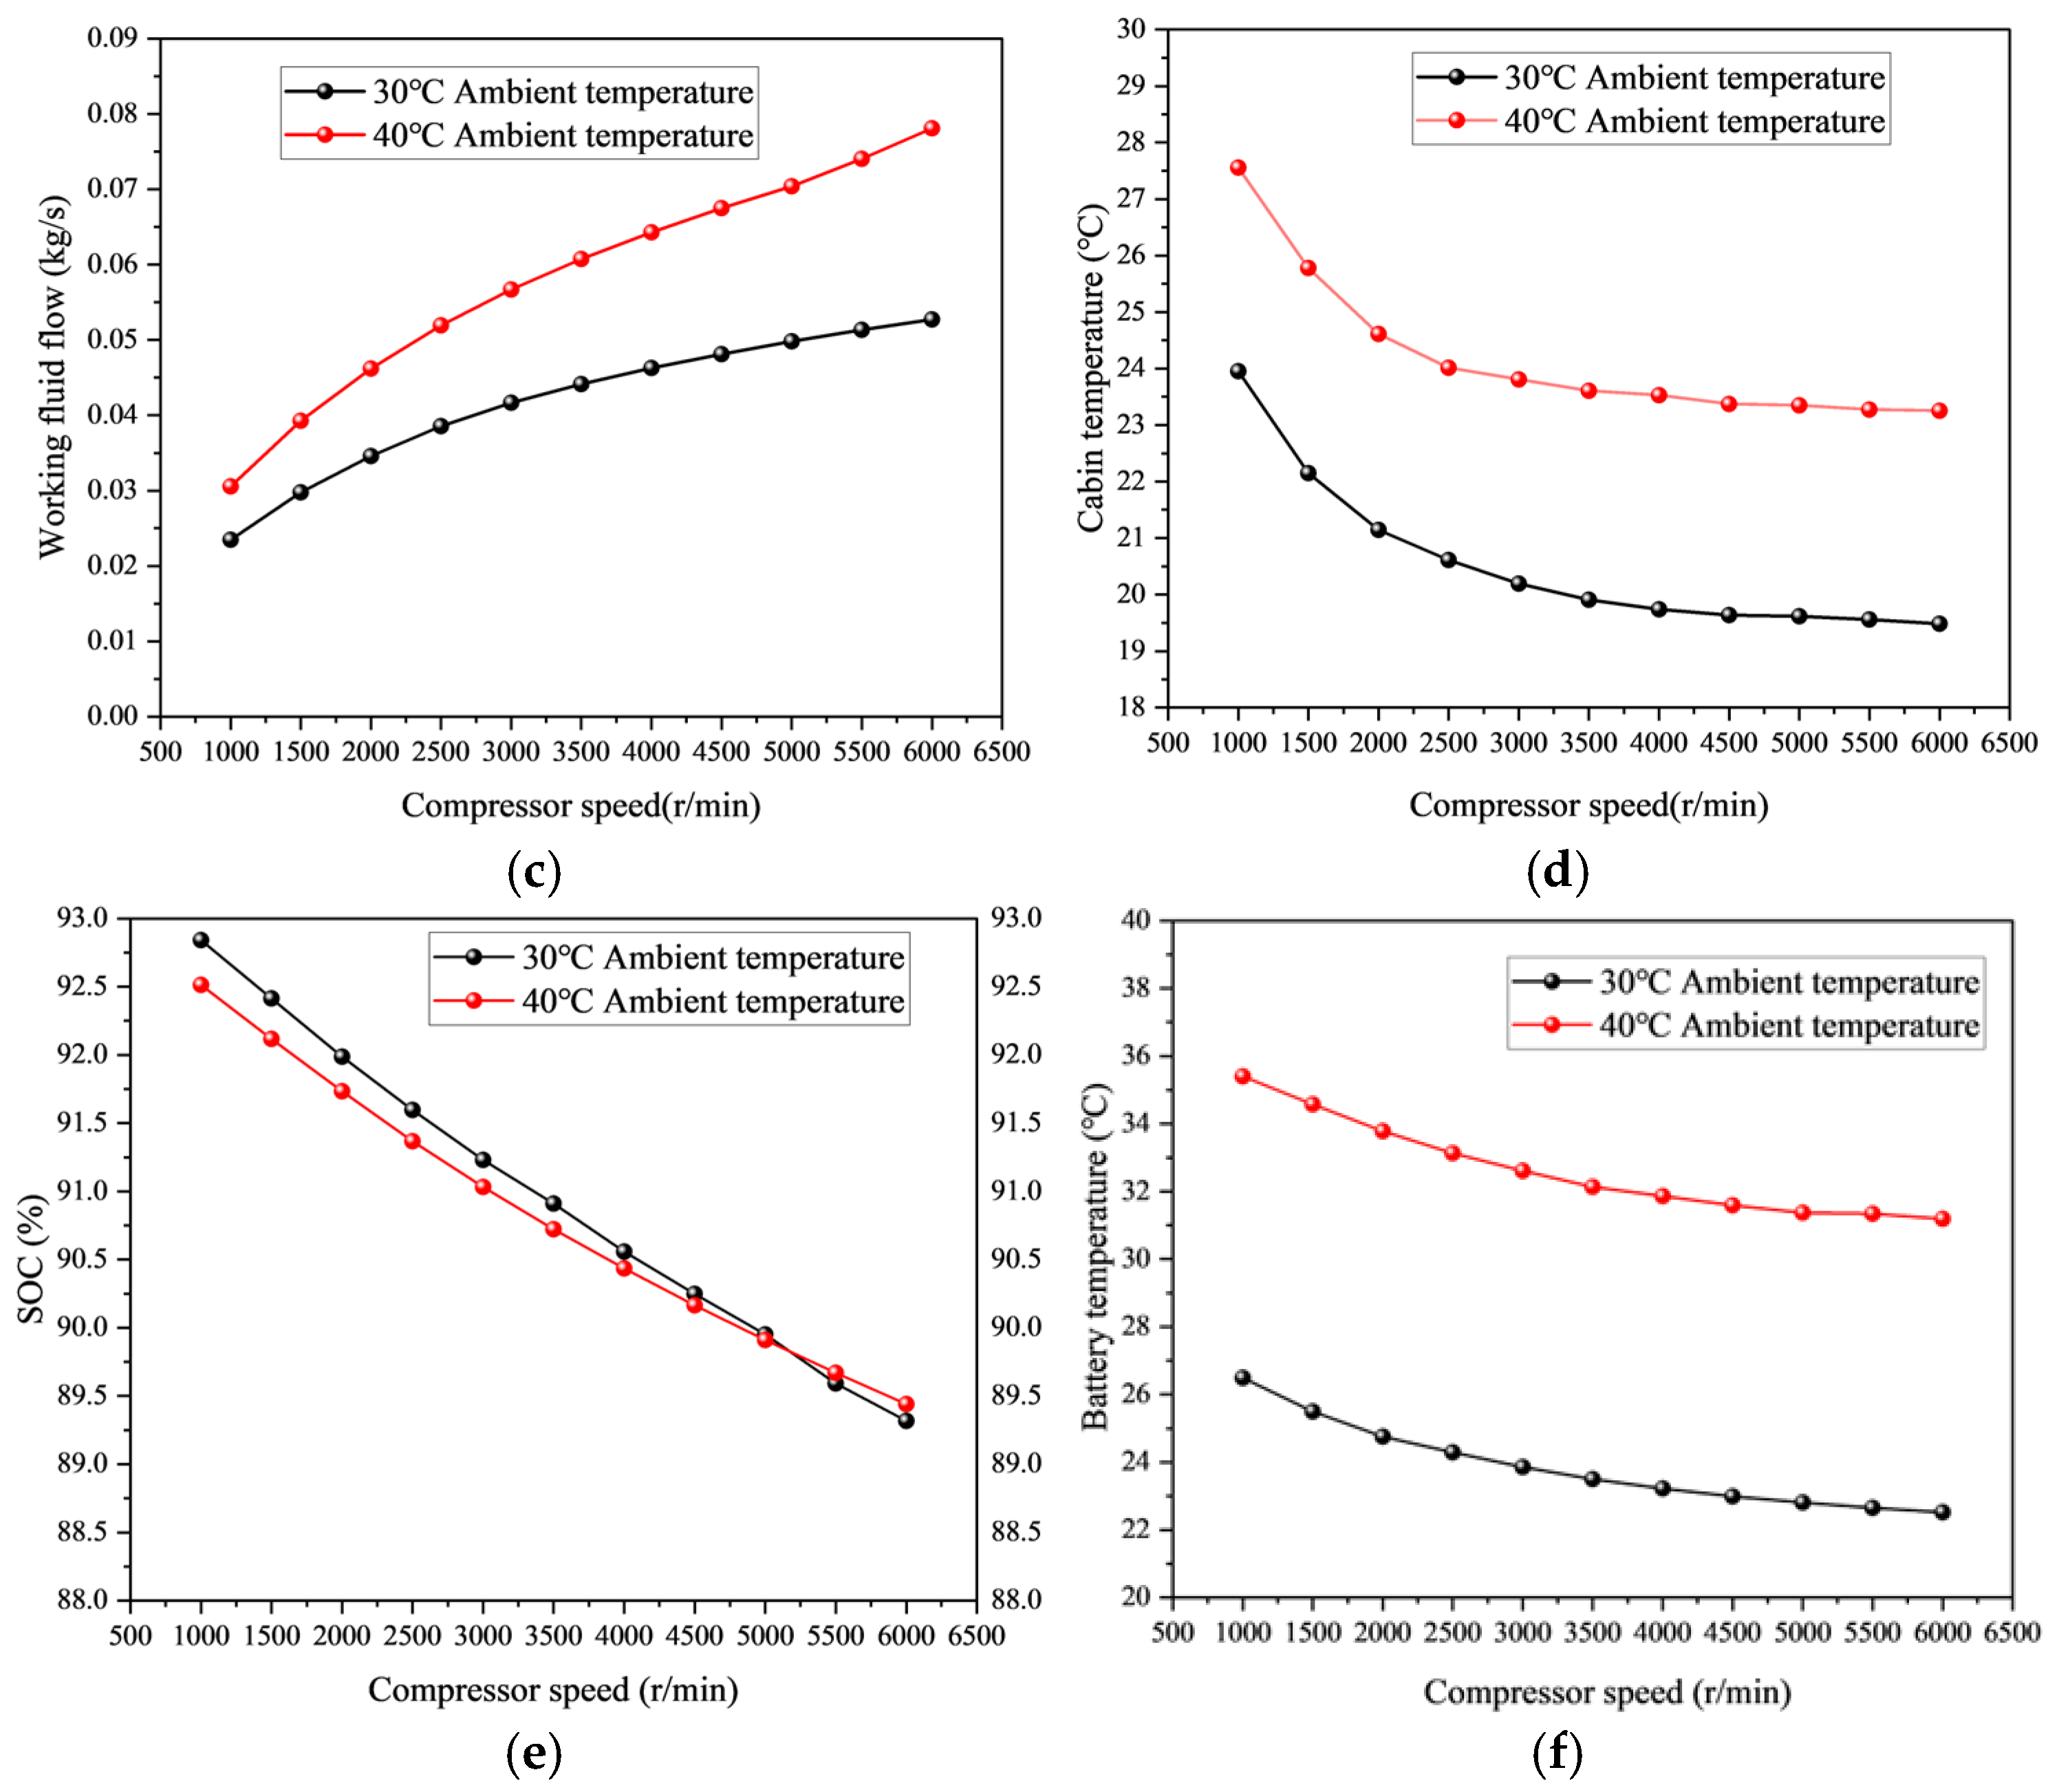
3.4. The Impact of Compressor Speed on AC System Performance
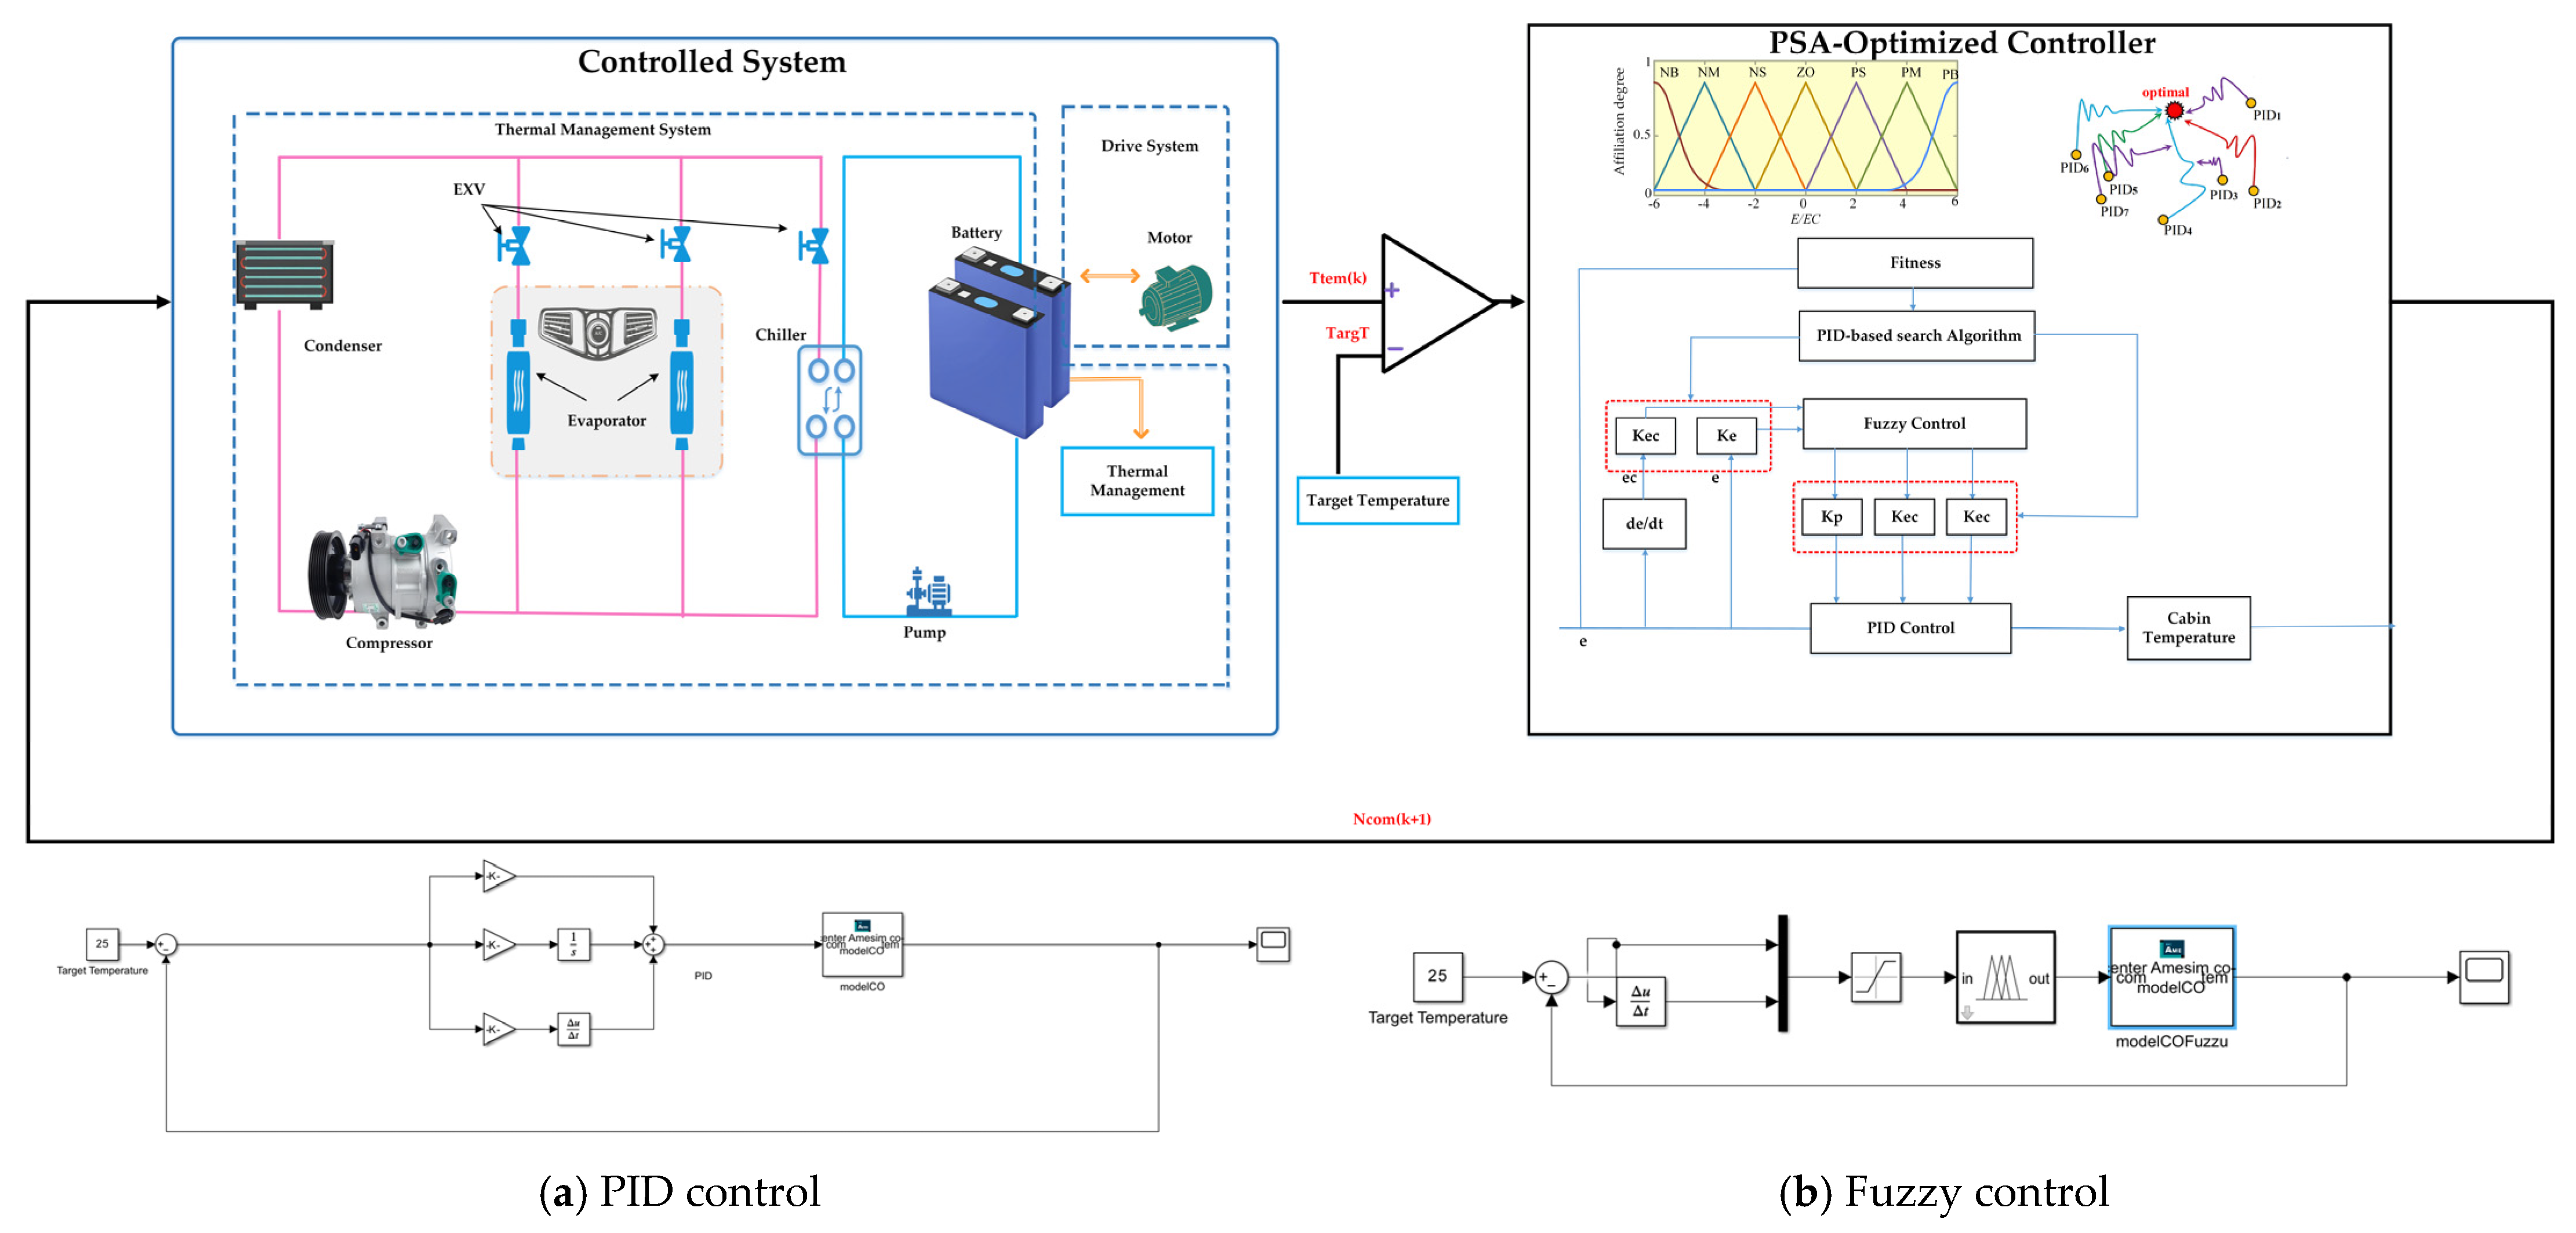
4. Compressor Speed Regulation Strategies
4.1. PID Control Method
4.2. Fuzzy PID Control Method
4.3. PSA-Optimized Control Method
4.3.1. PSA
4.3.2. Optimization of PSA-Optimized Controller Parameters
- (1)
- Parameter initialization: The initial population size is set to 50, and the initial values and ranges for the five parameters are set as well.
- (2)
- Determining the fitness function: The fitness function evaluates individual performance in the global optimization process. In the air conditioning system, the objective function is set as follows:
- (3)
- Perform PSA optimization and present the optimized values of the five parameters ().
- (4)
- Launch the simulation mode. The optimized parameters are evaluated by means of the fitness function. Then, return to step (3). Each iteration updates the position and fitness of every individual
- (5)
- The process concludes once the maximum number of iterations is reached, yielding the global optimal solution. Selecting a higher number of iterations typically enhances accuracy in many algorithms. Given the complexity of the air conditioning system and the limitations on memory, a balance between computational efficiency and result accuracy is necessary; therefore, 20 iterations are sufficient to meet the requirements outlined in this paper.
5. Simulation Results Analysis
5.1. Definition of Simulation Conditions
5.2. Simulation Results Analysis and Discussion
5.2.1. An Analysis of the Differences in Cabin Temperature
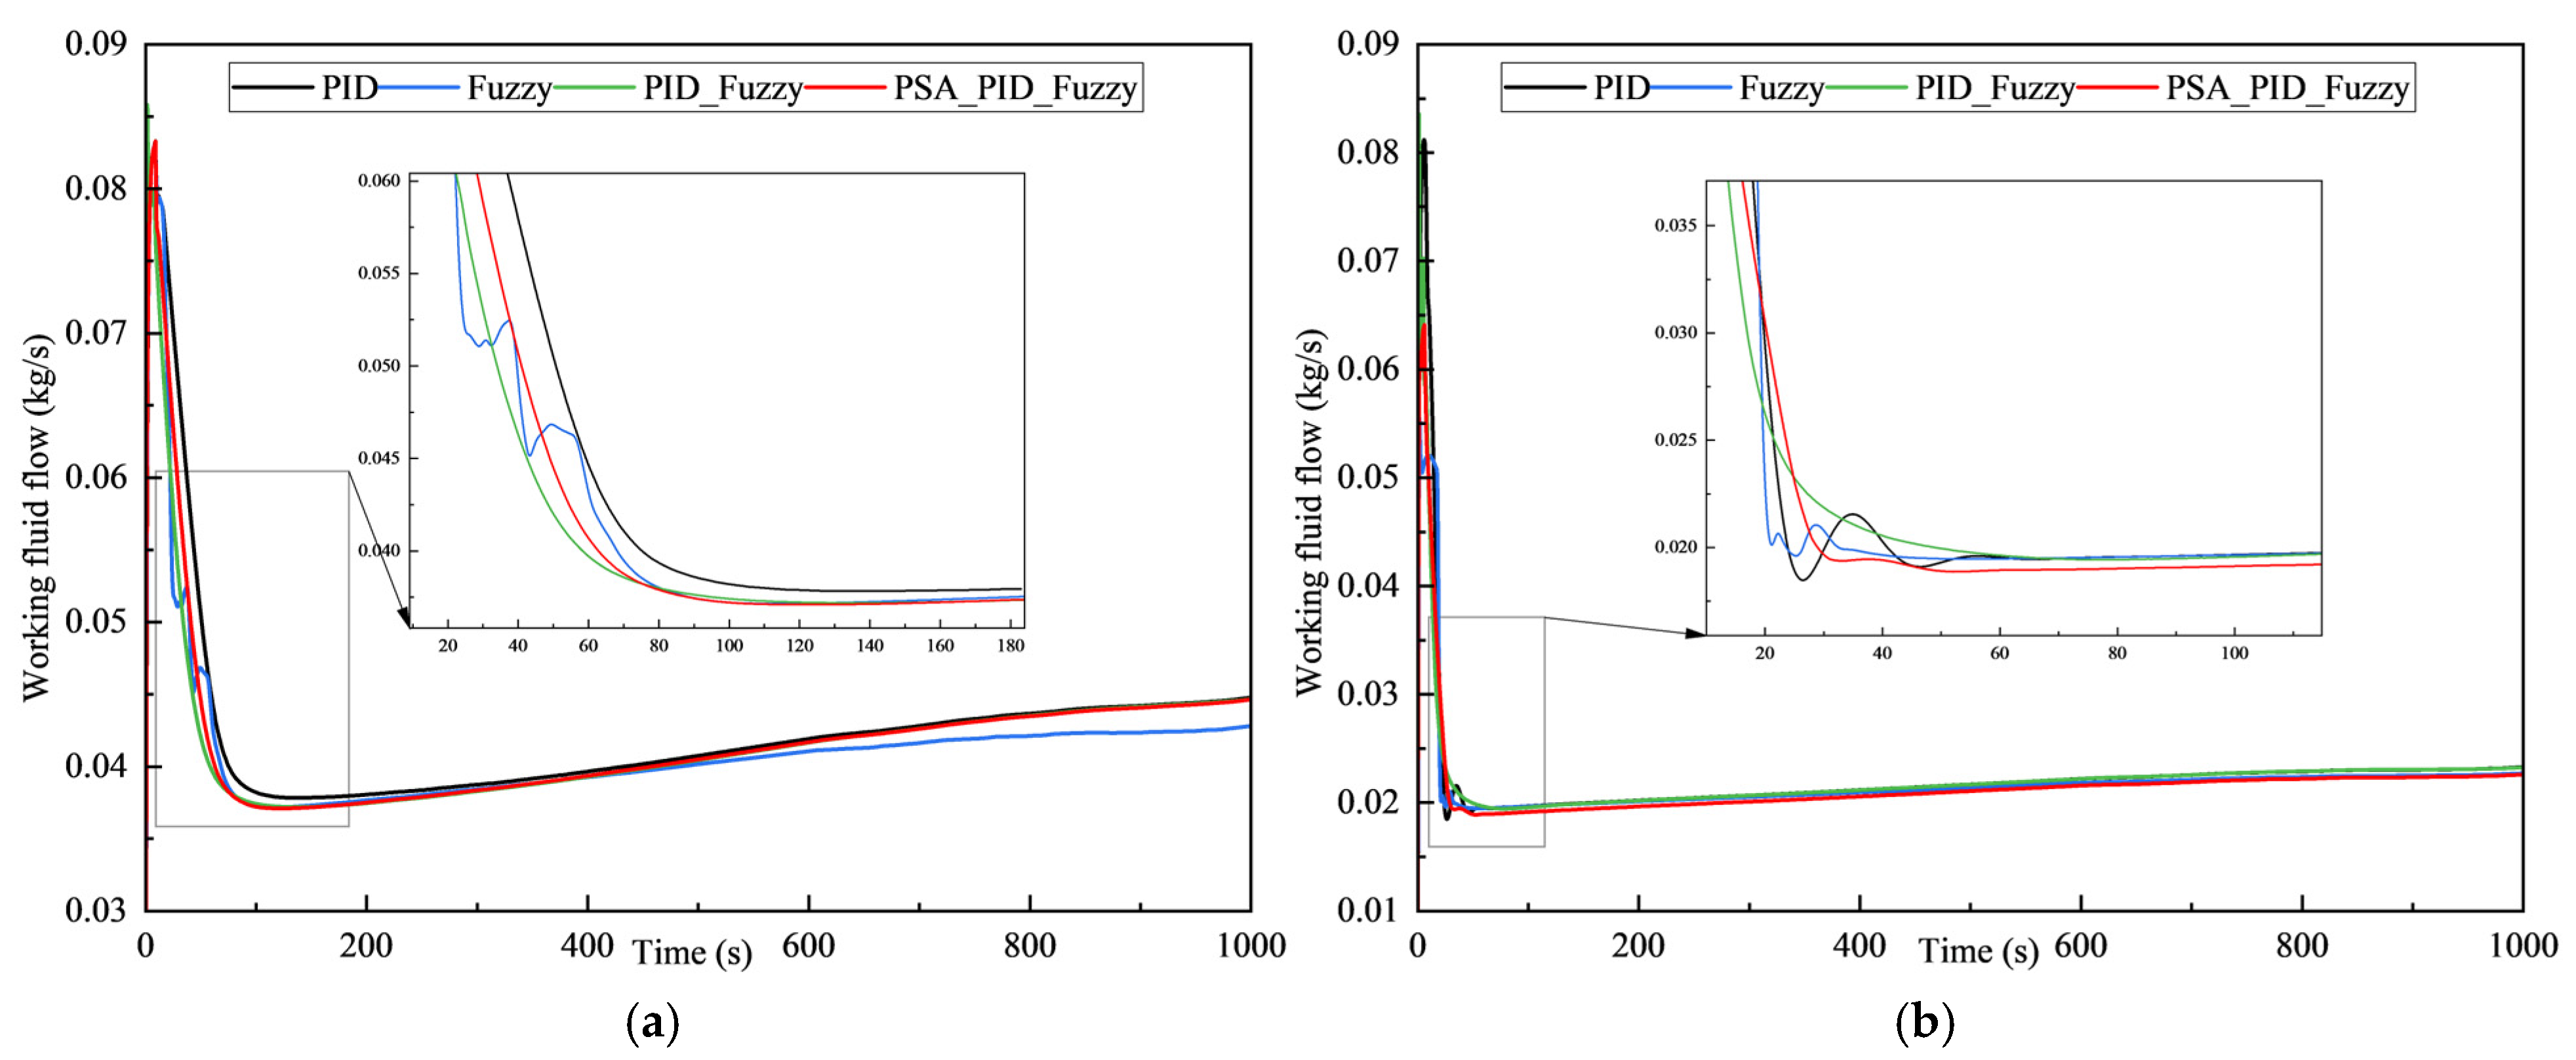
5.2.2. An Analysis of the Differences in Compressor Speed and Working Fluid Flow
5.2.3. An Analysis of the Differences in Battery Temperature and SOC
5.2.4. An Analysis of the Differences in Compressor Power Consumption and COP
6. Conclusions
- Compared to the traditional PID control strategy, the PSA-Optimized control significantly reduces cabin temperature overshoot and improves steady-state control accuracy. Specifically, PSA-Optimized limits overshoot to just 0.010 °C when the target is 20 °C and 0.012 °C when the target is 25 °C, values substantially lower than PID’s overshoot of 0.214 °C at 20 °C and 0.084 °C at 25 °C. The steady-state error is also significantly minimized, measuring 0.066 °C versus PID’s 0.078 °C at 20 °C, and 0.02 °C versus PID’s 0.11 °C at 25 °C. Furthermore, the PSA-Optimized strategy achieves much faster adjustment times, approximately 74.12 s compared to PID’s 245.11 s at 20 °C, and 27.76 s compared to PID’s 49.53 s at 25 °C, ensuring rapid and smooth convergence to the target temperature with minimal fluctuations.
- The PSA-Optimized strategy effectively reduces compressor speed fluctuations and enables smooth speed adjustments, as shown in Figure 11 and Figure 12, particularly when compared to the more oscillatory behavior of traditional PID control. This superior dynamic control over the actuator contributes to improved system stability and responsiveness during transient phases and in the presence of disturbances.
- The PSA-Optimized control system exhibits enhanced performance in terms of compressor power consumption and the coefficient of performance (COP) of the air conditioning system. As indicated in Table 4, compared to traditional PID control, the PSA-Optimized system achieves a notably higher average COP. For example, at a target temperature of 20 °C, its COP is 3.45 compared to PID’s 3.31, and at 25 °C, its COP is 3.68 compared to PID’s 3.62. This improved energy efficiency also contributes to mitigating the rate of SOC decline in the battery system.
Author Contributions
Funding
Data Availability Statement
Conflicts of Interest
References
- IPCC. Climate Change 2023: Mitigation of Climate Change. Working Group III Contribution to the Sixth Assessment Report; Cambridge University Press: Cambridge, UK, 2023; pp. 456–459. [Google Scholar]
- Prakhar, P.; Jaiswal, R.; Gupta, S.; Tiwari, A.K. Electric Vehicles in Transition: Opportunities, Challenges, and Research Agenda—A Systematic Literature Review. J. Environ. Manag. 2024, 372, 123415. [Google Scholar] [CrossRef] [PubMed]
- IEA. Global EV Outlook 2024; International Energy Agency: Paris, France, 2024. [Google Scholar]
- Li, X.; Wang, R. Towards integrated thermal management systems in battery electric vehicles: A review. eTransportation 2025, 24, 100396. [Google Scholar] [CrossRef]
- Zou, H.M.; Tang, Z.H.; Yang, T.Y.; Tian, C.Q. Research progress on thermal management technology of electric vehicles. J. Refrig. 2022, 43, 15–27+56. [Google Scholar]
- Li, Z.; Zhang, H.; Sheng, L. Research progress on immersion cooling technology for lithium -ion batteries in new energy vehicles. J. Refrig. 2024, 45, 38–49. [Google Scholar]
- Zhao, G.; Wang, X.; Negnevitsky, M.; Zhang, H. A review of air-cooling battery thermal management systems for electric and hybrid electric vehicles. J. Power Sources 2021, 501, 230001. [Google Scholar] [CrossRef]
- Gharehghani, A.; Rabiei, M.; Mehranfar, S.; Saeedipour, S.; Mahmoudzadeh Andwari, A.; García, A.; Mico Reche, C. Progress in battery thermal management systems technologies for electric vehicles. Renew. Sustain. Energy Rev. 2024, 202, 114654. [Google Scholar] [CrossRef]
- Maiorino, A.; Cilenti, C.; Petruzziello, F.; Aprea, C. A review on thermal management of battery packs for electric vehicles. Appl. Therm. Eng. 2024, 238, 122035. [Google Scholar] [CrossRef]
- Lee, J.T.; Kwon, S.; Lim, Y.; Chon, M.S.; Kim, D. Effect of Air-Conditioning on Driving Range of Electric Vehicle for Various Driving Modes. In Proceedings of the Asia Pacific Automotive Engineering Conference, Bangkok, Thailand, 1–3 April 2013. SAE Technical Paper. [Google Scholar]
- Mancini, N.; Mardall, J.S.M.; Kopitz, J.; Raymond, O.C.; Hanks, D.F.; Li, H. Optimal Source Electric Vehicle Heat Pump with Extreme Temperature Heating Capability and Efficient Thermal Preconditioning. U.S. Patent No. 2019/0070924A1, 6 April 2021. [Google Scholar]
- Lu, J.; Song, Q.; Fang, Y. Analysis of control strategies for the Tesla Model Y heat pump air conditioning system. Automobile Parts 2023, 40, 7–18. [Google Scholar] [CrossRef]
- Dan, D.; Zhao, Y.; Wei, M.; Wang, X. Review of thermal management technology for electric vehicles. Energies 2023, 16, 4693. [Google Scholar] [CrossRef]
- Zhang, R.R.; Stanke, E.J.; Zhang, G.X.; Lu, Y.C.; Sun, X.L.; Li, X.L. Benefits investigation of electronic expansion valve in electric vehicle thermal system as compared to thermal expansion valve with shut—Off valve. Int. J. Refrig. 2019, 100, 404–413. [Google Scholar] [CrossRef]
- Kim, H.; Hong, J.; Choi, H.; Oh, J.; Lee, H. Development of PCM-based shell-and-tube thermal energy storages for efficient EV thermal management. Int. Commun. Heat Mass Transf. 2024, 154, 107401. [Google Scholar] [CrossRef]
- Jino, L.; Kumar, A.V.; Doley, S.; Berlin, M.; Jacob, A.; Natarajan, N. Revolutionizing EV battery cooling: Innovative hybrid nanofluid solution in an inverted right-angled triangular porous cavities for enhanced thermal regulation via natural convection. J. Energy Storage 2024, 94, 112470. [Google Scholar] [CrossRef]
- Zhang, Z.; Wang, J.; Feng, X.; Chang, L.; Chen, Y.; Wang, X. The solutions to electric vehicle air conditioning systems: A review. Renew. Sustain. Energy Rev. 2018, 91, 443–463. [Google Scholar] [CrossRef]
- Hao, S.; Han, K.; Wang, Y.; Liu, Q. Vapor compression cycle-based integrated thermal management systems for electric vehicles: A critical review. Energy Convers. Manag. 2024, 321, 119072. [Google Scholar] [CrossRef]
- Ko, J.; Jeong, J.H. Status and challenges of vapor compression air conditioning and heat pump systems for electric vehicles. Appl. Energy 2024, 375, 124095. [Google Scholar] [CrossRef]
- Yordanova, S.; Merazchiev, D.; Jain, L. A two-variable fuzzy control design with application to an air-conditioning system. IEEE Trans. Fuzzy Syst. 2015, 23, 474–481. [Google Scholar] [CrossRef]
- George, M.; Kamath, D.; Kurian, C. Electronically tunable ACO-based fuzzy FOPID controller for effective speed control of electric vehicles. IEEE Access 2021, 9, 73392–73412. [Google Scholar] [CrossRef]
- Krishnamoorthy, S.K.; Das, N.; Gudimetla, P.; Emami, K. Enhanced speed control for BLDC motors using WOA-integrated PID controller optimization. IEEE Access 2024, 12, 162465–162475. [Google Scholar] [CrossRef]
- Huang, X.; Li, K.; Xie, Y.; Liu, B.; Liu, J.; Liu, Z.; Mou, L. A novel multistage constant compressor speed control strategy of electric vehicle air conditioning system based on genetic algorithm. Energy 2022, 241, 122903. [Google Scholar] [CrossRef]
- Gao, Y. PID-based search algorithm: A novel metaheuristic algorithm based on PID algorithm. Expert Syst. Appl. 2023, 232, 120886. [Google Scholar] [CrossRef]
- Xie, Z.; Cao, T. Adaptive impedance matching of medium voltage power line carrier communication based on PSA. Power Syst. Prot. Control 2024, 52, 45–52. [Google Scholar] [CrossRef]
- Zhu, M.; Zhang, J.; Bu, L.; Nie, S.; Bai, Y.; Zhao, Y.; Mei, N. Methodology and experimental verification for predicting the remaining useful life of milling cutters based on hybrid CNN-LSTM-attention-PSA. Machines 2024, 12, 752. [Google Scholar] [CrossRef]
- GB/T 12782-2022; Requirements and test methods for motor vehicle heating performance. China Standards Press: Beijing, China, 2022.
- Bernardi, D.; Pawlikowski, E.; Newman, J. A general energy balance for battery systems. J. Electrochem. Soc. 1985, 132, 5. [Google Scholar] [CrossRef]
- Kim, W.G.; Kim, C.K.; Lee, J.T.; Yun, C.W.; Yook, S.J. Characteristics of nanoparticle emission from a light-duty diesel vehicle during test cycles simulating urban rush-hour driving patterns. J. Nanoparticle Res. 2018, 20, 94. [Google Scholar] [CrossRef]
- Cheng, R.; Zhang, W.; Yang, J.; Wang, S.; Li, L. Analysis of the Effects of Different Driving Cycles on the Driving Range and Energy Consumption of BEVs. World Electr. Veh. J. 2025, 16, 124. [Google Scholar] [CrossRef]


| Solar Radiation | Ambient Temperature | Target Temperature | Humidity | Driving Cycle |
|---|---|---|---|---|
| 1000 W/m2 | 40 °C | 25 °C | 40% | WLTC |
| Data Type | 0 s | 25 s | 50 s | 75 s | 100 s | 200 s | 300 s | 400 s | 600 s | 800 s | 1000 s | 1200 s | 1400 s | 1600 s | 1800 s |
|---|---|---|---|---|---|---|---|---|---|---|---|---|---|---|---|
| Experimental (°C) | 40.0 | 34.7 | 31.2 | 28.4 | 24.9 | 24.5 | 24.6 | 24.7 | 25.0 | 25.2 | 25.2 | 25.3 | 25.1 | 25.1 | 24.9 |
| Simulation (°C) | 41.9 | 36.0 | 33.1 | 28.7 | 25.5 | 25.2 | 25.1 | 25.3 | 25.4 | 25.5 | 25.7 | 25.8 | 25.3 | 25.3 | 25.3 |
| Test Group | Ambient Temperature | Target Temperature | Humidity | Speed | SOC |
|---|---|---|---|---|---|
| Condition 1 | 35 °C | 20 °C | 40% | WLTC | 95% |
| Condition 2 | 35 °C | 25 °C | 40% | WLTC | 95% |
| Overshoot | Steady-State Error | Adjustment Time | ||||
|---|---|---|---|---|---|---|
| Group | 20 °C | 25 °C | 20 °C | 25 °C | 20 °C | 25 °C |
| PID | 0.214 | 0.084 | 0.078 | 0.11 | 245.11 | 49.53 s |
| Fuzzy | 0.008 | 0.054 | 0.331 | 0.08 | 123.11 | 30.11 s |
| PID-fuzzy | 0.016 | 0.117 | 0.089 | 0.22 | 73.87 | 94.21 s |
| PSA-Optimized | 0.01 | 0.012 | 0.066 | 0.02 | 74.12 | 27.76 s |
| Battery Temperature (°C) | SOC (%) | Normalized-SOC | ||||
|---|---|---|---|---|---|---|
| Group | 20 °C | 25 °C | 20 °C | 25 °C | 20 °C | 25 °C |
| PID | 29.256 | 31.902 | 92.043 | 92.973 | 3.11 | 2.13 |
| Fuzzy | 29.411 | 31.991 | 92.107 | 93.121 | 3.05 | 1.98 |
| PID-fuzzy | 29.216 | 31.932 | 92.003 | 93.104 | 3.15 | 2 |
| PSA-Optimized | 29.041 | 31.834 | 92.082 | 93.126 | 3.07 | 1.98 |
| Compressor Consumption(W) | Cooling Capacity (W) | COP | ||||
|---|---|---|---|---|---|---|
| Group | 20 °C | 25 °C | 20 °C | 25 °C | 20 °C | 25 °C |
| PID | 2295.81 | 432.49 | 7619.31 | 1580.61 | 3.31 | 3.62 |
| Fuzzy | 2095.04 | 434.36 | 7240.91 | 1471.76 | 3.44 | 3.64 |
| PID-fuzzy | 2287.56 | 435.35 | 7776.62 | 1601.02 | 3.38 | 3.65 |
| PSA-Optimized | 2283.91 | 433.13 | 7891.48 | 1608.91 | 3.45 | 3.68 |
Disclaimer/Publisher’s Note: The statements, opinions and data contained in all publications are solely those of the individual author(s) and contributor(s) and not of MDPI and/or the editor(s). MDPI and/or the editor(s) disclaim responsibility for any injury to people or property resulting from any ideas, methods, instructions or products referred to in the content. |
© 2025 by the authors. Licensee MDPI, Basel, Switzerland. This article is an open access article distributed under the terms and conditions of the Creative Commons Attribution (CC BY) license (https://creativecommons.org/licenses/by/4.0/).
Share and Cite
Xia, K.; Yu, L.; Wang, J.; Yu, W. PSA-Optimized Compressor Speed Control Strategy of Electric Vehicle Thermal Management Systems. Energies 2025, 18, 2687. https://doi.org/10.3390/en18112687
Xia K, Yu L, Wang J, Yu W. PSA-Optimized Compressor Speed Control Strategy of Electric Vehicle Thermal Management Systems. Energies. 2025; 18(11):2687. https://doi.org/10.3390/en18112687
Chicago/Turabian StyleXia, Kun, Lianglu Yu, Jingxia Wang, and Wei Yu. 2025. "PSA-Optimized Compressor Speed Control Strategy of Electric Vehicle Thermal Management Systems" Energies 18, no. 11: 2687. https://doi.org/10.3390/en18112687
APA StyleXia, K., Yu, L., Wang, J., & Yu, W. (2025). PSA-Optimized Compressor Speed Control Strategy of Electric Vehicle Thermal Management Systems. Energies, 18(11), 2687. https://doi.org/10.3390/en18112687