Article

Lower-Carbon Substitutes for Natural Gas for Use in Energy-Intensive Industries: Current Status and Techno-Economic Assessment in Lithuania

by
Aurimas Lisauskas
,
Nerijus Striūgas
* and
Adolfas Jančauskas
Laboratory of Combustion Processes, Lithuanian Energy Institute, LT-44403 Kaunas, Lithuania
*
Author to whom correspondence should be addressed.
Energies 2025, 18(11), 2670; https://doi.org/10.3390/en18112670
Submission received: 31 March 2025 / Revised: 12 May 2025 / Accepted: 15 May 2025 / Published: 22 May 2025

Abstract

:
Significant shortfalls in meeting the climate mitigation targets and volatile energy markets make evident the need for an urgent transition from fossil fuels to sustainable alternatives. However, the integration of zero-carbon fuels like green hydrogen and ammonia is an immense project and will take time and the construction of new infrastructure. It is during this transitional period that lower-carbon natural gas alternatives are essential. In this study, the industrial sectors of Lithuania are analysed based on their energy consumption. The industrial sectors that are the most energy-intensive are food, chemical, and wood-product manufacturing. Synthetic natural gas (SNG) has become a viable substitute, and biomethane has also become viable given a feedstock price of 21 EUR/MWh in the twelfth year of operation and 24 EUR/MWh in the eighth year, assuming an electricity price of 140 EUR/MWh and a natural gas price of 50 EUR/MWh. Nevertheless, the scale of investment in hydrogen production is comparable to the scale of investment in the production of other chemical elements; however, hydrogen production is constrained by its high electricity demand—about 3.8 to 4.4 kWh/Nm3—which makes it economically viable only at negative electricity prices. This analysis shows the techno-economic viability of biomethane and the SNG as transition pathways towards a low-carbon energy future.

Graphical Abstract

1. Introduction

The Copernicus Climate Change Service (C3S) has confirmed that 2024 is the warmest year on record globally, marking the first calendar year in which the average global temperature exceeded 1.5 °C above pre-industrial levels [1]. This development highlights a significant shortfall in meeting the targets set by the Paris Agreement in 2015, which aims to prevent such temperature increases. The key driver of climate change today remains dependence on fossil fuels, necessitating a phased transition to achieve the Europe’s goal of eliminating carbon emissions by 2050. To support this goal, some countries have adopted carbon tariffs to reduce both global and regional carbon emissions [2]. At the same time, recent geopolitical events have demonstrated that diversifying energy sources is essential for mitigating climate change and ensuring energy security. This became particularly evident over the past few years when global gas prices experienced severe fluctuations due to the combined effects of the global pandemic and geopolitical tensions. For example, Europe’s gas-price markers indicate that natural gas prices skyrocketed from 67 to a record-breaking 340 EUR/MWh over the period February–August 2022 [3], triggering a power crisis in energy-intensive industries, especially in energy-import-dependent countries like Lithuania. The energy surge led to unplanned industry halts, significant increases in production costs, and reduced market competition. These dual challenges can be addressed by diversifying fuel types and transitioning to alternative gases, such as zero-carbon fuels like green hydrogen and green ammonia obtained from renewable energy sources such as hydropower, solar power, wind power, or carbon-based renewable energy sources, such as synthetic natural gas (SNG) [3,4] and biomethane produced from renewable sources Table 1.
Despite the rapid development of zero-carbon fuels like green hydrogen and ammonia, H2 and NH3 still face significant barriers to meeting current and projected energy needs and reducing dependence on fossil fuels. For comparison, global green hydrogen production in 2023 was approximately 31 million tons [13], meeting only 2.3% of the total industrial energy demand of 166 EJ [5]. The scale of hydrogen and ammonia production and the inadequacy of the infrastructure mean that its use as a primary energy source is limited for the time being, both in the industrial and transport sectors. Moreover, lower-carbon products are characterized by up to 34% higher average investment costs than carbon-based counterparts and are still not economically viable [14]. There is a significant gap between the vision of sustainable energy and its realisation; thus, effective transitional solutions are needed. Considerable challenges exist in achieving fuel diversification by decarbonising technological processes to ensure sustainable production while reducing costs.
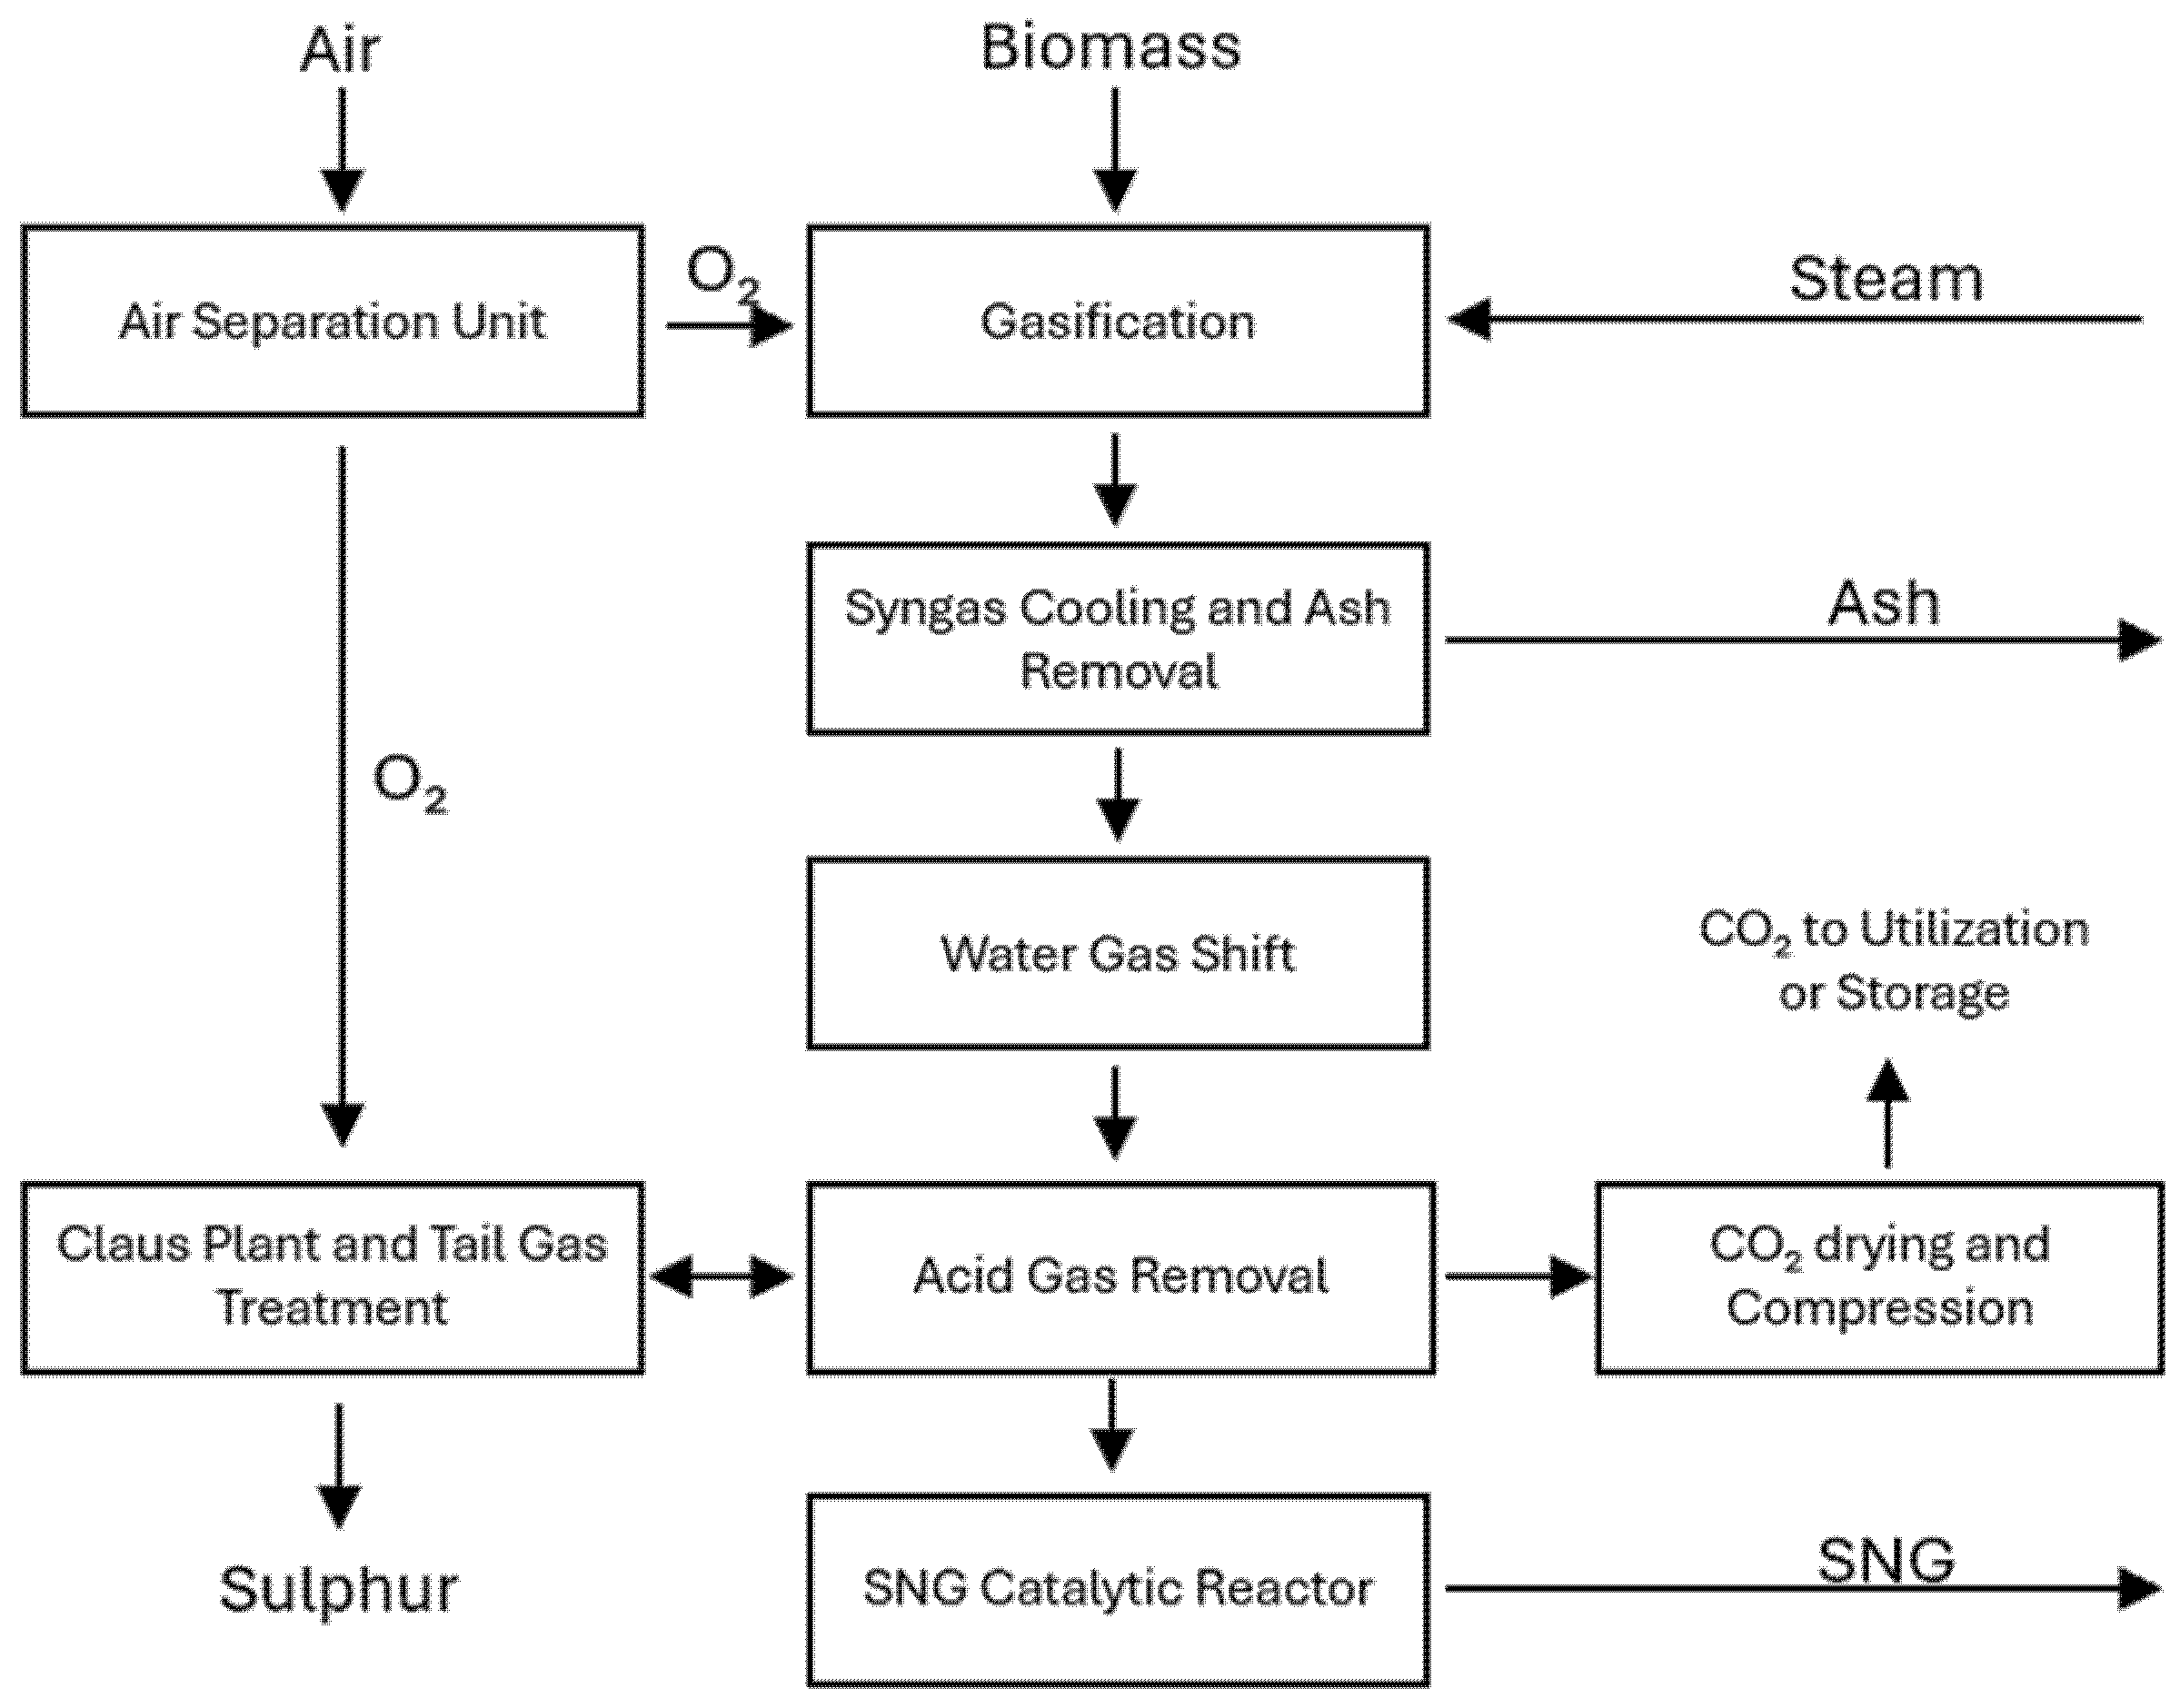
Synthetic natural gas (SNG) and biomethane are emerging intermediate energy sources that can help alleviate supply gaps in fossil fuels, hydrogen, and ammonia. SNG and biomethane, regarded as lower-carbon fuels, are produced from biomass. SNG is produced through a thermochemical process called gasification, in which biogenic residues and wastes are converted into synthetic gas (syngas). Syngas primarily consists of H2, CO, and CO2. An additional process called catalytic water–gas shift conversion is applied to upgrade syngas into synthetic biogas.
In contrast, biomethane is produced via anaerobic digestion. During the biodegradation of renewable raw materials and organic waste in oxygen-free conditions, a gas mixture consisting of 55–70% methane, 35–40% carbon dioxide, and trace amounts of N2, H2, O2, H2S, and water vapour known as biogas is produced [15]. Biogas is then upgraded into biomethane through further processing, including cooling, drying, and purification. Both alternatives generally have a high calorific value, a consistent composition, and other desirable characteristics, such as low concentrations of impurities, water vapour, hydrogen sulphide, ammonia, etc. SNG and biomethane can be easily integrated into existing pipeline systems and used in industry, power generation, and transport, ensuring a smooth transition to fully renewable energy sources. The SNG and biomethane stream can be utilised in applications currently powered by natural gas without issue, as its volumetric composition and thermal characteristics (such as LHV and wobble index) are equivalent to those of natural gas [4].
Natural gas is a hydrocarbon gas primarily composed of methane, with smaller amounts of other hydrocarbons, such as ethane, propane, and butane. It may also contain traces of non-hydrocarbon gases like carbon dioxide, nitrogen, and helium. In Lithuania, natural gas is one of the most-used fuels, ranking third (17.3%) in fuels used for primary energy consumption in 2023 [16]. Because of its high calorific value, natural gas is considered a cleaner-burning fossil fuel, with CO2 emissions of 515 kg/MWh of electricity produced, compared with 1020 kg/MWh for coal [17]. Its versatility and wide availability make it suitable for various industrial processes in production, power generation, and heating. It covers 27.2% of the total energy demand in Lithuanian industry as a primary fuel [16].
In recent years, there has been a notable increase in the number of research articles focusing on techno-economic and life-cycle analysis (LCA) of synthetic natural gas and biomethane, as well as their integration with carbon capture, utilisation, and storage (CCUS) technologies. In a study conducted by Cormos et al., the authors explored various aspects of SNG production from woody biomass, including process modelling and simulation, model validation, mass and energy-balance assessments, and LCA calculations for a 500 MWth plant with a 60% CO2-capture rate [4]. The study concluded that integrating CO2 removal into biomass gasification could yield negative carbon emissions of approximately 457 kg/MWh. However, the process costs remain higher than current EU natural gas prices, being estimated at around 53 EUR/MWh compared to Lithuania’s prevailing 44–45 EUR/MWh range [18]. A techno-economic assessment of biomethane production was also conducted by Padi et al. [3]. That study investigates the feasibility of biomethane production from cattle slurry and grass silage through an anaerobic process. The production cost was close to 72 EUR/MWh, with potential for distribution into the natural gas grid. The authors suggests that the recent surge in energy prices due to geopolitical factors could enhance the viability of distributed cattle-slurry–grass-silage biomethane systems (DCSGSB systems), as the natural gas market price directly influences the demand for such installations. Authors also emphasises that governmental subsidies that support the widespread adoption of these technologies remain crucial.
The future price range is challenging to predict, given the geopolitical factors. The economic feasibility and limited resources make future use of fossil fuels unfavourable. Alternative fuels, however, have various advantages and disadvantages across different dimensions. Natural gas derived from biomass is the most promising renewable energy source today. The reasons are its comparably high heating value and its compatibility with existing distribution networks and infrastructure like distribution pipelines and auxiliary equipment. Artificially produced natural gas is cleaner, more diverse, and strategically independent, making it a significantly superior fuel option.
Determining whether methane produced through anaerobic and thermochemical processes can be cost-competitive with natural gas remains essential. To address this question, a comprehensive analysis of the current industrial energy landscape, biomass potential, and techno-economic factors is required. The insights gained could inform future strategies for integrating renewable energy into energy-intensive sectors. While previous studies have primarily focused on the techno-economic and environmental performance of large-scale renewable gas production, this study uniquely evaluates the sector-specific potential and economic viability of synthetic natural gas (SNG) and biomethane as transitional fuels within Lithuania’s most energy-intensive industries. By dynamically assessing break-even conditions under real market scenarios and directly comparing these pathways with scenarios in which hydrogen is used, our analysis provides actionable insights for the practical deployment of lower-carbon gases during the critical transition to a low-carbon energy system.

2. Methodology

2.1. Classification of Industries

The various activities of industrial companies result in differing levels of energy consumption in their production processes. Structuring companies according to their activities allows for a more optimal adaptation of the regulatory framework, specialisation of responsibility for environmental compliance, tailoring of the tax environment, and improved assessment of energy consumption to promote its optimisation. The European Union regulates industries according to the classification used in the European Community’s list of products [19]. The PRODCOM statistics cover industrial production (except military products and some energy products) by enterprises classified within Sections B, C, and E of NACE Rev. 2 [20].
The Director General of the Lithuanian State Data Agency, by Order No. DĮ-266 of 3 December 2024, approved the revision of the Classification of Economic Activities in the Economic Activity Classification (EVRK Rev. 2.1) [21] by the Commission Delegated Regulation (EU) No. 2023/137 of 10 October 2022. Using the classification, the statistical department publishes industry energy-consumption data. Using the classification, we selected the industries with the highest energy consumption and extracted the quantities of energy and fuels consumed in them.
To identify target industries and opportunities for the development of renewable energy sources, statistical data on energy consumption in the industries were gathered, highlighting the most fossil-fuel-intensive industries; summarised information on logging residues and biomass fuel prices was also assembled (Figure 1). The aggregated information on investment and the operating costs of the technologies under consideration enabled an assessment of the competitiveness of the production of SNG, biomethane, and hydrogen fuels with the currently used natural gas.

2.2. Techno-Economic Assessment

The technical and economic assessment enables calculation of the simulated cost of producing 1 MWoutput of biofuels in the process of transitioning from natural gas to biomethane, SNG or hydrogen. Research and development projects in Europe are ongoing, with focuses such as synthetic natural gas, bio-methane, and hydrogen production. Currently, synthetic natural gas is not widely used commercially due to the availability of cheap fossil fuels on the world market. This explains the lack of data on SNG production and consumption statistics (Table 1). For the development of synthetic natural gas production, a preliminary assessment of the required investment and technical and economic data has been conducted based on previously published work [4,22,23]. The investments needed for the individual process plants and the techno-economic data were recalculated based on the analysed yield of 1 MW of gaseous biofuel, including the installation of the plants and their operation. To compare the planned investments, economic indicators are here provided, along with a detailed assessment of equipment investments. For each process plant, the investment was estimated based on the provided data, with a scaling factor applied to evaluate the investment required for the specified capacity. Subsidies and other forms of support for investment or production were not used in the calculation of the output costs for the various fuel types. Different countries may use different levels or even methods of support, leading to varying production costs. The levelised cost of syngas (LCO) is defined as the ratio of the annual cost to the yearly renewable gas production:
L C O = C t H L H × P
where P is the production capacity, MW; HLH is hours worked per year; and Ct is annual cost of production in EUR, calculated as follows:
C t = F C F × C i + C i n p u t + C O & M
where Ci is the investment cost, EUR; Cinput is the cost of fuel; CO&M is operating and maintenance cost, EUR; and FCF is the fixed charge factor, as defined.
C i = C I n v , r e f , i P P r e f S F i
where Pref and CInv,ref,i are the capacity of and investment needed for a known device. Modelling the production of 1 MWoutput, the investment is adjusted by the scaling factor (SFi) presented separately for each unit of the process chain. The scaling factor is selected according to the element of the process chain. For the components of the production value chain for synthetic natural gas (SNG), our investment estimates are based on the techno-economic assessment conducted by H. Thunman et al. [22], applying the scaling factors specified for each element of the value chain. For hydrogen and biomethane technology investments, we used a calculation from studies analysing the cost of producing 1 MWoutput of energy [23,24], as follows:
F C F = r × 1 + r n 1 + r n 1
where n is the economic lifetime (n = 25 years) and r is the discount rate, 5%.
The results allow us to compare the competitiveness of renewable gaseous fuels with natural gas. They show at what price levels of energy resources it makes sense to invest in fuel diversification in industries using natural gas.

2.3. Inputs Data and Technological Scheme for Calculation

2.3.1. Synthetic Natural Gas

The cost of synthetic natural gas depends on various factors, such as the prices of energy resources and raw materials and the selected gasification technology. The selection of the devices in the principle circuit diagram of the SNG process chain is based on the SNG scheme analysed by Cormos et al. for Slovenia [4] and the plant characteristics analysed by Thunman et al. for “GoBiGas” [22]. For this reason, the calculations will be based on the most rational and typical technological solutions and parameters, as illustrated in Figure 2. Calculations are based on the volume and output of thermal energy.
The investments were recalculated for the individual plants in the process chain, and the techno-economic data were evaluated to analyse a 1 MW synthetic fuel yield [4,22]. The CAPEX cost of a given plant subsystem (e.g., gasification unit, syngas processing line, acid gas removal unit, CO2 processing unit, SNG production unit, etc.) for a given production capacity was calculated by applying the Formula (3) presented in Section 2.2 of the investment correlation methodology. The reference data used for various plant subsystems are reported in Table 2.
Operation expenditures (OPEX) consider both the fixed (e.g., direct labour, plant maintenance, administration, etc.) and variable (e.g., biomass, chemicals, solvents, boiler feed water, process and cooling water, ash disposal, etc.) components using the key economic assumptions shown in Table 3.

2.3.2. Biomethane

Biomethane is emerging as a rapidly expanding alternative to natural gas in Europe, contributing to the reduction of reliance on natural gas imports due to insufficient and decreasing domestic production (Table 1). To assess investment in biomethane 1 MW outputs, the calculations assume that the production plant corresponds to Figure 3. According to the biogas-production process, first, organic waste from a livestock farm—animal and cattle manure, along with straws—is collected and stored in a storage container/tank. From there, the material is transferred to a mixing container, shredded, and blended into a homogeneous mixture in appropriate proportions to optimize anaerobic digestion. The prepared mixture is then fed into a hermetically sealed fermenter, i.e., an AD biogas-production unit. The produced gases are accumulated in a sealed container or temporary holding tank before they undergo the biogas-upgrading process to improve gas quality. After anaerobic digestion, the digested waste material is removed and transferred to a digestate-storage facility.
The gas produced from raw biogas contains significant amounts of hydrogen sulphide, water vapour, and CO2 and must be upgraded. The process of upgrading starts by cooling the gas from the AD biogas-production unit to its dew-point temperature to condense and separate the water vapour. The cooled and dried gas is then passed through activated carbon filters that remove volatile organic compounds (VOCs), and, in some filters, hydrogen sulphide. The purified gas, consisting mainly of a mixture of CH4 and CO2, is compressed to a pressure of 12 to 16 bar, as required for membrane filtration.
The investment and operating cost data for a 1 MW-output biomethane plant are based on studies carried out in Lithuania [24] and in Ireland [3]. Investments in and the development of biogas power plants were assessed in terms of the primary-process-chain facilities, such as the biogas plant, the cogeneration plant, and the biomethane-processing and -compression facilities. The operating costs of a biogas plant were evaluated in terms of the main process-chain facilities, such as the biogas plant, the CHP plant, and the biomethane processing and compression facilities. The capital and operating costs and the main economic specifications related to the hypothetical production and market introduction are presented in Table 4 and Table 5, below.

2.3.3. Green Hydrogen

This analysis of green hydrogen also involved a comparison to previously noted forms of carbon-neutral fuels like the biomethane and synthetic natural gas (SNG for short). Green hydrogen is an energy source that has water vapor as the main byproduct of its combustion; hence, it is considered a clean and sustainable energy source.
Green hydrogen is produced exclusively from renewable energy sources using the electrolysis process. The most typical technology used for hydrogen production is the polymer electrolyte membrane electrolyser (PEME). PEMEs can be up to 60% more expensive than alkaline electrolysers, which hinders market penetration [25]. The water incoming to the electrolysis plant is first deionised and desalinated and then treated with a scrubber. The treated water is mixed with a potassium hydroxide (KOH) solution in the stack of the electrolyser [26]. The stack produces gaseous streams of hydrogen and oxygen. The gaseous hydrogen and oxygen pass through two gas–alkali separators, where the separated oxygen is emitted to the atmosphere and the hydrogen is passed on to the other stages. The hydrogen stream is further purified by blowing through a gas scrubber, a gas accumulator, and a gas/water separator. The impurities present in the hydrogen stream are removed through deoxygenators and a dryer. The purified hydrogen reaches a purity of 99.99% and is compressed and stored. The principal scheme is shown in Figure 4.
The investment in hydrogen production for a notional output of 1 MW was estimated based on an assessment by researcher David Jure Jovan in Slovenia [23]. The electrolysis plant accounts for the largest share of the investment, 73% of the total investment. High-pressure storage is the second-most-significant component of the investment, accounting for 9% of the investment. Documentation, BoP components, connection to the electricity grid, and construction and installation work account for only 5% of the investment. Balance-of-plant (BoP) components include the electrolyser system, which is composed of a water-control system, a power supply, a DM unit, an electrolyte tank, a gas/water separator, pumps, a dryer, etc. The investment amounts per MW are given in Table 6.
The operating costs are calculated based on a percentage of the investment, the cost of water (feedstock), and primarily the cost of hydrogen production, which is determined by the cost of electricity at 48.95 kWh/kg of hydrogen production. This aspect, which determines even the necessary replacement of the stacks of the electrolysis apparatus, is not such a significant cost factor. After ten years, the stacks of the electrolysis plant are considered to represent operating costs. The OPEX data and key economic specifications are shown in Table 7 and Table 8.

3. Energy Consumption in Industry

Transitioning from conventional fuels to renewable energy sources is crucial to achieving the European Union’s climate-neutrality targets. Replacing natural gas with alternative gaseous fuels that do not contain carbon, such as hydrogen, will require significant financial resources and time to consolidate these resources and build the necessary infrastructure. In contrast, biomethane and synthetic natural gas are two methane-based renewable fuels that can meet industry demand and can be supplied through the existing natural-gas infrastructure to reduce greenhouse gas (GHG) emissions during the transition period.
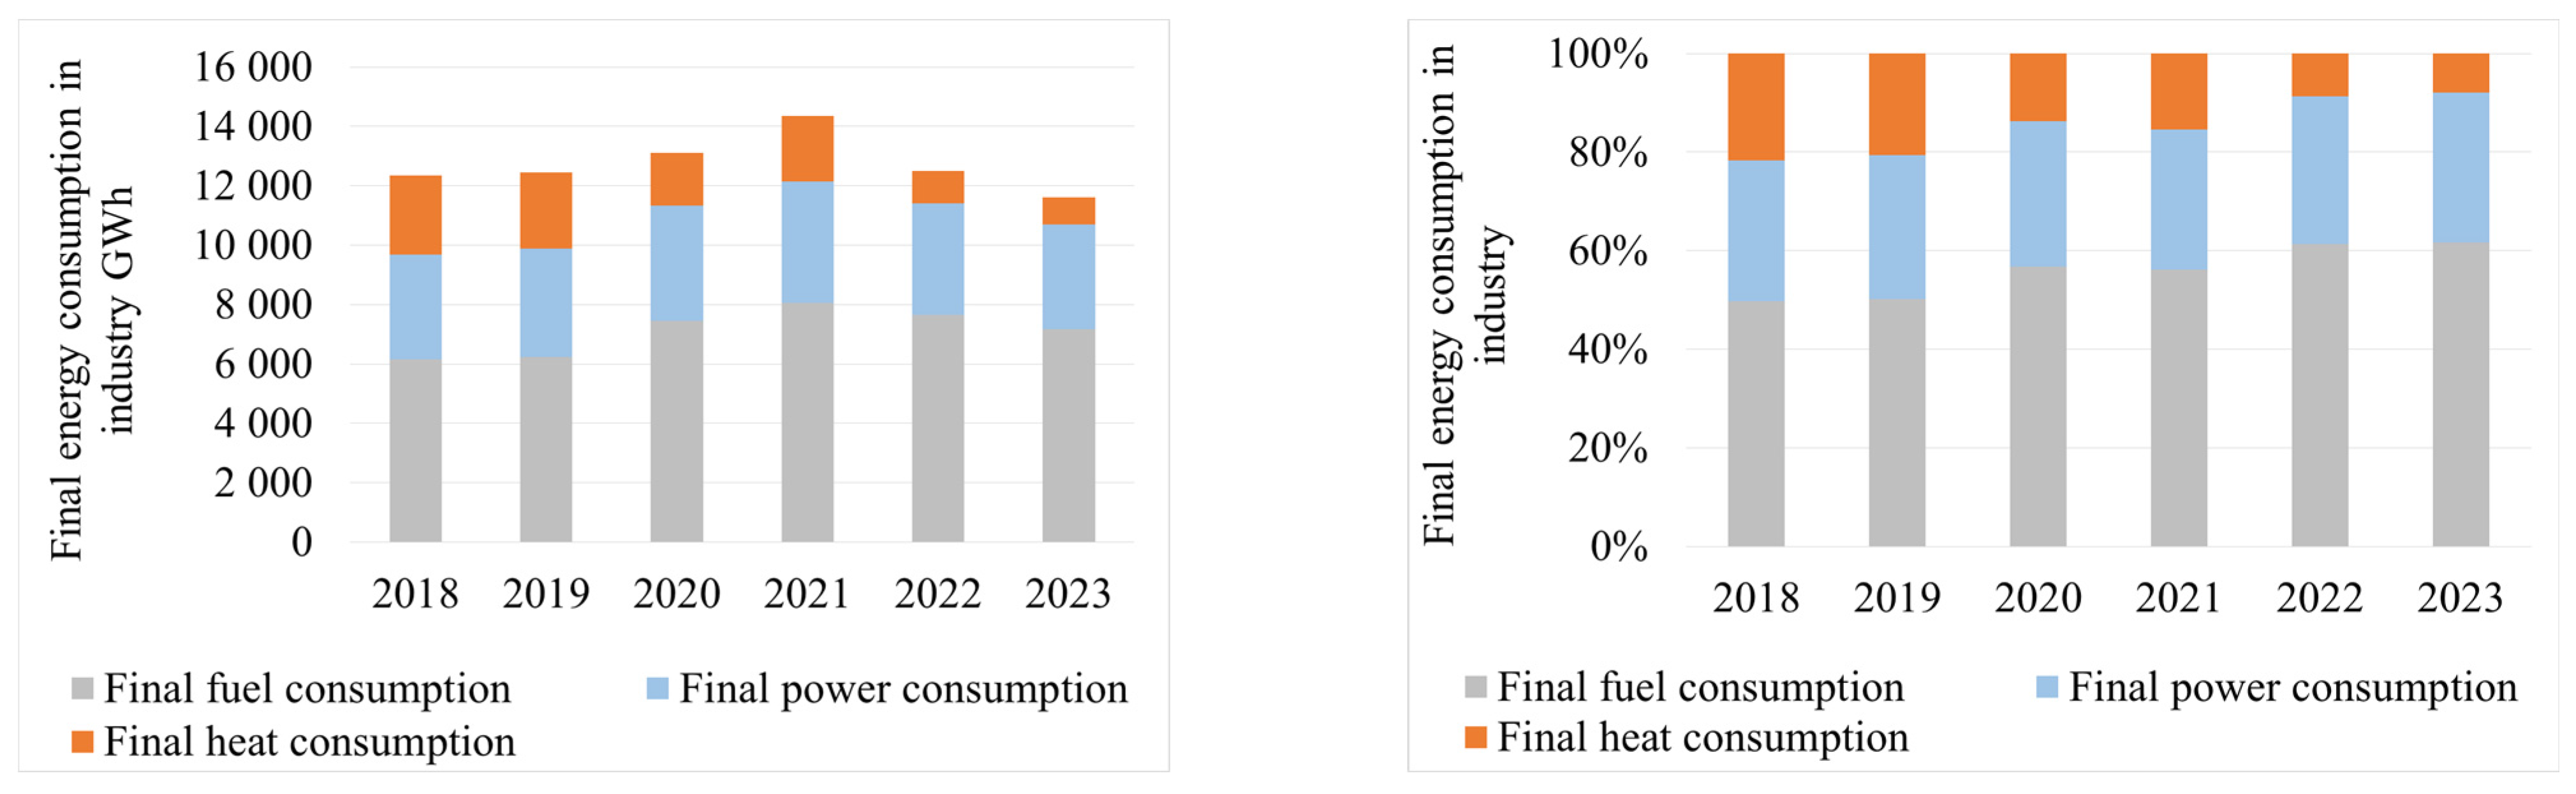
The Lithuanian industry’s final energy demand peaked in 2021, with a total final energy consumption of 1436 GWh in technological processes. Final fuel consumption in the industry, on average, accounts for around 50% of total energy consumption and reached the 60% mark in 2022 and 2023. Changes in the energy market have led to a slight decrease in heat consumption by businesses, with this figure reaching 2679 GW in 2018 and only 925 GWh in 2023 [27]. This change in the final energy balance reflects the renewal of companies’ energy installations, which involved replacing on-site electricity and heat-generation units (Figure 5).
Natural gas, firewood, wood residues for fuel, and other bituminous coal dominate final fuel consumption in the industry [27]. The industry’s most intensively used fuels have declined slightly by a few percentage points each year, falling by 13% in 2023 compared to 2018. The use of wood residues for fuels increased by 3.4% in 2023 compared to 2018; natural gas decreased by 6.6% in the same time period; and other bituminous coal showed the most significant decrease: 49.9% (Figure 6a).
The expenses associated with other fuels have increased steadily by a few percentage points each year and were 6.3% higher in 2023 than in 2018. Liquefied petroleum gas showed a significant (58%) increase between 2022 and 2023. Industrial companies looking for an alternative that is equivalent in quality to natural gas have turned to liquefied petroleum gas (Figure 6b). There has been an increase in the cost of road-transport diesel in recent years, with this fuel costing 14.2% more in 2023 compared to the previous year.
The branches of the economy of the Republic of Lithuania are classified according to the Economic Activity Classification (hereinafter referred to as “EAC”) [21]. The CESE is subdivided into up to 99 items [28]. The primary energy-intensive industries stand out for their final energy consumption [19]: food, beverages, and tobacco production accounted for 27%; other non-metallic mineral production accounted for 26%; chemicals and chemical production accounted for 22%; cement, lime, and plaster production accounted for 19%; paper and paper production accounted for 6% of total fuel consumption in the industry in 2022. According to the data provided by Statistics Lithuanian in 2022 on the final consumption of fuel, electricity, and heat in technological processes, three industries stand out:
  • production of food products, beverages, and tobacco products consumed 1460 GWh of final energy, of which 63% was used for fuel, 33% was used for electricity, and 4% was used for heat;
  • production of chemicals and chemical products consumed 1194 GWh of final energy, of which 49% was used for fuel, 24% was used for electricity, and 28% was used for heat;
  • manufacture of wood and wood and cork products consumed 734 GWh of final energy, of which 62% was used for fuel, 31% was used for electricity, and 7% was used for heat.
Energy types such as electricity are reflected in the statistics only in purchases from energy suppliers. Still, the electricity generated by the company’s PV power plants for technological needs has not yet been separately identified. The heat consumed in the industry is predominantly generated through fuel conversion, with only a minor portion being externally sourced, except in the chemical industry. Fuel diversification from standard natural gas to SNG and biomethane will reduce the need for fossil fuels and enable more efficient utilization of primary energy through by-unit CHP systems. In the chemical and food industries, natural gas accounts for 80% of the fuel balance; in the beverages and tobacco industries, natural gas accounts 76% of the fuel balance. Wood waste accounted for 87% of the fuel balance in the wood and wood-products industry in 2022. Fuel diversification would reduce fuel demand by enabling more efficient use of primary energy sources.
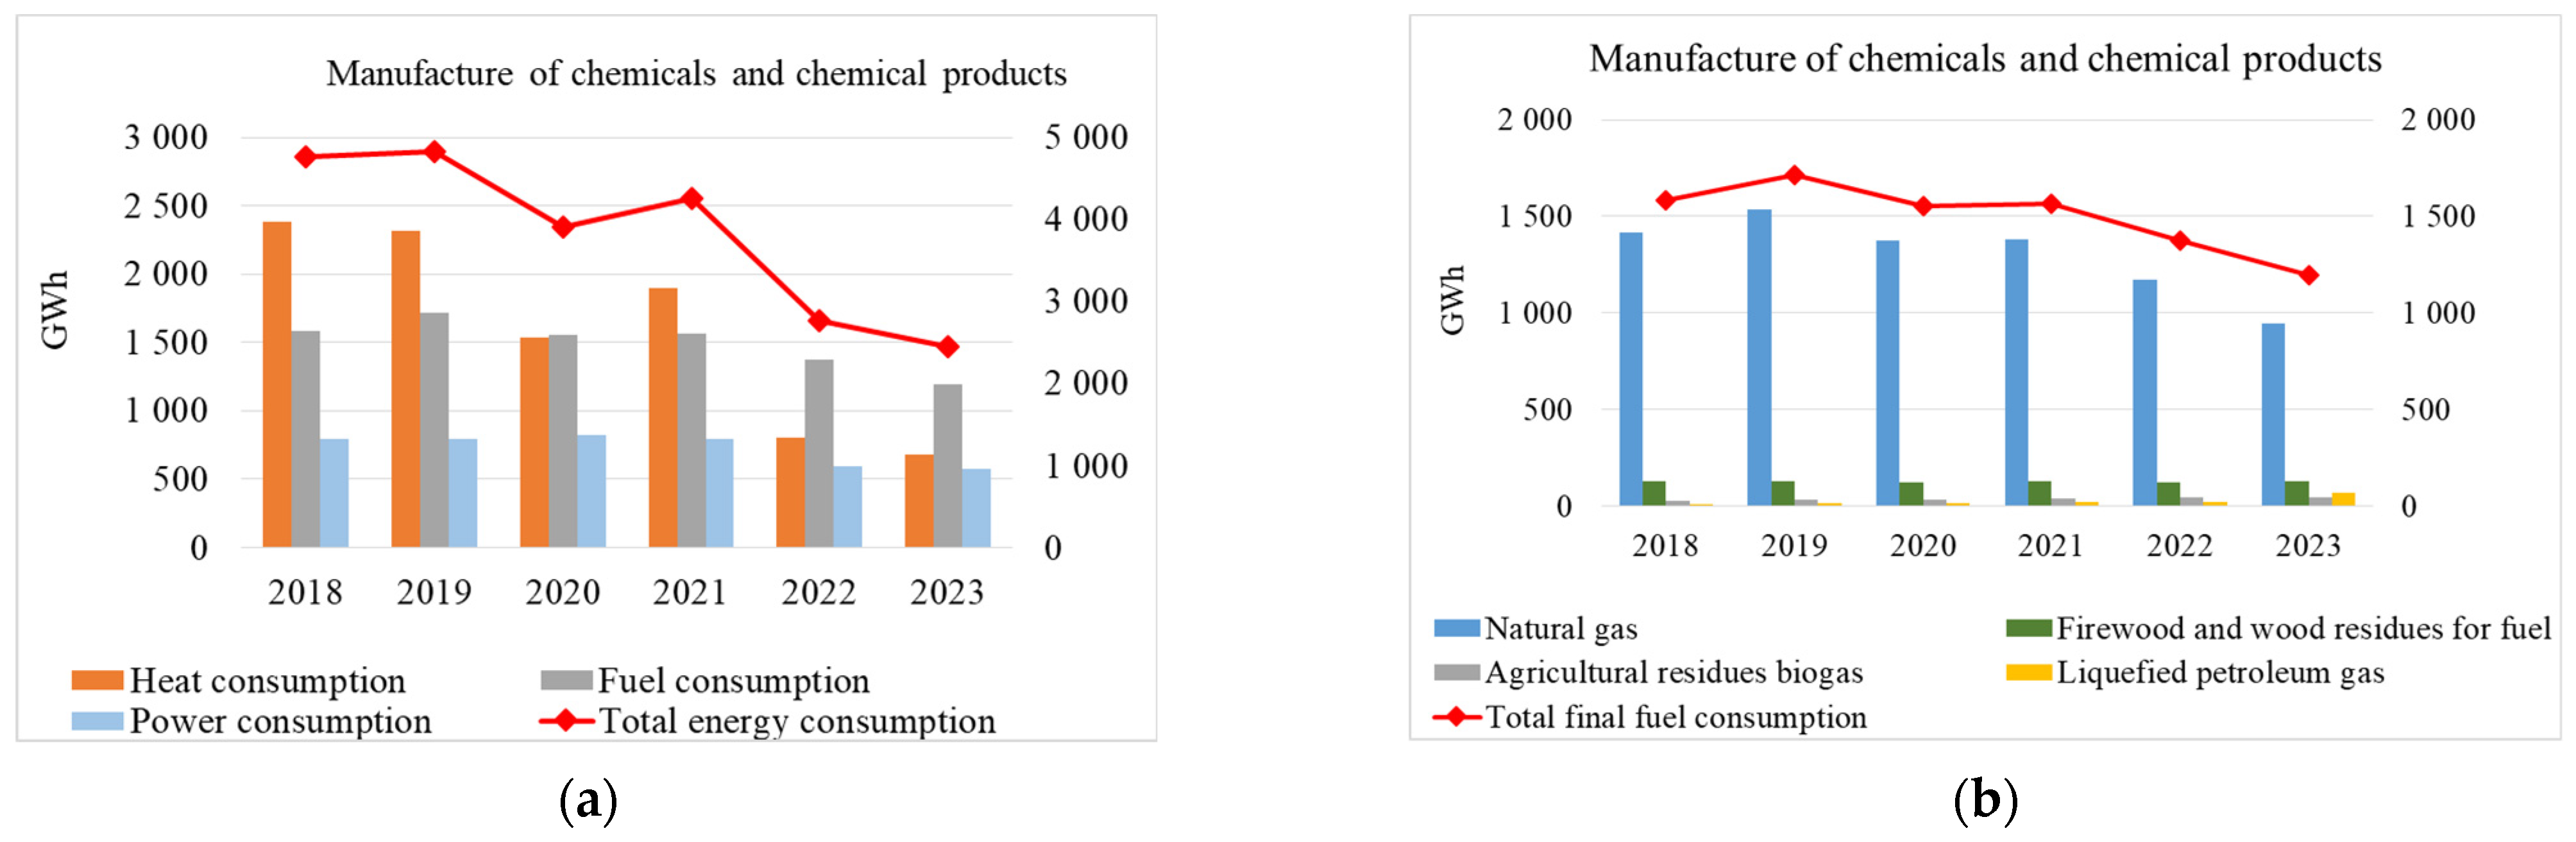
The chemical industry uses all three types of energy: fuel, heat, and electricity. Final energy consumption in the chemical industry decreased significantly between 2018 and 2023. Final energy consumption peaked in 2019, at 4833 GWh, while the final fuel consumption was only 1714 GWh (Figure 7a).
Final energy consumption in industry in 2023 was down by 49% compared to the peak, and final fuel consumption in the industry was down 30%. In final fuel consumption, wood fuel consumption remained constant between 2018 and 2023, while natural gas consumption decreased by as much as 38% compared to the peak in 2019. The significant increase in LPG consumption contrasts with the change in natural-gas consumption, with a noticeable increase in 2023 as companies diversified their fuel mix and switched to LPG to stabilize production costs per unit of output. There was a 3.5-fold increase in 2023 compared to 2022, to 71.1 GWh from 20.3 GWh. Natural gas consumption in the chemical industry is declining by a few percentage points each year but will still reach 80% in 2022 (Figure 7b). Energy consumption in the chemical and chemical products industry in 2022 averaged 19.9% in the EU and 25.2% in Lithuania of the total energy consumption in the industrial sector. The chemical industry uses mainly fossil fuels, so as much as a fifth of the energy consumption in this industry represents an opportunity for decarbonisation in this sector [29].
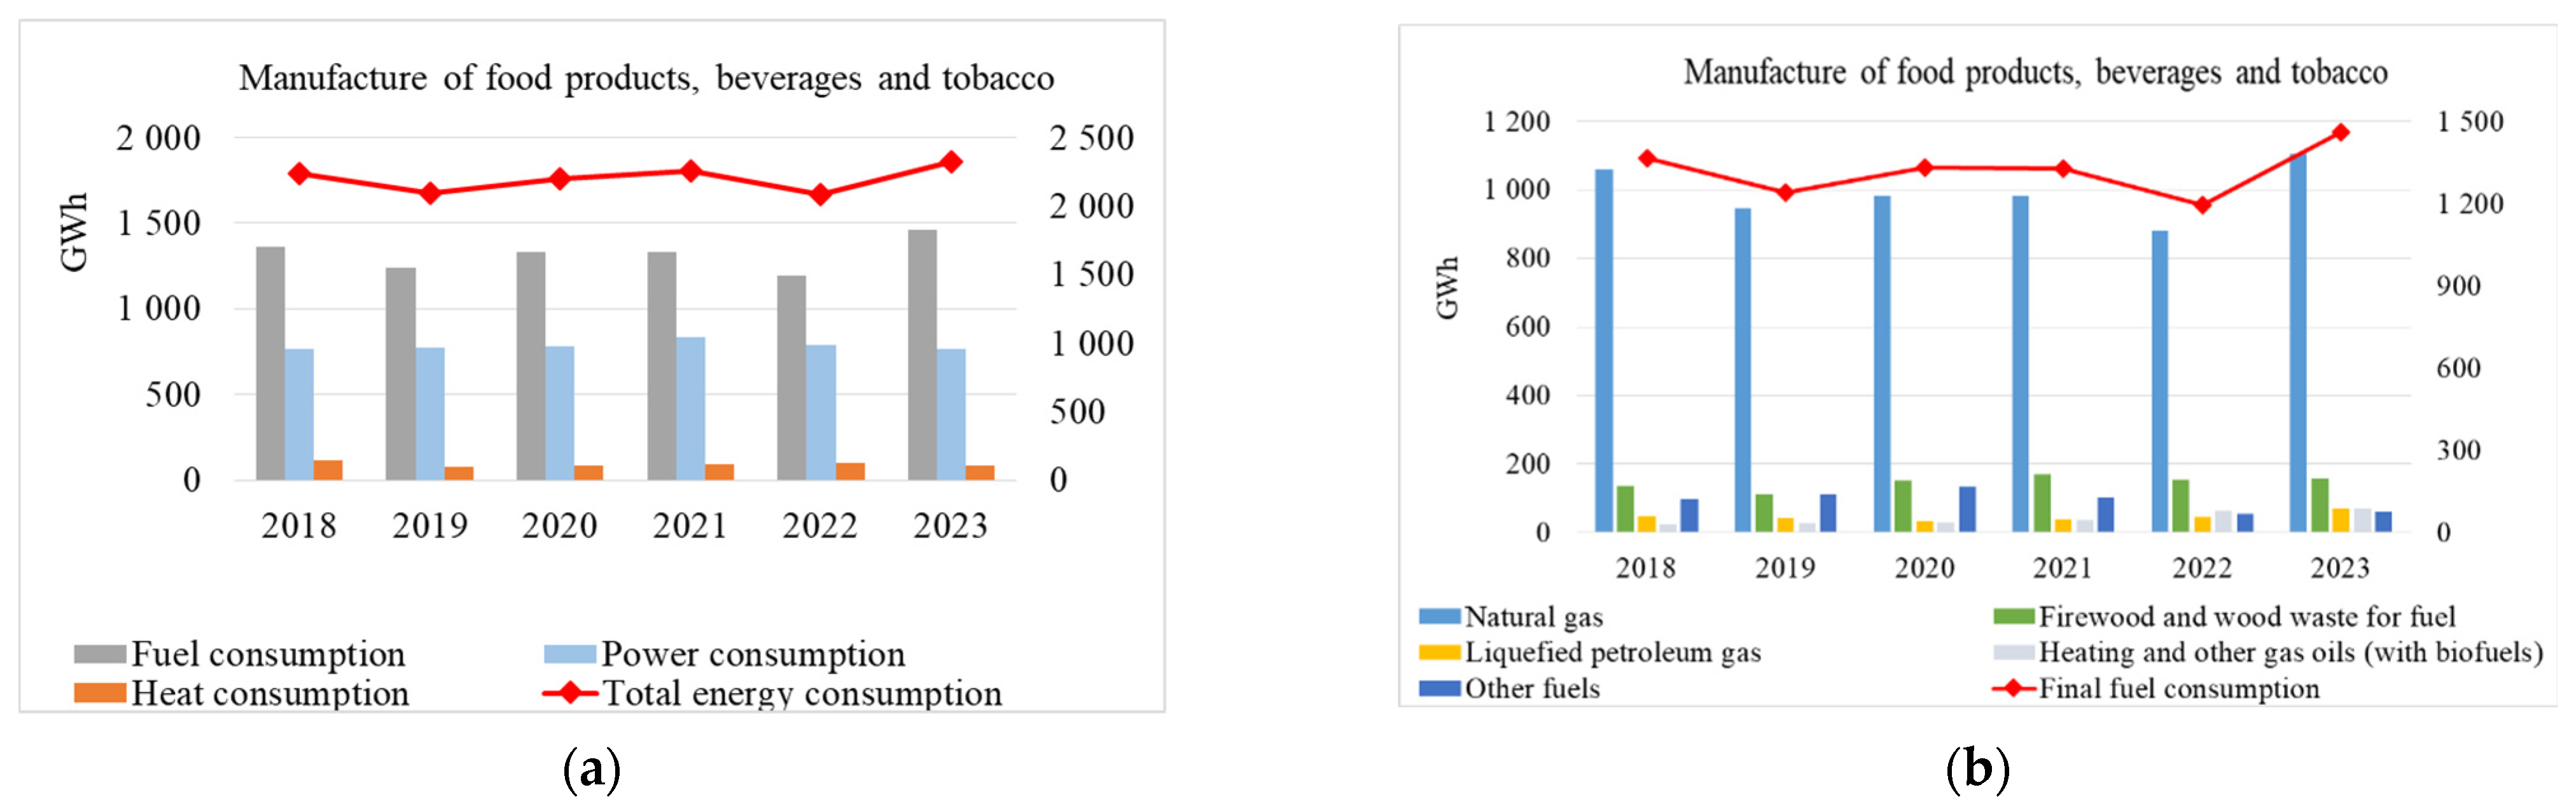
The food industry’s final energy consumption has evolved slightly, peaking at 2318 GWh in 2023. Final energy consumption and final fuel consumption in the food sector have evolved from year to year. Sill, compared to 2018, both final energy consumption and fuel consumption increased by 3% and 7%, respectively (Figure 8a).
Natural gas accounts for the largest share of fuel consumption in the food, beverages, and tobacco industry, averaging 76% of the total fuel consumption. Other fuels account for only one-quarter of the food, beverages, and tobacco industry’s final fuel consumption (Figure 8b). The energy consumption of the Lithuanian food and tobacco industry in 2022 was 19.1% of the industry’s total energy consumption, exceeding the EU average of 12.6% [29]. Natural gas is the most-used fuel in this industry, and the industry thus offers opportunities for fuel diversification.
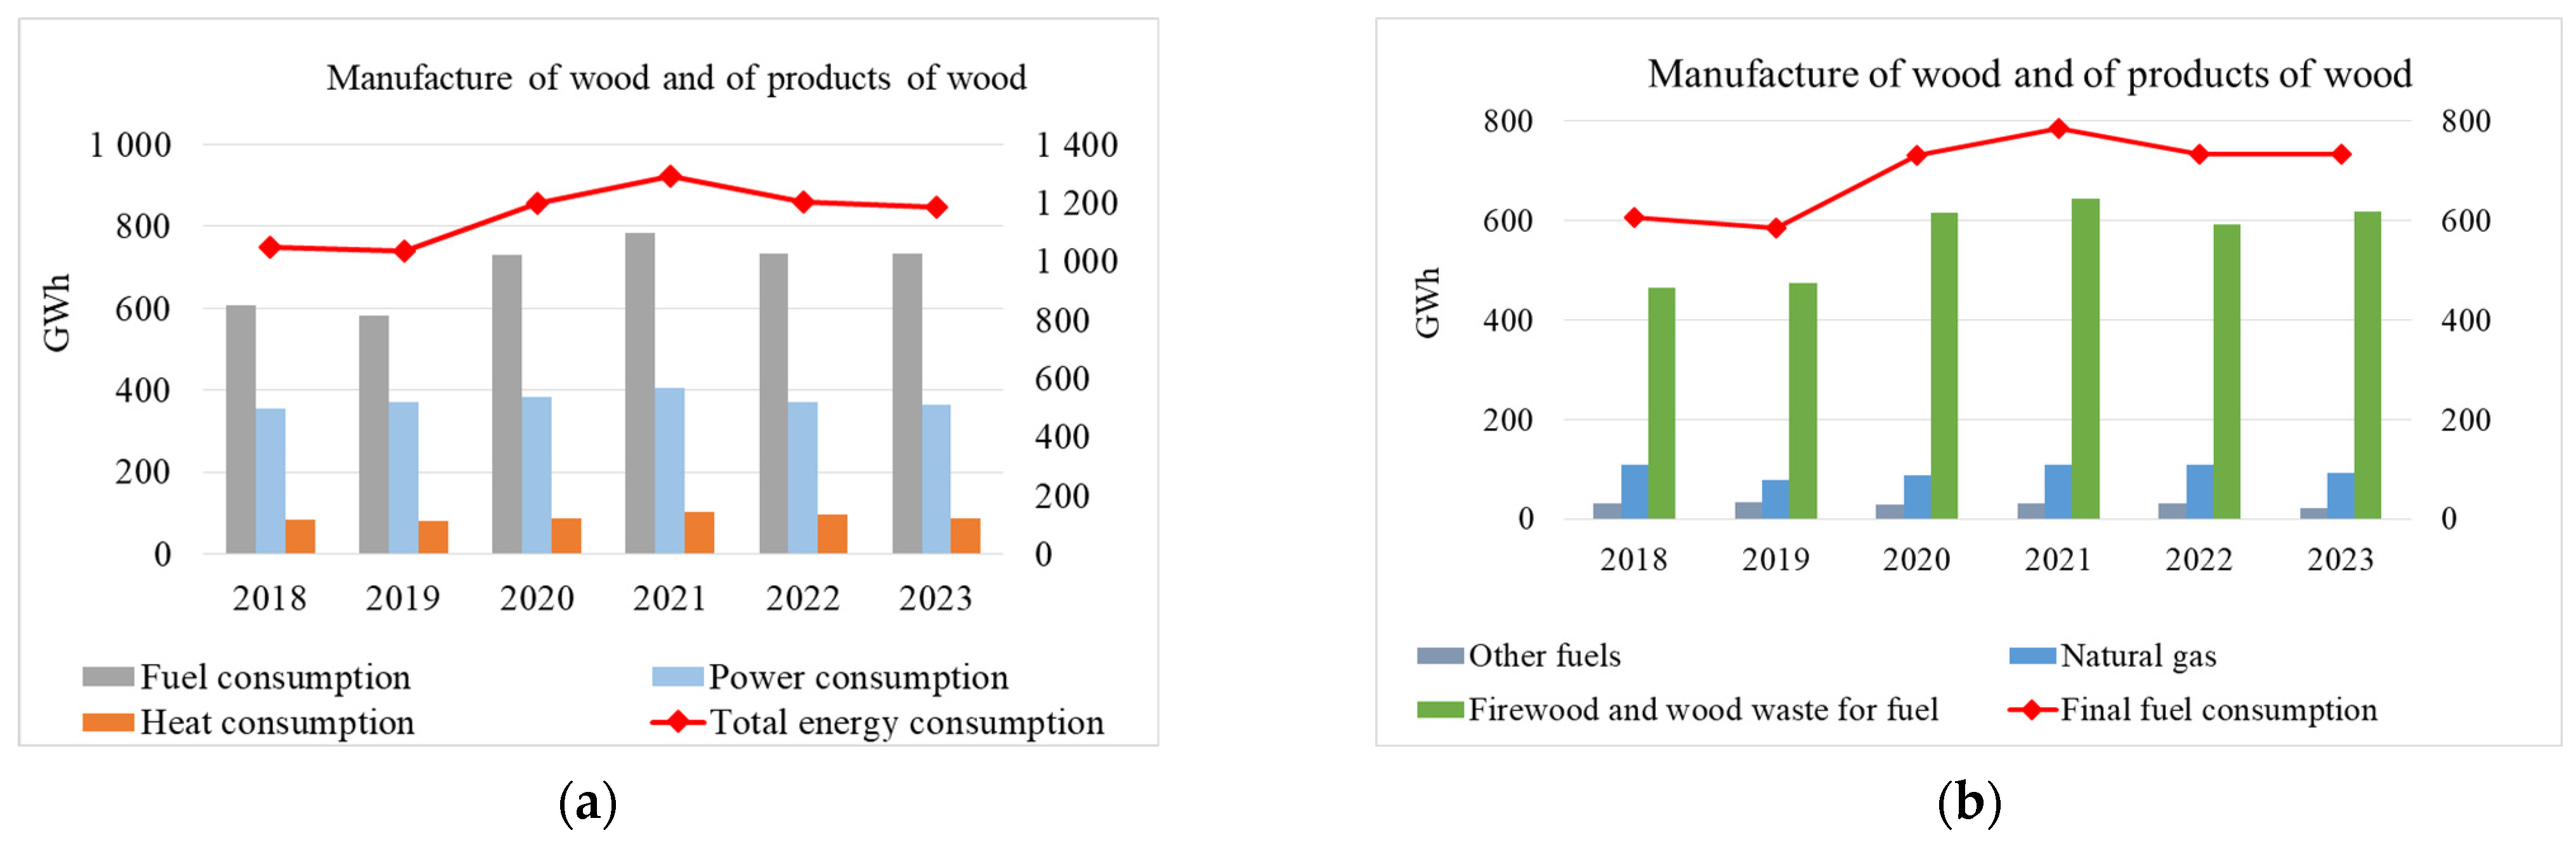
Production by the wood and wood-based-products industry has been increasing yearly, as is well illustrated by the upward trend in final energy consumption and fuel consumption. It should be noted that the COVID-19 pandemic saw reduced demand for wood and wood products, a change attributed to the slowdown in exports. In recent years, this trend in demand for wood and wood products, including furniture, paper, and its products, has continued. Exports of wood and wood products have declined by 16%. The decline in trade volumes reduced the positive trade balance from EUR 2.8 billion in 2022 to EUR 2.6 billion in 2023. The volume of exports of timber and timber-derived products dropped from EUR 5.1 billion in 2022 to EUR 4.3 billion in 2023. The share of this sector in total annual exports fell from 11.5% to 10.8% [30]. The peak of energy and fuel consumption was 1292 GWh in 2022 and 784 GWh in 2023. The downward trend in the industry’s performance was driven by declining exports, with energy and fuel consumption decreasing by 8% and 6%, respectively, in 2022 compared to 2021 (Figure 9).
In the wood and wood-products industry wood waste is the predominant fuel, accounting for an average of 600 GWh, or 82% of total fuel consumption; it otherwise becomes manufacturing-process waste. Natural gas made up only an average of about 14% or about 110 GWh in the last year. Other fuels, such as road-transport diesel and liquefied petroleum gas, make up only 5% of the total fuel consumption in the industry (Figure 9b). Wood fuels account for the largest share of energy consumption in the Lithuanian wood industry, but energy costs account for as much as 10.8% of the industry’s total energy costs. In contrast, the EU average in this industry is only 4.8% of total energy costs [29]. The fact that the energy consumption of the wood industry in Lithuania is almost twice as high as that of the wood industry in the EU shows the potential for efficiency improvements in the production process.
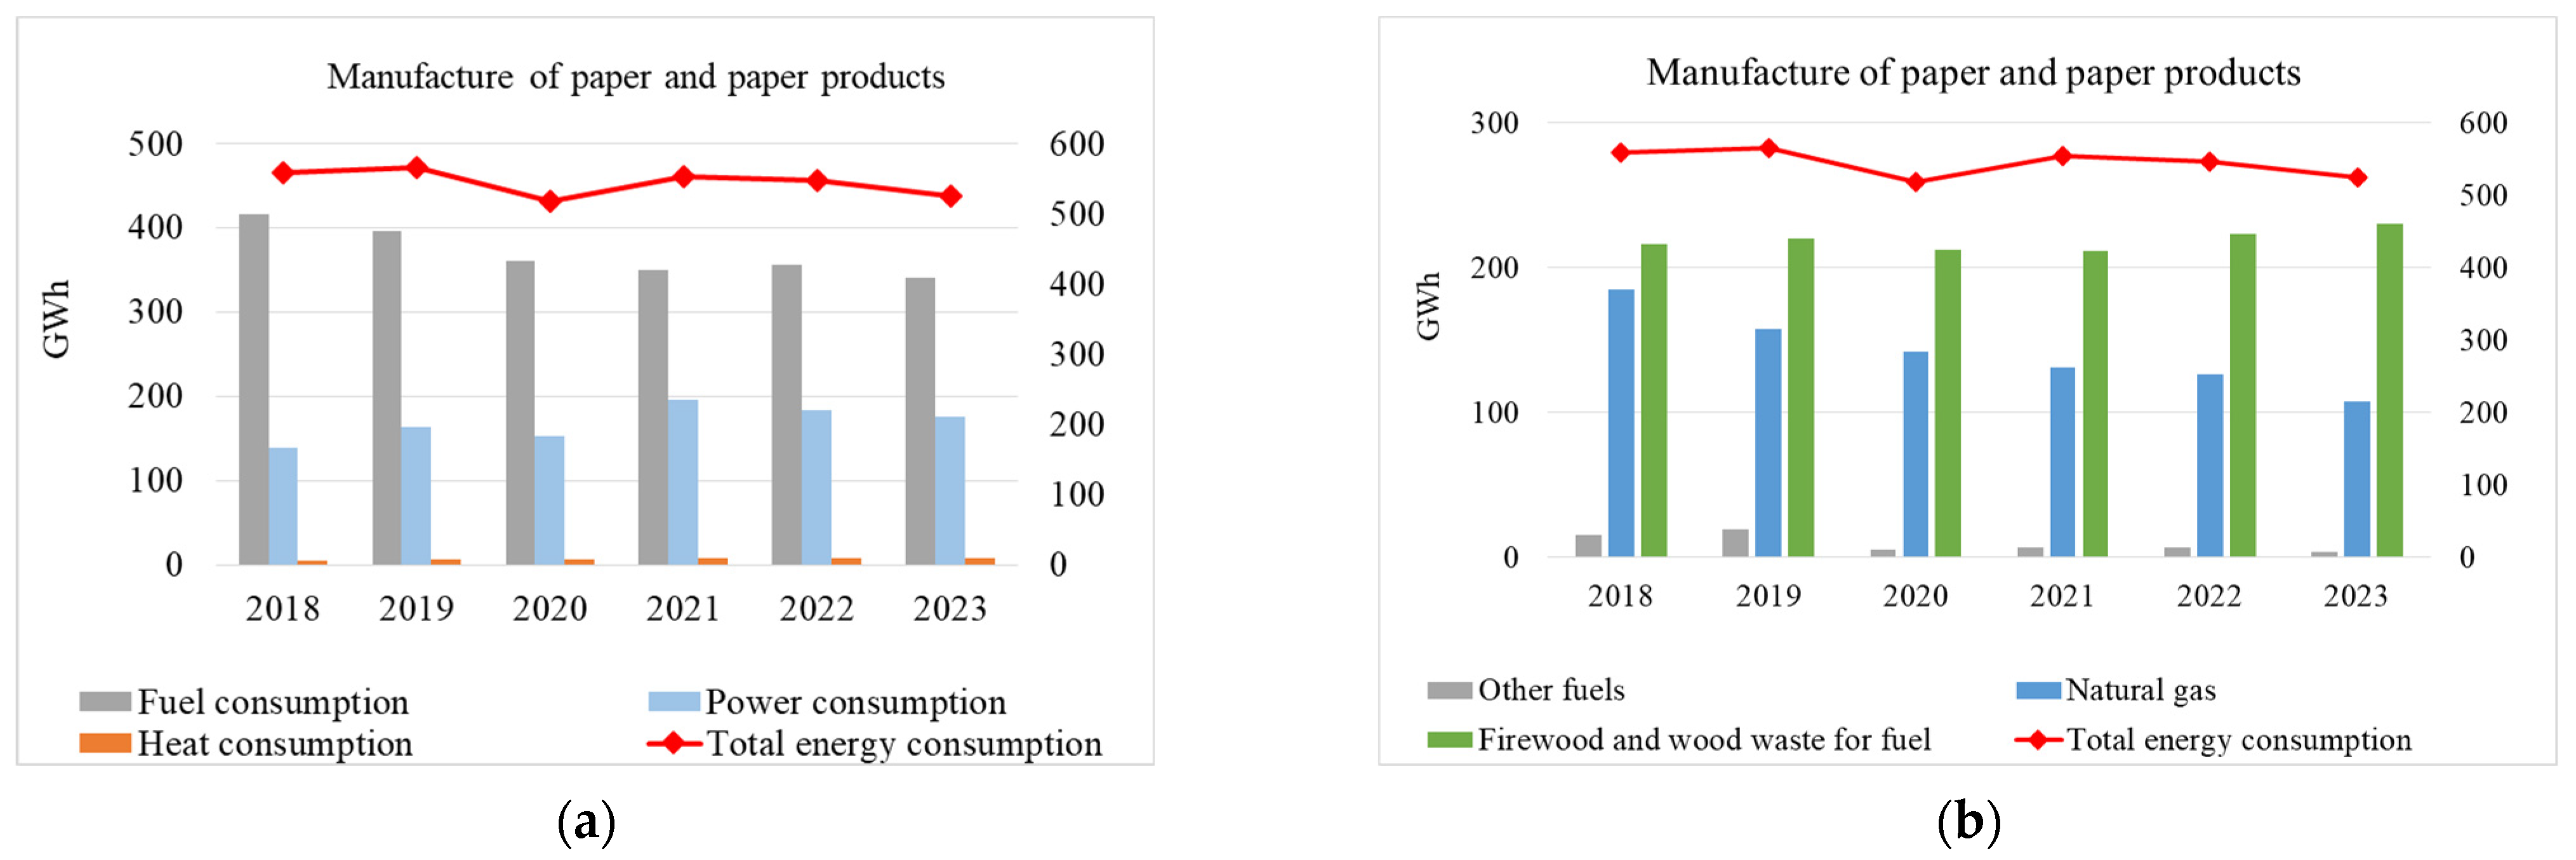
Peak final energy consumption in the paper industry was 565 GWh, reached a 2019; and the peak final fuel consumption, 416 GWh, was reached in 2018. The technology chain for the paper-production process uses three types of energy in total: fuel, electricity, and heat. A slight decrease in fuel consumption and an increase in electricity consumption can be observed in the final energy balance, for a reduction of 18% and a rise of 27%, respectively. Heat maintains a constant trend in use (Figure 10a).
The share of renewable energy in final fuel consumption in the paper industry has significantly increased. The paper industry’s fuel and energy balance consisted of 68% wood waste fuel and 31% natural gas in 2022. Natural gas consumption decreased from 44% to 31%, while the share of wood and wood waste rose from 52% to 68% between 2018 and 2023 (Figure 10b). The Lithuanian paper industry’s energy consumption accounted for 5.27% of its total energy consumption, compared to an EU average of 13.8% [29]. The fact that the Lithuanian industry’s energy consumption is almost half that of the EU industry average is attributed to the narrow range of products produced.
The large share of natural gas and wood-waste fuel among all energy sources in these chosen industries opens the possibility of fuel diversification from fossil fuels to renewable fuels.

4. Biomass Potential

Lithuania and the other Baltic countries are striving to maximize the use of renewable energy to reduce energy dependence, enhance regional energy security, and complement European decarbonization plans. The market penetration of renewables reflects a positive trend in the number of producing consumers. District heating operators first tested the real-time market penetration of renewables in district heating systems operated in relatively small towns [31]. Best practices in real-time energy-flow-management strategies are being transferred to electricity-grid operators to address the same challenges Ricardo et al. described for renewable energy sources and infrastructure development in Chile [32]. Although it is difficult to link all challenges and their impacts in a changing downstream generation market, as in the quantile connectedness approach described by Liu et al. [33], there are plans to expand the capacity for renewable-energy generation under stable market conditions. According to revised data from EPSO-G, the state-owned electricity transmission and exchange group, the permitted capacity for solar power plants reached 225 MW in 2021 and 1978 MW in 2024. The permitted capacity issued for wind power plants tripled from 623 MW in 2021 to 1741 MW in 2024 [34]. However, biomass resources, which are renewed every year, are still underexploited. Lithuania’s most widely used biomass resources are wood, industrial wood waste, and logging residues. A major part of the biomass in Lithuania is used by district heating systems, which are widespread in Northern and Eastern Europe [35]. Biomass stocks increased due to the increased total volume of accumulated stems. Processed data from the State Forest Enterprise show that the volume of stems accumulated in private and state forests steadily grew by 1.7% to 549.9 million m3 between 2011 and 2020 [36]. The total wood-fuel potential was around 367.6 million m3 in 2020 (Table 9). White alders and biscuits are challenging to consider as logging residues, as biscuits are left behind for ecological reasons and white alders are treated as forests. Due to economic inexpediency, stumps and roots are not yet used as fuel. Households use firewood, while fine-quality wood is allocated to the paper and furniture industry. The remaining logging residues ranged from 78.3 million m3 in 2011 to 91.2 million m3 in 2020.
The potential for logging residues is estimated from the total annual flow of wood-fuel feedstock from annual logging operations. The volume of logging residues increased by 22% between 2011 and 2020. Around 1.1 million m3 of logging residues are generated annually, with an energy value of 2.28 TWh [36].
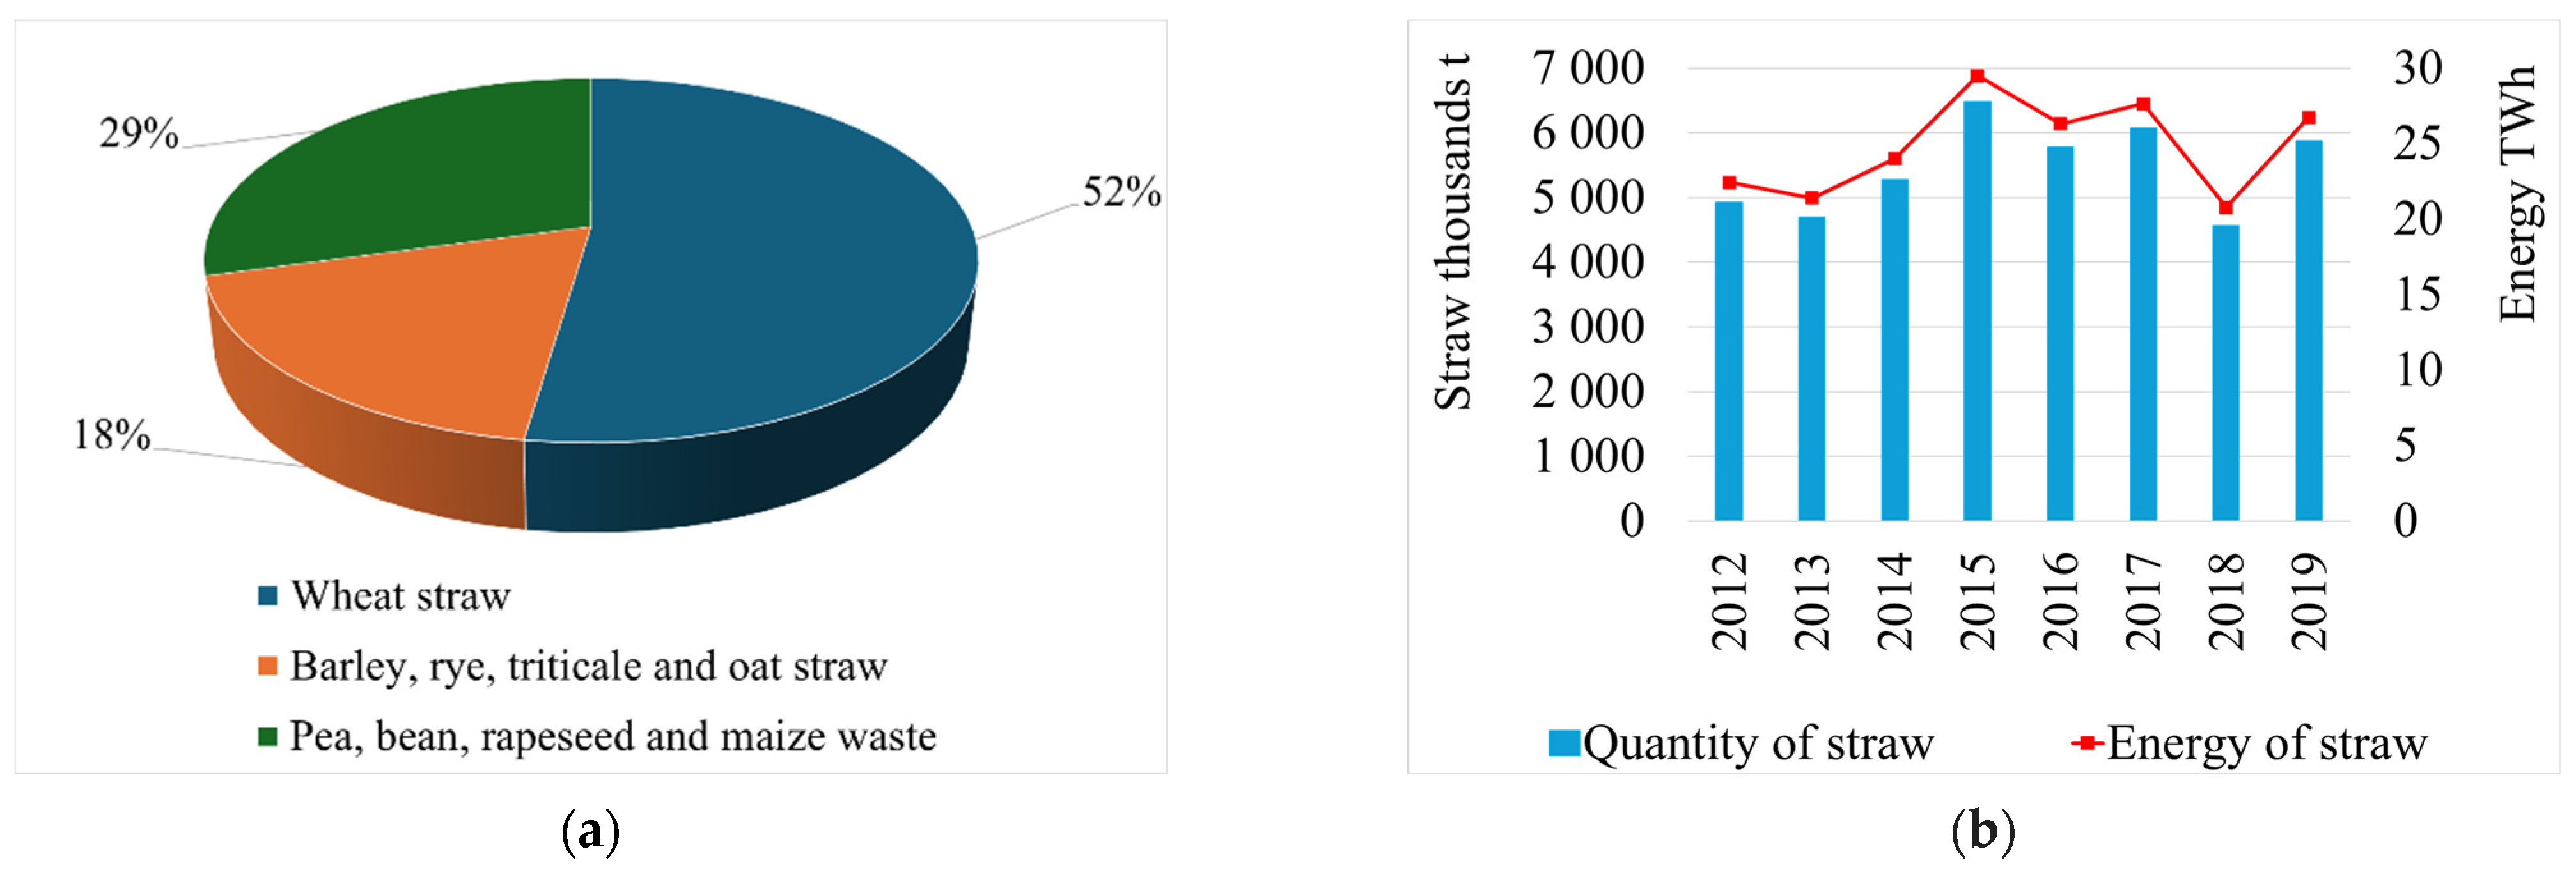
The most significant form of waste in agriculture is straw from crop production. The yield of straw is related to the yield of cereals. Research carried out by the research team of Tilvikienė et al. from the Lithuanian Centre for Agrarian and Forestry Sciences (LAMMC) shows that the total amount of straw in cereal fields in Lithuania in 2019 was about 5.88 million tonnes. Wheat straw accounted for 52%; rye, triticale, and oat straw accounted for 18%; and pea, bean, rapeseed, and maize waste accounted for 29% (Figure 11a).
Fields generate up to 5 million tonnes of total crop-waste straw each year, with a theoretical potential of up to 24.8 TWh (Figure 11b).
Lignin is a waste from discontinued industrial yeast-production process. Expert estimates put the trade volume of lignin blended with wood biomass at up to 30,000 tonnes per year, and the estimated potential is 0.5 million tonnes or 2.6 TWh of energy. Lignin has been traded on the biofuel exchange only since 2019. These biomass resources are examined in greater detail below, and a techno-economic assessment is included here.

4.1. Wood and Wood-Residues Potential in Lithuania

In 2022, firewood, forest logging, and agricultural residues accounted for 70.7% of Lithuania’s renewable energy structure. In power plants and boiler houses, biofuels were converted into 67.2% heat energy and 17.1% electricity [27]. The National Forest Inventory data cover the period since 2003, when a complete inventory of the whole country was carried out using the sampling method. The plot-based forest inventory results in stand volumes that are 10–15% lower, which has led to a shift towards using the National Forest Inventory data. As a result, a sharp increase in timber volumes was observed between 1998 and 2003 [27]. Mature-stands volume has increased from 113 million m3 to 162 million m3 since 2003, and the area has increased from 375 thousand ha to 465 thousand ha since 2003. According to the National Forest Inventory, the total volume of wood has increased from 453.4 million m3 to 566.7 million m3 since 2003. The most significant volume of timber accumulated in pine forests—232 million m3. Since 2003, the volume of wood in these stands has increased by 52 million m3. During this time, the volume of spruce forests increased from 75.8 million m3 to 102.2 million m3 [27].
Statistics Lithuania is surveying forestry companies and farms to assess the volume of logging residues and wood waste generated in the sector. The data show that more logging residues than wood waste are generated. The amount of logging fell by as much as 60%, and the amount of wood waste fell by up to 72.5% between 2014 and 2022 [27]. Logging residues are burned, used for consumption, disposed of on-farm, and sold to consumers. There has been a significant decrease in incineration; use for own needs has practically disappeared; and the amount of residues sold to consumers has halved (Figure 12a).
The downward trend in the use of logging residues reflects the associated import of cheaper timber from Belarus to the Lithuanian market. Imports of wood fuel from Belarus to Lithuania increased in 2016, reaching 401.2 thousand tons, and peaked in 2019 at 1053.3 thousand tons [36]. The value of wood-fuel imports increased from EUR 10.5 million to EUR 46.4 million in 2019. As logging residues could not compete with cheap timber from a neighbouring country, the volume of logging-residue preparation decreased (Figure 12b). The high volumes of wood-fuel imports are confirmed by statistics showing trade volumes between 2014 and 2022 ranging in value from USD 16 million to USD 51.9 million [37].
The international biomass exchange “Baltpool” was established in 2012 to standardize biomass auctions in the Baltic Sea Region. Subsequently, it expanded its activities to organize heat auctions and administer public-interest service funds for the electricity sector [38]. In Lithuania, representatives of “Baltpool” have proposed an amendment to the Law on Heat [39]. The selected SM3D woodchip production specifies a moisture content of between 35% and 55%, an ash content of less than 5%, a fractional size of 3.16–63 mm, a small-particles fraction of less than 20%, a chlorine content of less than 0.02%. It is made from short-rotation plantations and logging residues. Wood-chip production is divided into six categories that differ in terms of moisture content, ash content, and fineness. The specifications for woodchip production are given in Table 10.
SM3D is a biofuel made from timber trunks, residues from the timber industry, unharvested trees, dried energy crops, and dried residues from harvesting residues from forestry. Woodchip-production trade volumes have averaged 2000 thousand tones yearly for the last five years (Figure 13a).
The amount of energy sold is approximately 5.7 TWh annually. The most-traded product is SM2-specification woodchips, with annual sales volumes averaging up to 1300 thousand tonnes annually. The second product of interest on the market is SM3. The average sales of SM3 were half those of SM2 in 2022, but sales volumes in recent years have been as high as 700 thousand tonnes per year [38].
The logging residues consumed were declared and are reported in the statistics. Some of this biomass is left in the forest due to ecological requirements; some is laid in clearings; and some is left in the forest due to the excessive cost of the product. The technical potential of logging residues from mature-forest harvesting will be assessed. The average volume of mature tree branches is around 15% of the volume of the tree, according to the State Forest Service [10]. It is assumed that only 7% of the branches can be technically extracted from the forest for subsequent use. Mature forests are harvested annually at an average rate of about 6.5 million m3 of green trees, according to annual reports submitted to the State Forest Service under the supervision of the Ministry of Environment [40,41,42].
The lignin accumulated in Lithuania is a by-product of the previous yeast production. Yeast production has ceased, and up to 0.5 million tonnes of lignin is stored. The lignin biofuel blend has a high moisture content of ~43%, a calorific value of ~19 GJ/t, an ash yield of ~8%, and a sulphur content of ~0.2% [43]. The lignin biofuel blend is sold mainly in Lithuania, both directly to customers and via the biofuel exchange. Lignin has been traded on the biofuel exchange only since 2019 (Figure 13b). Market participants have shown interest in lignin, and in 2023, trading volumes increased by as much as 60% compared to the previous year, reaching a trading volume of 16,000 tonnes/year, corresponding to as much as 38.6 GWh of energy [38]. The increase in trade volume can be attributed to the increased demand due to the SURE scheme certificate awarded following the certification audit carried out at the company in February 2023 [44].
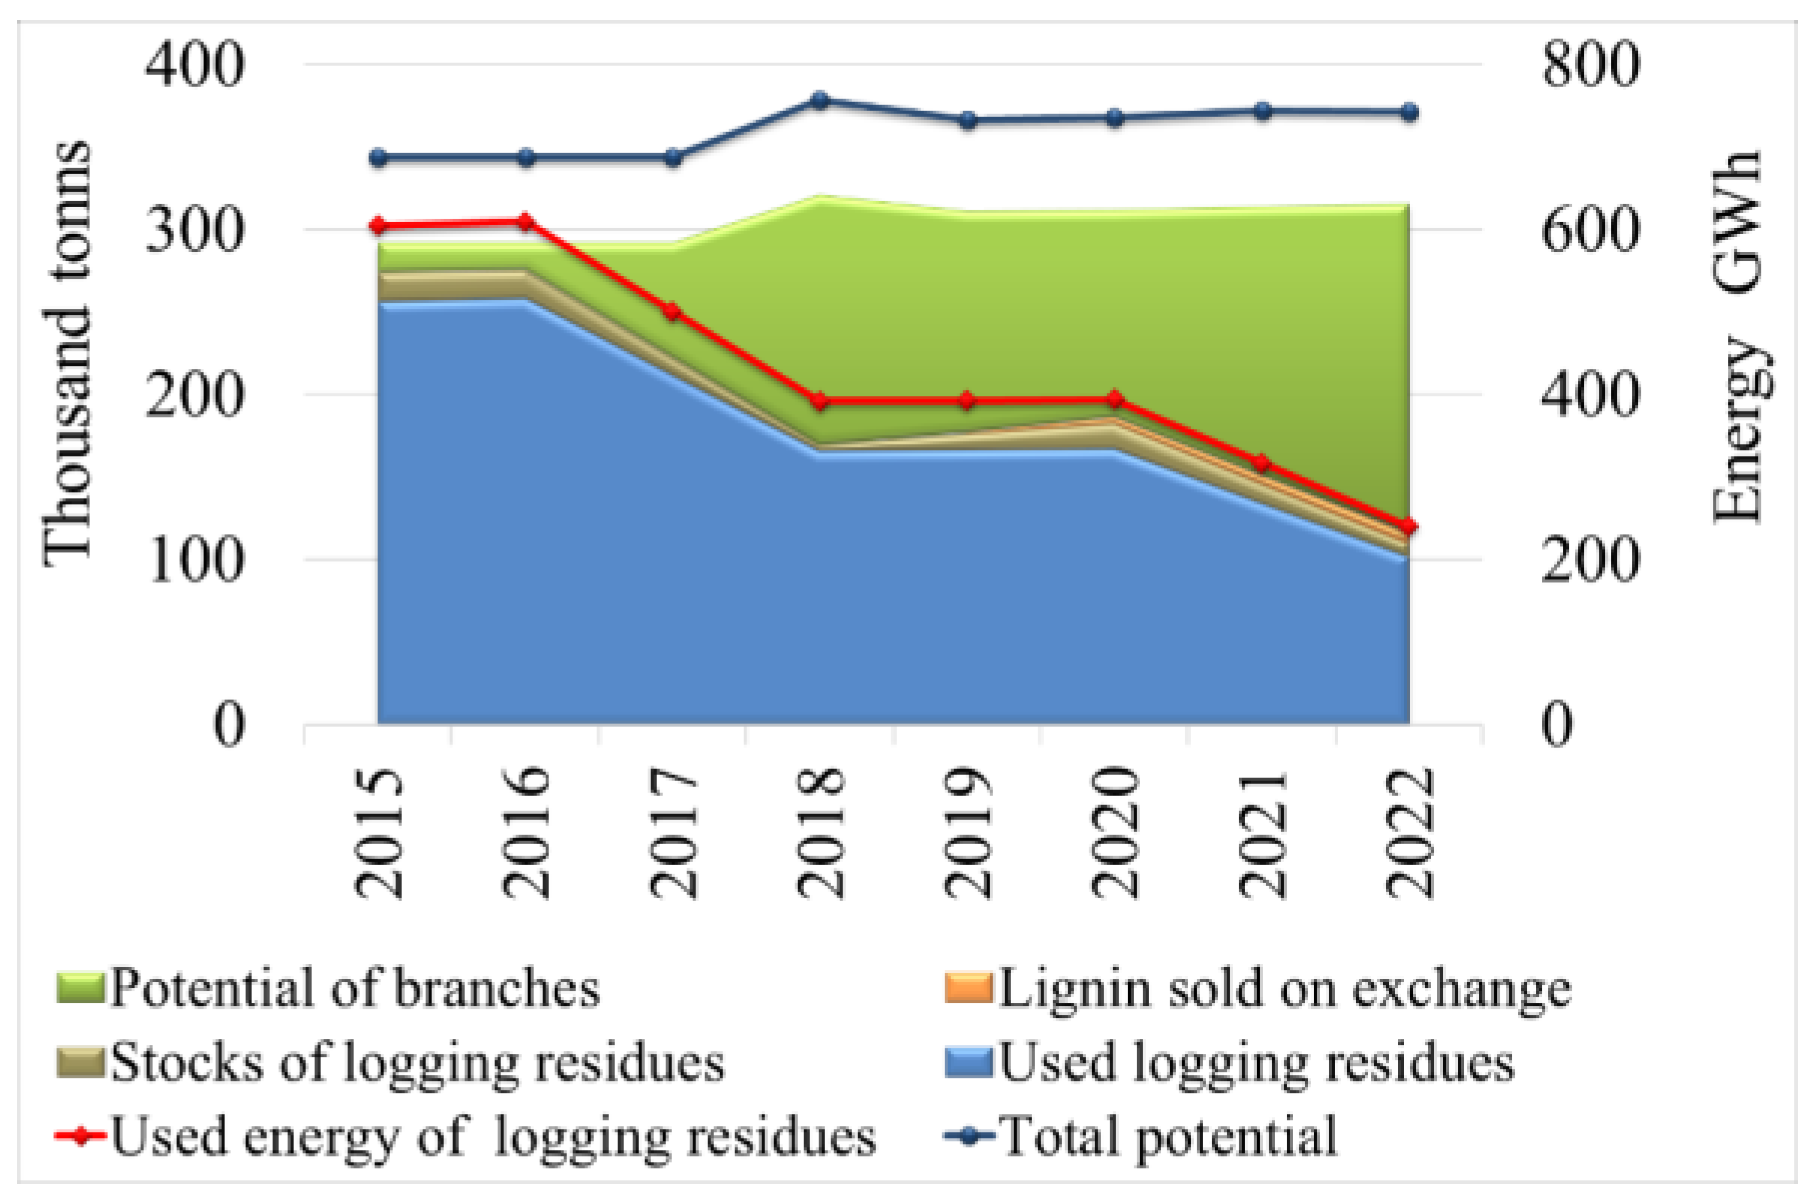
The total amount of logging waste suitable for producing woodchip products is around 300 thousand tonnes annually. Forestry companies and other managers consume between 258 and 102 thousand tonnes of logging residues annually. The free technical potential left on the logging sites is between 16 and 165 thousand tonnes per year, depending on the year. This amount ranges from 83 MWh to 399 MWh per year, depending on the year (Figure 14).
The potential of logging residues is also underexploited in Sweden. Swedish researchers estimated the ecological potential of the industries and arrived at a slightly higher potential of 21,120 GWh in 2020 [45]. At the same time, the potential of the branches used in 2020 was only 7384 GWh. As in Lithuania, the potential of logging residues in Sweden is not fully exploited for energy needs. The free-economic-zone policy formulated by Minzhe Du’s team in the study is an effective liberalisation policy that promotes energy efficiency and exploits existing potential. However, free-trade zones must consider sustainable development that does not harm the environment [2].

4.2. Agricultural Residues in Lithuania

In Lithuania, the area of land used for agriculture has declined slightly over the last five years, while the area of arable land has been increasing, accounting for 35% of Lithuania’s total land area (Table 11).
The greatest amount of agricultural residues is generated by crop production. The amount of straw is related to the yield of cereals. Its yield depends on the type of cereal crop, the variety, climatic conditions, etc. Bužinskienė et al. has described in a paper a methodology for assessing primary agricultural residues [46]. The researcher classified straw as direct agricultural waste and presented a method for evaluating the straw produced. The methodology considers the amount of straw generated based on the yield and type of cereals and rapeseed crops. Statistics Lithuania provides annual data on winter and summer cereal and rapeseed crop yields via interactive access. The production of grains in Lithuania has increased significantly in recent years [27].
Statistics Lithuania generates data on the straw volumes generated every second year through a survey on straw volumes collected in agriculture; these data are available via interactive access. Agricultural companies, large farmers, and family farms declare the quantities of straw collected [27]. The amounts reported of straw collected include straw from winter cereals (wheat, triticale, rye, barley), spring cereals (wheat, barley, triticale, rye), and winter and spring rapeseed crops. A coefficient can be used to represent the ratio of product to residue yield, allowing the estimation of the amount of straw generated by the harvested crop. These coefficients are presented by Bužinskienė et al. and Scarlat et al. in their papers [46,47].
The average quantity of straw left on the fields is 2263 thousand tonnes per year. Wheat straw was the most abundant, at 1533 thousand tonnes in 2015 and 1569 thousand tonnes in 2022, while rye straw was the least, at 37 thousand tonnes in 2022. Wheat-straw production was down by as much as 64% in 2022 compared to 2015, at only 86 thousand tonnes. The energy potential of straw left in the field is more than 10 thousand GWh annually, with a low of 7156 GWh in 2018 and a high of 12,785 GWh in 2022 (Table 12).

4.3. Fluctuation of Feedstocks Price

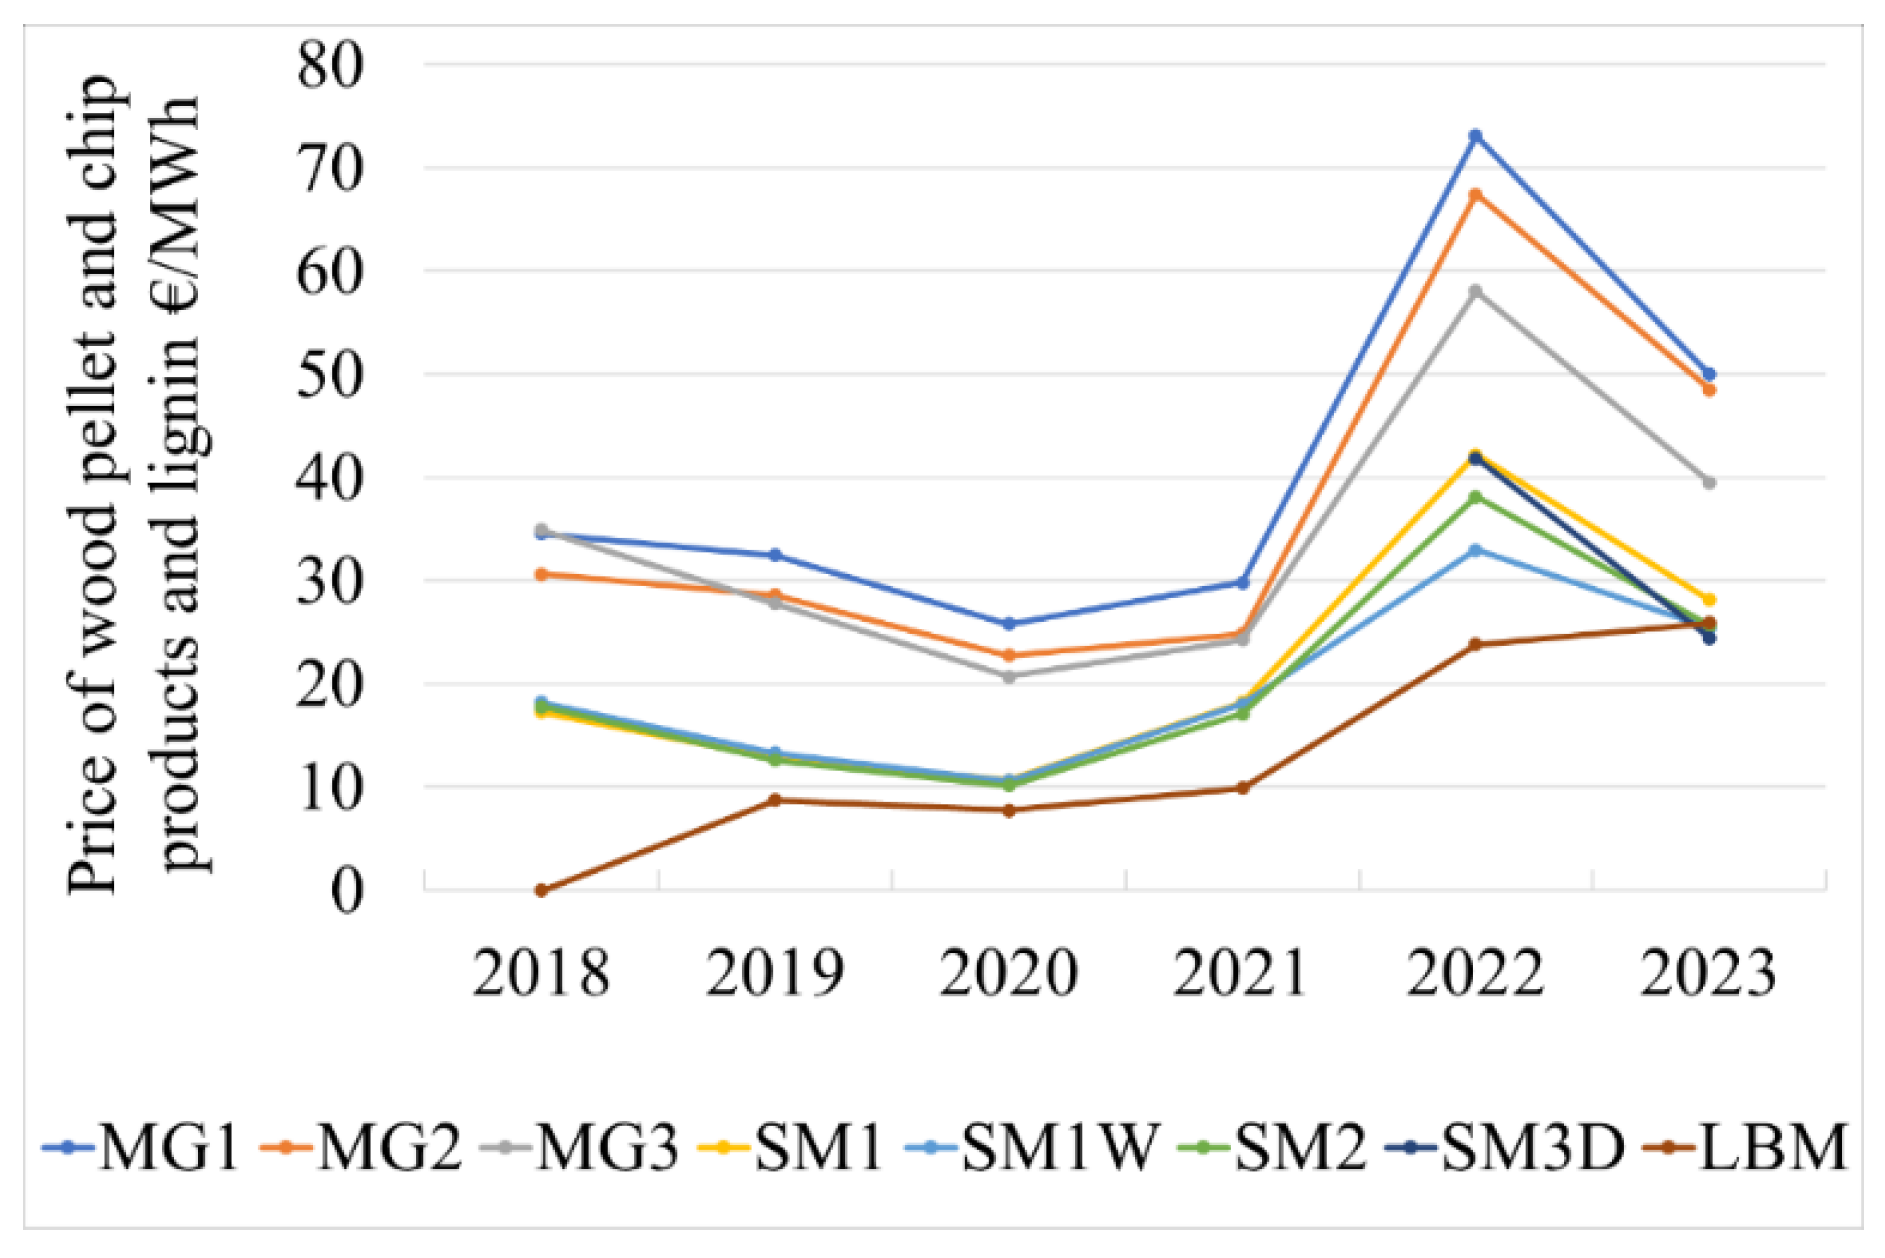
Trends in the market prices of energy resources and raw materials influence the penetration of alternative fuels in the energy market and their competitiveness. The competitiveness of synthetic natural gas and biomethane with natural gas is determined by the price of biomass feedstock, which fluctuates in line with prices of natural gas and other fuels. The annual analysis of biofuel prices shows a consistent increase in the price of wood pellets, woodchips, and lignin and biomass blends. In 2023, the prices of these products exhibited an upward trend. Specifically, wood-pellet production costs rose by up to 63% compared to the same period in the previous year, while woodchip-production costs increased by up to 55%. Conversely, biofuel prices showed a declining trend in 2023. However, over the broader period from 2018 to 2023, biofuel prices experienced an average increase of 47% (Figure 15).
The price of the lignin and biomass blend showed little change between 2019 and the end of 2021 due to stable demand, and the price was kept between 9 EUR/MWh and 11 EUR/MWh. As market participants have shown interest in this type of biofuel, the price has shown an upward trend, from 13 EUR/MWh at the beginning of 2023 to a peak of 32 EUR/MWh in December 2022 [
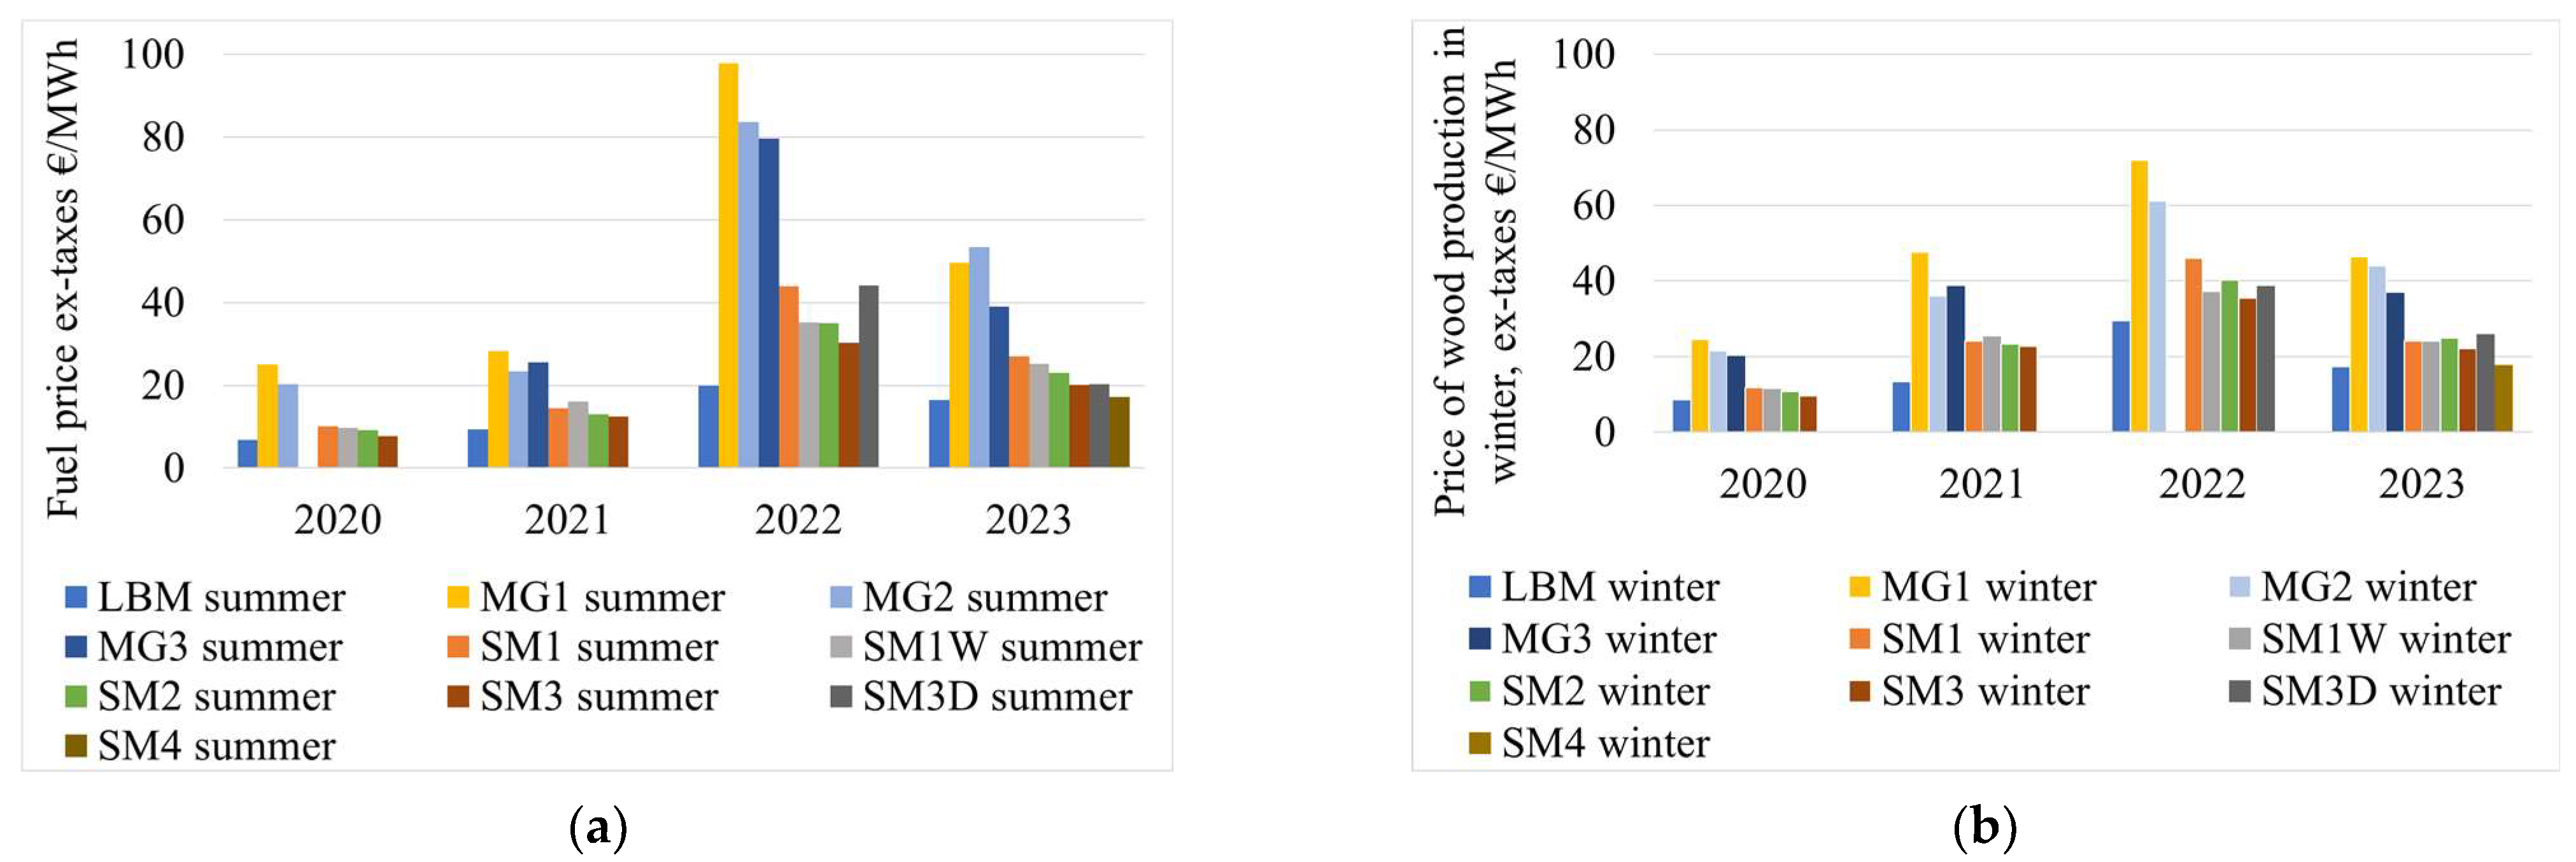
38]. This price increase is linked to the general trend of rising energy prices in Lithuania and abroad. The prices of woodchip products and lignin blends fluctuate yearly for the same summer or winter season. The price of all wood products increased annually during the summer season, rising by an average of 27% in 2021 compared to the same period in the previous year. In 2022, due to the geopolitical upheaval resulting from the reduction in the supply of natural gas on the spot market, the prices of other energy resources also increased by as much as an average of 65% compared to the previous year. In the corresponding period in 2023, however, there was a 37% average decrease in the price of biomass products. Looking at the price dynamics of woodchip products from 2020 to 2023, one can see an average price increase of 60% (Figure 16).
The average price dynamics for woodchip products up to 2021 have followed the market trend of lower prices in summer and higher prices in winter (Figure 16a). The average price of these products was 9 EUR/MWh in the summer season, 14 EUR/MWh in the winter season in 2020, and 14 EUR/MWh and 26 EUR/MWh in 2021. The changing geopolitical situation and decreased volumes of natural gas futures led to adjustments in biomass prices, resulting in a levelling or even an increase in the average summer vs. winter prices in 2022 and 2023. Accordingly, the average prices of wood products were 47 EUR/MWh in summer and 36 EUR/MWh in winter in 2022; these prices were 29 EUR/MWh and 28 EUR/MWh, respectively, in 2023 (Figure 16b).
Cereal straw is the largest source of agricultural waste in Lithuania. Trends in straw fuel prices have evolved over the last five years. The price of straw fuel has been decreasing on average by 50% in May and June, except in 2023, and increasing by around 40% from July onwards, maintaining a similar price trend as in 2019–2021. A decrease in straw prices is observed from October to November 2021. Significant price increases can be observed from August onwards, with prices increasing by as much as 50% from July 2023 [48].

5. Techno-Economic Calculations

5.1. Synthetic Natural Gas Price

The capacity of the modelled SNG plant is 1 MWoutput or 7884 MWh/year for an operating time of 7884 h/year. The investment in the SNG plant amounts to EUR 3.734 million, assuming a discount rate of 5%. The modelling results show that with an electricity price of around 140 EUR/MWh (excluding VAT) and a feedstock price of 24 EUR/MWh (excluding VAT), the cost of produced SNG is 57 EUR/MWh. The estimated cost of synthetic natural gas production differs from the results of other researchers’ studies. A study by Cormos et al. showed that the cost of production of SNG using SNG production and CO2-capture technology was 53 EUR/MWh [4]. This difference in production cost could be due to the higher price of the energy resource adopted as the price of electricity. The calculation assumes energy prices increase continuously, with electricity at 1% per year and natural gas at 2% per year. The moderate long-term increase in electricity and natural gas prices is based on several assumptions. The Seimas of the Republic of Lithuania has approved the National Energy Independence Strategy, according to which the final consumption of electricity will increase almost threefold and will reach 34.7 TWh in 2050 from 11.2 TWh in 2022, while natural gas will decrease from 6.2 TWh in 2022 to 0.2 TWh in 2050 [49]. Increasing electricity demand should increase the price, but research by the Paul Kozlov group shows that in the long term, the price of electricity should decrease due to the growing RES capacity [50]. A study by Pöyry Management Consulting on the development of the wholesale gas market forecasts an increase in the price of gaseous fuels in the Baltic region in the long term [51]. Due to the different arguments available, we have assumed a consistent rise in electricity and natural gas prices.
The price of natural gas at the border determines the profitability/competitiveness of SNG power-plant production. With the price of natural gas at the border at 25 EUR/MWh excluding VAT, SNG production becomes noncompetitive and cash flow is always negative (Figure 17a).
At the higher border gas price of 50 EUR/MWh excluding VAT, the cash flow becomes positive in the eighth year of operation (Figure 17b). The rapid payback on investments is influenced not so much by the price of the energy resources used in the technological chain as by the competitive market price of natural gas. The cash flow would become positive in the first year of operation if the electricity price remains at 140 EUR/MWh excl. VAT and the natural gas price at the border remains at 100 EUR/MWh excl. VAT (Figure 17c).

5.2. Biomethane Price

The production of biomethane and SNG has great advantages in terms of scalability. These technologies are compatible with the existing natural-gas infrastructure, making them easier to distribute and integrate. Biomethane production costs can be around 69 EUR/MWh in Europe, and excluding feedstock, the bulk of the costs are investment costs [52]. The energy-conversion efficiencies are typically on the order of 50% to 65%. In addition, the use of biomass or organic waste as feedstock allows for a flexible supply of feedstock, although regional variability and competition with food production may pose challenges. The cost of SNG production is strongly influenced by electricity prices and the level of utilisation of the facilities, but the maturity of these technologies gives an economic and infrastructural advantage [53].
The capacity of the modelled biomethane plant is 1 MW output or 7884 MWh/year for an operating time of 7884 h/year. The investment in the biomethane plant amounts to EUR 2.98 million, assuming a discount rate of 5% and the average price of feedstock of 24 EUR/MWh excl. VAT; energy prices increase continuously, with electricity at 1% per year and natural gas at 2% per year. At current natural gas prices, the border of 25 EUR/MWh excl. VAT and electricity of 140 EUR/MWh excl. VAT makes biomethane production unattractive (Figure 18a).
At natural gas prices, the border of 50 EUR/MWh excl. VAT and electricity of 140 EUR/MWh excl. VAT, the cash flow becomes positive in the twelfth year of operation (Figure 18b). With a high natural gas price at the border of 100 EUR/MWh excl. VAT and an electricity price of 140 EUR/MWh excl. VAT, the cash flow becomes positive in the first year of operation (Figure 18c).

5.3. Green Hydrogen Price

Proton-exchange membrane (PEM) electrolysis is a promising technology for the production of green hydrogen, with high initial efficiency (70–90%) and fast response to changing demands, making it well suited for integration with RES. However, one of the major drawbacks of this technology is the high investment and operating costs. PEMs are characterised by a degradation in performance over time. Stack degradation is a major issue, with a stack having a lifetime of up to 60,000 h [54]. The degradation rate can be up to 3.2 mV/h, so that efficiency decreases over time and drops from 65.3% to around 59.5% by the end of life [54]. This degradation can increase the Levelized Cost of Hydrogen (LCOH) by up to 1.5 times. Although future cost reductions are expected due to technological improvements and scaling, these limitations remain significant barriers to widespread technological deployment. Summarizing all these facts provided above, electrolysis is a cleaner and more flexible method of hydrogen production that is particularly suitable for renewable energy systems; however, current technical constraints limit its applicability in the short-term period, and it can be considered as a technology for application in the more distant future, beyond the 2030s.
It is incorrect to assess the competitiveness of hydrogen based on the price of natural gas on the border of Lithuania, as has been done in the case of SNG and biomethane, because the cost of electricity is a decisive factor in the cost of hydrogen. The National Energy Independence Strategy envisages several energy-market scenarios. The roadmap scenario sees an increase in electricity-generation capacity. Electricity generation by onshore wind-power plants will increase from 0.7 GW in 2022 to 10 GW in 2025; that of offshore wind-power plants will increase from 0 GW in 2022 to 4.5 GW in 2050; that of solar power plants will increase by up to 9 GW; and total electricity generation in 2025 will reach 74 TWh. According to the strategy, the capacity of hydrogen electrolysers is expected to increase from 0 to 8.5 GW in 2050 [49]. Energy suppliers from Finland to Germany are planning a Nordic Baltic Hydrogen Corridor, which will allow for the export/import of hydrogen depending on market trade and fluctuations in energy prices [55]. The envisaged strategic visions could make hydrogen production competitive under power-surplus conditions.
In the case of hydrogen production, assumptions included a constant natural gas price of around 50 EUR/MWh, and the trend of accumulated cash flows and the cost of hydrogen were calculated (a) at an electricity price of 50 EUR/MWh; (b) at an electricity price of 0 EUR/MWh, and (c) at an estimated electricity price of a negative 26 EUR/MWh to make the cost of hydrogen equal to zero. The last case (c) shows the trend in how much the surplus electricity would cost if hydrogen were to penetrate the market (Figure 19).
Only in the case of surplus electricity and a negative price of 26 EUR/MWh does the cumulative profit of hydrogen production become positive in the eighth year. Otherwise, it is not economically attractive.
The benefits of fuel diversification are more evident in the case of biomethane at a high natural gas price of 100 EUR/MWh, as cash flows are already positive in the fourth year, showing a return on investment and cost savings that will allow companies to save working capital for the next investment and increase labour pay (Table 13). In the SNG case, the benefit is not so immediate.
The additional revenue generated would allow the business sector to invest more in innovation by increasing the digitalisation of the technological process, raising the pay level for employees and increasing the corporate tax paid to the state, which currently stands at 15% of revenues. The fuel-diversification process requires financial resources and time to implement. Still, diversification can bring tangible benefits to fuel producers, consumers of a lower-carbon substitute for natural gas, and the state through the tax base for the transition to the hydrogen-energy era.
The cost of production output depends on the price of the raw material used. For SNG and biomethane, it depends on the price of biomass and, for hydrogen, the price of electricity (Figure 20a).
Figure 20 shows how production costs respond to changes in the price of raw materials and the discount rate. Biomethane is very sensitive to the feedstock price, while SNG remains relatively stable due to its capital-intensive structure. Hydrogen-production costs increase sharply with the price of electricity, confirming its high dependence on energy costs. All three fuels show similar increases in cost with increasing discount rates, indicating a similar sensitivity to the cost of capital. Overall, feedstock costs remain the dominant factor in bio-methane and hydrogen production, and financial conditions play an important role in all production routes. These differences highlight the importance of the regional resource and investment context in the choice of technology

6. Conclusions

  • Biomass potential in Lithuania is estimated to start the fuel-diversification process: logging residues account for 1.1 million m3 of logging residues each year, with an energy value of 2.28 TWh; agricultural residues generate up to 5 million tonnes of total crop waste litter annually, with a theoretical potential of up to 24.8 TWh; lignin final potential is estimated at 0.5 million tonnes or 2.6 TWh of energy.
  • The feedstock-potential analysis and the technical-economic analysis for a 1 MWh synthetic natural gas power plant showed that SNG production could compete with natural gas on the market at electricity prices of 140 EUR/MWh excl. VAT, at an average price of logging residues of 24 EUR/MWh excl. VAT, and a natural gas price at the border of 50 EUR/MWh excl. VAT.
  • Analyses of potential and the technical-economic analysis for a 1 MWh biomethane power plant showed that biomethane production could compete with natural gas on the market at electricity prices of 140 EUR/MWh excl. VAT, at an average cost of feedstock of 21 EUR/MWh excl. VAT, and a natural gas price at the border of 50 EUR/MWh excl. VAT.
  • Although green hydrogen is not currently economically viable, its market potential could increase in the event of an electricity surplus or a negative electricity price. This would increase the availability of an additional fuel, which would be of practical benefit to both market players and the state by broadening the tax base and increasing energy resilience.
  • The end-use of the Lithuanian industrial sector offers significant opportunities for the diversification of gaseous fuels, as natural gas currently accounts for around 50% of the sector’s process energy needs. Industries such as chemicals and chemical products, food, beverages, tobacco, and wood processing have high annual energy intensities of up to 1500 GWh, making them particularly relevant for fuel diversification.

Author Contributions

A.L.: Data curation, Formal analysis, Investigation, Methodology, Writing—original draft. N.S.: Conceptualization, Resources, Supervision, Writing—review & editing. A.J.: Formal analysis, Investigation, Methodology, Writing—original draft, review & editing. All authors have read and agreed to the published version of the manuscript.

Funding

This work has received funding from the European Union’s Horizon Europe research and innovation programme under grant agreement No. 101122257. Views and opinions expressed are, however, those of the authors only and do not necessarily reflect those of the European Union or the European Climate, Infrastructure and Environmental Executive Agency (CINEA). Neither the European Union nor the granting authority can be held responsible for them.

Data Availability Statement

The original contributions presented in the study are included in the article, further inquiries can be directed to the corresponding author.

Conflicts of Interest

The authors declare no conflicts of interest.

References

  1. Copernicus. Available online: https://climate.copernicus.eu/global-climate-highlights-2024 (accessed on 17 February 2025).
  2. Du, M.; Huang, C.; Liao, L. Trade liberalization and energy efficiency: Quasi-natural experiment evidence from the pilot free trade zones in China. Econ. Anal. Policy 2025, 85, 1739–1751. [Google Scholar] [CrossRef]
  3. Padi, R.K.; Douglas, S.; Murphy, F. Techno-economic potentials of integrating decentralised biomethane production systems into existing natural gas grids. Energy 2023, 283, 128542. [Google Scholar] [CrossRef]
  4. Cormos, C.C.; Dragan, M.; Petrescu, L.; Cormos, A.M.; Dragan, S.; Bathori, A.M.; Galusnyak, S.C. Synthetic natural gas (SNG) production by biomass gasification with CO2 capture: Techno-economic and life cycle analysis (LCA). Energy 2024, 312, 133507. [Google Scholar] [CrossRef]
  5. The International Energy Agency. Available online: https://www.iea.org/energy-system/industry (accessed on 14 February 2025).
  6. CEIC Natural Gas Production: OPEC: Marketed Production. Available online: https://www.ceicdata.com/en/countries (accessed on 29 April 2025).
  7. SAF Ukraine (Sustainable Agribusines Forum). Biomethane Production and Use in European Countries: EBA Report; SAF: Kyiv, Ukraine, 2025. [Google Scholar]
  8. Decorte, M.; Tessens, S.; Fernández, D.; Repullo, F.; McCarthy, P.; Oriordan, B.; Maggioni, L.; Pieroni, C.; Protas, M.; Rogulska, M.; et al. Mapping the State of Play of Renewable Gases in Europe. Available online: https://www.regatrace.eu/wp-content/uploads/2020/02/REGATRACE-D6.1.pdf (accessed on 29 April 2025).
  9. Amber Grid. Favourable Conditions for Biomethane Development Leads to Realistic Expectations for Renewable Gas Growth. Available online: https://ambergrid.lt/en/news/favourable-conditions-for-biomethane-development-leads-to-realistic-expectations-for-renewable-gas-growth/1121 (accessed on 29 April 2025).
  10. State Forest Service under the Ministry of Environment of the Republic of Lithuania. Medienos Ruoša; State Forest Service under the Ministry of Environment of the Republic of Lithuania: Vilnius, Lithuania, 2017. [Google Scholar]
  11. Ishaq, H.; Dincer, I.; Crawford, C. A review on hydrogen production and utilization: Challenges and opportunities. Int. J. Hydrogen Energy 2022, 47, 26238–26264. [Google Scholar] [CrossRef]
  12. Gasification: A Sustainable Technology for Circular Economies. Scaling up to Reach Net-Zero by 2050; European Biogas Association: Brussels, Belgium, 2021. [Google Scholar]
  13. Ratib, M.K.; Muttaqi, K.M.; Islam, M.R.; Sutanto, D.; Agalgaonkar, A.P. Large-scale production of green hydrogen from solar energy in Australia: Operation and control of a multi-unit PEM electrolyser system. Int. J. Hydrogen Energy 2025, 98, 873–886. [Google Scholar] [CrossRef]
  14. Dieterich, V.; Hanel, A.; Bastek, S.; Spliethoff, H.; Fendt, S. Entrained flow gasification-based biomass-to-X processes: A techno-economic assessment. Energy Convers. Manag. 2024, 301, 118061. [Google Scholar] [CrossRef]
  15. Jameel, M.K.; Mustafa, M.A.; Ahmed, H.S.; Mohammed, A.J.; Ghazy, H.; Shakir, M.N.; Lawas, A.M.; Mohammed, S.K.; Idan, A.H.; Mahmoud, Z.H.; et al. Biogas: Production, properties, applications, economic and challenges: A review. Results Chem. 2024, 7, 101549. [Google Scholar] [CrossRef]
  16. Lithuanian Energy Agency. Energy Consumption 2025. Available online: https://www.ena.lt/energijos-vartojimas/ (accessed on 3 February 2025).
  17. Ballesteros, M.; Pujol, M.; Walsh, F.; Teubner, J. Geothermal Energy Electricity Generation in Australia: Recent Developments and Future Potential; Australian Geothermal Association: Melbourne, Australia, 2019. [Google Scholar]
  18. National Energy Regulatory Council. Natural Gas Import Prices 2024. Available online: https://www.regula.lt/dujos/Puslapiai/duju-kainos/importo-kainos.aspx (accessed on 30 January 2025).
  19. Statistical Office of the European Union. Statistical Classification of Economic Activities in the European Community NACE 2 ver, 2nd ed.; Office for Official Publications of the European Communities: Luxembourg, 2008. [Google Scholar]
  20. European Union. Statistical Classification of Products by Activity (PRODCOM) 2022. Available online: https://ec.europa.eu/eurostat/statistics-explained/index.php?title=Industrial_production_statistics_introduced_-_PRODCOM (accessed on 14 January 2025).
  21. Government of the Lithuanian Respublic. Economic Activity Classification Rev. 2.1; Government of the Lithuanian Respublic: Vilnius, Lithuania, 2014. [Google Scholar]
  22. Thunman, H.; Gustavsson, C.; Larsson, A.; Gunnarsson, I.; Tengberg, F. Economic assessment of advanced biofuel production via gasification using cost data from the GoBiGas plant. Energy Sci. Eng. 2019, 7, 217–229. [Google Scholar] [CrossRef]
  23. Jovan, D.J.; Dolanc, G. Can green hydrogen production be economically viable under current market conditions. Energies 2020, 13, 6599. [Google Scholar] [CrossRef]
  24. Lithuanian Centre for Social Sciences, Institute of Economics and Rural Development. Biodujų Gamybos Ir Panaudojimo Galimybių, Poreikių Įvertinimo Ir Plėtros Galimybės; Lithuanian Centre for Social Sciences, Institute of Economics and Rural Development: Vilnius, Lithuania, 2018; Available online: https://zum.lrv.lt/uploads/zum/documents/files/LT_versija/Veiklos_sritys/Zemes_ir_maisto_ukis/Bioenergetika/BIodujustudija%202018.pdf (accessed on 30 March 2025).
  25. IRENA. Green Hydrogen Cost Reduction: Scaling up Electrolysers to Mett the 1.5 °C Climate Goal; IRENA: Abu Dhabi, United Arab Emirates, 2020. [Google Scholar]
  26. León, M.; Silva, J.; Ortíz-Soto, R.; Carrasco, S. A Techno-Economic Study for Off-Grid Green Hydrogen Production Plants: The Case of Chile. Energies 2023, 16, 5327. [Google Scholar] [CrossRef]
  27. State Data Agency of the Republic of Lithuania. Environment, Agriculture and Energy in Lithuania 2022. Available online: https://osp.stat.gov.lt/lietuvos-aplinka-zemes-ukis-ir-energetika-2022/energetika/energijos-balansas (accessed on 4 December 2024).
  28. State Data Agency of the Republic of Lithuania. Classification of Economic Activities 2024. Available online: https://osp.stat.gov.lt/600 (accessed on 5 December 2024).
  29. Odyssee-Mure. Energy Consumption Trend by Industrial Branch 2022. Available online: https://www.odyssee-mure.eu/publications/efficiency-by-sector/industry/energy-consumption-trend-industrial-branch-eu.html (accessed on 29 April 2025).
  30. State Forest Service under the Ministry of the Environment of the Republic of Lithuania. Exports and Imports of Wood and Wood Products in 2023–2024. Available online: https://amvmt.lrv.lt/lt/naujienos/medienos-ir-jos-produktu-eksportas-bei-importas-2023-metais/ (accessed on 15 January 2025).
  31. “Baltpool” JSC. Heat auctions: Last Auction Rezults 2025. Available online: https://e.baltpool.eu/heat/?lang=en&ti=2015793 (accessed on 31 March 2025).
  32. Ricardo, R. Power Shift: Decarbonization and the New Dynamics of Energy Markets. Energies 2025, 18, 752. [Google Scholar] [CrossRef]
  33. Liu, T.; Zhang, Y.; Zhang, W.; Hamori, S. Quantile Connectedness of Uncertainty Indices, Carbon Emissions, Energy, and Green Assets: Insights from Extreme Market Conditions. Energies 2024, 17, 5806. [Google Scholar] [CrossRef]
  34. Lithuanian Energy Agency. National Electricity Generation in Lithuania; Lithuanian Energy Agency: Vilnius, Lithuania, 2024. [Google Scholar]
  35. Jonynas, R.; Puida, E.; Poškas, R.; Paukštaitis, L.; Jouhara, H.; Gudzinskas, J.; Miliauskas, J.; Miliauskas, G.; Lukoševičius, V. Renewables for district heating: The case of Lithuania. Energy 2020, 211, 119064. [Google Scholar] [CrossRef]
  36. CIVITTA. Assessment of the Potential and Development Options for the Use of Indigenous Wood Fuel for Heat Production and Preparation of a Proposal; CIVITTA: Vilnius, Lithuania, 2023. [Google Scholar]
  37. Trading Ecomomics. Lithuania Import from Belarus of Fuel Wood, Wood in Chips or Particles, Sawdust, Wood Waste 2022. Available online: https://tradingeconomics.com/lithuania/imports/belarus/fuel-wood-logs-wood-chips (accessed on 9 December 2024).
  38. “Baltpool” JSC. Technical Specifications of Wood Chip Products n.d. Available online: https://www.baltpool.eu/en/biomass-exchange/products/ (accessed on 6 December 2024).
  39. Parliament of the Republic of Lithuania. Amendment of articles 1, 2, 12, 17, 20, 22, 28, 29, 30, 32 of the Heat Management Law No. IX-1565 and Addition of An Annex to the Law 2022. Available online: https://e-seimas.lrs.lt/portal/legalAct/lt/TAD/dd1e8211ac0911ecaf79c2120caf5094 (accessed on 11 December 2024).
  40. Valstybinė miškų tarnyba Medienos Ruoša 2018. Available online: https://amvmt.lrv.lt/uploads/amvmt/documents/files/Statistika/MiskuStatistika/2018/01%20Misku%20ukio%20statistika%202018_m.pdf (accessed on 12 February 2024).
  41. State Forest Service under the Ministry of Environment of the Republic of Lithuania. Harvesting Wood 2019. 2019, pp.129–143. Available online: https://amvmt.lrv.lt/uploads/amvmt/documents/files/Statistika/MiskuStatistika/2019/01%20Misku%20ukio%20statistika%202019_m.pdf (accessed on 12 February 2024).
  42. State Forest Service under the Ministry of Environment of the Republic of Lithuania. Harvesting Wood 2020. 2020. Available online: https://amvmt.lrv.lt/uploads/amvmt/documents/files/Statistika/MiskuStatistika/2020/01%20Misku%20ukio%20statistika%202020_m.pdf (accessed on 15 May 2025).
  43. JSC “Lignineko”. Web Page n.d. Available online: http://www.lignineko.lt/en/products (accessed on 29 January 2024).
  44. Bureuau Veritas. Bureau Veritas Issued the First SURE Certificate in Lithuania 2003. Available online: https://www.bureauveritas.lt/lt/newsroom/bureau-veritas-isdave-pirmaji-sure-sertifikata-lietuvoje (accessed on 27 March 2025).
  45. FlexSNG. “Flexible Production of Synthetic Natural Gas and Biochar via Gasification of Biomass and Waste Feedstocks” n.d. Available online: https://www.skogforsk.se/kunskap/kunskapsbanken/2023/hur-mycket-grot-lamnas-kvar-i-skogen/ (accessed on 20 February 2024).
  46. Bužinskienė, R.; Miceikienė, A. Assessment of Biomass Utilization for Energy Production From Agricultural Residue. Manag. Theory Stud. Rural. Bus. Infrastruct. Dev. 2021, 42, 549–560. [Google Scholar] [CrossRef]
  47. Scarlat, N.; Martinov, M.; Dallemand, J.F. Assessment of the availability of agricultural crop residues in the European Union: Potential and limitations for bioenergy use. Waste Manag. 2010, 30, 1889–1897. [Google Scholar] [CrossRef] [PubMed]
  48. National Energy Regulatory Council. Average National Fuel (Raw Material) Price. Web Page n.d. Available online: https://www.regula.lt/en/Pages/Activities/district-heating-sector.aspx (accessed on 24 January 2024).
  49. Ministry of Energy of the Republic of Lithuania. National Energy Independence Strategy; Ministry of Energy of the Republic of Lithuania: Vilnius, Lithuania, 2024. [Google Scholar]
  50. Kozlovas, P.; Gudzius, S.; Jonaitis, A.; Konstantinaviciute, I.; Bobinaite, V.; Gudziute, S.; Giedraitis, G. Price Cannibalization Effect on Long-Term Electricity Prices and Profitability of Renewables in the Baltic States. Sustainability 2024, 16, 6562. [Google Scholar] [CrossRef]
  51. Williams, J.; Winter, M. Independent Economic Analysis of the Long-Term Liquefied Natural Gas Import Solution to the Republic of Lithuania. Available online: https://www.google.com/url?sa=t&source=web&rct=j&opi=89978449&url=https://enmin.lrv.lt/uploads/enmin/documents/files/Economic_analysis_of_LNG_FINAL.pdf&ved=2ahUKEwiW2_-JqJGNAxXFnf0HHZemC4YQFnoECBgQAQ&usg=AOvVaw0H39uLc7Cr6zt724kbSmTy (accessed on 15 May 2025).
  52. Bai, A.; Balogh, P.; Nagy, A.; Csedő, Z.; Sinóros-Szabó, B.; Pintér, G.; Prajapati, S.K.; Singh, A.; Gabnai, Z. Economic Evaluation of a 1 MWel Capacity Power-to-Biomethane System. Energies 2023, 16, 8009. [Google Scholar] [CrossRef]
  53. Gorre, J.; Ortloff, F.; van Leeuwen, C. Production costs for synthetic methane in 2030 and 2050 of an optimized Power-to-Gas plant with intermediate hydrogen storage. Appl. Energy 2019, 253, 113594. [Google Scholar] [CrossRef]
  54. Wang, X.; Star, A.G.; Ahluwalia, R.K. Performance of Polymer Electrolyte Membrane Water Electrolysis Systems: Configuration, Stack Materials, Turndown and Efficiency. Energies 2023, 16, 4964. [Google Scholar] [CrossRef]
  55. Amber Grid. The Gas Transmission System Operators Are Leading the Development of the Nordic-Baltic Hydrogen Corridor (NBHC); Amber Grid: Vilnius, Lithuania, 2024. [Google Scholar]
Figure 1. Research flowchart.
Energies 18 02670 g001
Figure 2. Typical gasification system [4].
Energies 18 02670 g002
Figure 3. Schematic diagram of the biomethane-production system [3].
Energies 18 02670 g003
Figure 4. Schematic diagram of a green-hydrogen-production system [26].
Energies 18 02670 g004
Figure 5. Final energy consumption in industry [27].
Energies 18 02670 g005
Figure 6. Final fuel consumption in industry [27]: (a) more intensively used fuels and (b) other fuels consumed.
Energies 18 02670 g006
Figure 7. Energy consumption in the chemical and chemical products industry [27]: (a) energy, (b) fuel.
Energies 18 02670 g007
Figure 8. Energy consumption and fuel consumption in the food, beverages and tobacco industry [27]: (a) energy, (b) fuel.
Energies 18 02670 g008
Figure 9. Energy and fuel consumption in the wood and wood-products industry [27]: (a) energy, (b) fuel.
Energies 18 02670 g009
Figure 10. Energy and fuel consumption in the paper and paper products industry [27]: (a) energy, (b) fuel.
Energies 18 02670 g010
Figure 11. Agriculture waste potential [36]: (a) Yields of agricultural cereal waste in Lithuania, 2019; (b) annual straw production and its potential.
Energies 18 02670 g011
Figure 12. Trends in the use of logging residues and changes in importation of wood fuel from Belarus ((a) generation of logging residues and management forestry in Lithuania; (b) importation of wood fuel from Belarus).
Energies 18 02670 g012
Figure 13. Trends in the Biomass Exchange Market ((a) woodchip trading; (b) lignin trading).
Energies 18 02670 g013
Figure 14. The technical potential of logging residues, including branches and lignin, in Lithuania.
Energies 18 02670 g014
Figure 15. Price dynamics of wood-pellet production, woodchip products and lignin mix in Baltpool [38].
Energies 18 02670 g015
Figure 16. Price dynamics for wood pellets, woodchip products, and lignin blends in the commodities market (a) summer and (b) winter.
Energies 18 02670 g016
Figure 17. Synthetic natural gas-production costs and cumulative profit at an electricity price of 140 EUR/MWh and different natural-gas prices at the border: (a) 25 EUR/MWh, (b) 50 EUR/MWh, (c) 100 EUR/MWh.
Energies 18 02670 g017
Figure 18. Biomethane production costs and cumulative profit at electricity price 140 EUR/MWh and different natural gas prices at the border: (a) 25 EUR/MWh, (b) 50 EUR/MWh, (c) 100 EUR/MWh.
Energies 18 02670 g018
Figure 19. Hydrogen-production costs and cumulative profit: (a) at electricity price of 50 EUR/MWh (b) at electricity price of 0 EUR/MWh, (c) at electricity price of −26 EUR/MWh.
Energies 18 02670 g019
Figure 20. Dependence of the cost of production output on (a) feedstock price and (b) discount rate.
Energies 18 02670 g020
Table 1. Comparative overview of the production and consumption (PJ) of natural gas, synthetic natural gas, biomethane, and green hydrogen (2018–2023) [5,6,7,8,9,10,11,12]. N/A—data not available.
Gaseous FuelYear/TrendFinlandGermanyItalyLithuaniaPoland
ProductionConsumptionProductionConsumptionProductionConsumptionProductionConsumptionProductionConsumption
Natural gas
(NG)
2018090.921330791962492074.3201675
2023059.214526611082112052.2132660
Trend0%−35%−32%−14%−45%−15%0%−30%−34%−2%
Syn. natural gas
(SNG)
2018There are insufficient data available. SNG production via gasification is technically ready for large-scale deployment, but its progress is hindered by competition with prices for natural gas.
2023
Trend
Biomethane
(Bio-CH4)
20180.430.4336.136.13.13.10000
20233.33.33603601191190.170.1722.722.7
Trend+667%+667%+897%+897%+3739%+3739%N/AN/AN/AN/A
Green Hydrogen (H2)2018There are insufficient data available. Industrial-scale green hydrogen production is still under development and in the early stages of scale-up.
2023
Trend
Table 2. Data for CAPEX calculation.
Investment of Plant SubsystemCAPEX, EUR
Air separation unit870,780
Fuel-handling systems680,249
Gasification and combustion294,991
Primary gas-production cleaning237,874
Flue gas system140,340
Tar adsorption106,233
Acid gas removal1,099,682
SNG production unit137,478
Carbon-process unit20,515
Sulphur removal unit74,687
Power unit71,777
Table 3. SNG key economic assumptions.
Cost of Plant SubsystemOPEX
Discount rate5%
Lifetime of the investment25 years
Annual production time7884 h/year
Boiler-fed chemical water treatment cost190 EUR/month (1 MWthoutput)
Gasifier block maintenance cost0.059 kWh/kWhprod
Cost of catalysts (WGS and SNG reactors)3000 EUR/y (1 MWthoutput)
Cost of biomass24 EUR/MWh2025
Ash disposal cost109 EUR/t
Staff requirements for the operation of a 1 MW installation5
Average salary of an employee 1150 EUR/moth
Administrative costs, defined as direct labour percentage30%
Maintenance costs, defined as CAPEX percentage3.25%
Assumption of rising electricity prices1%
Assumption of rising natural gas prices2%
Table 4. Data for economic calculations.
Plant SubsystemCAPEX, EUR
Biogas power plant1,126,086
Biomethane-production facilities716,957
Cogeneration unit for own use, 600 kW414,400
Measurements (volume, quality, humidity)286,266
Biomethane-compression equipment225,000
Two pressure vessels (16 bar and 200 Nm3)212,000
Plant subsystemOPEX, EUR
OPEX biogas plants11,261
OPEX cogeneration power plants57,913
OPEX for biomethane production2434
OPEX for biomethane compression16,000
Table 5. Biomethane key economic specification.
Assumptions for Economic Analysis
Discount Rate5%
Lifetime of the investment25 years
Annual production time7884 h/year
Cost of biomass24 EUR/MWh
Biogas performance235 Nm3/h
Cogeneration power plant600 kW
Biomethane Production Equipment
Biomethane production104 Nm3/h
Methane concentration>97%
Biomethane pressure16 bars
Biomethane Production and Compression Equipment
Biomethane production100 Nm3/h
Methane concentration>97%
Biomethane pressure250 bars
Staff requirements for the operation of a 1 MW installation3
Average salary of an employee36,000 EUR/year
Maintenance costs, defined as CAPEX percentage4.15%
Assumption of rising electricity prices1%
Assumption of rising natural gas prices2%
Table 6. CAPEX data for economic calculations.
Hydrogen-Production SystemsCAPEX, EUR
Project documentation100,000
Electrolyser1,600,000
High-pressure storage200,000
BoP components120,000
Connection to electricity networks100,000
Construction and assembly work80,000
Table 7. CAPEX data for economic calculations [23].
Plant SubsystemOPEX, EUR
H2O price in Lithuania0.0020 EUR/kg
O&M costs for the electrolyser (% of CAPEX)5%
O&M costs of H2 storage (% of CAPEX)1.50%
Installation & design costs (% of CAPEX)30%
Table 8. Key economic specifications [23].
Discount Rate5%
Lifetime of the investment25 years
Annual production time7884 h/year
Net production rate, up to 300Nm3 H2/h
Production capacity, dynamic range15–100%of flow range
Power consumption at stack3.8–4.4kWh/Nm3 of H2
Delivery pressure30 to 200 bars
Price of stack of 1 MW444,000EUR/10 year
Lower heating value (LHV)37.00kWh/kg
Power consumption for H2 production48.95kWh/kg
Water needed (kg water/kg H2)17,90kg H2O/kg H2
Density of water997kg/m3
Lower heating value (LHV)37.00kWh/kg
Power consumption for H2 production48.95kWh/kg
Table 9. Total accumulated wood-fuel potential based on accumulated stem volume in million m3 [36].
White AldersBiscuitsLogging ResiduesFirewoodFine Creature WoodStumps and Roots
201118.418.978.347.960.991.4
201218.720.180.249.062.493.6
201318.321.182.150.263.995.8
201419.121.683.451.064.997.4
201519.321.384.951.966.099.1
201620.021.586.152.666.9100.4
201720.921.487.153.367.8101.7
201820.720.888.253.968.6102.9
201922.220.989.954.969.8104.7
202021.921.691.255.770.9106.3
±1.4±0.8±4.2±2.5±3.2±4.8
Table 10. Technical specifications for woodchip production [38].
CodsSM1SM1WSM2SM3DSM3SM4
Moisture (min–max), % of the usable mass20–45%35–55%35–55%35–55%35–60%35–60%
Ash yield, % of dry matterNo more than 2%No more than 2%No more than 3%No more than 5%No more than 5%No more than 7%
Size of fraction (length–weight–thickness), mm.3.15 ≤ P ≤ 63 (min. 80%)3.15 ≤ P ≤ 63 (min. 80%)3.15 ≤ P ≤ 63 (min. 70%)3.15 ≤ P ≤ 63 (min. 60%)3.15 ≤ P ≤ 63 (min. 60%)3.15 ≤ P ≤ 63 (min. 60%)
Part of the fine fraction in biofuelNo more than 2%No more than 5%No more than 10%No more than 20%No more than 25%No more than 30%
Chlorine content (% of dray matter)<0.02%<0.02%<0.02%<0.02%<0.03%<0.03%
Predominant primary raw materialStemwoodStem wood and wood industry residues.Whole trees (without roots)Short-rotation coppice and stored logging residuesFresh logging residuesFresh logging residues
Allowable impuritiesDry leaves. dry thornsDray leaves, dry thornsLeaves, thorns (dray and not dry) and barkLeaves, thorns (dray and not dry) and bark
Table 11. Land area used by agricultural producers [27].
Utilised Agricultural Area, Hectares20182019202020212022
Agricultural land in use, total2,947,2342,974,9942,942,7772,937,4702,911,297
Arable land2,115,4852,211,9312,249,3502,279,0522,292,471
Pastures and meadows795,932728,014657,978622,598582,973
Gardens and berry gardens30,36429,47529,52229,55329,672
Table 12. Quantity and energy potential of straw left in fields.
Unused Straw20152016201720182019202020212022
Straw of wheatThousand tons1533134613719941345168714871569
Straw of triticaleThousand tons197139104641461848786
Straw of ryeThousand tons5641332357583337
Straw of barleyThousand tons284191182217206247175183
Straw of rapeseed cropsThousand tons359280380303482677633627
TotalThousand tons24291996207016012236285224152502
Untapped straw potentialGWh10,89789729297715610,02712,78510,82611,220
Table 13. Potential cost savings and higher corporate tax deductions from fuel diversification for a relative 1 MWoutput of production.
Diversification SavingsIncome Tax Revenue
Lower-Carbon Substitute Natural GasSNGCH4SNGCH4
Unitsk EURk EURk EURk EUR
20250000
20260000
20270000
20280169025
2029018250274
2030038620579
2031062970945
20320914901372
2033012,43501865
2034016,17402426
2035120,38503058
2036125,08703763
2037230,29904545
2038336,04105406
2039342,33506350
2040449,20017380
2041456,65818499
2042564,73119710
2043673,440111,016
2044682,809112,421
2045792,859113,929
20468103,615115,542
20479115,101117,265
20489127,341119,101
204910140,359221,054
Disclaimer/Publisher’s Note: The statements, opinions and data contained in all publications are solely those of the individual author(s) and contributor(s) and not of MDPI and/or the editor(s). MDPI and/or the editor(s) disclaim responsibility for any injury to people or property resulting from any ideas, methods, instructions or products referred to in the content.

