
Investigation on Pressure Drop Characteristics During Refrigerants Condensation Inside Internally Threaded Tubes


Abstract
1. Introduction
2. Methods
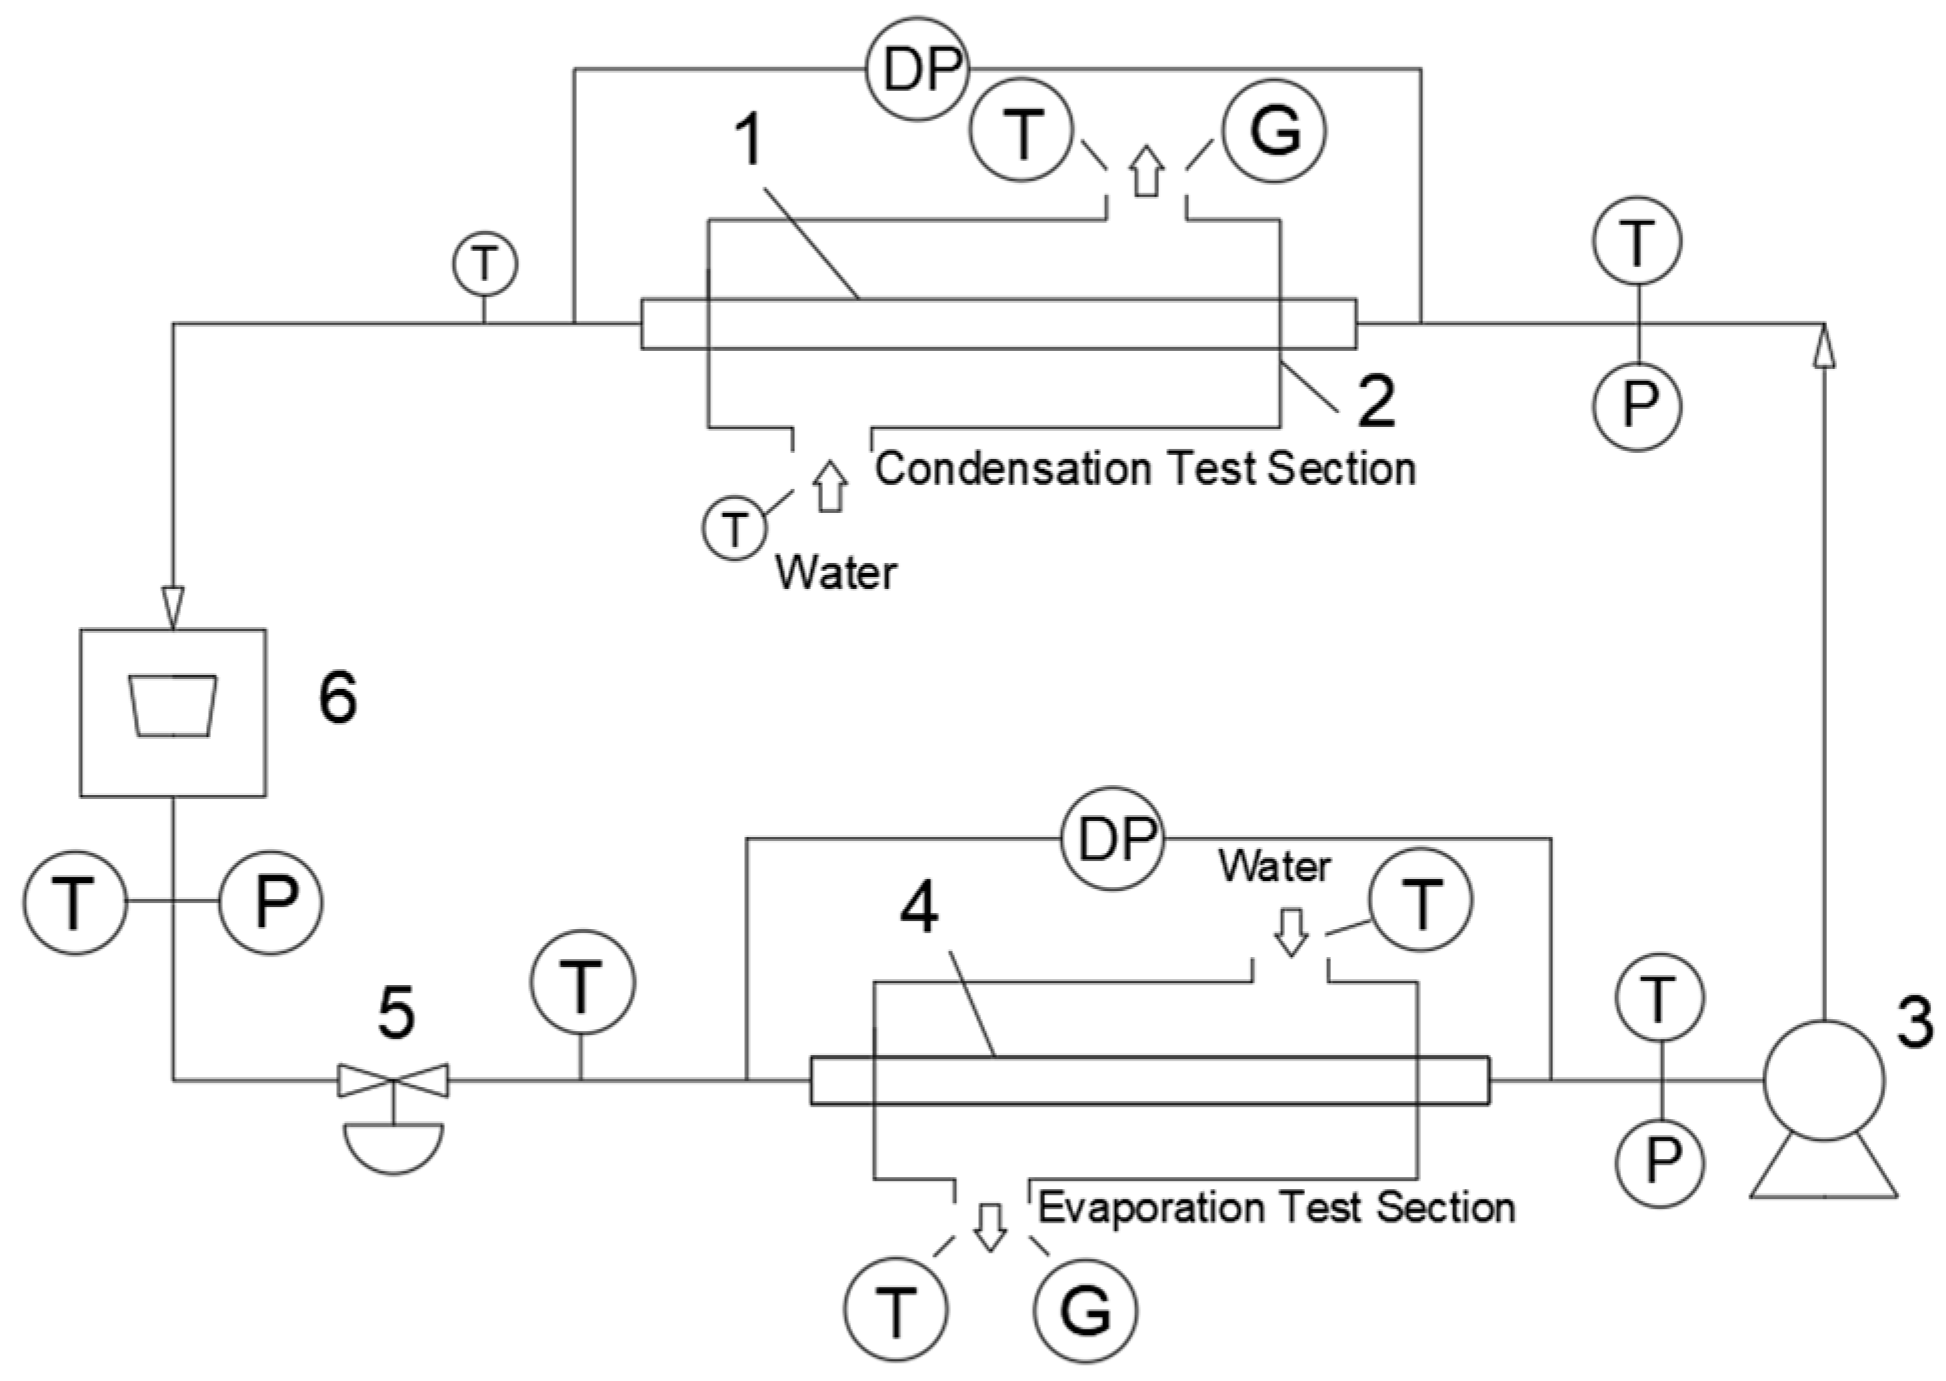
2.1. Experimental Setup for Internally Threaded Tubes
- Install the test specimen with pressure transducers mounted at both ends to measure pressure differentials.
- Regulate compressor frequency through a variable-frequency drive and adjust refrigerant flow rate using an electronic expansion valve, while monitoring flow parameters with high-precision flow meters to ensure system stability.
- Establish predetermined test conditions through the aforementioned control mechanisms. Maintain steady-state operation for sufficient duration before recording measurements. Collect at least five data points per test group and compute arithmetic means.
- Modify operational parameters (flow rates or temperatures) to conduct repetitive experiments across the target research range.
- Terminate testing by deactivating heating elements and water pumps, discontinue data acquisition, and evacuate residual refrigerant from the system.
2.2. Experimental Measurement Device
2.2.1. Thermometric Instruments
2.2.2. Pressure and Differential Pressure Measuring Instrument
2.2.3. Flow Measurement Instrument
2.2.4. Error Analysis
- (1)
- Analysis of temperature error
- (2)
- Analysis of pressure errors
- (3)
- Analysis of flow error
- (4)
- Error analysis of the friction factor
2.3. Main Experimental Parameters
2.4. Data Processing
3. Experimental Results and Analysis
3.1. Resistance Characteristics of Internally Threaded Tubes
3.1.1. Pressure Drop Comparison Between R22 and R410A
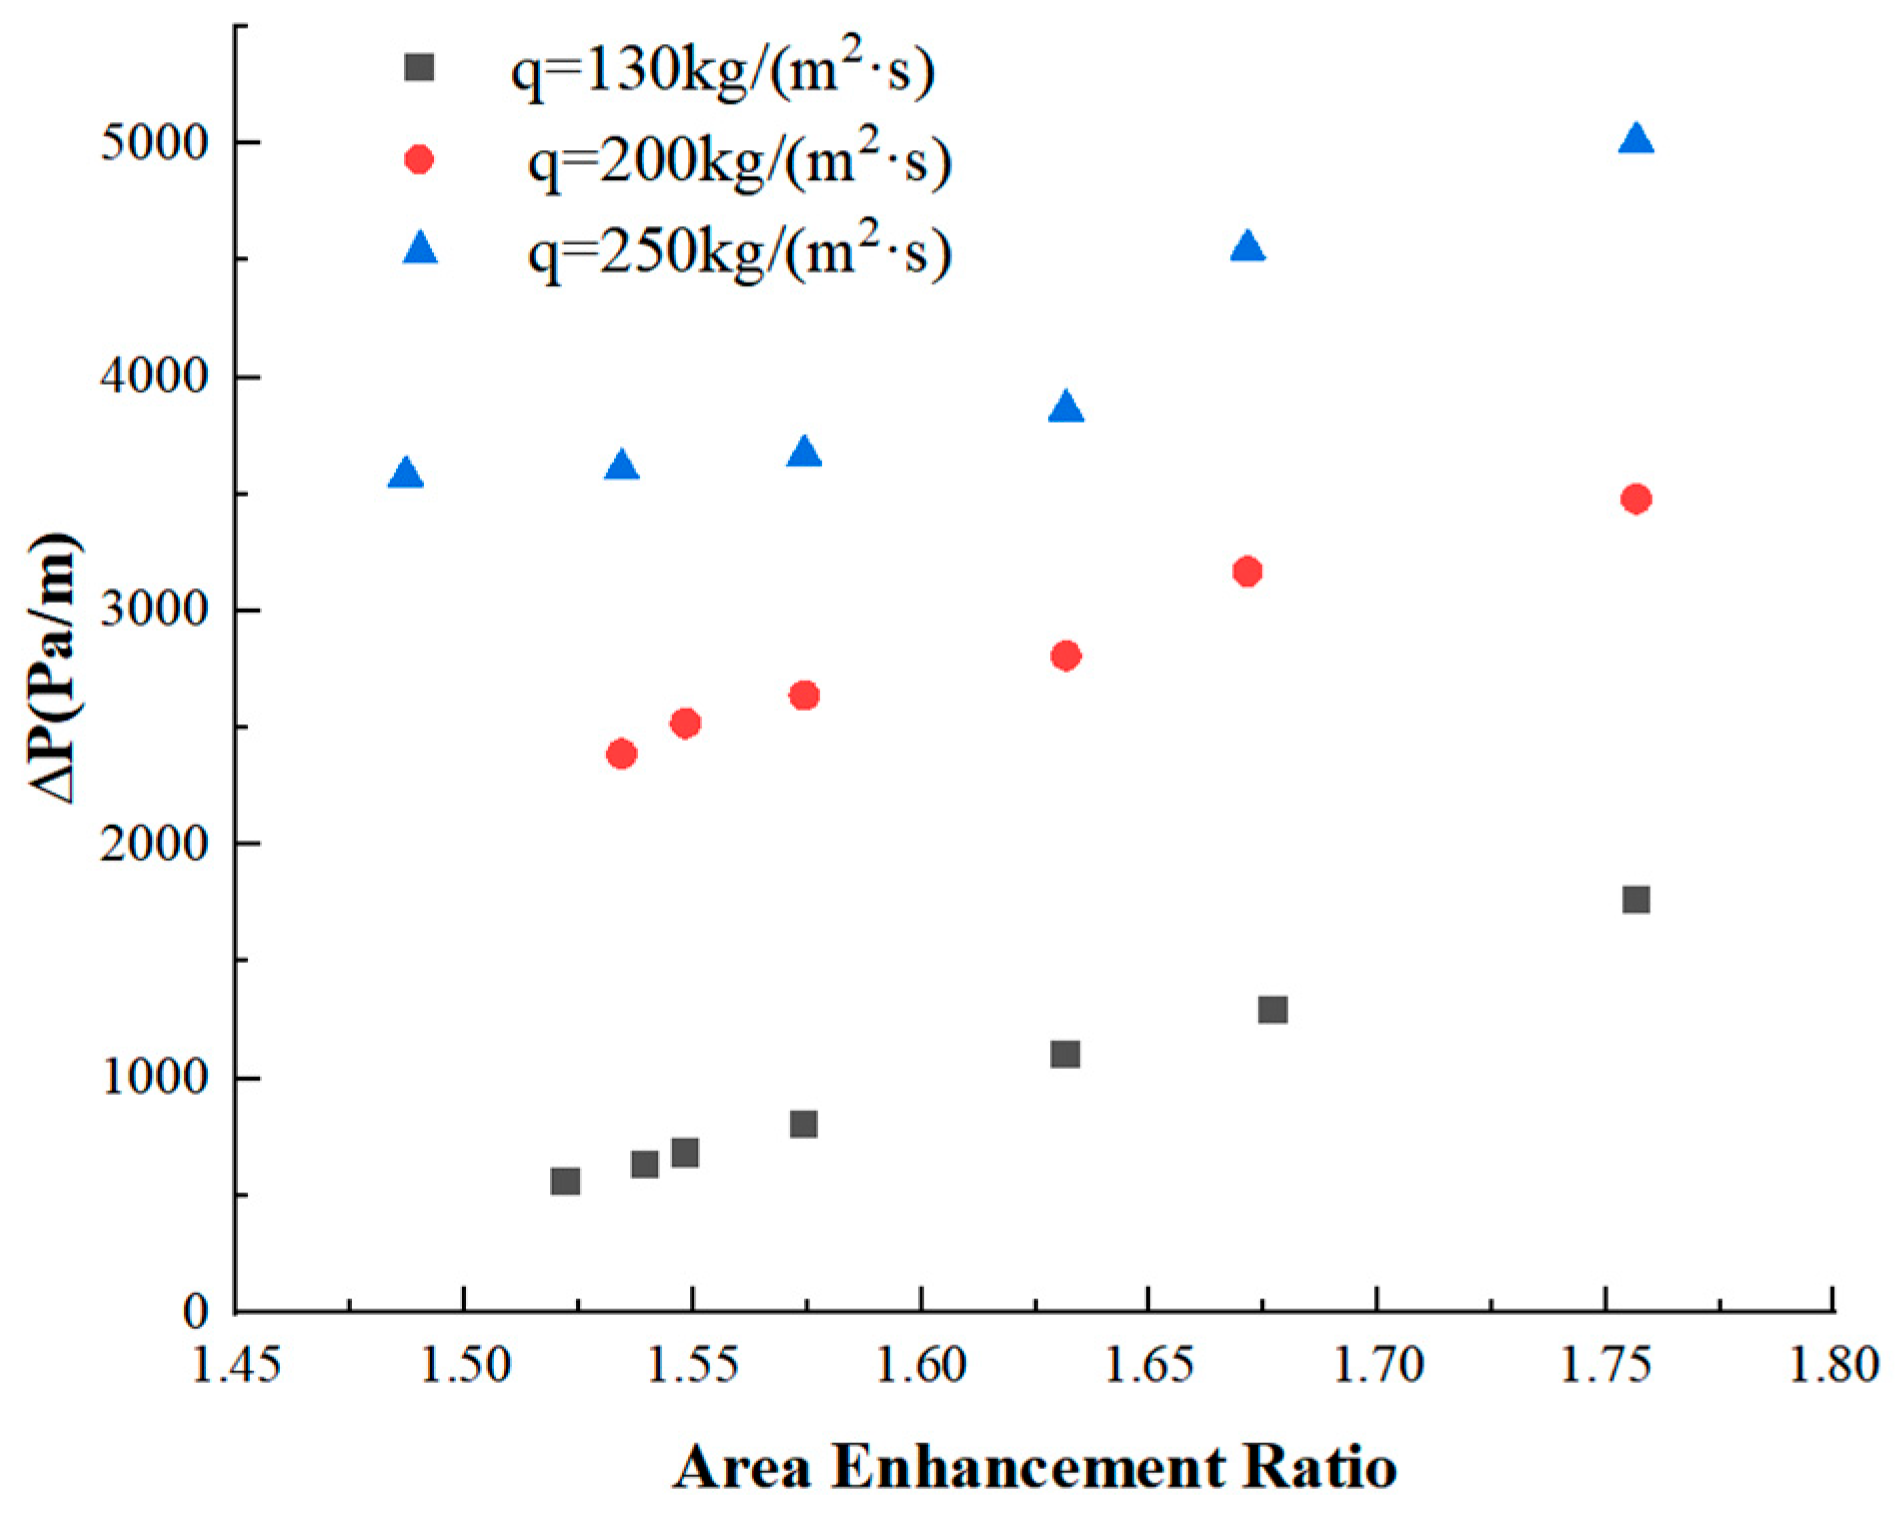
3.1.2. Relationship Between Area Enhancement Ratio and Pressure Drop
3.2. Study on Resistance Coefficient Correlations
3.2.1. Resistance Coefficient Model
3.2.2. Optimization Based on Webb Model
3.2.3. Parameter-Coupled Model Integrating Ravigururajan Approach
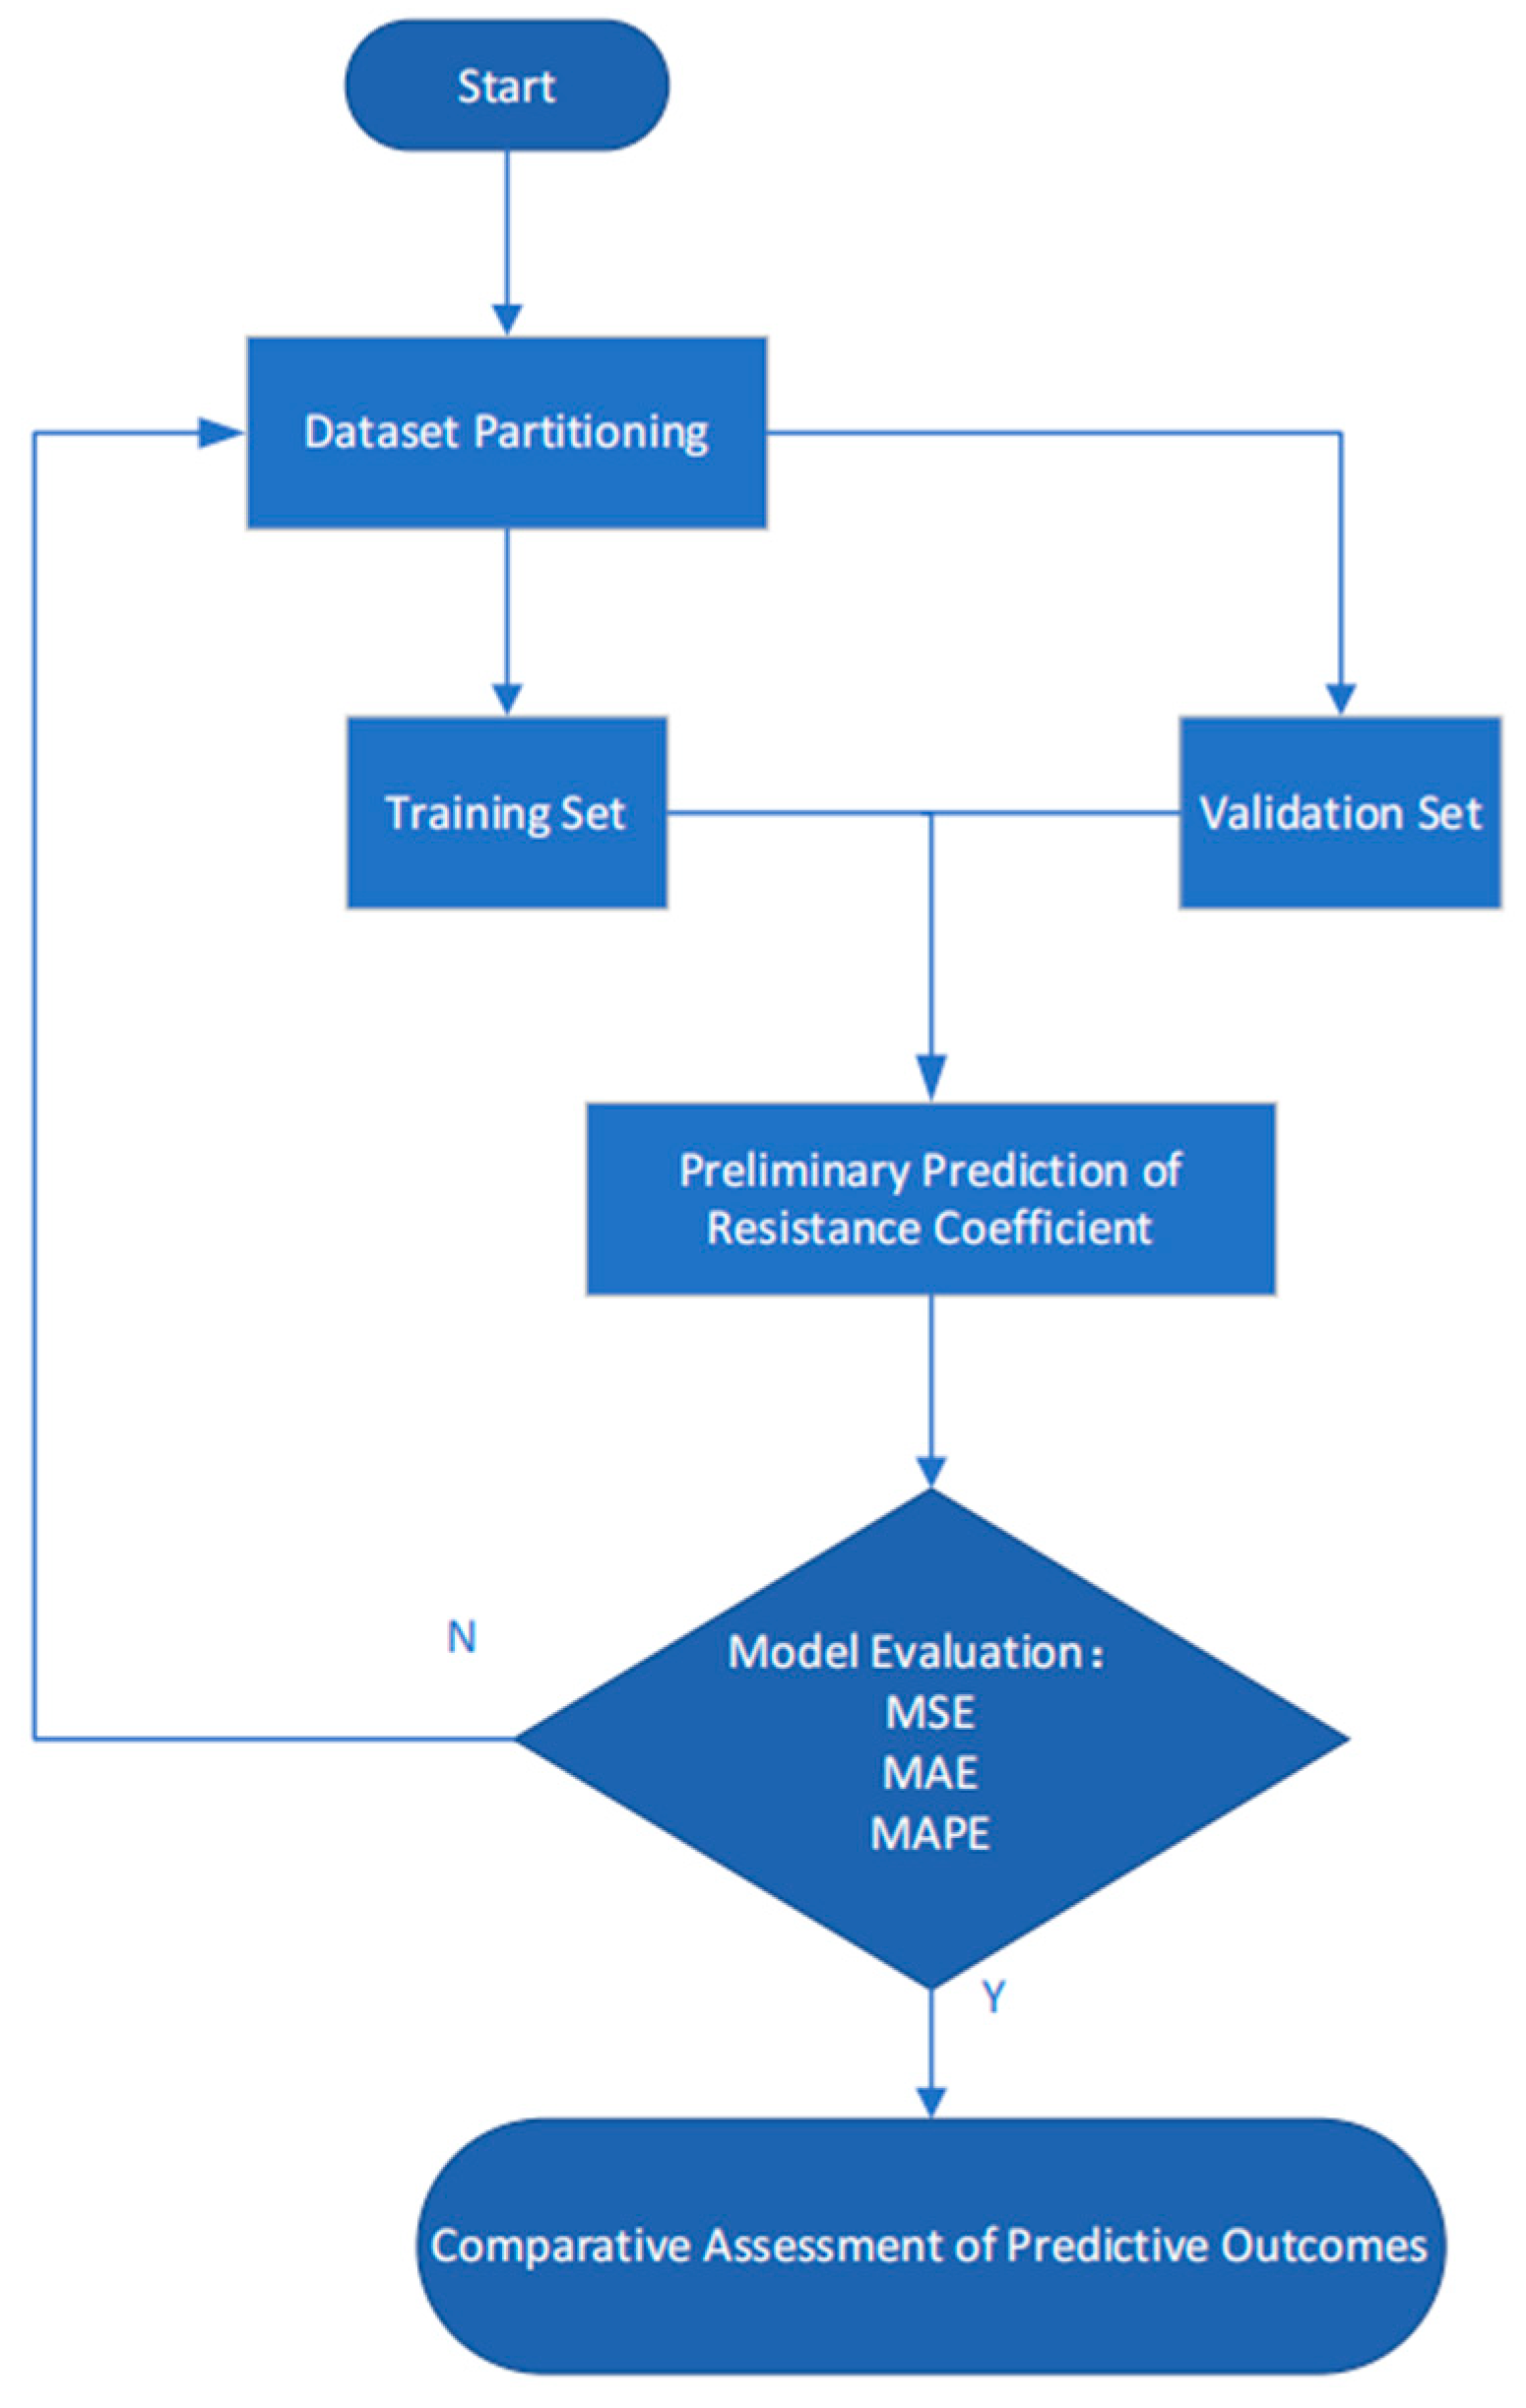
3.3. Prediction and Validation of the SVR Model
4. Conclusions
- R410A demonstrates comparable thermophysical properties to R22 while exhibiting superior operational characteristics as an alternative refrigerant. Under the investigated conditions, R410A generated lower pressure drops compared to R22. This phenomenon is attributed to the greater vapor–liquid density disparity in R22, which amplifies velocity differences between phases, enhances axial shear forces, intensifies interfacial friction, and consequently elevates flow disturbance and energy dissipation.
- For R410A flow, the pressure drop in internally threaded tubes increases proportionally with the area enhancement ratio. A linear correlation between area enhancement ratio and pressure drop was observed at mass velocity below 200 kg/(m2·s), with the slope of this relationship diminishing as flow velocity increases. However, pronounced nonlinear fluctuations emerge at higher velocities, rendering linear regression inadequate. Tubes with higher area enhancement ratios exhibit stronger flow resistance, particularly under elevated mass velocity conditions. This results in intensified flow turbulence enhanced interfacial and wall friction, and consequently increased frictional losses.
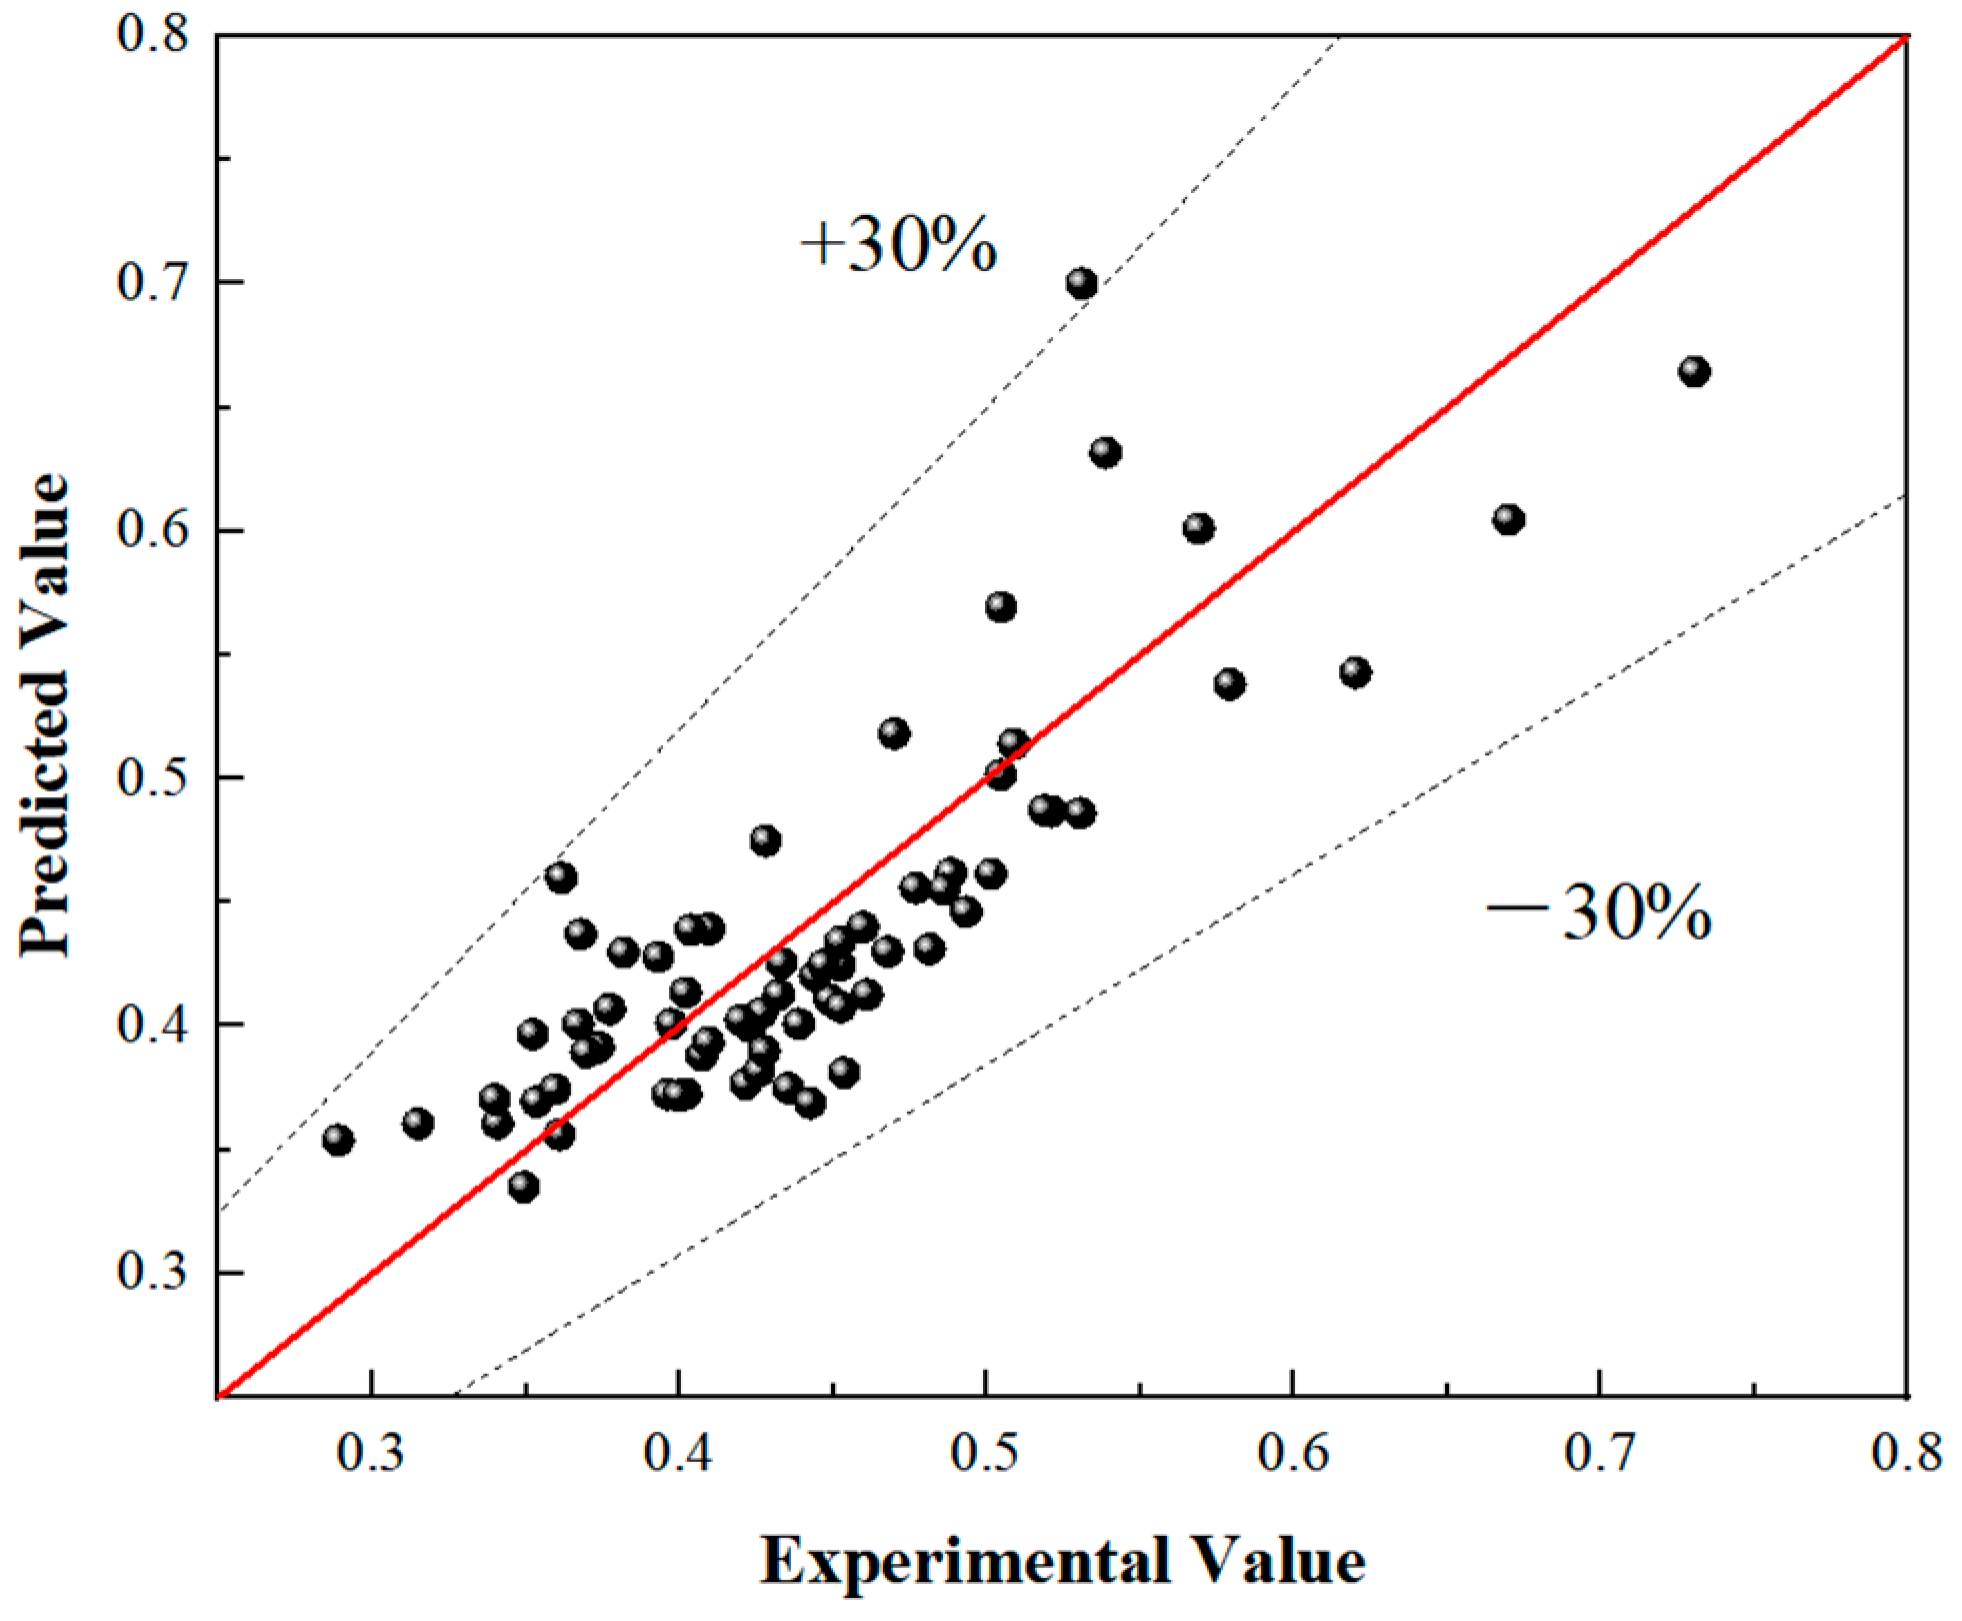
- Two friction factor prediction models were developed based on the Webb and Ravigururajan correlations. Model, I (Webb-based) demonstrated a mean absolute percentage error of 8.21%, with maximum and minimum prediction errors of 31.08% and 0.62%, respectively. Model II (Ravigururajan-based) showed improved performance with a mean absolute percentage error of 7.08%, maximum error of 27.66%, minimum error of 0.76%, and reduced standard deviation from 0.0619 to 0.0362. The enhanced predictive accuracy of Model II satisfies engineering application requirements.
- Implementation of an SVR model enabled effective outlier removal and rapid determination of resistance coefficient ranges when combined with empirical correlations. This hybrid strategy addresses data scarcity issues in high-cost experimental scenarios by integrating physical characteristics with domain knowledge, while simultaneously improving selection efficiency in industrial applications. The methodology demonstrates broad applicability to various experimental configurations requiring substantial resource investment.
5. Future Works
- The selected industrially prevalent internally threaded tubes in this study could potentially accommodate expanded geometric parameter ranges (e.g., rib numbers of 50–70). The coupled effects of low rib counts with other parameters on flow resistance merit further investigation.
- The coupled interactions among geometric parameters of internally threaded tubes present inherent complexity. While the developed friction factor correlation in this work partially integrates parametric interdependencies, its extrapolation beyond experimental conditions requires empirical validation through extensive datasets to progressively refine the coupled relationships, thereby enhancing coupling coherence and predictive accuracy. Furthermore, implementing functional transformations (e.g., logarithmic scaling, power-law modifications) to the correlation architecture could optimize parametric coupling effects. This demands that investigators possess sophisticated analytical capabilities to discern critical hydrodynamic mechanisms governing friction factor evolution.
Author Contributions
Funding
Data Availability Statement
Conflicts of Interest
Symbols
| De | Outer diameter (m) |
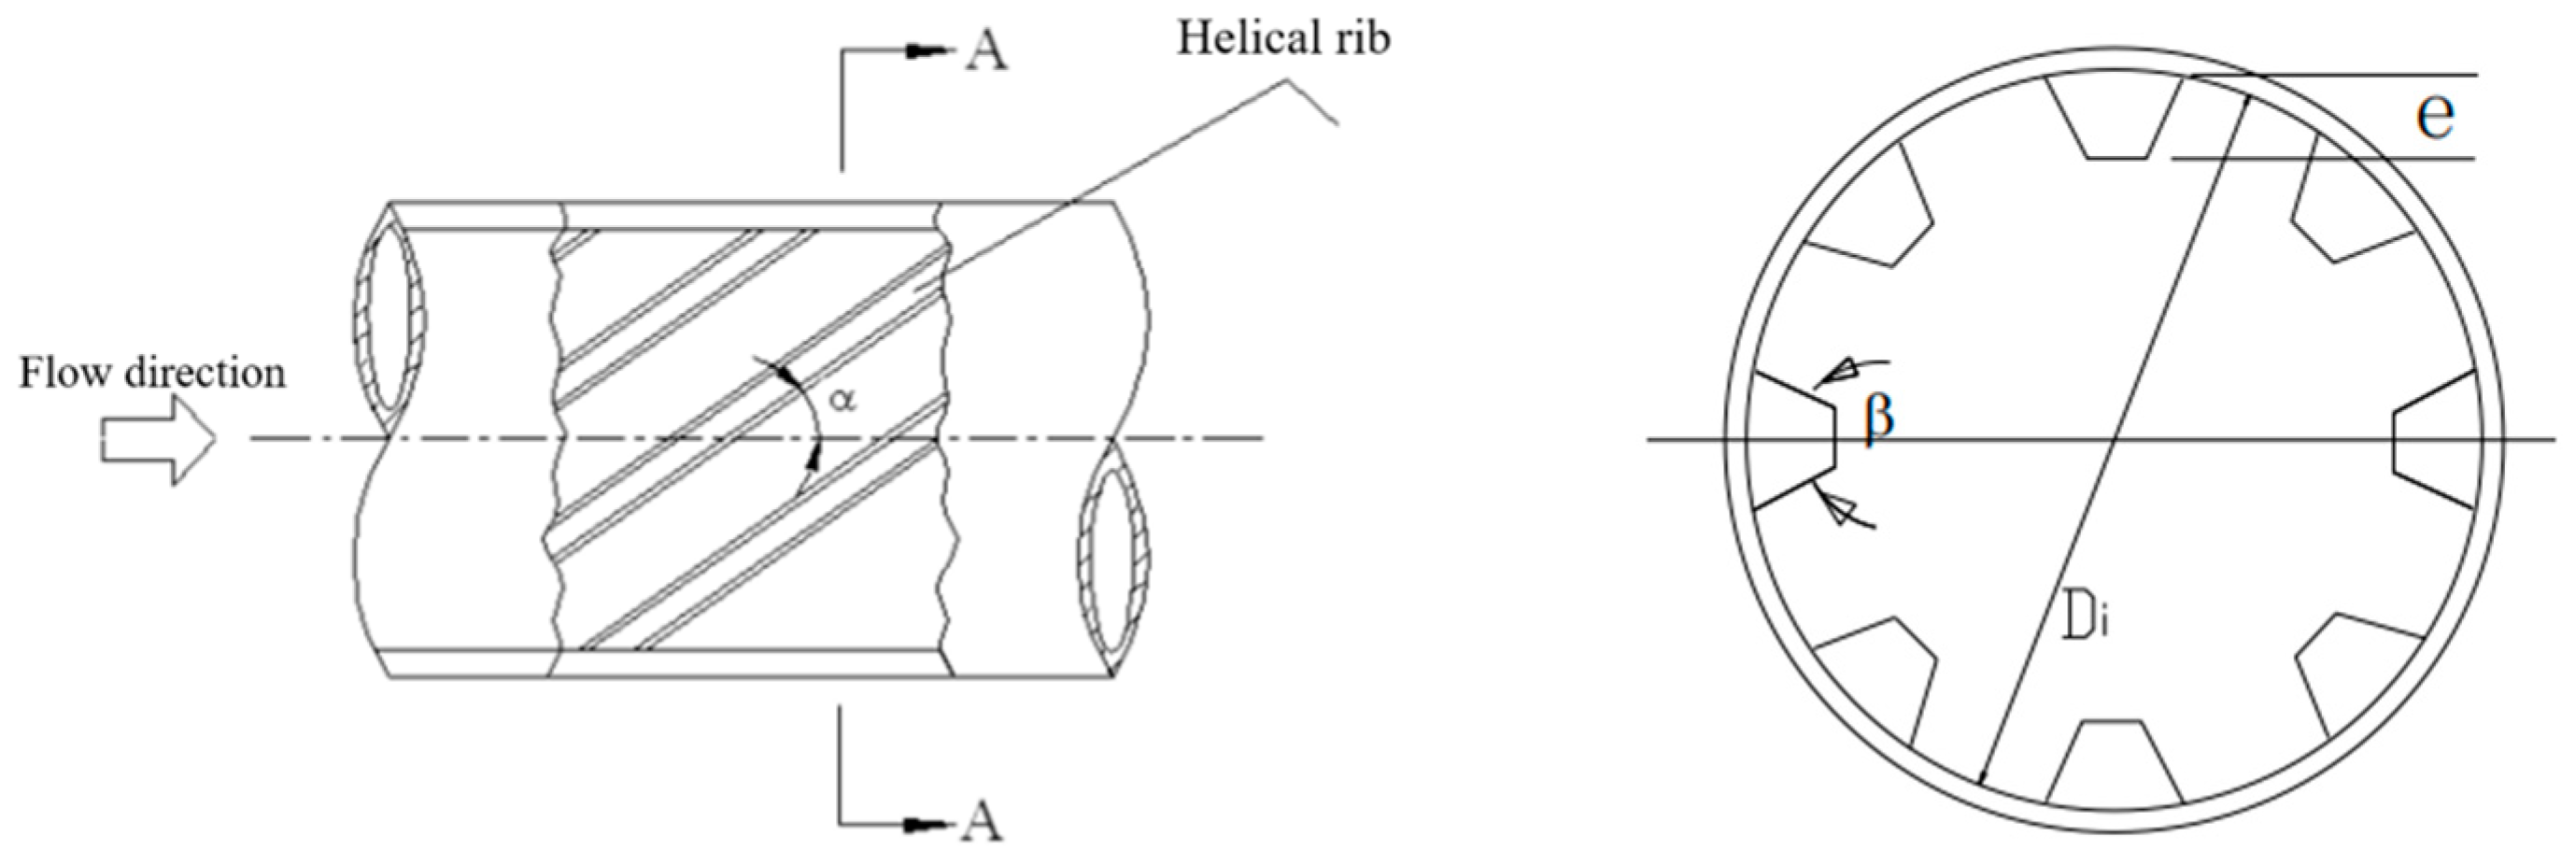
| e | Thread height (m) |
| α | Helix angle |
| β | Crest angle |
| Ns | Number of ribs |
| Re | Reynolds number |
| Aai | Actual heat exchange area inside the tube (m2) |
| Afr | Area based on the root diameter of the teeth (m2) |
| Pf | Tooth spacing perpendicular to the tooth direction (m) |
| fs | Friction coefficient of smooth tube |
| fa | Friction coefficient of enhanced tube |
| p | Pitch (m) |
References
- Khafaji, H.Q.A.; Abdul Wahhab, H.A.; Alsaedi, S.S.; Al-Maliki, W.A.K.; Alobaid, F.; Epple, B. Thermal Performance Evaluation of a Tubular Heat Exchanger Fitted with Combined Basket–Twisted Tape Inserts. Thermochem. Convers. Process. Solid Fuels Renew. Energ. 2022, 12, 4807. [Google Scholar] [CrossRef]
- Lawson, R.; Webb, J.D. Measurement analysis and interpretation of noise in the working fluids of power plants. Arch. Proc. Inst. Mech. Eng. 1966, 181, 26–35. [Google Scholar] [CrossRef]
- Champagne, P.R.; Bergles, A.E. A Novel, Variable-Roughness Technique to Enhance, on Demand, Heat Transfer in a Single-Phase Heat Exchanger. In Proceedings of the International Heat Transfer Conference 11, Kyongju, Republic of Korea, 23–28 August 1998. [Google Scholar]
- El-Sebaey, M.S.; El-Din, S.S.; El-Kholy, M.K. Heat transfer and fluid flow performance of an internally longitudinal finned tube: Numerical study and experimental validation. Int. J. Therm. Sci. 2024, 201, 109025. [Google Scholar] [CrossRef]
- Wu, J.; Xu, F.; Zhang, L.; Xi, Y.; Liu, Y.; Zhang, X.; Zhou, C.; Zhao, Y. Turbulent flow and heat transfer in a new type of internally torsion-ribbed helical tube. Chem. Eng. Process.-Process Intensif. 2024, 200, 109784. [Google Scholar] [CrossRef]
- Su, Y.; Li, X.; Wu, X. Frictional pressure drop correlation of steam-water two-phase flow in helically coiled tubes. Ann. Nucl. Energy 2024, 208, 110764. [Google Scholar] [CrossRef]
- Naphon, P.; Nuchjapo, M.; Kurujareon, J. Tube side heat transfer coefficient and friction factor characteristics of horizontal tubes with helical rib. Energy Convers. Manag. 2006, 47, 3031–3044. [Google Scholar] [CrossRef]
- Liu, X.; Jensen, M.K. Geometry Effects on Turbulent Flow and Heat Transfer in Internally Finned Tubes. J. Heat Transf. 2001, 123, 1035–1044. [Google Scholar] [CrossRef]
- Kim, J.-H.; Jansen, K.E.; Jensen, M.K. Analysis of heat transfer characteristics in internally finned tubes. Numer. Heat Transf. Part A Appl. 2004, 46, 1–21. [Google Scholar] [CrossRef]
- Sethumadhavan, R.; Raja Rao, M. Turbulent Flow Friction and Heat Transfer Characteristics of Single- and Multistart Spirally Enhanced Tubes. J. Heat Transf. 1986, 108, 55–61. [Google Scholar] [CrossRef]
- Di Piazza, I.; Ciofalo, M. Numerical prediction of turbulent flow and heat transfer in helically coiled pipes. Int. J. Therm. Sci. 2010, 49, 653–663. [Google Scholar] [CrossRef]
- Li, W.; Fu, P.; Li, H.; Li, G.; Thors, P. Numerical–Theoretical Analysis of Heat Transfer, Pressure Drop, and Fouling in Internal Helically Ribbed Tubes of Different Geometries. Heat Transf. Eng. 2016, 37, 279–289. [Google Scholar] [CrossRef]
- Mogaji, T.S.; Olapojoye, A.O.; Idowu, E.T.; Saleh, B. CFD study of heat transfer augmentation and fluid flow characteristics of turbulent flow inside helically grooved tubes. J. Braz. Soc. Mech. Sci. Eng. 2022, 44, 90. [Google Scholar] [CrossRef]
- Li, Y.; Chang, J.; Kong, C.; Bao, W. Recent progress of machine learning in flow modeling and active flow control. Chin. J. Aeronaut. 2022, 35, 14–44. [Google Scholar] [CrossRef]
- Webb, R.L.; Narayanamurthy, R.; Thors, P. Heat Transfer and Friction Characteristics of Internal Helical-Rib Roughness. J. Heat Transf. 1999, 122, 134–142. [Google Scholar] [CrossRef]
- Ravigururajan, T.S.; Bergles, A.E. Development and verification of general correlations for pressure drop and heat transfer in single-phase turbulent flow in enhanced tubes. Exp. Therm. Fluid Sci. 1996, 13, 55–70. [Google Scholar] [CrossRef]
- Cavallini, A.; Censi, G.; Del Col, D.; Doretti, L.; Longo, G.A.; Rossetto, L. Condensation of Halogenated Refrigerants Inside Smooth Tubes. HVACR Res. 2002, 8, 429–451. [Google Scholar] [CrossRef]
- Gnielinski, V. New Equations for Heat and Mass Transfer in Turbulent Pipe and Channel Flow. Int. Chem. Eng. 1976, 16, 359–368. [Google Scholar]
- Hughes, J.D.; Dewitt, D.P.; Bergman, T.L.; Lavine, A.S. Fundamentals of Heat and Mass Transfer. Staff. Gen. Res. Pap. 2007, 27, 139–162. [Google Scholar]
- Ji, W.-T.; Zhang, D.-C.; He, Y.-L.; Tao, W.-Q. Prediction of fully developed turbulent heat transfer of internal helically ribbed tubes—An extension of Gnielinski equation. Int. J. Heat Mass Transf. 2012, 55, 1375–1384. [Google Scholar] [CrossRef]
- De Chazal, L.E.M. Analysis of heat and mass transfer, E.R.G. Eckert and R.M. Drake, Jr., McGraw-Hill, New York (1972). 806 pages. $21.50. AIChE J. 1972, 18, 670. [Google Scholar] [CrossRef]
- Petukhov, B.S. Heat Transfer and Friction in Turbulent Pipe Flow with Variable Physical Properties. In Advances in Heat Transfer; Hartnett, J.P., Irvine, T.F., Eds.; Elsevier: Amsterdam, The Netherlands, 1970; pp. 503–564. [Google Scholar]
- Mori, Y.; Nakayama, W. Forced convective heat transfer in a straight pipe rotating around a parallel axis: (1st report, laminar regionit). Int. J. Heat Mass Transf. 1967, 10, 1179–1194. [Google Scholar] [CrossRef]
- Mori, Y.; Nakayama, W. Study of forced convective heat transfer in curved pipes (2nd report, turbulent region). Int. J. Heat Mass Transf. 1967, 10, 37–59. [Google Scholar] [CrossRef]
- Lee, S.C.; Nam, S.C.; Ban, T.G. Performance of heat transfer and pressure drop in a spirally indented tube. KSME Int. J. 1998, 12, 917–925. [Google Scholar] [CrossRef]
- Harleß, A.; Franz, E.; Breuer, M. Experimental investigation of heat transfer and friction characteristic of fully developed gas flow in single-start and three-start corrugated tubes. Int. J. Heat Mass Transf. 2016, 103, 538–547. [Google Scholar] [CrossRef]
- Webb, R.L.; Kim, N.H. Principles of Enhanced Heat Transfer; Garland Science: New York, NY, USA, 2004. [Google Scholar]
- Xiong, B.; Zhao, X.; Hu, Y.; Huang, H.; Liu, Y.; Su, Y. Machine learning assisted empirical formula augmentation. Mater. Des. 2021, 210, 110037. [Google Scholar] [CrossRef]


| Measuring Instrument | Accuracy Level | Instrument Range |
|---|---|---|
| Thermometer | ±0.10 °C | −20–150 °C |
| Volume flowmeter | ±0.20% | 0–10 L/min |
| Mass flowmeter | ±0.5% | 0–100 kg/h |
| Absolute pressure transmitter | ±0.04% | 0–4 MPa |
| Pressure differential transmitter | ±0.065% | 0–100 kPa |
| Parameter | Experimental Condition |
|---|---|
| Saturation temperature at inlet pressure | 45 °C |
| Inlet superheat | 20 K |
| Outlet subcooling | 5 K |
| The pressure difference across the test section | 0~100 kPa |
| Refrigerant mass velocity | 50~600 kg/(m2·s) |
| Temperature (°C) | Liquid Density (kg/m3) | Vapor Density (kg/m3) | Liquid Dynamic Viscosity (Pa·s) | Vapor Dynamic Viscosity (Pa·s) | |
|---|---|---|---|---|---|
| R22 | 45 | 1106.0 | 75.7 | 0.000149 | 0.0000137 |
| R410A | 45 | 942.9 | 120.4 | 0.0000888 | 0.0000154 |
| Number | Root Wall Thickness (m) | Thread Height (m) | Crest Angle | Helix Angle | Number of Ribs |
|---|---|---|---|---|---|
| 1# | 0.0003 | 0.0002 | 53 | 18 | 60 |
| 2# | 0.0003 | 0.00017 | 25 | 18 | 70 |
| 3# | 0.0003 | 0.0002 | 30 | 18 | 50 |
| Model | Operating Parameters | |
|---|---|---|
| Webb model | Re = 20,000~80,000 | 0.024 ≤ e/De ≤ 0.041 |
| 25° ≤ α ≤ 45° | 10 ≤ Ns ≤ 45 | |
| Ravigururajan model | Re = 5000~250,000 | 0.01 ≤ e/De ≤ 0.2 |
| 27° ≤ α ≤ 90° | 0.1 ≤ p/d ≤ 7.0 | |
| Current experimental conditions | Re = 20,000~60,000 | e = 0.13~0.20 mm |
| α = 15~30°, β = 25~53° | Ns = 50~70 | |
| Mean Absolute Percentage Error (MAPE) | Standard Deviation (SD) | Maximum Error | Minimum Error | |
|---|---|---|---|---|
| Model I | 8.21% | 0.0619 | 31.08% | 0.62% |
| Model II | 7.08% | 0.0362 | 27.66% | 0.76% |
Disclaimer/Publisher’s Note: The statements, opinions and data contained in all publications are solely those of the individual author(s) and contributor(s) and not of MDPI and/or the editor(s). MDPI and/or the editor(s) disclaim responsibility for any injury to people or property resulting from any ideas, methods, instructions or products referred to in the content. |
© 2025 by the authors. Licensee MDPI, Basel, Switzerland. This article is an open access article distributed under the terms and conditions of the Creative Commons Attribution (CC BY) license (https://creativecommons.org/licenses/by/4.0/).
Share and Cite
Meng, X.; Wang, J.; Sun, Q.; Ma, X. Investigation on Pressure Drop Characteristics During Refrigerants Condensation Inside Internally Threaded Tubes. Energies 2025, 18, 2662. https://doi.org/10.3390/en18102662
Meng X, Wang J, Sun Q, Ma X. Investigation on Pressure Drop Characteristics During Refrigerants Condensation Inside Internally Threaded Tubes. Energies. 2025; 18(10):2662. https://doi.org/10.3390/en18102662
Chicago/Turabian StyleMeng, Xiangrui, Jian Wang, Qian Sun, and Xinling Ma. 2025. "Investigation on Pressure Drop Characteristics During Refrigerants Condensation Inside Internally Threaded Tubes" Energies 18, no. 10: 2662. https://doi.org/10.3390/en18102662
APA StyleMeng, X., Wang, J., Sun, Q., & Ma, X. (2025). Investigation on Pressure Drop Characteristics During Refrigerants Condensation Inside Internally Threaded Tubes. Energies, 18(10), 2662. https://doi.org/10.3390/en18102662