Article

Fermentation of Sugar Beet Pulp by E. coli for Enhanced Biohydrogen and Biomass Production

1
Scientific-Research Institute of Biology, Yerevan State University, 1 A. Manoogian str., Yerevan 0025, Armenia
2
Microbial Biotechnologies and Biofuel Innovation Center, Yerevan State University, 1 A. Manoogian str., Yerevan 0025, Armenia
3
Department of Food Technology and Processing Products, Technical Faculty, S. Seifullin Kazakh Agrotechnical Research University, 62 Zhenis Avenue, Astana 010011, Kazakhstan
4
Department of Technological Equipment, Shakarim University, st., Glinka, 20A, Semey 071410, Kazakhstan
5
Department of Biochemistry, Microbiology and Biotechnology, Faculty of Biology, Yerevan State University, 1 A. Manoogian str., Yerevan 0025, Armenia
*
Authors to whom correspondence should be addressed.
Energies 2025, 18(10), 2648; https://doi.org/10.3390/en18102648
Submission received: 22 April 2025 / Revised: 11 May 2025 / Accepted: 13 May 2025 / Published: 20 May 2025

Abstract

:
This study investigates the potential of sugar beet pulp (SBP), a lignocellulosic by-product of sugar production, as a low-cost substrate for biohydrogen and biomass generation using Escherichia coli under dark fermentation conditions. Two strains—BW25113 wild-type and a genetically engineered septuple mutant—were employed. SBP was pretreated via thermochemical hydrolysis, and the effects of substrate concentration, dilution, and glycerol supplementation were evaluated. Hydrogen production was highly dependent on substrate dilution and nutrient balance. The septuple mutant achieved the highest H2 yield in 30 g L−1 SBP hydrolysate (0.75% sulfuric acid) at 5× dilution with glycerol, reaching 12.06 mmol H2 (g sugar)−1 and 0.28 mmol H2 (g waste)−1, while the wild type under the same conditions yielded 3.78 mmol H2 (g sugar)−1 and 0.25 mmol H2 (g waste)−1. In contrast, undiluted hydrolysates favored biomass accumulation over H2 production, with the highest biomass yield (0.3 g CDW L−1) obtained using the septuple mutant in 30 g L−1 SBP hydrolysate without glycerol. These findings highlight the potential of genetically optimized E. coli and optimized hydrolysate conditions to enhance the valorization of agro-industrial waste, supporting future advances in sustainable hydrogen bioeconomy and integrated waste biorefineries.

1. Introduction

Sugar beet (SB) (Beta vulgaris) is a member Amaranthaceae family, and due to higher sucrose content (approx. 20%) in its roots, it has been cultivated commercially for the production of sugar worldwide since 1802 [1]. Annually ~282 million tons of beet sugar was produced worldwide in 2023 [2]. Sugar beet pulp is a widely available residue from sugar production, with an estimated global output of 120 million tons per year (measured as wet mass with about 90% moisture content), and approximately 20 million tons generated annually within Europe [1,3]. According to the National Statistics Bureau of the Republic of Kazakhstan, in 2024, the gross sugar beet harvest in the country was approximately 1.36 million tons in original weight and 1.27 million tons in net weight after processing [4]. 40–60 g of sugar beet pulp (SBP) can be generated from 1 kg processed roots [5] resulting in a significant amount of lignocellulosic waste generation, which has great potential as a low-cost substrate for biohydrogen production.
SBP is primarily composed of hemicellulose (30–40%), cellulose (20–25%), and pectin (10–15%). It contains relatively low levels of lignin (2–4%), which makes it more amenable to microbial and enzymatic degradation compared to other lignocellulosic residues. SBP also includes crude protein (7–10%), ash (4–8%), and residual soluble sugars (1–5%), with negligible lipid content (<1%). This composition makes SBP a highly suitable substrate for biohydrogen production and other bioconversion processes [1,6,7,8]. Due to generated high volumes and rich composition, SBP is widely investigated for its production of value-added products; the precise scheme is represented in Figure 1 showing current applications of SBP and emerging research directions to obtain variety of products such as biofuels (e.g., bioethanol, biohydrogen), biopolymers (e.g., bioplastics, nanocellulose), biochemical (e.g., lactic acid, succinic acid, xylitol, bioplastics, nanocellulose) and others [6,7,9].
Of particular interest is the production of biofuels as sustainable alternatives to non-renewable fossil fuels.
Among various renewable energy carriers, hydrogen has emerged as a key component of the future low-carbon economy. In particular, second-generation hydrogen, produced from non-food lignocellulosic biomass, offers a promising route toward sustainable and carbon-neutral energy solutions [10]. Recent studies have shown that thermochemical routes like gasification—especially when combined with pretreatments such as palletization, torrefaction, and hydrothermal carbonization—can significantly improve hydrogen yield and fuel quality [10,11,12].
A wide range of research is carried out using mixed cultures and anaerobic digestion. Table 1 shows specifically obtained hydrogen yields with the usage of SBP for hydrogen production. However, no studies were found in the literature investigating the usage of SBP by using pure cultures. Some research aimed to obtain bioethanol using pure culture of Clostridia or yeasts [13,14,15]; however, to the best of our knowledge, SBP has never been investigated as a feedstock for biohydrogen production using pure culture of E. coli.
Escherichia coli is facultatively anaerobic bacteria performing mixed acid fermentation and resulting in H2 evolution as one of the fermentation end products. It establishes rapid and short growth phases, growing in a wide range of pH [16]. E. coli is a good candidate to apply for biotechnological purposes because it has flexible metabolism (fermentation, aerobic and anaerobic respiration), is well characterized, and genetically and metabolically easy to manipulate [17].
Table 1. Overview of hydrogen production from SBP using different inoculum.
ReferenceUsed WastePretreatmentInoculumFermentation ConditionsHydrogen Yield
[18]Hydrolyzed Sugar Beet Pulp (SBPEnzymatic hydrolysis (saccharification with Viscozyme® and Ultraflo® Max at 45 °C, pH 5.5, 10 h)Anaerobic sludge froma municipal wastewater treatment plant, pretreated at 80 °C for 1.5 h, pH adjusted to 5.5. Contains hydrogen-producing Clostridiales, Lactobacillales, Coriobacteriales, and methanogens (Methanosphaera sp.)Batch: 35 °C, pH 5.5, Xo/So = 1:8 (VS-based), nitrogen purged before sealing, manually shaken dailyBatch: 279 dm3 H2 kgVS−1 (K3PO4 supplementation)
Semi-continuous: 35 °C, SRT = 5 days, OLR ≈ 10 gVS/m3d, pH adjusted dailySemi-continuous: 36 dm3 H2 kgVS−1 (K3PO4 supplementation)
[19]Sugar Beet Pulp (SBP)Thermal pretreatment (80 °C for 1.5 h, pH 5.5)Anaerobic sludge from a municipal wastewater treatment plant, pretreated at 80 °C for 1 h. Contains Clostridiales, Lactobacillales, Methanobrevibacter, and CaproiciproducensBatch: 35 °C, pH 5.5, Xo/So = 1:8 (VS-based), nitrogen purged before sealingBatch: >200 dm3 H2 kgVS−1 (with Fe2O3, 0.1 g (dm3)−1)
Semi-continuous: 35 °C, SRT = 5 days, OLR ≈ 9.95 gVS/m3dSemi-continuous: 52.11 dm3 H2 kgVS−1 (with Fe2O3)
[13]Sugar Beet Pulp (SBP)
Dilute acid pretreatment
Dilute acid pretreatment (H2SO4 1% v/v)Co-culture: Escherichia coli + Saccharomyces cerevisiaeSSF: 35 °C, pH controlled, simultaneous saccharification and fermentationSSF: 252 dm3 H2 kgVS−1
[20]Sugar Beet (various particle sizes)Mechanical size reduction (0.1–1 cm particle sizes)Naturally occurring microbial consortia (not specified)Batch: various particle sizes (0.1–1 cm), 24.6 g L−1 sugar beet; optimum at 0.1 cm pH ~6, anaerobic, temp not specifiedMaximum: 197.9 mL H2 g TOC−1 at 0.1 cm particle size
[21]Sugar Beet Pulp (SBP)Alkaline, Thermal-Alkaline, Microwave-Alkaline pretreatmentsAnaerobic sludge (from Ankara WWTP), 1800 mg L VSS−1Batch: 35 °C, 175 rpm, 20 g/L COD, pH 6.0115.6 mL H2 g COD−1 (alkaline pretreatment) 108.2 mL H2 g COD−1 (thermal-alkaline) 66.7 mL H2 g COD−1 (microwave-alkaline)
In our earlier work, we established that different waste hydrolysates can support the growth of E. coli and facilitate H2 production, with notable differences observed between wild-type strain and genetically modified mutant. Specifically, the septuple mutant (ΔhyaB ΔhybC ΔhycA ΔfdoG ΔldhA ΔfrdC ΔaceE) exhibited enhanced H2 production yields compared to the wild-type strain [22,23].
The current study investigates the application of SBP for hydrogen production using a wild type and genetically engineered mutant for enhanced hydrogen production during dark fermentation. It has been shown that SBP can be applied for utilization by E. coli pure cultures and, moreover, enhanced hydrogen yield has been experimentally shown to suggest the promising application of SBP for enhanced hydrogen production technology.

2. Materials and Methods

2.1. Waste Source and Pretreatment

The samples of sugar beet pulp taken from LLP “SUGAR FACTORY” “KARABULAK” (Republic of Kazakhstan, Zhetysu Region, Karabulak village) were dried to a moisture content of 6.0–6.3% at t = 45 °C, τ = 6–7 h to ensure sample preservation during the research process. After drying, the sugar beet pulp samples were ground using a Stegler LM-1000 knife mill (Shenzhen Bestman Instrument Co., Ltd., Shenzhen, China).
Solutions containing 25–200 g L−1 SBP were subjected to psychochemical treatment, such as thermal, thermochemical and ultrasound treatments. Sulfuric acid was used as a main hydrolyzing agent with final concentration of 0.5–1.5%. For thermochemical treatment, solutions containing mentioned concentration of waste and the hydrolyzing agent were autoclaved for 45 min at 121 °C (Daihan Scientific, Wonju-si, South Korea). Meanwhile, for thermal treatment the same autoclaving parameters were used without addition of any chemical compound. In the ultrasonic treatment, 2 to 10 min ultrasound exposure times were tested. The hydrolysate was filtered, pH adjusted to pH 7.5. Subsequently, the solutions were boiled for 15–20 min to remove the sediment and after cooling, centrifuged at 7500× g for 15 min. The final solutions were diluted two-fold and five-fold and then autoclaved for 15 min at 121 °C [23,24].

2.2. Bacterial Strain Cultivation and Hydrogen Production

Escherichia coli wild-type strain BW25113 and the septuple mutant characterized in Table 2 were used in this study.
Overnight cultures were grown anaerobically in peptone medium composed of 20 g L−1 peptone, 2 g L−1 KH2PO4, and 5 g L−1 NaCl. For hydrogen fermentation experiments, cells were inoculated into SBP medium at various substrate concentrations and dilutions and cultivated anaerobically under fermentative conditions at 37 °C for 96–240 h. During batch cultivation, the following parameters were measured at the beginning, 3rd, 6th hours and per 24 h intervals: redox potential (ORP, in mV) using a redox electrode (HI3131, HANNA Instruments, Póvoa de Varzim, Portugal); pH using a calibrated pH electrode (HI1131, HANNA Instruments, Portugal); and cell density using optical density at 600 nm (OD600), measured with a Cary 60 UV-Vis spectrophotometer (Agilent Technologies, Waldbronn, Germany) [25,26]. All fermentation experiments were carried out in biological triplicates, and average values are presented with standard deviations. The initial pH of the fermentation medium was adjusted to 7.5 ± 0.2 using KH2PO4. pH was not actively controlled during incubation but was monitored throughout fermentation to assess acidification due to microbial metabolism.
Table 2. Characteristics of E. coli strains used.
StrainsGenotypeSubunits LackingReference
BW25113rrB ΔlacZ4787 HsdR514 Δ(araBAD)567Δ(rhaBAD)568 rph-1Wild type[27]
BW25113 hyaB hybC hycA fdoG ldhA frdC aceEBW25113 ΔhyaB ΔhybC ΔhycA ΔfdoG ΔldhA ΔfrdC ΔaceELarge subunit of Hyd-1 and 2, repressor of FHL, α-subunit of formate dehydrogenase-N, lactate dehydrogenase[28]
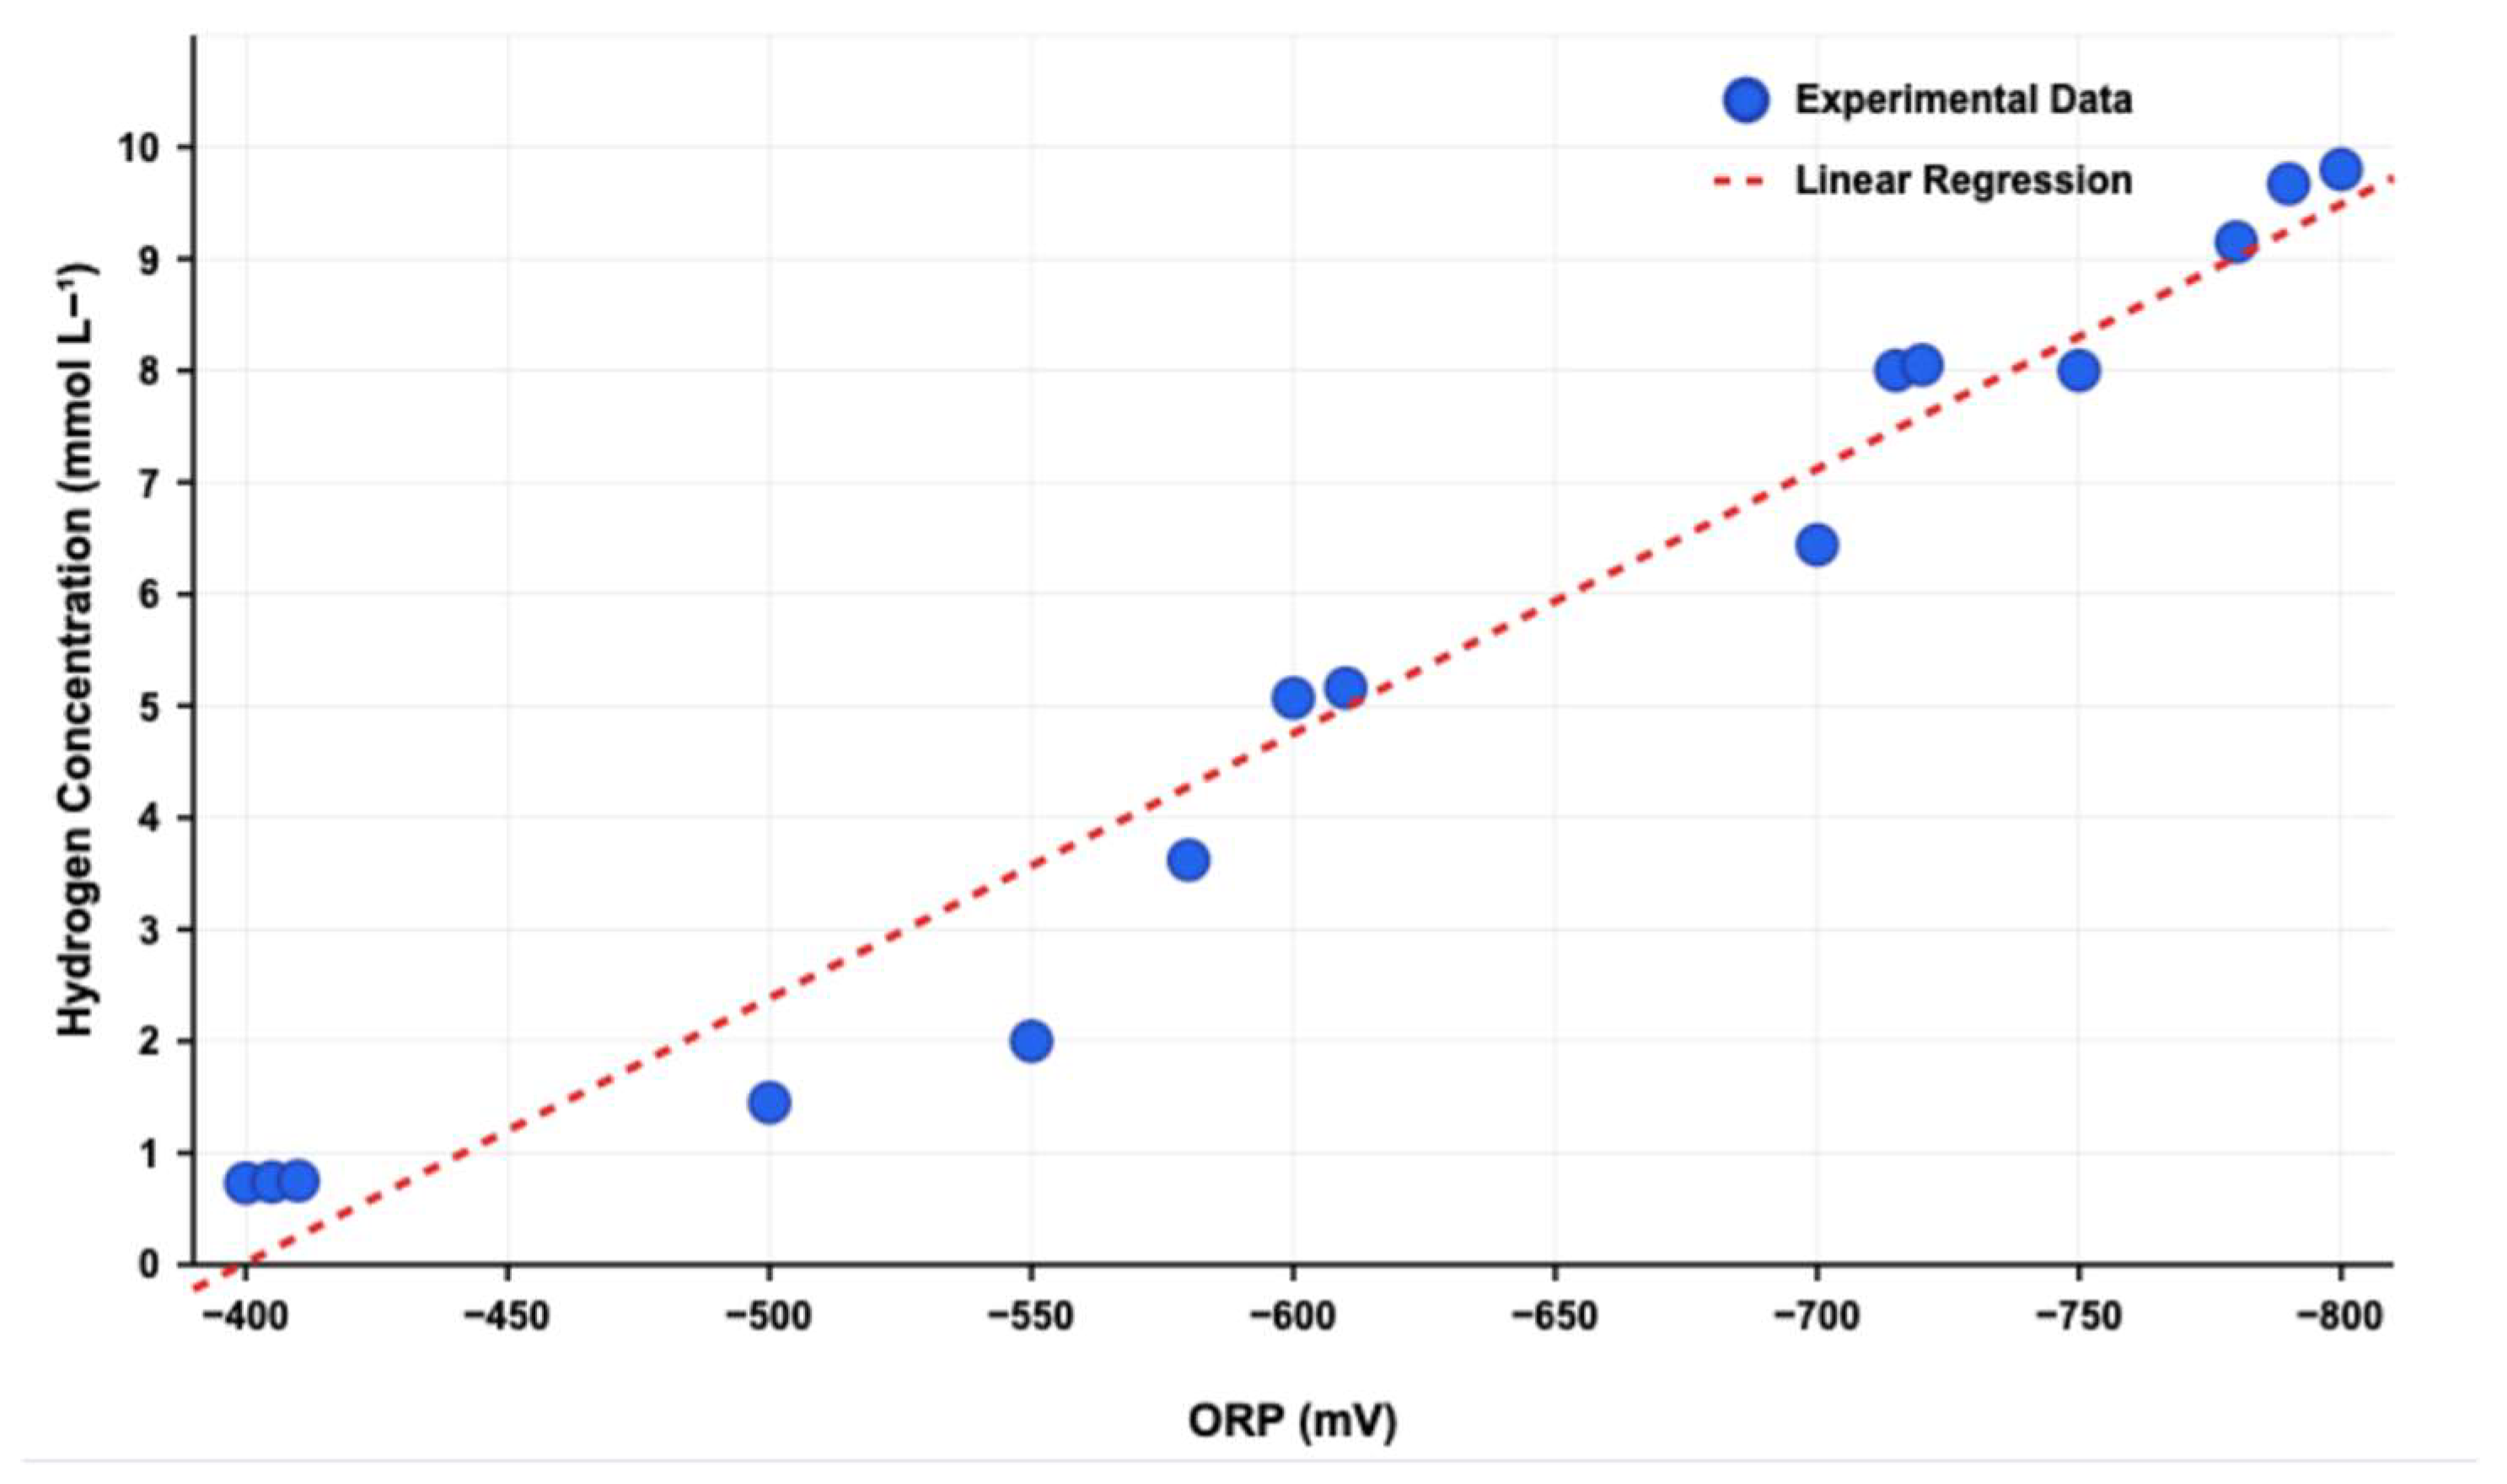
Biomass concentration was estimated using OD600 values, applying a conversion factor of 0.3 ± 0.1 g cell dry weight (CDW) per liter per unit of OD600 [24,25]. This conversion was established from literature for E. coli under similar growth conditions and provides an approximate measure of dry biomass based on optical density [29,30]. Hydrogen production was estimated indirectly by tracking ORP changes and applying the empirical method developed by Piskarev et al. [31], which correlates ORP values with hydrogen concentration under anaerobic conditions (Figure 2). According to this method, progressively more negative ORP values indicate increasing hydrogen accumulation. A calibration curve adapted from Piskarev was used to convert recorded ORP values into estimated H2 concentrations (mmol L−1).
Hydrogen yields were then calculated as
H2 yield (waste-based) = mmol H2/g waste,
H2 yield (sugar-based) = mmol H2/g sugar consumed

2.3. Physicochemical Analysis

The total solids (TS) and volatile solids (VS) content of SBP were analyzed based on fresh mass (FM) as per the standard methods [32]. Samples were initially dried at 105 °C for 24 h using a laboratory oven (WiseVen, Daihan Scientific, Wonju-si, South Korea), followed by incineration at 550 °C for 4–5 h in a muffle furnace (Daihan FHX-05, 4.5 L, max 1200 °C, Daihan Scientific, Wonju-si, South Korea) [32].
Chemical oxygen demand (COD) of the SBP hydrolysate, both with and without glycerol supplementation, was assessed using a modified procedure designed for substrates with high suspended solids, as outlined by Raposo et al. (2008) [33]. This method involved oxidizing the sample with potassium dichromate and silver sulfate in sulfuric acid within a digestion vessel (KJELDATHERM digestion block, C. Gerhardt Analytical Systems, Königswinter, Germany) at elevated temperatures. The COD value was derived from the quantity of reduced potassium dichromate, indicating the oxygen required to oxidize organic matter. The COD was calculated using the following formula:
C O D = F A S B l F A S l i q u i d   s a m p l e × N F A S × 8000 V l i q u i d   s a m p l e
where FASBl—volume of FAS (ferrous ammonium sulfate) used in the titration of the blank sample (mL). FASliquid sample—volume of FAS used in the titration of the liquid sample (mL). NFAS—concentration of reducing reagent (N). Vliquid sample—volume of liquid sample (mL).
Total nitrogen content was determined through the Kjeldahl method [34], which involved digestion with sulfuric acid and a catalyst mixture (CuSO4 and K2SO4) using a TURBOTHERM infrared digestion unit (C. Gerhardt Analytical Systems, Germany). Distillation was subsequently performed with a VAPODEST® 300 distillation unit (C. Gerhardt Analytical Systems, Germany). A 4% boric acid solution containing Tashiro’s indicator was used as the receiver, and titration was conducted with 0.1 N HCl.
The carbohydrate concentration (g L−1) was measured according to the colorimetric method by Dubois et al. [35]. The carbon-to-nitrogen (C/N) ratio was estimated by converting COD values (mg O2 L−1) to carbon using a factor of 0.375 (COD × 0.375 = mg C/L), and dividing by total nitrogen (mg N/L) obtained from Kjeldahl analysis.
Total phenolics were quantified using the Folin–Ciocalteu reagent (Carl ROTH, Karlsruhe, Germany), following the method by Javanmardi [36] with slight modifications. Absorbance was measured at 765 nm after a 2 h dark incubation. Gallic acid served as the calibration standard, and the results were expressed as mg gallic acid equivalents per gram of solid (mg GAE (g solid)−1). The total flavonoid content was assessed via an aluminum chloride colorimetric assay, adapted from the protocol of Kumaran and Karunakaran [37]. The absorbance at 415 nm was used to calculate flavonoid concentration based on a quercetin standard curve, with results reported as mg quercetin equivalents per gram of solid content (QE) (g of solid content)−1.
Physicochemical analyses, including TS, VS, COD, and nitrogen content, were performed in triplicate for each sample condition to ensure data reproducibility.

2.4. Statistical Analysis

All experimental data were obtained from independent biological triplicates and are presented as mean ± standard deviation (SD). Statistical significance was evaluated using two-way analysis of variance (ANOVA), followed by Tukey’s multiple comparison test to assess differences between strains, treatment conditions, and time points. A p-value of less than 0.05 was considered statistically significant. Data analysis and visualization were conducted using GraphPad Prism 8.0.2 (GraphPad Software, San Diego, CA, USA) and Python (version 3.9.19) programming language [38,39].

3. Results and Discussion

3.1. Treatment Optimization and Hydrolysate Composition

In this study, both wet and dry sugar beet pulp (SBP) were evaluated for suitability in biohydrogen production. While wet SBP offers direct usage potential, it resulted in poor fermentation performance and negligible H2 production across all tested conditions. n contrast, dried SBP produced significantly more biomass and hydrogen. These findings suggest that drying not only aids in storage and handling but also enhances substrate consistency and availability of fermentable sugars, making it more suitable for downstream applications.
To enhance sugar release, multiple physicochemical pretreatments were tested: dilute acid hydrolysis, thermal treatment, and ultrasound-assisted hydrolysis. Only acid hydrolysis showed a significant improvement in sugar yield. Other treatments—such as autoclaving alone or ultrasound (2–10 min)—did not lead to increased sugar release. Notably, increasing substrate loading to 200 g/L did not proportionally increase sugar yield, indicating a limit in hydrolysis efficiency at high concentrations.
It is worth mentioning that sulfuric acid concentrations ranging from 0.5% to 1.5% were tested and it was established that 0.75% was optimal for 30 g L−1 waste concentration and 1% for 50 g L−1. Both were autoclaved at 121 °C for 45 min. These thermochemical hydrolysis parameters closely align with those reported by Bellido et al. [14] and Zheng et al. [40], who demonstrated hydrolysis yields of up to 93% and total reducing sugar yields of 63% under comparable conditions (∼0.66% sulfuric acid at 120 °C). On the other hand, operating at 121 °C and a slightly higher acid concentration of 0.75% ensures effective hydrolysis while avoiding excessive thermal degradation of sugars, which is reported at higher temperatures (>170 °C). Notably, at this temperature, arabinose—a key pentose sugar derived from SBP—remains stable and bioavailable, making it suitable for subsequent microbial fermentation processes by arabinose-utilizing bacterial strains [1]. It is worth mentioning that arabinose can be utilized more efficiently by E. coli than xylose, primarily due to its uptake via the energetically favorable AraE proton symporter. This allows E. coli to grow on arabinose even under ATP-limited or anaerobic conditions where xylose utilization is impaired [41]. The selected parameters thus represent a balance between process efficiency, sugar stability, and compatibility with downstream bioconversion.
Total solids represent 77% of fresh matter for the 30 g L−1 SBP hydrolysate and 72% for the 50 g L−1 SBP hydrolysate, indicating both preparations have similar water content despite different initial substrate loadings. Furthermore, volatile solids constitute 26% of total solids in the 30 g L−1 sample and 31% in the 50 g L−1 SBP containing hydrolysate (Table 3). This slightly higher proportion of volatile solids in the more concentrated hydrolysate suggests a marginally more efficient extraction of organic matter at higher substrate concentrations. While these general percentages appear similar between the two hydrolysate concentrations, the detailed composition analysis reveals significant differences in the specific compounds extracted. Particularly, total sugar concentrations reached 6.54 mg mL−1 for the 30 g L−1 SBP containing hydrolysate and 11.42 mg mL−1 for the 50 g L−1 SBP, representing approximately 21.8% and 22.8% of the initial substrate on a weight basis, respectively.
It is known that thermochemical hydrolysis can lead to a generation of specific flavonoid and phenolics content; thus, the total amount of these compounds was investigated as well. However, this was not a result of ethanol extraction but a content in liquid medium per gram of total solids. The total phenolic content decreases from 0.116 mg GAE g solids−1 in the 30 g L−1 sample to 0.0921 mg GAE g solids−1 in the 50 g L−1 sample, representing a 21% reduction despite higher substrate loading. Conversely, the flavonoid content increases dramatically from 0.1204 mg QE g solids−1 to 0.213 mg QE g solids−1, representing a 77% increase (Table 3). This inverse relationship between phenolics and flavonoids across the two hydrolysate concentrations suggests complex extraction dynamics, potentially involving differential solubility, degradation, or transformation processes at various substrate densities. Interestingly, obtained COD values for SBP hydrolysate perfectly match with sugar data, when initial waste concentration was 30 g L−1 in hydrolysate COD was 15,000 (mg O2 L−1), and in higher concentration it doubled twice. Data strongly differ when looking at nitrogen data as, while the 30 g L−1 preparation yielded 15.84 mg nitrogen per 100 mL, the 50 g L−1 preparation contained only 17.26 mg per 100 mL. This 9% increase in nitrogen extraction stands in stark contrast to the 67% increase in initial substrate concentration, demonstrating a clearly non-proportional relationship. This suggests that extracting nitrogen compounds becomes less efficient at higher substrate concentrations, possibly because of restricted mass transfer within the denser mixture or because nitrogen-containing compounds become bound in complex structures that resist solubilization under the hydrolysis conditions employed.
To sum up, while 50 g L−1 resulted in higher total sugar content, the 30 g L−1 condition exhibited better overall fermentation performance in terms of biomass growth, hydrogen production efficiency, and C/N balance (see Section 3.2 and Section 3.3). Furthermore, phenolic content—known to inhibit microbial metabolism—was slightly lower in the 50 g L−1 hydrolysate than in the 30 g L−1, but flavonoids were substantially higher, suggesting potentially greater inhibitory effects at higher concentrations.

3.2. Sugar Utilization and Biomass Generation

Due to the complexity of the waste hydrolysate, which contains multiple sugars likely consumed both sequentially and simultaneously, specific growth rate measurements were not performed. Instead, growth was monitored via OD changes and total biomass, as detailed in the Section 2. During batch culturing, sugar content in the beginning and at the end of fermentation was measured (Figure 3).
Although hydrolysis of higher SBP concertation resulted in higher sugar, the biomass generation was optimal in lower concentration containing media. In conditions without glycerol supplementation, more efficient substrate utilization was observed at lower SBP loads, as indicated by a more balanced C/N ratio and greater biomass formation. In contrast, higher SBP loads led to elevated initial C/N ratios but minimal biomass increase (Table 4). High biomass was obtained when using either 30 g L−1 SBP containing waste without dilution or 50 g L−1 waste containing hydrolysate with 5× dilution (Figure 3). At 30 g L−1 SBP with no dilution and no glycerol, the C/N ratio dropped significantly from 36.7 to 15.9 in wild type and to 26.2 in septuple mutant, showing active carbon utilization.
It is worth mentioning that, with 0× dilution, no H2 production was observed in both wild type and mutant strain (Figure 4 and Figure 5), which means that in this condition, metabolic pathways were switched to biomass generation rather than H2 production, for this point of view stress factor investigations will be of great interest. In conditions with glycerol supplementation, the trend was not as straightforward. The initial C/N ratios were much higher, indicating an excess of carbon due to added glycerol. Moreover, sugar consumption was significantly lower in samples with glycerol co-fermentation (Figure 4) and generated biomass was mainly similar in all conditions independent of applied dilution. Thus, highest biomass yield was obtained using septuple mutant grown in 30 g L−1 SBP containing hydrolysate without dilution, reaching up to 0.3 g CDW L−1. Further condition optimization and mixture with other wastes especially from sugar beet production can lead to higher biomass yields.

3.3. Hydrogen Production

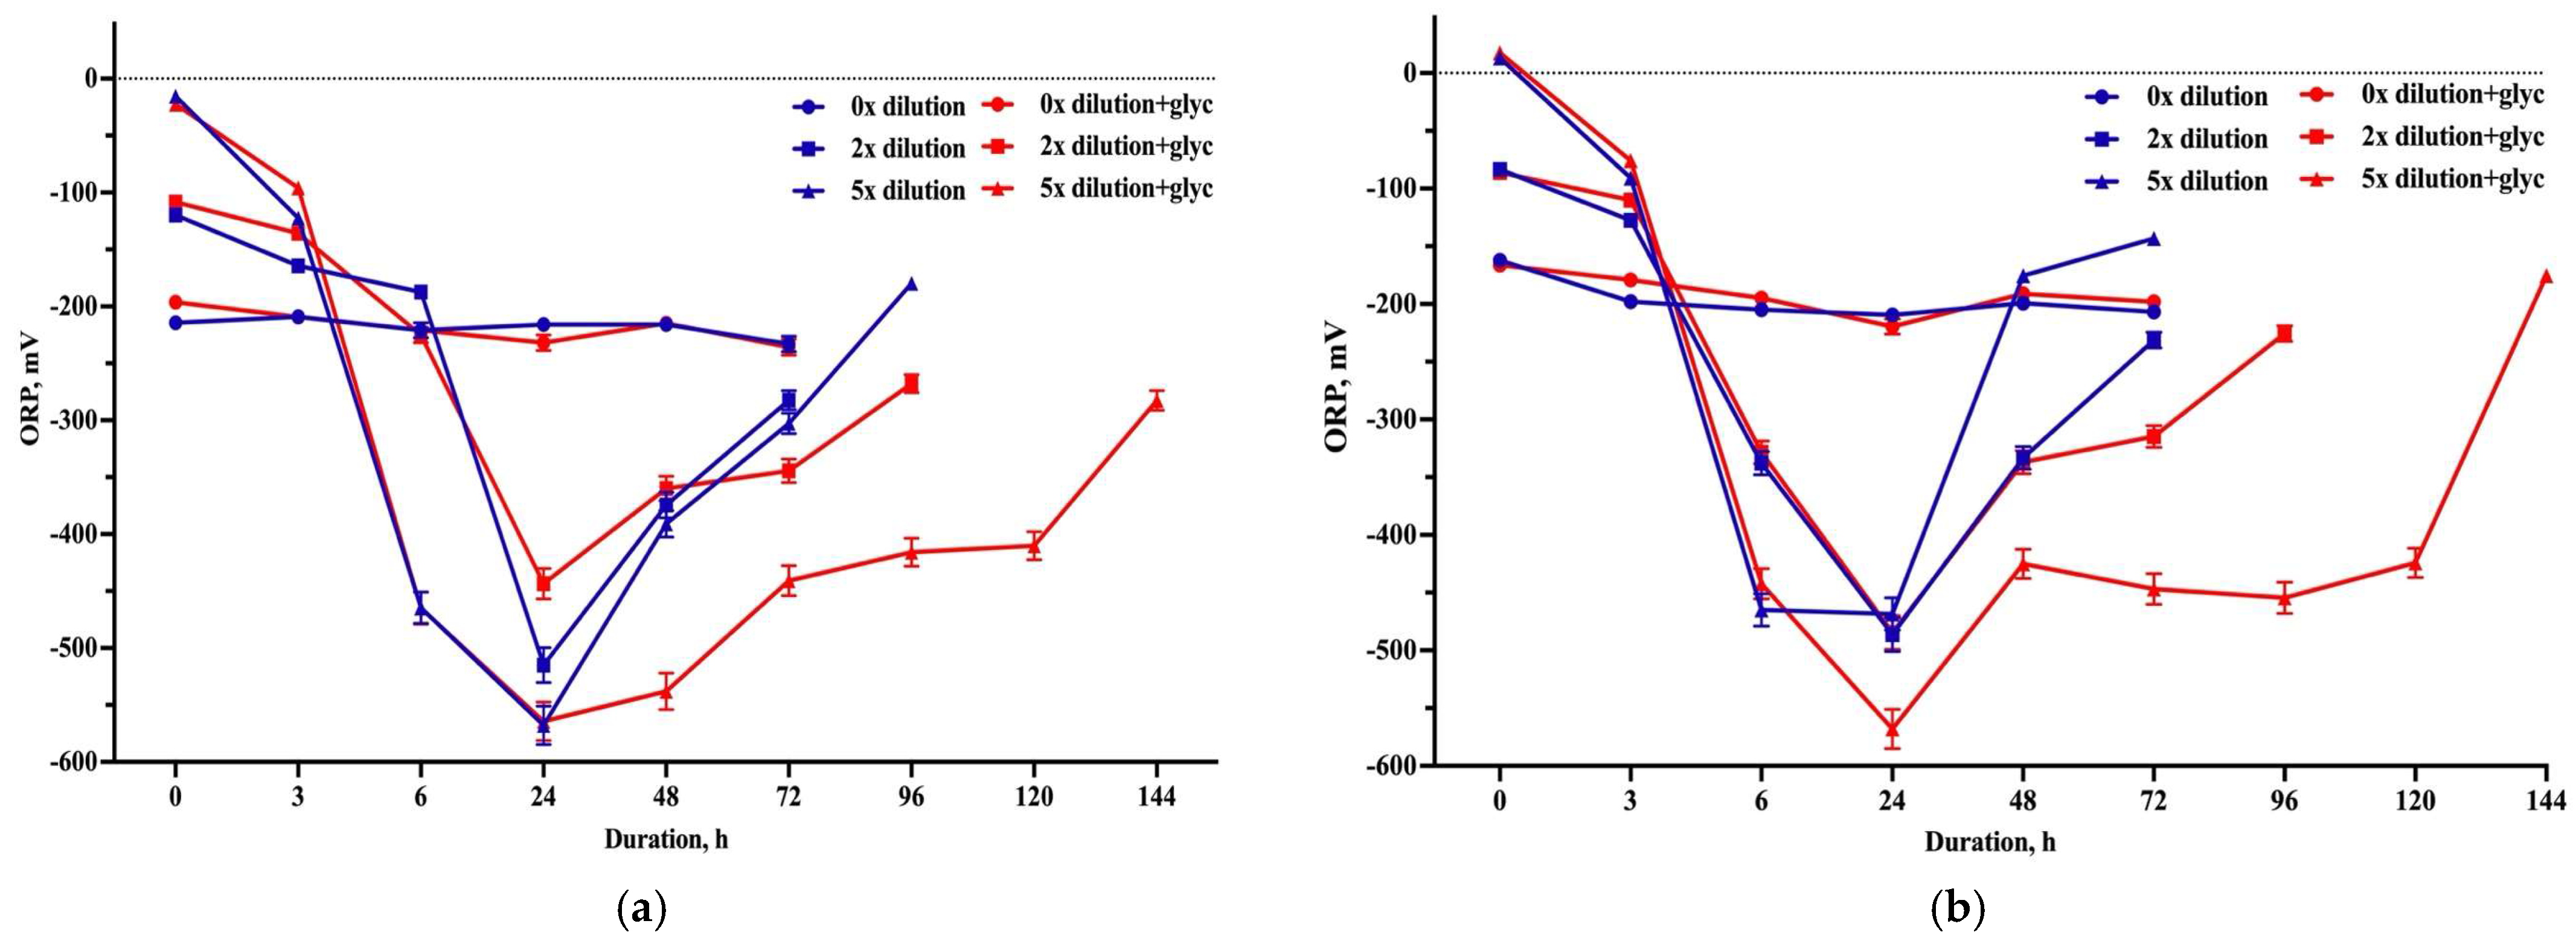
Redox potential (ORP) monitoring revealed critical insights into the dynamics of H2 production during batch fermentation. In both E. coli wild-type and septuple mutant strains, no significant ORP drops were observed in undiluted SBP hydrolysates as mentioned above, regardless of substrate concentration. However, upon 2× and 5× dilution of both 30 g L1 and 50 g L1 SBP hydrolysates, distinct ORP drops were detected, particularly within the 6 to 48 h of growth. These reductions—often reaching as low as −400 mV—corresponded H2 production. Particularly ORP drops in wild type and mutant strains were in similar time points when grown in a 30 g L1 SBP containing hydrolysate, from 6 to 48 h in 2× diluted and 6 to 24 h in 5× diluted media (Figure 4a and Figure 5a). In 50 g L1 SBP containing and 2× diluted media H2 production was observed from 24 h to 48 h; meanwhile, and in 5× dilution 6 to 48 h in both strains (Figure 4b and Figure 5b). Data were significantly affected when additional glycerol was supplemented. However, in both the wild type and mutant strain, the effect of glycerol on ORP changes does not cause significant effects on time slots when 2× dilution applied but, in 5× dilution, H2 production started from 6 h to 144 or 216 h (Figure 3 and Figure 4). Although time slots were similar, significant differences were observed in H2 yields. Table 4 represents the highest H2 yields obtained during batch culturing in mmol L−1 and further yields in mmol per gram of sugar was calculated considering sugar consumption in each condition. In the wild-type strain, the highest H2 production (3.57 ± 0.11 mmol L−1) was observed in 50 g L1 SBP hydrolysate with 5× dilution and glycerol. In the same condition without glycerol, the yield was 2.16 ± 0.06 mmol L1. A similar pattern was observed in the septuple mutant, where the same condition (50 g L1, 5× dilution, glycerol) also resulted in 3.57 ± 0.11 mmol L1 H2, while without glycerol, the value was much lower (0.81 ± 0.02 mmol L1). This shows that glycerol addition has a strong positive effect, especially under higher dilution.
When comparing hydrogen production per gram of sugar, the septuple mutant showed the best results. In 30 g L−1 SBP hydrolysate, 5× dilution with glycerol, it reached the highest yield of 12.06 ± 0.36 mmol (g sugar)−1. In comparison, the wild type under the same condition produced 3.78 ± 0.113 mmol (g sugar)−1. Interestingly, also in 2× dilution, the septuple mutant with glycerol achieved 7.23 ± 0.22 mmol (g sugar)−1, showing a very efficient conversion even with less dilution. Despite lower sugar content, this condition supported superior substrate utilization and higher hydrogen yield per gram of sugar. These findings justify the selection of 30 g L−1 with 0.75% H2SO4 as an economically and biologically optimal condition for further fermentation studies.
These results clearly show that the septuple mutant is more effective in redirecting carbon flow toward hydrogen production. Moreover, this strain has stable gene deletions, meaning it does not require constant genetic maintenance, which is beneficial for large-scale industrial use, ensuring consistent performance over time.
In general, glycerol addition led to lower sugar consumption but increased hydrogen yield per gram of sugar. These performance differences closely aligned with the observed C/N ratio dynamics (Table 5). C/N ratios decreased over the course of fermentation, indicating carbon utilization and biomass generation as a nitrogen source. In the septuple mutant, this decrease was especially pronounced by 24 h in hydrogen-producing conditions compared to wild type. For example, in 2× diluted 30 g L−1 SBP with glycerol, the initial C/N ratio dropped from 83.4 ± 2.5 to 76.4 ± 2.3, while in 5× diluted media, it fell from 291.0 ± 14.7 to 62.0 ± 1.9, correlating with the highest H2 yields. Thus, hydrogen productivity was influenced by both substrate dilution and C/N balance, and the combination of glycerol supplementation and lower initial C/N ratios proved especially beneficial in the septuple mutant. This supports the conclusion that optimizing nutrient ratios, particularly through dilution and co-substrate adjustment, enhances fermentative hydrogen production in genetically modified strains. Moreover, during dark fermentation, E. coli primarily produces H2 along with minimal amounts of carbon dioxide. Unlike chemical or thermochemical methods, biological fermentation does not introduce nitrogen, carbon monoxide, or complex hydrocarbons into the gas mix, significantly simplifying downstream separation. This low-impurity profile allows for the use of cost-effective purification methods, such as water scrubbing or membrane separation, to achieve high hydrogen purity (up to ~99.9%). As a result, the H2 generated is well-suited for direct use in fuel cells or other applications requiring clean fuel, with reduced energy and infrastructure costs for purification.

4. Conclusions

The study explored the potential of sugar beet pulp as a substrate for biomass and biohydrogen production using E. coli wild type and septuple mutant, focusing on optimizing pretreatment methods and co-fermentation with glycerol. Based on obtained data, the following conclusions can be made:
  • Undiluted hydrolysates led to minimal H2 production but maximized biomass formation, with the septuple mutant reaching 0.3 g CDW L−1, indicating a shift in metabolic activity from H2 production to growth.
  • The highest H2 yield during 24th hour of fermentation was obtained in 5× diluted 30 g L−1 SBP with glycerol using the septuple mutant reaching up to 12.06 mmol H2 (g sugar)−1 and 0.28 mmol H2 (g waste)−1.
  • Moderate H2 yields were obtained in 50 g L−1 SBP containing hydrolysate with glycerol in both strains. These data confirm that the combination of dilution and co-substrate is the most effective.
Lower SBP concentration (30 g L−1) with low sulfuric acid content (0.75%) proved to be the most efficient and cost-effective condition for sugar release and biohydrogen production. These results demonstrate that SBP is a promising feedstock for bioenergy production, with different operational setups tailored to either hydrogen or biomass maximization.
While the study provides valuable insights, it was conducted at a laboratory scale, and further work is required to scale up the process for industrial applications. The impact of fermentation by-products on hydrogen yields and further optimization of fermentation conditions should also be explored. Future directions should include co-fermentation with other agro-industrial wastes, scale-up studies, and further strain engineering to enhance yields and process economics.

Author Contributions

G.M., A.T., R.B. and K.B. (Kamila Baichiyeva)—Experimental analysis, data collection; Methodology; Investigation; L.V.—Formal analysis; Writing—original draft preparation; K.B. (Kairat Bekbayev) and K.T.—Funding acquisition; Project administration; Writing—review and editing; K.T.—Funding acquisition; Writing—review and editing; Validation; Supervision; Conceptualization. All authors have read and agreed to the published version of the manuscript.

Funding

This research has been funded by the Science Committee of the Ministry of Science and Higher Education of the Republic of Kazakhstan (Grant No. AP19677558) and by Basic support and a research grant from the Higher Education and Science Committee of the Ministry of Education, Science, Culture and Sports of Armenia (23FP-3D020).

Data Availability Statement

Data will be made available upon reasonable request.

Conflicts of Interest

The authors declare no conflicts of interest.

References

  1. Joanna, B.; Michal, B.; Piotr, D.; Agnieszka, W.; Dorota, K.; Izabela, W. Sugar Beet Pulp as a Source of Valuable Biotechnological Products. In Advances in Biotechnology for Food Industry; Elsevier: Amsterdam, The Netherlands, 2018; pp. 359–392. [Google Scholar]
  2. Our World in Data. Available online: https://ourworldindata.org (accessed on 11 May 2025).
  3. Bonnin, E.; Ralet, M.-C.; Thibault, J.-F.; Schols, H.A. Enzymes for the Valorisation of Fruit- and Vegetable-Based Co-Products. In Handbook of Waste Management and Co-Product Recovery in Food Processing; Elsevier: Amsterdam, The Netherlands, 2009; pp. 257–285. [Google Scholar]
  4. Government of Kazakhstan. National Statistics Office of Kazakhstan. Available online: https://stat.gov.kz (accessed on 11 May 2025).
  5. Mohdaly, A.A.A.; Sarhan, M.A.; Mahmoud, A.; Ramadan, M.F.; Smetanska, I. Antioxidant Efficacy of Potato Peels and Sugar Beet Pulp Extracts in Vegetable Oils Protection. Food Chem. 2010, 123, 1019–1026. [Google Scholar] [CrossRef]
  6. Usmani, Z.; Sharma, M.; Diwan, D.; Tripathi, M.; Whale, E.; Jayakody, L.N.; Moreau, B.; Thakur, V.K.; Tuohy, M.; Gupta, V.K. Valorization of Sugar Beet Pulp to Value-Added Products: A Review. Bioresour. Technol. 2022, 346, 126580. [Google Scholar] [CrossRef] [PubMed]
  7. Rana, A.K.; Gupta, V.K.; Newbold, J.; Roberts, D.; Rees, R.M.; Krishnamurthy, S.; Thakur, V.K. Sugar Beet Pulp: Resurgence and Trailblazing Journey towards a Circular Bioeconomy. Fuel 2022, 312, 122953. [Google Scholar] [CrossRef]
  8. Baryga, A.; Ziobro, R.; Gumul, D.; Rosicka-Kaczmarek, J.; Miśkiewicz, K. Physicochemical Properties and Evaluation of Antioxidant Potential of Sugar Beet Pulp—Preliminary Analysis for Further Use (Future Prospects). Agriculture 2023, 13, 1039. [Google Scholar] [CrossRef]
  9. Aljabri, M.; Alharbi, S.; Al-Qthanin, R.N.; Ismaeil, F.M.; Chen, J.; Abou-Elwafa, S.F. Recycling of Beet Sugar Byproducts and Wastes Enhances Sugar Beet Productivity and Salt Redistribution in Saline Soils. Environ. Sci. Pollut. Res. 2021, 28, 45745–45755. [Google Scholar] [CrossRef]
  10. Singh, R.; Kumar, R.; Sarangi, P.K.; Kovalev, A.A.; Vivekanand, V. Effect of Physical and Thermal Pretreatment of Lignocellulosic Biomass on Biohydrogen Production by Thermochemical Route: A Critical Review. Bioresour. Technol. 2023, 369, 128458. [Google Scholar] [CrossRef]
  11. Gong, M.; Feng, A.; Wang, L.; Wang, M.; Hu, J.; Fan, Y. Coupling of Hydrothermal Pretreatment and Supercritical Water Gasification of Sewage Sludge for Hydrogen Production. Int. J. Hydrogen Energy 2022, 47, 17914–17925. [Google Scholar] [CrossRef]
  12. Riaz, S.; Oluwoye, I.; Al-Abdeli, Y.M. Oxidative Torrefaction of Densified Woody Biomass: Performance, Combustion Kinetics and Thermodynamics. Renew. Energy 2022, 199, 908–918. [Google Scholar] [CrossRef]
  13. Puligundla, P.; Mok, C. Valorization of Sugar Beet Pulp through Biotechnological Approaches: Recent Developments. Biotechnol. Lett. 2021, 43, 1253–1263. [Google Scholar] [CrossRef]
  14. Bellido, C.; Infante, C.; Coca, M.; González-Benito, G.; Lucas, S.; García-Cubero, M.T. Efficient Acetone–Butanol–Ethanol Production by Clostridium Beijerinckii from Sugar Beet Pulp. Bioresour. Technol. 2015, 190, 332–338. [Google Scholar] [CrossRef]
  15. Vučurović, V.M.; Razmovski, R.N. Sugar Beet Pulp as Support for Saccharomyces Cerivisiae Immobilization in Bioethanol Production. Ind. Crops Prod. 2012, 39, 128–134. [Google Scholar] [CrossRef]
  16. Poladyan, A.; Margaryan, L.; Trchounian, K.; Trchounian, A. Biomass and Biohydrogen Production during Dark Fermentation of Escherichia coli Using Office Paper Waste and Cardboard. Int. J. Hydrogen Energy 2020, 45, 286–293. [Google Scholar] [CrossRef]
  17. Trchounian, A. Mechanisms for Hydrogen Production by Different Bacteria during Mixed-Acid and Photo-Fermentation and Perspectives of Hydrogen Production Biotechnology. Crit. Rev. Biotechnol. 2015, 35, 103–113. [Google Scholar] [CrossRef]
  18. Cieciura-Włoch, W.; Borowski, S.; Domański, J. Dark Fermentative Hydrogen Production from Hydrolyzed Sugar Beet Pulp Improved by Nitrogen and Phosphorus Supplementation. Bioresour. Technol. 2021, 340, 125622. [Google Scholar] [CrossRef]
  19. Cieciura-Włoch, W.; Borowski, S.; Domański, J. Dark Fermentative Hydrogen Production from Hydrolyzed Sugar Beet Pulp Improved by Iron Addition. Bioresour. Technol. 2020, 314, 123713. [Google Scholar] [CrossRef]
  20. Eker, S.; Erkul, B. Biohydrogen Production by Extracted Fermentation from Sugar Beet. Int. J. Hydrogen Energy 2018, 43, 10645–10654. [Google Scholar] [CrossRef]
  21. Ozkan, L.; Erguder, T.H.; Demirer, G.N. Effects of Pretreatment Methods on Solubilization of Beet-Pulp and Bio-Hydrogen Production Yield. Int. J. Hydrogen Energy 2011, 36, 382–389. [Google Scholar] [CrossRef]
  22. Vanyan, L.; Aghekyan, H.; Vassilian, A.; Poladyan, A.; Trchounian, K. Biotechnological Potential of Spent Coffee Grounds for Biohydrogen Production by Escherichia coli. Int. J. Hydrogen Energy 2024, in press. [Google Scholar] [CrossRef]
  23. Petrosyan, H.; Vanyan, L.; Mirzoyan, S.; Trchounian, A.; Trchounian, K. Roasted Coffee Wastes as a Substrate for Escherichia coli to Grow and Produce Hydrogen. FEMS Microbiol. Lett. 2020, 367, fnaa088. [Google Scholar] [CrossRef]
  24. Mirzoyan, S.; Aghekyan, H.; Vanyan, L.; Vassilian, A.; Trchounian, K. Coffee Silverskin as a Substrate for Biobased Production of Biomass and Hydrogen by Escherichia coli. Int. J. Energy Res. 2022, 46, 23110–23121. [Google Scholar] [CrossRef]
  25. Mirzoyan, S.; Trchounian, A.; Trchounian, K. Hydrogen Production by Escherichia coli during Anaerobic Utilization of Mixture of Lactose and Glycerol: Enhanced Rate and Yield, Prolonged Production. Int. J. Hydrogen Energy 2019, 44, 9272–9281. [Google Scholar] [CrossRef]
  26. Poladyan, A.; Trchounian, K.; Vassilian, A.; Trchounian, A. Hydrogen Production by Escherichia coli Using Brewery Waste: Optimal Pretreatment of Waste and Role of Different Hydrogenases. Renew. Energy 2018, 115, 931–936. [Google Scholar] [CrossRef]
  27. Trchounian, K.; Trchounian, A. Escherichia coli Hydrogen Gas Production from Glycerol: Effects of External Formate. Renew. Energy 2015, 83, 345–351. [Google Scholar] [CrossRef]
  28. Maeda, T.; Sanchez-Torres, V.; Wood, T.K. Enhanced Hydrogen Production from Glucose by Metabolically Engineered Escherichia coli. Appl. Microbiol. Biotechnol. 2007, 77, 879–890. [Google Scholar] [CrossRef]
  29. Gleizer, S.; Ben-Nissan, R.; Bar-On, Y.M.; Antonovsky, N.; Noor, E.; Zohar, Y.; Jona, G.; Krieger, E.; Shamshoum, M.; Bar-Even, A.; et al. Conversion of Escherichia coli to Generate All Biomass Carbon from CO2. Cell 2019, 179, 1255–1263.e12. [Google Scholar] [CrossRef]
  30. Aristidou, A.A.; San, K.-Y.; Bennett, G.N. Improvement of Biomass Yield and Recombinant Gene Expression in Escherichia coli by Using Fructose as the Primary Carbon Source. Biotechnol. Prog. 1999, 15, 140–145. [Google Scholar] [CrossRef]
  31. Piskarev, I.M.; Ushkanov, V.A.; Aristova, N.A.; Likhachev, P.P.; Myslivets, T.S. Establishment of the Redox Potential of Water Saturated with Hydrogen. Biophysics 2010, 55, 13–17. [Google Scholar] [CrossRef]
  32. Sołowski, G.; Konkol, I.; Cenian, A. Methane and Hydrogen Production from Cotton Waste by Dark Fermentation under Anaerobic and Micro-Aerobic Conditions. Biomass Bioenergy 2020, 138, 105576. [Google Scholar] [CrossRef]
  33. Raposo, F.; De la Rubia, M.; Borja, R.; Alaiz, M. Assessment of a Modified and Optimised Method for Determining Chemical Oxygen Demand of Solid Substrates and Solutions with High Suspended Solid Content. Talanta 2008, 76, 448–453. [Google Scholar] [CrossRef]
  34. Bradstreet, R.B. Kjeldahl Method for Organic Nitrogen. Anal. Chem. 1954, 26, 185–187. [Google Scholar] [CrossRef]
  35. DuBois, M.; Gilles, K.A.; Hamilton, J.K.; Rebers, P.A.; Smith, F. Colorimetric Method for Determination of Sugars and Related Substances. Anal. Chem. 1956, 28, 350–356. [Google Scholar] [CrossRef]
  36. Javanmardi, J. Antioxidant Activity and Total Phenolic Content of Iranian Ocimum Accessions. Food Chem. 2003, 83, 547–550. [Google Scholar] [CrossRef]
  37. Kumaran, A.; Karunakaran, R.J. Antioxidant Activity of Cassia Auriculata Flowers. Fitoterapia 2007, 78, 46–47. [Google Scholar] [CrossRef]
  38. Gevorgyan, H.; Abaghyan, T.; Mirumyan, M.; Yenkoyan, K.; Trchounian, K. Propionic and Valproic Acids Have an Impact on Bacteria Viability, Proton Flux and ATPase Activity. J. Bioenerg. Biomembr. 2023, 55, 397–408. [Google Scholar] [CrossRef]
  39. Vanyan, L.; Trchounian, K. Glucose Concentration Is Determinant for the Functioning of Hydrogenase 1 and Hydrogenase 2 in Regulating the Proton and Potassium Fluxes in Escherichia coli at PH 7.5. Biochimie 2024, 227, 205–216. [Google Scholar] [CrossRef]
  40. Zheng, Y.; Cheng, Y.-S.; Yu, C.; Zhang, R.; Jenkins, B.M.; VanderGheynst, J.S. Improving the Efficiency of Enzyme Utilization for Sugar Beet Pulp Hydrolysis. Bioprocess. Biosyst. Eng. 2012, 35, 1531–1539. [Google Scholar] [CrossRef]
  41. Desai, T.A.; Rao, C.V. Regulation of Arabinose and Xylose Metabolism in Escherichia coli. Appl. Environ. Microbiol. 2010, 76, 1524–1532. [Google Scholar] [CrossRef]
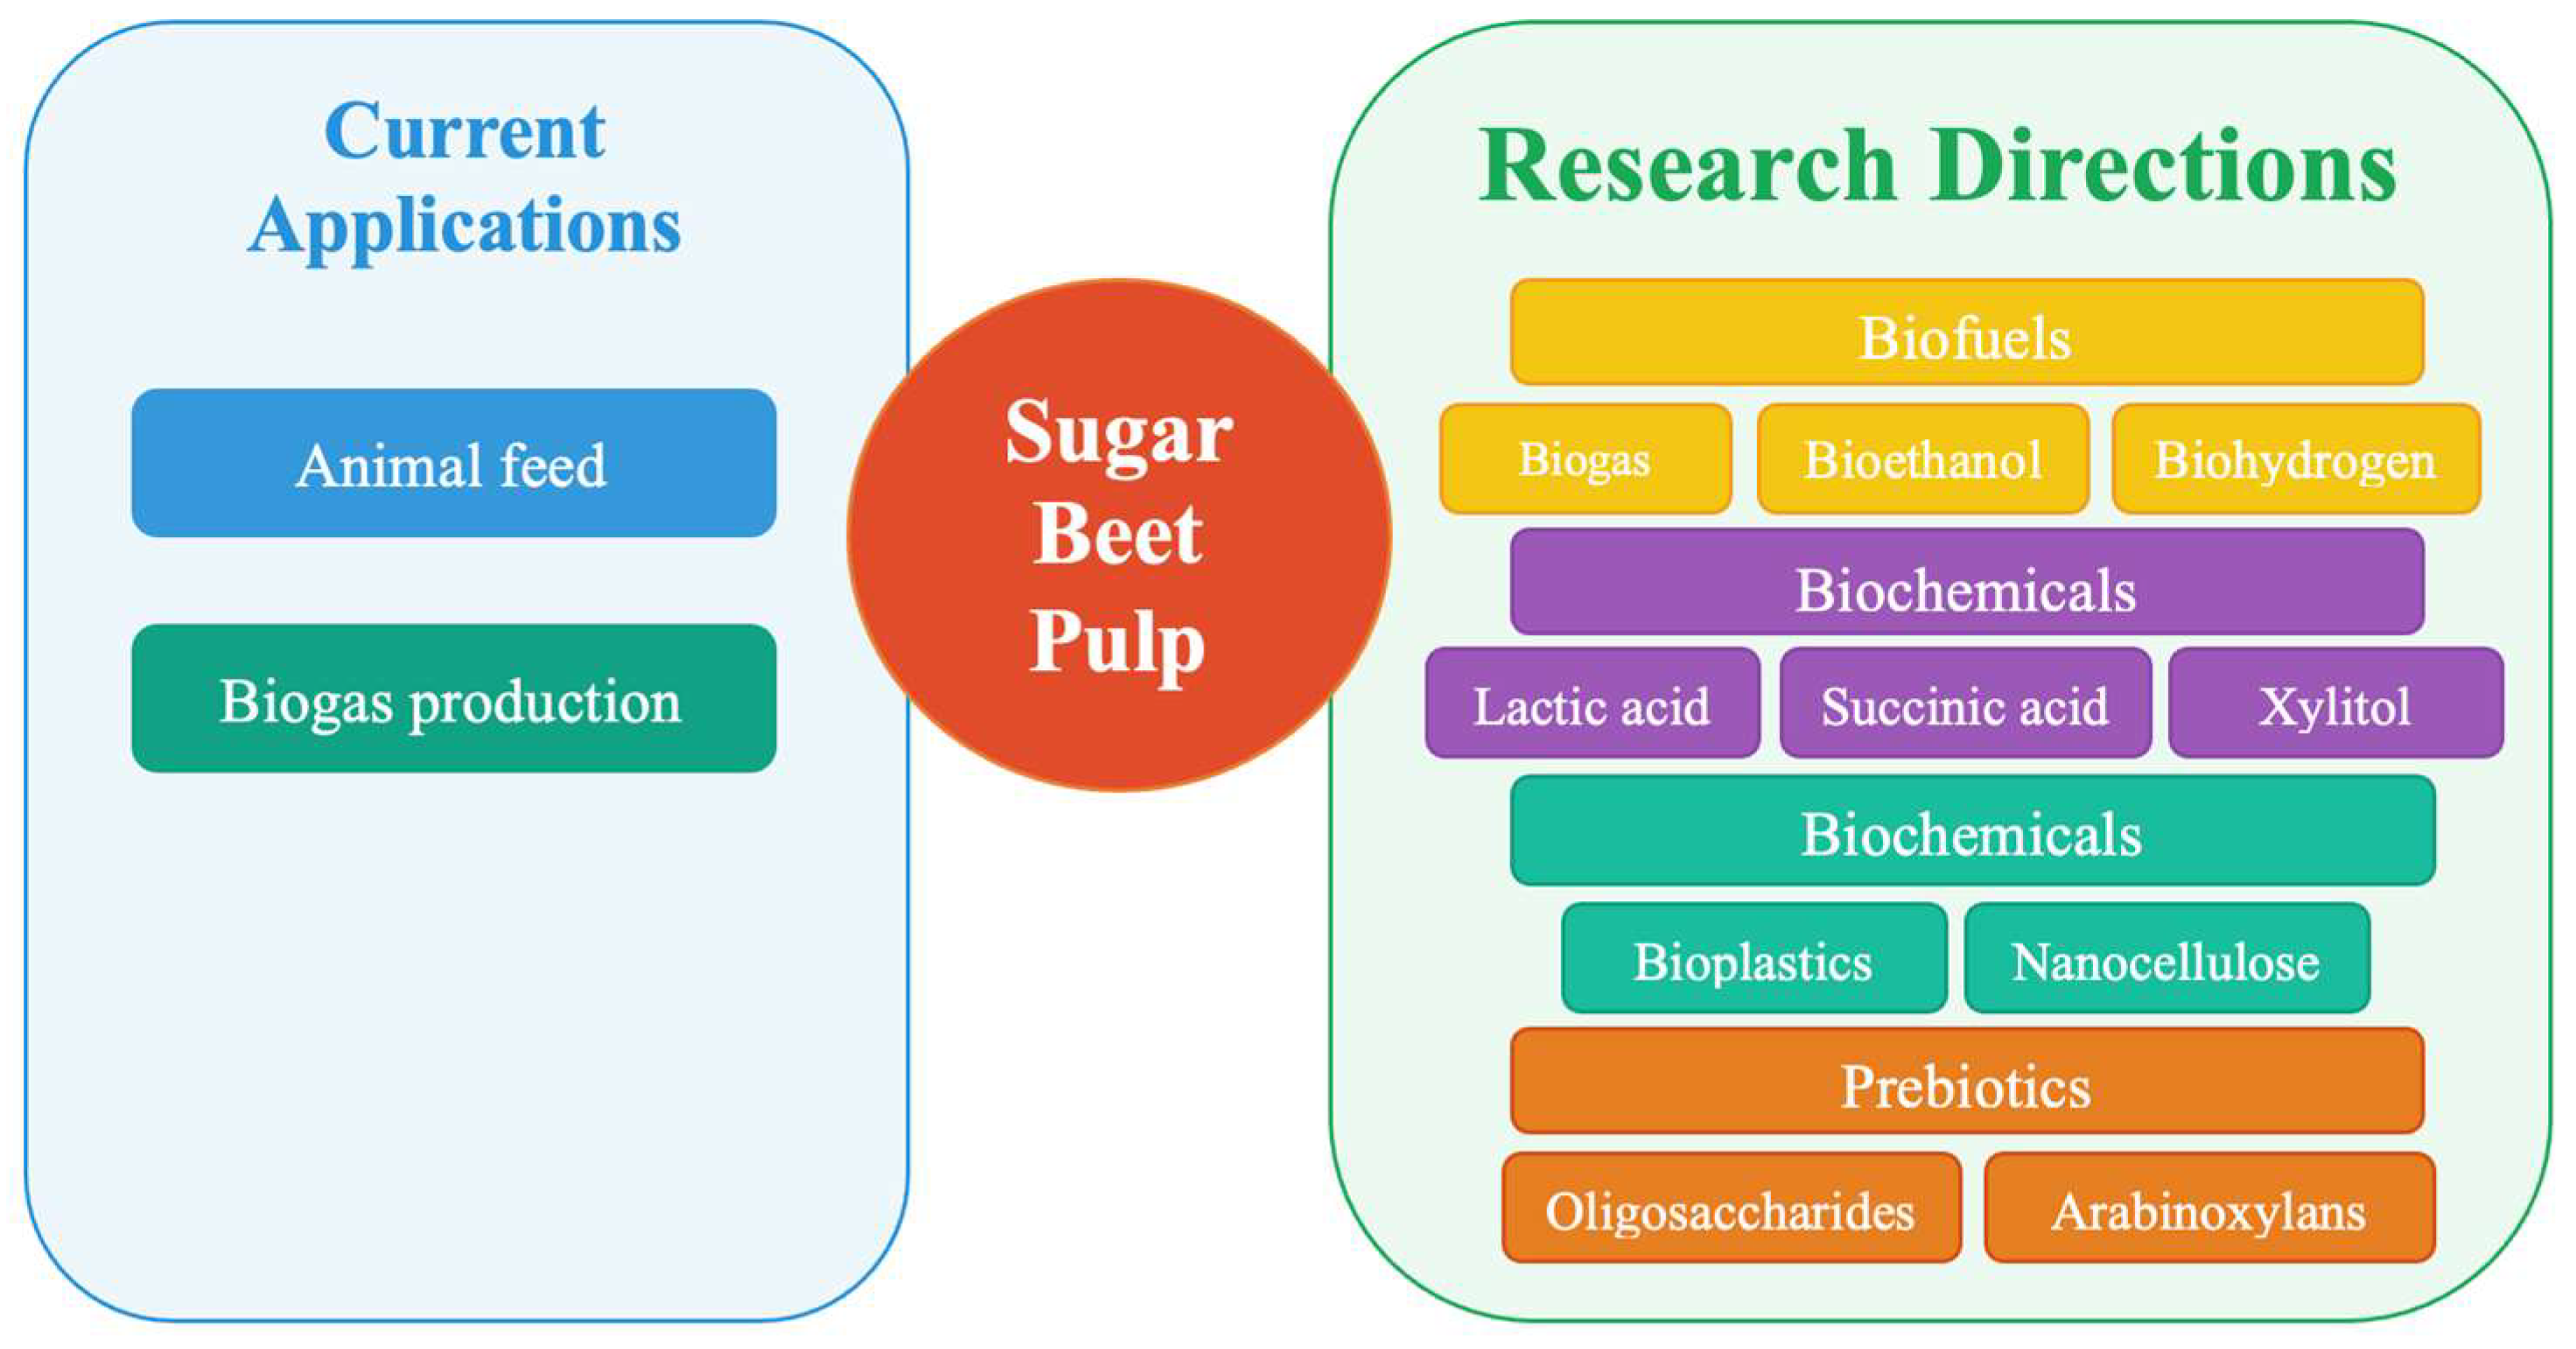
Figure 1. Current uses and research directions for sugar beet pulp (SBP). While SBP is mainly used for animal feed and biogas production, research is expanding into its use for biofuels, biochemicals, bioplastics, and prebiotics.
Energies 18 02648 g001
Figure 2. Relationship between ORP and H2 concentration. The scatter plot demonstrates the strong linear relationship between oxidation-reduction potential (ORP) and hydrogen gas concentration.
Energies 18 02648 g002
Figure 3. Sugar utilization and biomass production of E. coli wild-type (WT) and septuple mutant (SM) strains during batch fermentation of sugar beet pulp (SBP) hydrolysate. Experiments were conducted at two hydrolysate concentrations (30 and 50 g·L−1) with varying dilution factors (0×, 2×, 5×) and in the presence or absence of glycerol (+glyc). Blue bars represent total sugar concentration, orange bars indicate residual sugar after fermentation, and green bars show biomass production (right y-axis). Data represent mean ± standard deviation from triplicate experiments.
Energies 18 02648 g003
Figure 4. Oxidation-reduction potential (ORP) changes during batch growth of E. coli wild type using SBP hydrolysates at concentrations of 30 g L−1 (a) and 50 g L−1 (b). ORP values, measured in millivolts (mV), reflect the reducing environment of the fermentation medium throughout the 168 h cultivation period. Experiments were conducted at 37 °C under anaerobic conditions using six different media formulations for each hydrolysate concentration: three dilution factors (0×, 2×, 5×), each tested both with and without glycerol supplementation. Blue lines represent conditions without glycerol, while red lines indicate glycerol-supplemented cultures. Error bars indicate standard deviation from triplicate experiments. For detailed experimental procedures, see Section 2.
Energies 18 02648 g004
Figure 5. Oxidation-reduction potential (ORP) changes during batch growth of E. coli septuple mutant using SBP hydrolysates at concentrations of 30 g L−1 (a) and 50 g L−1 (b). ORP values, measured in millivolts (mV), reflect the reducing environment of the fermentation medium throughout the 168 h cultivation period. Experiments were conducted at 37 °C under anaerobic conditions using six different media formulations for each hydrolysate concentration: three dilution factors (0×, 2×, 5×), each tested both with and without glycerol supplementation. Blue lines represent conditions without glycerol, while red lines indicate glycerol-supplemented cultures. Error bars indicate standard deviation from triplicate experiments. For detailed experimental procedures, see Section 2.
Energies 18 02648 g005
Table 3. Characteristics of SBP hydrolysate (without dilution).
30 g L−1 SBP50 g L−1 SBP
Total phenolics (mg GAE g solids−1)0.1160.0921
Total flavonoids (mg (QE) g solids−1)0.12040.213
COD (mg O2 L−1)15,461.633,332.8
Total nitrogen (mg (100 mL)−1)15.8380617.25892
Total sugar (mg (mL)−1)6.54354811.41742
Total solids [%FM]7772
Volatile solids [% TS]2631
Table 4. C/N ratio during batch fermentation of SBP by E. coli.
SBP g L−1DilutionGlycerolC:N Ratio StartC:N Ratio 24 h—BW25113C:N Ratio—Septuple Mutant
30Glyc−36.7 ± 1.115.9 ± 0.526.20 ± 0.79
Glyc+53.1 ± 1.649.0 ± 1.540.40 ± 1.21
Glyc−21.5 ± 0.644.1 ± 1.313.00 ± 0.39
Glyc+83.4 ± 2.553.8 ± 1.676.40 ± 2.29
Glyc−64.6 ± 1.970.9 ± 2.120.40 ± 0.61
Glyc+291.0 ± 14.7161.3 ± 4.862.00 ± 1.86
50Glyc−72.2 ± 2.228.9 ± 0.931.00 ± 0.93
Glyc+117.0 ± 3.546.2 ± 1.449.20 ± 1.48
Glyc−78.7 ± 2.437.7 ± 1.120.74 ± 0.62
Glyc+108.0 ± 3.275.6 ± 2.371.00 ± 2.13
Glyc−74.0 ± 2.27.2 ± 0.227.00 ± 0.81
Glyc+166.0 ± 5.043.3 ± 1.345.70 ± 1.37
Table 5. Maximum H2 yield during batch fermentation.
StrainHydrolysate (SBP)Dilution FactorGlycerol ConditionH2 Yield (mmol/L)H2 per g Waste Added (mmol/g Waste)H2 per Gram Sugar (mmol/g Sugar)
BW2511330 g L−1Glyc-0.70 ± 0.020.05 ± 0.0020.289 ± 0.008
Glyc+0.78 ± 0.020.02 ± 0.00063.6 ± 0.108
Glyc-1.49 ± 0.040.25 ± 0.0071.49 ± 0.045
Glyc+1.5 ± 0.050.25 ± 0.0073.78 ± 0.113
50 g L−1Glyc-1.36 ± 0.040.05 ± 0.0030.37 ± 0.011
Glyc+1.37 ± 0.040.055 ± 0.0031.82 ± 0.054
Glyc-2.16 ± 0.060.864 ± 0.012.126 ± 0.06
Glyc+3.57 ± 0.110.36 ± 0.024.17 ± 0.125
Septuple mutant30 g L−1Glyc-1.4 ± 0.040.09 ± 0.0030.7 ± 0.02
Glyc+1.36 ± 0.040.09 ± 0.0037.23 ± 0.22
Glyc-1.4 ± 0.040.23 ± 0.0071.22 ± 0.036
Glyc+3.57 ± 0.110.28 ± 0.00912.06 ± 0.36
50 g L−1Glyc-1.49 ± 0.040.06 ± 0.0060.4 ± 0.012
Glyc+3.54 ± 0.110.14 ± 0.015.8 ± 0.174
Glyc-0.81 ± 0.020.08 ± 0.0020.416 ± 0.012
Glyc+3.57 ± 0.110.36 ± 0.0074.134 ± 0.12
Disclaimer/Publisher’s Note: The statements, opinions and data contained in all publications are solely those of the individual author(s) and contributor(s) and not of MDPI and/or the editor(s). MDPI and/or the editor(s) disclaim responsibility for any injury to people or property resulting from any ideas, methods, instructions or products referred to in the content.