1. Introduction
Global warming has emerged as one of the greatest contemporary challenges in terms of sustainability, driven largely by the accelerated increase in population and the widespread dependence on fossil fuels as primary sources of energy (coal, oil and natural gas). Recent data indicate that the oil and gas sector accounts for around 15% of greenhouse gas emissions linked to energy use, while the industrial sector generates around 25% of these emissions. These figures show the urgency of promoting cleaner technologies in the supply and transformation of energy, paying special attention to the electrification of chemical processes [
1]. Electrification involves replacing conventional heating and power systems, based on fossil fuels, with technologies powered by electricity (for example, heat pumps, electric heaters or electric vehicles) that, combined with a decarbonized electricity generation matrix, can reduce both energy demand and atmospheric emissions [
2].
Previous literature review studies [
3] have identified significant benefits of using a heat pump for the energy efficiency of a facility and its application in distillation columns.
In this scenario, the implementation of innovative industrial processes that take advantage of
as a raw material and the use of renewable energy for the production of fuels and petrochemicals becomes relevant. In particular, the production of methanol from natural gas and captured
(through carbon capture and use, CCU) emerges as an alternative of great strategic value. Methanol is a key compound in the chemical industry, used as an input in the production of plastics, paints, adhesives and solvents, among others. In addition, its application is being investigated as a fuel with a higher octane rating for internal combustion engines and reduced emissions of particulate matter [
4,
5] and as a hydrogen carrier for fuel cells [
6]. These characteristics have promoted sustained growth in the demand for methanol at a global level, exceeding 120 million metric tons annually and with prospects of an increase of 2–3% annually [
7]. However, countries such as Colombia cover 100% of their demand (estimated at 70 thousand metric tons per year) through imports [
8,
9], which opens up business opportunities to satisfy the internal supply with local production.
In the Colombian case, the Magdalena Medio Refinery, located in Barrancabermeja, processes about 250 kbpd and provides more than 50% of the automotive fuels used in the country. Currently, the refinery operates three steam methane reforming (SMR) units to produce high-purity hydrogen (97–99% mol), used in the hydrotreatment process of heavy residues. Faced with projections of decarbonization, energy transition and possible natural gas surpluses, the refinery is exploring alternatives for the production of “cleaner fuels” and the valorization of residual streams. In this sense, the reconversion of one of the SMR plants —with a capacity of 14 MMSCFD of hydrogen— into a methanol production unit constitutes a particularly attractive technological and market option.
The conversion proposal proposes substantial changes in the process, integrating
capture (CCU) by amines (DEA) [
10] and partial electrification of the distillation stage through a heat pump (HP). The heat pump, with propane as a working fluid [
11,
12], uses electrical energy (ideally from renewable sources) to redistribute heat from the top to the bottom of the distillation column, reducing steam consumption and dependence on furnaces or boilers that burn fossil fuels. Estimates from different studies indicate that these energy recovery and utilization schemes can reduce the total energy demand in the distillation process by 30% to 45% [
13]. Added to this are the environmental advantages of replacing traditional fuels with electricity from clean sources, reducing
emissions and other atmospheric pollutants.
The comprehensive evaluation of the proposal, which involves the reformulation of the steam reforming (SMR) process, the addition of captured
and the electrification of the distillation column were carried out through simulations in Aspen HYSYS and life cycle analysis (LCA) according to the standardized methodology [
14]. To assess the environmental impact of the methanol process [
15,
16,
17], global warming indicators, non-renewable resource consumption, respirable inorganic emissions and carcinogenic potential were selected, which allow quantifying the ecological footprint and comparing it with a conventional methanol plant based on combined reforming (CR) [
18]. The results illustrate the energy viability and the benefits of emissions reduction (especially
) offered by the use of the heat pump and photovoltaic renewable energy, in addition to the incorporation of carbon capture in the global methanol production scheme.
This article, therefore, addresses the conversion of an industrial hydrogen unit into a methanol plant with a lower carbon footprint, analyzing its technical challenges, environmental benefits and business prospects for the Colombian market. The structure of this document is organized into four main sections: the Introduction, where the relevance of the problem is framed and the theoretical and contextual bases are presented; Materials and Methods, describing the
capture configuration, heat pump design, process modeling in Aspen HYSYS and the life cycle analysis approach; Results, with energy balance data, methanol yields and environmental assessment in terms of various impact categories; and, finally, Conclusions, where the implications of the proposal and its possible application in the Colombian industrial environment are discussed. The aim is to provide a technological solution that combines the use of existing resources [
19,
20], the capture and use of
and the partial electrification of key operations, in order to promote more efficient and sustainable chemical processes in the medium- and long-term.
2. Materials and Methods
The analysis and results of the methanol production processes in this study were carried out and obtained through a commercial process simulation software. The processes evaluated are a conventional methanol production unit of CR technology, which, in this work, is called the base case; and a proposed methanol production unit, which is developed from the modification of a real plant, which was originally designed for the production of hydrogen through SMR technology in an oil refinery in Colombia. This plant additionally includes a heat pump. Both processes incorporate a carbon capture unit that uses the flue gases from the main reforming furnace to use
as raw material. The methodology was developed in 5 stages: (i) the modeling and simulation of the carbon capture units; (ii) the modeling and simulation of the methanol production processes, obtaining of the mass and energy balances; (iii) the analysis and evaluation of the incorporation of the heat pump into the distillation column of the proposed process; (iv) the basis for the life cycle analysis (LCA) using ISO 14040 standardized methodology [
14], which will determine the potential environmental impacts of the evaluated processes considering the results obtained in (ii); and the last stage (v) considers an experimental test developed to determine the real energy demand required for the methanol–water separation conditions in situ, which allows refining the energy models of the simulation and sizing of the heat pump in the distillation column.
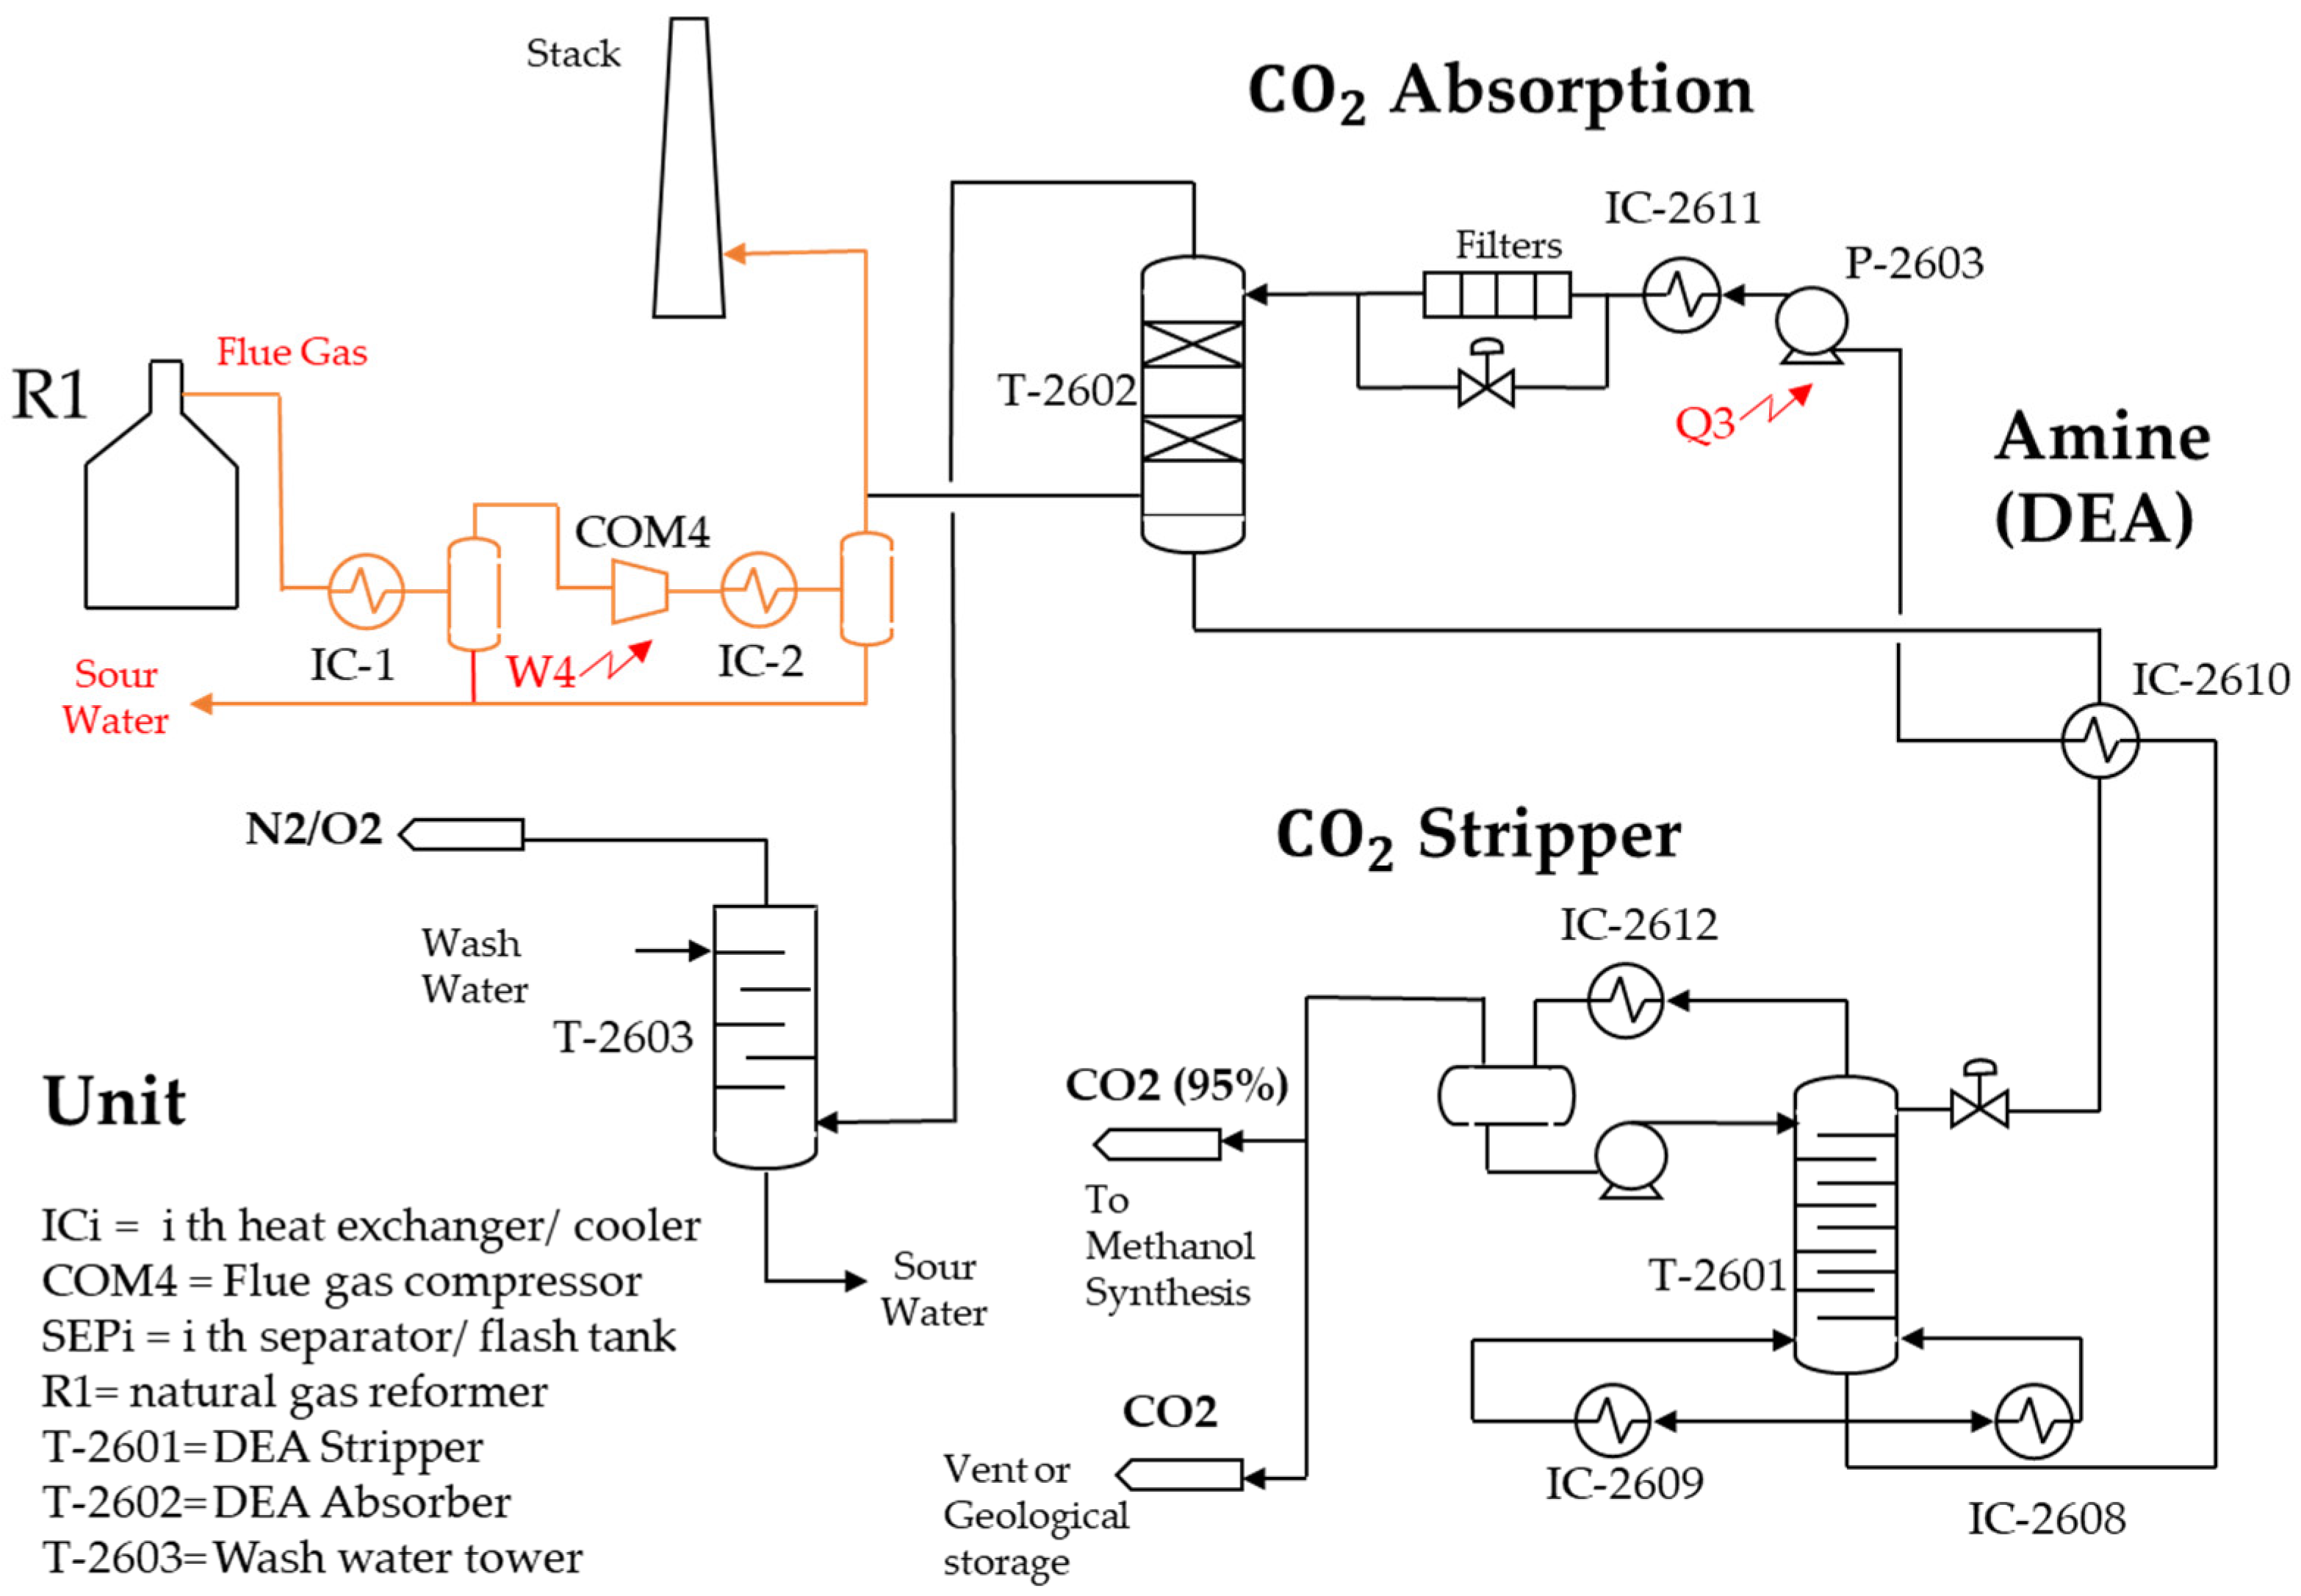
2.1. Carbon Capture Evaluation
The raw material used in the methanol
synthesis process comes from 3 main sources: flue gas from the natural gas reformer, internal suppliers of the refinery and
produced in the SMR process. The process is simulated by ASPEN HYSYS using DEA (diethanolamine) as a solvent, which, by having two amine groups, improves the
absorption capacity compared to MEA (mono-ethanolamine) [
21] and MDEA (methyl diethanolamine) [
22].
Figure 1 shows the carbon capture unit modified for this study, which is made up of the flue gas compression system (COM4) from the chimney of the reformer furnace R1, the absorption column (T-2602) with DEA composed of 20 stages, the stripping column (T-2601) with 21 stages and a column for gas washing (T-2603) with water with 10 stages, whose objective is to limit the possible DEA entrainments that may occur with the gas circulation.
The operating conditions established for the absorption column are, on average, 18 bar and 38–70 °C, while for the stripper, they range from 1.4 to 2.2 bar, with temperatures ranging between from 98 and 134 °C in the top and bottom.
The chemistry of the capture unit is given by the reactions (Reactions (1)–(5)) in equilibrium, which are calculated from the Gibbs free energies and obtained from the literature [
23]. For the case of the rate-controlled reactions (Reactions (6)–(9)), the simplified power law (10) was used.
In Equation (10),
r is the reaction rate;
k is the pre-exponential factor;
T is the temperature (absolute); n is the exponent for the temperature; R the gas constant;
Ci is the concentration;
is the number of components in the reaction; and
is the stoichiometric coefficient of the components. The kinetic parameters for reactions (6)–(9) are given in
Table 1 [
24,
25], which were supplied from the literature.
The composition of the inlet gas stream to the carbon capture unit is shown in
Table 2. It was obtained from tests carried out in the chimney of the SRM process furnace, which was adapted in this study to capture
and synthesize methanol. The SMR process generates high greenhouse gas emissions by its nature [
26,
27].
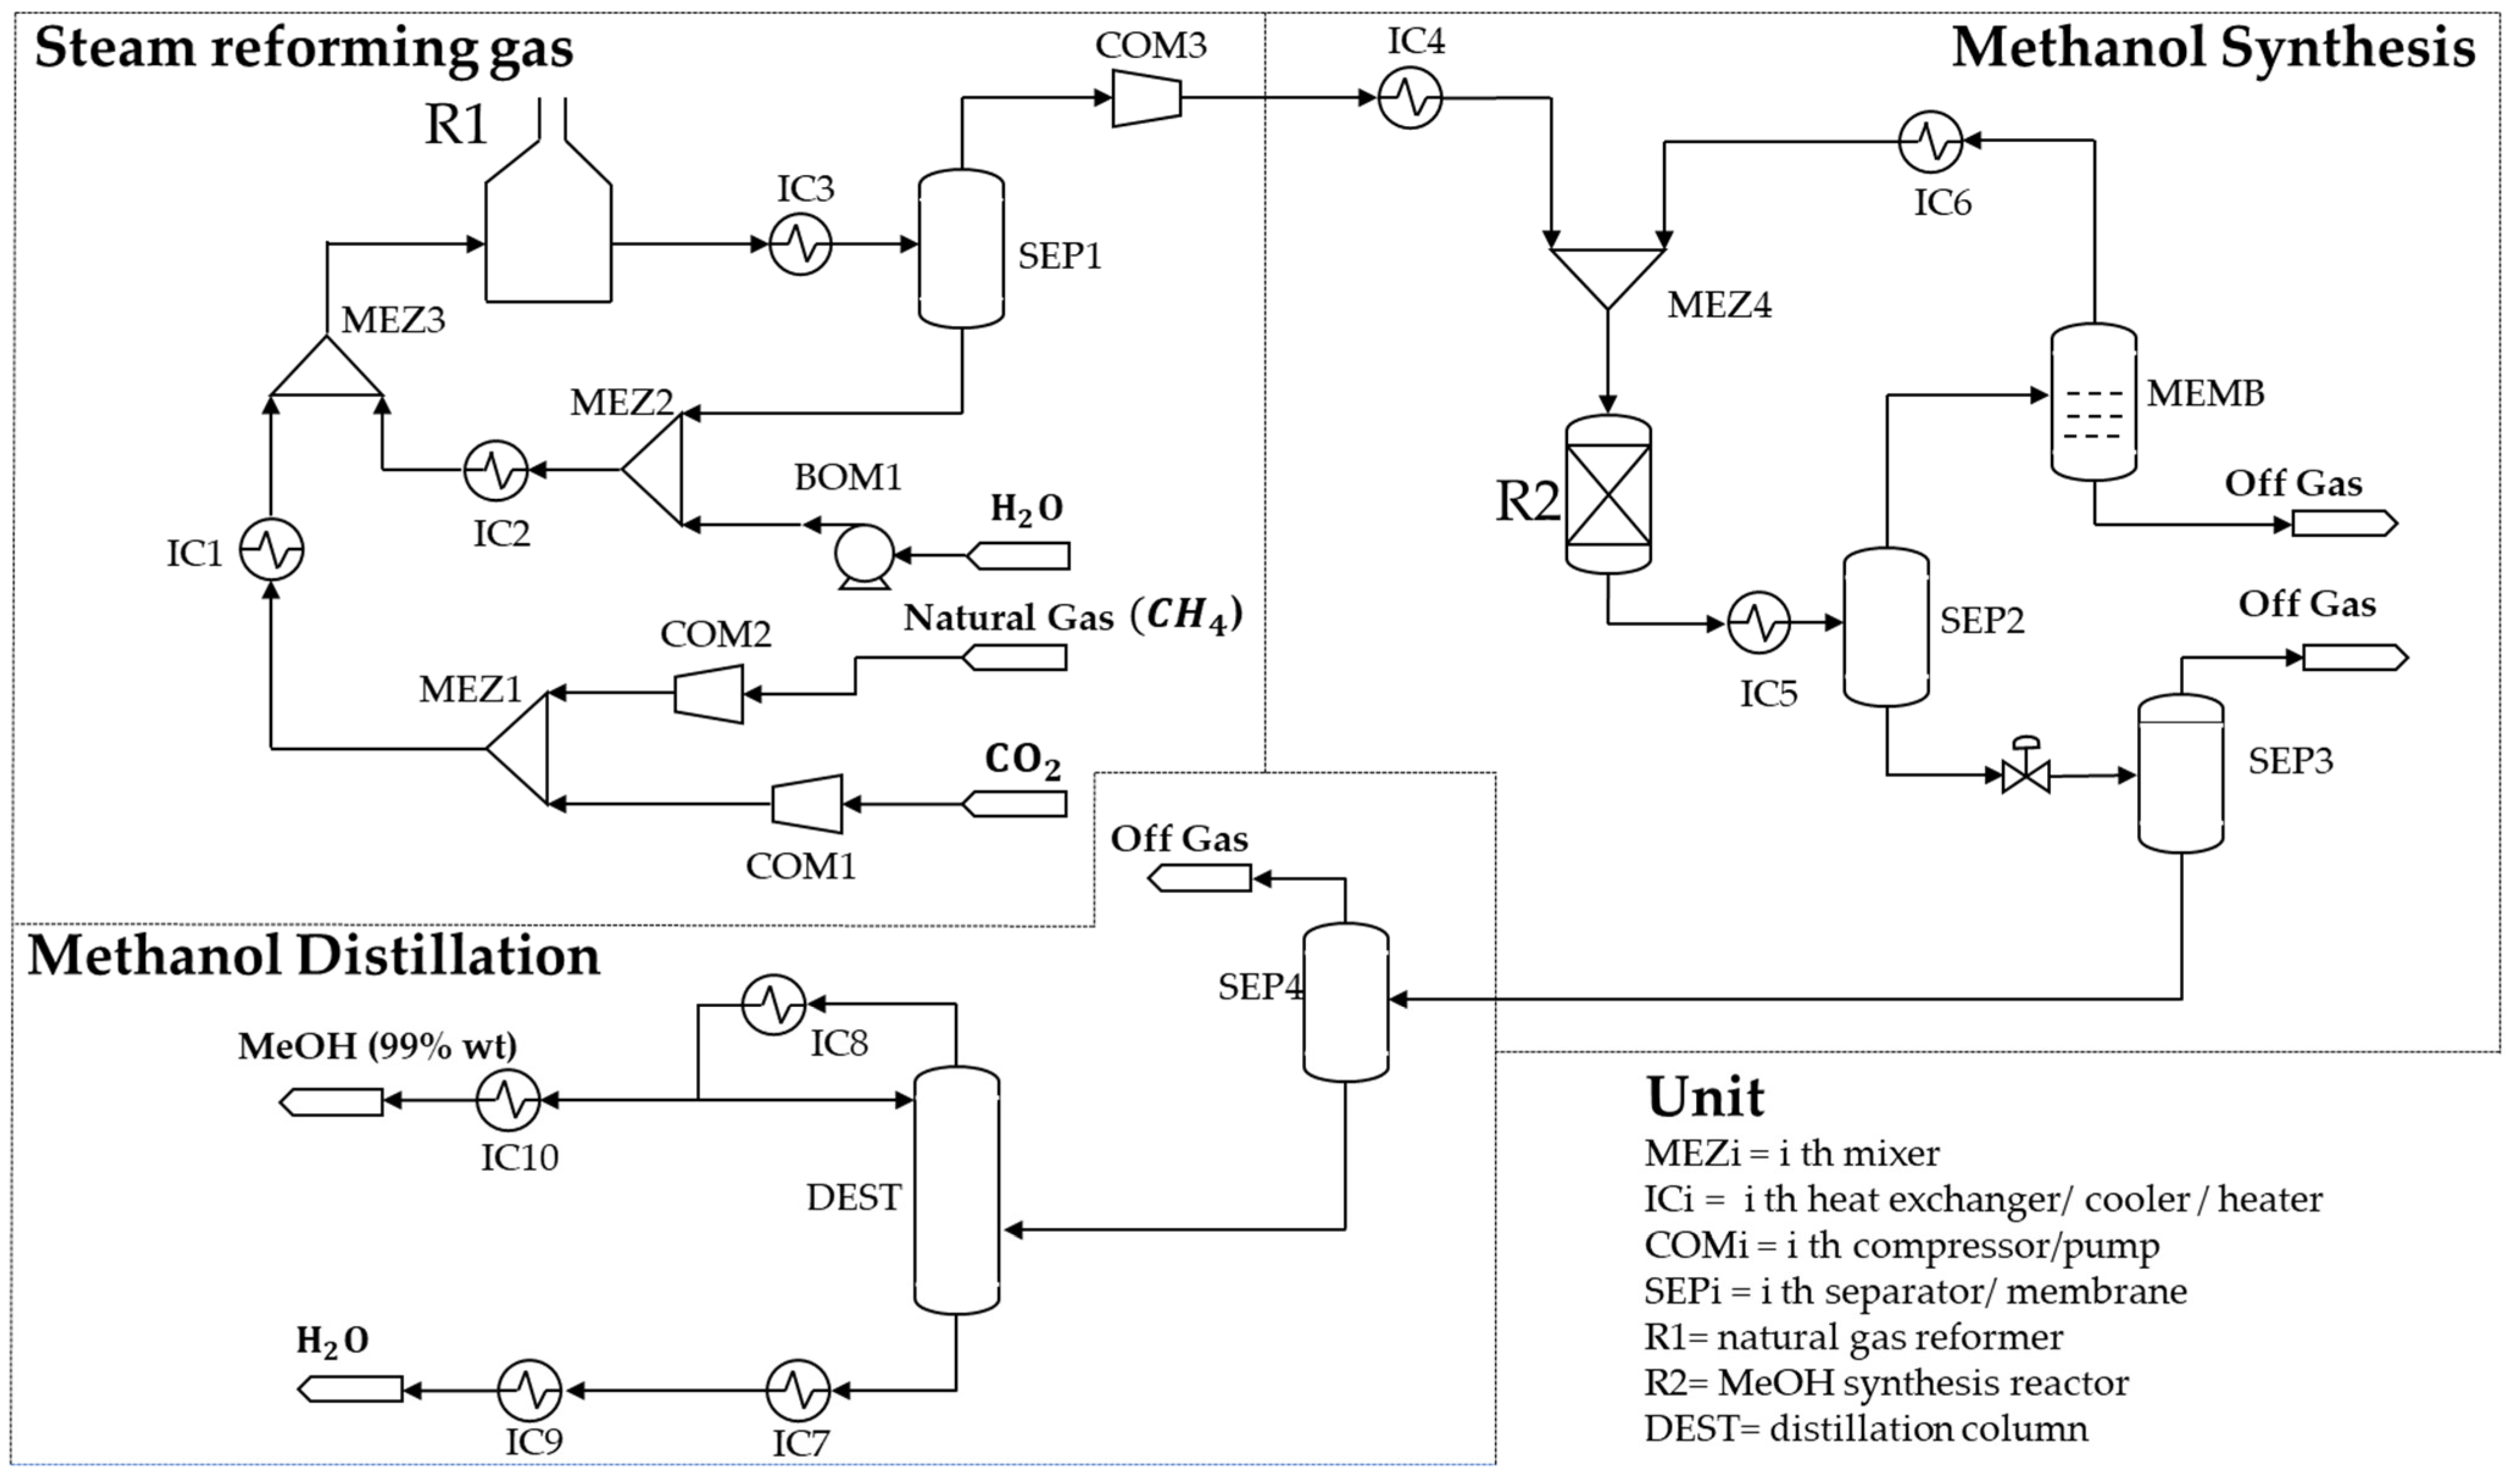
2.2. Methanol (MeOH) Production
The MeOH production process for this comparative study (
Figure 2) is part of various trends towards the development of “greener” products [
28], which is obtained from the transformation of natural gas in three stages: (1) natural gas reforming, (2) MeOH synthesis and (3) the MeOH distillation process.
The conceptual design simulates a medium-sized MeOH production facility for approximately 190 tonnes per day with a purity of 99.8 wt.
The first stage may have some technological variants depending on the type of chemical design. For the process design defined for the base case, the so-called combined reforming (CR) is applied, which consists of a dry reforming reaction (DR) (Reaction (11)) [
29], a wet reforming reaction (SR) (Reaction (12)) and a water–gas-shift (WGS) mechanism (Reaction (13)) [
30]. These reactions are highly dependent on the
/
ratio, where, at ratios higher than 0.7, the yield towards carbon production is significantly reduced [
31], which decreases the formation of undesirable coke for the plant catalyst [
32]; the
/CO ratio (17) also increases, reducing the conversion of
, increasing its presence downstream of the system.
Experimental experience indicates that setting a / ratio of at least 2.0 allows for an adequate balance between the /CO ratio and the conversion of .
The second stage of the methanol production process is the synthesis of MeOH through a CO−
hydrogenation process (Reactions (14)–(16) [
33,
34,
35].
For this type of reaction, it is convenient to adjust the optimal stoichiometric ratio, which has been determined for H/C at 2.5 and for
/CO at 0.5. These values avoid significant deactivation of the synthesis catalyst due to the effects of water formation [
36] on the active surface of the catalyst. In industrial plants,
/CO ratios ranging up to 3.5 are typically used [
37].
The operational and technical information for the simulated base case plant was obtained from previous literature studies by Olah et al. [
18], Canete et al. [
31] and Chao et al. [
38].
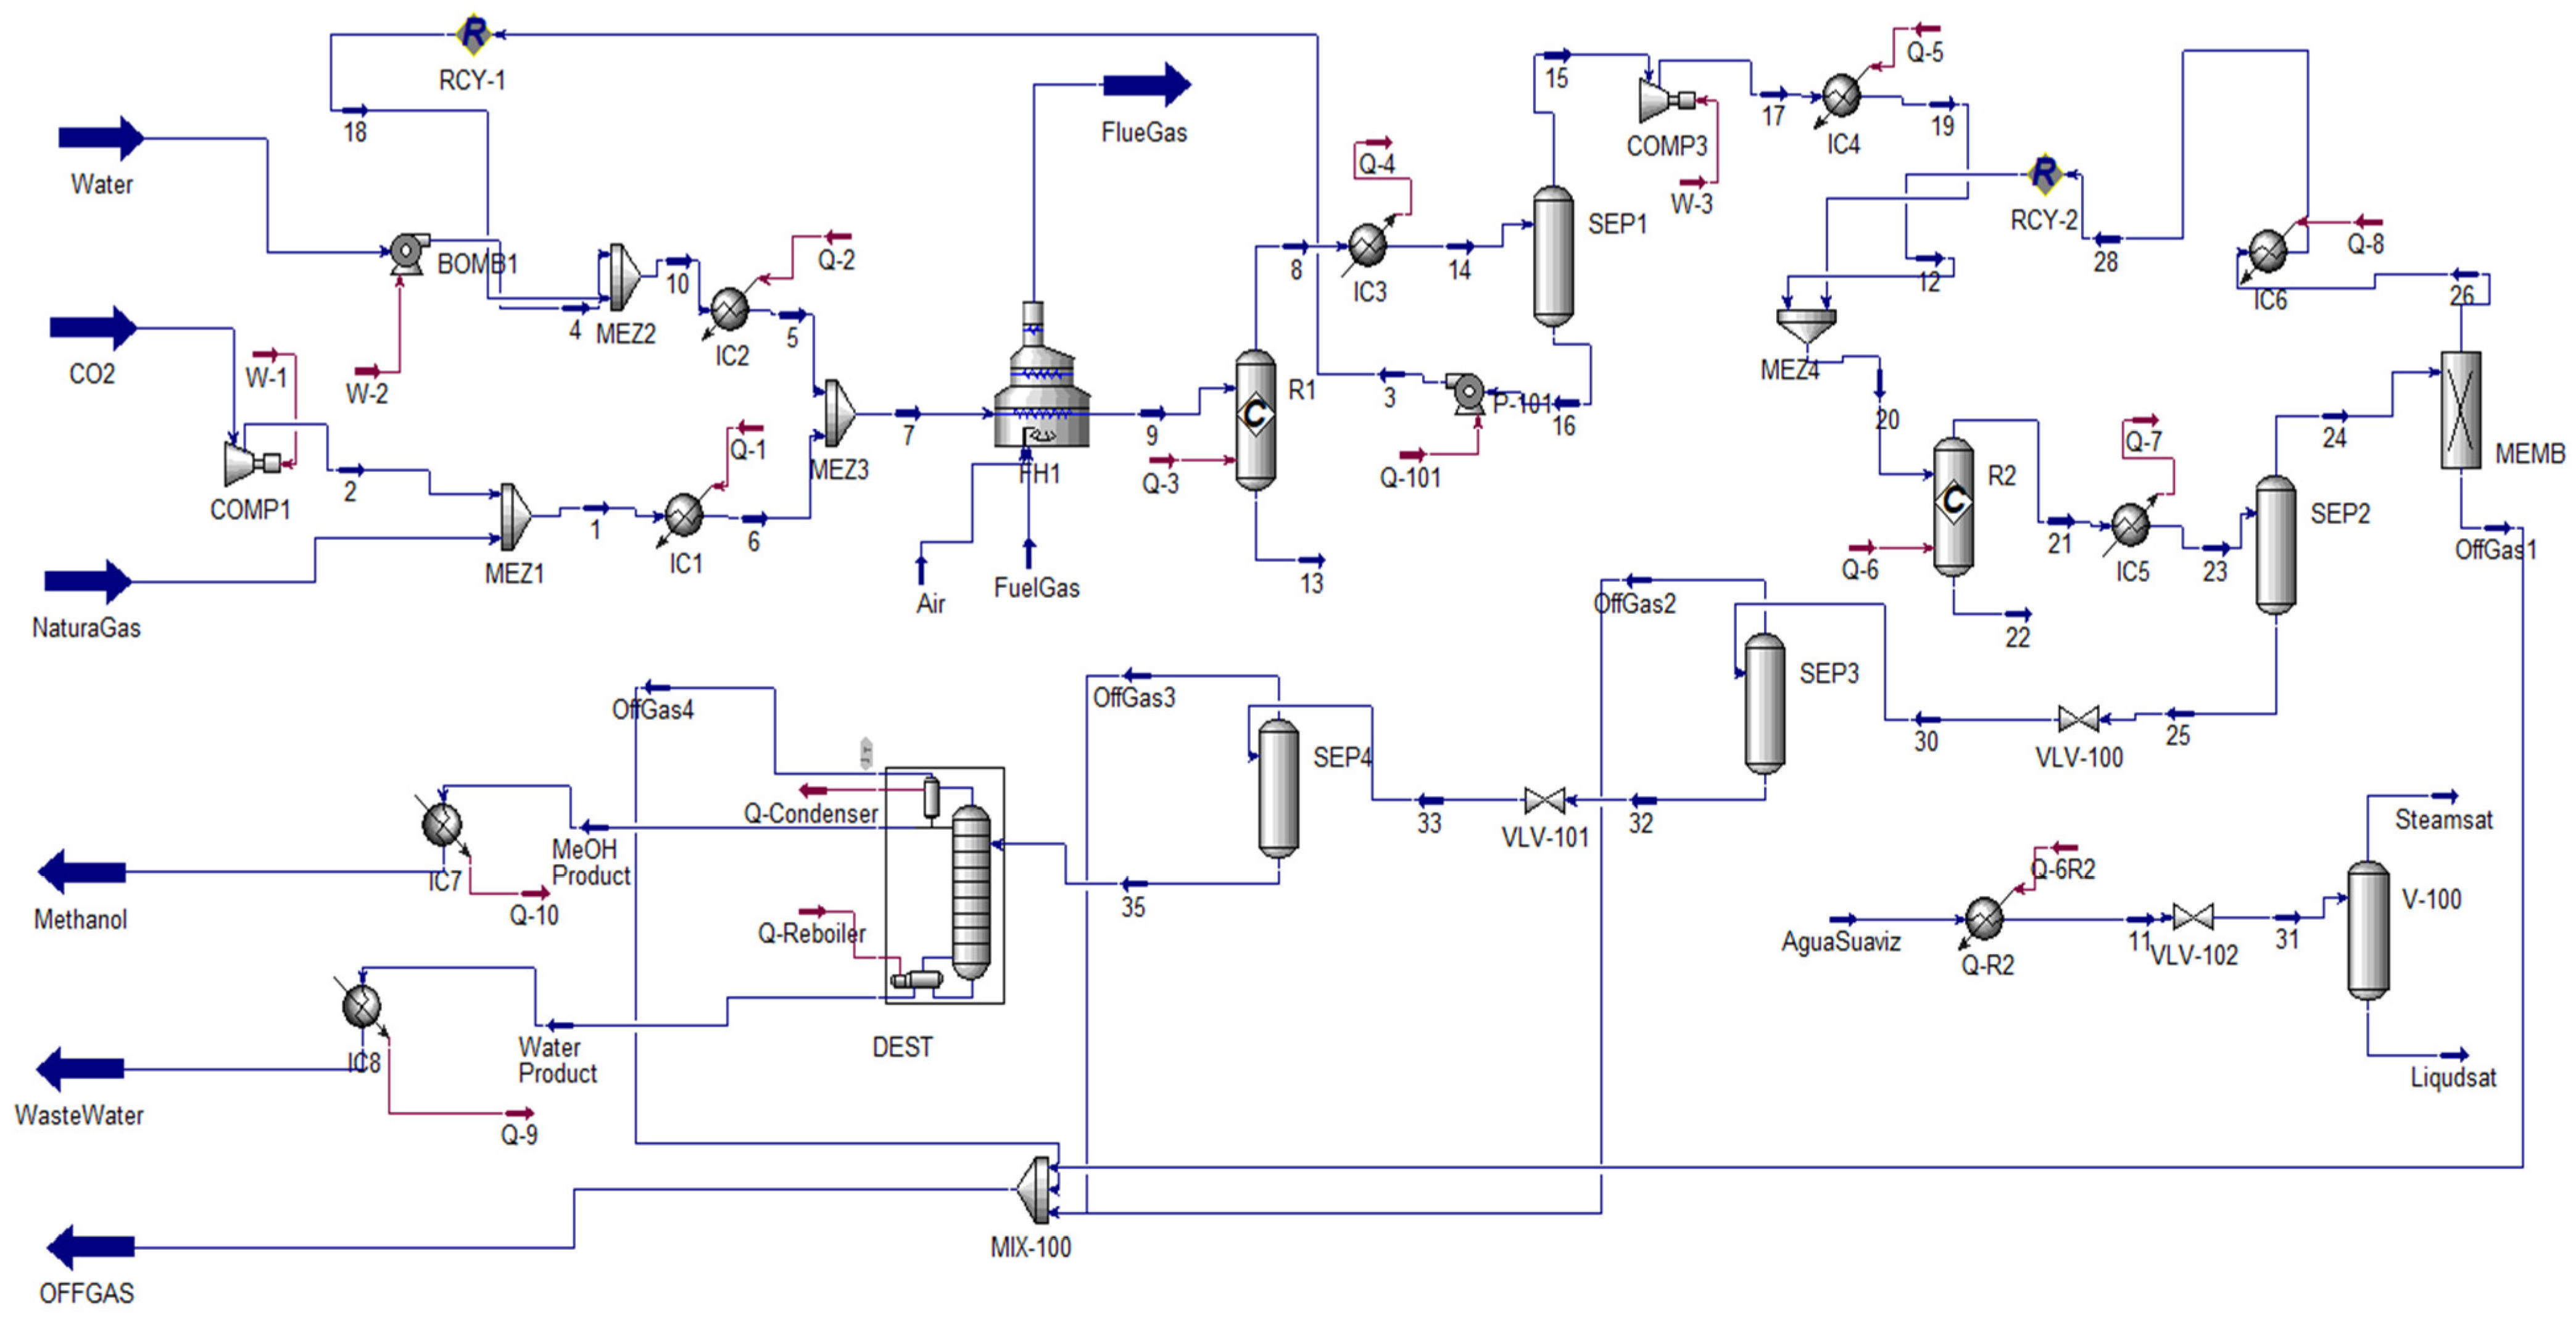
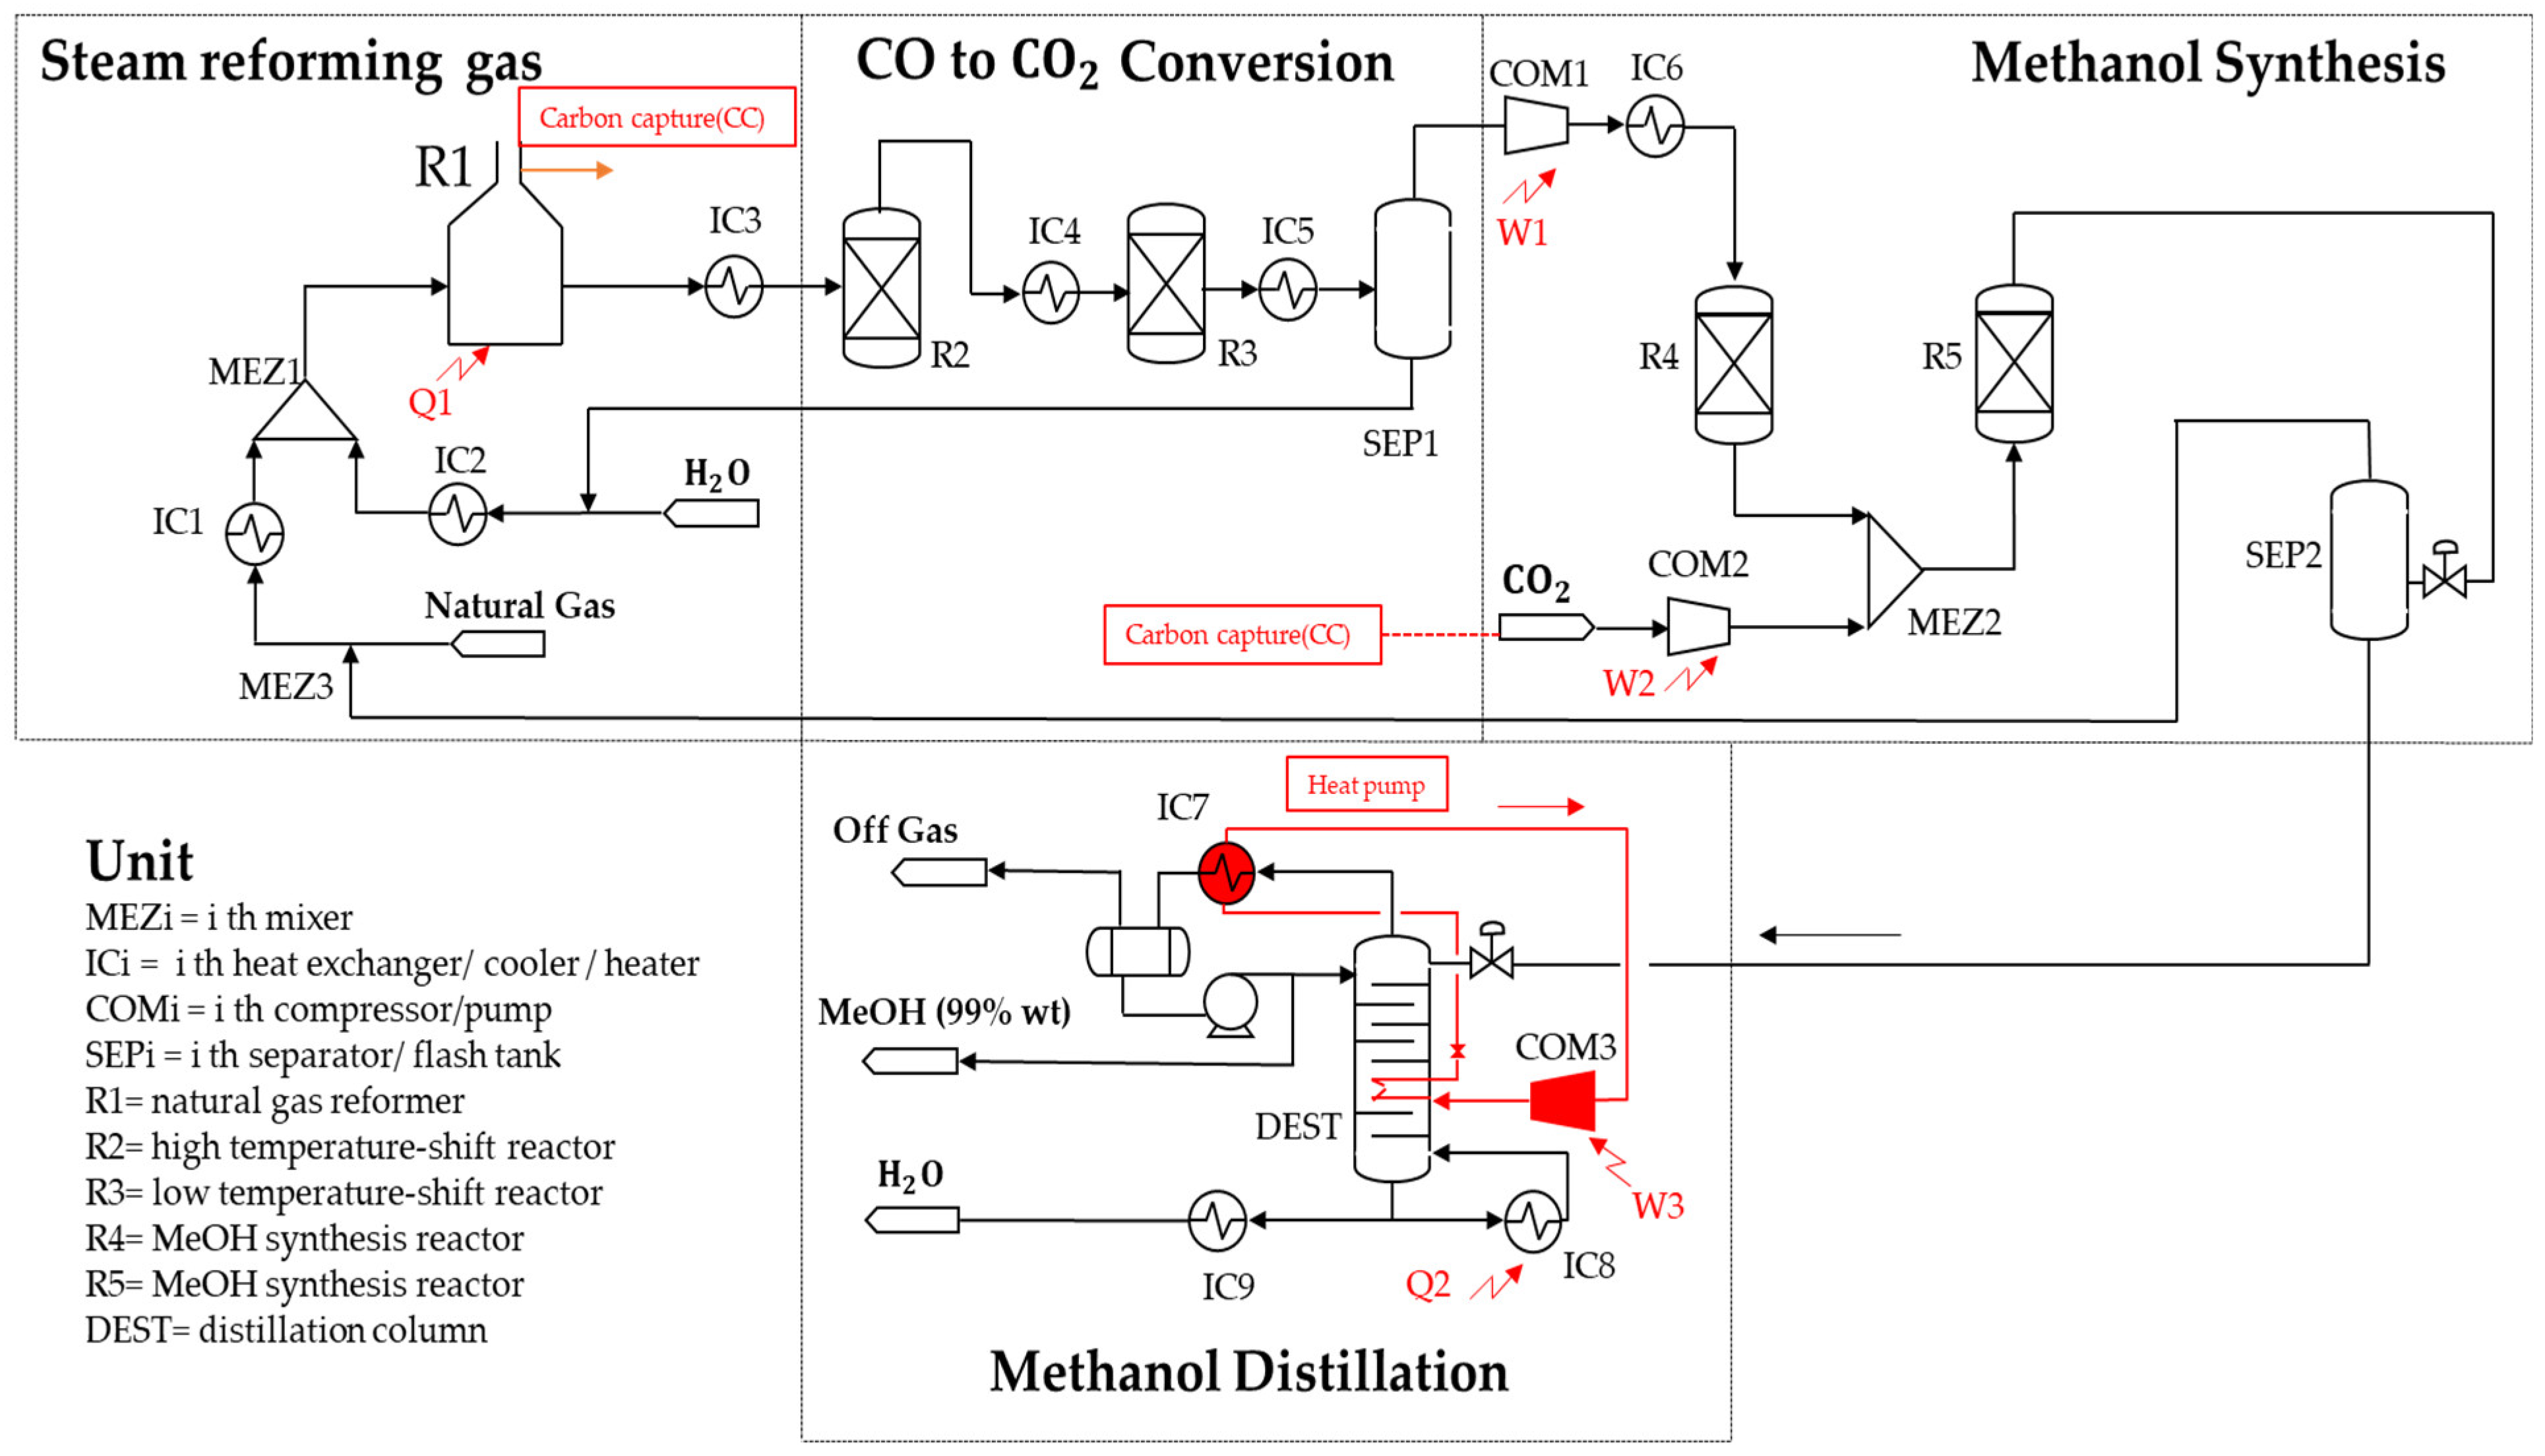
The proposed methanol production process (
Figure 3), unlike the base case, involves 4 process stages, which comprise (1) natural gas steam reforming, (2) CO to
conversion, (3) MeOH synthesis and (4) the MeOH distillation process.
The process starts with a conventional SRM stage similar to that defined for a hydrogen production plant, which is expressed by Reactions (11) and (12) in R1 (830 °C), followed by a CO to conversion stage at high (383 °C) and low temperatures (208 °C), which allows an increase in the composition of and in the stream (Reaction (13)) that goes to the methanol reactors. The synthesis gas that is produced in the conversion reactors (R2–R3) is then compressed (COM1) to the optimal conditions required for the methanol synthesis stage (R4–R5), which is carried out by two catalytic stages with the external addition of , which comes from the carbon capture unit or from other suppliers of the refinery. The gas produced by the exothermic reaction is cooled and condensed (SEP2) and then enters the distillation separation stage (DEST) of the methanol–water mixture.
Steam reforming (R1) is simulated in HYSYS as a 90% conversion reactor whose data reproduce the composition of the gas produced in a real reforming plant.
The CO to conversion stage is simulated by (2) equilibrium reactors (Reaction (13)) and the methanol synthesis in (2) conversion reactors arranged in a series and complemented with a recirculation loop to the reforming stage. According to the literature and laboratory data, the methanol synthesis reaction from at the specified operational conditions (50–70 bar-255 °C) can be between 20 and 25%, which is why it is required in the design to install a recirculation line (loop), which allows reaching conversions in the system higher than 90%.
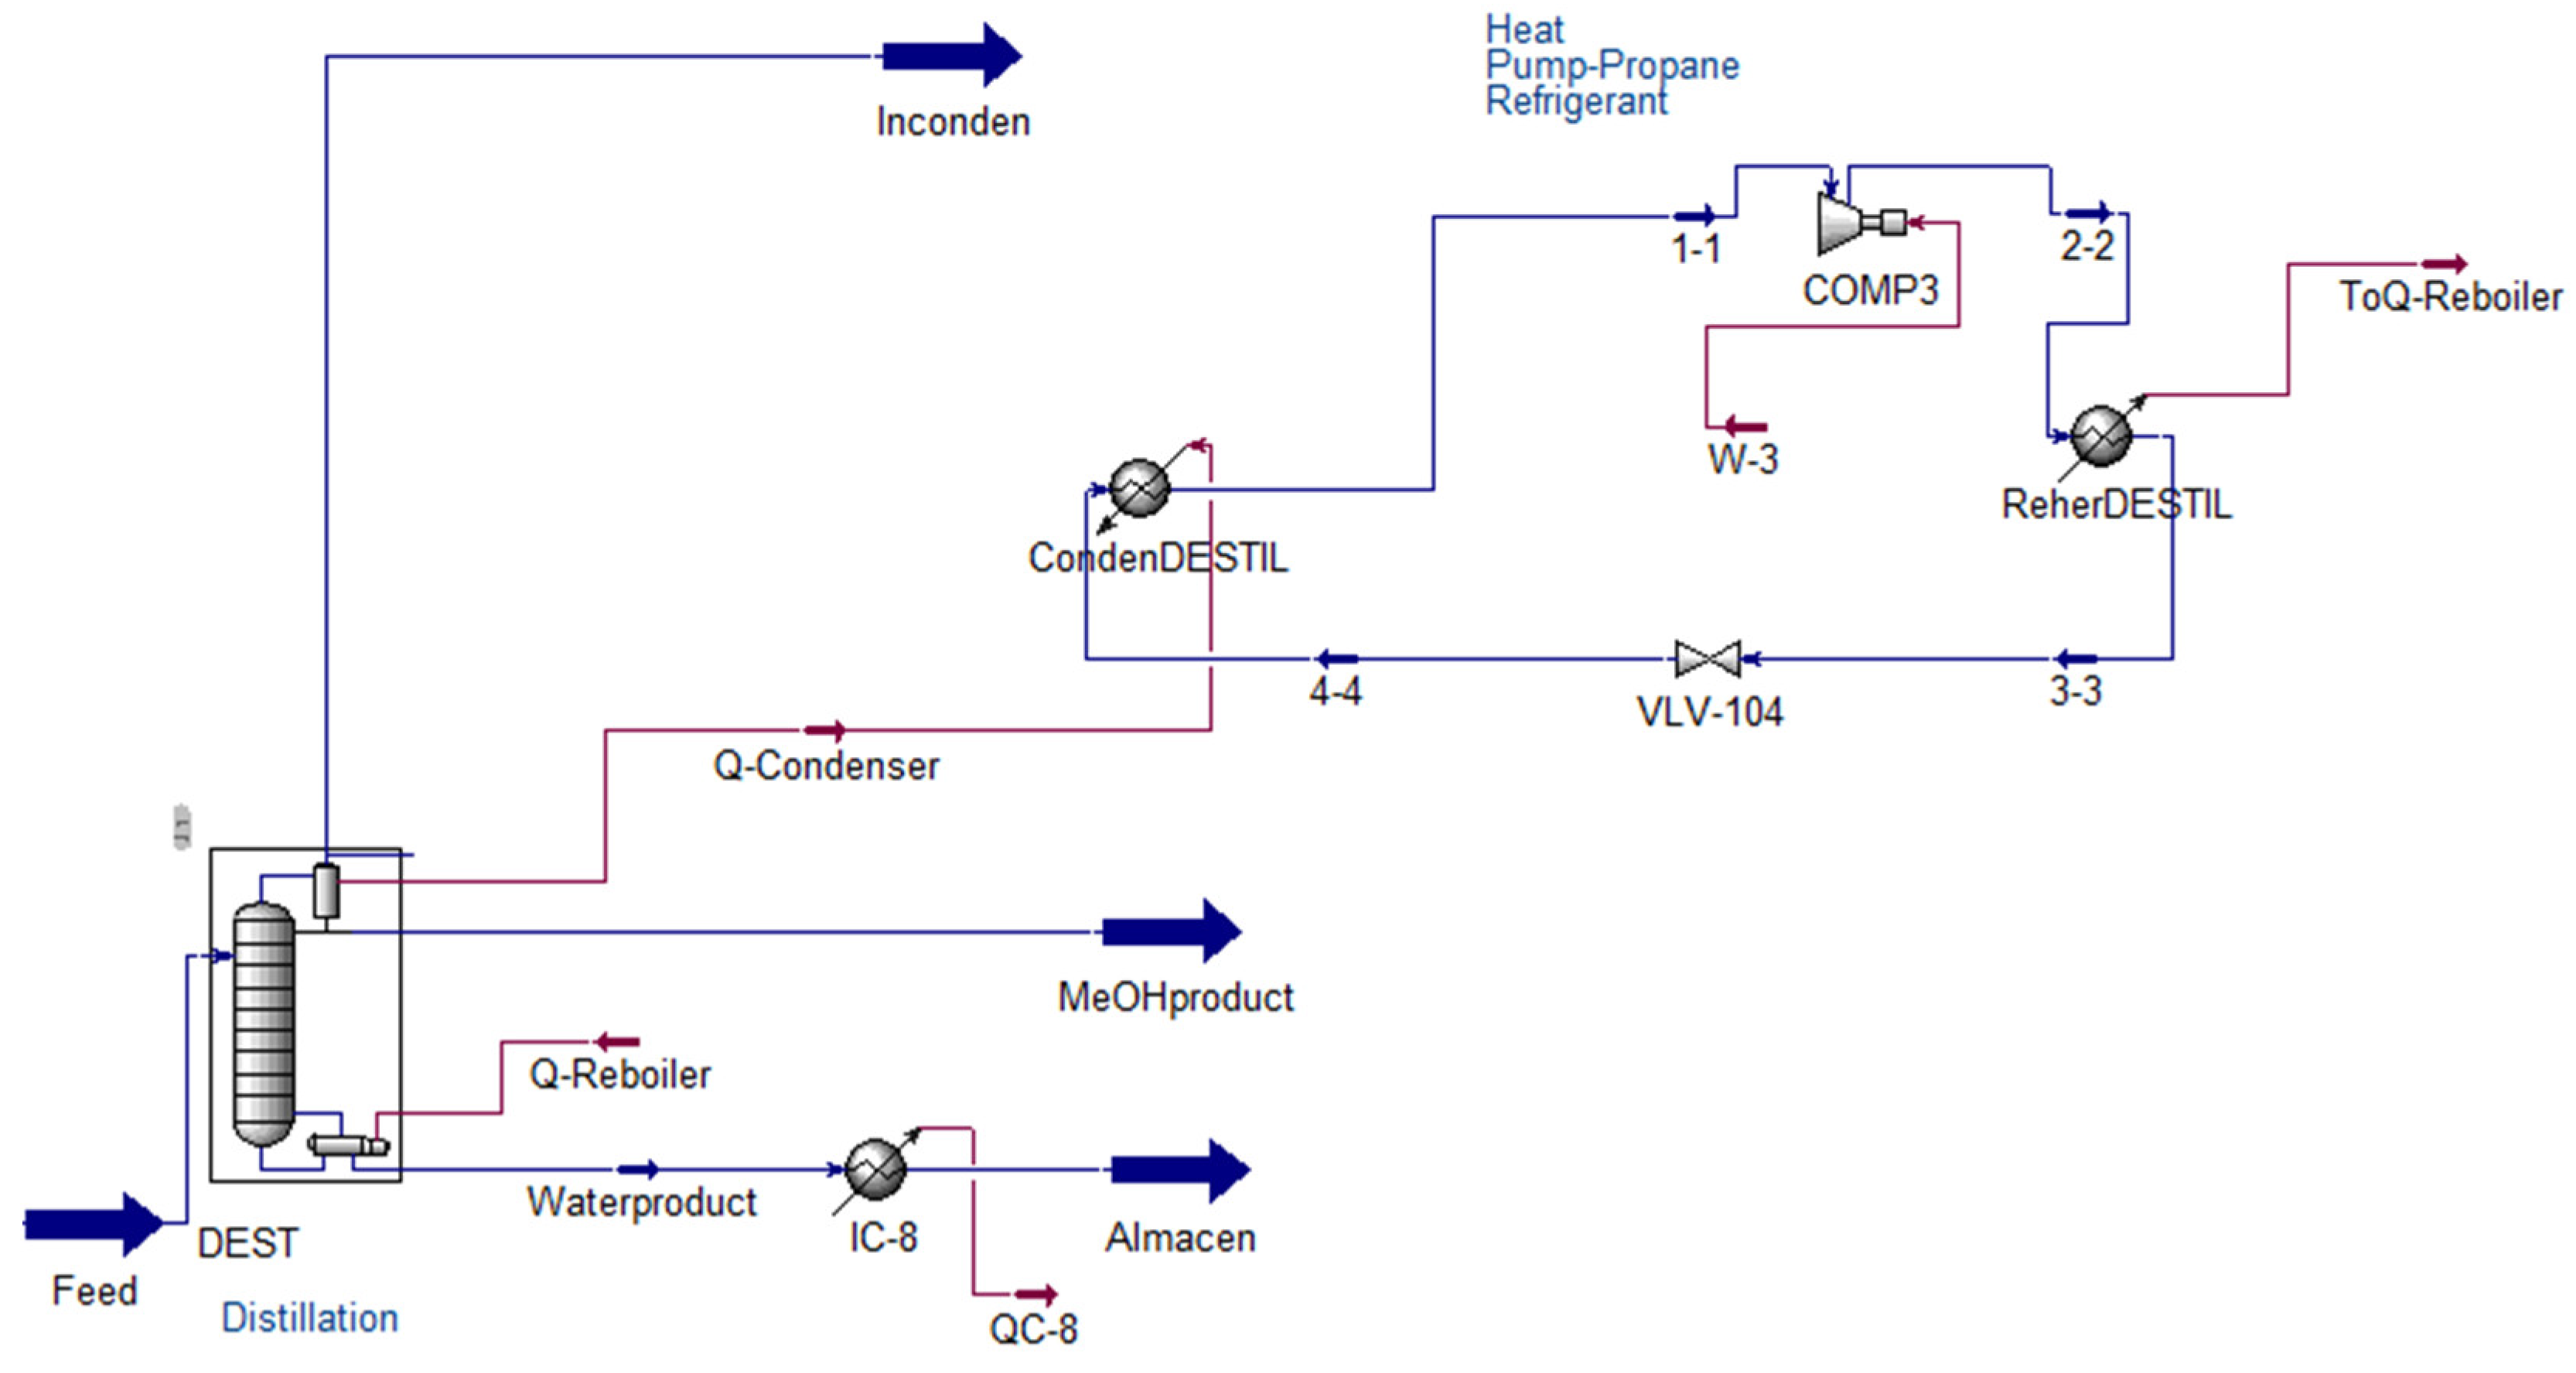
The distillation stage is made up of a distillation column of 25 theoretical stages with a reboiler and a condenser, establishing operational conditions between 2.4 and 1.3 bar and 125 and 75 °C in the top and bottom. The column integrates a heat pump (HP) between the top and bottom systems, handling propane gas as a working fluid. The column is optimized by setting a reflux ratio of 0.96, with the feed entering the column in stage 12.
The decarbonization metric used, based on the material balances obtained, is calculated by
where
is the net
abatement (kg),
is the mass (kg) of feedstock
consumed in the process, and
is the emissions resulting from energy consumption in the units. The results are in
Section 3.1.
2.3. Electrification by Heat Pump (HP)
The purpose of electrification is to partially or totally replace the use of a fossil fuel (used to generate heating steam) with renewable electricity in the HP. The procedure applies the so-called direct electrification through the use of a heat pump. This procedure consists in applying mechanical work to a fluid (propane) that circulates in a closed circuit [
39], allowing a reduction in the heating and cooling demand between the top and bottom of the distillation column by transferring energy from a cold sump to a hot sump (
Figure 2). This scheme is integrated into the HYSYS model, allowing us to compare the energy and environmental demand between a conventional heating system and the scheme proposed through the HP.
An important concept to consider in the design of any HP is related to the so-called coefficient of performance (COP), an indicator that allows us to determine the performance of the thermodynamic cycle associated with the pump, and which is defined as follows:
where Q is the useful heat delivered (extracted from the source at a lower temperature) and P is the high-grade (primary) energy (work) input supplied to the pump of heat and, consequently, to the working fluid. It is estimated that the higher the COP, the better the HP’s capacity to deliver energy to the process and therefore improve the overall energy efficiency of the industrial plant. In some cases, complex systems of two and even three HP cycles in series are designed, which allows for improvements of up to 29% in the COP compared to a single cycle [
40].
Typically, the heating procedure in a distillation column is carried out in the reboiler, using medium-(MP) or low-pressure (LP) steam, which is produced from the power generation area of the refinery, where the generation cycle uses the burning of natural gas or fuel oil in a furnace or boiler, which generates steam at high temperature and pressure (42 bar). This generated steam also passes through an electric generation turbine with the objective of degrading the steam to medium-(11 bar) or low-pressure (4.5 bar) conditions.
2.4. Environmental Assessment and LCA
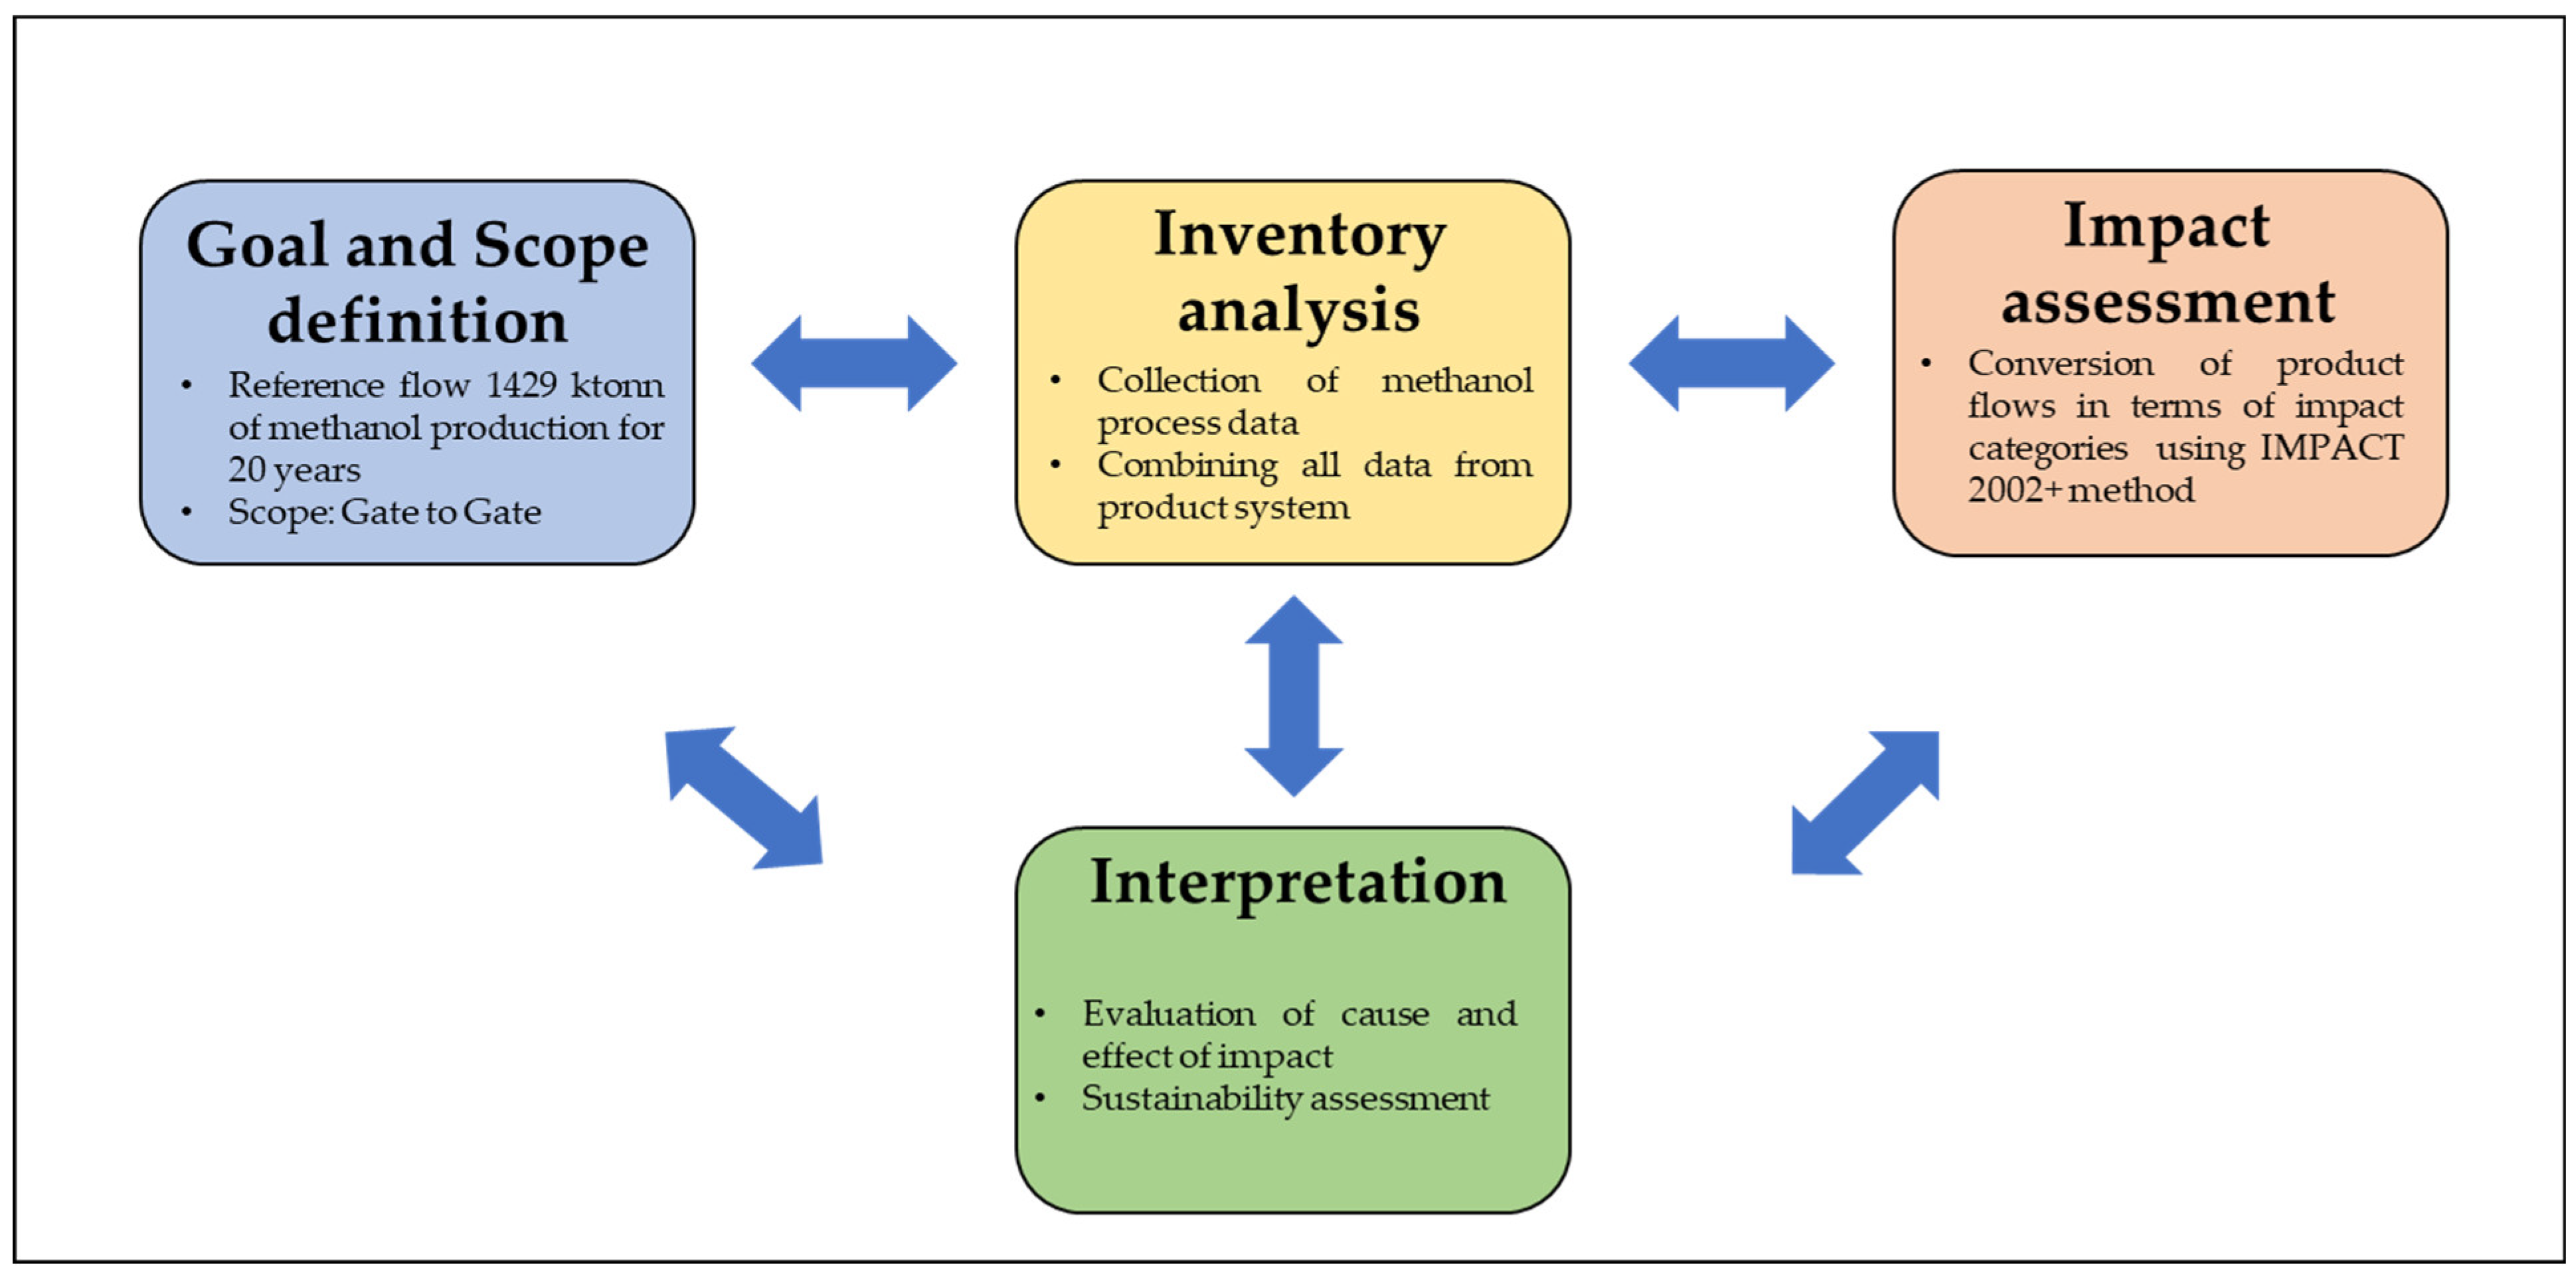
The life cycle assessment is used in this study within the framework of the ISO 14040 standard (
Figure 4), which consists of goal and scope definitions, inventory analysis, impact assessment and interpretation that is part of the study report. Using the IMPACT 2002+ method, the life cycle assessment was calculated by SimaPro v7.1.
2.4.1. Life Cycle Assessment Framework
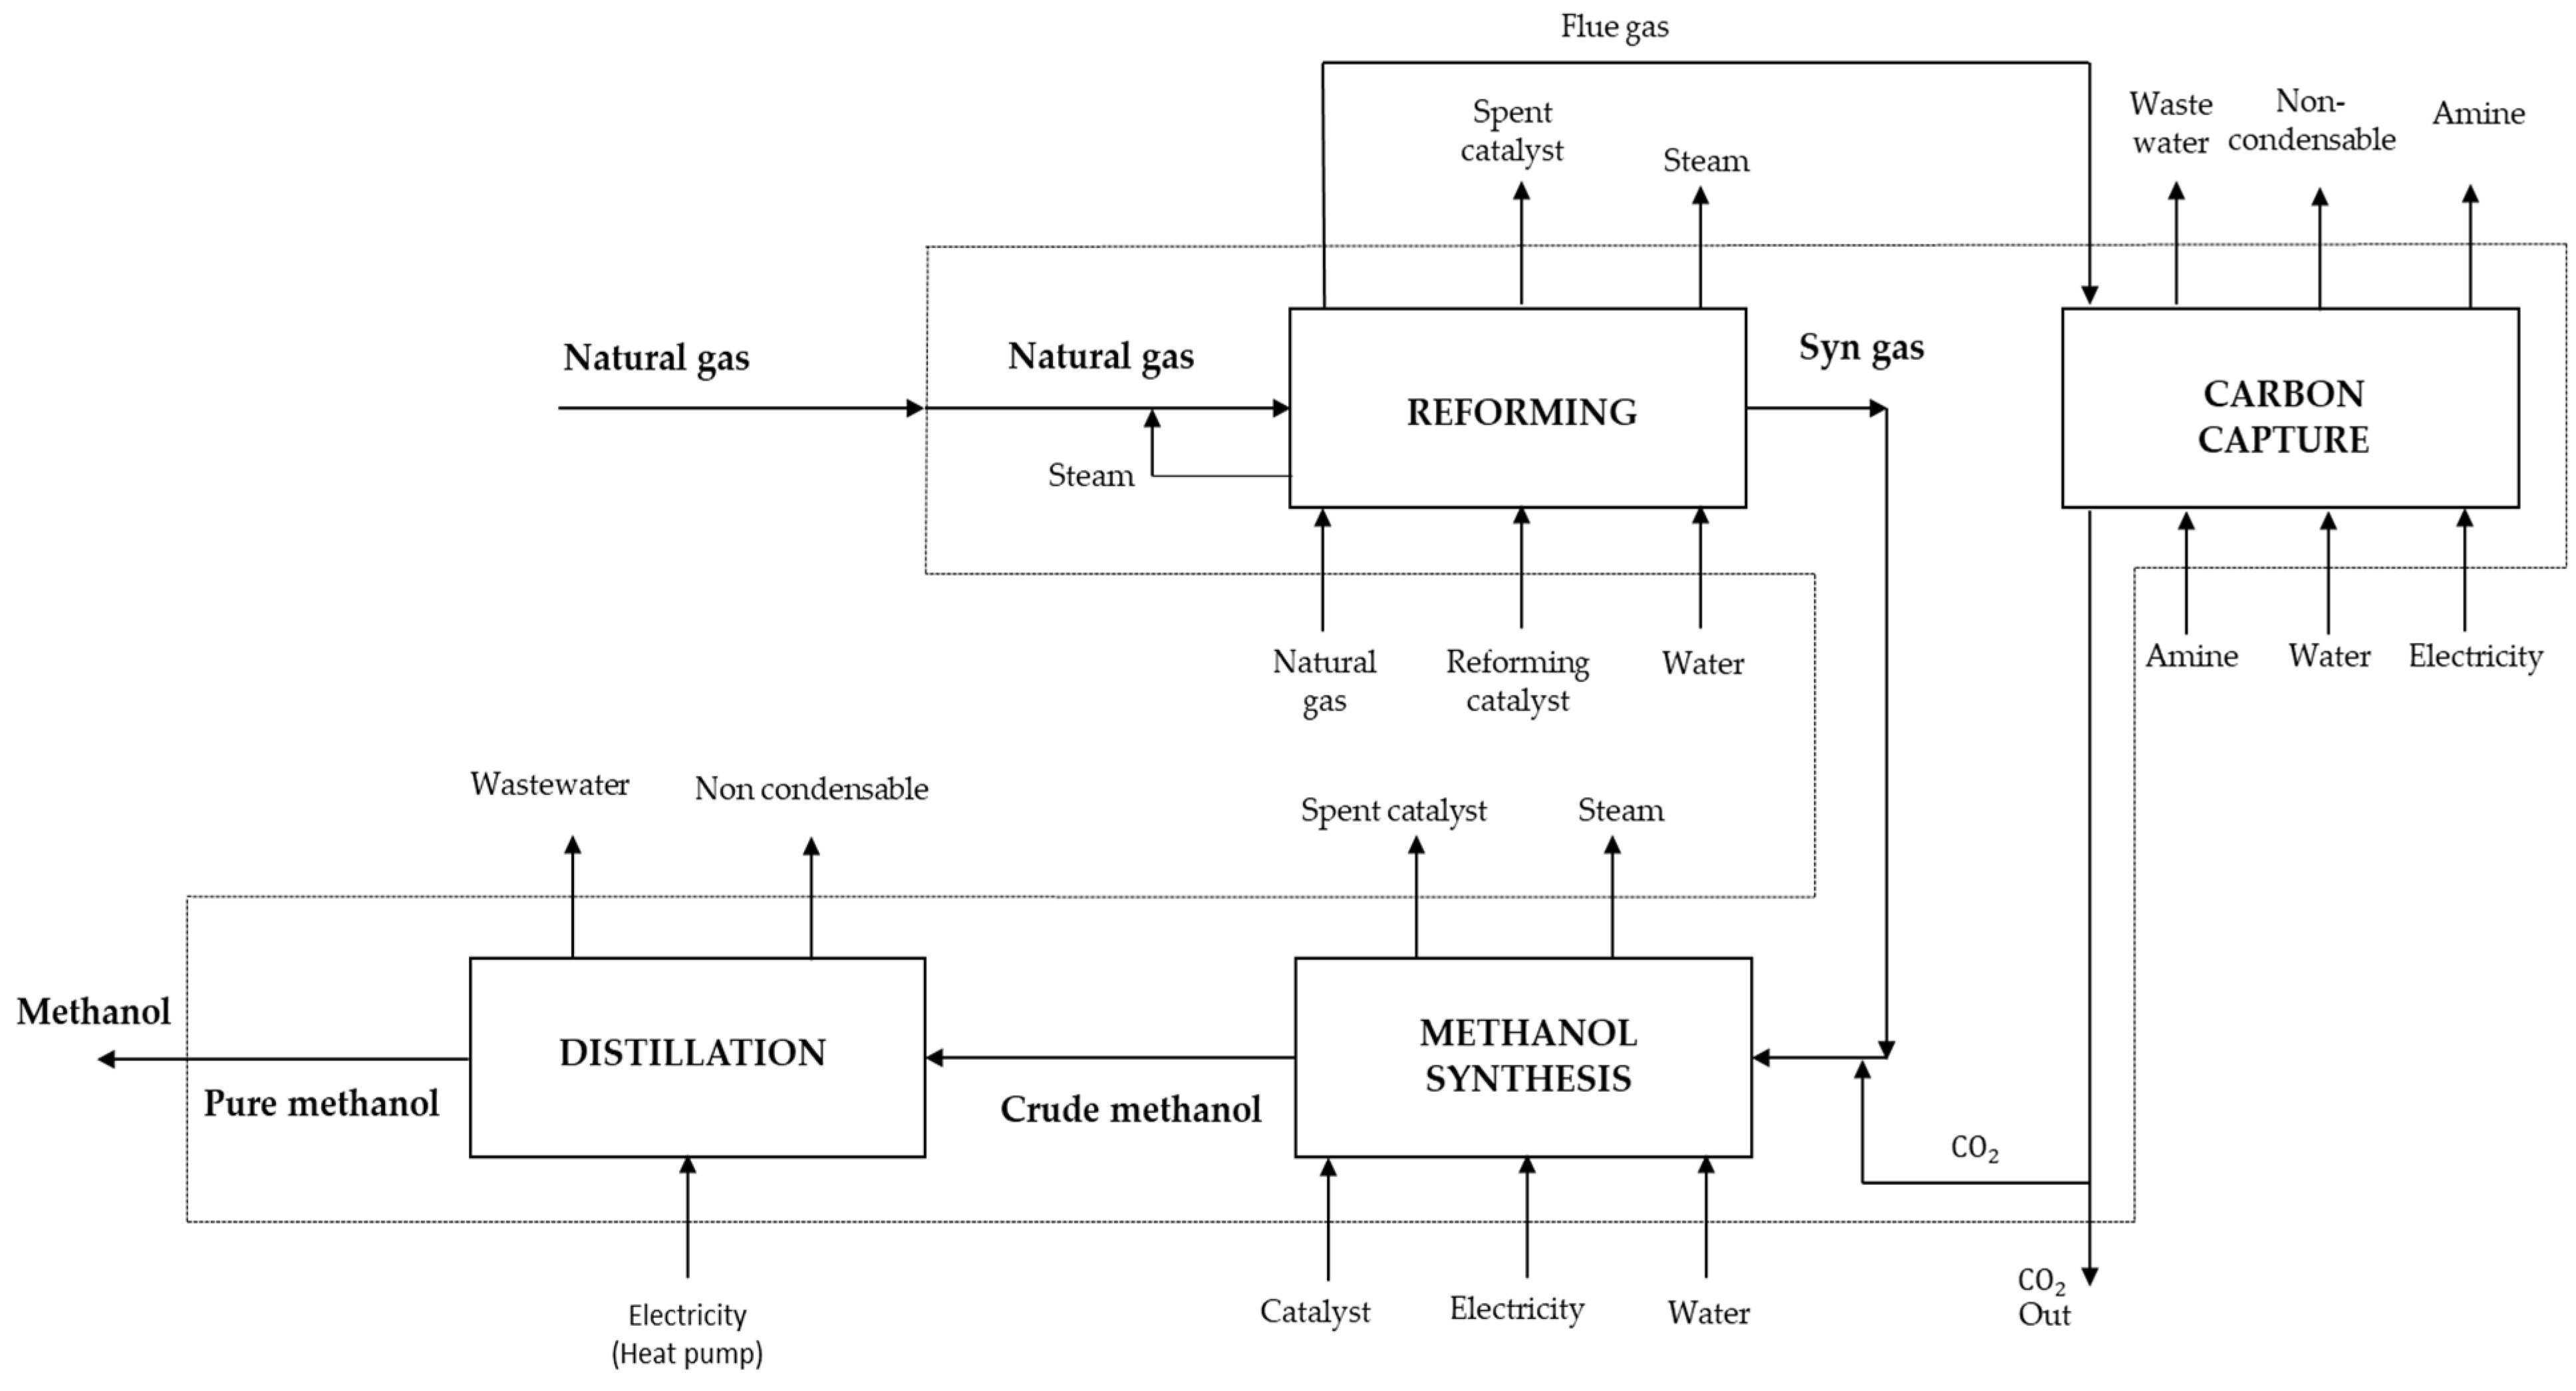
The approach used in this analysis considers the boundary limits as “Gate to Gate”, which considers the inputs and outputs (material and energy) of the process units to be evaluated (
Figure 5). The reference flow considered for the methanol production processes is 1429 kton for 20 years of lifetime. The data were collected in the form of inventories and processes. The input and output flows of materials and energy were combined to quantify a system of products that can generate environmental impacts. The flows include electricity consumption according to the Colombian electrical matrix [
41], the weight of the catalysts used for the study period, water consumption, consumption of chemical products (amines) and emissions generated in the units.
The flows that enter or leave the system directly from the environment are called elementary flows by the LCA methodology.
In the environmental impact assessment phase, the system of products emitted into the environment is transformed into impact categories. This is achieved by applying life cycle impact assessment methodologies. These methodologies are standardized and globally accepted for calculations. The results obtained are interpreted in terms of impact categories.
Impacts are defined in this analysis as respirable inorganic components, carcinogens, global warming and non-renewable energy.
2.4.2. Goal and Scope
The objective of this study is to calculate the potential environmental impacts of methanol production, considering the methanol production flow for a period of 20 years, as mentioned in
Section 2.4.1. The calculation defines the consumption of materials and electricity for the operating period of the units, also considering the maintenance stages and recurring replacement of the catalysts according to their useful life or normal deactivation processes.
Figure 4.
Life cycle assessment framework for methanol production process.
Figure 4.
Life cycle assessment framework for methanol production process.
Figure 5.
Process flow for methanol production and its life cycle inventory.
Figure 5.
Process flow for methanol production and its life cycle inventory.
2.4.3. Process Description
Natural gas enters the plant boundaries with an undetectable sulfur content but whose maximum specification has been set at 6 ppm. In the case of the actual hydrogen production plant and the desulfurization reactors, which are located right at the gas inlet to the plant, analyses have found low levels of catalyst deactivation after 5 years of continuous operation, confirming that the natural gas for this process does not contain sulfur, which is why this inventory is not considered within the LCA. The natural gas stream enters the reforming section together with steam (or for the base case), where the nickel catalyst is placed in a reformer heater (R1) within 162 vertical tubes. The life of the nickel catalyst has been estimated at an average of 5 years, so it is expected to be replaced 4 times within a 20-year period.
Natural gas is also fed as a fuel to the reformer to guarantee the minimum temperatures of the chemical reactions, mainly of an endothermic type. The gas flue produced by the burning of natural gas in the reformer is used in a thermal integration process for the preheating of the feed streams to the plant. The synthesis gas from the reformer goes through (2) stages of conversion of CO to
. The catalyst of the first reactor (R2) is designed for high-temperature operation and is made up of iron and chromium oxides (
−
) with a life expectancy of 5 years, as is the catalyst of the second reactor (R3) at a low temperature, with a base of copper and aluminum oxides (CuO −
). In the synthesis section, the gas is compressed to 72 bar. A two-stage compressor consumes about 3675 kWh of electricity. In this section,
from the flue gas (R1) and other refinery suppliers is fed to the second stage of the methanol synthesis reactors to ensure the desired conversion, and the copper oxide catalyst is used to carry out methanol reactions. Depending on the operational performance of the catalyst, the life expectancy of the catalyst can range from 3 to 5 years, so for the LCA study period (20 years), replacement rates of up to 7 times have been considered. Gas coming out of the reactors is cooled to condense out most of the methanol. Methanol product is purified in the distillation section which has a close cycle with heat pump. Inventory material flows are expressed in kilotons (kt), and energy flows are expressed in megawatt (MW) in
Table A8.
2.4.4. LCIA Methods
The IMPACT 2002+ LCIA method was used to convert the inventory data (
Table 3) information into environmental impacts and damage category results.
2.4.5. Impact Categories
Global warming potential (GWP) estimates the effect of warming over time, produced by the release of 1 kg of greenhouse gas compared to the release of 1 kg of . This allows us to determine the relative effect of each gas emitted. The quantification unit is the equivalent value.
This category refers to the carcinogenic effects of chemical compounds on human health due to compounds such as chromium VI and 1,4-butanediol. Chromium is present in the R2 reactor catalyst, and other metals, such as mercury, cadmium, lead and arsenic, are shown to have carcinogenic potential but are not considered for methanol production. This category relates to the absorption of carcinogenic substances, not through direct contact, but through a transport medium (water, air or soil). The units are in kg of equivalent.
This is a category of particulate emissions that can cause adverse effects on human health due to small particles (PM 10, PM 2.5) and other precursor compounds (NOx, SOx) emitted primarily during the combustion of fossil fuels. It is linked to respiratory problems and lung damage. The units are in kg PM 2.5 equivalent.
This category indicates the depletion of non-renewable fossil resources due to the extraction and use of these resources for power generation in boilers or generators. It infers concern that these limited energy resources will not be available in the future to maintain current consumption patterns. The units are given in MJ primary.
2.4.6. Impact Calculations
The calculations of environmental impacts and the reported results were carried out in two stages:
The characterization stage was carried out using substance characterization factors and how these contribute to the evaluation of environmental impact in a given category [
42] for the system of interest. The factors and the methodologies used have been established by various institutions, among which the IPCC (Intergovernmental Panel on Climate Change), founded in 1988, [
43] and the Eco-indicator 95–99 [
44], developed by countries such as Switzerland and the Netherlands, which have provided guidelines for the determination of environmental inventories, can be highlighted.
where
is the inventory contributing to the impact,
is the cass of the inventory i contributing to the impact and
is the characterization factor for inventory i. The characterization factor is estimated for each of the impact categories to be evaluated within the study. Equation (20) presents an example of what would be the expected contribution of, methane and CFC-115 to GWP for a hypothetical case. The calculation allows us to identify how methane and CFC-115 have an impact of up to 25 and 7000 times more compared to
.
Normalization: This consists of converting the results of the characterization into neutral global units, then dividing each one by a normalization factor. These factors represent the degree of contribution of each impact category to the local environmental problem and population.
For example, in the case of the use of the Eco-indicator 95 methodology, the factor to be used is 13,477; therefore, the result of normalization is as follows:
Grouping: This is the classification of impact categories into other groups that group impact categories with similar effects together.
Weighting: This is the conversion of the results of the characterized values into a common and summable unit, then multiplying them by their specific weighting factor. They are then added together to obtain a single total score for the environmental impact of the system. In the graphical results of this study, the display units will be given by environmental points (Pt). In the continuation of the previous example, the weighting factor is 2.5, which, multiplied by the normalization value, would be
This is how the environmental impacts are quantified for the four defined categories, information that is obtained from the mass and energy balances developed for the evaluated processes.
An overview of the normalization factors for the four damage categories and midpoint categories is given by IMPACT 2002+ (Europe region) in
Table 4 and
Table 5 [
45]. The weighting factors were calculated by default using SimaPro V7.1.
2.5. Energy Estimation in a Distillation Column
The HYSYS model adjustment process for the distillation column was carried out using information obtained at laboratory scale, which allows establishing the real energy demand required for the separation process of a methanol–water mixture. This information allows fine-tuning the sizing of the HP to be installed in the distillation column.
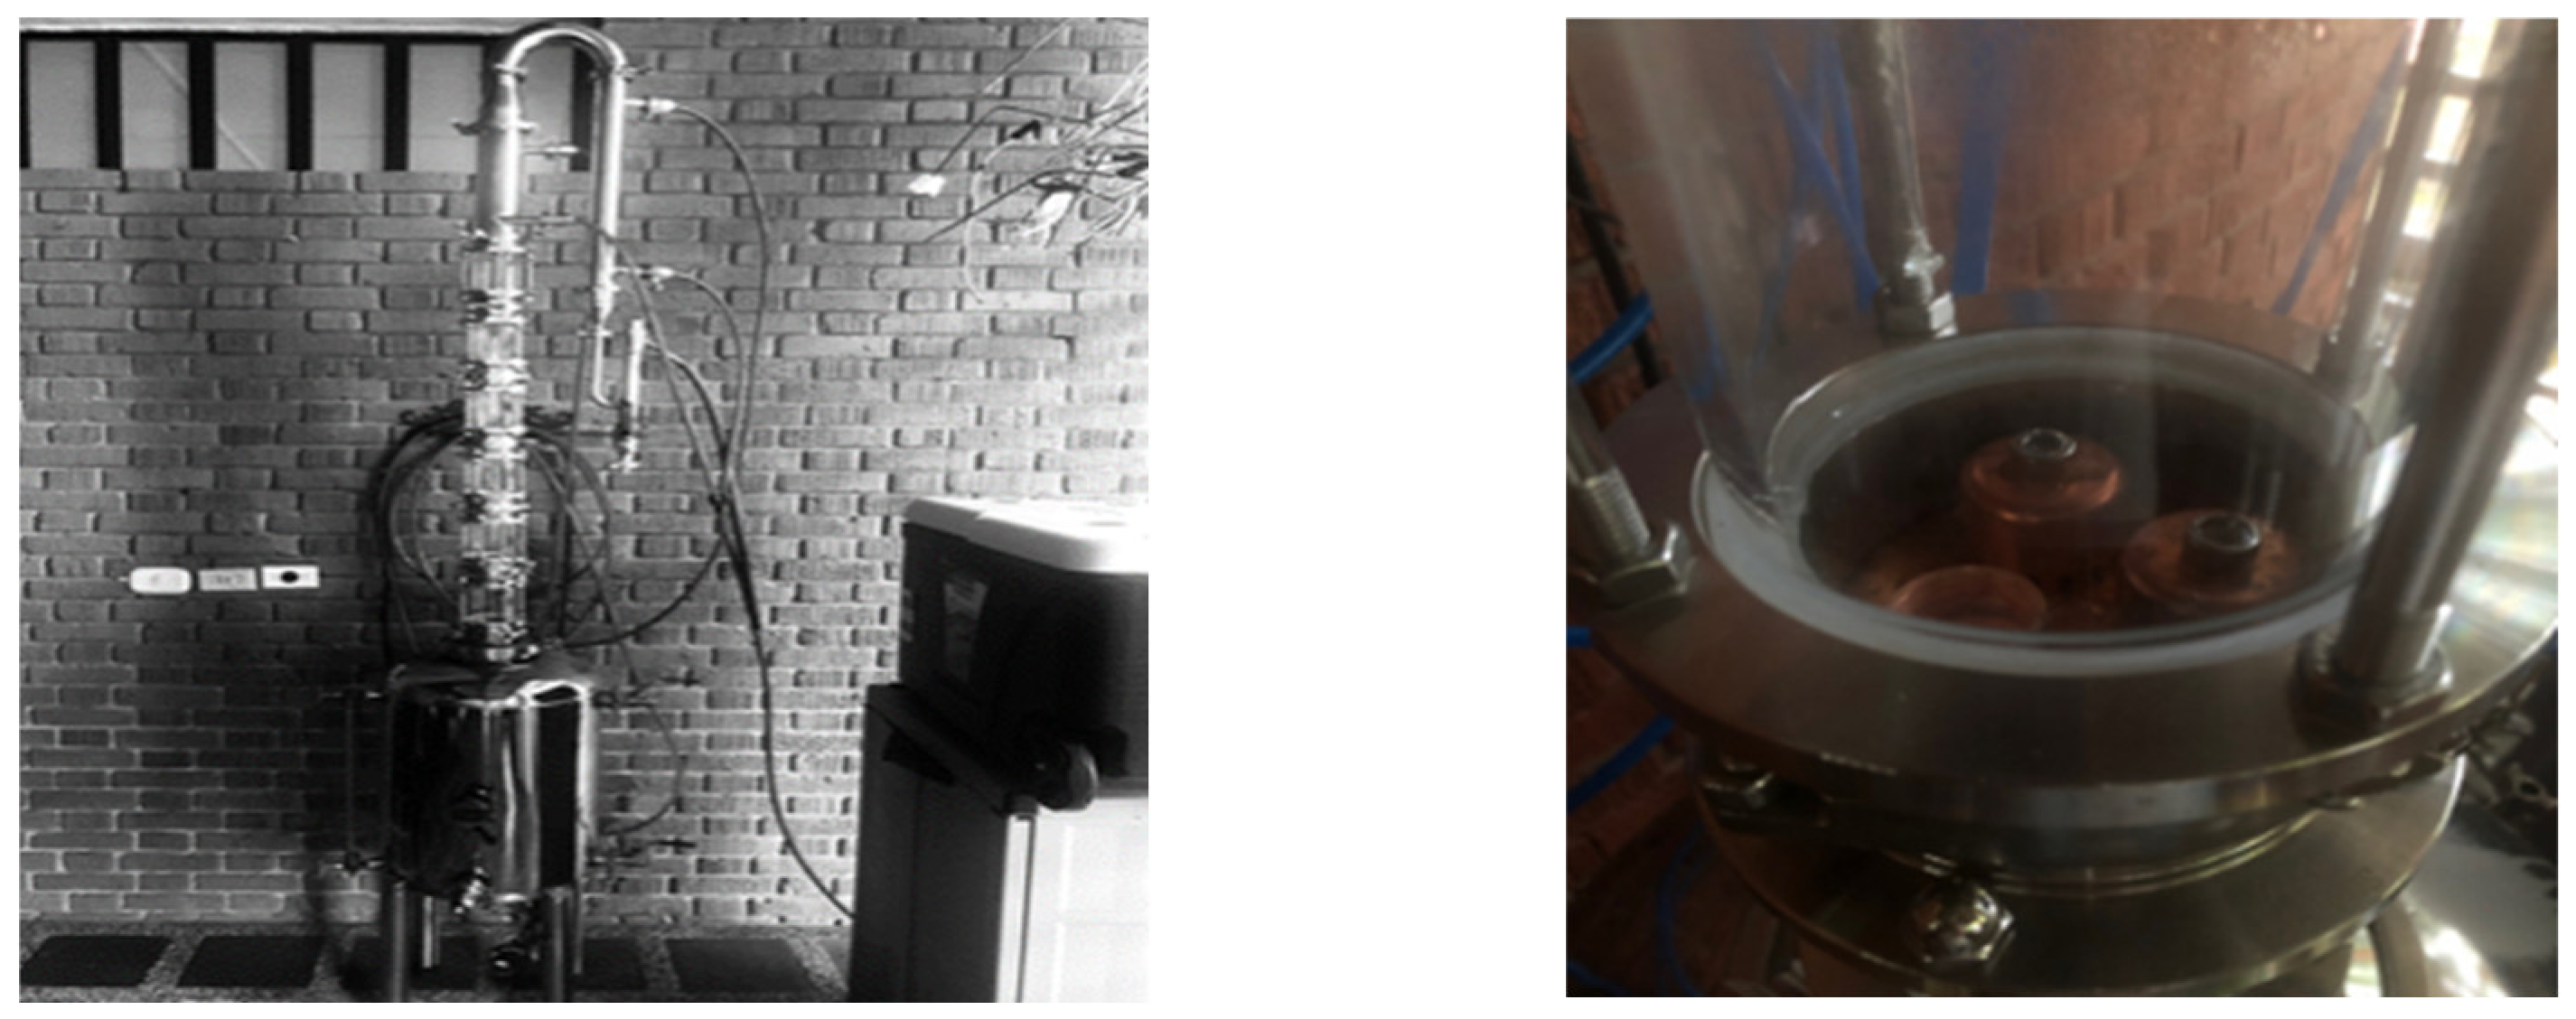
The established energy demand, including losses to the environment, is compared with the estimates predicted by the model, allowing the establishment of a margin of experimental error. The test (
Figure 6) is designed for the separation of 20 L of a methanol–water mixture (49% MeOH-51%
).
The equipment consists of a 6-stage real column with a diameter of 3 inches and a maximum working capacity of 50 L, which is arranged to obtain a distillate between 95% wt and 99% wt of MeOH purity, using a 3.5 kW 220 v electric resistance as a heating medium. The column is equipped with a top condenser (heat exchanger), which uses cooling water and a magnetic flow meter to control the internal reflux and production distillate. The system also uses a temperature controller (DROK 80–300 V AC meter) with a K-type thermocouple to control the top conditions in the column in such a way as to allow precise adjustment of the cut-off point for methanol distillation.
3. Results
The comparative results of the mass and energy yields of the analyzed processes are summarized below, as well as the energy and emission performance, inferred using the heat pump (electrical energy) in the distillation column in relation to estimates obtained from a steam generation plant for the thermal supply of the distillation column. The experimental analysis allows us to determine and adjust the energy demand of the methanol distillation process to the atmospheric conditions of the site (Barrancabermeja-Colombia) to validate the HYSYS model.
Finally, the results of the comparative mass and energy balances (
Appendix A) allow us to determine the levels of environmental impact and damage for the categories of global warming, carcinogens, respiratory inorganics and non-renewable energy.
3.1. Material and Energy Balance
In the base-case scenario, the process consumes 3129 kg/h of natural gas and 2316 kg/h of captured
to produce 7560 kg/h of MeOH. The process also consumes approximately 6848 kg/h of water. Effluent and blowdown streams are vented to the flare systems. The total plant blowdown is 2.2% of total production, which is consistent with the information obtained from conceptual designs of this type of plant [
46,
47]. The reformer (R1 in
Figure 2 and
Figure 3) is the plant’s main energy consumer, while reactors R2 (
Figure 2) and R4–R5 (
Figure 3) are the main heat generators, given the exothermic nature of the synthesis reaction.
The carbon capture process (
Figure 1) is designed to provide
feed for both the base case and proposed units. The unit is part of a real plant at the Magdalena Medio Refinery, which has been configured to perform carbon capture in a hydrogen production plant. The solvent used for the absorption process is DEA.
The proposed plant design uses the same gas flow as the base case, but as an SRM process, it does not use
as feed. The water flow rate used is lower than the base case and set at 2043 kg/h, which allows for significant energy advantages in reformer R1. The captured
is added to methanol in the second reaction stage, at a flow rate of 2356 kg/h. The performance of the study processes is summarized in the tables below (
Table 6,
Table 7 and
Table 8), where the efficiency of the proposed process increases methanol production by 5%, with a notable reduction in energy consumption (−50% fuel gas–steam and −30% electricity) and
emissions, with a value of 62% (
Table 8). The obtained production corresponds to 7942 kg/h of MeOH (99.8% wt). The results of the global mass and energy balances, as well as diagrams of the HYSYS simulations, are shown in
Appendix A and
Appendix B. The annualized methanol production represents covering 97% of the estimated demand for methanol in Colombia.
3.2. Heat Pump Implementation and Column Energy Estimation
The COP of the heat pump for the distillation column is determined by Equation (23)
where
and
are the working fluid (propane) temperatures in Kelvin and represent the COP ideal, which, for this exercise, (
= 316 K,
= 363 K) is equivalent to 6.7. For the simulated plant (
= 4379 kW,
= 848 kW), the calculated COP is 5.1, which is a representative value for similar HP systems with a renewable electricity supply [
46].
It is important to consider that while the HP can operate over a wide temperature range, the working fluid conditions are an important aspect for the system design [
47]. The use of the HP for the distillation column generates energy savings close to 86% (850 kW required by HP) compared to the external supply required for the column’s reboiler (6282 kW). It is important to note that the energy demand of the distillation process represents between 20 and 25% of the unit’s overall demand (without the CCU process).
In the calculation of
emissions in the distillation stage, a conventional steam generation plant would require generating 7389 kW by burning natural gas to provide the column’s reboiler energy (6282 kW). The effect compared to the use of the heat pump is observed in
Table 9. With use of electricity from the Colombian electricity matrix for the heat pump, the emission factor is low, considering that 67% of electricity comes from hydro; the reference value used is 0.126
[
48]. Finally, for this study, photovoltaic electrical energy has been considered for heat pump use, so the emission factor will be zero and the benefits for reducing
emissions will be greater.
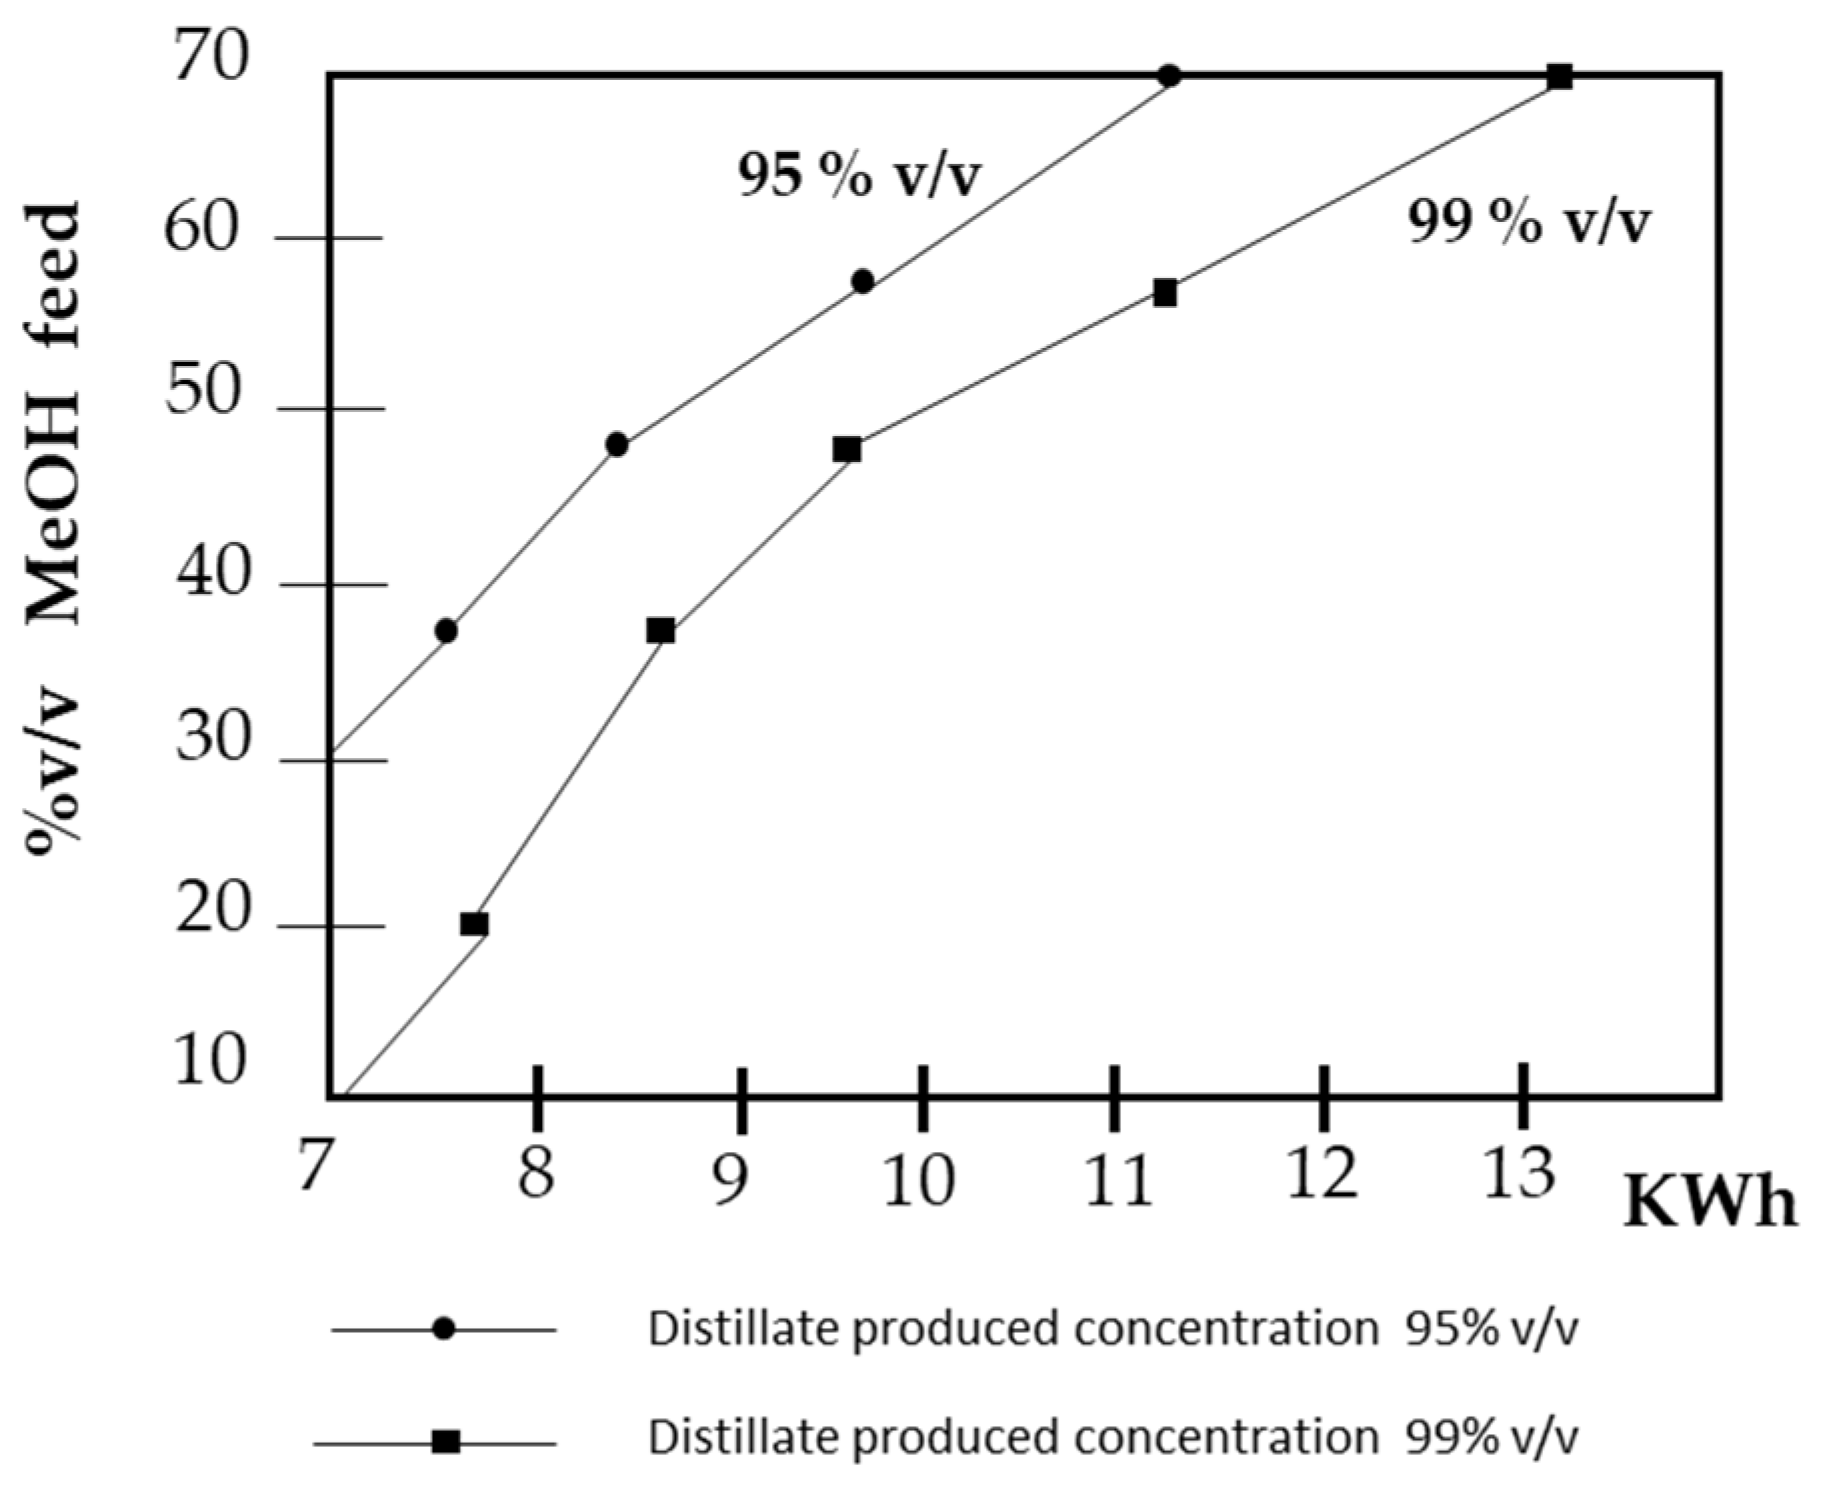
The energy demand for the distillation process of the simulated industrial plant was evaluated and adjusted through a small-scale experimental test for a methanol–water mixture.
Figure 7 shows a graph that allows estimating the energy required to separate a methanol–water mixture at different concentrations.
Table 10 shows an estimated energy deviation of approximately 6% from the experimental model, which is taken into account when calculating the power required by the HP (850 kW) on an industrial scale.
3.3. Environmental Assessment (LCA)
The focus of the assessment was to compare the impact categories generated by the methanol production processes for the base case and the proposed plant.
The results (
Table 8) allow for the identification of long-term effects over infinite time horizons or in ranges of up to 500 years.
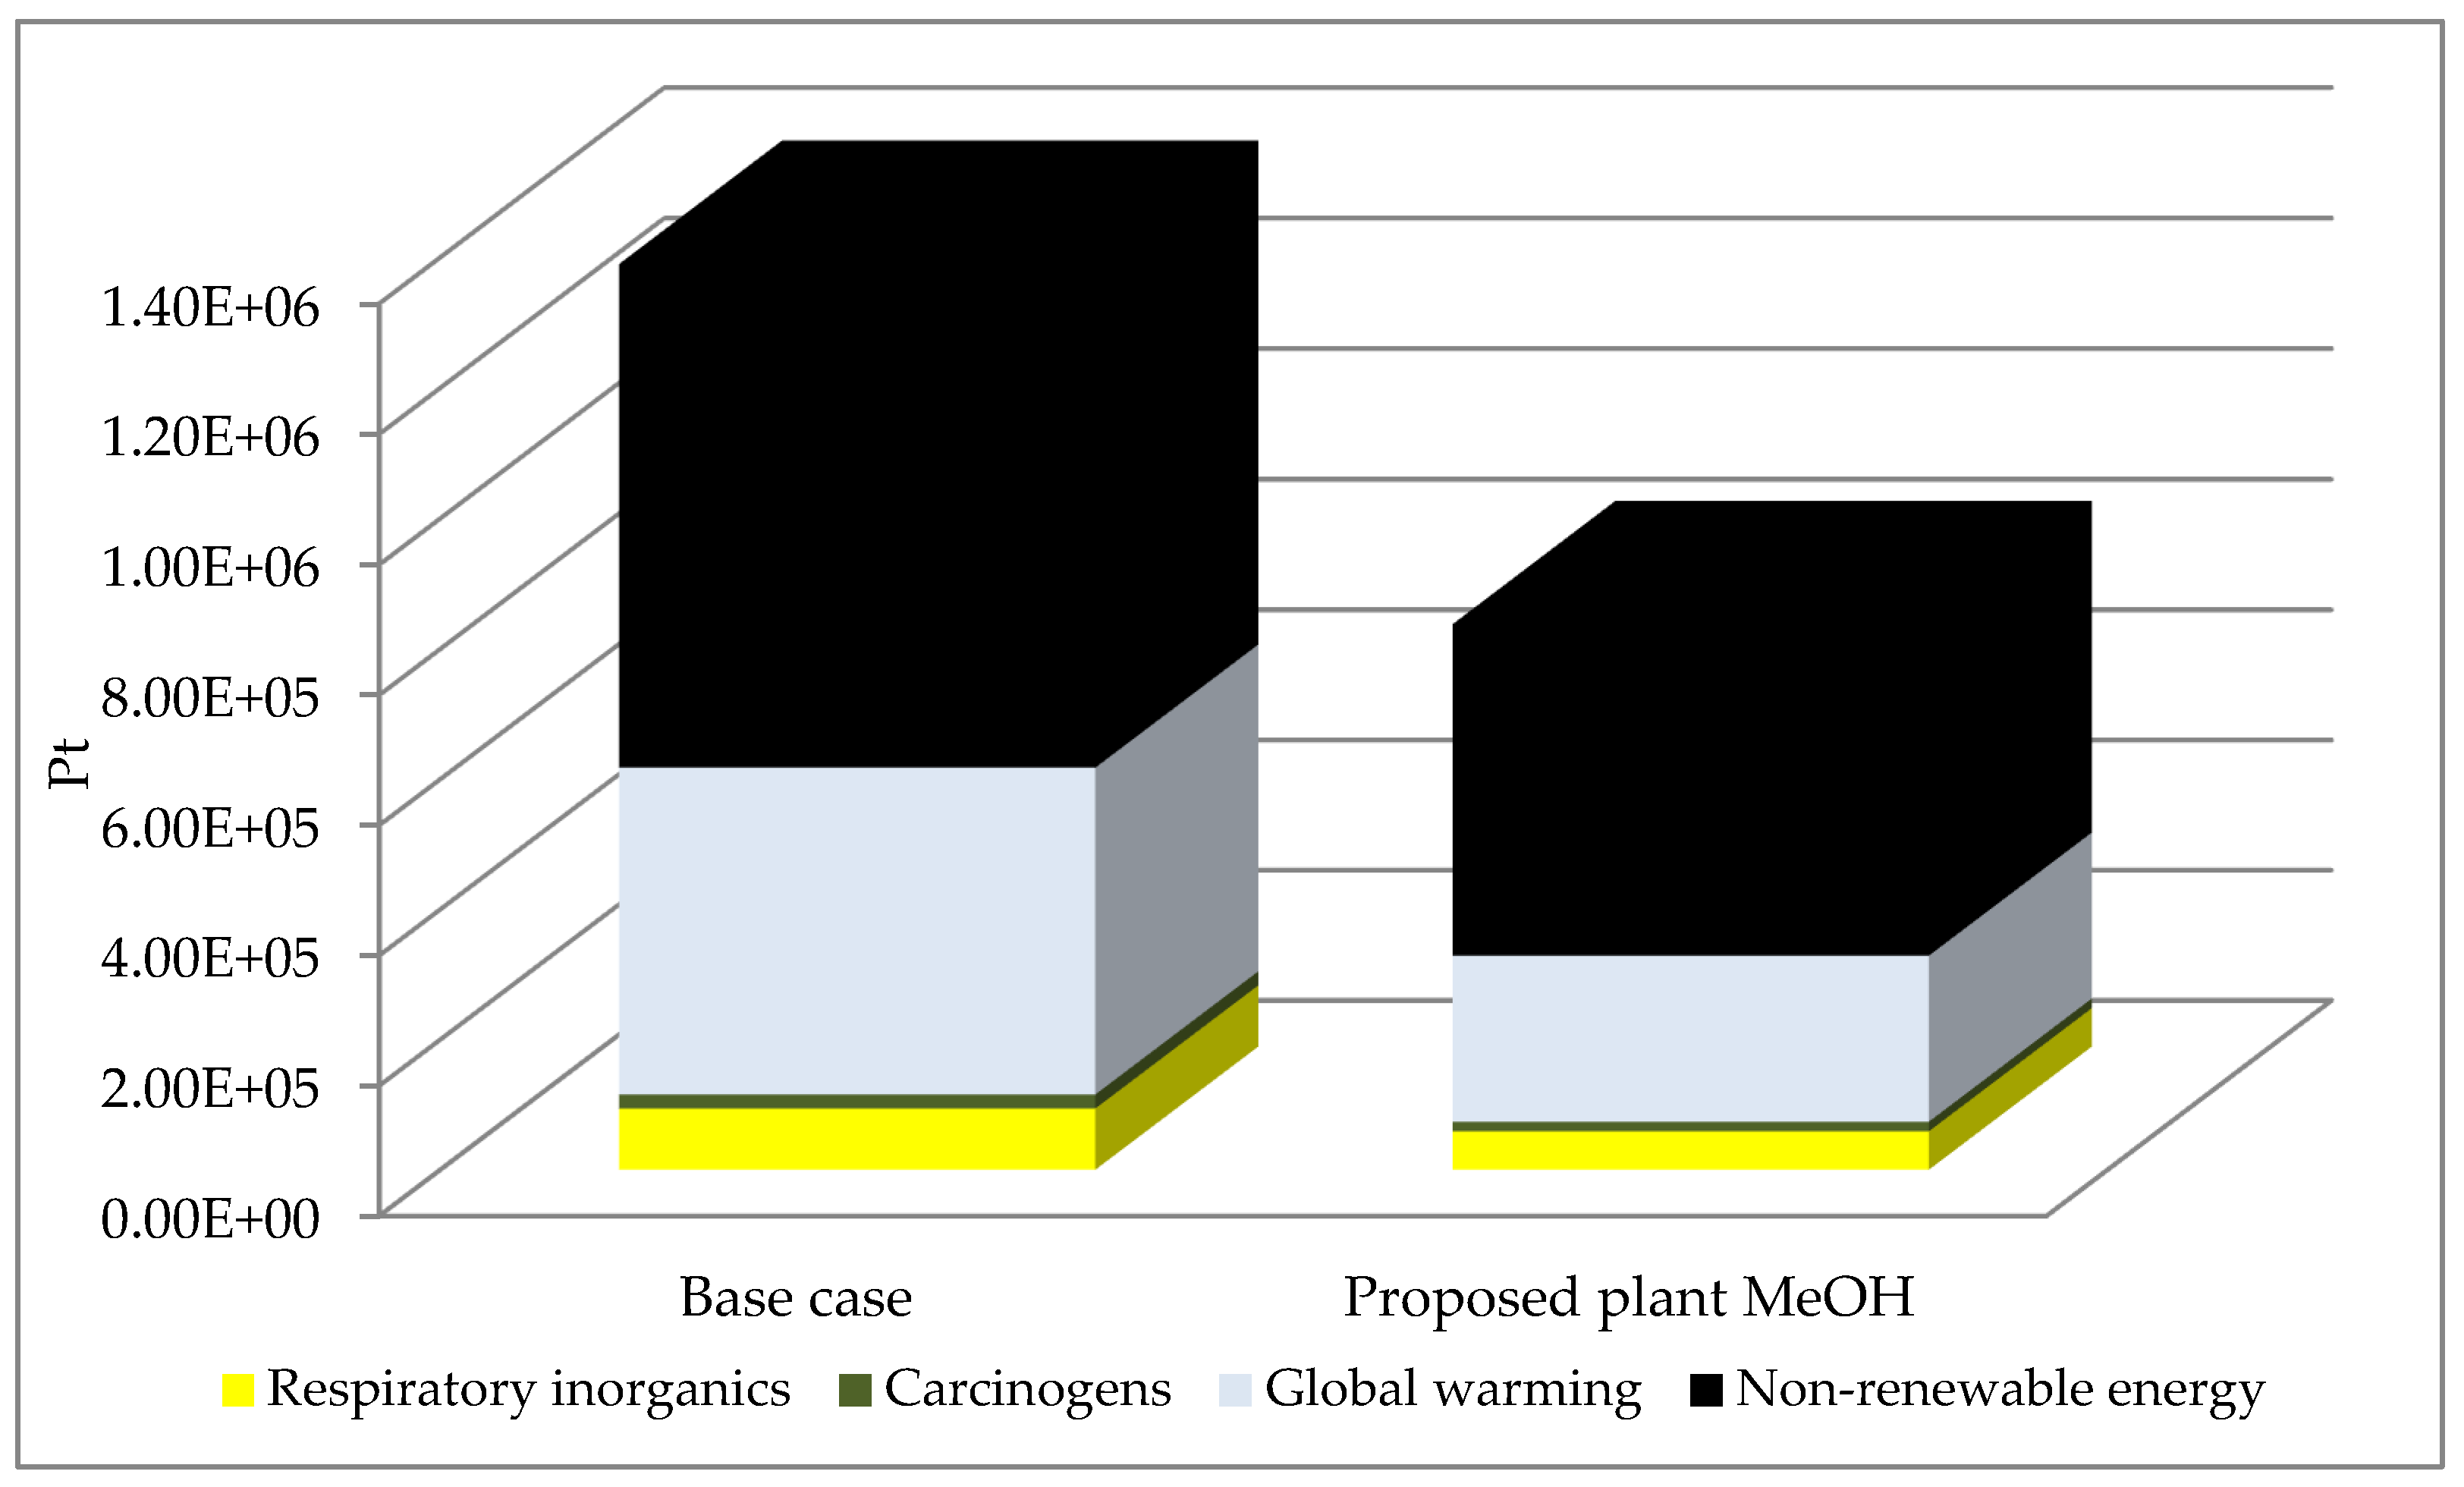
In global warming, a 50% reduction in the
level is observed, considering that only through direct venting to the atmosphere does the proposed process reduce
gas emissions by 62%. In the midpoint category, respiratory inorganics [
49], the proposed plant shows a 37% reduction in particulate matter with a size of PM2.5, considering the general reduction in gases to the atmosphere compared to the base case. In the case of carcinogenic elements, an estimate is made of the cumulative toxicological risk due to the effects of the chemical substances released into the environment by each of the industrial plants. The proposed plant shows a 32% reduction, which is explained by a reduction in the components that affect the air by the proposed plant, linked to a chlorine ethylene equivalent (
), a substance linked to various types of cancer [
50].
Table 11 summarizes the results obtained by the midpoint category.
In terms of non-renewable energy, the proposed plant achieves a comparative reduction of 34%, primarily due to the reduction in a non-renewable resource, such as natural gas, which is used primarily as a heating medium in the R1 reformer and in steam generation systems for heating in the base case.
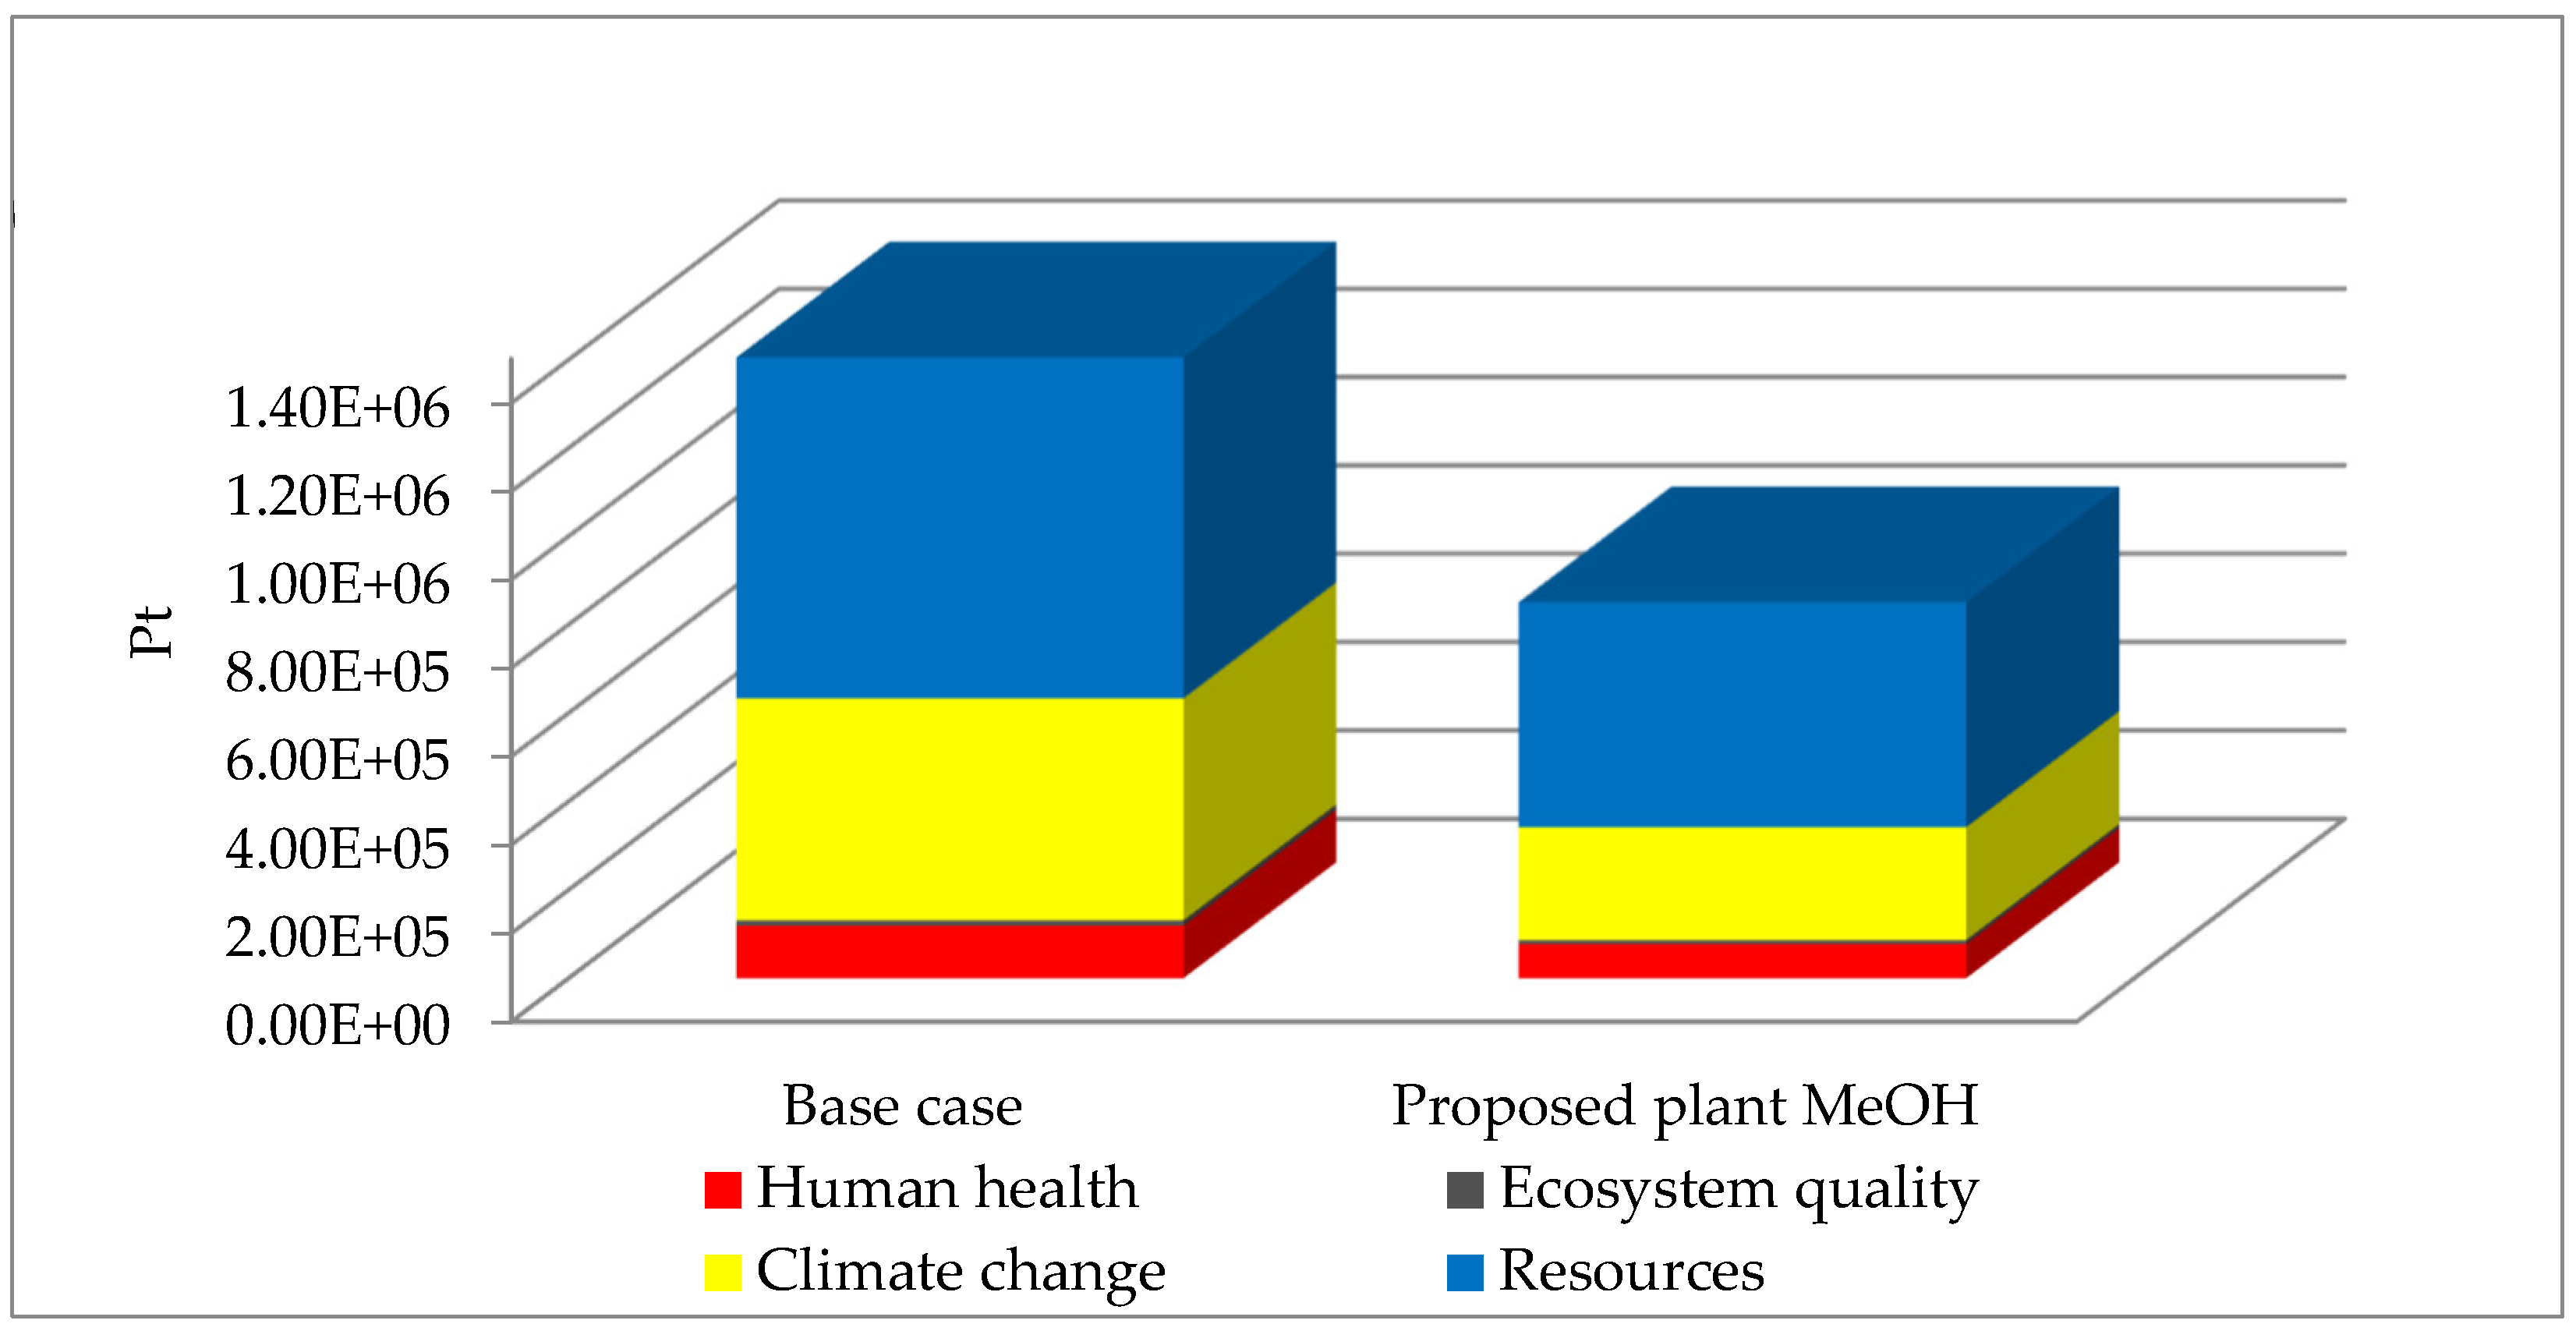
Figure 8 and
Figure 9 graphically summarize the impacts of both processes on the environment using weighted points (Pt).
The damage characterization factors or “endpoints” of a substance are obtained by multiplying the midpoint characterization potentials with the damage characterization factors of reference substances [
51] (
Table 12).
In the case of the damage category (see
Table 13), climate change is directly associated with the GWP midpoint category and is expressed in
eq units in human health. In this case, it includes human toxicity (carcinogenic effects) and respiratory effects (inorganic), which contribute to human health damage, and the units are expressed in DALY/kg emission.
Resources: The contributing midpoint category is non-renewable energy consumption, which evaluates non-renewable energy resources, including energy that has raw materials as energy carriers (higher calorific values), such as crude oil, natural gas, etc. It is assumed that the energy extracted from these resources will no longer be available as a functional energy unit for an infinite time horizon. The unit for expressing this category is the primary energy for energy carriers (in this case, natural gas) as MJ/unit consumed.
Ecosystem Quality: The category of damage is expressed as Potentially Disappeared Fraction over a certain area and during a certain time per kg of emitted substance [PDF-
-year/kg emitted] [
52].
Although at the weighted level the damage effect due to Ecosystem Quality is low (
Figure 9), the impacts due to ecotoxicity and acidification in water are considered to be linked to the low MeOH levels in the wastewater produced in the distillation columns at the units.
4. Conclusions
The proposed technical and environmental analysis for the industrial production of methanol using a photovoltaic renewable energy heat pump demonstrates significant results in terms of MeOH production, energy savings and overall decarbonization of the process, reducing emissions into the atmosphere by 62% and the contribution to global warming by 50%, compared to the results of a conventional CR plant. The results indicate that expanding the use of heat pumps through so-called indirect electrification for industrial distillation processes can guarantee enormous energy savings (over 88%) with a more efficient and sustainable process for society (electricity instead of fossil fuel), as long as the electricity supply is of renewable origin or with a low emission factor. Undoubtedly, the use of a heat pump is a differential factor that can contribute significantly to the energy transition schemes in current chemical processes.
With this technological proposal, 97% of the current demand for MeOH in Colombia could be covered, representing a significant business opportunity, following an economic and financial evaluation, considering future projections for the domestic and foreign markets in terms of raw material prices and costs. It is important to note that the proposed plant considers the use of existing infrastructure and installed equipment (reforming plant and CCU), for which it would be necessary to carry out a complete technical–economic evaluation at the level of the mechanical integrity of the materials and equipment in such a way that it can be determined whether it is possible to modify the existing plant or if a new production plant would be required to provide reliability for the refinery.


