1. Introduction
Due to the global energy crisis and environmental pollution issues, countries around the world are steadily promoting the development of renewable energy. The grid-connected capacity of renewable energy, represented by wind and solar power, has been increasing year by year [
1]. However, due to the intermittency and volatility of its output, the rising penetration of renewable energy has gradually increased the difficulty of power balancing [
2], posing severe challenges to the safe and stable operation of the grid [
3,
4]. Technically, renewable energy can already provide frequency regulation services [
5,
6]. Recent studies and regulatory developments in various countries require renewable energy generators, such as wind turbine power generators (WTGs) and photovoltaic power generators (PVGs), to participate in the primary frequency regulation of the power system [
7,
8]. In some regions, including parts of Europe, market mechanisms have also been established to allow renewables to participate in the frequency regulation ancillary service market [
9]. Encouraging the active participation of large-scale renewable energy generators in the frequency regulation market through market-oriented mechanisms is an inevitable way to address the challenges of power system safety, operational stability, and economic efficiency.
When renewable energy generators participate in the energy–frequency regulation market simultaneously, choosing an appropriate bidding strategy can increase their own revenues while alleviating the system’s frequency regulation pressure. Frequency regulation is one of the most critical ancillary services in power systems, playing a key role in maintaining system stability and ensuring secure grid operation. With the increasing penetration of renewable energy and their inherent variability, the importance of frequency regulation has grown significantly. As a result, the design of effective market mechanisms for procuring and allocating frequency regulation resources has become a major area of research. While energy market mechanisms in the day-ahead spot market are relatively mature, the frequency regulation market is still evolving and merits detailed discussion. In recent years, countries have adopted various regulation market designs. The PJM market in the U.S. offers RegA and RegD services and uses a two-part settlement mechanism [
10]. The UK provides FFR, FCDM, and EFR services through bilateral contracts or auctions [
11]. Nordic countries use FCR and FRR under a joint ancillary and balancing mode [
9]. In China, the ancillary service market is still evolving, with AGC-based regulation as the primary service and pilot projects exploring primary regulation markets. Settlements are typically handled on a daily clearing and monthly settlement basis [
12]. Due to the random uncertainty of renewable energy output, a large amount of current literature often combines renewable energy with energy storage to participate in the energy–frequency regulation market during the research process and optimizes the bidding strategies of generators by quantitatively modeling the uncertainty of renewable energy output [
13,
14]. Authors of [
15,
16] constructed a joint clearing model of the energy–frequency regulation market based on frequency regulation performance indicators, which not only fully utilizes renewable energy as a frequency regulation source but also effectively controls the risk of renewable energy–frequency regulation output. An optimization model was developed in [
17] with the objective function of maximizing the revenue of wind farms based on the prediction results of wind power probability density, and the ant-lion optimization algorithm was used to solve the model and obtain the day-ahead optimal bidding power of wind farms participating in the energy–frequency regulation market at the same time.
When renewable energy generators participate in the decision-making transactions of the energy–frequency regulation market, they often face game competition with traditional generators, such as thermal power generators (TPGs), with different types of generators having different natural endowments of primary energy. Authors of [
18] analyzed the bidding behavior of each market player through the Nash master–slave game model. The results showed that reducing the number of oligopolistic players or increasing in the share of stock units could further exacerbate the monopoly phenomenon in the market. Meanwhile, in [
19], the authors developed a multi-oligarchical non-cooperative game model based on power market equilibrium. The model described the market tariff formulation and was solved using a multi-population co-evolutionary algorithm.
In addition to game-theoretic approaches, recent studies have also explored bidding strategies based on different optimization methods, especially under complex markets. The decision of the generator on the bidding price often affects the allocation of the bidding capacity. Currently, the main idea is to establish an optimization model for the electricity market clearing process and derive the optimal bidding price through the solution of the optimization model. Generally, the upper model with the maximum interest of generators as the core and the lower model with the lowest cost of the power system as the core are established, and the upper and lower models are linked and iterated through the tariffs until the two-layer model reaches the equilibrium state; that is to say, the optimal bidding price is obtained. Authors of [
20] established a decision optimization model with the objective of maximizing the interests of each transaction subject in the power market and solved the optimal transaction power and transaction price through the grey correlation projection method and NSGA-II algorithm. Authors of [
21] established a two-layer optimization model of the day-ahead offer strategy with the objective of taking into account the profit and risk of power producers, and they solved the offer strategy of power producers under different load scenarios. Authors of [
22] studied the market tariff mechanism with the purpose of promoting new energy consumption, designed two tariff mechanisms, and simulated the two tariff mechanisms using the simulation method of applying intelligent agents.
At present, most of the investigations only focus on the participation of a small number of renewable energy generators in the frequency regulation market. However, with the further development of renewable energy, a large number of similar-type renewable energy generators entered the market. These generators often share similar resource endowment characteristics, power generation technologies, and face similar market conditions and regulations, leading to a certain degree of similarity in decision-making of large-scale renewable energy generators of the same type. These common factors contribute to a certain degree of similarity in the decision-making of large-scale renewable energy generators of the same type. Mean-field game theory [
23,
24,
25,
26] studies precisely the dynamic behavior among a large number of similar decision-makers for exploring how a large number of similar participants choose the optimal decision in a competitive environment. In [
27], Kizilkale et al. utilized the energy storage of electric thermal loads with similar characteristics to balance the supply–demand imbalance in the power grid caused by the increase in the share of new energy sources, and they established a linear quadratic mean-field game model for the problem of tracking the level of segmented energy storage of large-scale similar electric thermal loads. Authors of [
28] modeled the similar process of large-scale electric vehicle decision-making charging and discharging management and computational offloading as a mean-field game model from the perspective of optimization cost, and the results showed that the model not only had optimal economic efficiency, but also had obvious superiority in maintaining grid stability. Hui et al. used the mean-field game model, specifically by solving the coupled Hamilton–Jacobi–Bellman (HJB) and Fokker–Planck–Kolmogorov (FPK) equations through the fixed-point iterative method and finite-difference method, to obtain the optimal bidding capacity and bidding price for large-scale wind farms participating in energy–frequency regulation markets [
29].
Therefore, this study aims to address the problem of optimizing the bidding strategies of large-scale renewable energy generators in the day-ahead energy–frequency regulation market. As a result, a bi-level game-theoretic bidding decision model is developed, where the inner layer applies mean-field game theory to model competition among same-type generators, and the outer layer uses non-cooperative game theory to capture interactions among different generator types. The goal is to determine the optimal bidding energy and price to maximize individual profits while improving overall market efficiency. The proposed model is solved using a fixed-point iteration and finite-difference method, and its effectiveness is demonstrated through case studies. In summary, the contributions of this paper are as follows:
- (1)
A mean-field game approach is developed to model the strategic interactions among a large number of similar renewable energy generators, enabling an easy analysis of decentralized bidding behavior in the energy–frequency regulation market.
- (2)
A bi-level game-theoretic bidding model is proposed for large-scale renewable energy generators participating in the day-ahead energy–frequency regulation market. The model captures both intra-type competition using mean-field game (MFG) theory and inter-type competition using non-cooperative game theory, allowing a valid analysis of bidding strategies under complex market dynamics.
- (3)
Through extensive case studies with varying renewable penetration levels, the proposed model is validated to improve bidding effectiveness and profitability for renewable generators compared with traditional proportional bidding, stochastic optimization (SO), and robust optimization (RO) approaches, while reducing the reliance on TPGs for frequency regulation services.
2. Trading Mechanism and Framework of the Bi-Level Bidding Model
A trading mechanism is established in this section, which enables WTGs and PVGs to compete with TPGs in the energy–frequency regulation market. In the proposed scenario, large-scale WTGs and PVGs are considered to participate in competition with TPGs in the energy–frequency regulation market. Each generator in the market is free to participate in the energy market or frequency regulation market by planning their own bidding energy and bidding price. The decision-making process of renewable energy generators in the scenario mainly focuses on the day-ahead market based on their own power generation and load demand of the power grid. The day-ahead market is responsible for determining the operational schedule and planned power output of generators for the following day. The day-ahead market covers the two clearing prices: clearing price in the energy regulation market and clearing price in the frequency regulation market. Based on the medium- and long-term energy consumption–decomposition curve, the energy market allows participants to submit their buy and sell offers for the next day.
Through centralized trading before the day, the clearing is optimized to determine the operation mode and planned operation curve of each market entity for the next day. The frequency regulation market generally adopts the organizational method of “day-ahead offer and intra-day centralized clearing”, with the day-ahead declaration information sealed until the operation day, and centralized clearing for each trading session on the operation day. This market is designed to maintain system frequency stability in real time by activating fast-responding resources, evaluated by regulation mileage and performance. During the pre-clearance, the power trading organization will sort the prices according to the frequency regulation mileage and clear them in order from the lowest to the highest, until the sum of the winning frequency regulation capacity meets the demand value of the frequency regulation capacity of the corresponding region in each time period.
The pre-clearance in the energy–frequency regulation market is implemented through centralized declaration and unified clearing. Via optimization computations, the unit start-up combination, time-sharing generation output curves, and time-sharing tariffs can be obtained. The primary procedures encompassed declaration, clearing, and settlement, which are detailed as follows:
- (1)
Declaration: Market participants engaged in trading are required to declare the principal trading information, including the output interval for the trading day and the prices of energy purchase, sale, start-up, and shutdown on the day before trading, based on the daily decomposition of medium- and long-term power forecasts.
- (2)
Clearing: The power trading institution aggregates the information declared by market participants. Considering factors such as the system load forecast, generating unit maintenance schedules, and operating constraints of generating units, it formulates the maximization of the comprehensive benefits of system operation as the objective function. Subsequently, the market participants are cleared in ascending order of declared prices to formulate the generating unit operation plan for the trading day.
- (3)
Settlement: The clearing price is anchored on the offer price of the last cleared unit, which serves as the marginal settlement price for all successful bidders. Based on the data provided by the power dispatching organization, such as the power generation quantity of the generating company, power metering curve data, and dispatching instruction data, the power trading institution prepares and issues settlement certificates in accordance with the transaction results and actual operation data. This facilitates the final electricity tariff settlement between the user side and generation side.
The proposed bi-level bidding model was constructed under the energy–frequency regulation mechanism, where generators participated in coordinated market operations. Assume that there were
MW WTGs,
Ms PVGs, and
Mth TPGs in the energy–frequency regulation market. The initial bidding strategies of these generators within the market were denoted as
sw,
ss, and
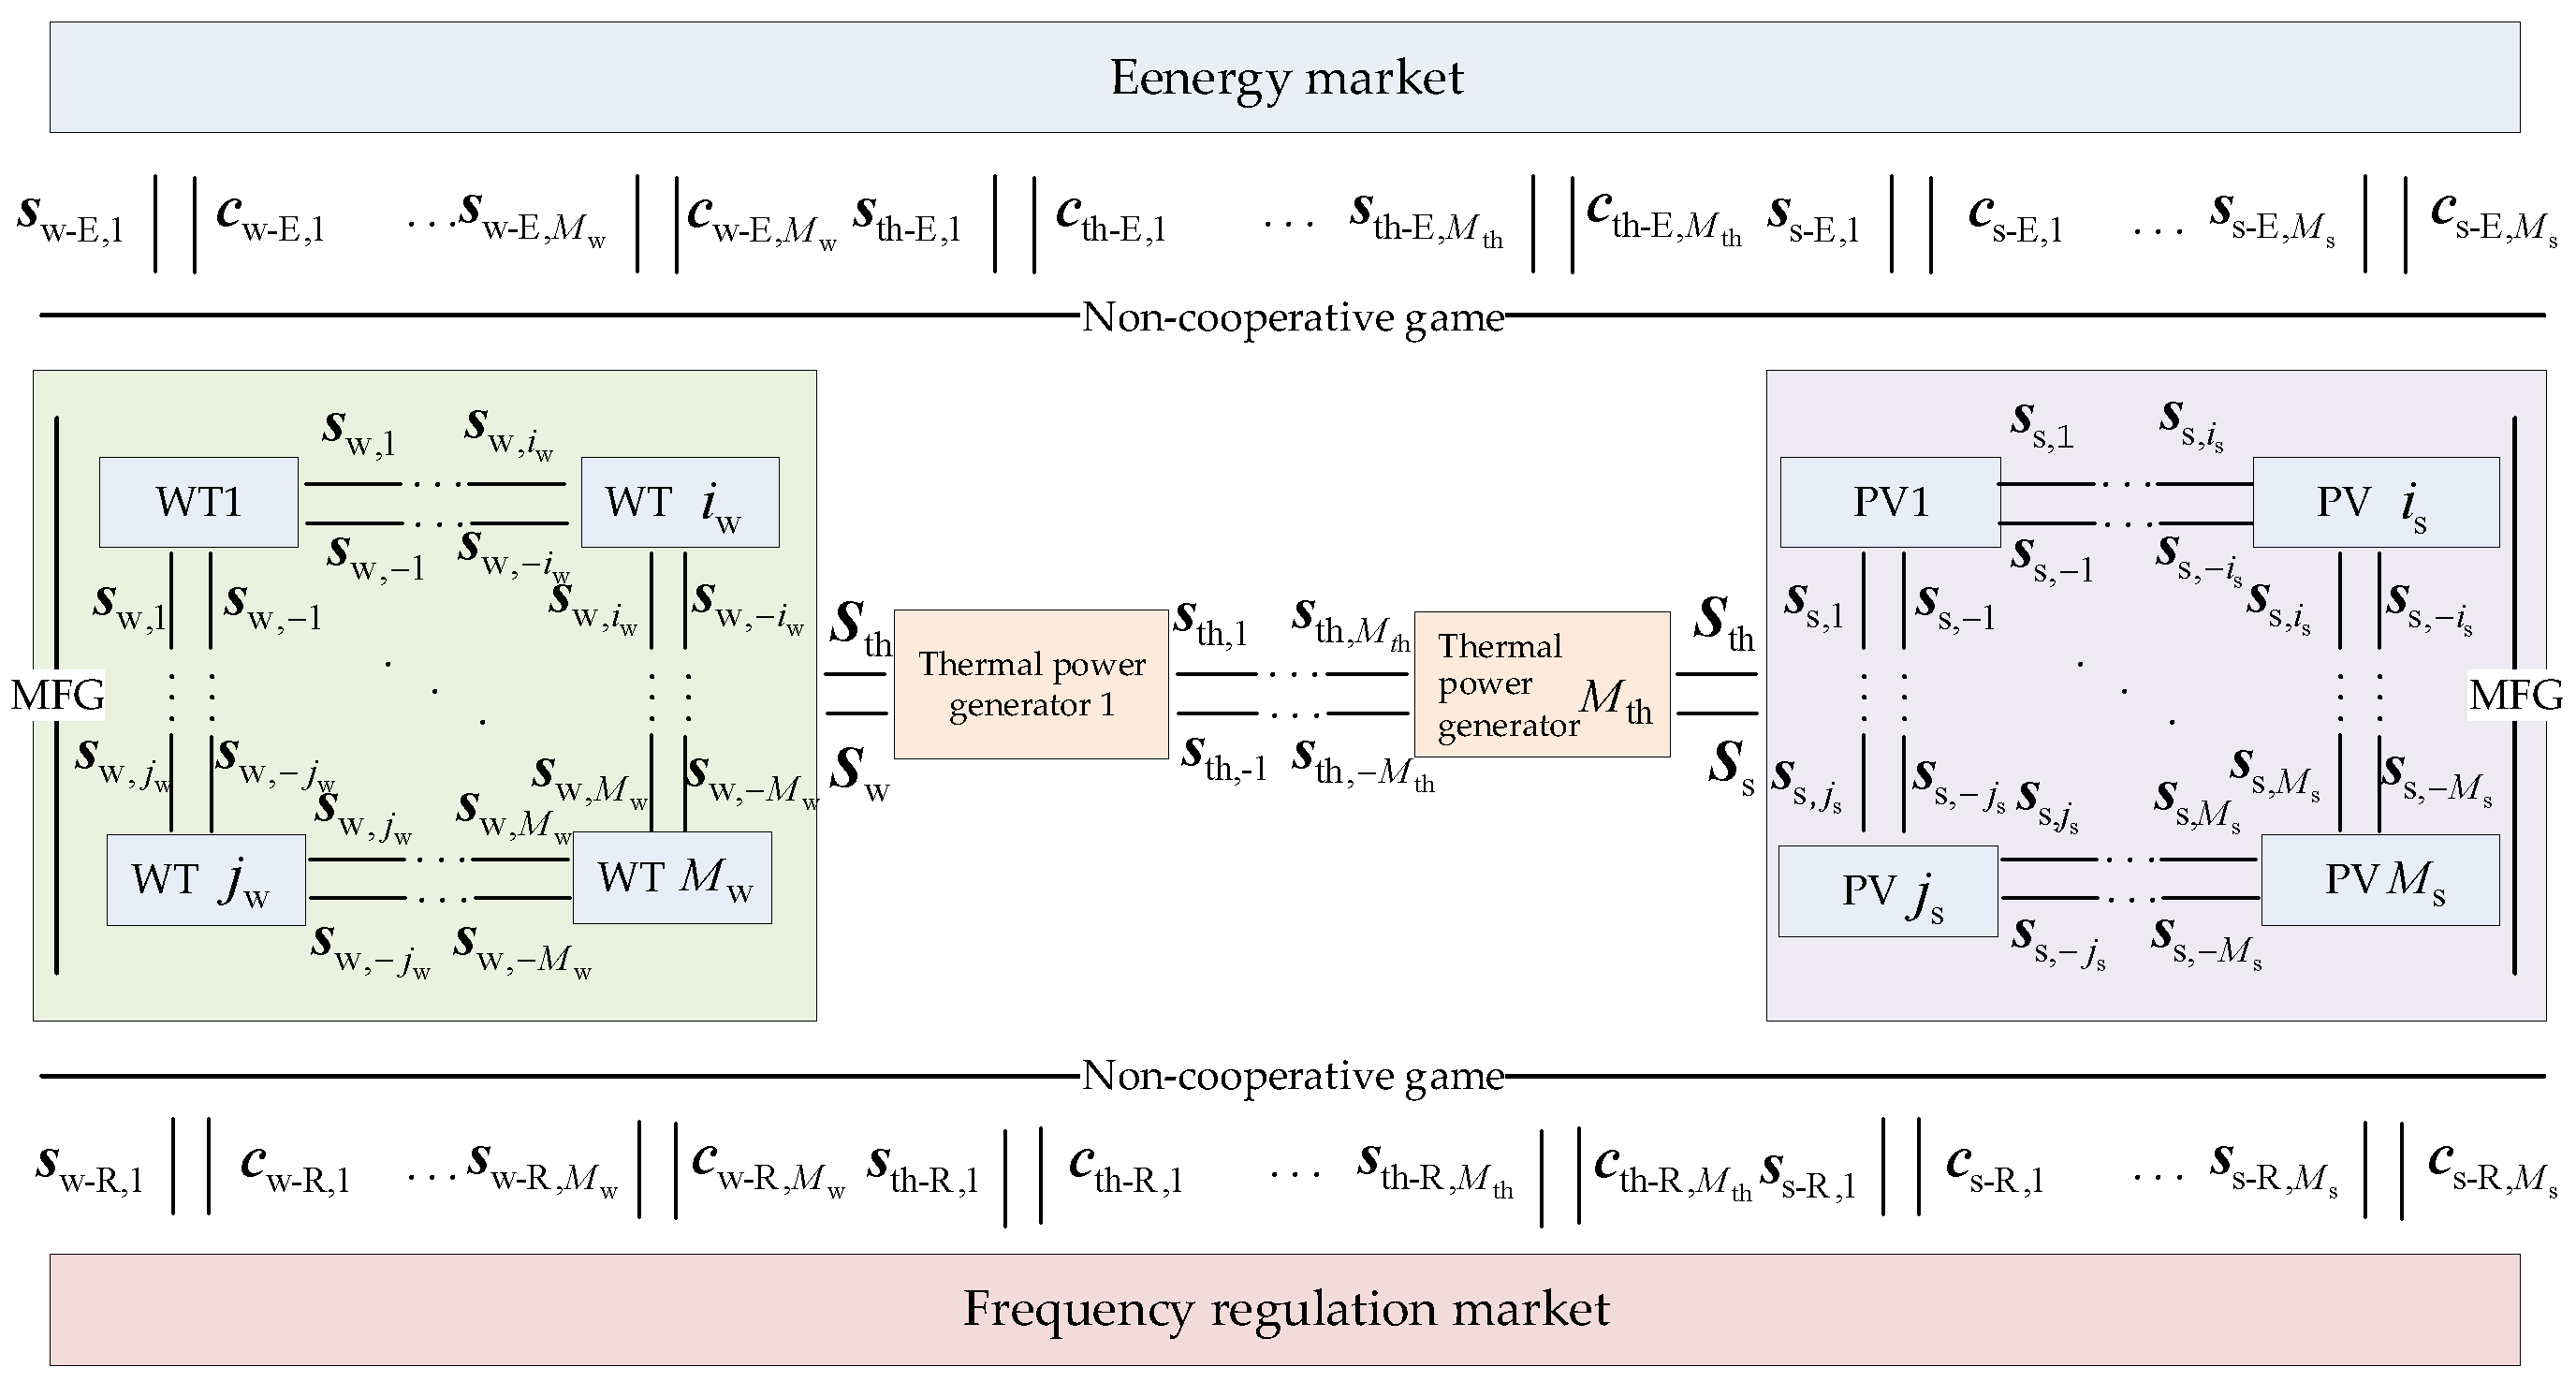
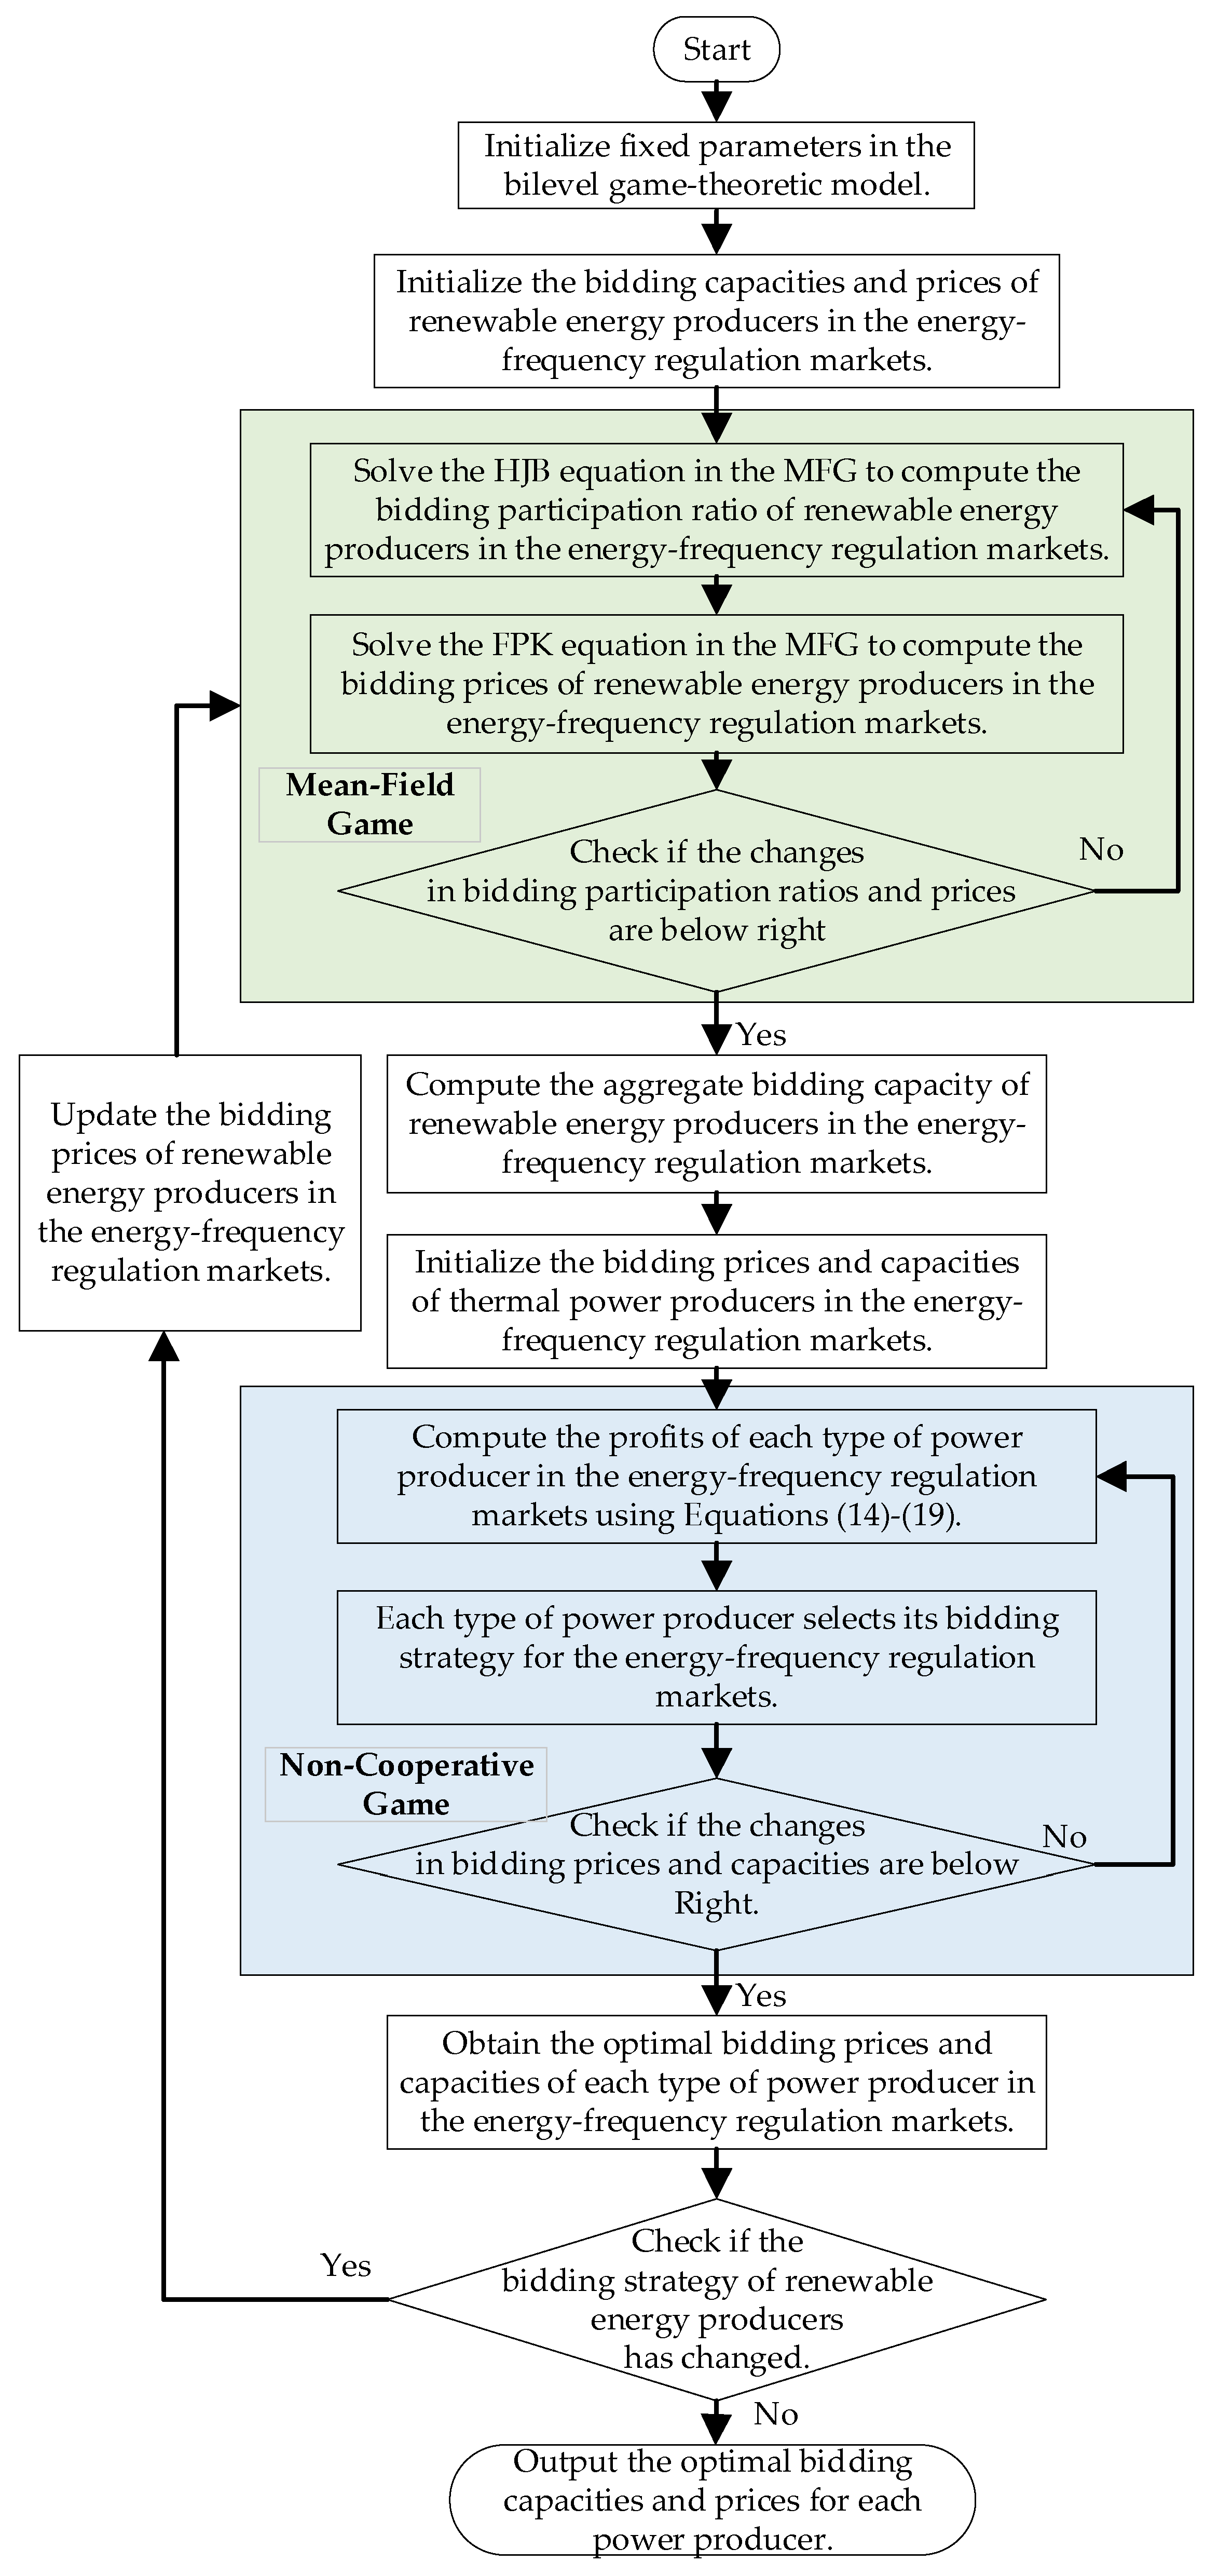
sth, respectively. Given the large number of renewable energy generators and their comparable generation characteristics, a mean-field game among the identical renewable energy generators (large-scale WTGs and PVGs) was performed to ascertain their bidding strategies. Grounded on the results of the mean-field game, similar renewable energy generators were regarded as a collective and engaged in a non-cooperative game with a relatively fewer number of TPGs, thereby procuring updated bidding strategies. The results of the mean-field game and the non-cooperative game were iteratively refined until no generator changed its bidding strategy, at which point the ultimate bidding strategy was considered optimal. The bidding decision-making process of generators participating in the energy–frequency regulation market is illustrated in
Figure 1.
In
Figure 1,
denote the indices of WTGs. The row vector
represents the bidding strategy of WTG
i in the energy–frequency regulation market, including the bidding price
in the energy regulation market, the bidding energy
in the energy market, the bidding price
in the frequency regulation market, and the bidding energy
in the frequency regulation market. Then,
denotes all WTGs except
i, and
represents the strategies of all other WTGs except
i. The term
denotes the aggregate strategy of large-scale WTGs participating in the energy–frequency regulation market, and the vector
represents the bidding strategy of WTG
i in the energy regulation market, while
represents its bidding strategy in the frequency regulation market. The energy market clearing result
includes the clearing price
and the awarded energy
for WTG
i. Similarly, the frequency regulation market clearing result
includes the clearing price
and the awarded energy
. The parameter definitions for PVGs and TPGs are analogous to those for WTGs, distinguished by subscripts, where the subscript
s denotes variables related to PVGs, and the subscript
th denotes variables related to TPGs.
3. Mean-Field Game Model for Large-Scale Renewable Energy Generators
Based on the mechanism, the inner-layer mean-field game model is formulated to capture the decentralized decision-making behavior of WTGs. The resource endowment traits of large-scale WTGs and PVGs exhibit a certain level of homogeneity. The procedures for constructing the mean-field bidding decision model are analogous for both WTGs and PVGs. Here, WTGs are employed as an exemplar for elucidation.
Mean-field game theory delves into the optimal strategy selection among a large number of similar participants. To mitigate the influence of disparities in installed capacity among distinct WTGs, the pertinent variables of WTGs depicted in
Figure 1 are normalized. Specifically,
is defined as the ratio of the bidding capacity to the installed capacity of WTG
partaking in the frequency regulation market at a given time
, which corresponds to the state of WTG within the mean-field game framework. Meanwhile,
is the ratio of the bidding capacity to the installed capacity of WTG
in the energy market at a given time
t, aligning with the control exerted by WTGs in the mean-field game, and
represents the installed capacity of WTGs
In light of the similarity in decision-making behaviors of large-scale WTGs participating in energy–frequency regulation market trading, one WTG was taken as the example for in-depth analysis. Subsequently, the label of WTG was further expunged to derive the status and control of the representative WTG.
The state of WTG at
is modeled by a random variable
with distribution
, so as to approximate the distribution of the overall behavior of large-scale WTGs. Here,
is the limit distribution of the empirical distribution
:
where
represents the ratio of the bidding energy of WTG
participating in the frequency regulation market at time
t to its installed capacity,
is an indicator function, where
is
and
is
, and
represents the empirical distribution function of the bidding strategies of WTGs participating in the frequency regulation market at time
t. When the number
of WTGs is relatively large,
will converge to a probability density
, and the bidding strategies of all WTGs will be determined by
in the frequency regulation market.
The evolution of the state
of WTG is described by the stochastic differential equation in Formula (2), which captures both deterministic and stochastic dynamics of the bidding state. This enables the equation to accurately depict the dynamic evolution process of the system, handling the variability of renewable energy sources. Meanwhile, it also links the state evolution of individual WTG with the average field of the entire market, enabling individual decision-making to be based on the overall state of the market for optimization:
where
is the drift term, representing the deterministic change part of
,
denotes the ratio of the predicted power generation of generators at time
t to its installed capacity, and
is the diffusion term, representing the stochastic change part of
.
represents the Brownian motion, and
captures the stochastic perturbations around the predicted generation profile, while
represents the intensity of the Brownian motion. This formulation allows the model to better represent the uncertain nature of renewable generation and ensures that bidding strategies are optimized under realistic conditions. Also,
and
jointly affect the increment
as coefficients. It should be emphasized that the state transition of renewable energy generators is stochastic, which can all be derived from the probability density
.
In the process of participating in the energy–frequency regulation market, WTGs need to declare the bidding capacity and the bidding price. The bidding price of WTGs can be expressed as [
23,
30]:
where
represents the bidding price in the energy market,
represents the bidding price in the frequency market,
represents the provided energy demand at time
t,
represents the provided energy demand by other energy sources,
represents the provided frequency demand of WTG at time
t,
represents the provided frequency demand by other energy sources,
and
are conversion parameters between bidding price and energy demand in the energy market, while
and
are conversion parameters between bidding price and frequency demand in the frequency market.
In the energy–frequency regulation market, the strategic goal of WTG is to maximize the total revenue, which can be expressed as follows:
where
represents the expected value,
represents the total revenue of WTG,
represents the process revenue of WTG, and
represents the terminal revenue that depends on the terminal status of
.
The process revenue can be expressed as:
where
represents WTG’s profit in the energy market at time
t,
represents the capacity revenue in the frequency market,
represents the performance revenue in the frequency regulation market,
,
, and
are the cost coefficients,
represents the generation cost for WTG,
represents the index coefficient of frequency modulation performance for WTG,
represents the price of frequency regulation performance, and
represents the mileage benefit factor of WTG.
Based on the state equation and profit function of WTGs, a mean-field game model for large-scale WTGs participating in the energy–frequency regulation market was established. The mean-field game model mainly consisted of two equations, namely, the backward Hamilton–Jacobi–Bellman (HJB) equation and the forward Fokker–Planck–Kolmogorov (FPK) equation. The HJB equation describes the optimal control determined by an individual based on the overall state, while the FPK equation describes the update of the overall state after the individual’s state change according to the control. In the scenario set in this paper, the HJB equation describes the optimal ratio of the bidding energy capacity of renewable energy generators in the energy–frequency regulation market to their installed capacity, and the FPK equation describes the change in the probability density of the bidding capacity ratio. Substituting Equations (2)–(12) into the HJB–FPK equation system, the mean-field game equation system for large-scale renewable energy generators participating in the energy–frequency regulation market can be obtained as follows:
where
represents WTG’s assessment revenue in the energy market,
represents WTG’s assessment revenue in the frequency market,
represents the error rate,
represents the deviation in power generation of WTG at time
t,
represents the punish price in the energy market,
represents the punish price in the frequency market,
represents the proportion of deviation allocated to the frequency market, and
represents the proportion of deviation allocated to the energy market.
Basically, the mean-field game for large-scale WTGs participating in the energy–frequency regulation market can be established. The mean-field game model mainly consists of two equations [
24], namely, the Hamilton–Jacobi–Bellman (HJB) equation and the Fokker–Planck–Kolmogorov (FPK) equation. The HJB–FPK equation can be expressed as:
where
represents the value of Function (3) with
, and
represents the variable in the HJB–FPK equation.
In Equation (13), the bidding price of WTGs serves as a bridge for the iterative solution of the HJB–FPK equation. When and no longer change, a Nash equilibrium is reached. In game theory, Nash equilibrium corresponds to a state where, assuming that game participants have a number of available strategies, no single game participant is interested in unilaterally changing their strategy. When the mean-field game reaches a Nash equilibrium, the control at this time is the optimal control for renewable energy generators participating in the energy–frequency regulation market. This strategy is suitable for each participant, and at this time is the probability density of the system state when the entire system decides on the optimal strategy. Based on the probability density and the optimal control under Nash equilibrium, the bidding price of renewable energy generators participating in the energy–frequency regulation market can be calculated. The bidding price is an equilibrium price formed by the equilibrium points of each participant in the mean-field game and is also suitable for every participant.
6. Case Study
In this section, a case study is presented to show the performance of the proposed bi-level game model using day-ahead market data, analyzing bidding strategies for renewable and thermal generators under different scenarios.
6.1. Simulation Parameters
In the case study, a day-ahead market was introduced to show the performance of the proposed approach. The participants in the game were large-scale WTGs and PVGs, as well as two TPGs. Through the mean-field and non-cooperative games, they iteratively optimized each other to form the optimal bidding strategies.
The installed capacity and cost parameters of WTGs, PVGs, and TPGs are shown in
Table 1, which take the renewable energy installed capacity data of Germany from the ENTSO-E website [
31] as the reference. In the table, a, b, and c represent the cost parameters for each type of generator. Since the same type of renewable energy generator has similar power generation characteristics to generate energy, the ratios of the total forecasted power generation to the total installed capacity to simulate the ratio of the forecasted power generation to the installed capacity of a single renewable energy generator were used.
In order to prevent malicious competition, it is stipulated that the upper and lower limits for generators to participate in the energy–frequency regulation market are 4000 EUR/MWh and −500 EUR/MWh, respectively. It is reasonable to assume that the price of the frequency regulation performance in the frequency regulation market
is 5 EUR/MWh. For the renewable energy in the market of the deviation of the penalty mechanism, we set the error rate
in the range between [−0.01, 0.01]. When the error rate was more than zero, the penalty price in the energy market
= 6.25 EUR/MWh; when the error rate was less than zero, the penalty price in the energy market
= 62.5 EUR/MWh, and the penalty price in the frequency regulation market
= 56.07 EUR/MWh. Combined with the other parameters provided in
Table 2, simulation experiments were carried out for the bidding decision-making model proposed in this paper.
During the simulation process, the generation data and load data of WTGs and PVGs were adopted from the ENTSO-E website from 16 January 2022 to 16 February 2022 for Germany. The German data were used for their typicality with a high proportion of renewable energy generation, as the proportion of renewable energy generation reached 55% in 2023, with a total generation capacity of 251.2 TWh [
32]. Firstly, we assumed that a scenario with a high percentage of new energy generation was up to 70%, which was analyzed in detail, and then comprehensively analyzed other typical scenarios with a high percentage of renewable energy generation. Generators’ decisions on both bidding energy and bidding price in the market depend on the forecasts of generation and load, the load forecast curves for 17 February 2022, and the output forecast curves of WTGs and PVGs obtained based on the random forest algorithm [
33,
34], and the main hyperparameters are presented in
Table 3. The frequency regulation demand was defined as 10% of the load demand.
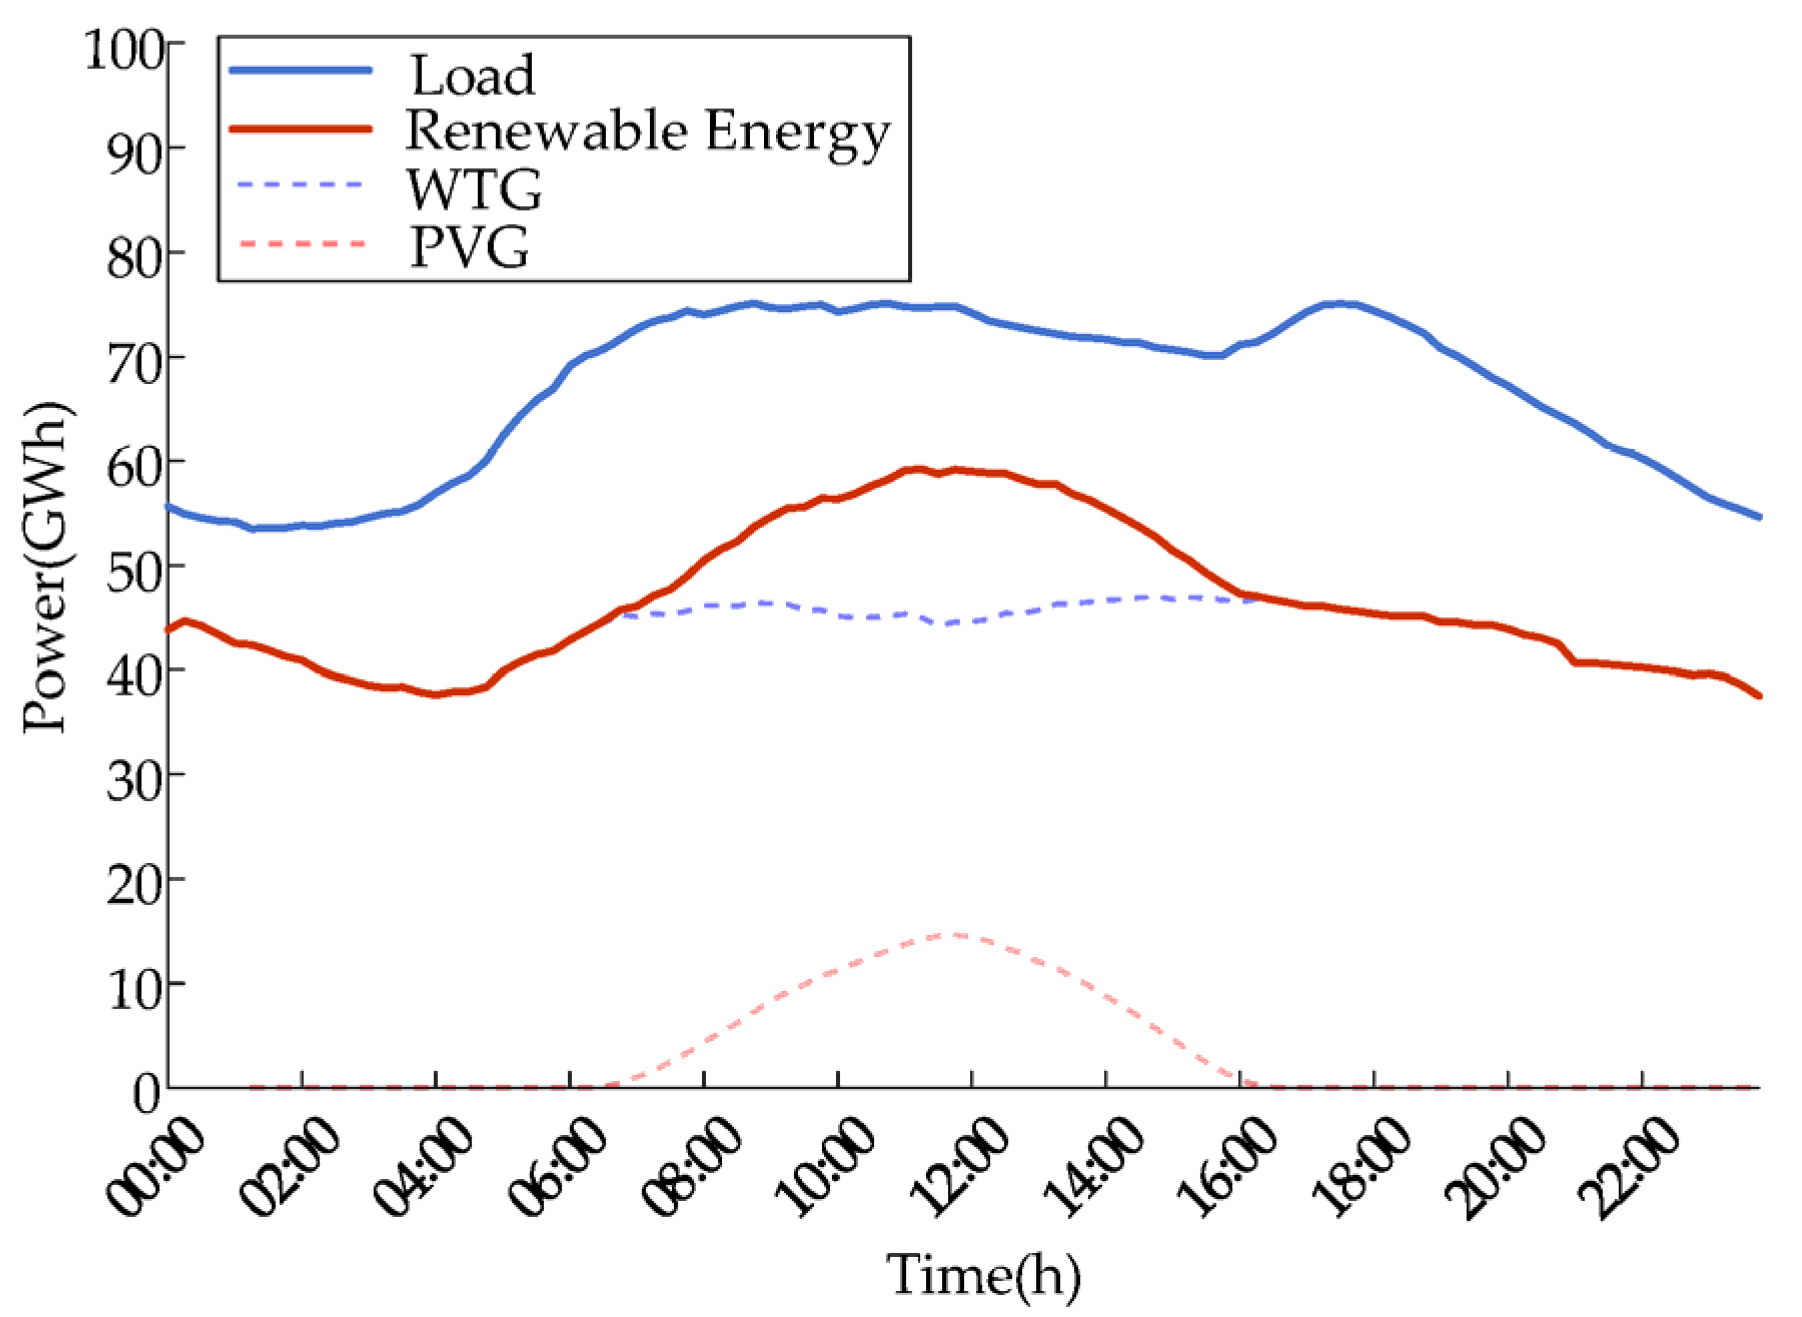
6.2. Bidding Strategy Analysis with 70% Renewable Penetration Relative to Load
Firstly, under the scenario with 70% of new energy generation, the load and renewable energy output predicted by the random forest algorithm are shown in
Figure 3.
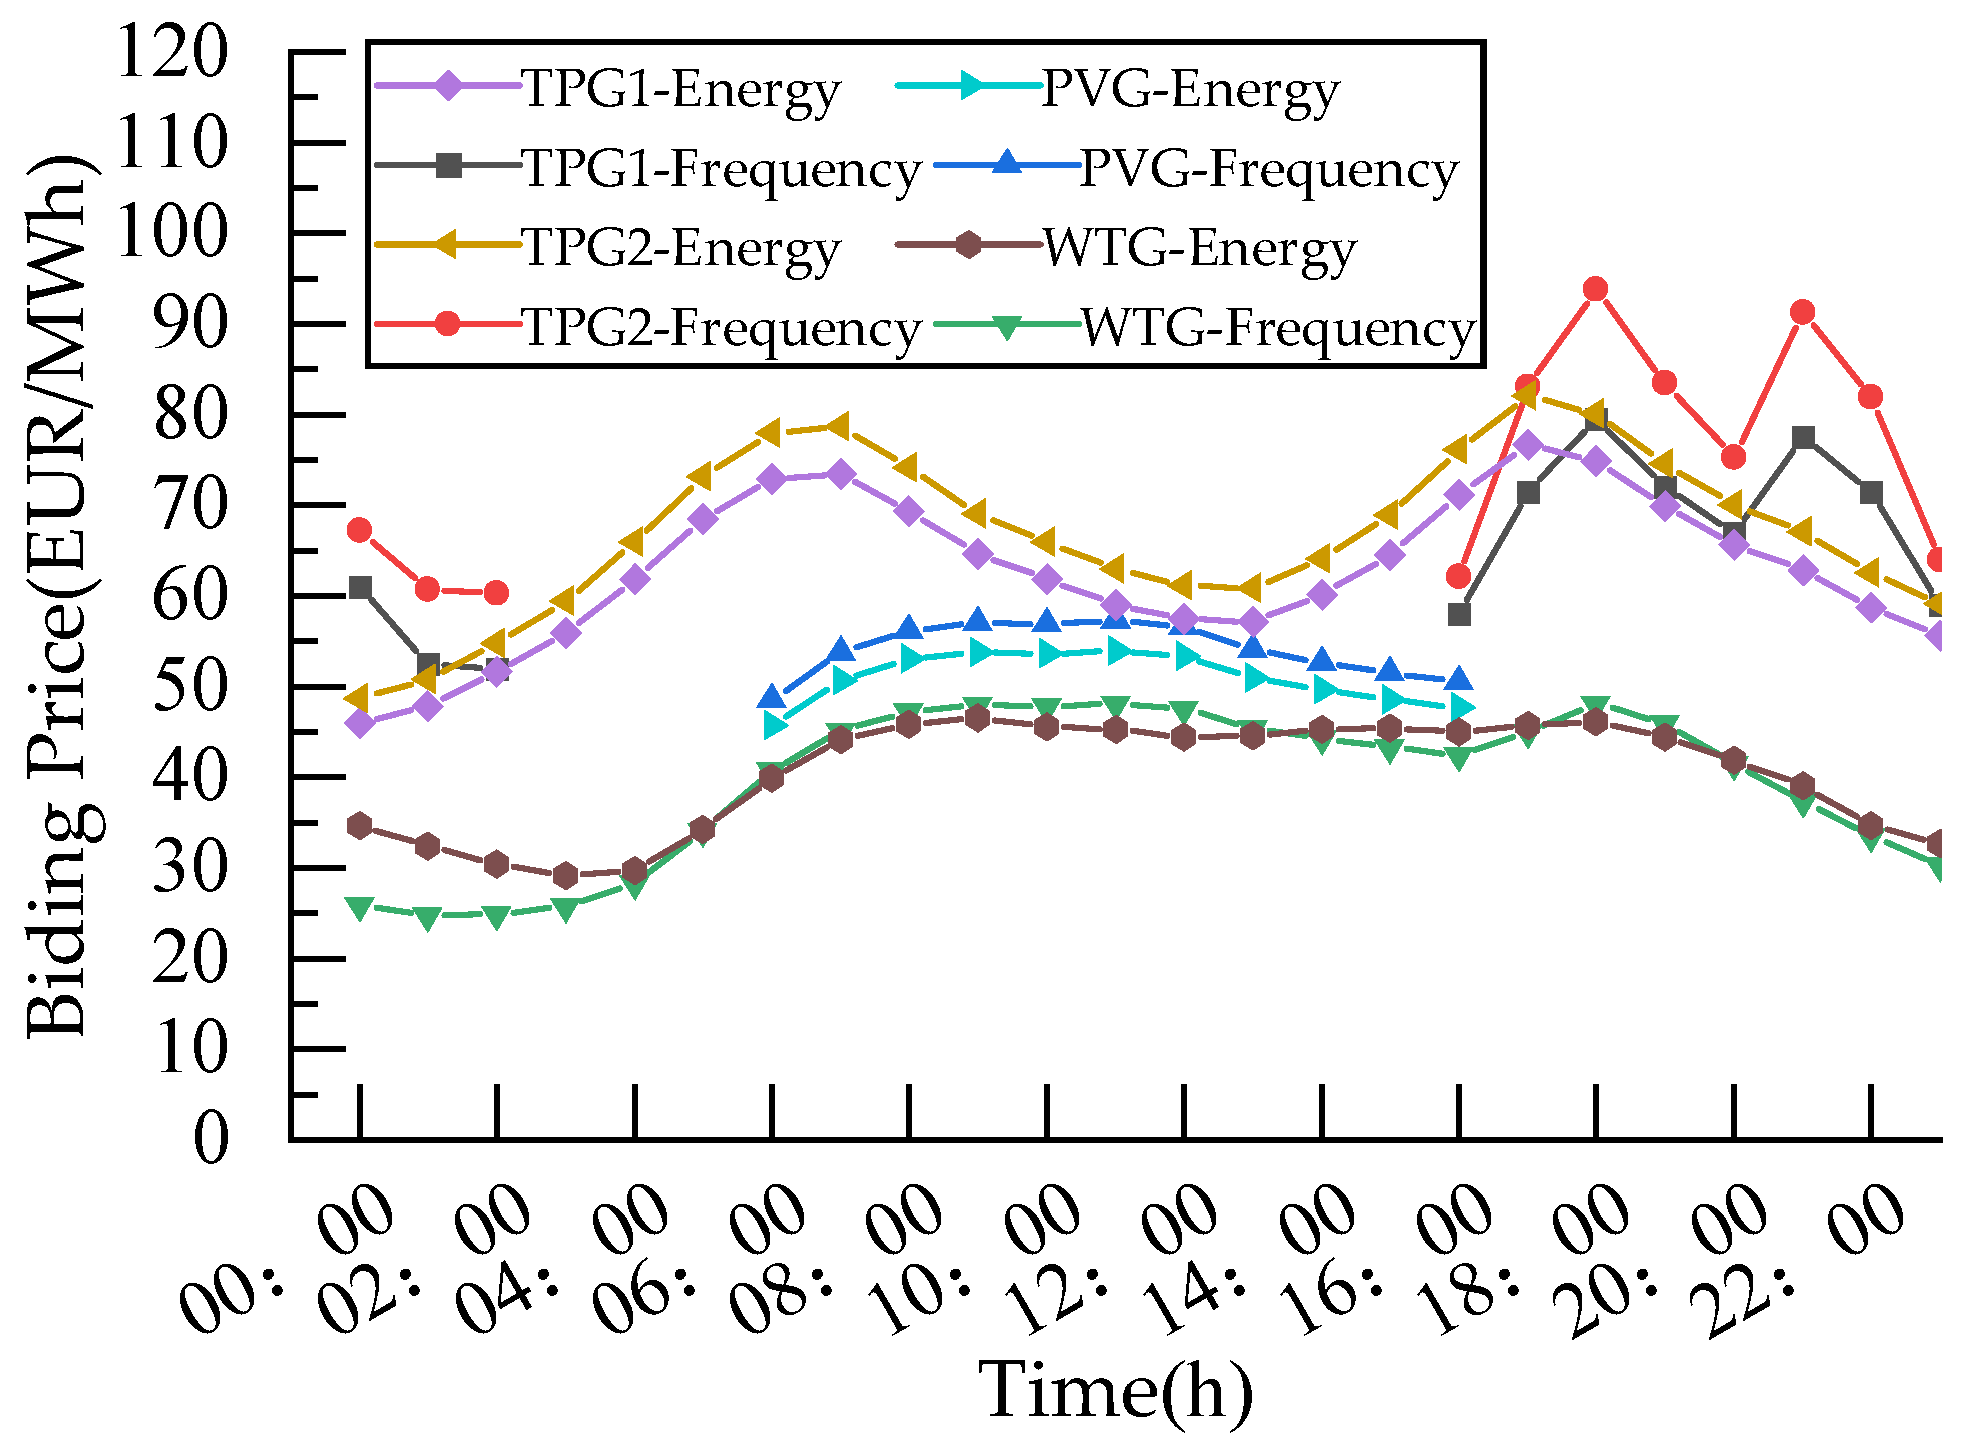
Based on the predicted output, the bidding strategy was optimized by the two-layer model.
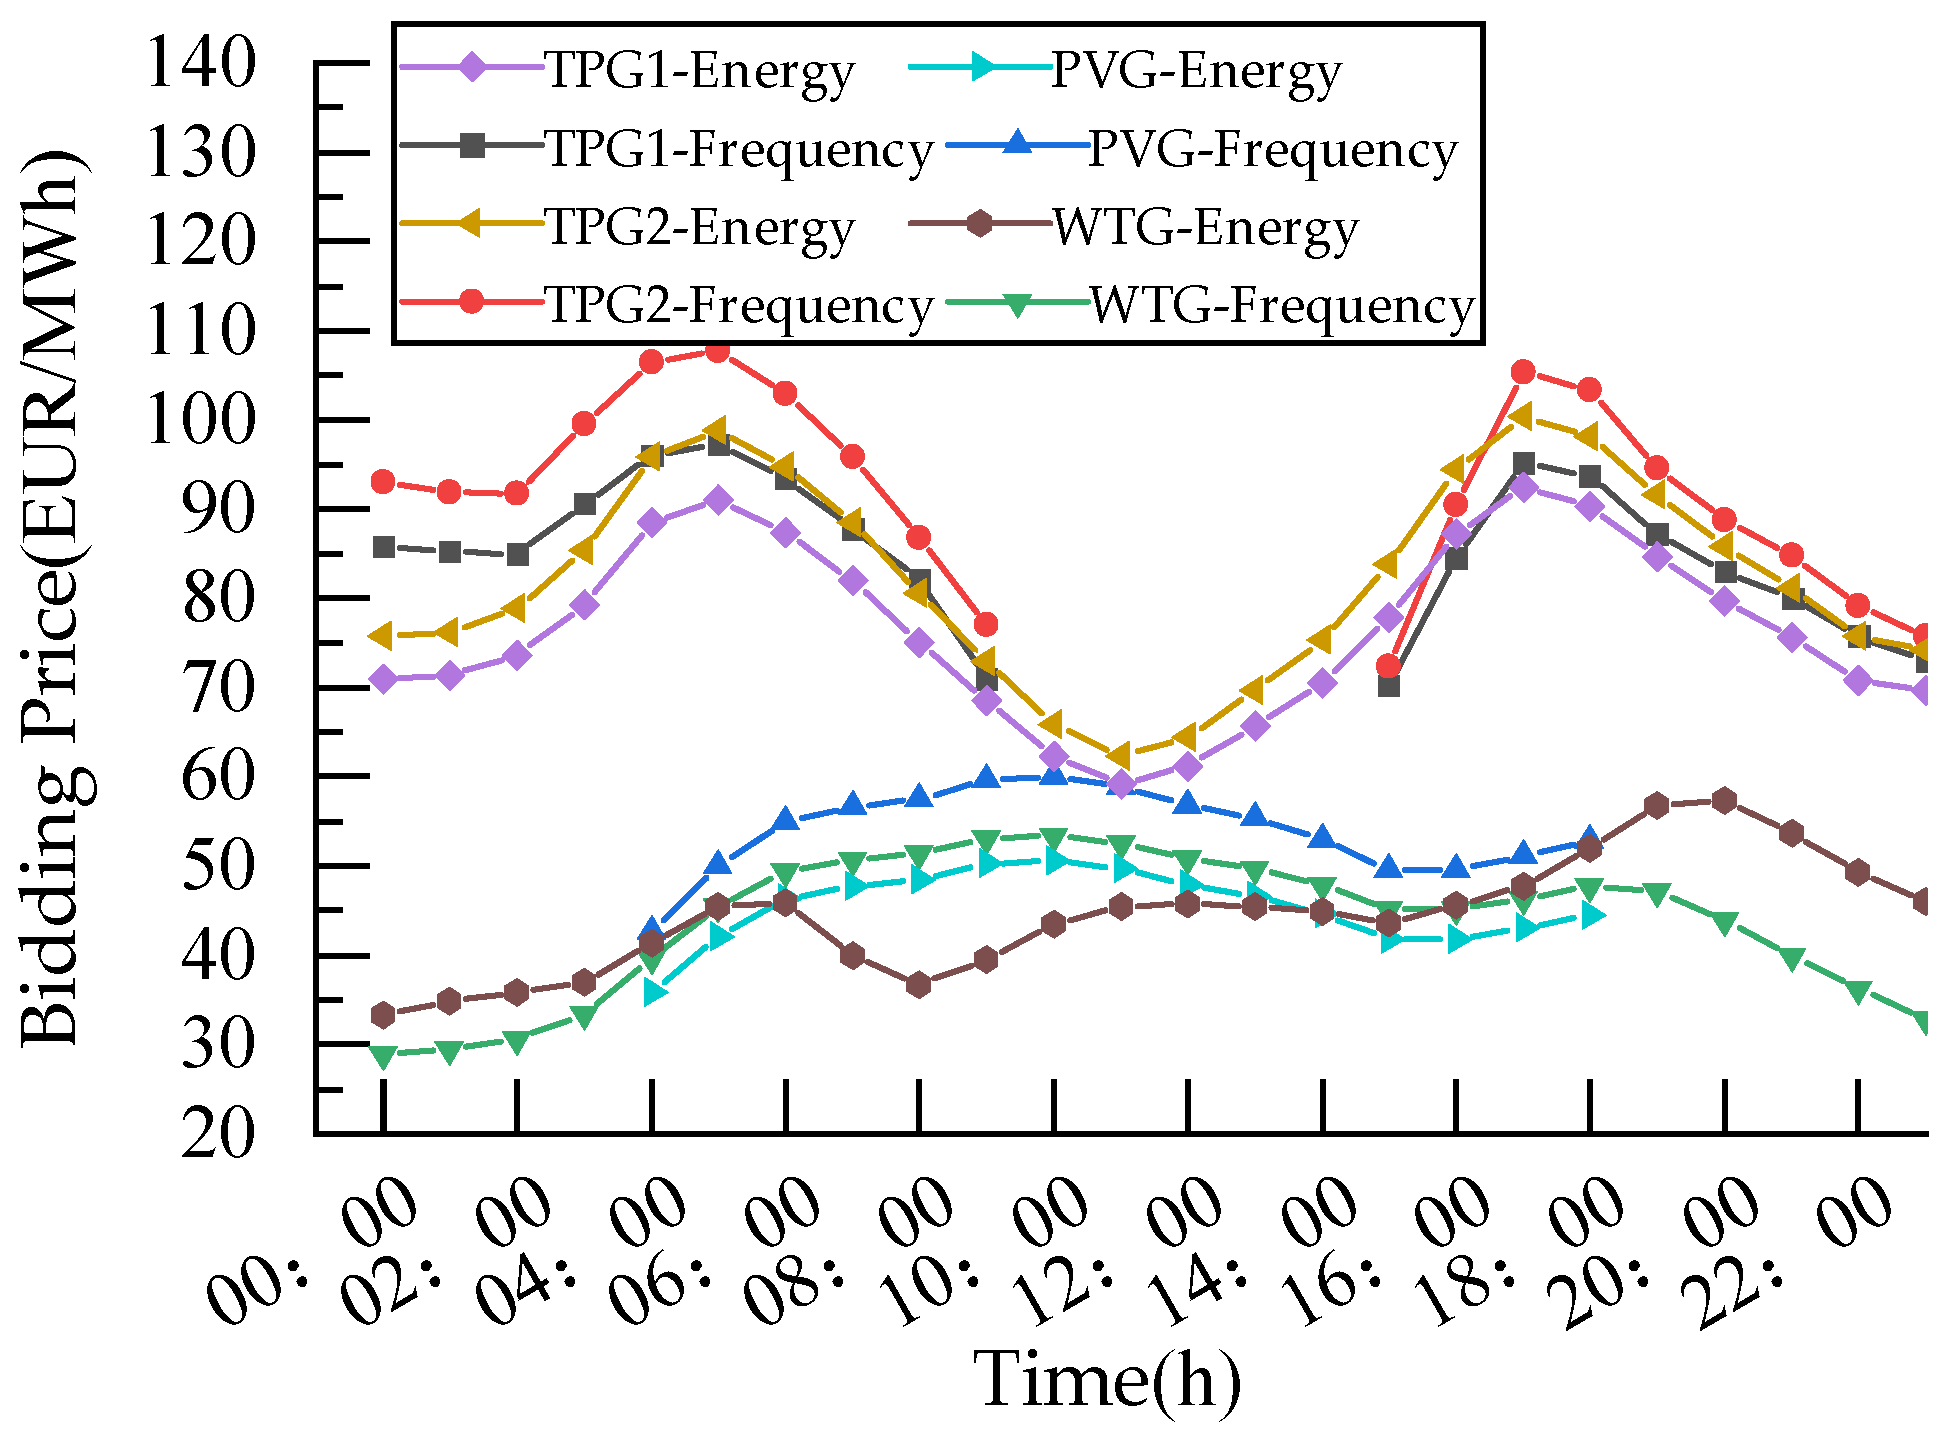
Figure 4 shows the bidding prices of large-scale PVGs and WTGs in the energy–frequency regulation market at the Nash equilibrium. The bidding price curve of PVGs and WTGs was jointly influenced by the predicted power generation and load curves, reaching its peak at 08:00 and 18:00. The bidding price of TPGs mainly depends on their bidding energy, showing a trend of rising, then falling, and then rising again. Overall, the bidding price of TPGs was higher than that of PVGs and WTGs, due to the higher cost of TPGs compared to PVGs and WTGs.
In
Figure 4, when the load is on the rise, the bidding price of new energy generators for the frequency regulation market is higher than that of the energy market. This is because higher load increases the demand of frequency regulation and, as a consequence, the market incentivizes participation to maintain the stable operation of the power grid. In order to obtain more profits, generators will increase their bidding price. Conversely, when the load is on the decline, the decrease in frequency modulation demand leads to lower bidding prices for generators to participate in the frequency regulation market than in the energy market, and generators are more inclined to participate in the energy market to obtain more profits.
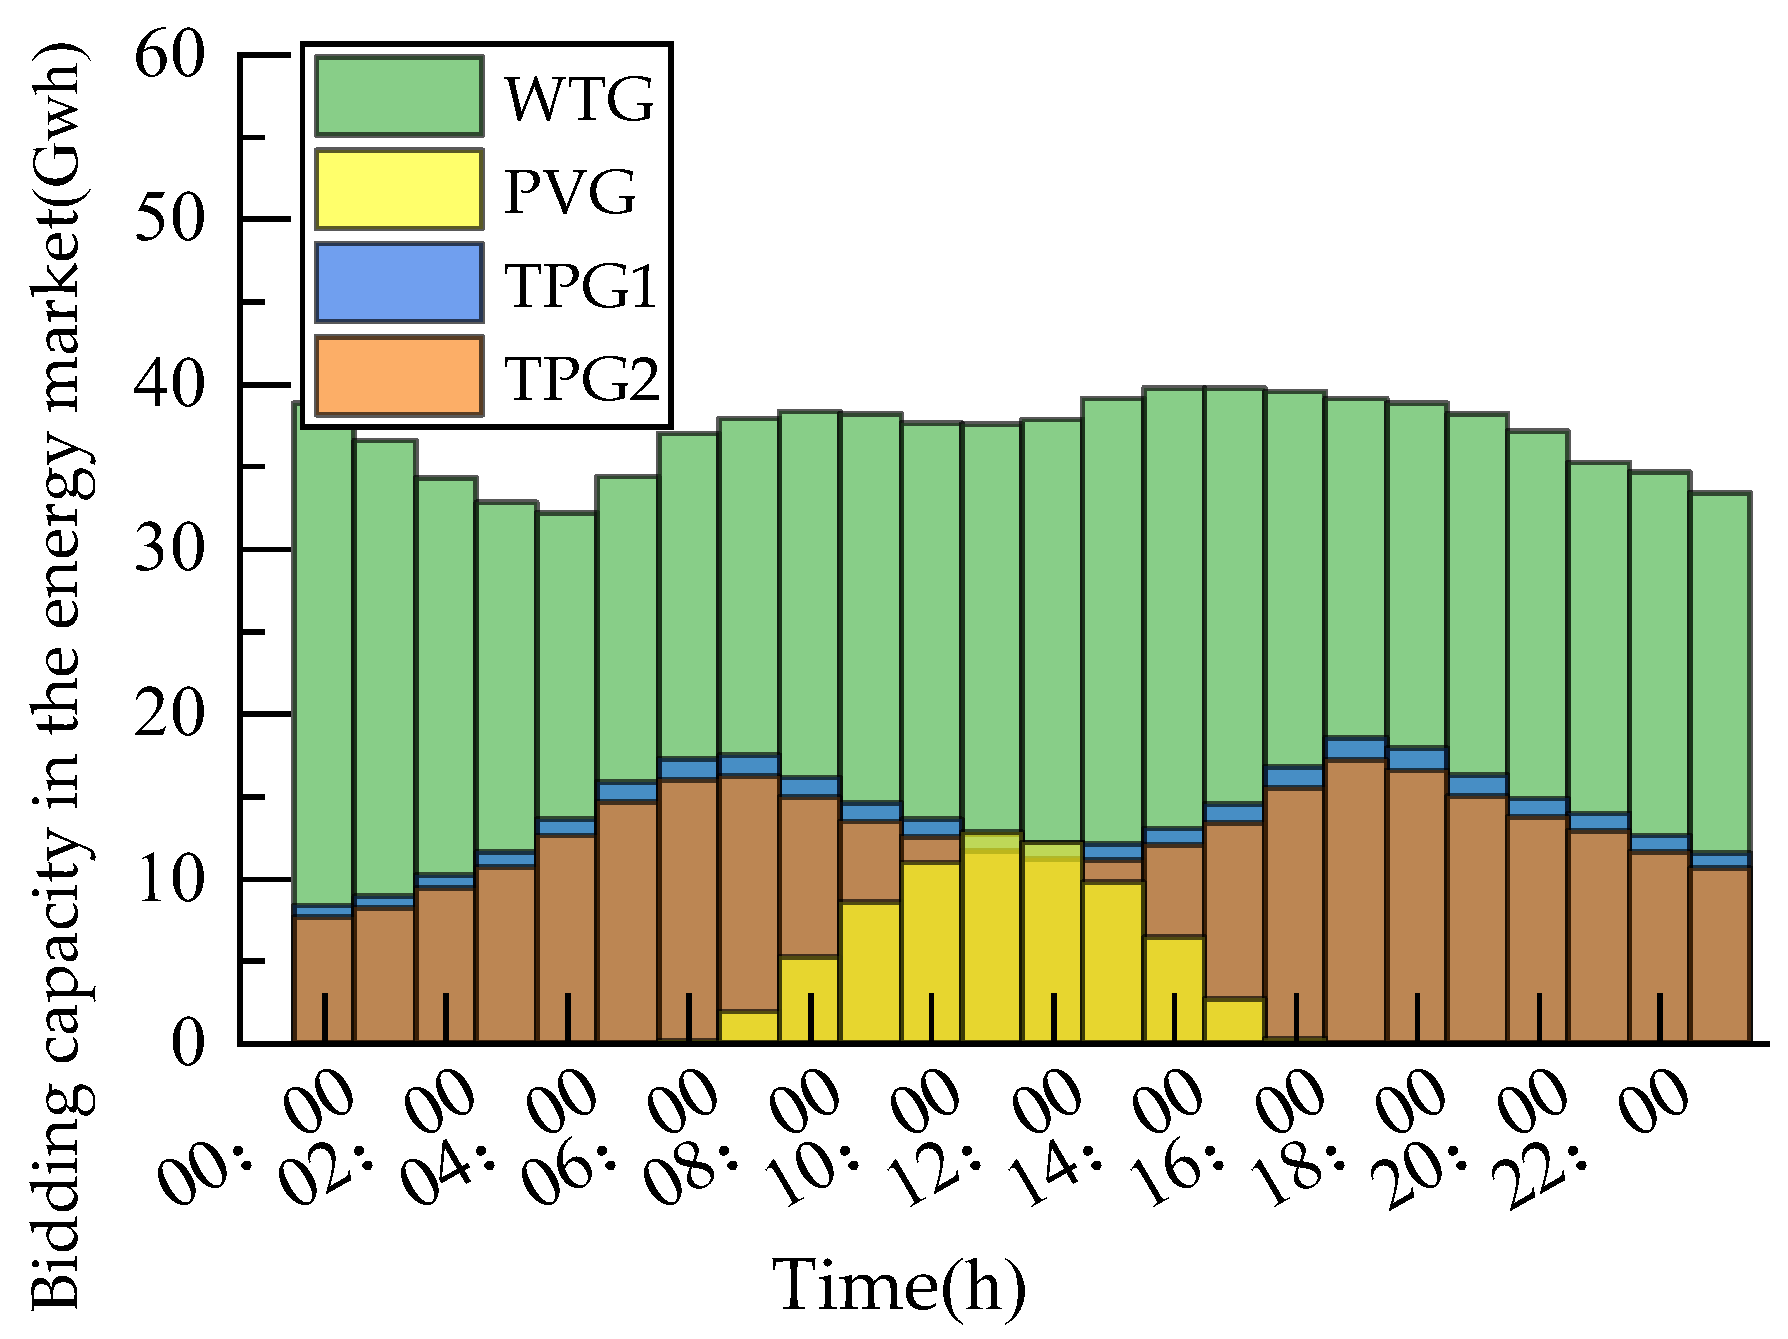
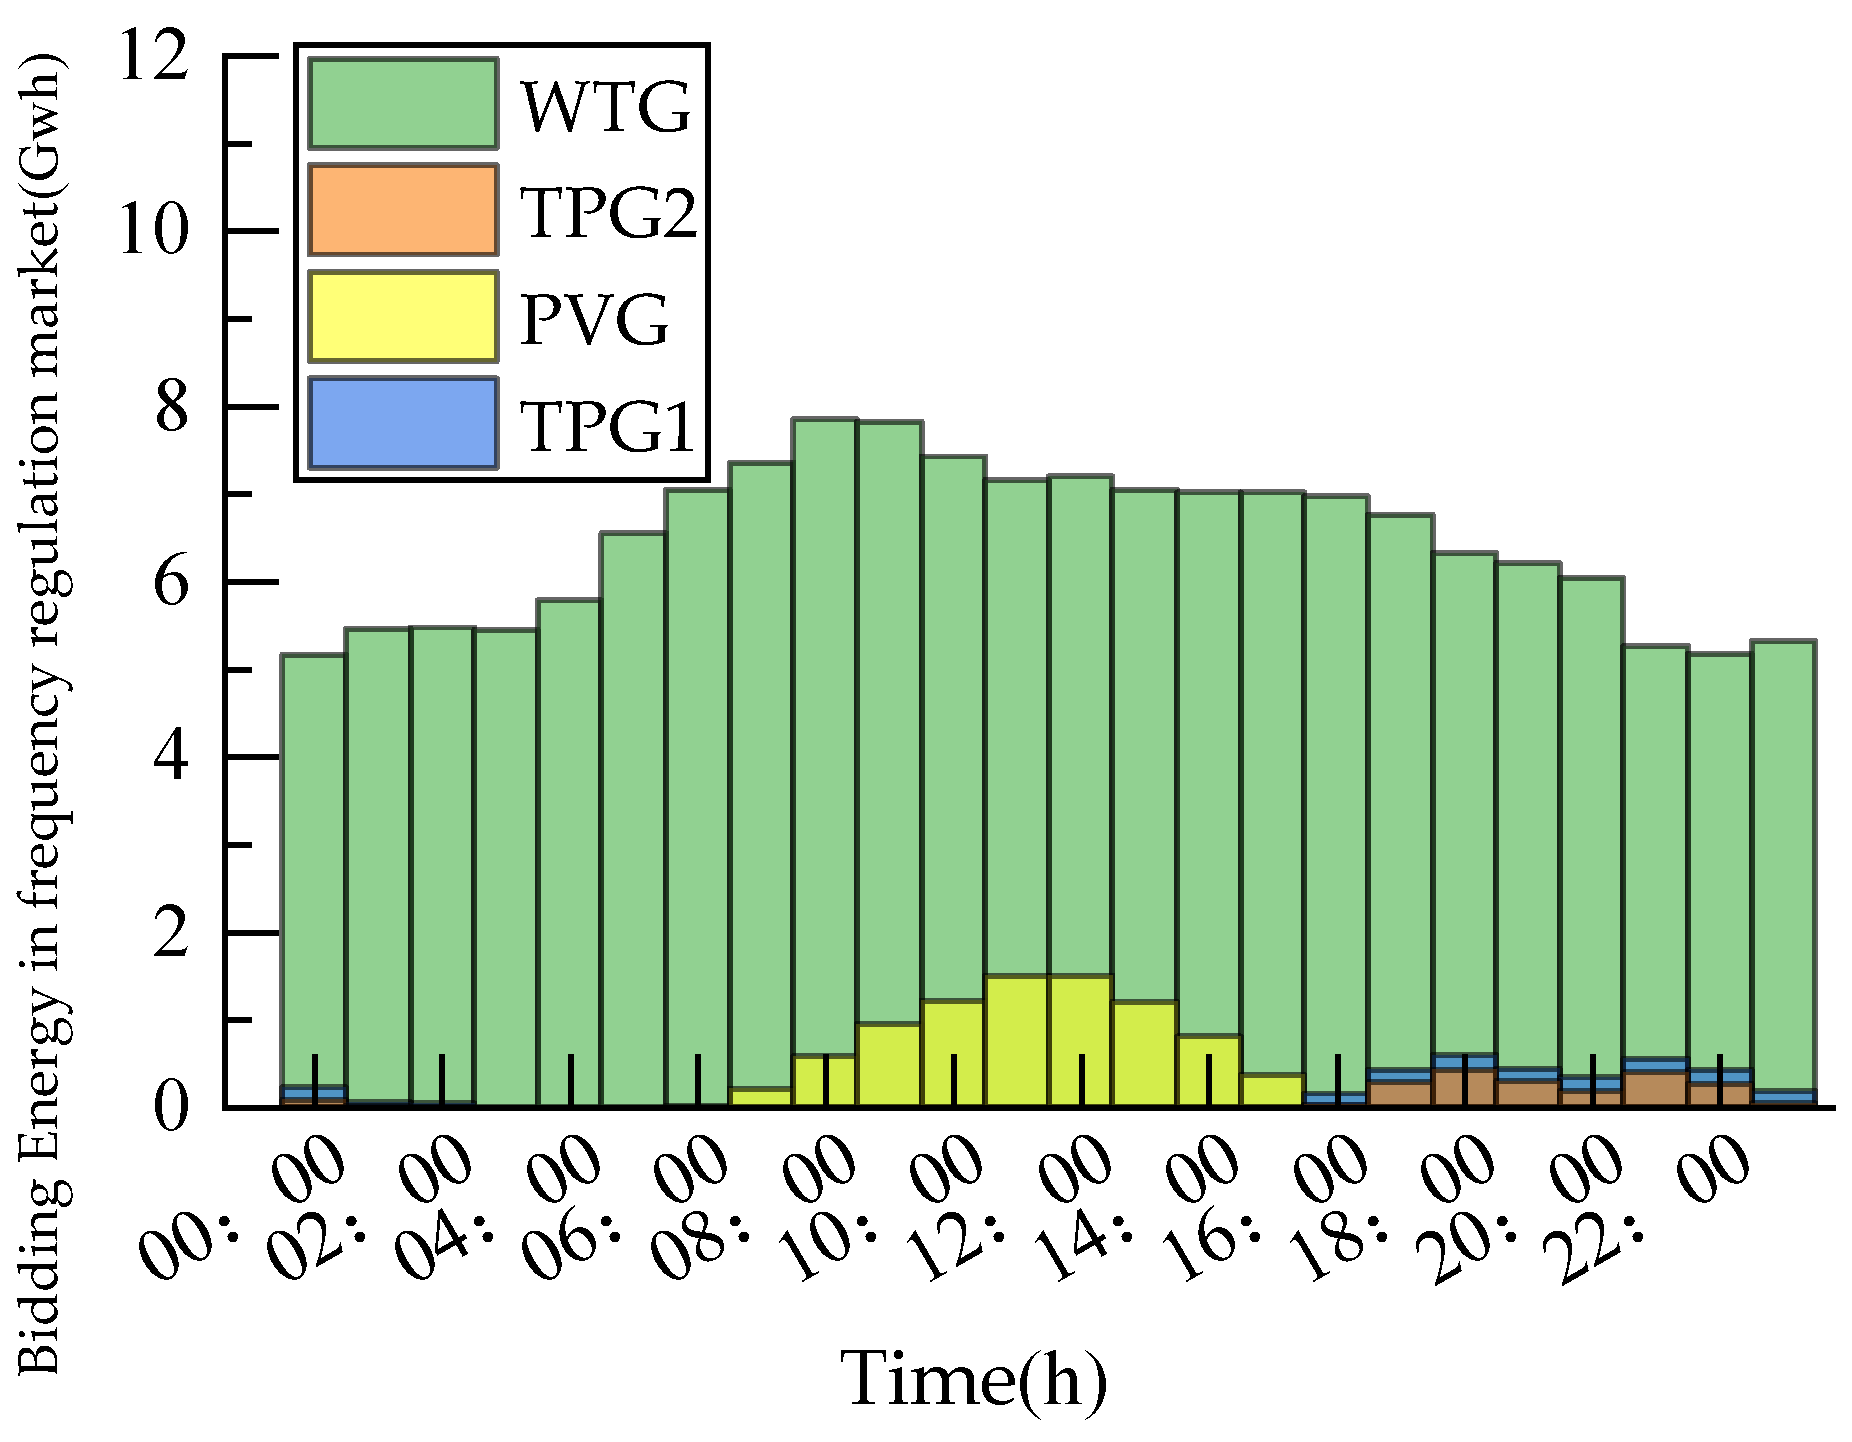
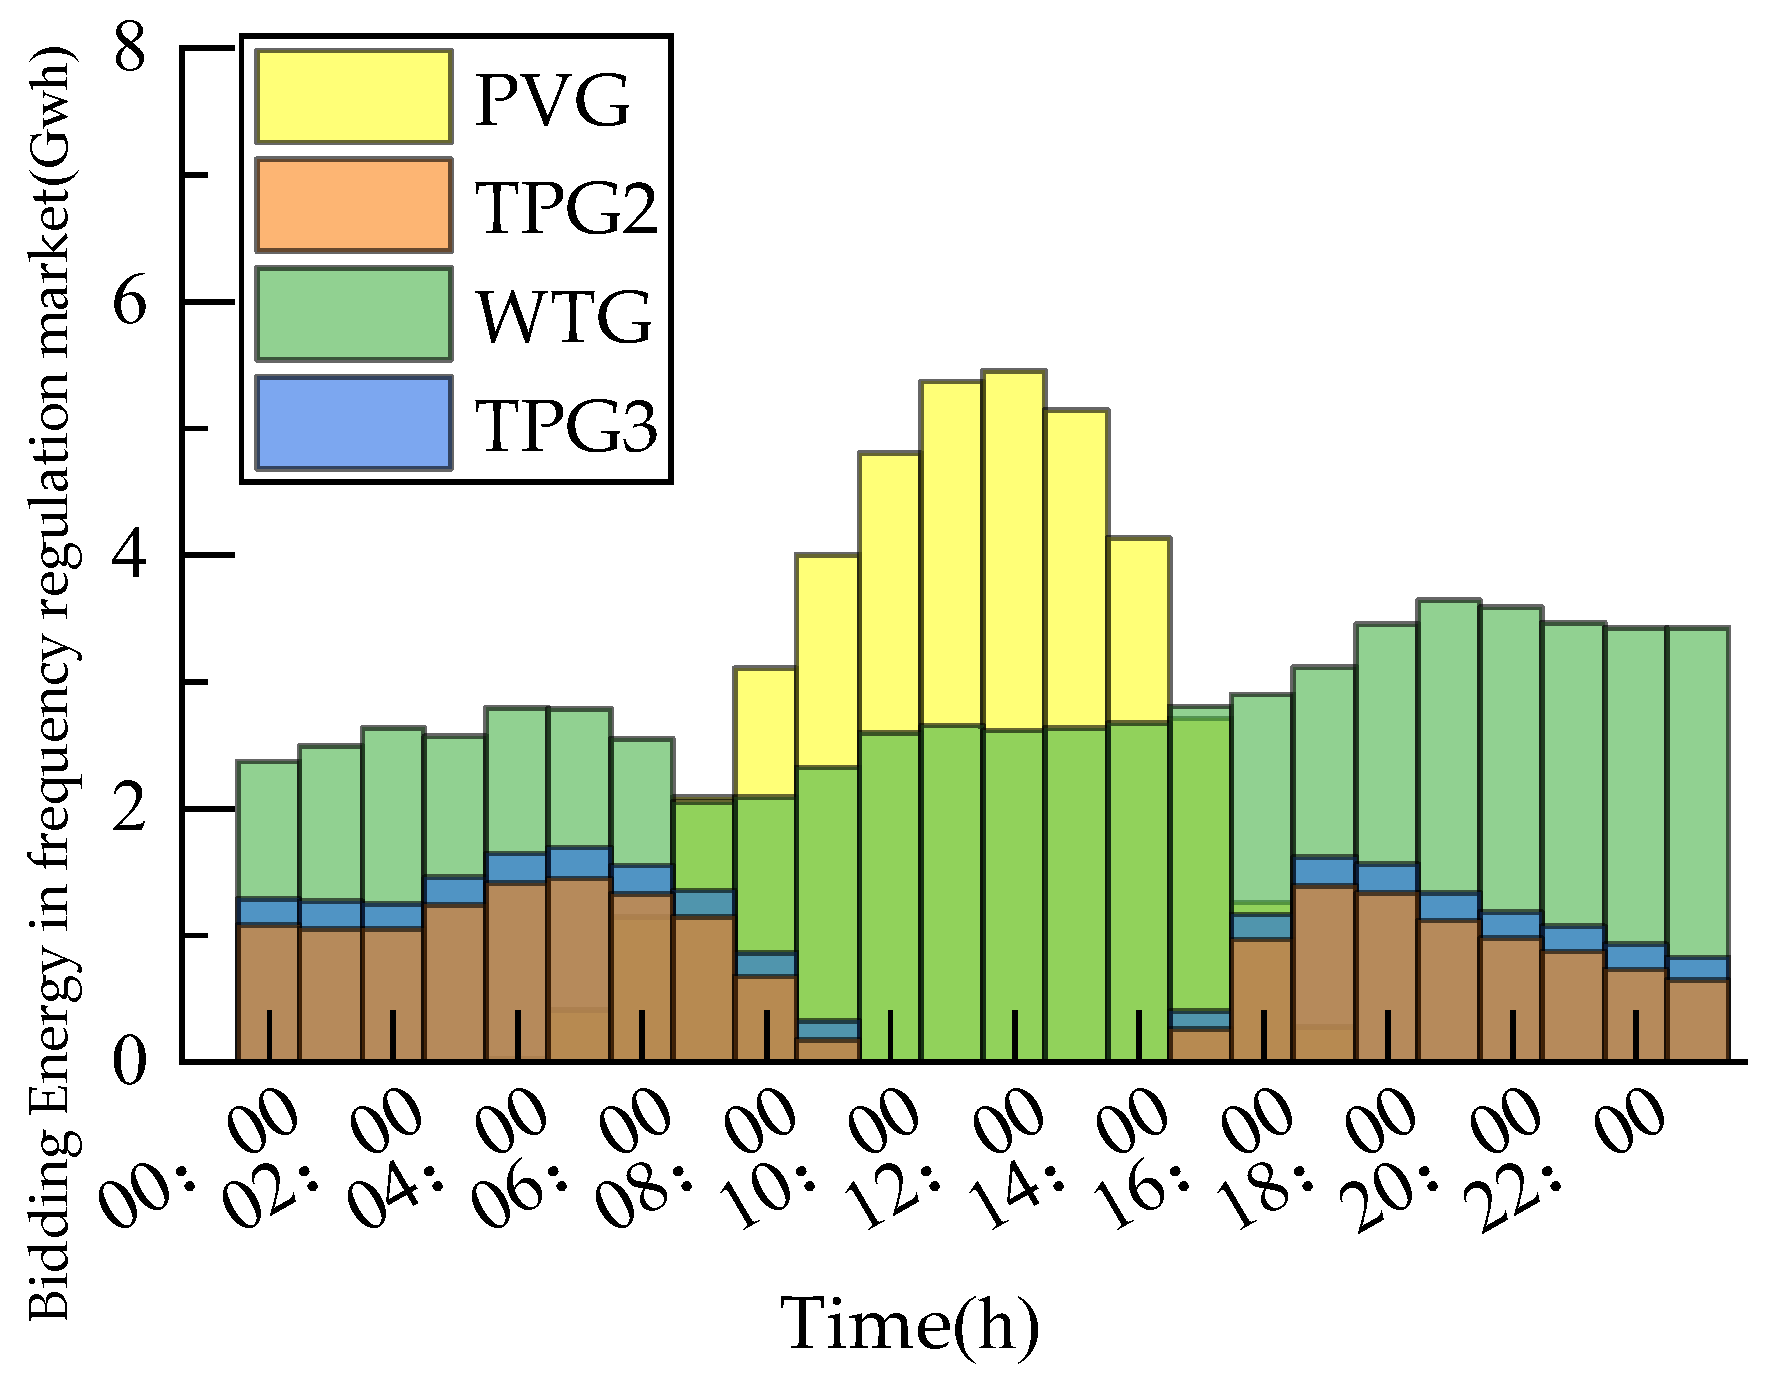
Figure 5 and
Figure 6 demonstrate the bidding energy allocation of generators in the energy and frequency regulation markets, respectively. The results confirmed that the proposed model optimized the bidding capacity of renewable energy generators, enabling them to dominate during peak generation periods, while TPGs supplemented the demand during low-generation intervals. This dynamic allocation underscores the practical applicability of the mean-field game in large-scale market scenarios. Therefore, under the assumption of similar behavior among large-scale PVGs and WTGs, the ratio of the overall capacity for PVGs and WTGs participating in the energy–frequency regulation market was also the optimal bidding ratio to the total installed capacity.
Regarding the bidding energy of generators in the energy market, by referring to
Figure 4 and
Figure 5, it can be seen that, overall, the renewable energy generator plays a dominant role, supplemented by TPGs. Between 07:00 and 13:00, in order to pursue more profits, WTGs chose to reserve more capacity for competition in the frequency regulation market, resulting in a decrease in their bidding energy in the energy market. During the time periods of 04:00–09:00 and 15:00–19:00, TPGs chose to increase their bidding energy to ensure the stable operation of the power grid due to the peak load period and the absence of PVGs. Between 10:00 and 13:00, which was the peak period of WTGs and PVGs, TPGs chose to invest a small amount of capacity because of their relatively high costs, which weakened their competitiveness in the market.
By referring to
Figure 4 and
Figure 6, WTGs undertook the majority of frequency regulation responsibilities, since they have a large power generation capacity. Their bidding capacities in the frequency regulation market mainly increased with the rise in the frequency regulation price and decreased with its fall. During the period from 08:00 to 14:00, considering the bidding energy of PVGs in the energy market and the frequency regulation market, PVGs continuously increased the proportion of capacity invested in the frequency regulation market during this time to pursue greater profits.
In order to better show the performance of the proposed approach, the traditional proportional bidding-based approach was introduced to compare with the proposed approach. In the proportional bidding-based approach, each generator participates in the frequency regulation market with 15% of their generation. Revenue of generators under 70% penetration of renewable energy is shown in
Table 4.
It can be found that when PVGs and WTGs adopted the proposed bidding decision model, their revenue increased to a certain extent. The revenue growth of WTGs was more significant, as the trading energy of WTGs was relatively large, resulting in a greater increase in revenue. Similarly, PVGs gained less additional revenue due to their smaller trading volumes. The general decline in revenue for TPGs was due to the fact that in the proposed approach, PVGs and WTGs adjusted their bidding capacity ratio in the energy–frequency regulation market based on the market demand. Therefore, a larger proportion of trading energy was occupied by PVGs and WTGs, resulting in a decrease in the participation of TPGs in the frequency regulation market.
Further, the table presents the total revenue of renewable energy generators of the same type. According to the model described in
Section 2, each renewable energy generator bid in the frequency regulation market according to the optimal bidding capacity ratio, and thus each renewable energy generator obtained the corresponding proportion of revenue. It can be seen that when renewable energy generators participated in the energy–frequency regulation market, using the bidding decision-making model proposed in this paper to select their own bidding strategies could lead to higher revenues. That is, the rationality and effectiveness of the bidding decision-making model proposed in this paper were verified.
6.3. Bidding Strategy Analysis with 30% Renewable Penetration Relative to Load
In order to verify the practicality of the model, scenarios with lower new energy generation shares were analyzed. Taking the scenario where the proportion of renewable energy generators was 30% as an example, the generation and load data of WTGs and PVGs were also adopted from the German ENTSO-E website from 11 March 2022 to 11 April 2022, and the predicted output and load are shown in
Figure 7. The rest of the simulation parameters were set similarly to those in the scenario with a 70% share of new energy generation.
In the 30% scenario, the bidding prices of large-scale new energy generators for the energy–frequency regulation markets when the bidding decision model reached the Nash equilibrium are shown in
Figure 8, and the trend change was similar to that in the 70% scenario.
Compared with the 70% scenario, the bidding price of TPGs in the frequency regulation market was significantly higher in the scenario with a lower percentage of new energy generation. This was because of the substantial increase in the proportion of TPGs providing frequency regulation services in the 30% scenario, and their bidding price was increased to gain more revenue by increasing their own bidding price.
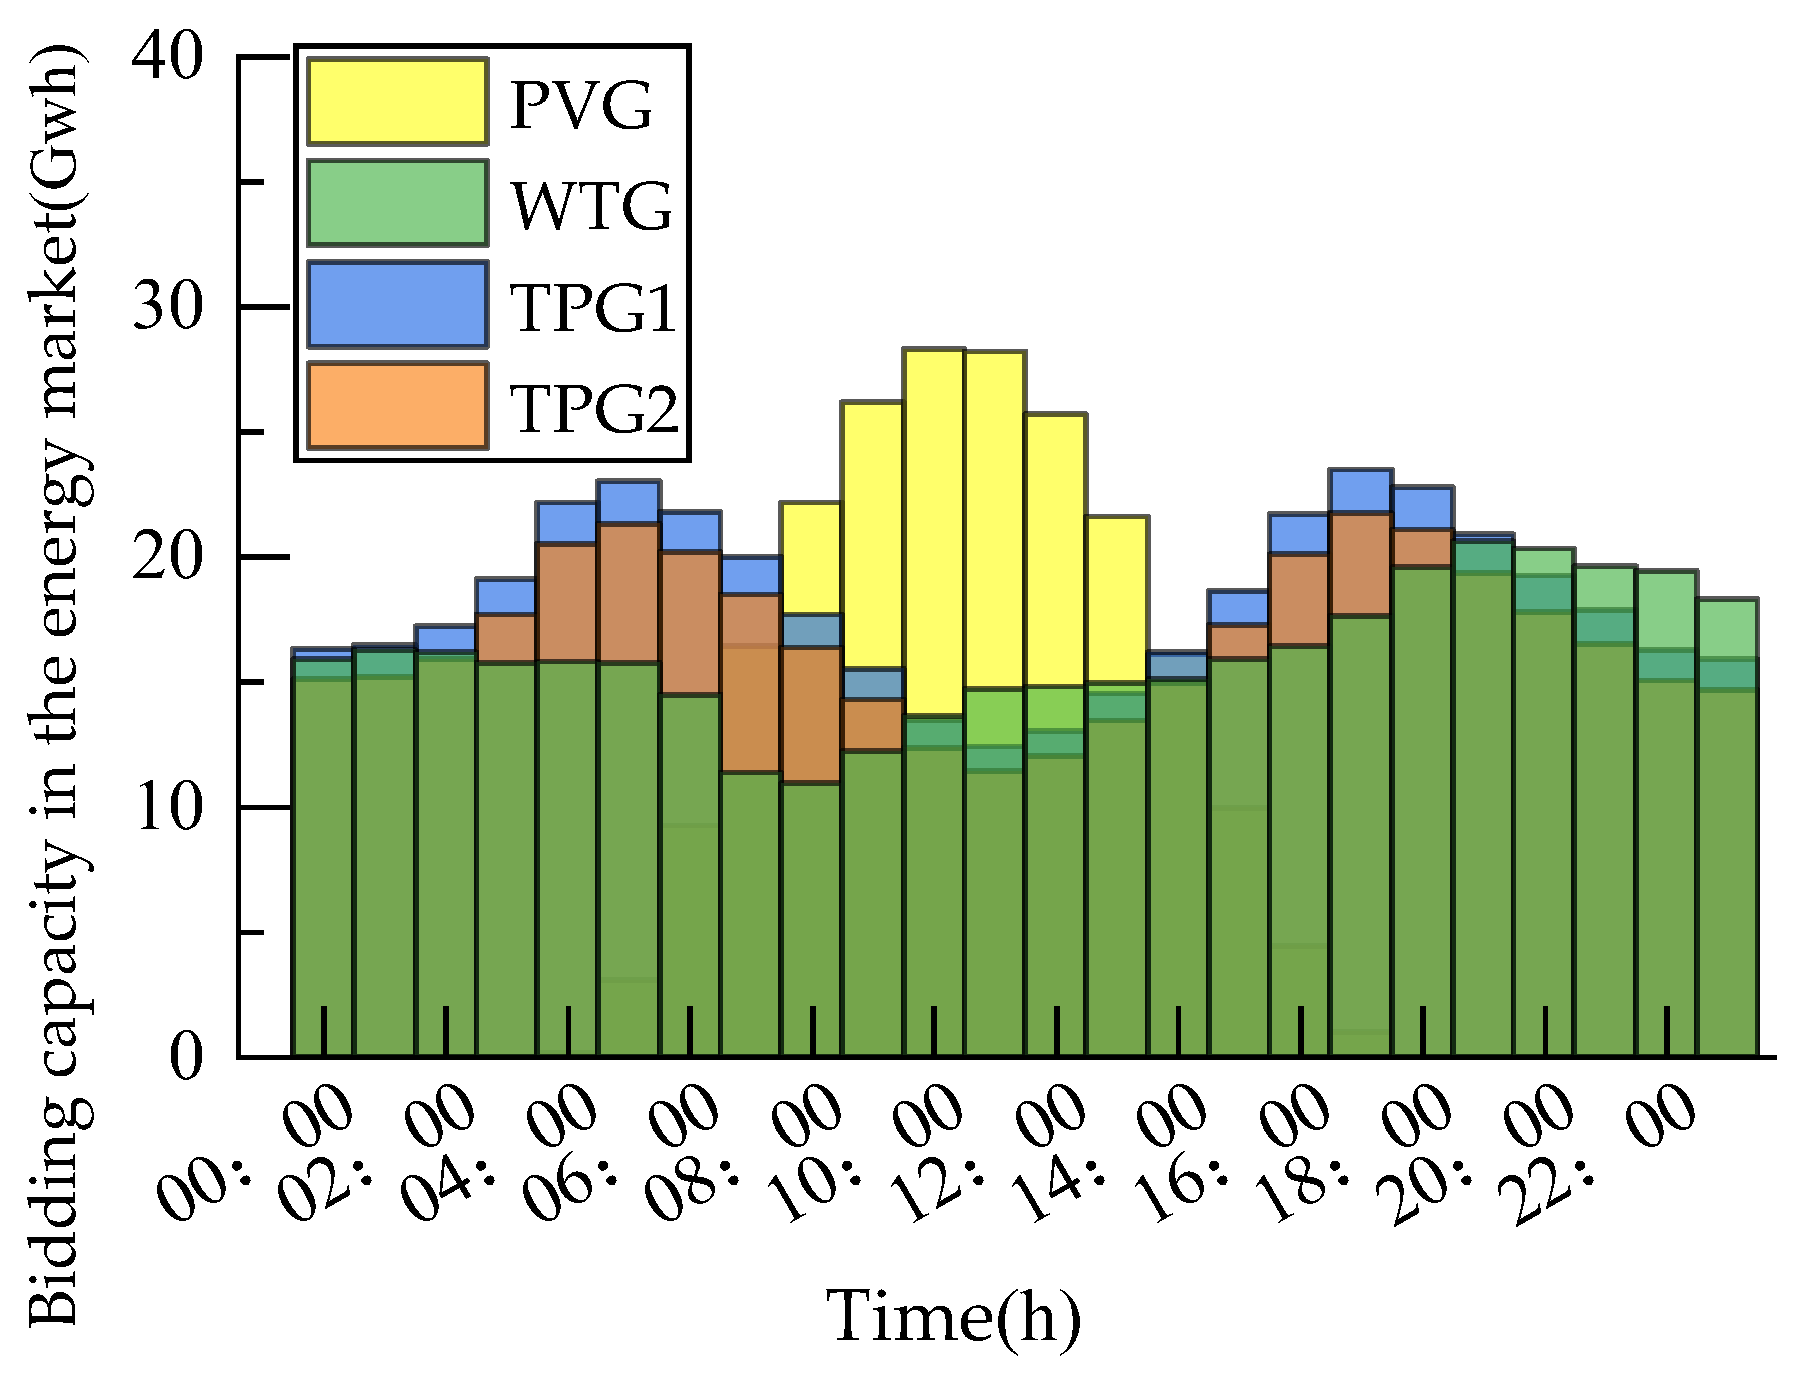
The bidding energy of large-scale PVGs and WTGs in the energy–frequency regulation market is shown in
Figure 9 and
Figure 10. In the energy market, TPGs took most of the load demand, and PVGs took most of the load demand during the peak generation period, together with WTGs, making the bidding capacity of TPGs lower at this time. Due to the lower cost of PVGs and WTGs, wind and PV bore all the frequency regulation demand during the high PVG period in the frequency regulation market.
Table 5 presents the revenue of different generators under different bidding strategies in the scenario with a relatively low proportion of renewable energy. In the proportional bidding model scheme, each generator participated in the frequency regulation market with 15% of its power generation. As shown in the table, under low renewable penetration, the proposed bidding model increased revenues for renewable generators while reducing those of TPGs. However, compared with the scenario with a high proportion of renewable energy generation, revenue changes for PV and thermal power were more significant under low renewable penetration. This is because, under low renewable penetration, PV and thermal generators produced more electricity and took on more load and regulation responsibilities, leading to greater revenue fluctuations.
6.4. Comparison Among Different Proportions of Renewable Energy and Bidding Strategies
A further analysis was conducted on the optimization of the bidding strategies of generators in scenarios with different proportions of renewable energy.
Table 6 shows the changes in the duration and capacity of TPGs’ participation in the frequency regulation market in scenarios with different proportions of renewable energy. As can be seen from
Table 6, with the continuous decrease in the proportion of renewable energy, the time for TPGs to provide frequency regulation services gradually increased, and the frequency regulation capacity increased significantly. In scenarios with a high proportion of PVGs and WTGs, TPGs hardly participated in the frequency regulation market, while in scenarios with a lower proportion of renewable energy, TPGs needed to provide most of the frequency regulation services during periods when PVGs were not at their peak.
In contrast, in the scenarios with a high proportion of renewable energy generation, TPGs’ service time in the frequency regulation market grew, and their capacity increased dramatically compared to the scenarios with a lower proportion of renewable energy. TPGs hardly participated in the frequency regulation market in the high percentage of renewable energy generation scenario, while in the lower percentage scenario, thermal power was required to provide most of the frequency regulation service during the non-PVG period.
While the proportion of renewable energy significantly influenced the duration and capacity of TPGs’ participation in frequency regulation, the choice of bidding strategies further shaped their market performance and revenue optimization. To better assess the performance of the proposed bi-level game-theoretic model, two widely adopted optimization-based bidding strategies: stochastic optimization (SO) and robust optimization (RO), were adopted to establish a more comprehensive and meaningful benchmark framework for evaluating the performance of the proposed bi-level game-theoretic model. We took a scenario with a 70% share of renewable energy as the example.
Table 7 demonstrates the revenue of generators under different bidding strategies.
In
Table 7, SO enabled WTGs and PVGs to achieve higher revenues compared to the proportional bidding strategy, with respective increases of approximately 1.1% and 0.6%. However, this advantage came at a cost to TPGs, whose revenues decreased under SO due to the increased competitiveness and bid aggressiveness of renewables informed by probabilistic foresight.
By contrast, the robust optimization approach operated under a worst-case scenario framework, assuming that uncertainties lie within bounded sets without requiring explicit probabilistic information. Although RO resulted in slightly lower revenues for renewable generators compared to SO, the optimization still outperformed the proportional bidding benchmark. Notably, RO provided higher revenues to TPGs than the stochastic approach, indicating that the conservative bidding behavior of renewables under RO can allow TPGs to regain a small share of market participation, especially during periods of low renewable availability.
The comparative results revealed that our bi-level model offers distinct advantages over these alternative approaches. By integrating mean-field coordination among renewable generators with strategic competition across different generation technologies, our approach captured critical market dynamics that other methods overlook.


