1. Introduction
As hydrogen continues to see investment globally to decarbonize the energy and mobility sectors, the role cryogenic liquid hydrogen must play is becoming increasingly important. Possessing the highest heating value by weight of all common fuels at 120–142 MJ/kg—roughly 2.8 times that of gasoline or kerosene at the lower heating value (LHV)—makes hydrogen a superior energy carrier in addition to its decarbonation potential. However, due to its very low density—14.4 times less than air at standard temperature and pressure (STP)—by volume, hydrogen is challenging. This has forced designers to employ high pressure to boost its density, and this has resulted in storage system designs up to 700 barg gas being implemented in applications such as fuel cell electric vehicles. However, even at 700 barg the volumetric heating value of hydrogen gas is only 0.07 MJ/L (LHV), versus 31.7 MJ/L for gasoline and 35.3 MJ/L for kerosene. To contain the same energy content as a gasoline tank would require a 700 barg gaseous hydrogen tank with over a 450 times larger volume and an over 500 times larger volume compared to kerosene. This issue is a significant impediment to a variety of end-use applications, especially in the mobility sector, where mass and/or physical space is limited.
An alterative approach for increasing volumetric density is to liquefy the hydrogen—which affords an 800:1 boost in density over STP gas (for liquid hydrogen at normal boiling point) and 120:1 versus 700 bar gas at ambient temperature. This density increase translates to the volumetric energy content, raising it two orders of magnitude to 8.5 MJ/L (LHV) at the normal boiling point (NBP)—still well below that of common petroleum-based liquid fuels but significantly higher than even 700 barg gas. In addition, to contain the same energy content as a gasoline tank would require a liquid hydrogen (LH
2) tank with a 3.7 times larger volume and a 4.2 times larger volume compared to kerosene. To exploit the large density increase, LH
2 is being considered for several mobility applications, such medium- and heavy-duty trucks [
1] and passenger aircraft [
2,
3]. But perhaps the most impactful role will be as an energy carrier and transport mode [
4,
5], similar to how liquefied natural gas is utilized today, using mega-scale, ocean-going tanker ships.
The downside of utilizing liquid hydrogen is the extremely low temperatures involved. With the second lowest boiling point of all the permanent gasses at 20.4 K, efficient storage and transfer of LH
2 poses unique challenges. Nevertheless, the commodity has been utilized on a large scale in the United States since the 1950s, with perhaps the most notable use being rocket fuel for space launch vehicles such as Saturn V and the Space Shuttle. NASA currently owns and operates the largest LH
2 storage tanks in the world [
6], with a combined capacity of roughly 7900 m
3 (560 metric tons) at Kennedy Space Center (KSC) in Florida. However, with LH
2 expanding into new sectors, the required scale-up in quantities will be unprecedented. A recent study by Ishimoto et al. examined the LH
2 supply chain between Norway, Europe, and Japan that would be necessary to support each country’s projected future annual demand [
4]. Their analysis assumed seven land-based storage tanks at loading/receiving terminals of around 50,000 m
3 each—a full 10× increase in volume compared to the largest LH
2 tank ever built (4700 m
3, located at Pad B at KSC)—while others have pushed the required capacities of individual tanks up to 100,000 m
3 [
5] and beyond. Similar infrastructure will be necessary for airports as well, with recent studies projecting tank capacities up 52,000 m
3 for large hubs and daily usages between 500–1600 metric tons [
2,
3]. At such scales, advanced, efficient storage system designs will be vital, and the success of said designs hinges on a thorough understanding of fundamental material properties. Of particular importance is the thermal insulation system (TIS) design for the vessel, as it is responsible for handling the lion’s share of the environmental heat load in large cryogenic storage tanks.
For over two decades, more efficient storage and transfer of LH
2 has been a particular research focus area for NASA and the Cryogenics Test Laboratory (CTL) at KSC [
7,
8,
9]. The CTL specializes in the design, testing, and implementation of advanced thermal insulation systems and utilizes a suite of custom-designed liquid nitrogen (LN
2) boiloff calorimeters for the characterization of TIS performance over a wide range of real-world operational conditions [
10,
11]. These LN
2-based instruments and their testing methodology have been formalized in the ASTM C1774 standard for cryogenic insulation systems testing [
12], and they are used to characterize a variety of insulation systems and materials, from high-vacuum, reflective Multi-Layer Insulation (MLI) [
13], foams and aerogels [
12,
14], and bulk fill products such as perlite and glass bubbles [
12]. However, these instruments have historically been constrained to the cold boundary temperature set by liquid nitrogen (77 K); hence, they cannot probe actual use conditions for LH
2 systems, and they are limited in evaluating heat transfer and other physical phenomena associated with deep cryogenic temperature regions. This is crucial, because the performance of most thermal insulation systems is expected to be impacted when the cold-side temperature is reduced from 77 K to 20 K due to changes in material properties, and most background gasses are readily condensable at LH
2 temperatures, which could play a significant role in tank designs and their overall safe operation. As such, testing capabilities that can access the LH
2 temperature range are necessary to aid in and accelerate development efforts for next-generation systems.
There are several methods to access the LH
2 temperature range: the use of liquid hydrogen or liquid helium for cooling, or the use of a cryocooler. Using LH
2 directly is costly and requires significant safety measures, although recent efforts have aimed to construct and test an LH
2-based boiloff calorimeter compliant with ASTM C1774 Annex A1 [
15]. Liquid helium (LHe) is colder at 4 K and inert, but it is also costly and introduces other technical challenges. Cryogenic refrigeration machines, or “cryocoolers”, have been employed for calorimetry purposes a number of times [
16,
17,
18] but only for isolated test campaigns.
Cryocooler-based approaches are attractive for a number of reasons: 1. there are many commercial off-the-shelf examples capable of reaching 20 K without the use of a consumable liquid; 2. unlike boiloff methods where heat loads are calculated directly from the mass flow rate of a continually evaporating cryogen that requires periodic refilling, time is not a driving factor in steady-state measurements; 3. access to a wider range of cold boundary conditions—conceivably from the minimum temperature achievable by the cryocooler/setup up to near ambient—as opposed to a constant temperature set by the boiling point of the sacrificial cryogen; and 4. the ability to test specimens using relatively small temperature differences (ΔT) but over a wide temperature range.
Annex A6 in ASTM C1774 covers the minimum requirements for the cryocooler-based calorimetry method, and it was heavily influenced by the work of Barrios [
18], whose flat-plate setup used the standard ASTM C177 Guarded-Hot-Plate Apparatus [
19] as a template and was employed to test polyurethane spray-on foam insulation (SOFI) for NASA down to 20 K. Most cryocooler-based calorimeters have been of a flat-plate style, which affords a simpler design in many ways but inherently suffers from edge effects at the sample perimeter (this is true as well for boiloff apparatuses [
11]). Cylindrical designs, such as the Cryostat-100 (CS-100) at the CTL [
10], demand a more complex design and involved test setup, but they eliminate edge effects.
Due the lack of available testing capabilities at LH
2 temperatures and in support of next-generation, large-scale LH
2 tank development [
20], an effort was recently undertaken by NASA and its partners CB&I and Shell to design a first-of-its-kind cryocooler-based calorimeter that employed a cylindrical geometry. This apparatus, deemed the Guarded Hot Cylinder (GHC), would utilize existing hardware at that CTL, namely, a cryocooler and small vacuum chamber assembly, possess a relatively straight-forward and quick test setup, and be used to characterize the thermal performance of insulations and other materials across broad operational temperature and pressure ranges. Additionally, the instrument could be used for other advanced studies such as adsorption characterization in high-surface-area materials and cryo-pumping effects in non-vacuum insulation systems.
Initial conceptualization and design of the GHC by the team occurred in early 2023, followed by fabrication, assembly, instrumentation and command and control (C&C), and initial testing at the CTL in 2024. Details regarding the evolution of the apparatus, including component design/fabrication, C&C philosophy, and test results, will be presented and discussed as well as useful lessons learned.
2. Guarded Hot Cylinder Design
The following sections cover the foundational measurement theory and derived insulation performance metrics (as defined in ASTM C1774): the effective thermal conductivity, ke, and heat flux, q; the high-level design requirements that drove the current manifestation of the apparatus; details regarding the design/fabrication of the individual components, and integration of the final assembly; instrumentation; and the C&C approach.
2.1. Measurement Theory
For any calorimetry testing, a primary challenge is quantifying the heat transmission (i.e., the J/s or Watts). One method is via the phase change of a material and the associated latent heat. Boiloff calorimetry, as the name implies, utilizes the evaporation (or boiling) of a saturated cryogenic liquid; at steady state, with a constant boiloff mass flow rate, the heat transmission is calculated by multiplying the mass flow rate by the heat of vaporization of the cryogen. Additionally, the cryogen provides a constant cold boundary temperature (CBT), while an electrical heater maintains the warm boundary temperature (WBT) on the opposite side of the test specimen. Once the heat transmission is known, in conjunction with the specimen geometry and ΔT, k
e can be determined using the Fourier heat conduction equation:
where k
e is in units of W/m-K, Q is the heat transmission in watts (W), Δx is the specimen thickness—the distance between the warm and cold boundary temperatures—in meters, A is the heat transfer area in square meters, and ΔT is the temperature difference (WBT-CBT) in kelvin. The heat flux, q, can also be calculated by dividing Q by A.
Equation (1) accurately represents flat geometries; however, cylindrical configurations require a modification of the heat transfer area, for which the log-mean area is employed:
where A
lm is in units of square meters, L is the length of the cylindrical test section in meters, and D
o and D
i are the outer and inner diameters of the test specimen in meters, respectively. The heat flux then becomes Q/A
lm.
Combining Equations (1) and (2) and substituting in the insulation thickness, Δx = 0.5(D
o − D
i), yields the effective thermal conductivity for a cylindrical configuration:
As no cryogen is employed for GHC measurements, no phase change occurs; hence, Q must be obtained via a different method. This is accomplished by accurately measuring the electrical input power to a heater assembly used to maintain the WBT. Therefore, Q in Equation (3) is simply the input voltage to the heater multiplied by the amperage.
The high-level configuration of the GHC test article is presented in
Figure 1 (vacuum chamber not shown), and it situates a cylindrical heater rod assembly inside a copper specimen cup that is bolted to and cooled by the cryocooler cold head. The heater assembly is oriented vertically and is concentric to the cup. This layout results in a cylindrical test specimen with a small axial through-hole, and it places the CBT on the outside surface area, with the WBT on the inner surface of the hole. A trim heater is employed between the cup and cold head to maintain the CBT.
Figure 1 shows the heater assembly, which consists of three independent heating elements: a center test section with upper and lower guards. Each heater is controlled to the same temperature (the WBT) to eliminate axial heat flow through the assembly and to create a steady-state, uniform temperature profile through the insulation thickness between the cold copper cup and warm test heater (within the region bounded by L and Δx). The voltage and amperage to the center test heater are used to determine the power supplied to maintain the warm boundary temperature (i.e., Q). At steady-state conditions and with a uniform temperature profile, this heater input power should be constant and equates to only heat moving radially though the insulation. Therefore, it can then be used in Equation (3) to determine the effective thermal conductivity of the material.
2.2. Basic Design Requirements
The GHC design was a “clean sheet” effort, governed by six high-level requirements:
Utilize, to the greatest practical extent, existing/available hardware at the KSC Cryogenics Test Laboratory; most notably, a model AL325 Gifford–McMahon (GM) cryocooler from the Cryomech company and a 150 mm diameter vacuum chamber assembly.
Accommodate testing in different background gas environments, from pressures <1 millitorr up to 1 atmosphere and study cryo-pumping and gas accumulation in non-vacuum environments. This required that the test article be a sealed volume and that a gas supply interface with the assembly. As this entire assembly had to also be placed inside a vacuum chamber and maintained at high vacuum (i.e., <1 millitorr pressure) to reduce environmental heat load during testing, the design necessitated two separate sealed pressure boundaries as well as penetration of the gas supply tube though the vacuum chamber. Additionally, the copper sample cup had to be able to be disassembled to swap out test specimens, which required a cold vacuum-tight interface seal.
Accommodate the widest range of WBTs and CBTs possible but targeting specifically CBTs of 20 K and 80 K and a WBT of 293 K.
Provisions must be put in place to control the temperature at the gas supply interface with the copper cup above the liquefaction point of the background gas.
Command and control software that can handle five independently controlled heaters—three on the inner assembly, the trim heater, and the gas supply interface—with a variety of user-defined inputs and control points.
Pressure control on the gas supply line.
2.3. Unique Conceptual Design Challenges and Solutions
Following from the above requirements, a detailed CAD model of the GHC test setup began to take shape in the spring of 2023 and unveiled a number of unique challenges requiring novel solutions.
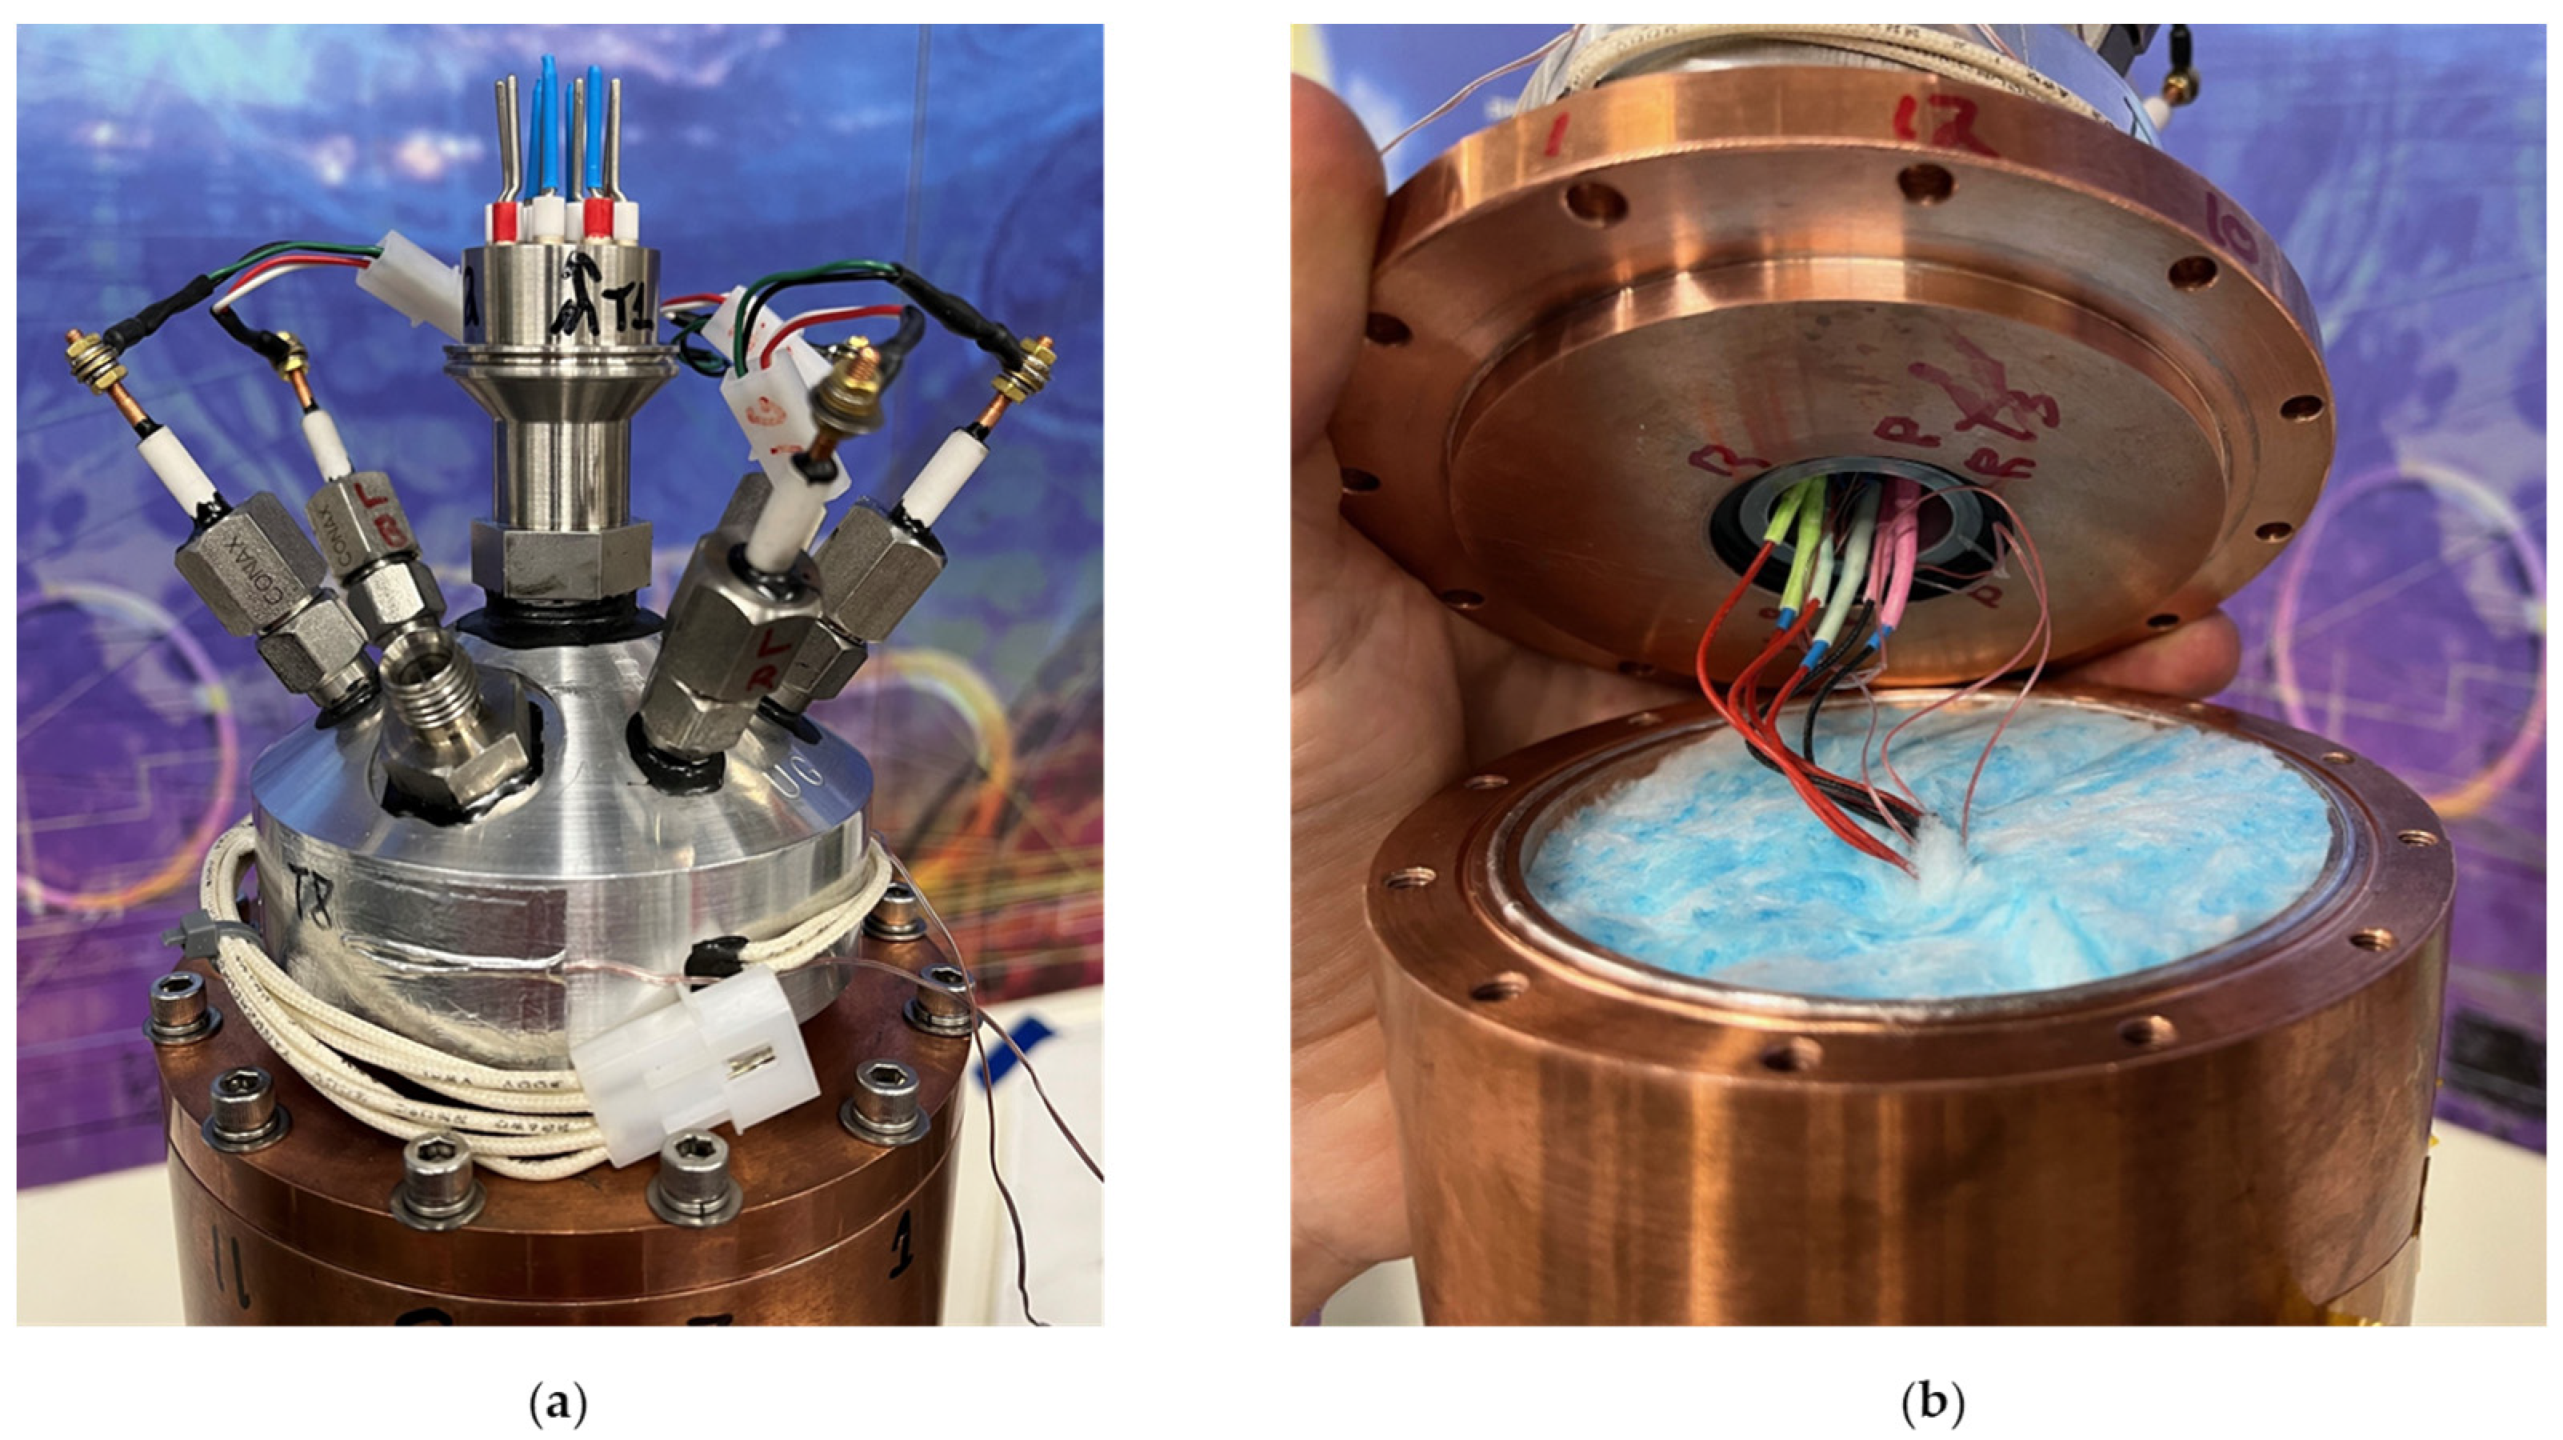
The nested pressure vessel configuration, in conjunction with the numerous instrumentation/power wires required to interface with the inner heater assembly to the data acquisition (DAQ) and C&C software—twelve total wires: three heaters times two power wires per heater and two wires per thermocouple temperature sensor—placed potential leaks from the test article to the vacuum chamber at the top of the list of challenges. To reduce possible leak points, the copper cup would be machined out a single piece of material, with only the upper port open. A removable lid, also constructed out of copper to create as close to an isothermal cold boundary around the test specimen as possible, would interface with the cup and be sealed by twin indium o-rings. The gas supply to the test article, as well as the twelve instrumentation and heater wires, would also have to interface at the lid, requiring a custom feedthrough manifold design.
Designed out of 6061-T6 aluminum, the feedthrough manifold houses three cartridge heaters to maintain proper temperatures (per requirement #4). A single five-channel thermocouple feedthrough (Kurt Lesker company (Jefferson Hills, PA, USA), P/N TFT5EP00005) and six independent electrical feedthroughs (Conax company (Buffalo, NY, USA), P/N EG-093-A-CU-T) were employed and interfaced with the manifold via pressure-rated pipe threads. These feedthroughs were permanently sealed to the manifold using Stycast 2850FT epoxy (Henkel Corporation, Düsseldorf, Germany) to reduce leak paths. The gas supply interface was a 6.35 mm boss-to-tube-type compression fitting (Swagelok company (Solon, OH, USA), P/N SS-400-1-6ST) with SAE standard AS5202 [
21] straight threads and a PTFE o-ring.
Because the aluminum manifold might be kept at much warmer temperatures than the copper lid during testing, maintaining a large ΔT was necessary between the two parts. This would be accomplished via a thermal isolator between the manifold and lid, fabricated from low-conductivity G-10 fiberglass epoxy. This isolator threaded into the lid, and then the manifold threaded into the isolator, and all three components were permanently sealed to one another using Stycast 2850FT epoxy. With a thermal conductivity 22 times lower than 6061-T6 aluminum (averaged across the operational temperature ranges stated in requirement #3) and over 700 times lower than copper, the G-10 isolator (NASA KSC, Merritt Island, FL, USA) would act as an effective thermal break between the manifold and lid.
2.4. Component Designs
Four core components/subsystems comprise the GHC: 1. a cryocooler capable of reaching 20 K—the model AL325 unit used for the current design could produce around 60 W of refrigeration at 20 K (LH2 temperature) or 300 W at 80 K (LN2 temperature)—2. the test article that physically attaches to the cryocooler cold head, which consists of a trim heater to control the CBT, a machined cup that houses the test specimen, a cup close-out lid and feedthrough interface, and an inner heater assembly; 3. a vacuum chamber that houses and thermally protects the cold head and test article during cryogenic testing; and 4. the balance-of-plant subsystems such as the vacuum pumping station, instrumentation, data acquisition and C&C hardware, and gas pressure control components.
2.4.1. Trim Heater and Thermal Shim
In order to test over the temperature range defined in requirement #3, the trim heater would be required to supply heat commensurate with the refrigeration capacity of the cryocooler at the CBT; up to 300 W at 80 K. To decrease the demand on the trim heater, a thin piece of material is placed between it and the cold head. This “thermal shim” would create a moderate ΔT between the trim heater and cold head, allowing the latter to operate at a lower temperature and, hence, at a lower refrigeration capacity.
Through trial-and-error during initial checkout testing, a thermal shim made of 300 series stainless steel that was 0.762 mm thick was found to provide good performance at 80 K and adequate performance around 20 K; for higher heat load tests (i.e., worse insulation performance), the thermal shim resulted in a CBT slightly above 20 K but was deemed adequate for current testing purposes.
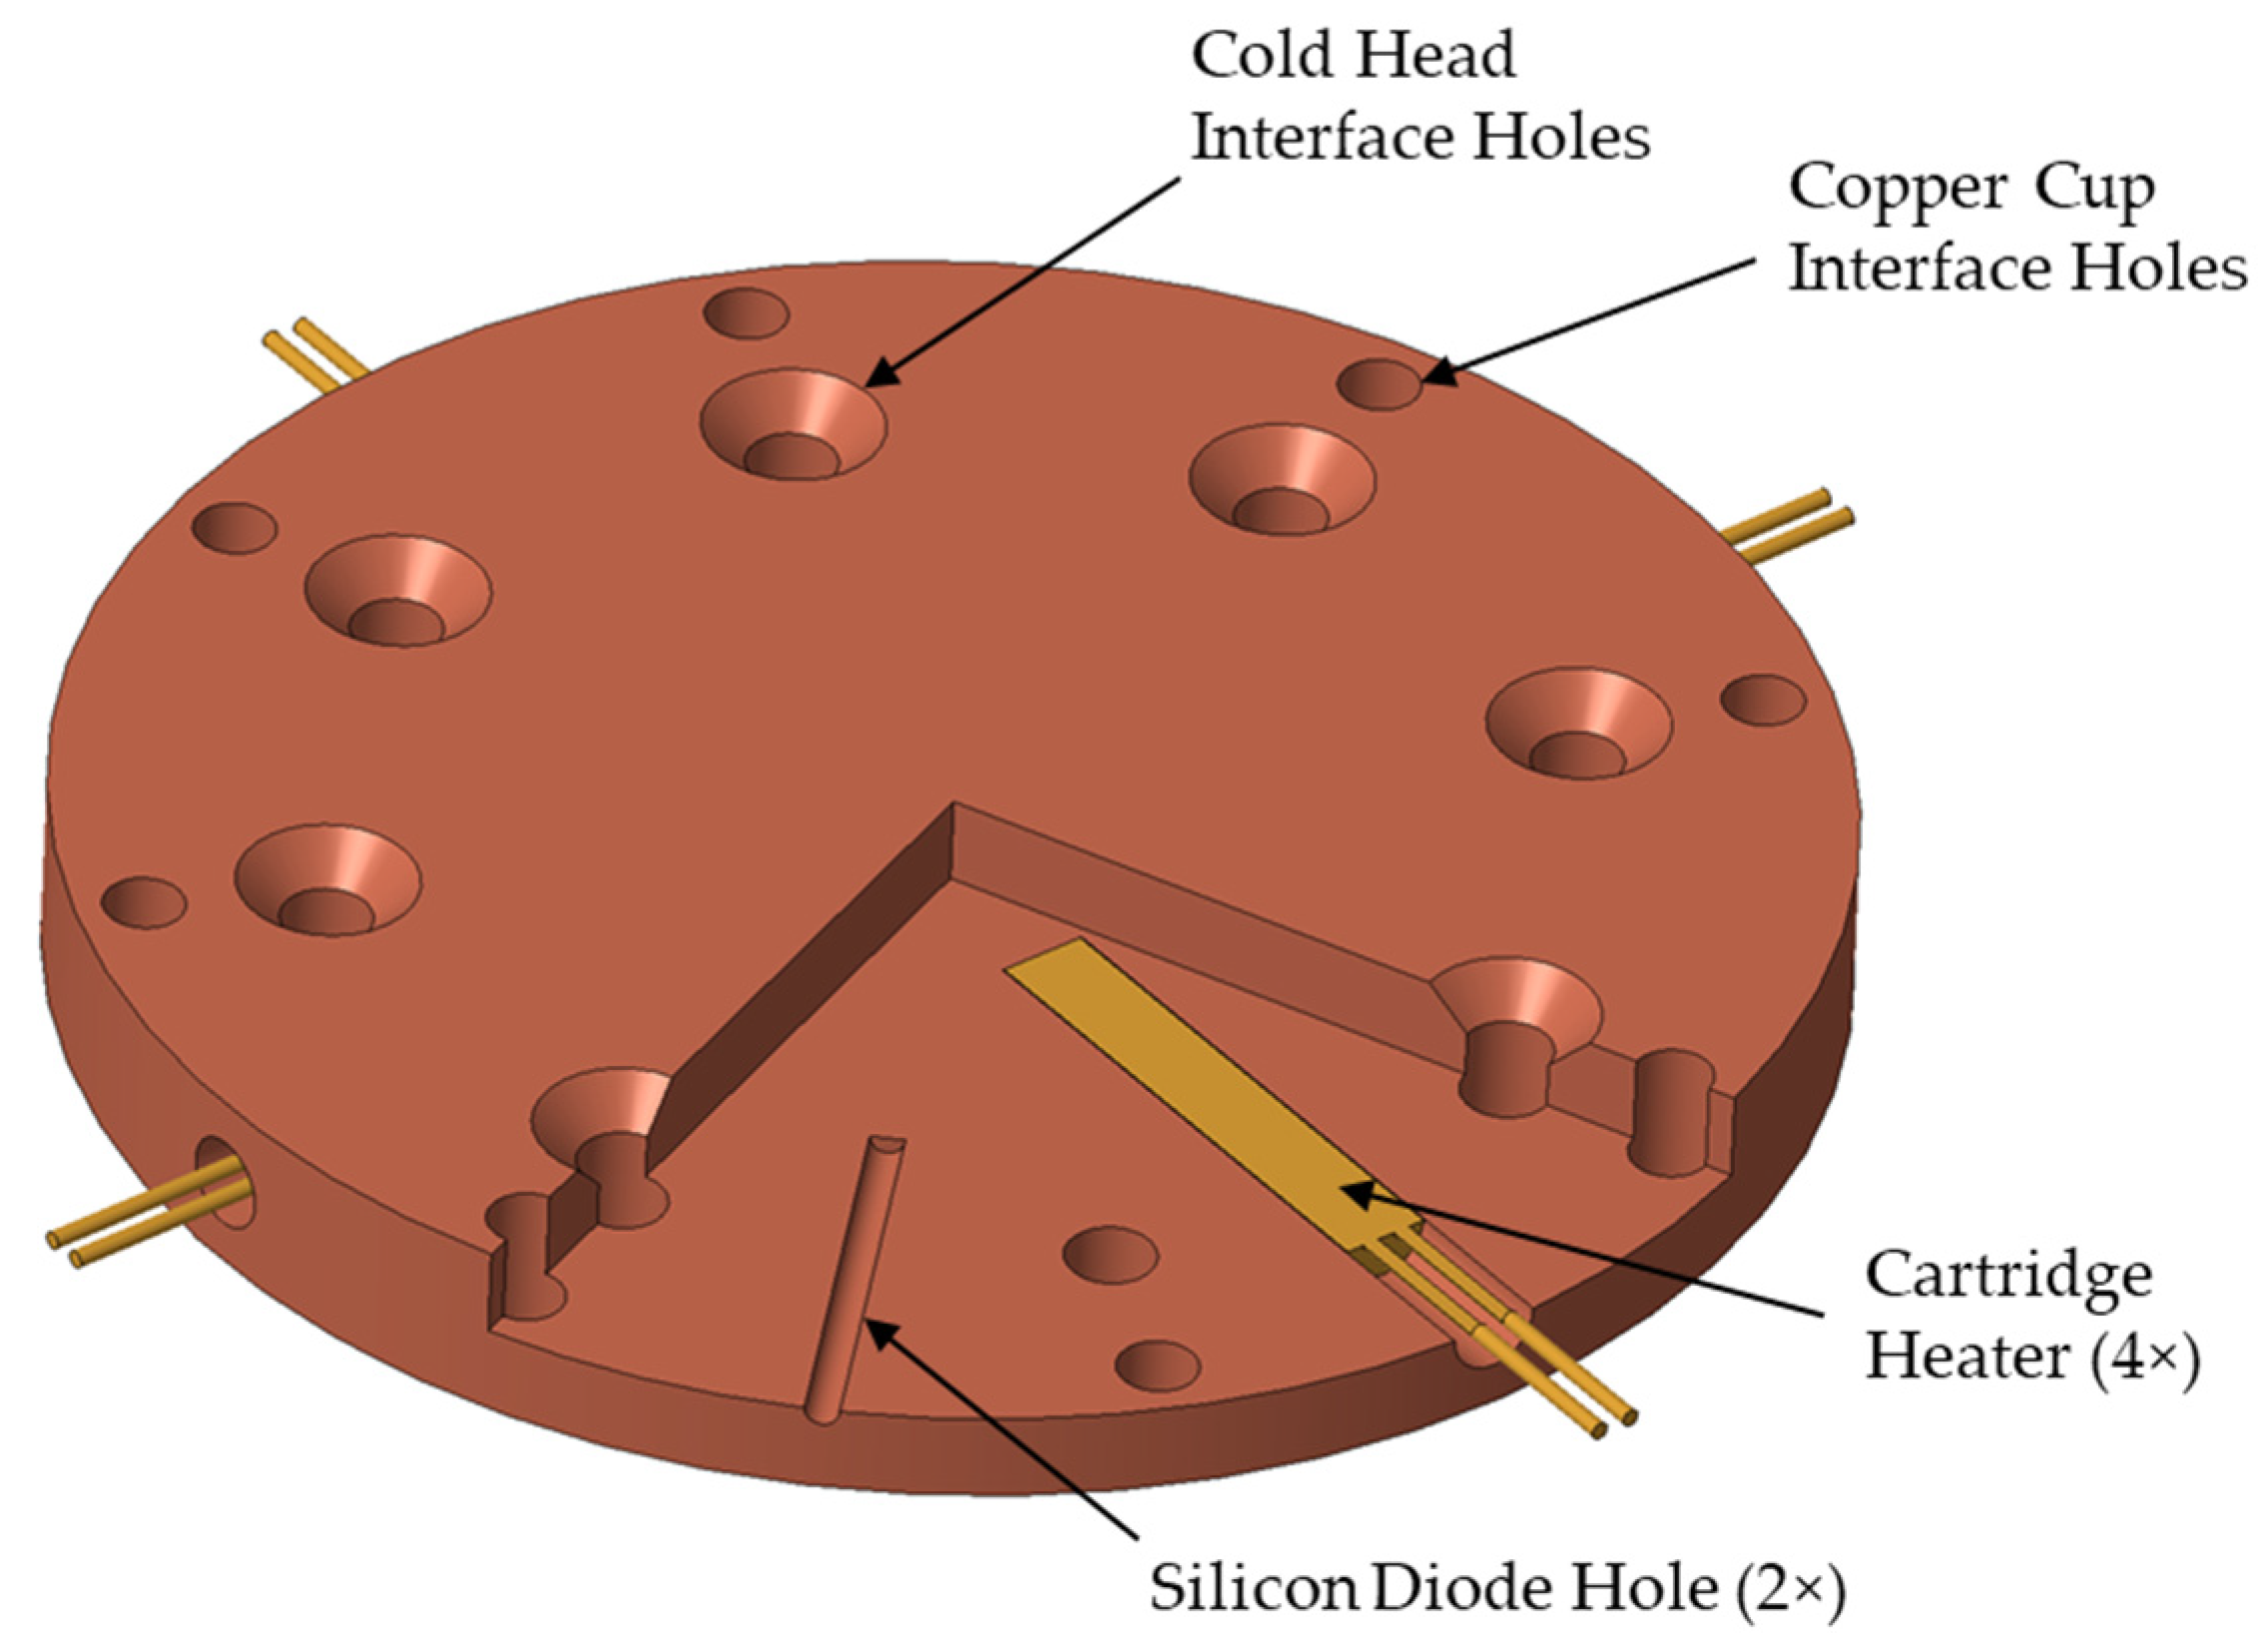
The trim heater design is shown in
Figure 2 and consists of a 12.7 mm thick, 120.65 mm diameter copper disc with four 6.35 mm diameter, 70 W, 120 VAC cartridge heaters spaced 90° apart. Two 2.4 mm diameter holes spaced 180° apart are also included to accommodate silicon diode temperature sensors. In the orientation shown, the bottom-facing side interfaces with the thermal shim and cold head via eight M6 × 1.0 flat-head stainless steel fasteners, and the top-facing side interfaces with the copper cup via eight stainless steel 12–24 thread socket-head cap screws. In the final assembly, the heaters and silicon diodes are permanently anchored in-place using Stycast 2850FT epoxy. Additionally, the four heaters are wired in parallel, giving the unit up to 280 W at full power.
2.4.2. Specimen Cup
The specimen cup was machined from a single piece of 120.65 mm diameter copper bar stock, with a flat floor and only the top port open. The total cup length is 199.47 mm, with an inner machined diameter of 91.95 mm and depth of 189.94 mm, with yielding wall thicknesses of 14.35 mm on the barrel section and 9.53 mm on the floor. Thick walls, along with high-conductivity copper, were desirable to minimize the ΔT that would exist vertically along the cup due to the focused heat removal at the bottom surface.
Twin, concentric o-ring groves were machined into the face of the cup at the top port to seal the lid. These grooves were sized to accommodate 96.69 mm diameter indium wire, with a depth of half the diameter, and these would be compressed/crushed by the flat sealing surface of the lid, creating a cold-tolerant, leak-tight seal.
The cup interfaces with the trim heater via eight 12–24 tapped holes around the lower face, and the lid is secured by twelve 10–32 tapped holes at the top port.
Two 2.4 mm diameter blind holes were included in the outer wall of the cup to accommodate silicon diodes and were vertically located and spaced apart to position them at the top and bottom of the test section (the region bounded by L and Δx in
Figure 1). These sensors were permanently anchored in place using Stycast 2850FT epoxy and would be used to provide information about the vertical ΔT at the CBT.
Figure 3 presents the CAD model of the final specimen cup design and an example of the indium o-rings in their final, installed configuration. Note: during initial checkout testing, it was found that only a single indium o-ring was necessary to adequately seal the specimen cup. Therefore, only the inner ring was used in subsequent testing.
2.4.3. Lid and Feedthrough Interface
The layout of the lid and feedthrough assembly had to accommodate six heater power wires, six thermocouple wires, and a gas supply interface while remaining vacuum-leak-tight across a wide temperature range. The situation was made even more challenging due to the vertical space constraint inside the vacuum chamber. The final design is shown in
Figure 4 and consists of a stepped copper lid, 14.3 mm at the thickest part and 9.53 mm at the thinnest, with a 1-1/2″–12 tapped hole in the middle; a G-10 isolator that threads into the lid, sized to provide a thermal break distance of 3.18 mm between the aluminum manifold and lid, with a 1-1/4″–18 threaded hole in the middle; and a cone-shaped aluminum manifold that threads into the G-10 isolator and houses three 20 W, 120 VAC cartridge heaters, six individual electrical feedthroughs for the inner heater assembly, a five-channel thermocouple feedthrough, and a gas supply fitting. Employing a conical shape angled the electrical feedthroughs enough to clear the top of the vacuum chamber and allowed the terminals to converge on the 22.2 mm diameter center port in the aluminum manifold. A 6 mm gap between the manifold and lid allowed for a round MLI blanket to be installed, limiting the radiative heat transfer between the two components during testing.
During final assembly, the lid, isolator, and manifold were threaded together using Stycast 2850FT epoxy as a sealant, as well as the three cartridge heaters into the manifold, resulting in a permanent assembly. On the inside of the manifold, a short section of wire with either a pin or socket terminal (one of each used for each of the three heaters and color-coded to aid in setup) was soldered to the end of each electrical feedthrough to interface with the inner heater assembly. The length of the wires is such that the pins/sockets terminate at the bottom face of the copper lid; this configuration made connecting the wires more cumbersome during the test setup but saved space in the small region between the lid and heater assembly where the additional wire slack must reside.
Figure 5 presents the as-built lid and feedthrough assembly and shows the wiring on both sides of the manifold as well as for the cartridge heaters, which were wired together in parallel to give a total power of 60 W at full power.
2.4.4. Inner Heater Assembly
The inner heater assembly was the most complex design challenge of the GHC apparatus and resulted in two different iterations to address issues that arose during initial checkout testing. It was desired to have a perfectly cylindrical, uniform outer surface area (i.e., the heat transfer area) while also accommodating six individual heater wires and three thermocouples. Additionally, heating had to be distributed uniformly and efficiently over the entire cylindrical surface area to eliminate potential hot spots.
A 9.53 mm diameter copper tube was chosen as the basis of the assembly and was driven primarily by the desired heaters and their available sizes. Flexible polyimide heaters, roughly 0.127 mm thick, would be used for the test section and guards and were sourced from Omega Engineering (Norwalk, CT, USA). In addition, with numerous options available at 25.4 mm wide, the heaters could be rolled into a cylinder with a dimeter of roughly 8 mm without overlap. The tube was bored out to a diameter as close to 8 mm as possible, and the thin heater cylinders slid into the tubes to fit snugly—and, more importantly, uniformly—against the inner wall. The heater wires could be routed through the middle of the tube stack and terminated at the top of the assembly, leaving a uniform, clean outer tube surface area. Although this configuration resulted in a thermal short between the test section and guards through the wires, because each heater would be controlled to the same temperature, at steady state, there should be no axial heat transfer. As for the thermocouples, a concession had to be made, as it was not practical to adhere them to the inner tube wall, nor was this desirable, as the outer surface temperature was the point of interest. As such, the thermocouples were secured to the outside of the assembly using copper tape, and the wires were routed vertically to meet up with the heater wires at the top of the assembly. Small-diameter 36-gauge wire was used for the thermocouples to minimize their impact on the uniformity of the outer surface area.
The sizing of the heater assembly was driven in large part by the sizes of the available polyimide heaters. The test section was to be larger than the guards, and a 25.4 mm wide by 76.2 mm long, 15 W, 28 V heater was chosen to power the unit, while the guards would be driven by 25.4 mm square, 10 W, 28 V heaters. Each tube section and heater would be somewhat thermally isolated from one another by short G-10 sections, and the entire assembly would be held together structurally by Stycast 2850FT epoxy.
Version 1 Design
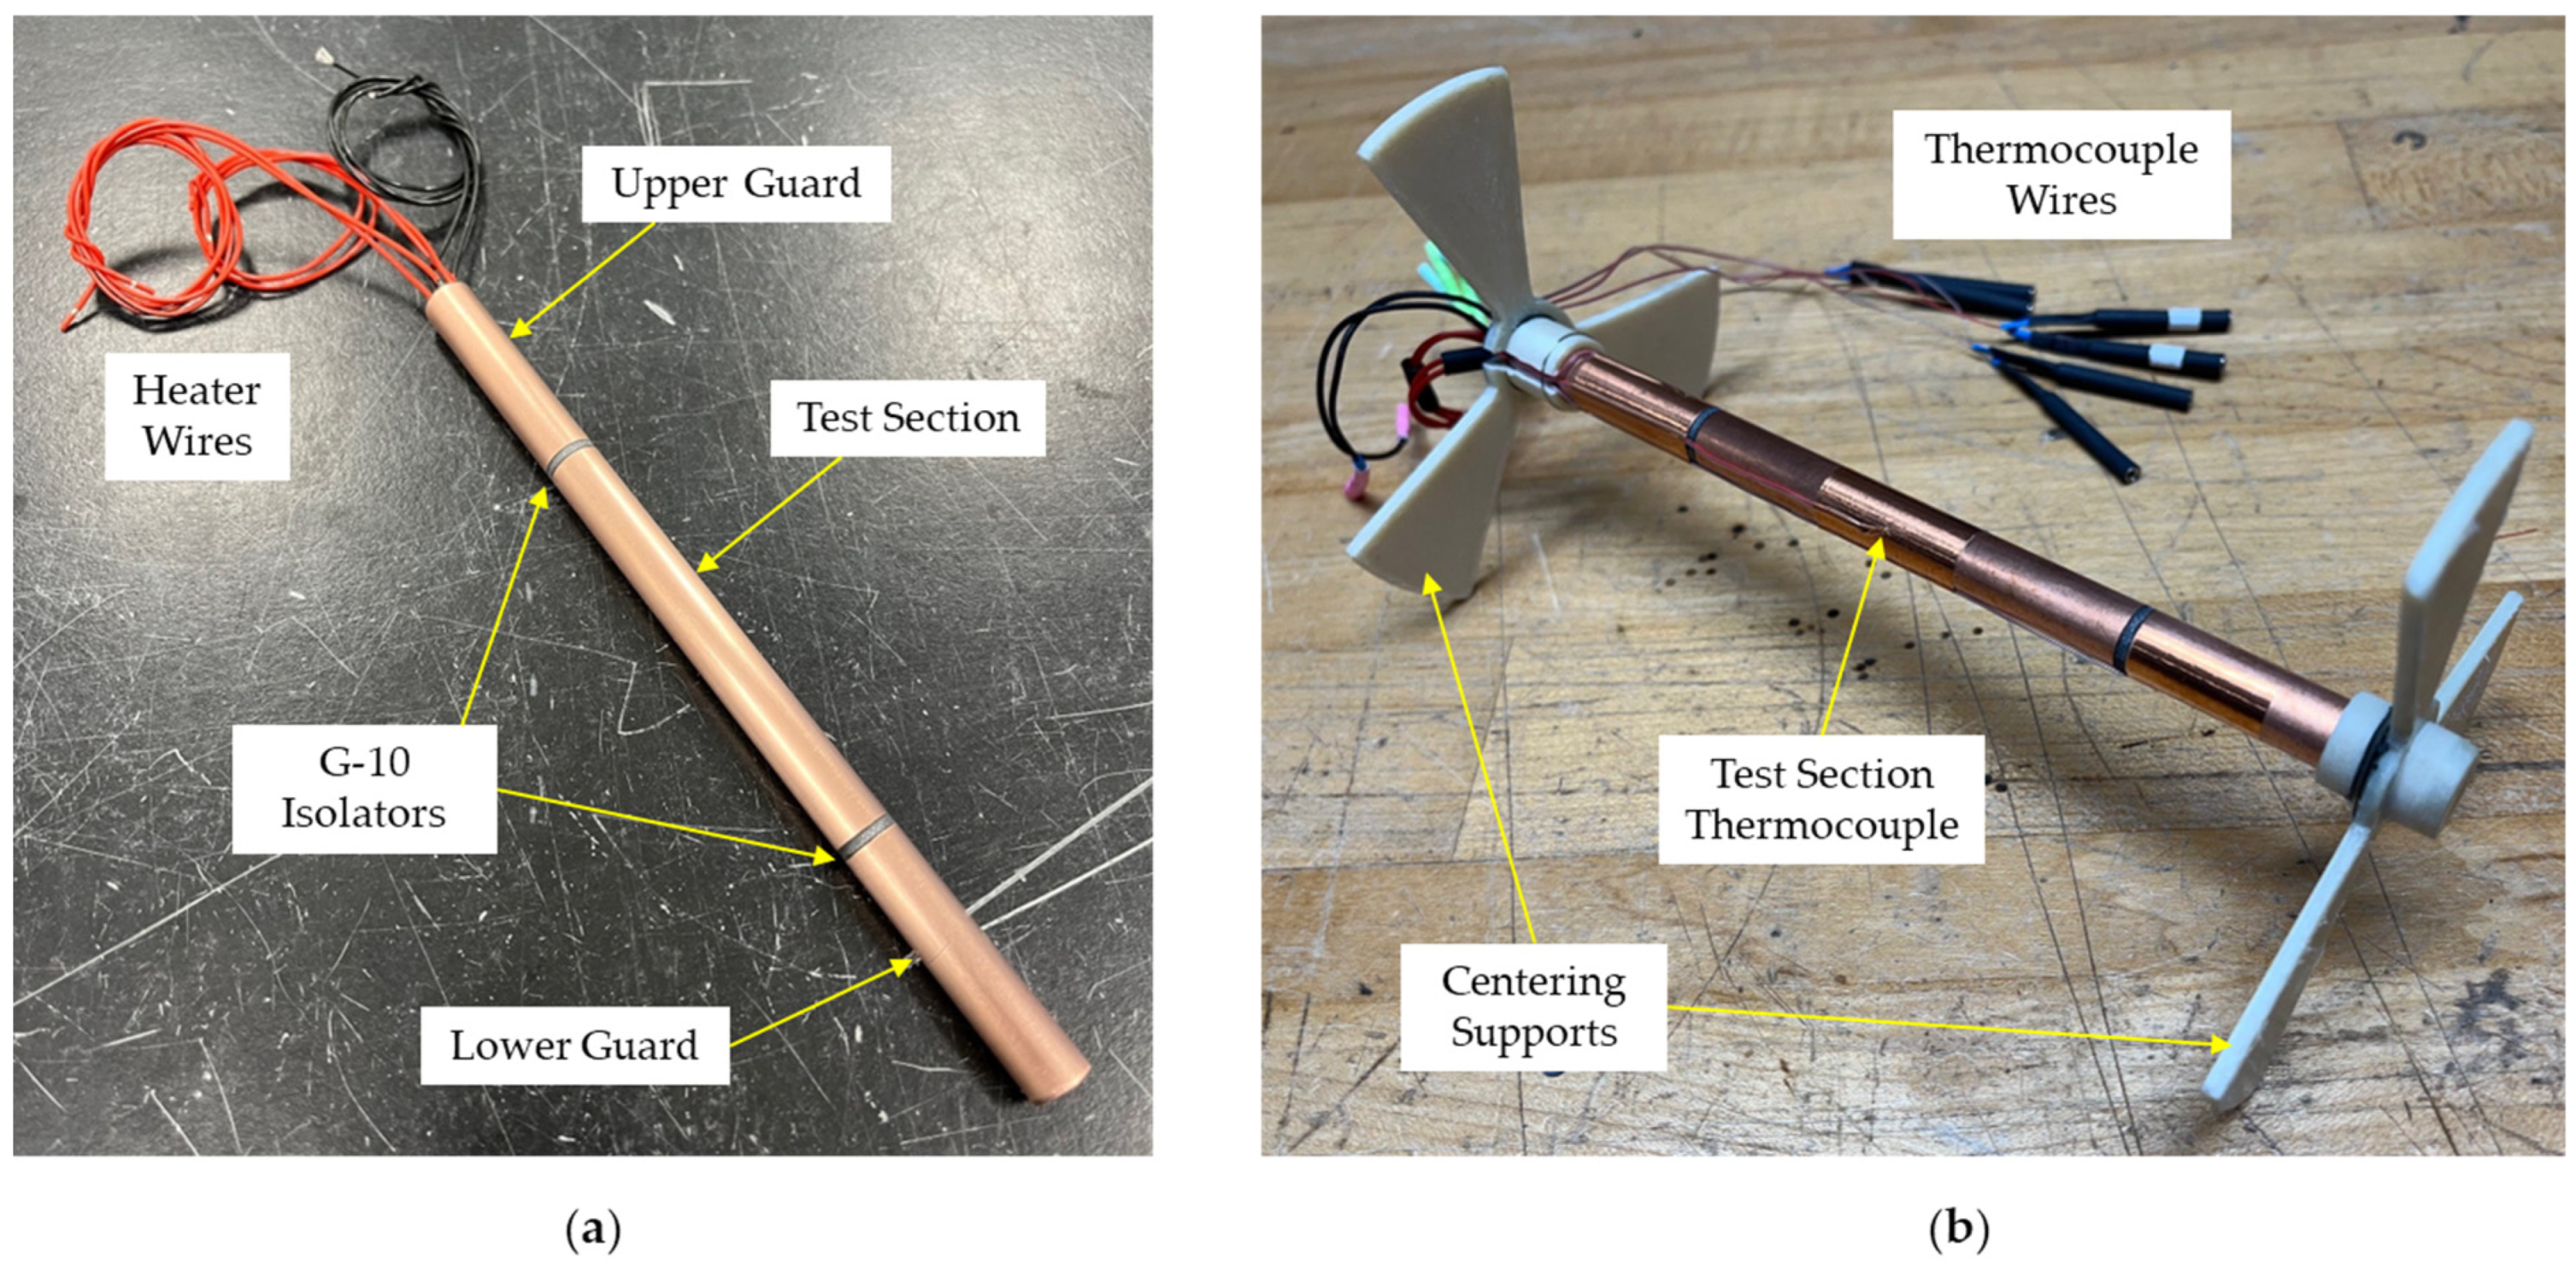
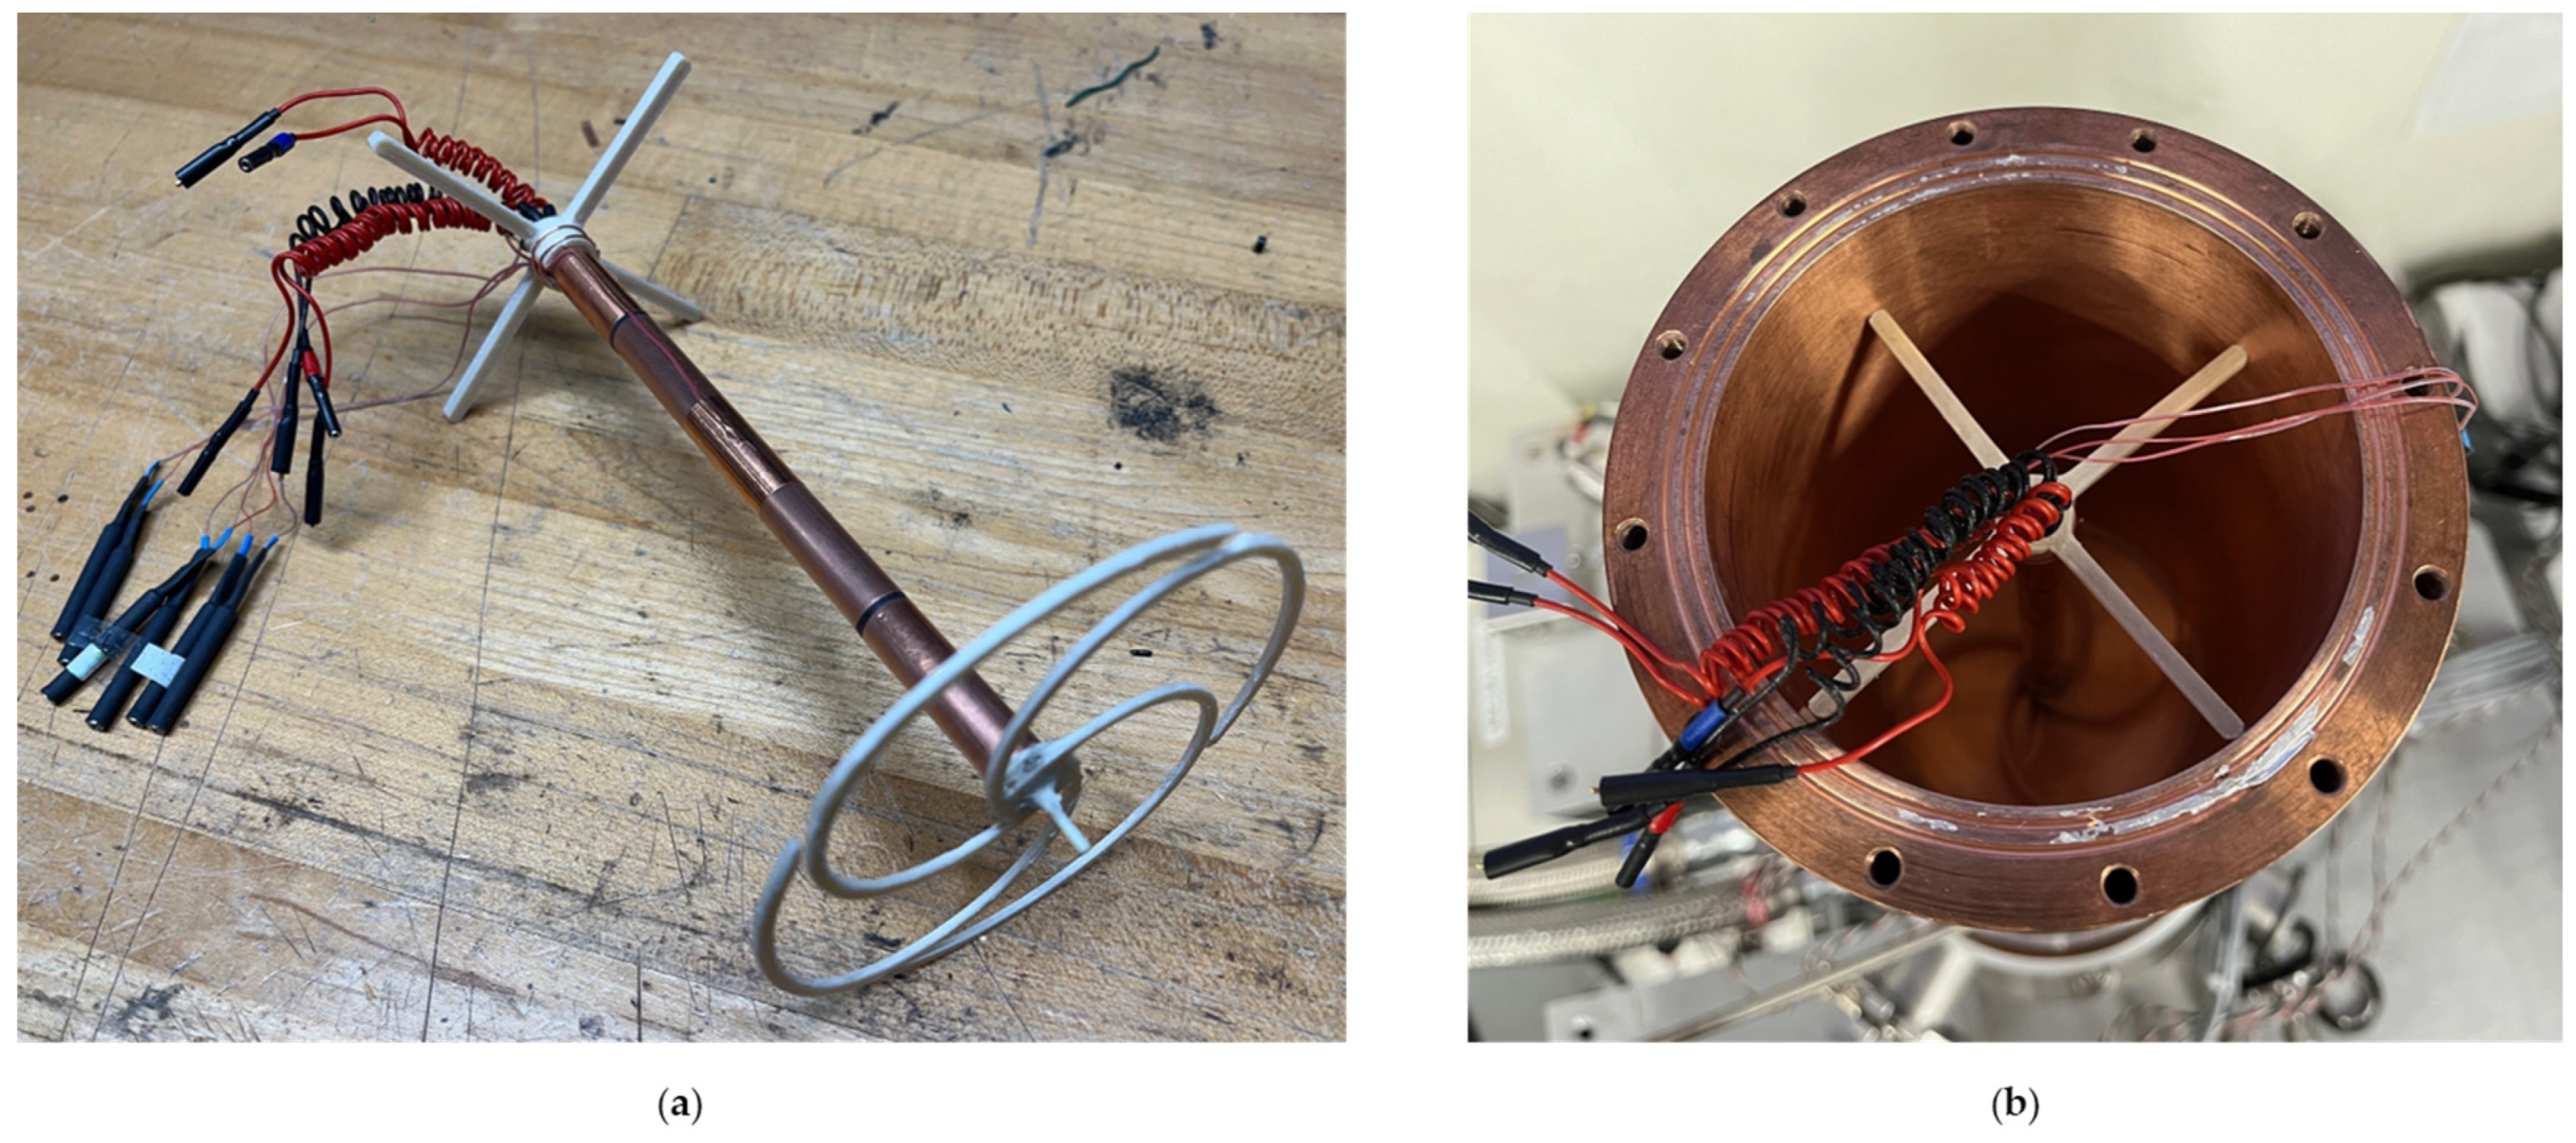
Two different iterations of the heater assembly were constructed and tested. Version 1 employed a 76.2 mm long test section (exactly the same length as the heater), with 40.2 mm guards separated with 1.7 mm G-10 isolators (tube sections), resulting in a total assembly length of 160 mm. The method of rolling the flexible heaters and inserting them into the tube section worked well; however, due to their small size and the bulky strain relief at the wire interface located at one end, they did not lie perfectly uniformly against the inner walls. For each heater, there was a small section not physically in contact with the wall; but as it was only small portion of the overall heater area, the decision was made to move forward with the assembly—a choice that ultimately necessitated a redesign of the overall heater assembly and will be discussed momentarily. Each part of the assembly was stacked and held in place with tape, and the inner volume was completely filled with epoxy to form a solid unit.
Figure 6 shows this version 1 unit after epoxy filling and as the completed assembly after installing thermocouples and terminating the different wires. Also shown in
Figure 6 are the upper and lower centering supports. These were 3D-printed out of polyetherimide plastic and used to precisely locate the heater assembly inside the copper specimen cup, vertically and concentrically, when testing with bulk-fill insulation materials (or gas/vacuum only).
Version 1 Observed Problems
During initial checkout testing of the version 1 heater assembly, an issue arose at low heat loads: with the test heater off and the guards controlling to a stable 293 K, the test heater temperature stayed slightly higher by roughly 1 degree. Two potential reasons were determined that could have caused such an issue: (1) there was a significant offset between two or more of the thermocouples, enough so that even though the guards were controlling to 293 K, their actual temperatures were warmer, which bled heat into the test section and affected its temperature; and/or (2) there was a hot spot inside the upper guard, considerably higher than the 293 K on the outer surface of the tube, and due to the thermal short from the test heater wires, which ran through the guard, very close to the inner wall, heat was leaking into the test section. Option 1 was not believed to be the cause, since the thermocouples had been calibrated at ambient temperature, and their offsets were accounted for in the DAQ software. Option 2 seemed the most logical choice, especially since, as was previously noted, a small portion of the flexible heaters did not touch the tube wall and were instead encapsulated in epoxy and in close proximity to the test heater wires. It was believed that this section produced a hot spot inside the epoxy fill that did not affect the reading of the guard thermocouple but resulted in enough heat leakage into the test section to maintain its temperature above 293 K.
Version 2 Design
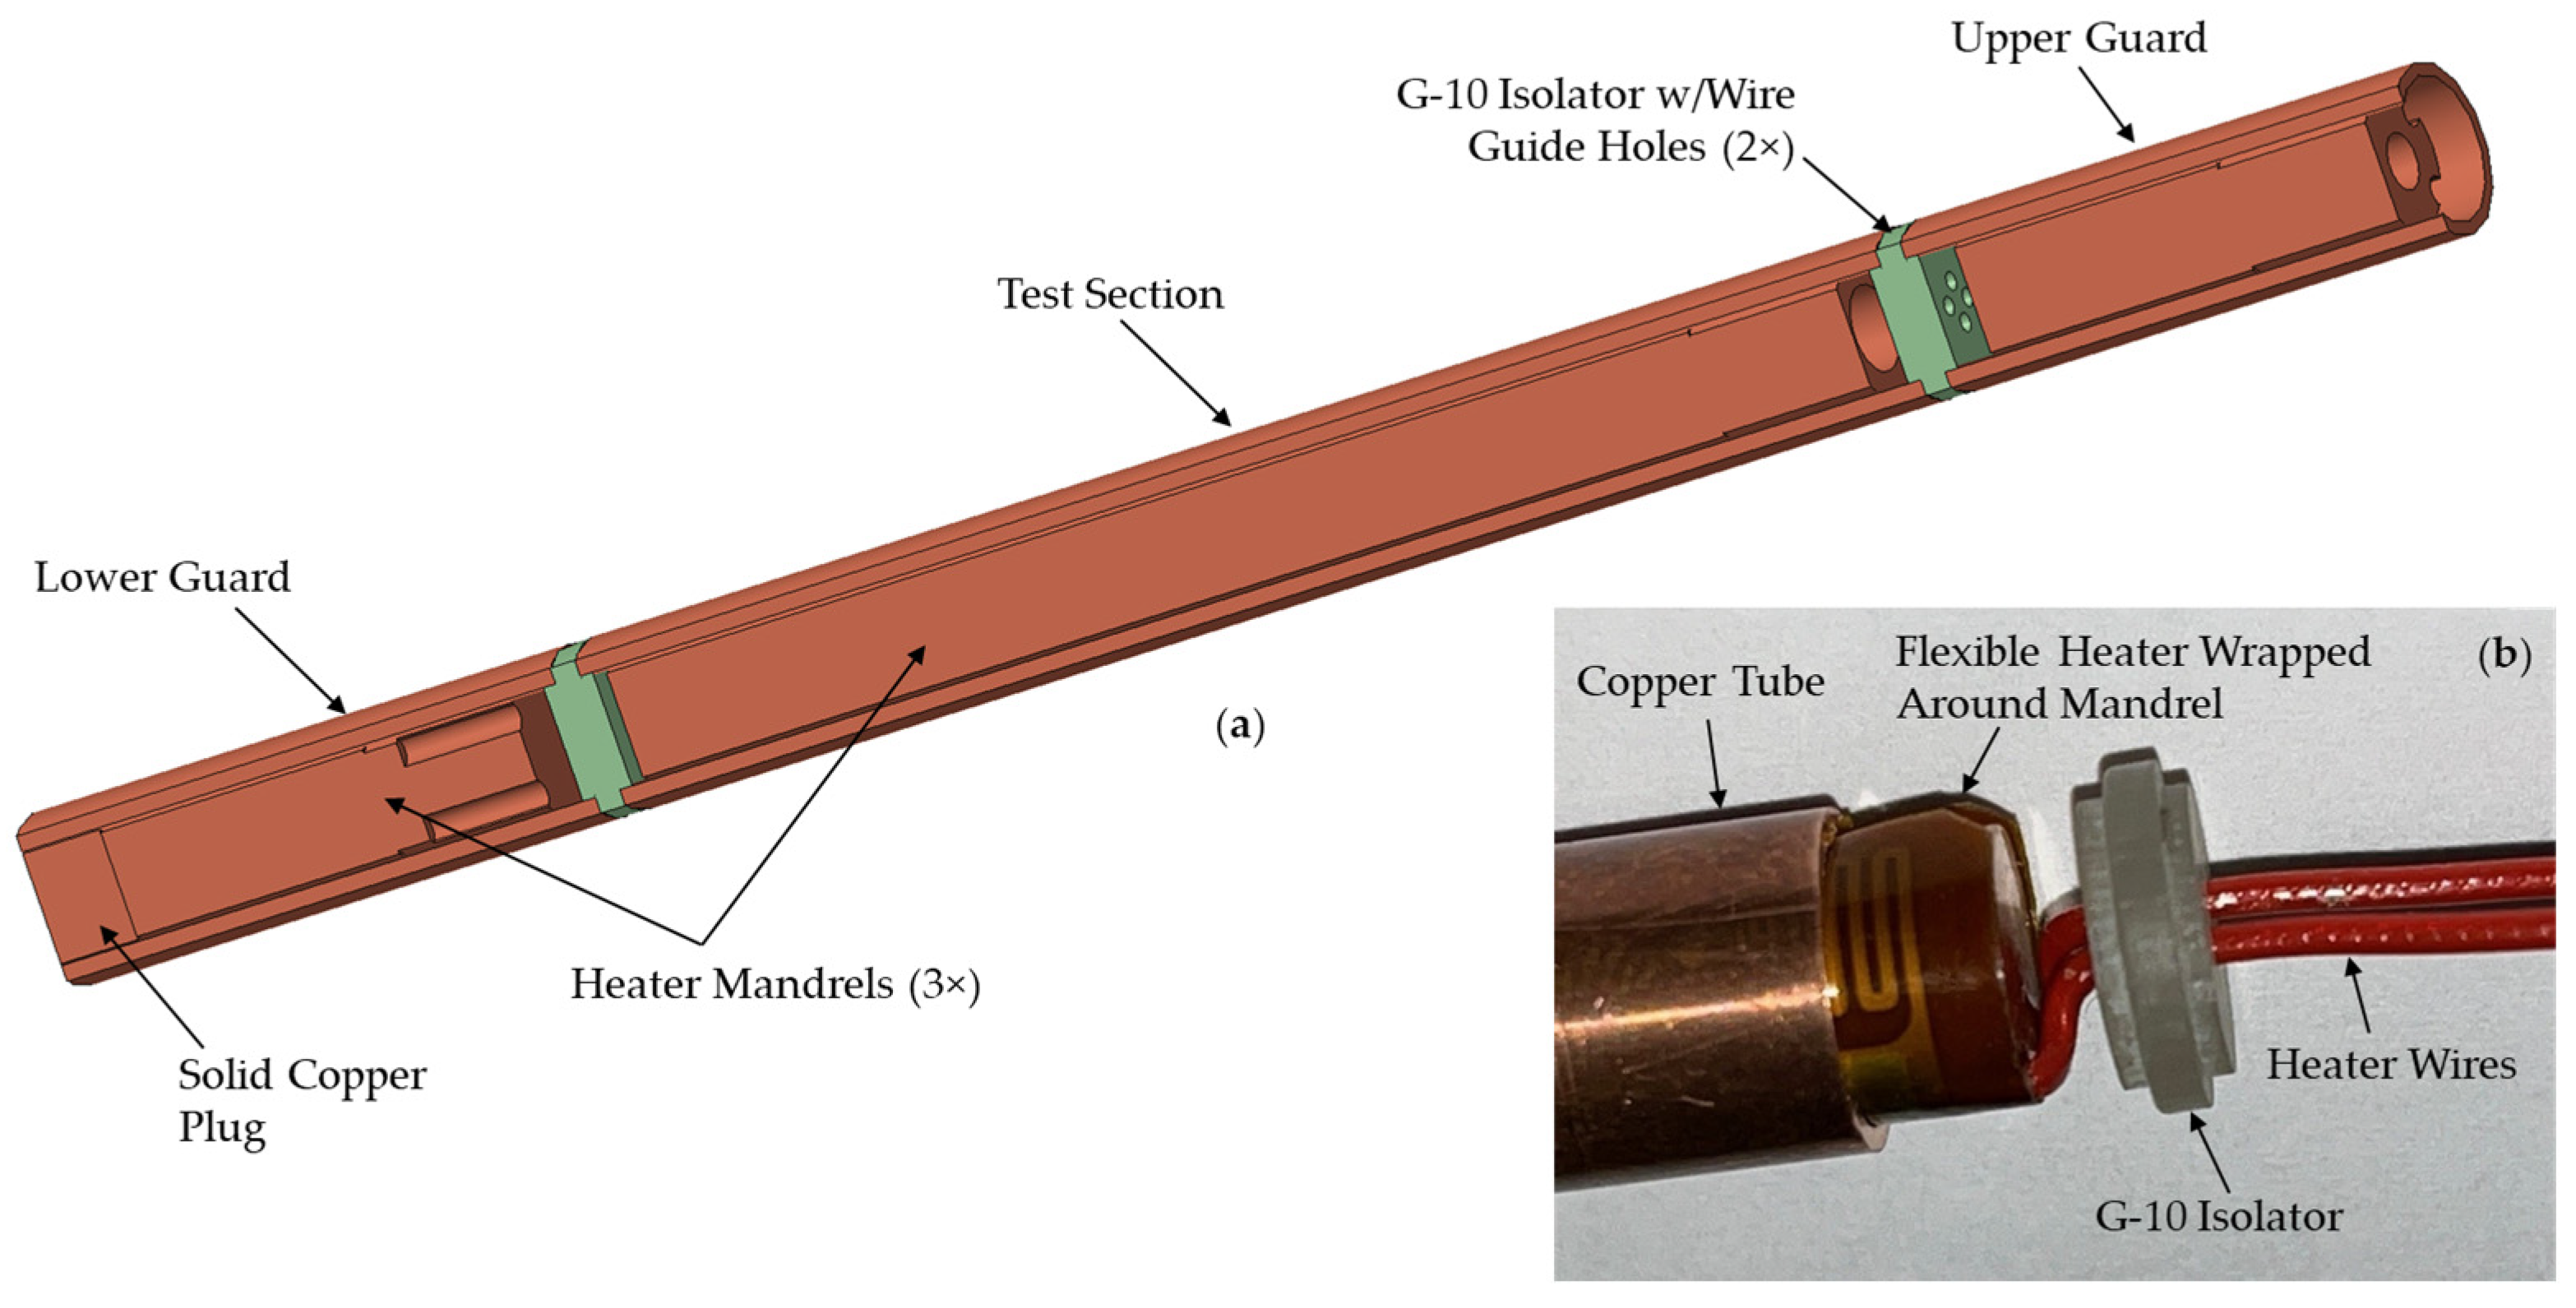
Combating the issue with the version 1 heater assembly required a full redesign of the unit. There were three goals for this effort: (1) ensure full contact between the flexible heaters and tube walls; (2) route the wires from the lower guard and test heater through the middle of the assembly, away from the tube walls; and (3) improve the thermal isolation between the test section and guards inside the tubes (in version 1, the tube walls were isolated using G-10 sections, but inside each section, there was good thermal communication via the epoxy). A number of solutions were explored to achieve goal #1, including applying a spring force to the backside of the heater to force it against the tube wall and using a temporary balloon that could be inflated during assembly to apply even pressure to the backside of the heater while the epoxy cured to bond it to the wall, none of which, it was felt, could be reliably executed. Instead, copper mandrels were chosen to wrap the heaters around, and then both could be inserted into the tubes. These mandrels had to be precision-machined to maintain the proper gap between them and the tube—a gap too small and the heater and mandrel could not be inserted, and a gap too large introduced a risk of having bad thermal contact between the heater and tube wall—and they had to accommodate reliefs for the inward-facing heater wire interfaces and, for the test section and upper guard, a center hole for wire routing. Through trial-and-error, a gap size of 0.3937 mm was found to provide the proper fit, allowing the mandrel and heaters to be fully inserted into the tubes without excessive effort yet sung enough to ensure uniform contact between the parts. During assembly, Stycast 2850FT epoxy was used between the parts to further ensure a solid bond, but this also acted as a lubricant to aid insertion.
With the issue of uniform heater contact resolved, wire routing and isolation were addressed by, again, using G-10 pieces between the tube sections. However, instead of hollow tubes sections, as with version 1, solid parts were fabricated from G-10 rod for version 2. These isolators were designed with a step on both ends to help center the copper tubes and created a 1.52 mm separation. Small holes were drilled into the center of each isolator to guide the individual heater wires—two holes in the lower isolator and four in the upper—and aided in routing the wires through the center of the assembly. This configuration required two tight 90° bends in each wire, very close to the interface point on the heaters, to reduce the amount of additional length and subsequent “dead space” inside the tubes needed to route the wires from the inner tube wall where they terminate to the centerline. Locating these bends as close to the heaters as possible minimized the dead space gap between the top of the mandrels and bottom of the G-10 isolators to 2.16 mm.
Figure 7b shows the configuration of the version 2 parts at the lower guard interface, with the wire bends clearly visible, while
Figure 7a presents a cut-away of the CAD model, revealing the individual parts and layout.
Accommodating the various changes and shortening the guards slightly to allow for more insulation around the unit resulted in a total length of 147.7 mm for the version 2 inner heater assembly—roughly 11 mm shorter than version 1—with an 80.7 mm test section, a 33.1 mm lower guard, and a 30.9 mm upper guard.
During final assembly, each of the tube sections was bonded to the G-10 isolators using Stycast 2850 epoxy to form a rigid unit. Additionally, all dead spaces (i.e., between mandrels and isolators and in the center holes through the mandrels) were filled with epoxy; this was carried out for thermal anchoring and to eliminate any possibility of gas-related heat transfer from occurring inside the unit. A solid copper plug was also epoxied into the end of the lower guard to remove dead space below the mandrel.
Figure 8 presents the final configuration of the version 2 inner heater assembly, with updated 3D-printed centering supports and longer heater lead wires to reduce parasitic heat leak as well as the unit positioned inside the copper specimen cup. This revised assembly proved extremely successful during initial testing, not only solving the issue from version 1 but also yielding valid tests at measured heat loads as low as 20 mW within the test section.
2.4.5. Final Assembly
The final GHC assembly is presented in
Figure 9 and shows the instrument as it was envisioned in CAD, with all the major components called out—note the vertical space limitation inside the chamber, which was a driving factor in the geometry of the aluminum manifold—and the as-bult system prior to installing wiring and insulation (MLI). Additionally, a design specification table that summarizes all the major components, instrumentation, and electrical hardware can be found in
Appendix A.
The gas supply feed tube shown in
Figure 9b was custom-made with the test article in place; therefore, it fit a particular clocking of the lid and feedthrough assembly. On the lower vacuum chamber, the gas supply tube feedthrough was also custom made, and it consisted of a 6.35 mm compression fitting (Swagelok company, P/N SS-400-1-4W) that was bored-through to allow the tube to seamlessly penetrate the chamber wall and welded to a 40 mm ISO-KF vacuum fitting.
Depending on the nature of the sample being tested, the setup time for the GHC can be relatively short, even accounting for the tear-down of a previous test. Given the current experience with the instrument, for most situations, the turn-around can be accomplished in well under 4 h, with most of the effort spent on mechanical removal of the old indium seal (i.e., scraping with non-metallic tools so as not to damage the copper sealing surfaces or via a small rotary tool and wire wheel) and installing the new specimen.
One shortcoming of the current setup is the two-person operation necessary for final installation of the lid and feedthrough assembly to close-out the cup. As can be gleaned from
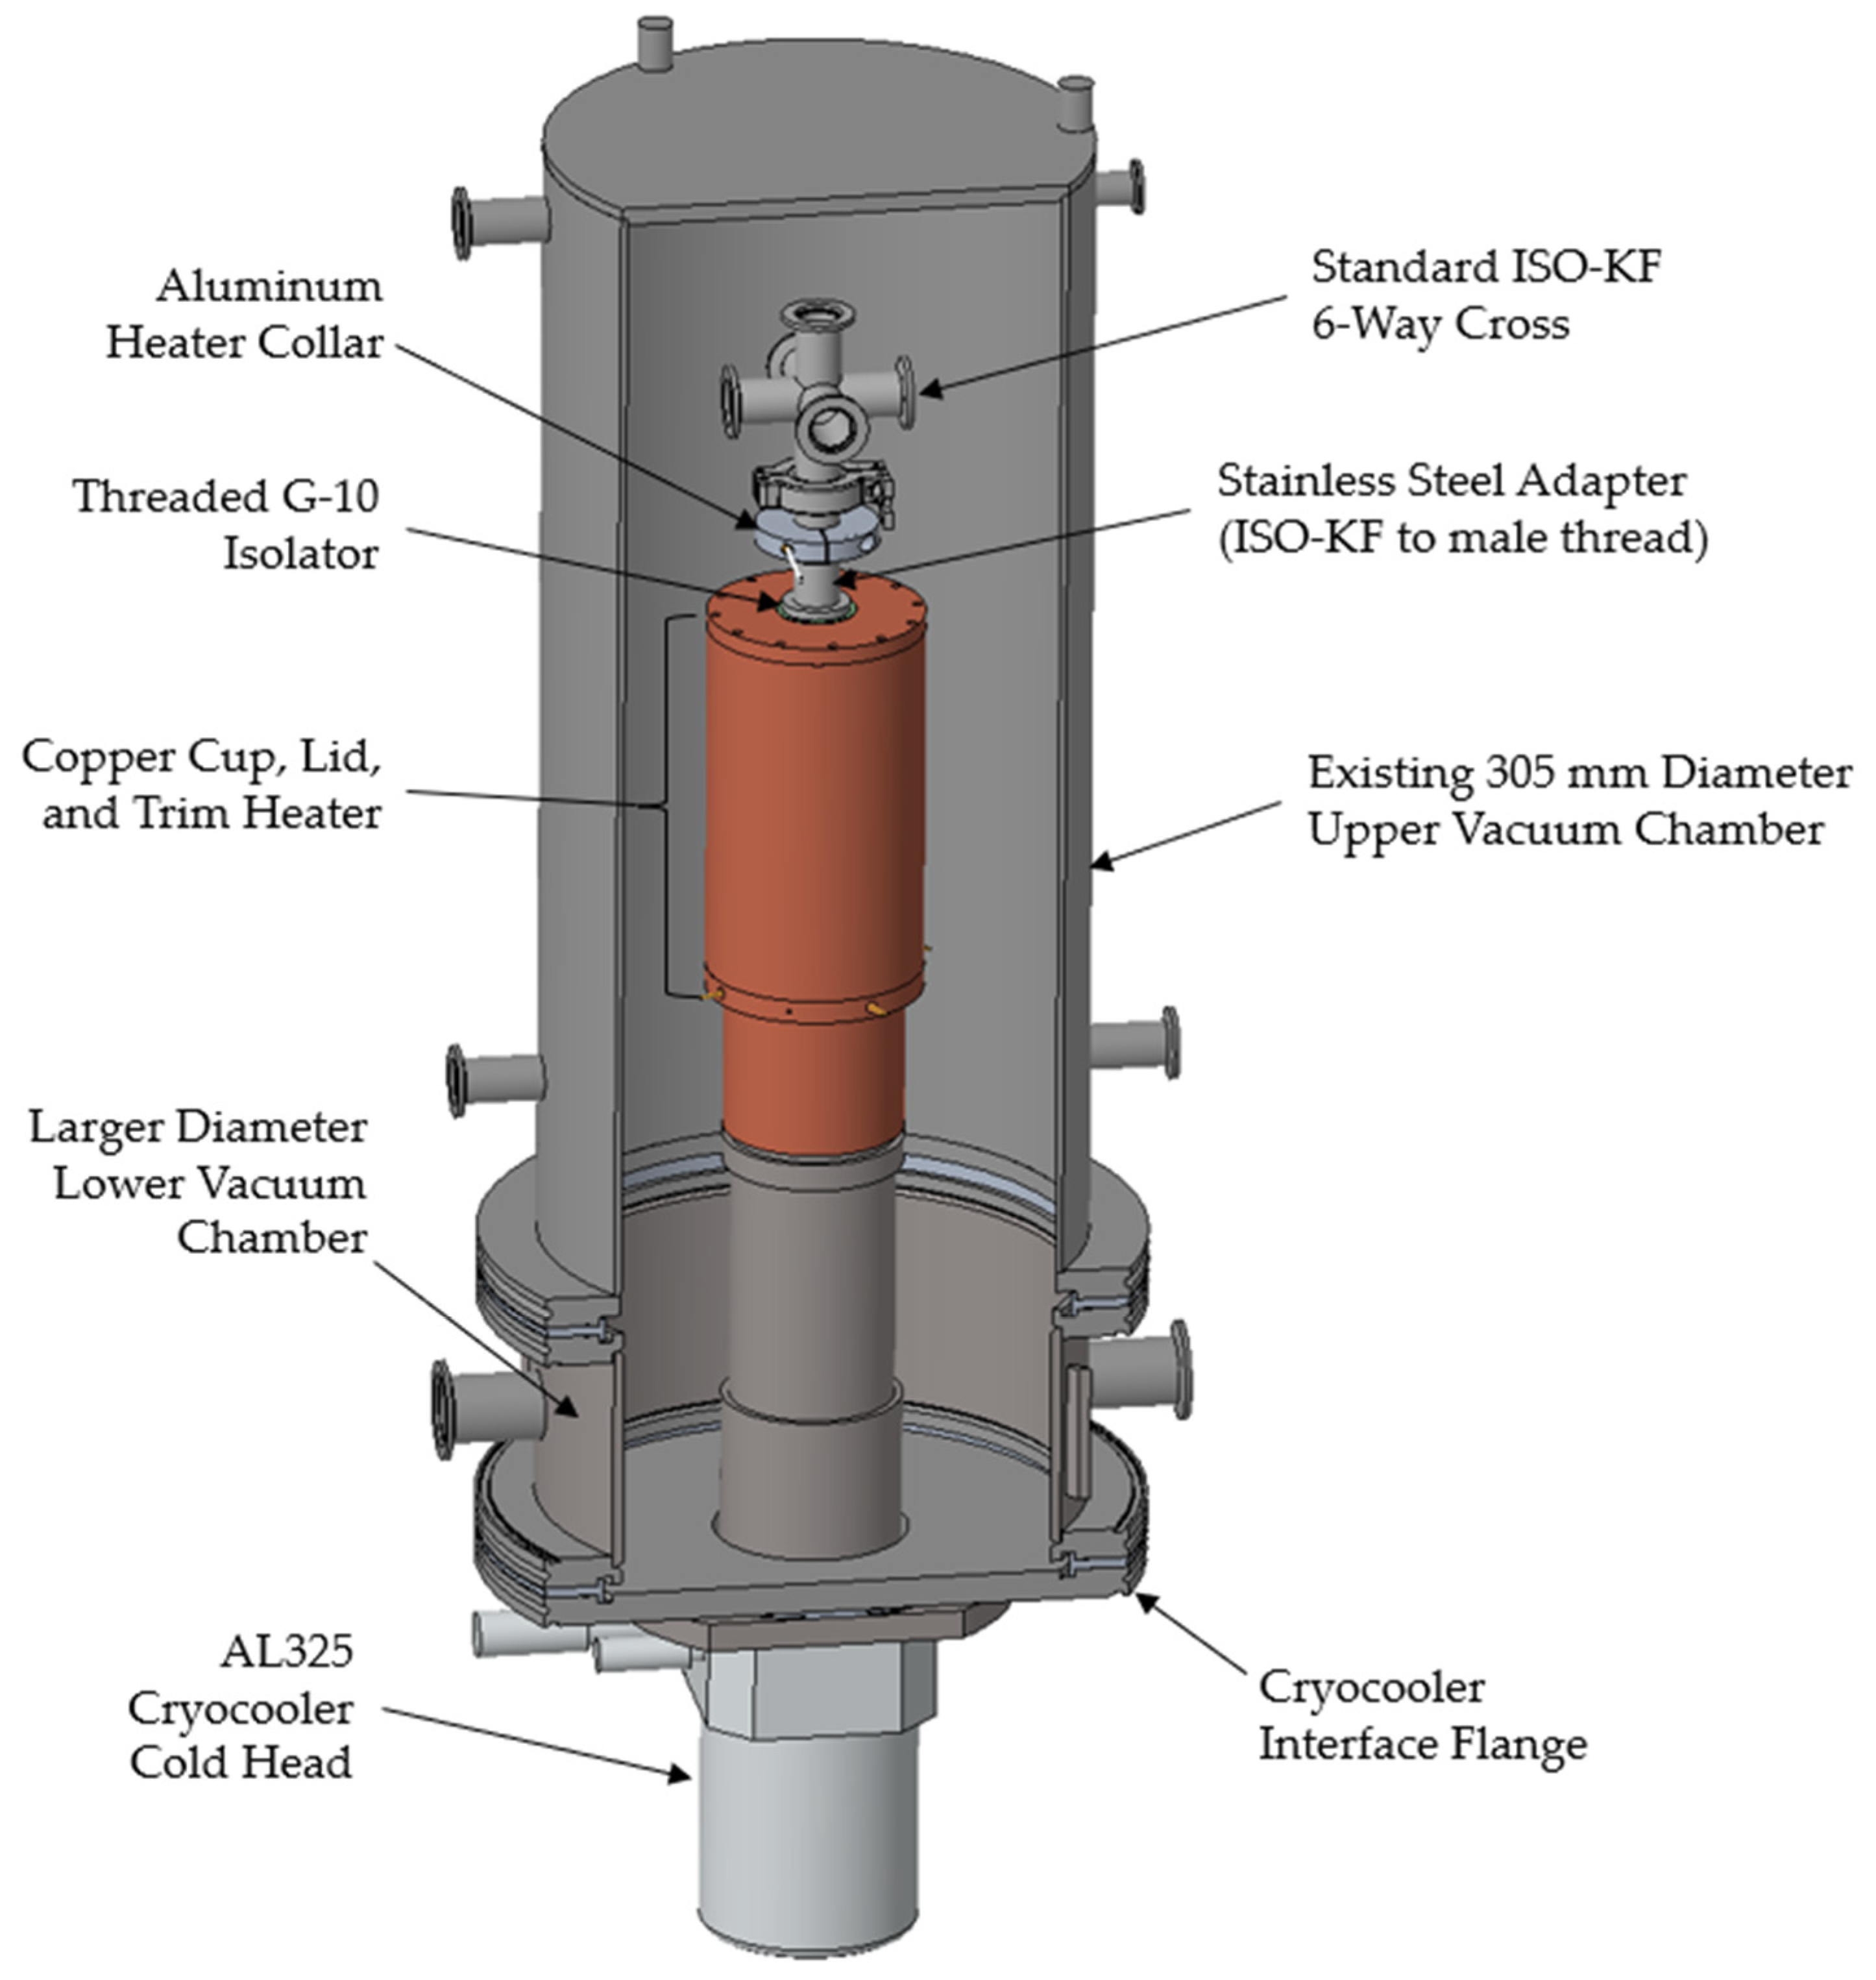
Figure 5b, it is very difficult for a single person to hold the lid assembly while connecting the twelve wires inside the aluminum feedthrough. This operation, while still awkward, is relatively straight-forward with a partner; however, a temporary fixture could probably be employed to eliminate this requirement, and this is something currently being explored. It should also be noted that the awkward wire management approach in the current GHC setup is a symptom of design concessions made due to space constraints inside the existing vacuum chamber. Given a larger chamber, it is possible to envision a lid and feedthrough assembly that is more accommodating to wire routing/terminating but also with more instrumentation inside the cup as well. Such a design has been explored, based on an existing 305 mm vacuum chamber at the CTL, and the concept is presented in
Figure 10.
With a much larger volume to utilize, the concept in
Figure 10 allows for a redesign of the feedthrough interface to employ more standard vacuum fittings (ISO-KFs were chosen for the embodiment shown in
Figure 10, but other configurations are possible). This not only allows for more room for additional wire length inside the test article, which aids in test setup, but also opens many more possibilities for instrumentation feedthroughs, as numerous commercial off-the-shelf options exist, and this expands the GHC’s testing capabilities. A custom adapter would still be necessary to interface with the standard fitting to the G-10 isolator, as well as a heater collar—possibly, depending on the type of vacuum fittings employed—to maintain the vacuum o-ring seals at ambient temperature.
2.5. Instrumentation and Comand and Control
Due to the wide range of temperatures and pressures required for GHC testing (see
Section 2.2), numerous types of instrumentation and C&C hardware are employed on the current setup. Many of the hardware choices were driven by prior experience by the project team and by the need to use existing/available resources at the CTL. Therefore, the components and approaches described herein are not intended to be prescriptive, as it is acknowledged there may be more efficient and effective options; instead, what is reported here is simply an example that has proven successful during these initial phases of development and early testing.
2.5.1. Temperature and Pressure/Vacuum Measurements
Two types of temperature instrumentation were used and primarily depended on the required lowest range at the location of interest: two-wire type-E thermocouples for temperatures down to roughly 80 K; and four-wire silicon diodes for temperatures < 80 K. The thermocouples were welded in-house from wire sourced from Omega Engineering and are employed on the inner heater assembly and aluminum manifold. The use of thermocouples on the inner heater assembly, as was previously mentioned, was driven more so by the need to minimize the total number of wires that interfaced with the aluminum manifold, and to decrease the impact of the sensor on the desired uniform heat transfer surface area. As the aluminum manifold was expected to be maintained at or above the temperature of the inner heater assembly, thermocouples were also chosen for it. In total, five thermocouples are employed in the current GHC setup—three on the inner heater assembly and two on the aluminum manifold (one for measurement, one for control)—and for those on the inner heater assembly, an in-house calibration was performed using liquid nitrogen, a water–ice bath, and at ambient temperature. All thermocouples interface with the DAQ via a National Instruments 9213 thermocouple input module and model cDAQ-9174 CompactDAQ.
Five silicon diode temperature sensors are currently used: three on the copper specimen cup, one on the trim heater, and one on the cold head. All sensors were sourced from Scientific Instruments (Schaumburg, IL, USA) and had the same physical senor package but were from different time p; hence, they have various model numbers (Si410, Si435, and Si540) and calibration ranges. These sensors interface with a Lakeshore Model 280 Temperature Monitor that feeds analog outputs to the DAQ for recording and heater control purposes.
Two pressurized volumes exist for the GHC setup: within the test article (i.e., in the insulation space) and in the vacuum chamber. To cover the large pressure range in the test article, from high vacuum (<1 millitorr) up to one atmosphere (760 torr), three MKS brand 627 series capacitance manometers are used: a 1000 torr unit for pressures from ambient down to about 10 torr; a 20 torr unit for pressures between 0.1 and 20 torr; and a 0.1 torr unit. These MKS manometers are routinely employed by the CTL for vacuum measurement and are used in conjunction with an MKS Type 248A control valve and Type 250 controller to precisely maintain the test pressure in the insulation space. Output signals are captured by the DAQ via a National Instruments 9219 analog input module.
Measurement of the vacuum chamber pressure is handled by a wide-range (760 torr to 1 × 10⁻⁵ torr) MKS Series 925 Micro Pirani™ transducer and reads into the DAQ via a USB connection.
Figure 11 and
Table 1 present the sensor layout, data tags, and relevant information for the temperature instrumentation.
2.5.2. Heater Control
Five independently controlled heating elements (that is, stand-alone heaters, or multiple wired in parallel) are necessary to operate the current GHC: two 120 VAC units, one for the trim heater and the other on the aluminum manifold, and three 28 VDC units powering the inner heater assembly. Except for the aluminum manifold heater, which is controlled via a stand-alone Cole-Parmer (Vernon Hills, IL, USA) Digi-Sense™ R/S heater controller, each of the other units is commanded via a custom DAQ/C&C system that will be discussed in the next section through intermediate power supply hardware.
For the trim heater, a micro-controller-based Single-Phase Proportional Control Solid-State Relay (SSR) from Sensata Technologies (Crydom, Model PMP2425WPH, Attleboro, MA, USA) supplies power based on C&C inputs. The test section on the inner heater assembly is powered by a single-channel programmable DC power supply (KEITHLYEY, Model 2230-30-5, Solon, OH, USA), and the upper and lower guards are handled by a three-channel programmable DC power supply (KEITHLYEY, Model 2230-30-1). A particularly important feature of the DC power supplies used are the remote sense lines in addition to the output power. These sense lines allow for the accurate measurement of the voltage potential across the heaters by compensating for the voltage drop in the source wires, and they are critical for the test heater. as the power (heat) is determined from the voltage and amperage measurements, and only heat that is deposited inside the test section is of intertest for calculating the performance metrics presented in
Section 2.1.
2.5.3. Software and Control Logic
Data acquisition and command and control for the GHC are handled via a custom program built using the National Instruments LabVIEW software (2018, version 21.0). It was unknown how difficult tuning and controlling the five independent heating elements would be at the outset of the project; therefore, the software was set up to provide maximum user flexibility.
Each heating element is controlled via the proportional–integral–derivative (PID) method, with the three variables set up as user inputs. For the three DC heaters on the inner assembly, the control variables are the three corresponding thermocouple temperatures (i.e., T1, T2, and T3, as shown in
Figure 11) with user-defined setpoints. The offsets for each of these thermocouples, determined from calibration testing, are also user-defined. A similar approach is used for the trim heater to control the CBT, except that the control point is also a user input; however, for all the testing to date, T6A, located in the middle of the test region, has been used at the CBT control point. For the aluminum manifold heating element, the stand-alone Cole-Parmer controller utilizes its internal logic and tuning to maintain the temperature using T8 as the control point. The T8 setpoint is adjusted by the user based on the T9 reading from the DAQ, typically to the same value as the upper guard temperature, T2, to reduce heat leak through the wires connecting the guard to the feedthrough on the manifold.
For the three inner heaters and the trim heater, provisions were put in place to bypass the PID control and send constant power to each unit based on a user-defined input—voltage for the inner heaters and percentage for the trim heater. This feature was added during checkout testing to aid in troubleshooting but proved valuable during actual test runs as well for fine-tuning the PID parameters.
Figure 12,
Figure 13 and
Figure 14 show three of the most relevant Graphical User Interface (GUI) screens from the LabVIEW program.
Figure 12 presents the primary GUI screen, where real-time temperature and pressure data are displayed, along with the control panels for the inner heater assembly and trim heater and inputs for the thermocouple temperature offsets. The control panels feature inputs for the WBT and CBT setpoints and PID bypasses (manual control buttons, with voltage inputs for the inner heaters and a percentage input for the trim heater). A real-time computation of the effective thermal conductivity—calculated using Equation (3)—is also displayed on the test heater control panel.
Figure 13 shows the PID control screen and features two sets of the three input parameters for each heating element, with an option to switch to “Fine PID” control (linked to the lower set of parameters for each element). These two sets of PID parameters were included during checkout testing when it was realized that, for the initial transient phase of a test—that is, when thermally conditioning the specimen to a constant temperature profile at steady state—a larger proportional gain is necessary to speed up the process. Once steady state is achieved, fine control, using much lower proportional gains, can be switched on to yield a more stable measurement. An overtemperature limit is also included for each heating element, which cuts power to the heaters in the event of a failure that could cause overheating, such as if the cryocooler were to inadvertently shut down during testing without personnel present to react.
Also noted in
Figure 13 is that the derivative parameter was set to zero for each control loop. This was a result of the trial-and-error approach to tuning the parameters during checkout testing. Over all tests, using integral and derivative parameters of 1 and 0, respectively, yielded reasonably stable behavior, and only the proportional parameter was varied depending on the test conditions—typically between 9 (for high heat loads or transient periods) and 0.1 (for low heat loads or steady-state periods).
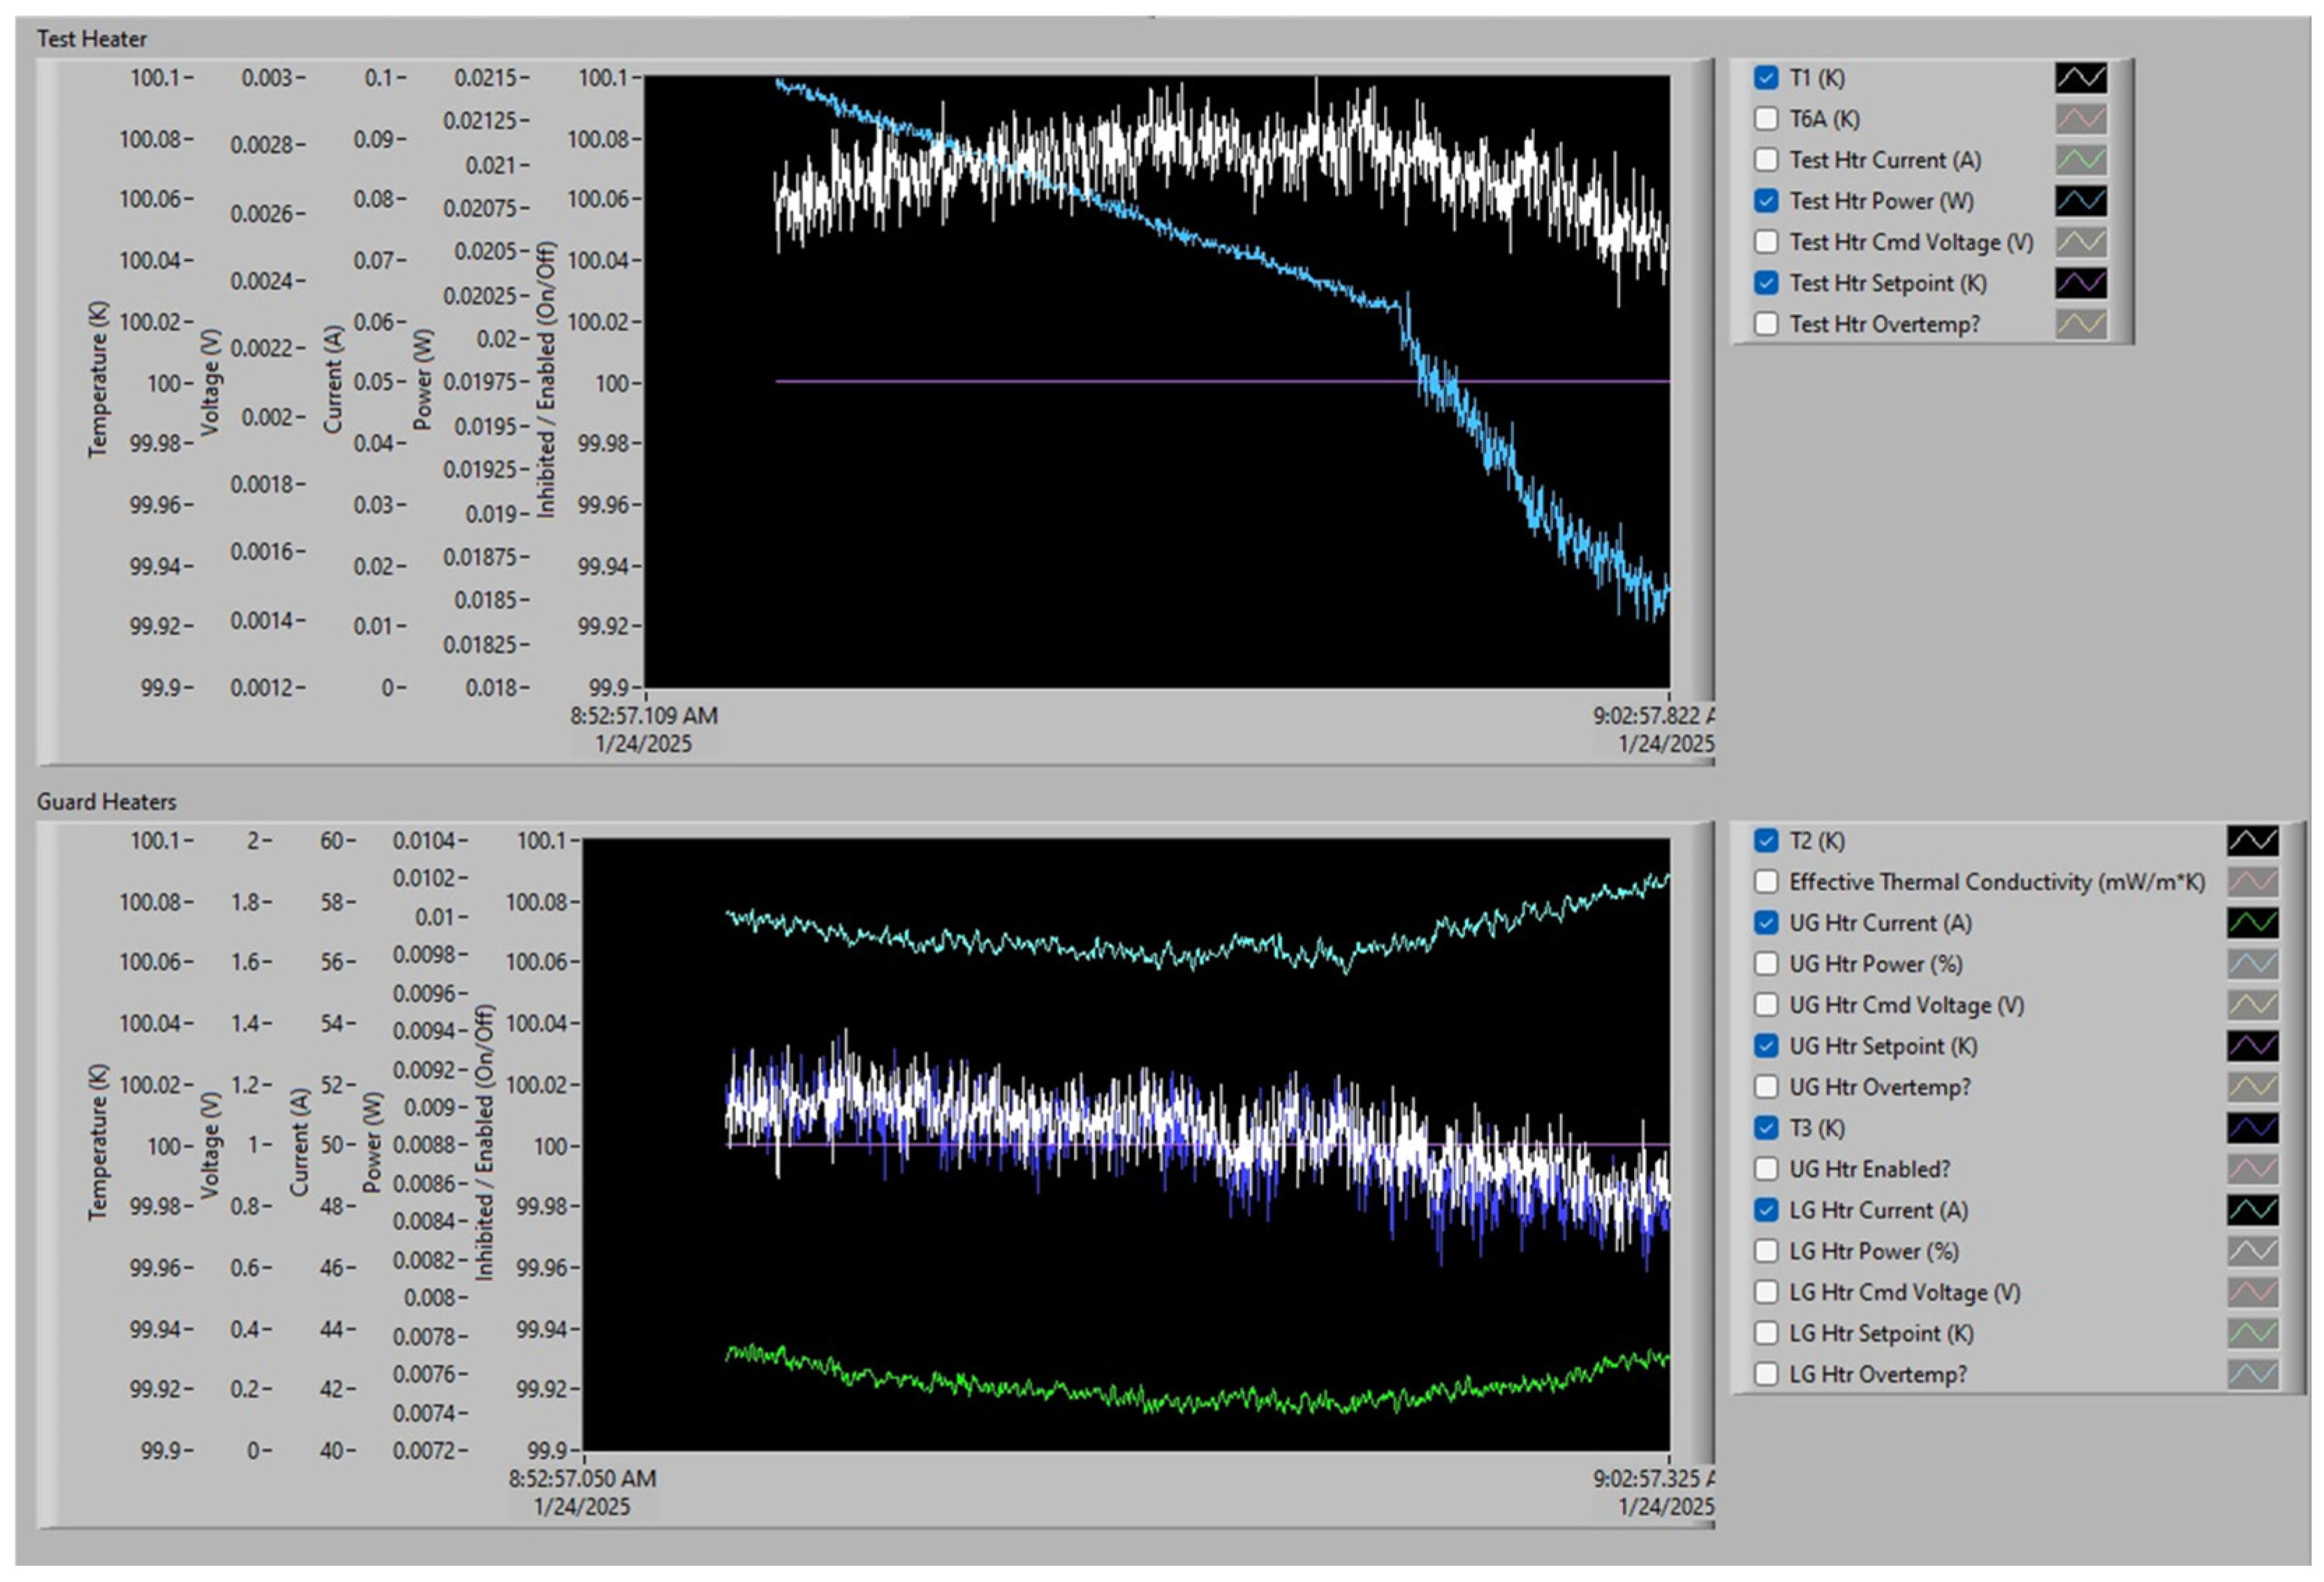
Figure 14 shows real-time data graphs for the inner heater assembly. These plots are critical to inform the test conductor during a GHC measurement as to the stability of a test and/or the trends so they can make necessary adjustments to the controls. During a successful steady state measurement, the guard and test section temperature and power (or current) plots remain relatively flat, with the temperatures at their setpoints (flat purple line) and with minimal fluctuation due to PID control. Due to the nature of the control logic—namely that there are three independently controlled heating elements on the inner assembly that can thermally communicate with each other—it is impossible to achieve completely flat, constant temperatures and input powers. However, in practice, it was found that very stable conditions are achievable, with indefinite temperature control of ±0.01 K or better routinely realized and with standard deviations on the test heater power of <0.01 W.
5. Conclusions
A Guarded Hot Cylinder (GHC) calorimeter has been designed and tested at the Cryogenics Test Laboratory (CTL) at NASA Kennedy Space Center to characterize the performance of thermal insulation systems and materials over broad pressure and cryogenic temperature ranges, with a particular focus on the liquid hydrogen regime (~20 K). As opposed to the more ubiquitous boiloff calorimetry approach, which utilizes a sacrificial cryogenic liquid to measure heat flow, the GHC is a “dry” method, employing a cryocooler to provide continuous cooling, and it can access deep cryogenic temperatures where the use of cryogens such as liquid hydrogen and helium are safety- and/or cost-prohibitive.
The driving factor that led to the development of the GHC was the lack of thermal insulation data at liquid hydrogen temperatures coupled with the growing global interest in the commodity. To date, there are very few calorimeters capable of determining the effective thermal conductivity (as defined in ASTM C1774) of insulation material/systems at a cold boundary temperature of 20 K. As such, the GHC was developed based on existing equipment at the CTL, namely a cryocooler and small vacuum chamber.
At a high level, the GHC has a nested cylindrical geometry, with an internal heater assembly situated in the middle of, and axially aligned to, a larger cold cup. The gap created between the heater and cup is filled with the test specimen. The cup is thermally coupled to the cryocooler, and its temperature—the cold boundary temperature (CBT)—is controlled using a custom trim heater assembly. The internal heater assembly consists of three independent heaters: a single, centrally located test heater with two guard heaters, one on either end. During testing, all three are controlled to the same temperature—the warm boundary temperature (WBT)—which eliminates axial heat transfer through the assembly and results in the heat generated by the test heater moving purely radially through the specimen to the cold cup. In a steady state and with a constant WBT and CBT, this heat should also be constant and is measurable using the voltage and amperage fed to the test heater. With the heat transfer known, along with the geometry of the sample and boundary temperatures, the effective thermal conductivity of the insulation can be obtained via the Fourier heat conduction equation.
The entire GHC assembly is placed into the existing vacuum chamber and insulated with Multi-Layer Insulation (MLI) to sufficiently reduce the environmental heat load. A gas feed tube links the interior of the cold cup to an external regulated supply through the vacuum chamber for the testing of different background gases over the full vacuum pressure range (i.e., from high vacuum to no vacuum).
The GHC was commissioned in 2024 and validated using existing standard data for 3M K1-type glass bubbles obtained from liquid nitrogen boiloff calorimetry. The instrument successfully measured steady-state heat loads from 4 W to 0.9 mW and is currently being used to explore insulation materials for mega-scale liquid hydrogen tank designs required to support future shipping terminals.


