1. Introduction
Most cryocoolers below 80 K use helium as a working fluid [
1]. However, helium is not a renewable substance. It is created via the alpha-decay of radioactive minerals within the Earth’s crust that slowly accumulate in underground storage reservoirs such as natural gas deposits. Helium has sufficient buoyancy to escape Earth’s gravitational well if released into the atmosphere. Major efforts are underway to conserve or replace helium in practical applications with other fluids or alternative technologies [
2]. Hydrogen has potential as a working fluid in some cryocoolers [
3]. Moreover, open refrigeration cycles involving hydrogen may also improve the efficiency of hydrogen cooling and liquefaction systems, the importance of which is rapidly growing as liquid hydrogen is considered as a promising clean fuel for the future [
4]. Hydrogen can be produced via electrolysis using renewable energy sources (e.g., solar, wind, and waves) to generate electricity to split water into hydrogen and oxygen. When hydrogen reacts with oxygen, e.g., in a fuel cell, useful energy is released, while harmless water vapor is formed as a product. To make hydrogen attractive as an energy-dense fuel, it needs to be stored in the liquid form, which requires cryogenic systems [
5], as the normal hydrogen boiling point is close to 20 K.
Little information is available on how hydrogen-based cryocoolers may perform other than a few studies showing promise for hydrogen [
4,
6]. In the present work, a ubiquitous thermoacoustic-type cooling process involving hydrogen is analyzed [
7]. The properties of hydrogen [
8], especially closer to the saturated states, warrant a study on whether the computationally efficient low-amplitude thermoacoustic theory can still be applied for the parametric modeling of cryogenic hydrogen phenomena or if more complete but numerically costly computational fluid dynamics (CFD) is required for higher fidelity estimations. Thermoacoustic modeling usually involves an assumption of an ideal gas for the working fluid with low acoustic amplitudes [
9,
10], whereas CFD can utilize more complex fluid properties stored in a tabular form and simulate processes with larger amplitudes in more complicated systems. The CFD modeling of thermoacoustic systems, albeit with more common fluids, has been conducted in the past and proved useful for elucidating details of thermofluid phenomena that cannot be captured by simplified theories [
11,
12]. A comprehensive recent review on thermoacoustic CFD can be found in [
13], whereas a review on multi-physics coupling in thermoacoustic devices is given in [
14].
The primary focus of the current study is the effect of real fluid properties on thermoacoustic heat transport in a simplified canonical configuration, namely a narrow channel with a linear variation in the mean temperature. At the appropriate phasing between acoustic pressure and velocity amplitudes and other suitable system parameters, the supplied acoustic power can be used to transport heat from cold to warm parts of the system. Numerical results for thermoacoustic heat flux obtained using CFD are compared in this paper with predictions of the analytical theory in a range of cryogenic temperatures and acoustic phasing and amplitudes to provide initial guidance on conditions where CFD simulations are needed. A thermoacoustic prime mover operating at higher temperatures is also simulated, as it can serve as an acoustic power source for a cryocooler. The combination of these system models will expedite future cryocooler development efforts.
2. Computational Setup
Thermoacoustic heat transport from low- to high-temperature regions can occur in porous materials, called stacks in standing-wave systems and regenerators in traveling-wave setups. These elements are placed between heat exchangers (hot and cold) inside resonators with a sound source and an acoustic network (
Figure 1). There is a large variety of thermoacoustic cryocoolers on the market with different degrees of complexity. In the present study, however, only a small and simplified portion of the entire system was analyzed to obtain basic information for thermoacoustic heat transport when hydrogen is used as a working fluid.
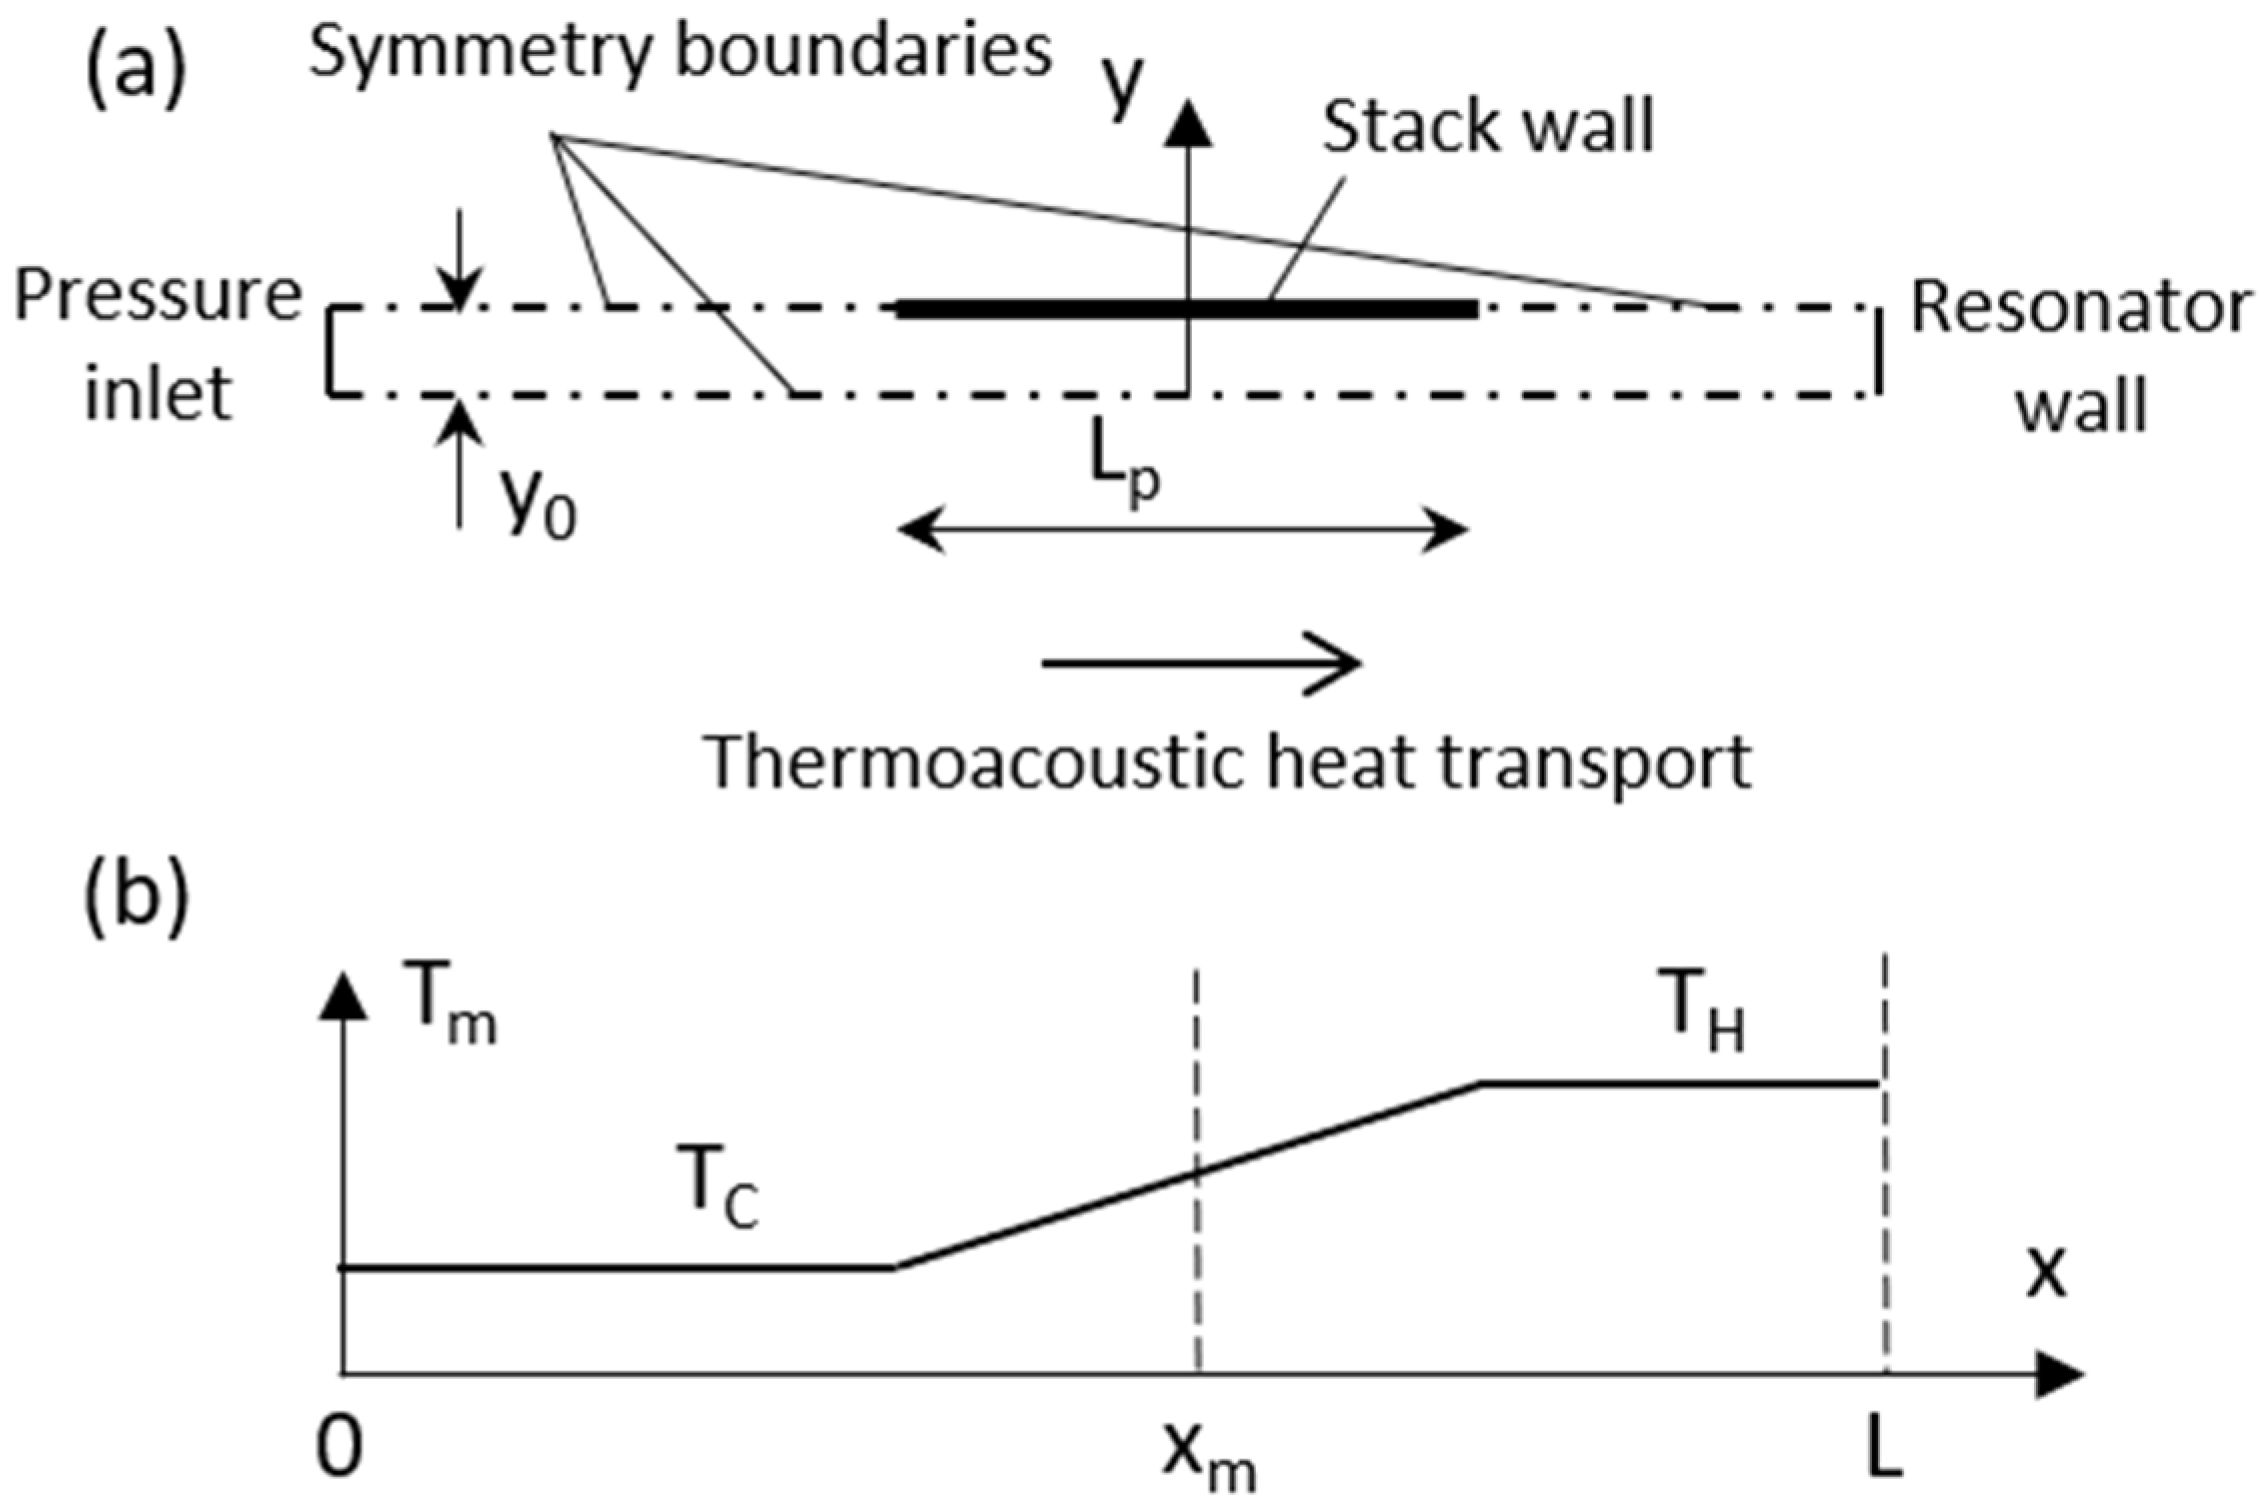
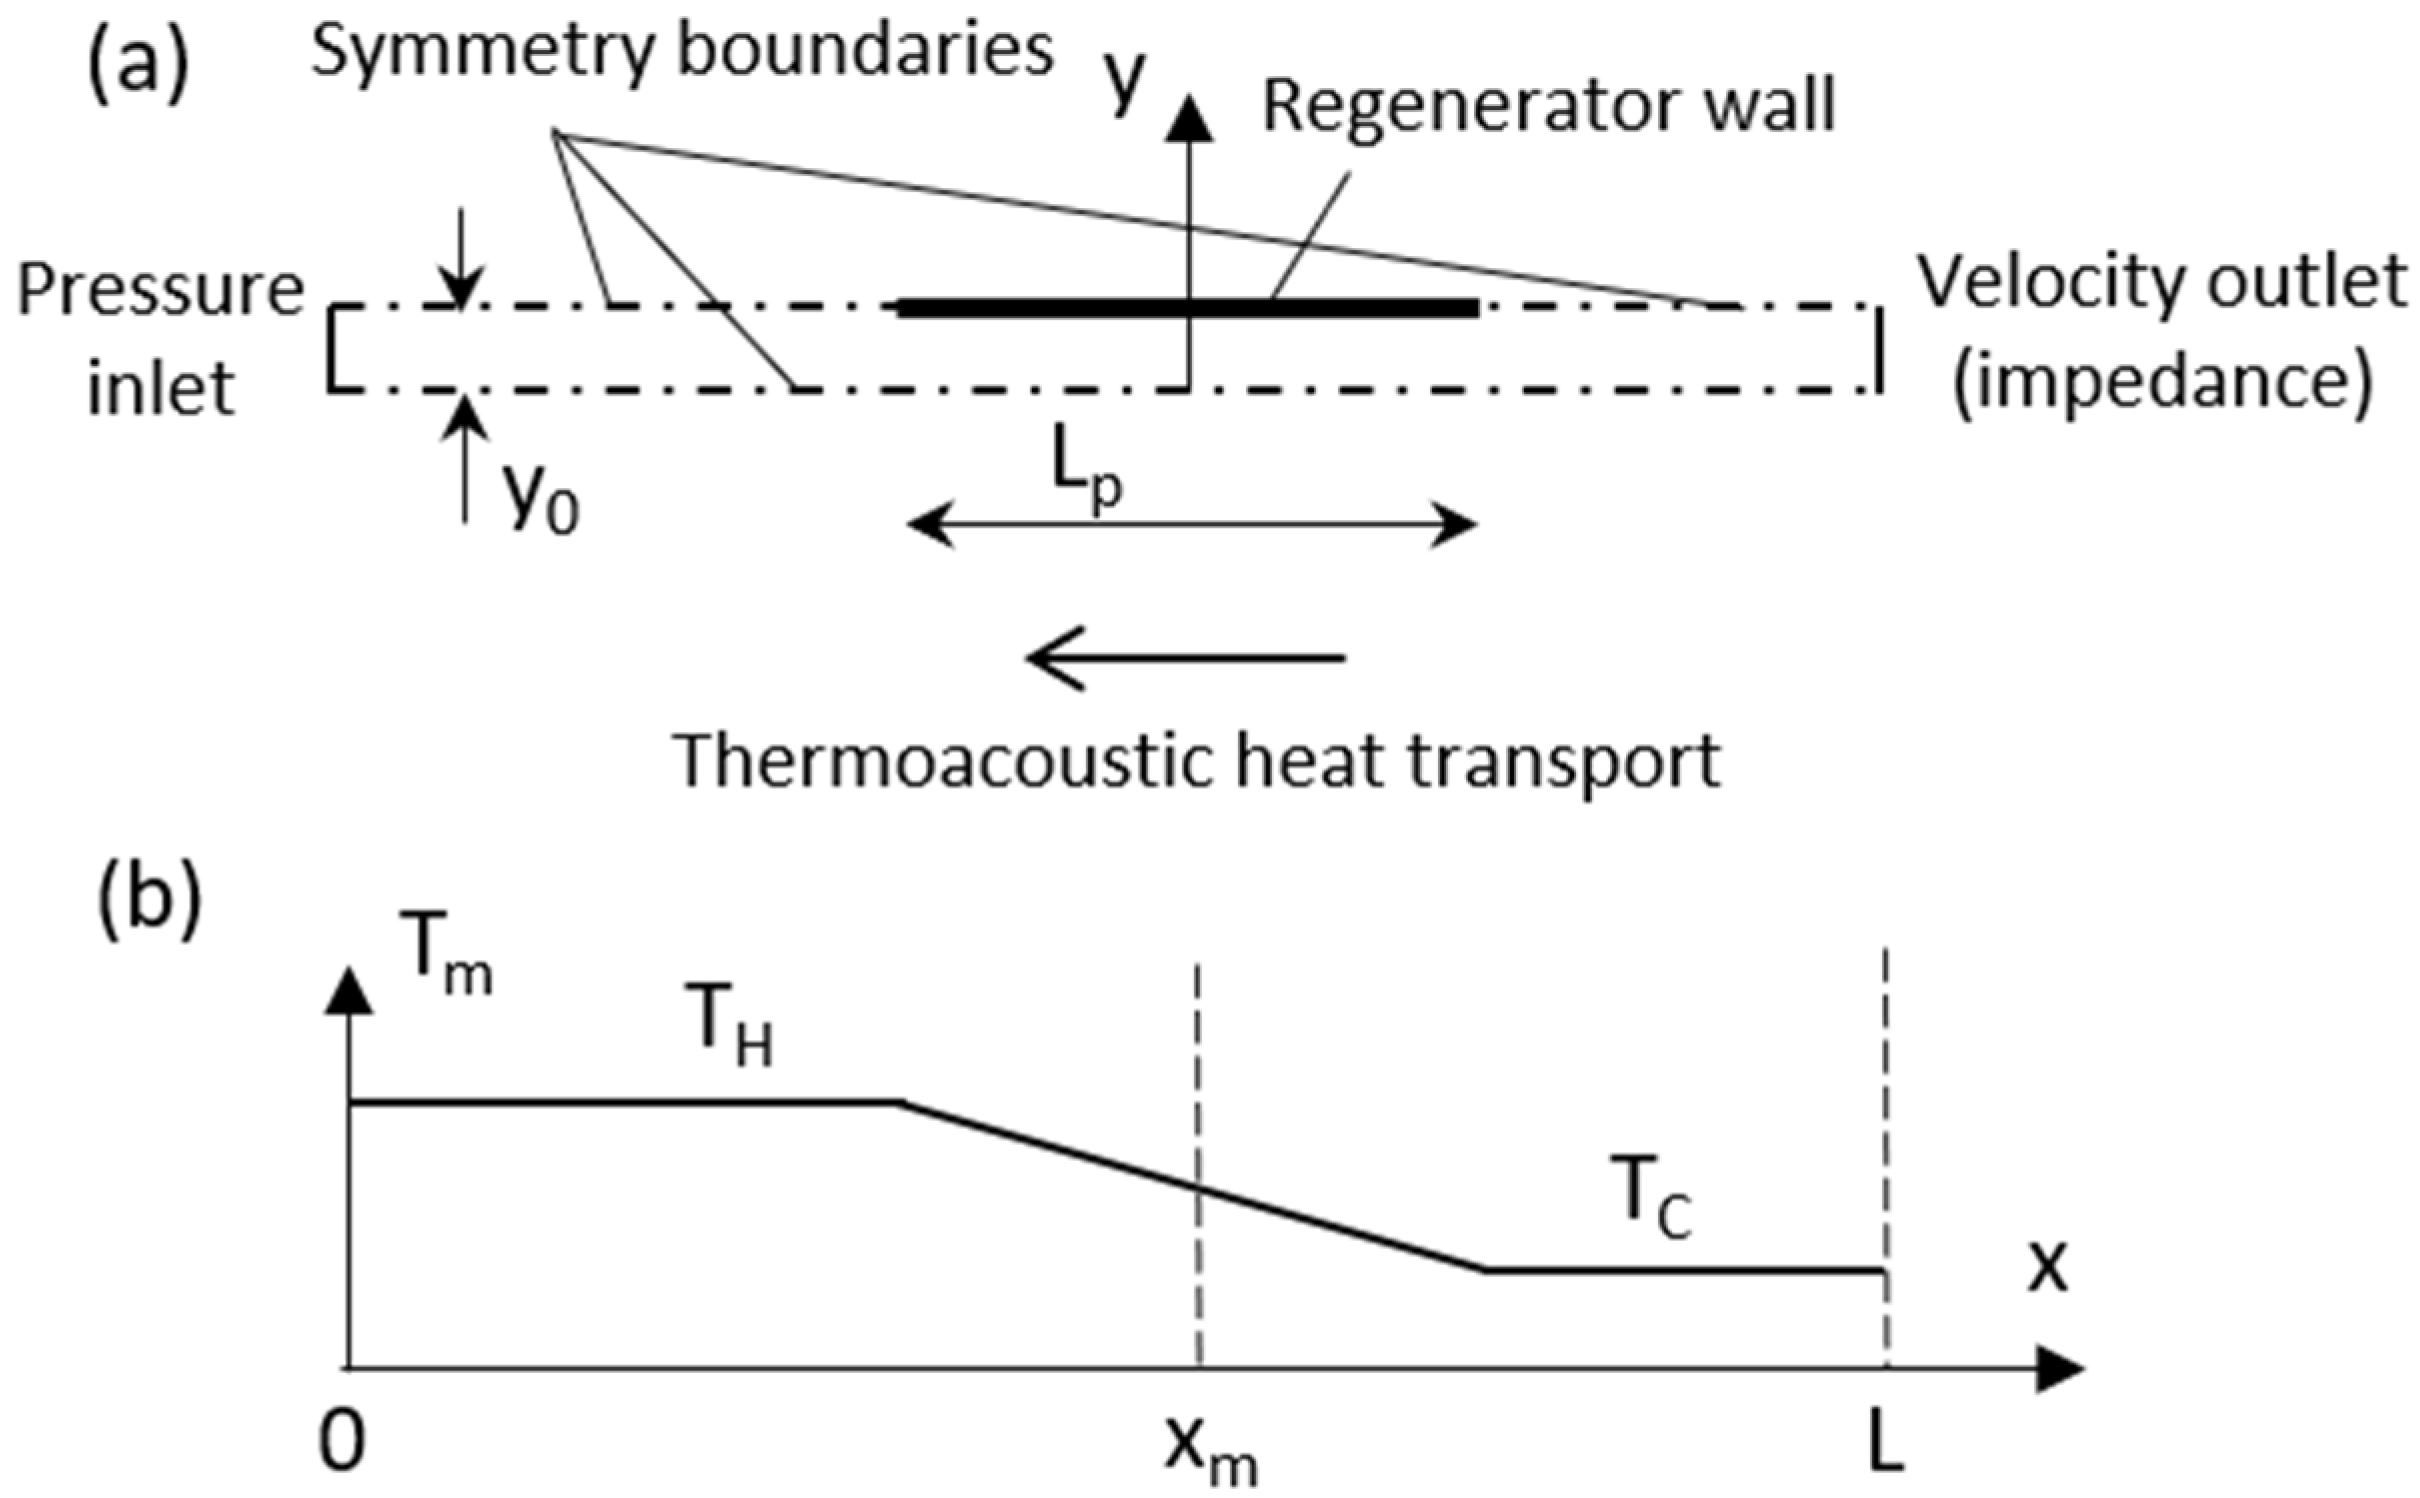
The two-dimensional numerical domain in the current study represents half of a stack/regenerator channel and a part portion of the surrounding space in the standing- and traveling-wave variants shown in
Figure 2a and Figure
3a, respectively. The domain length is
, the domain width is
, and the plate length is
. A portion of the domain boundary is treated as a stack/regenerator no-slip wall with a linear temperature gradient (illustrated in
Figure 2b and
Figure 3b). The cold and hot temperatures are designated as
and
, respectively. The other longitudinal borders in the numerical domain are treated as symmetry boundaries in CFD. The left boundary represents an inlet where sinusoidal pressure oscillations are superimposed on the mean pressure. In the cryocooler mode, the acoustic power enters the domain through this boundary. However, when a sufficient temperature gradient is imposed along the plate (usually much larger than for a cooler case), acoustic power can be produced inside this domain and exit through the left boundary. Such a regime corresponds to the prime mover mode.
The right (outlet) boundary is considered either as a solid wall for the standing-wave system (
Figure 2a) or as an impedance boundary relating fluctuations of acoustic pressure and velocity in the traveling-wave case (
Figure 3a). No three-dimensional features, heat exchangers, or thermal processes inside solid walls are considered. The main metrics for characterizing thermoacoustic heat transport include the time-averaged longitudinal convective heat flux in the mid-plane of the channel (with the axial coordinate
in
Figure 2 and
Figure 3), as well as the acoustic power supplied at the inlet plane (
= 0) in the case of cryocoolers and going outward of the domain in the case of a prime mover. The variable parameters include (1) the cold and hot temperatures, which define the mean temperature distribution through the entire system, (2) the inlet pressure amplitude, and (3) the outlet acoustic impedance. These variable parameters are listed in
Table 1, and the fixed system parameters are given in
Table 2. One can note that the domain half-width
is much smaller than the domain length, as pore sizes in stacks, and especially in regenerators, are usually very small and their selection depends on the thermal penetration depth defined in the next section. The system dimensions in this study are assigned realistic values producing reasonably good system performance, but no optimization is attempted, as this requires a complete system consideration and specification of operational states.
3. Numerical Modeling Aspects
Computational fluid dynamics (CFD) modeling was accomplished in this study using Simcenter Star-CCM+ software, version 2022.1 [
15], which has been applied and validated for complex fluid flows [
16]. It employs the finite-volume solver with the first-order temporal and second-order spatial discretization and SIMPLE algorithm for pressure–velocity coupling. The governing fluid dynamics equations discretized in this software include the mass, momentum, and continuity equations [
17]:
where
,
, and
are the gas density, pressure, and flow velocity, respectively;
is the time;
,
, and
are the computational cell volume, its surface area, and surface-area normal vector, respectively;
is the unity tensor;
is the tensor of viscous stresses;
is the total energy per unit mass; and
is the vector of heat flux.
Due to the relatively low amplitudes and straight-channel geometry, the laminar flow model was employed. Properties for normal hydrogen were obtained using CoolProp, version 6.6.0 [
18] from a fundamental equation of state [
8] and tabulated as functions of pressure and temperature. These tables were imported into the CFD software and used for simulating thermoacoustic processes.
The numerical mesh was generated inside the computational domain using high-aspect ratio cells to properly resolve the channel cross-sections while selecting longer longitudinal cell dimensions to keep the overall cell counts economical. An example of the mesh portion near one end of the plate is given in
Figure 4. A finer mesh was produced in the upper part of the channel close to the solid wall, since that is where variations in flow properties are significant, whereas flow is more uniform in the bottom portion near the symmetry boundary.
Standard acoustic conditions were applied to model pressure and temperature fluctuations at the domain inlet (
Figure 2 and
Figure 3),
where indexes
,
, and
stand for the inlet, mean, and acoustic amplitude, respectively; y is the vertical coordinate across the channel (
Figure 2 and
Figure 3);
is the angular frequency of the imposed acoustic oscillations;
is the temperature; and
is the specific heat at constant pressure. It should be noted that the acoustic pressure practically does not vary in any vertical channel section, but the acoustic velocity varies significantly in narrow channels with solid boundaries due to the wall no-slip condition. At the domain outlet (
Figure 2) in the standing-wave setups, the adiabatic wall is considered:
In the traveling-wave case, the acoustic impedance condition is imposed at the outlet:
where
is the pressure fluctuation and
is the normalized acoustic impedance. The outlet impedance implementation in the CFD software involves the usage of a velocity outlet. The section-averaged pressure is computed at this boundary, and then the difference between this pressure and the mean pressure is substituted into Equation (7) together with the known density and speed of sound, as well as a specified impedance value, to produce a velocity that is assigned at this outlet.
The initial conditions in CFD include the stationary gas, with the mean temperatures illustrated in
Figure 2 and
Figure 3, which involved constant-temperature sections outside the plate region, and the linear temperature variations in the channel between plates. The zones under the plates in
Figure 2 and
Figure 3 represent a half-channel width between two plates. It should be noted that the cold end of the standing-wave stack appears on the side of the input acoustic power for a stack located near the solid end, whereas the cold zone in the traveling-wave system is at the other end of the regenerator [
10]. This is why the temperature profiles in
Figure 2 and
Figure 3 have different forms for the standing- and traveling-wave systems. In the case of the standing-wave prime mover, also considered in this study, the configuration is similar to the standing-wave cryocooler but with a much greater temperature difference between hot and cold spaces.
After several acoustic cycles in a CFD simulation, the system reaches a limit-cycle state with flow variables exhibiting repeated oscillations. In such a regime, the cycle- and section-averaged quantities for the inlet and mid-plane acoustic power flux
and the convective enthalpy flux
in the mid-plane of the channel portion under the plate (section with y-axis shown in
Figure 2 and
Figure 3) are evaluated as follows:
where subscript
emphasizes that the quantities are computed in CFD simulation,
stands for the mid-plane,
is the acoustic period,
is an arbitrary time after the limit-cycle regime is reached,
is the channel thickness, and
is the gas specific enthalpy. The averaged cycle- and section-averaged thermoacoustic heat transport through the mid-plane was then evaluated as follows:
This thermoacoustic heat transfer mechanism pumps heat from the colder part of the plate to the hotter portion in both the standing- and traveling-wave cryocooler setups. In the case of a standing-wave prime mover, the acoustic inlet power and time-averaged heat flux will change sign, so these quantities are specified in the prime-mover situation as and and calculated using the same expressions as the right-hand sides of Equations (9) and (11) with negative values.
In the analytical low-amplitude thermoacoustic theory [
10], which utilizes the ideal-gas assumption, the channel section-averaged pressure fluctuations and the volumetric velocity fluctuations with frequency
are expressed as follows:
where
is the coordinate along the channel, and
and
are the complex amplitudes of the acoustic pressure and volumetric velocity. The spatial variations of these amplitudes can be determined using acoustic forms of the momentum and continuity equations [
10]:
where most symbols are similar to those shown above for the CFD equations, while
is the ratio of specific heats, and
is the Prandtl number. Thermoacoustic functions
and
are zeros in the domain portion without solid walls and, in the channel with a plate boundary, are determined via the following expressions:
where
and
are the thermal and viscous penetration depths:
where
and
are the gas thermal conductivity and viscosity, respectively.
The thermoacoustic Equations (15) and (16) can be integrated along the channel, using the same boundary conditions as in CFD. After that, the time-averaged input acoustic power flux can be assessed as follows:
where
is the cross-sectional area. The section- and time-averaged thermoacoustic heat flux through the channel mid-plane was determined with the solution given by Swift [
10]:
where all properties and variables are evaluated at the mid-plane. The subscript
is used in Equations (20) and (21) to emphasize that these quantities are found using the low-amplitude thermoacoustic theory based on the ideal gas model. The described thermoacoustic theory proved to produce reasonable agreements with experimental results in thermoacoustic systems at low acoustic amplitudes [
10].
4. Results and Discussion
A grid-dependency CFD study was conducted for both standing- and traveling-wave cooling setups to determine an adequate mesh resolution at the mean pressure of 5 bar, the inlet pressure amplitude of
, and the hot and cold temperatures of 80 K and 65 K. Three numerical grids of different mesh densities were generated. The mid-plane thermoacoustic heat transport fluxes computed in the limit-cycle regimes are shown in
Table 1, demonstrating oscillatory convergence with mesh refinement.
The associated numerical grid uncertainty
was estimated using the Richardson extrapolation
[
17] with the factor of safety
[
19] equation:
where
and
are the solution differences for fine-and-medium and medium-and-coarse grids, respectively,
is the observed order of accuracy, and
is the ratio of cell dimensions between different grids. The calculated grid uncertainty is also listed in
Table 3 and is considered adequate for the present study.
The solution sensitivity to a numerical time step
was also explored in the same operational conditions. The results obtained on a fine mesh with different
demonstrate monotonic convergence (
Table 4). The time step of 2 × 10
−6 was determined to provide adequate results. This value was adopted for all other CFD simulations in this investigation.
For CFD validation, the CFD results were compared with the analytical solutions obtained with the low-amplitude thermoacoustic theory described in the previous section, although perfect agreement should not be expected due to small deviations in hydrogen properties from the ideal gas model even at higher but still cryogenic temperatures and finite-amplitude acoustic effects. Theoretical values for the mid-plane thermoacoustic heat fluxes are also included in
Table 3, showing several percentage deviations from the CFD results.
Besides global characteristics, it is informative to compare the distributions of the acoustic velocity and temperature fluctuations. These functions were evaluated at the channel mid-plane from the CFD results at the moment of peak pressure at the system inlets. Analytical results are also available for complex amplitudes of these quantitates in the considered geometric setup from the following expressions [
10]:
where another pair of thermoacoustic functions is defined as follows:
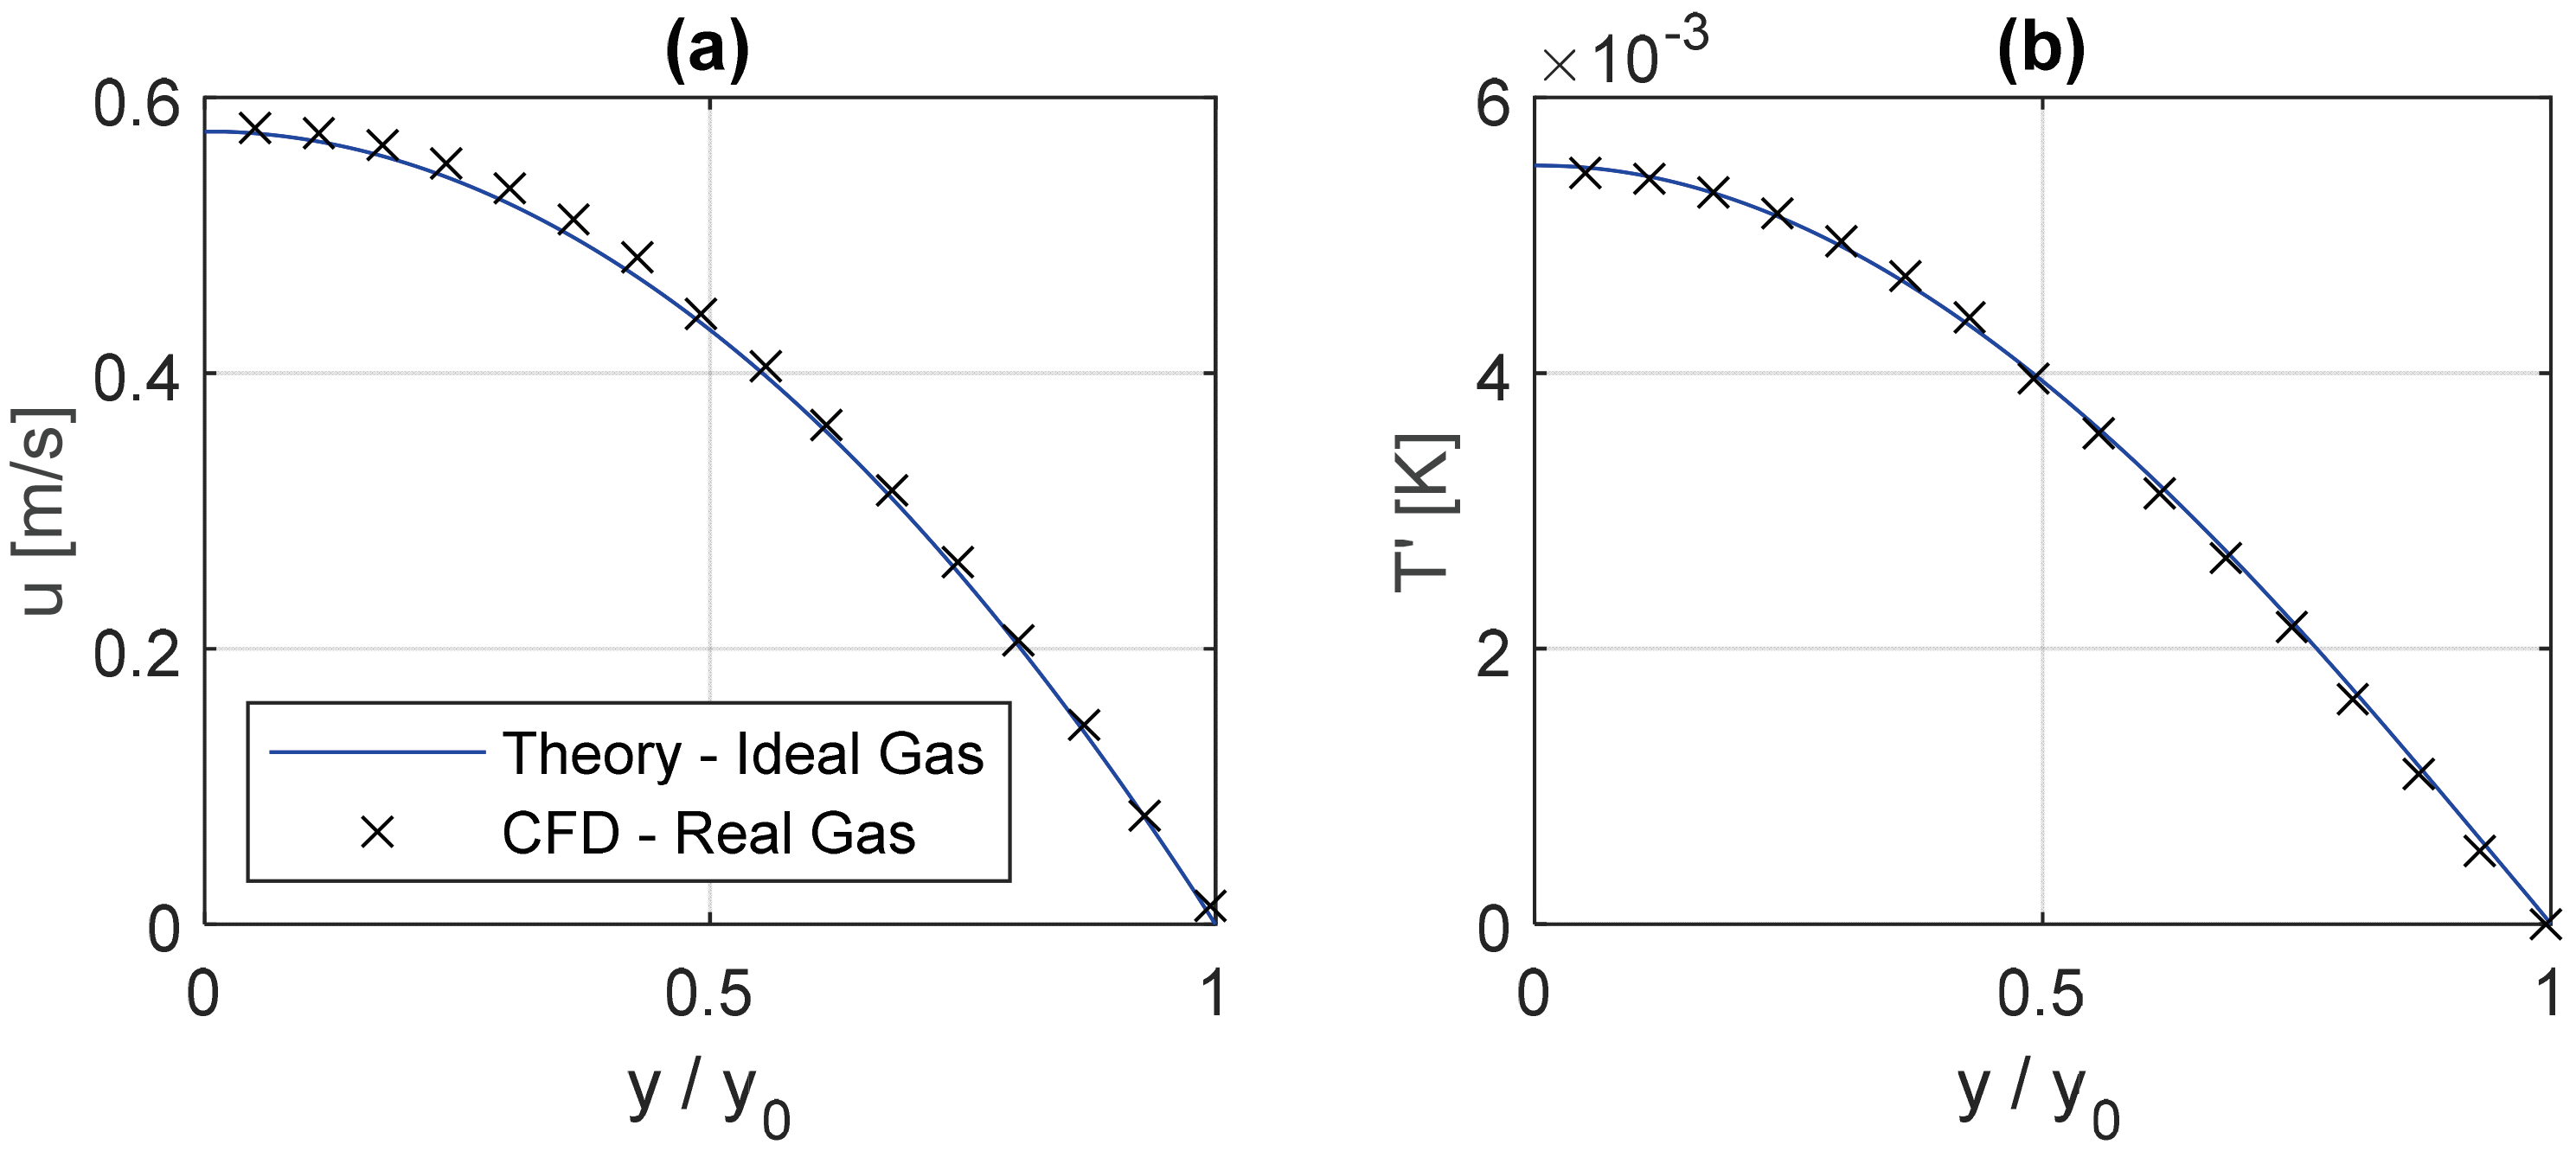
Theoretical solutions for the velocity and temperature fluctuations at the channel mid-plane inside cryocoolers were evaluated at the moment of the peak pressure at the inlet using previously obtained solutions for the spatial distributions of the acoustic pressure and velocity amplitudes in the considered channel. These analytical results were compared with the CFD data in
Figure 5 and
Figure 6. Very good correspondence was observed for most functions, whereas a relatively small deviation was noticeable for the temperature fluctuations in the standing-wave situation. Again, due to imperfect-gas and finite-amplitude effects in CFD, some deviation is expected, and the obtained agreement was deemed sufficient.
A parametric investigation using a set of CFD simulations with the conditions listed previously in
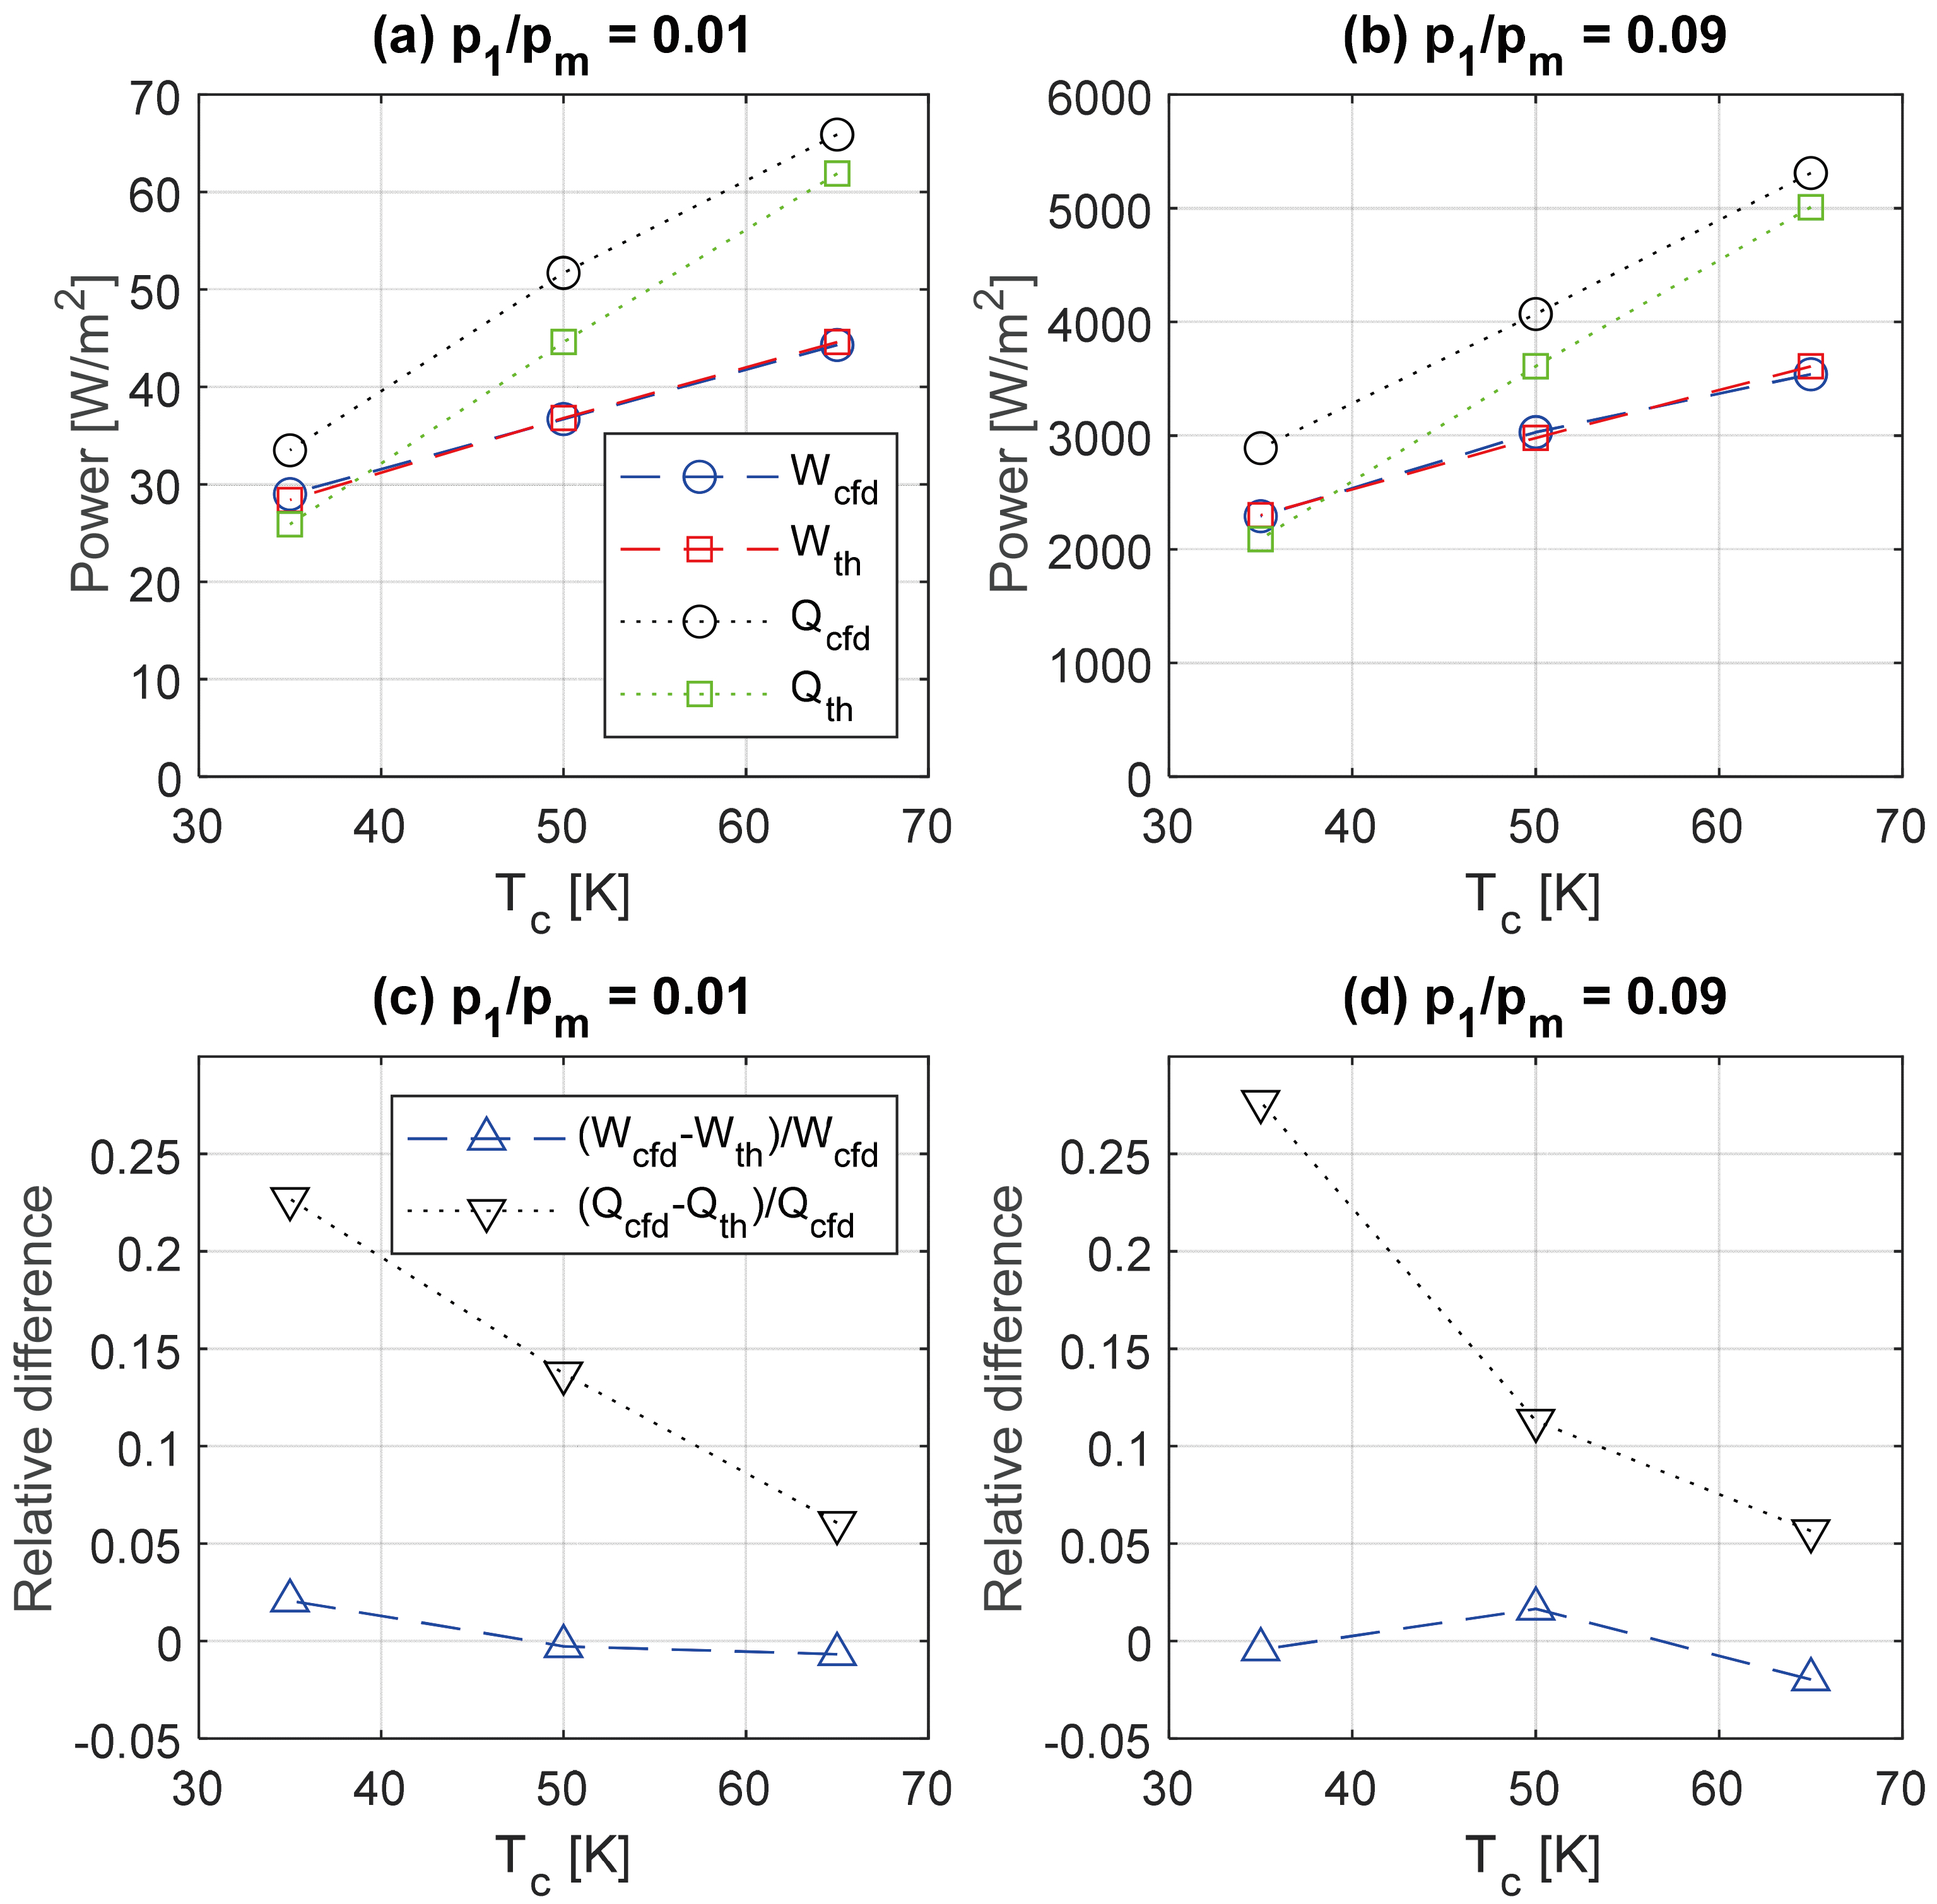
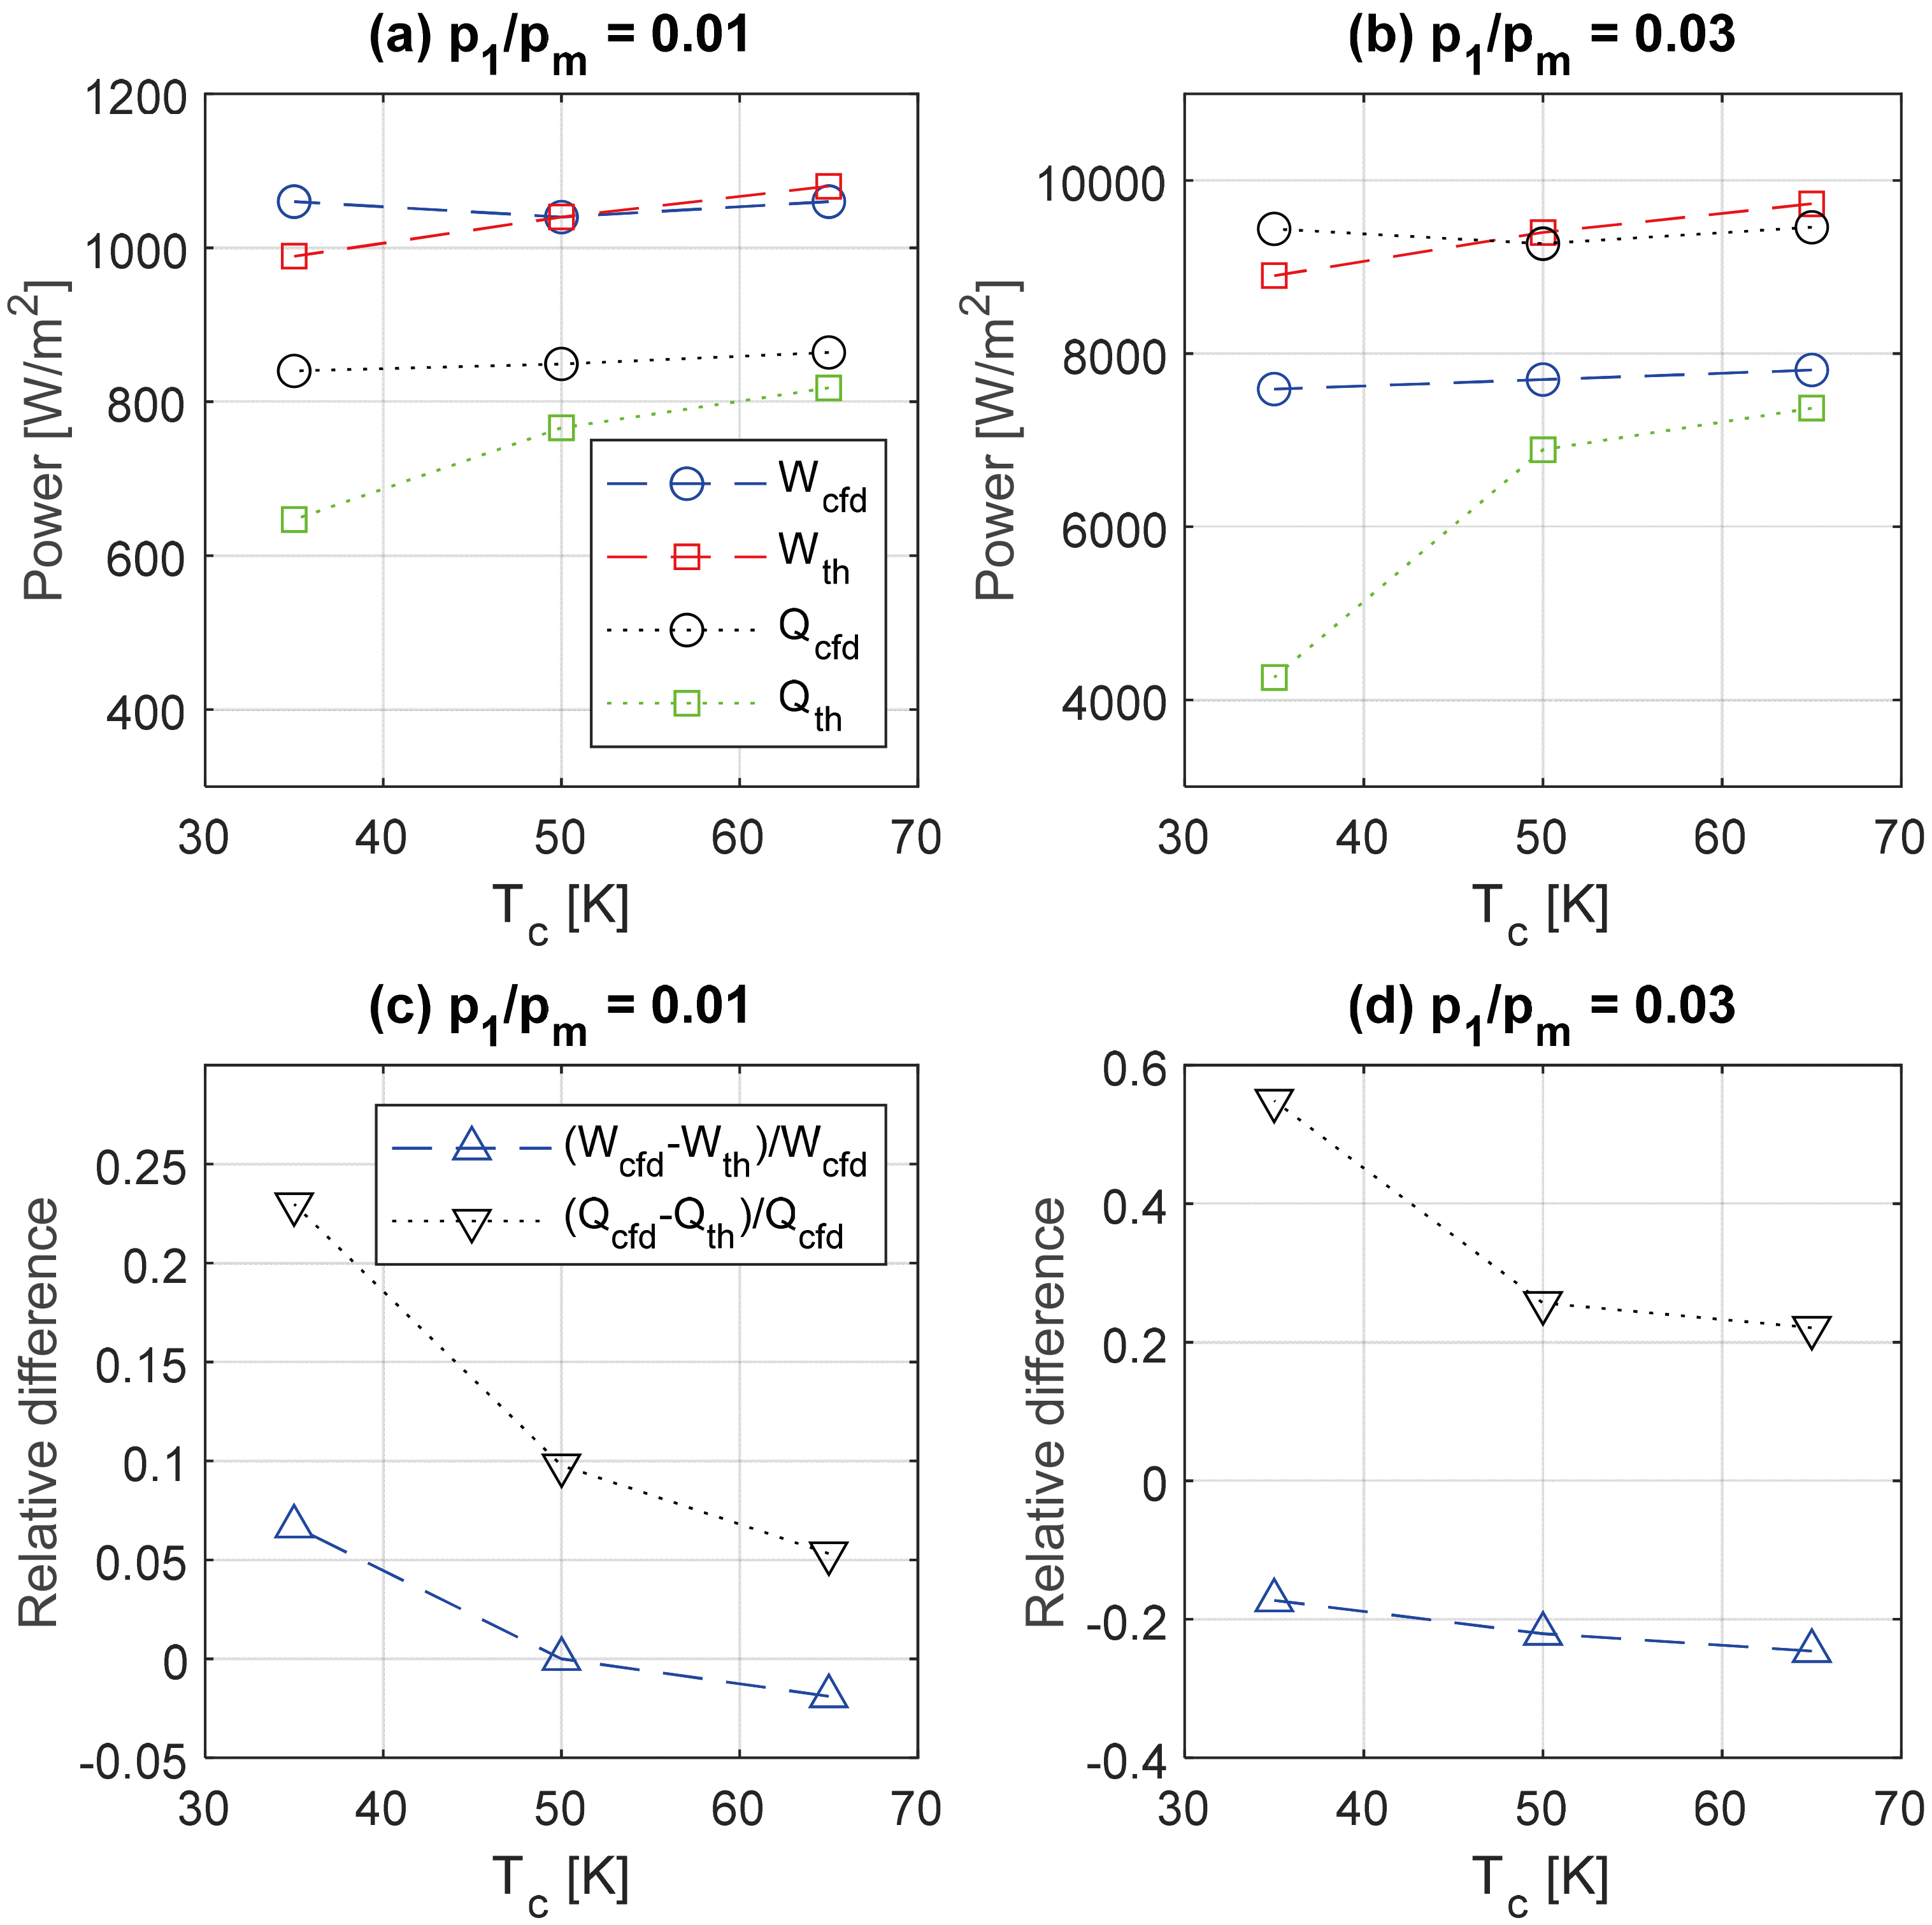
Table 1 was conducted with the aim of determining the effect of fluid proximity to saturated states and sound amplitudes. The hot-to-cold temperature difference was fixed (15 K), but the mean temperature was allowed to vary. Two acoustic amplitudes and phasing conditions were employed. The results for the input acoustic power and thermoacoustic heat transport fluxes are shown in
Figure 7 and
Figure 8 for the standing- and traveling-wave cooling setups, respectively.
In the standing-wave setup (
Figure 7), both the work input and heat flux decrease with lowering operational temperatures (
Figure 7a,b), and the system generally becomes less efficient, as expected. The acoustic power inputs predicted by the idealized theory and CFD are practically the same in the entire temperature range, whereas the difference between thermoacoustic heat flux found by the two approaches is noticeably different, and the difference increases at lower temperatures. The heat transport obtained with CFD is about 5% higher than analytical predictions at the highest temperature, but the differences approach 25% at the lowest temperatures (
Figure 7c,d). The CFD heat flux is greater, meaning that the system will lift more heat than predicted with the ideal-gas theory at the same power input. The magnitudes of the work input and heat transported scale are approximate as the square of the pressure amplitude, whereas the sensitivity of the relative difference between two computational approaches to the considered amplitudes is minimal.
Some of these observations also hold for the traveling-wave system (
Figure 8). However, one obvious difference is much larger power and heat transfer values at the same pressure amplitudes relative to the standing-wave configuration (
Figure 8a,b), since acoustic power increases with a phase shift between the acoustic pressure and velocity. Power and heat magnitudes decrease less with mean temperature in the real-gas CFD simulations. The traveling-wave setup exhibited greater discrepancies between the two methods. The real-system performance is again higher than suggested by the idealized theory, in that the CFD-computed heat transfer is greater by almost 60% while the acoustic power is smaller by about 20% at the lower operating temperatures near 40 K (
Figure 8c,d).
An additional set of simulations with the same geometry was conducted with the prime mover variant in the standing-wave configuration. To achieve acoustic power production, the hot temperature must be much greater than the cold temperature in comparison with the cryocooler setup [
20]. Such an engine can drive a thermoacoustic refrigerator. It should be noted that the impedance at the open boundary is not assigned in advance but is a result of calculations. For different temperature gradients along the plate, this impedance is different, meaning that the properties of the acoustic system outside this boundary also vary.
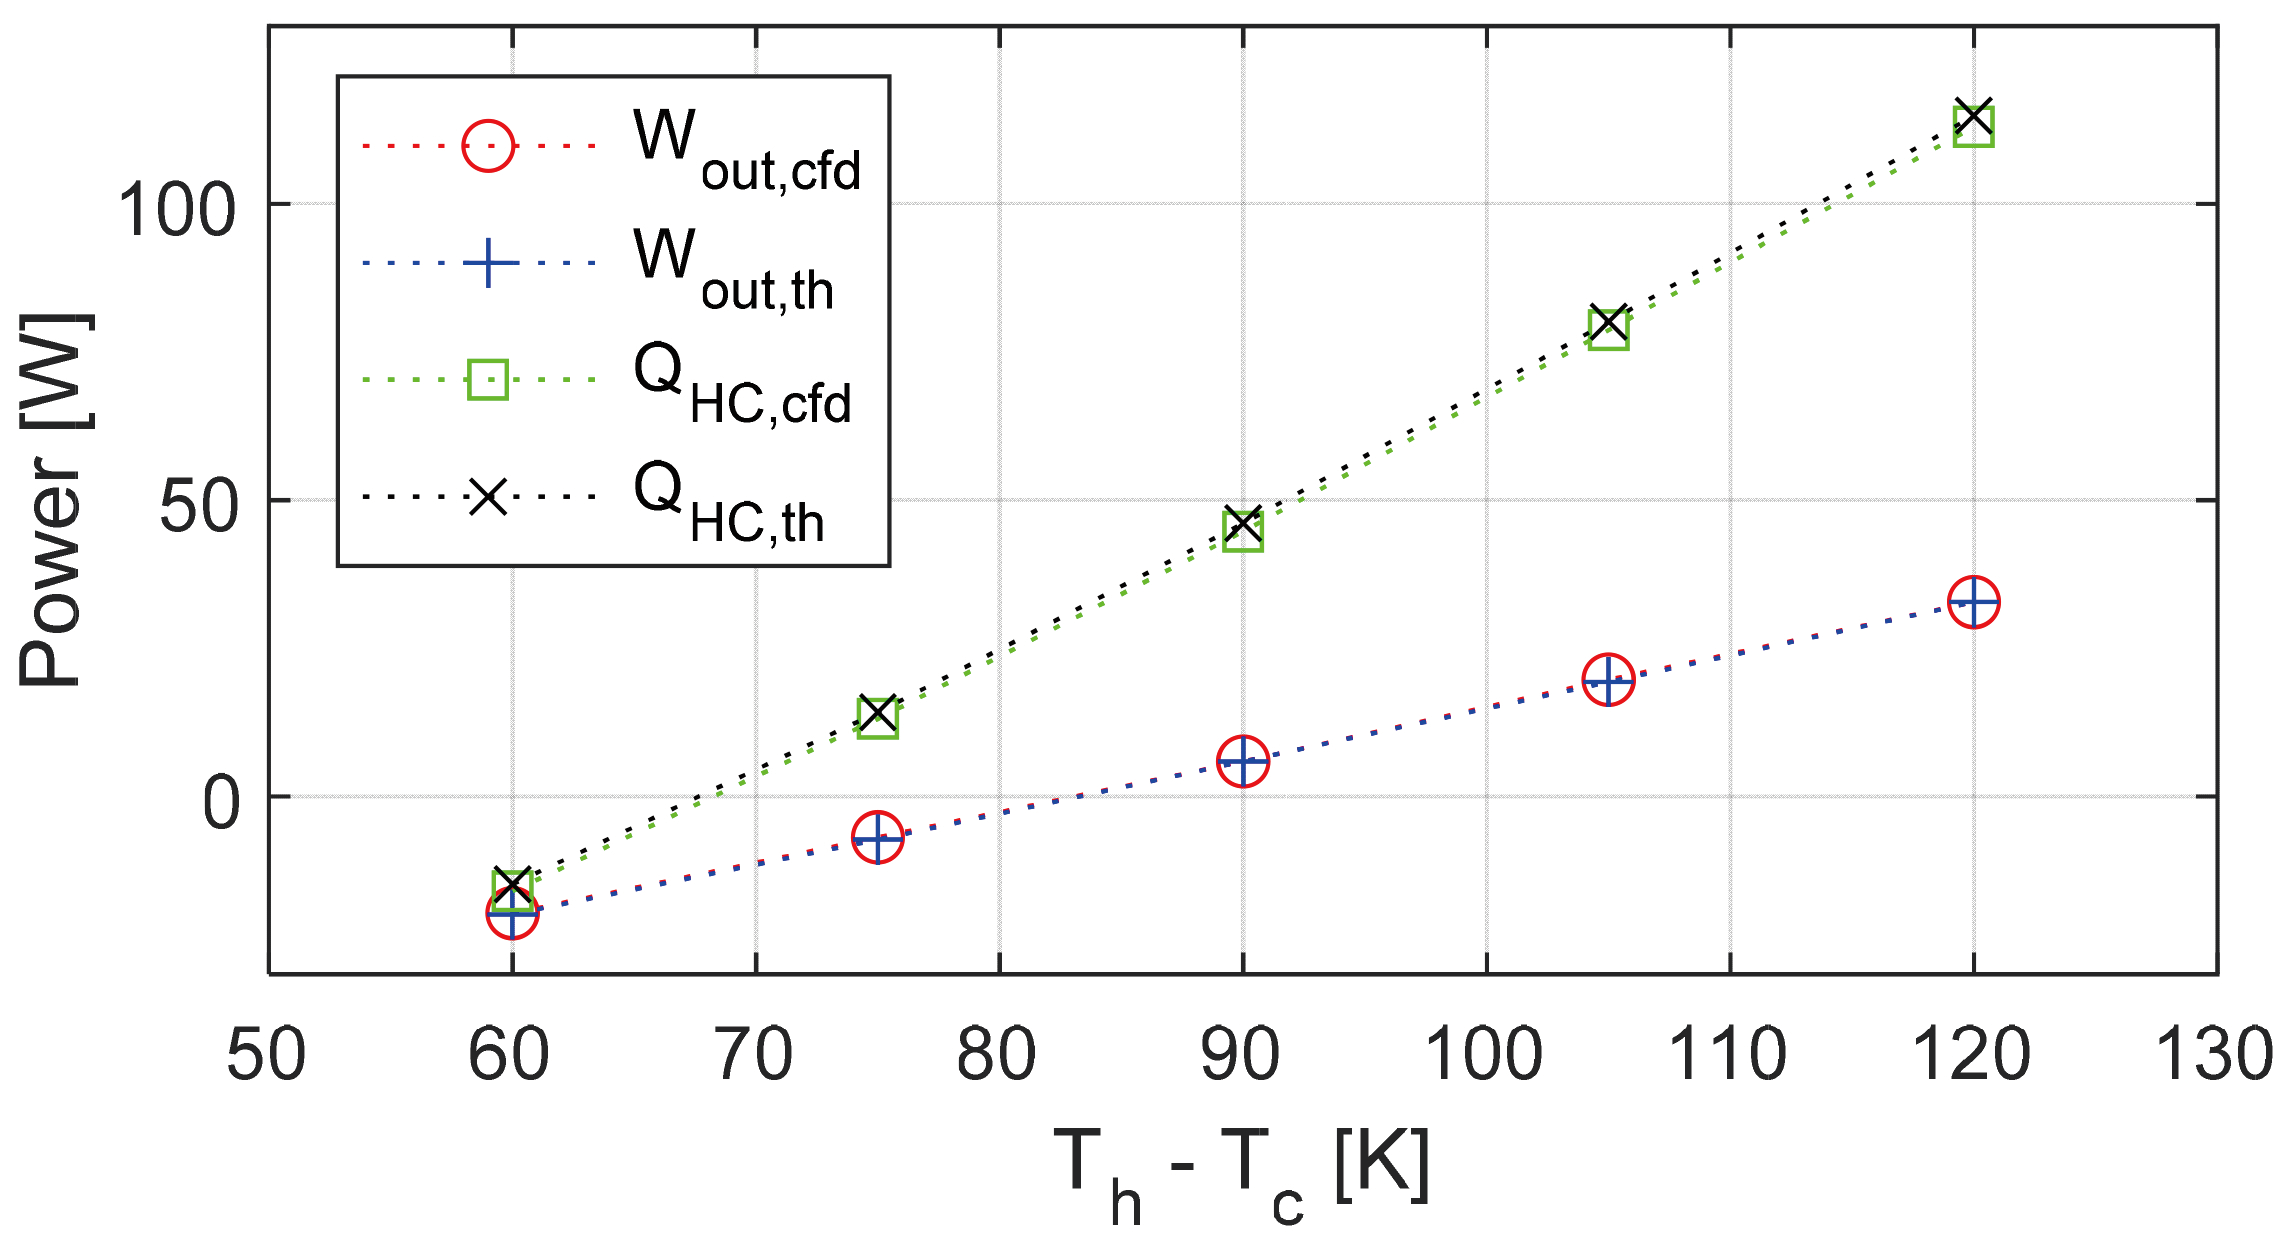
In the prime mover study, the cold temperature was fixed at 80 K (conveniently close to the normal liquid nitrogen boiling point), whereas the hot temperature was gradually increased from 140 K to 200 K (which may correspond to the upper stages of another cooling system). The acoustic power
leaving through the inlet plane from the considered domain and thermoacoustic heat flux
from the hot to cold halves in the stack region were obtained from CFD simulations and plotted in
Figure 9.
One can notice that at the temperature difference of 60 K, the system still performs as a refrigerator, as the output acoustic power is negative (meaning that there is an acoustic power flow into the system from an external source), while heat is also negative (implying heat pumping from the cold to the hot end of the stack). With an increase in the temperature difference to 75 K, the acoustic power remains negative (so external power is required). However, the heat now flows from hot to cold, which corresponds to a dissipative system that is neither an engine nor a refrigerator. A further increase in the temperature difference to 90 K leads to the positive production of acoustic power that also requires substantial heat input. From
Figure 9, the critical temperature difference when the system becomes self-excited can be estimated to occur at about 83 K. With the continuing increase in the temperature differential, more acoustic power is generated as expected. By comparing the CFD predictions with the theoretical results, also shown in
Figure 9, it can be concluded that the analytical theory is fully employable in this range, confirming the adequacy of the ideal-gas assumption for hydrogen at these relatively high temperatures.

