1. Introduction
In recent decades, the global demand for energy and the associated emissions of greenhouse gases have significantly risen, correlating with an improvement in population prosperity. To mitigate climate change and enhance its energy security, the European Union is actively encouraging the adoption of low-carbon technologies. For this purpose, different legislations have been emanated, among which the REPowerEU Plan [
1], the Fitfor55 package [
2], and the recent revision of the EPBD Directive [
3] surpassing the targets set by the 2018 European Directive 2018/2001 [
4].
In this regard, heat pumps (HPs) are an effective solution, as they significantly reduce the non-renewable primary energy required for buildings’ space conditioning compared to traditional fossil fuel boilers [
5,
6,
7]. Indeed, heat pumps can harness considerable amounts of renewable energy from aerothermal, geothermal, and hydrothermal sources.
1.1. Conventional Heat Pumps
Air-source heat pumps (ASHPs) have recently dominated the European market [
4] due to their widespread availability and relatively low initial costs. Nonetheless, the efficiency of air-source heat pumps is highly dependent on external air temperature, with performance diminishing during winter cold and summer heat, which coincides with peak building thermal demands [
8]. Additionally, defrost cycles, necessary during heating operations in low-temperature and high-humidity conditions, present a challenge [
9,
10]. The frost accumulating on the external heat exchanger of the heat pump can be cleared through various methods, such as using electric resistances to melt the ice, applying hot water sprays on the evaporator, redirecting hot refrigerant from the compressor discharge port, or reversing the thermodynamic cycle (which is the most common technique). Conversely, since the reversing defrost cycle method reduces the hot water temperature delivered to the building, a considerable lowering of indoor thermal comfort can typically occur [
11].
Ground-coupled heat pumps (GCHPs), which use the ground as the external source, generally perform better than air-source units due to the greater stability of the ground temperature [
12] and the absence of defrosting cycles. However, the investment cost of a GCHP is significantly higher than that of an ASHP, primarily due to the high installation costs of the borehole heat exchanger (BHE) field [
13]. Additionally, in highly unbalanced building loads or undersized borehole fields, the ground temperature may progressively deteriorate, resulting in reduced performance of the coupled heat pump.
1.2. Innovative Dual-Source Heat Pumps
In this context, prototypes of dual-source heat pumps (DSHPs), which utilize both air and ground as reservoirs, have been developed. These systems can be equipped with a dual external heat exchanger that allows for the use of the energy source (air or ground) that offers the best performance at any given time, while also reducing the initial investment costs by decreasing the required length of the BHE field [
14,
15]. Recent studies have focused on evaluating the performance of heat pump systems with dual air/ground cold reservoirs, highlighting the economic and environmental benefits of this approach [
14,
15,
16,
17,
18]. In particular, Corberán et al. [
15] demonstrated through TRNSYS simulations that a DSHP system can achieve efficiency comparable to that of GCHP systems, but with only half the borefield size needed for a conventional geothermal heat pump. This finding is corroborated by Grossi et al. [
17], who, through dynamic simulations over a 15-year operational period, showed that it is possible to reduce the BHE field size by 30–50%, with greater stability in performance indicators over the long term, especially under highly unbalanced loads. From an environmental perspective, Marinelli et al. [
18] found that over 50% of the environmental impact of an HP, considering its entire life cycle (production, installation, use, maintenance, and disposal), is attributable to the operational phase. As a result, the environmental impact of an ASHP is higher than that of a GCHP or DSHP due to its lower annual efficiency, which leads to higher electricity consumption. On the other hand, when considering the entire life cycle, the DSHP has a lower impact than the GCHP due to the shorter borehole field, resulting in fewer emissions associated with drilling. However, the literature lacks experimental tests directly comparing DSHP and ASHP units.
In parallel, proper borefield design is essential to ensure good system performance and limit the investment costs associated with the BHE installation [
19]. Although traditional design methods, such as the ASHRAE method [
20], offer quick procedures for calculating the nominal borehole length, these approaches often result in oversized borefields, leading to increased investment costs [
21]. To limit this circumstance, a deeper understanding of thermal response and ground properties can be gained by distributed temperature sensing (DTS) systems, which classically count on measurements of optical fibers installed within the BHEs or closely in the ground [
22,
23]. By investigating the ground thermal properties, the optimal borehole length can be evaluated according to the actual thermal diffusivity along the drilled hole; e.g., if the deepest depths are characterized by lower thermal performance, a shorter borehole can be preferred in favor of a larger number of heat exchangers. Additionally, a better understanding of the ground thermal response can be useful in managing the heat sources exploitation (i.e., optimized control logic development).
1.3. Comparison of the Heat Pumps Seasonal Performance
In order to obtain a reliable efficiency comparison between the DSHP and traditional HPs, the seasonal performance factor (
SPF) of the unit must be evaluated. Currently, for professional purposes, the
SPF evaluation is carried out in a very simplified way according to national and international standards [
24] based on steady-state conditions like the ‘bin method’, which considers the building load and heat pump performance as a function of the external source temperature and the cumulated frequency of this main variable for a direct extrapolation of the
SPF. In recent years, the development of powerful calculators has led to the use of numerical simulations for a better estimate of the
SPF: the so-called component test and system simulation (CTSS) [
25]. This method tests individual components of the HVAC system under standard steady-state conditions to obtain numerical models that are then integrated to simulate the performance of the entire HVAC system. However, analysis based on this method should always be complemented by experimental testing to confirm assumptions and validate subsystem models and dynamics timescales [
26,
27]. Otherwise, results may be subject to significant inaccuracies. In this regard, hardware-in-the-loop (HiL) testing can be highly beneficial for the identification of unexpected component behaviors that cannot be detected or anticipated through steady-state testing alone. The HiL method involves the experimental testing of a real device (e.g., the thermal generator), while the building thermal load and external climate data, specific to the location where the system will be installed, are simulated in the laboratory. In this way, the device is tested under working and load conditions representative of those encountered in real-world applications. Recently, Conti et al. [
27] proved the HiL approach benefits by estimating the energy consumption of an ASHP operating under real conditions over a four-month period. Their study revealed that standard methodologies, based on manufacturer data sheets, lead to significant deviations from actual performance due to their inability to account for transient phenomena, such as on–off cycles. For one of the tested modes, the authors recorded an efficiency drop of up to 35% compared to the standard method when the ASHP operated under nearly realistic conditions.
Currently, there are no unique or standardized HiL procedures for testing HPs; nonetheless, various methodologies have been developed by the scientific community [
28,
29,
30,
31] to assess the effective performance of whole systems over an entire conditioning season by testing their behavior over only a few typical days. Once these representative operating conditions are established, HiL tests can be conducted to characterize the efficiency of the system under these specific conditions. Moreover, these methods involve real-time communication between the test bench and a software/code of numerical simulation, a feature that is not always available in industrial settings.
1.4. Research Aim
In this work, a DSHP unit, which exploits renewable energy from the air and the ground, alternatively, was tested under different operating conditions while a DTS system was employed to analyze the ground thermal response during long-term tests monitoring the geothermal fluid temperature.
In the first phase, the dual-source unit was operated constantly (up to 8 h) at full load in geothermal heating mode to assess the thermal response of the ground. Additionally, several borefields of different lengths, from strongly undersized to larger oversized configurations, were coupled to the DSHP in order to understand the influence on the ground behavior and investigate the possible use of an undersized BHE field to meet the building energy demand. In the second phase of the campaign, the DSHP prototype was tested under the intermittent operating conditions of two representative days (RDs) of the heating season, in order to evaluate its actual SPF and assess efficiency improvement with respect to a traditional ASHP.
The obtained results point out that with a single borehole in an undersized configuration, the ground can rapidly restore its thermal level after being used, and thus a reduced BHE can be suitable, especially under intermittent operation, typical of the building climatization. In the heating season, the SPF of the DSHP, connected to a strongly undersized BHE field (−70% of the nominal size), increases by 3% compared to a conventional ASHP, and further improvements can be even adopted. In this regard, the present work aims at contributing to filling the gap in the evaluation of the seasonal performance of DSHPs coupled with undersized BHE fields by means of experimental tests.
2. Materials
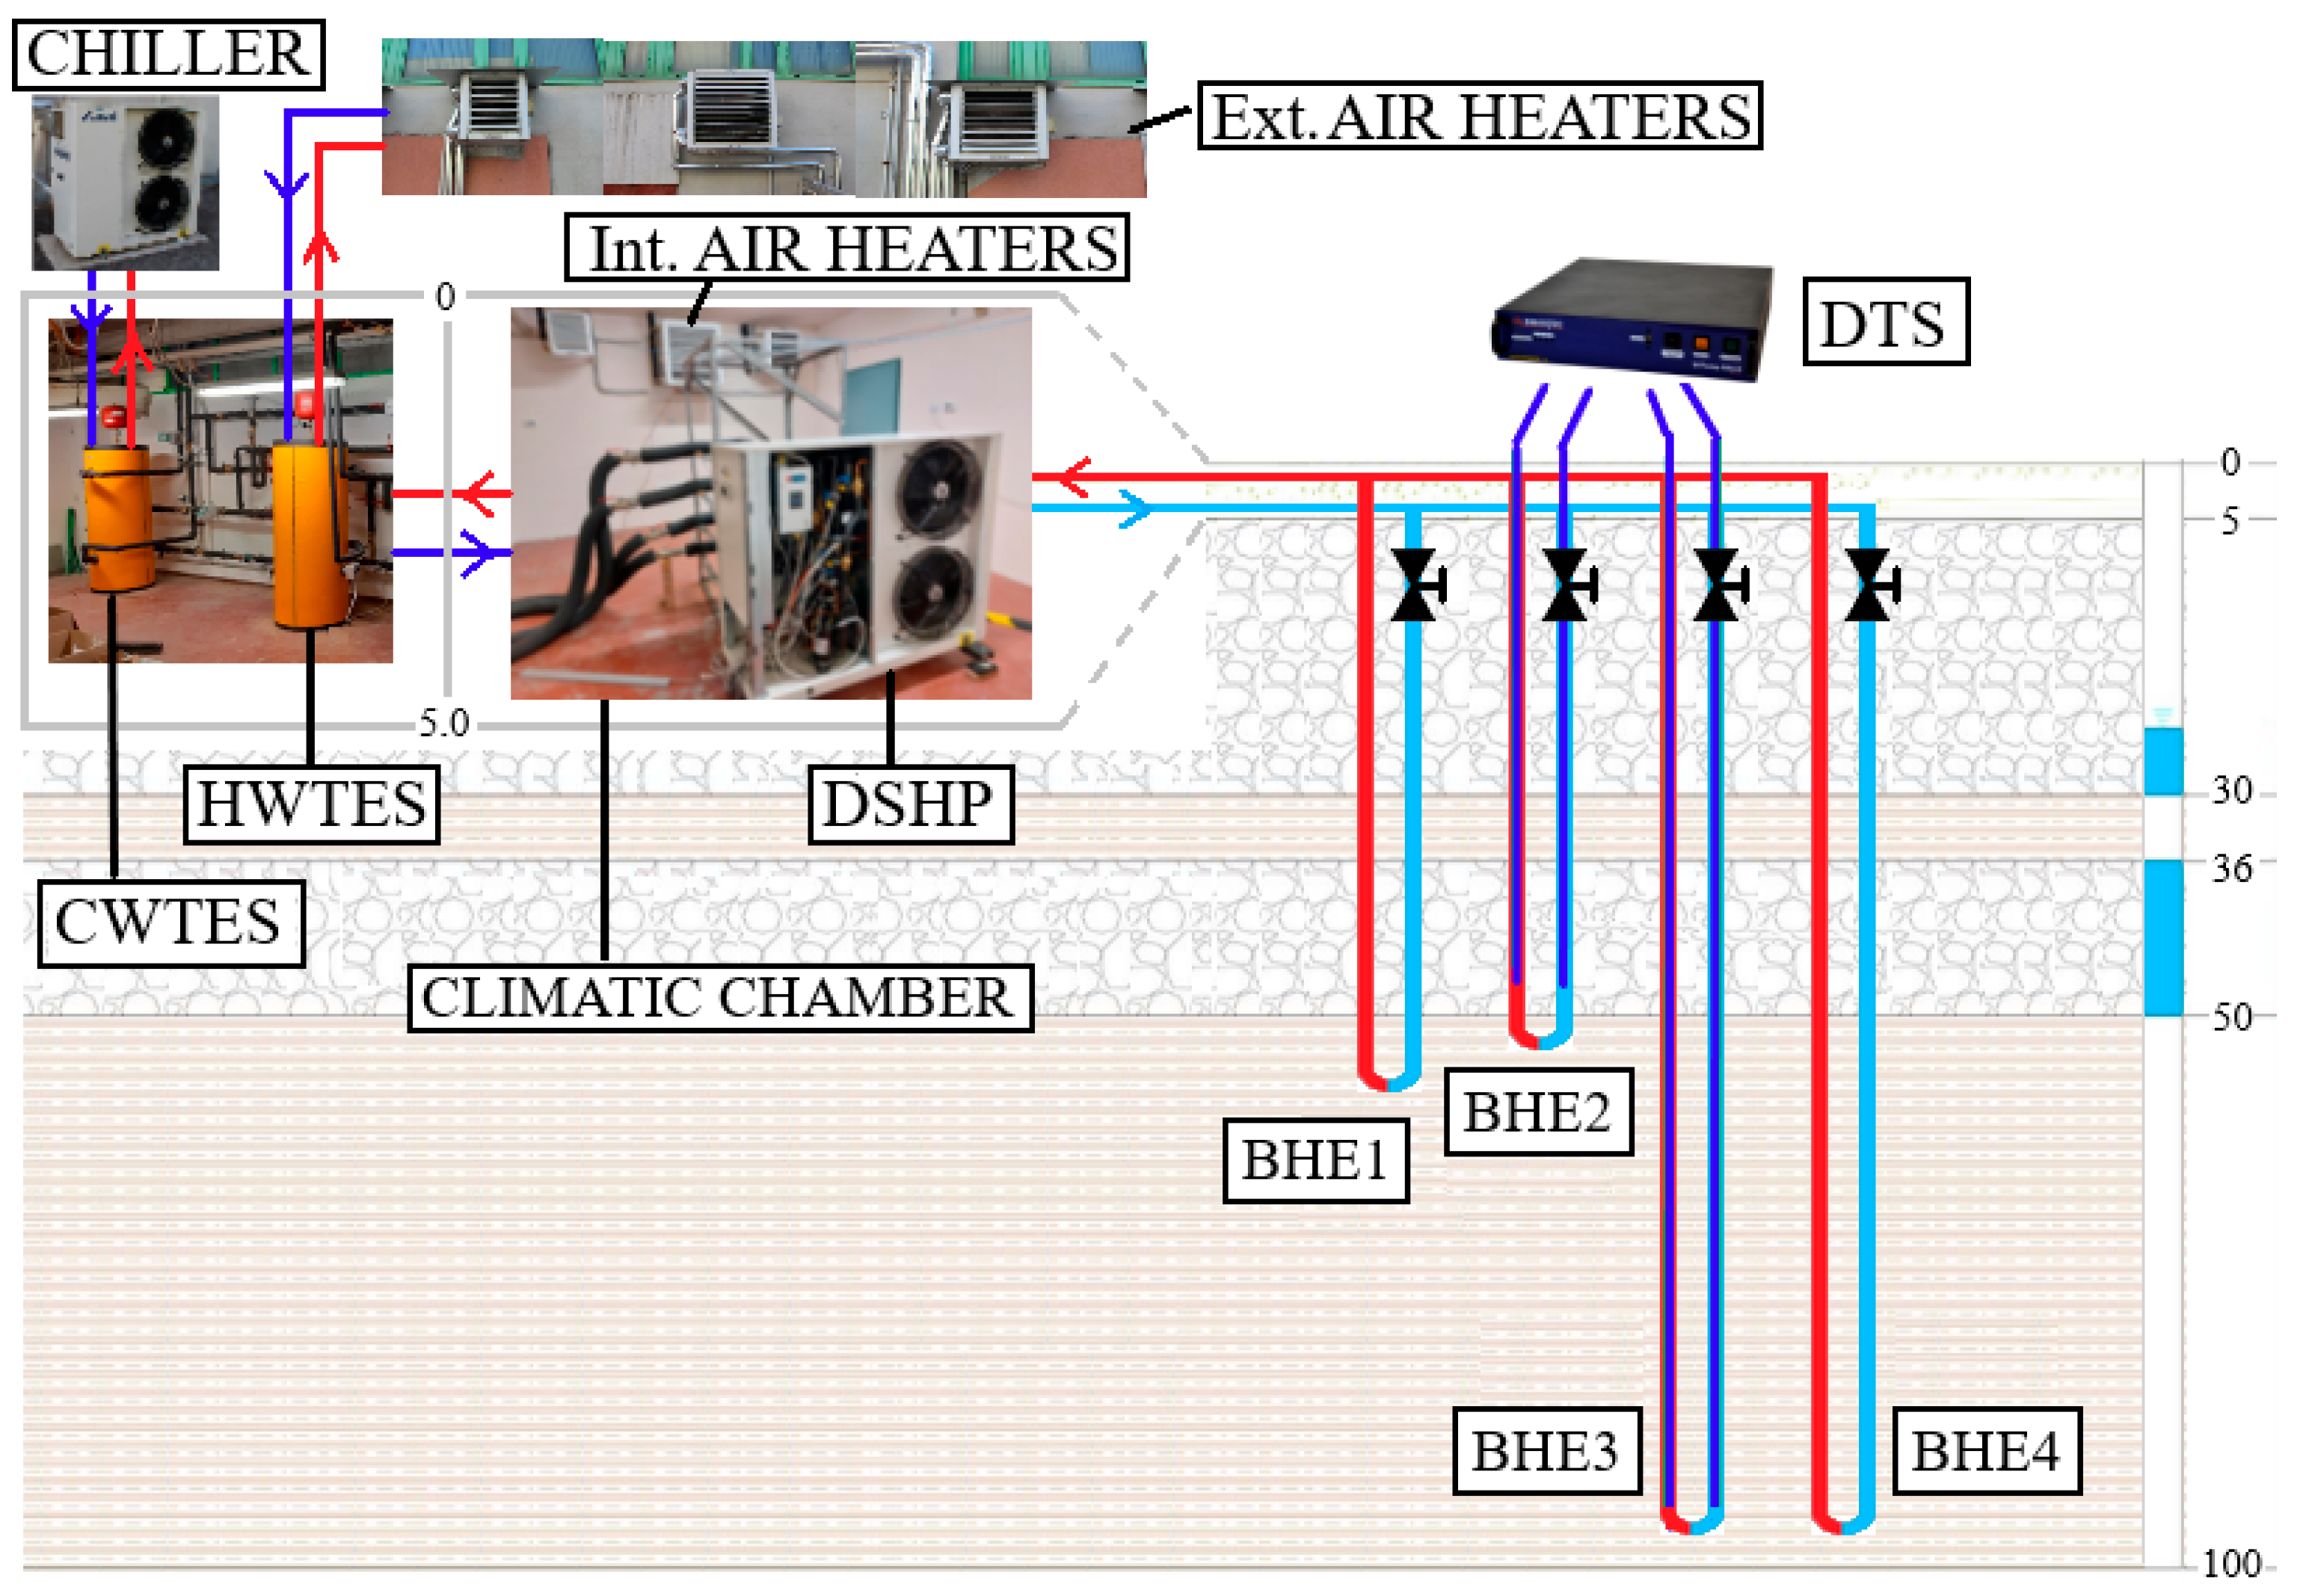
In this section, a brief overview of the experimental test rig employed for the laboratory tests, as shown in
Figure 1, is reported for the sake of brevity. For a full description, the reader can refer to Ref. [
32].
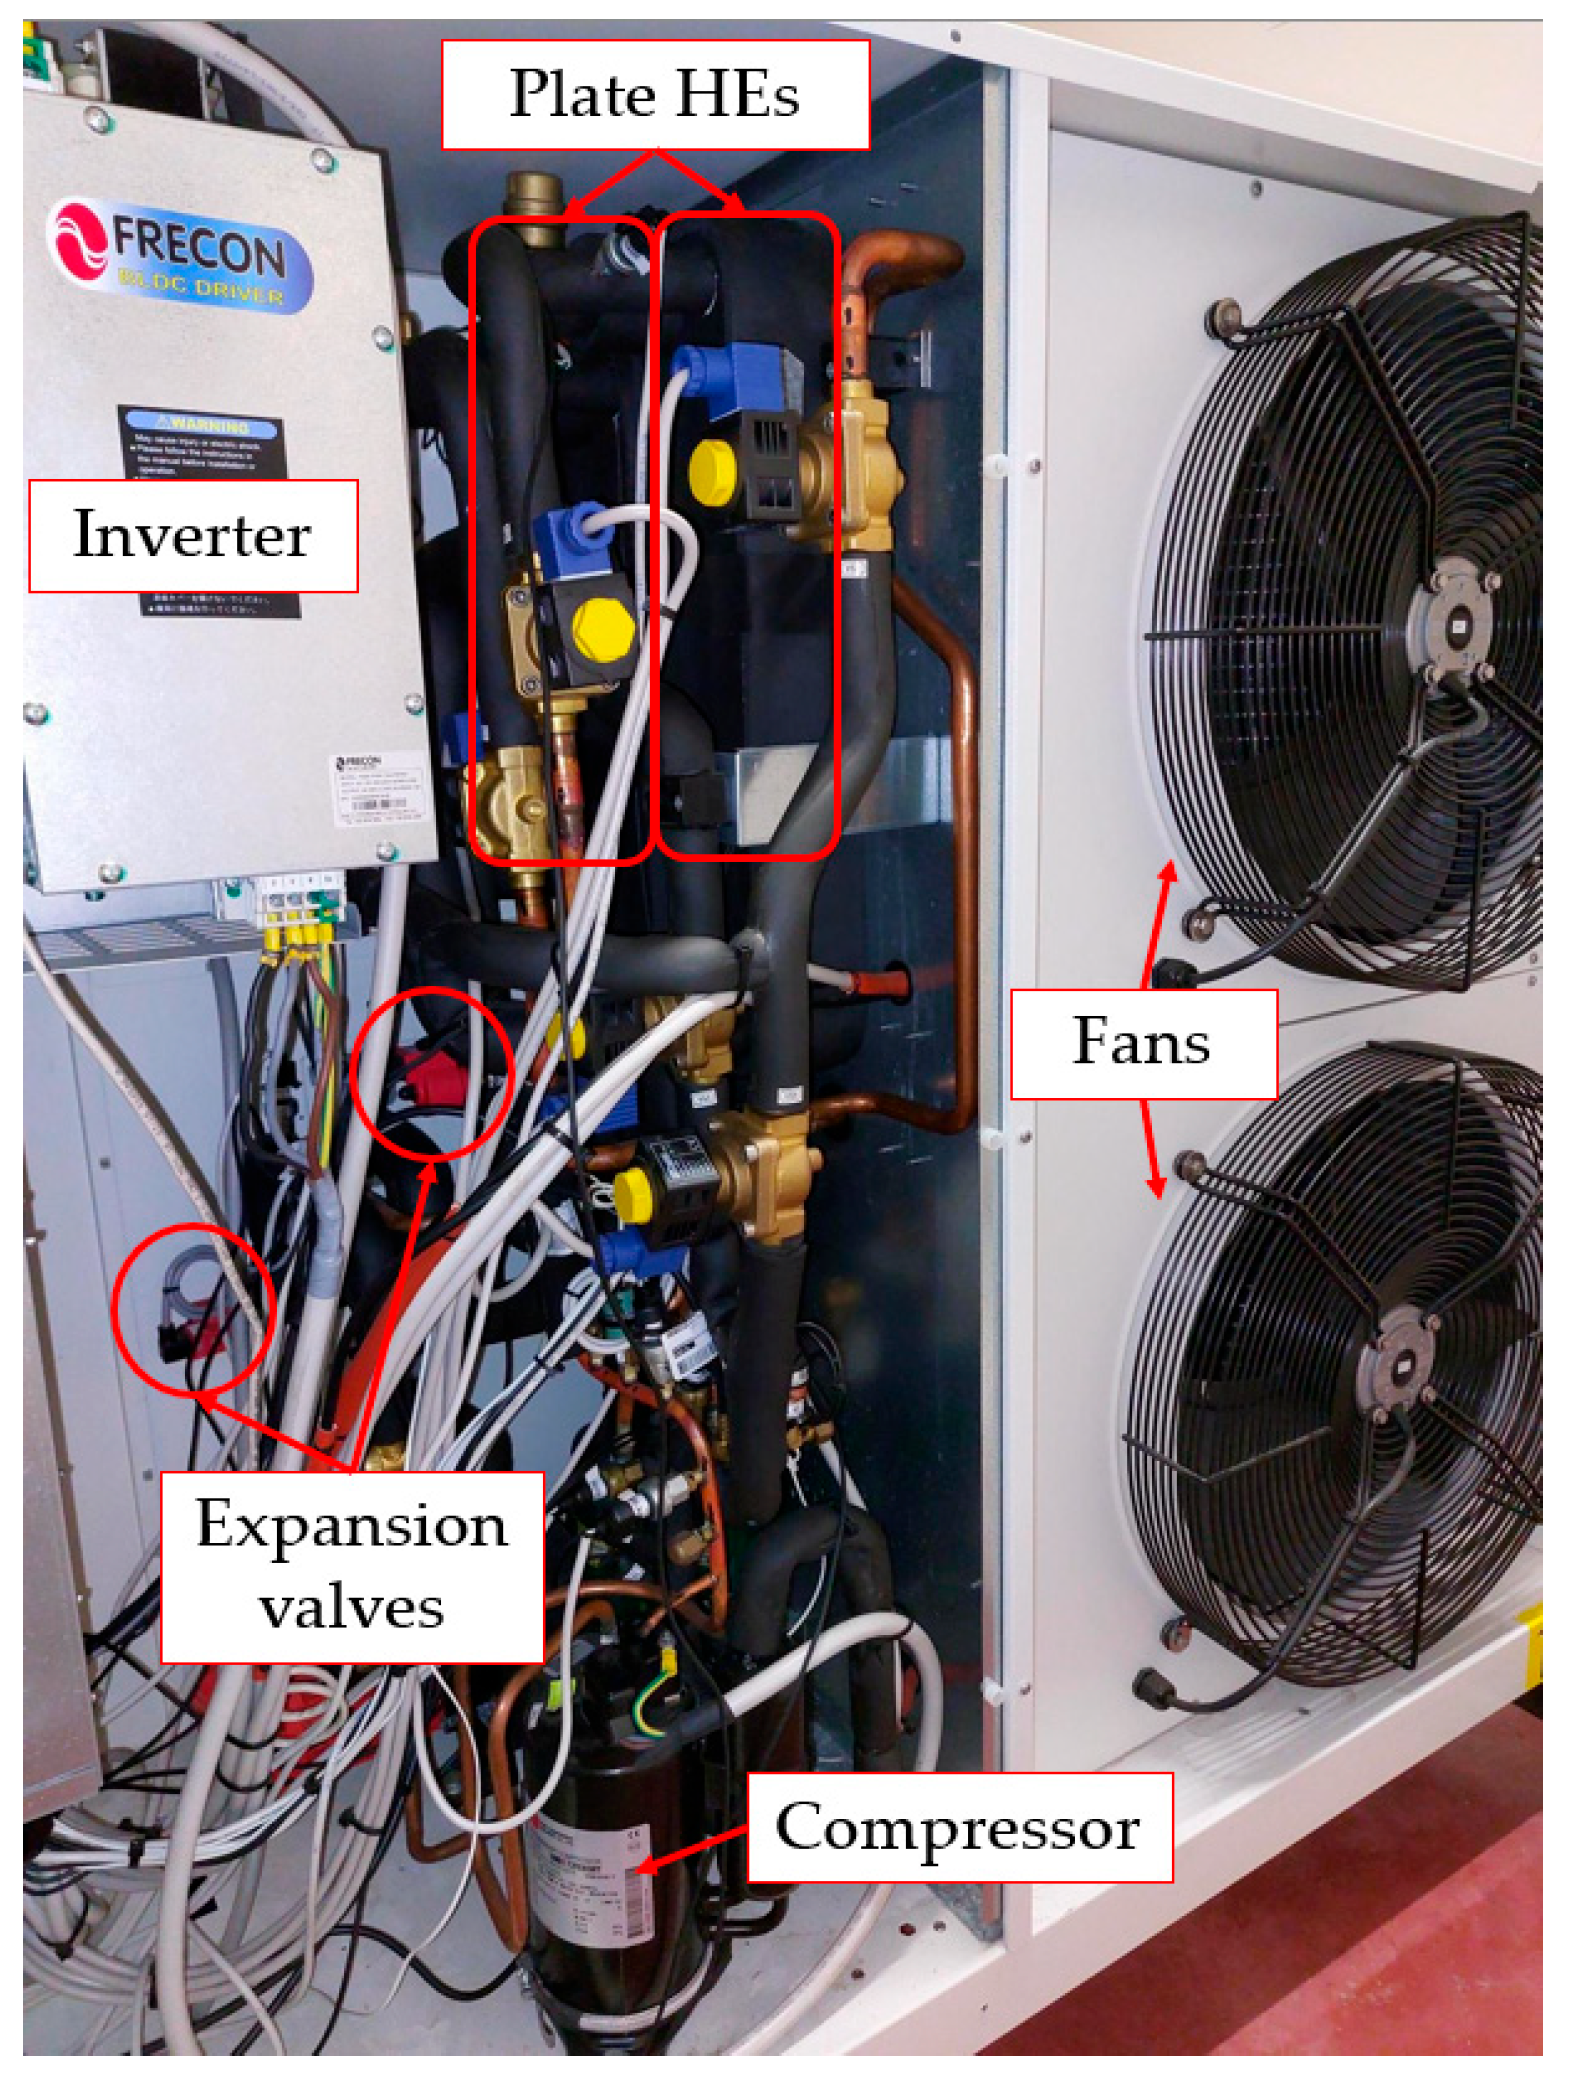
The DSHP prototype analyzed, as depicted in
Figure 2, is designed to harness both geothermal and aerothermal energy sources. For experimental purposes, the system is installed inside a subterranean, highly thermally insulated climate chamber (CC), as shown in
Figure 1. It is connected to a hydronic circuit, through which the thermal loads for heating and cooling can be simulated using a hardware-in-the-loop (HIL) approach. The tested unit is an electric inverter-driven HP that employs R-410A as refrigerant. When operating in geothermal mode, the device delivers a nominal heating capacity of 12.5 kW, determined with an inlet fluid temperature at the evaporator of 10 °C. In contrast, while operating in aerothermal mode, the rated heating capacity is 11.7 kW, assessed with 7 °C dry bulb and 6 °C wet bulb air temperatures. In both operating scenarios, the hot water flow maintains inlet and outlet temperatures of 35 °C and 40 °C, respectively.
As depicted in
Figure 1, a borefield consisting of four in-line double-U tube BHEs is connected to the DSHP. The BHE field, utilizing water as the heat transfer fluid, enables heat exchange with the ground when the unit operates in ground-source mode. The BHEs vary in depth: BHE1 and BHE2 are approximately 55 m deep, while BHE3 and BHE4 reach about 95 m. Each borehole is equipped with an independent shut-off valve, allowing selective activation and, consequently, variation of the total borefield length. This flexibility supports the evaluation of different system scales and facilitates analysis of ground thermal behavior and heat pump performance under varying borefield configurations.
To enable real-time monitoring of temperature profiles, a DTS system is installed within the borefield. Specifically, optical fibers are positioned along the supply and return pipes of one U-tube in BHE2 and BHE3, as illustrated in
Figure 1. This setup permits detailed investigation of parameters such as borehole thermal conductivity and resistance as a function of depth, short-term thermal interference between BHEs, and thermal charging/discharging time of the ground. The minimum spatial and temperature resolution of the DTS unit (SMARTEC, DiTemp Light Reading Unit) corresponds to 2 m and ±0.1 K, respectively.
To ensure stable operation of the DSHP system, a hot water thermal energy storage (HWTES) tank is integrated on the load side of the hydronic circuit. The tank, with a volume of 0.5 m
3, contains a coiled heat exchanger through which the heat pump circulates hot water. The HWTES is connected to three air heaters located inside the CC, which regulate the internal air temperature and balance the thermal energy exploited by the HP evaporator. Moreover, a cooling system composed of an air-to-water chiller and external air heaters allows heat dissipation to the external air when needed. To increase the thermal inertia of the system ensuring optimal operation of the chiller, an additional cold water thermal energy storage (CWTES) tank of 0.5 m
3 is placed in the hydronic loop (see
Figure 1).
To monitor system operation and assess the energy performance of the HP under test, several measurement devices are installed in the hydronic loop. These include temperature sensors (RTD Pt100, operating range −5 °C to 50 °C, accuracy class 1/10 DIN, uncertainty ±0.10 K) and electromagnetic flow meters (Siemens SITRANS F M MAG 1100 sensor (Siemens, Munich, Germany) paired with a MAG 6000 transmitter (Siemens, Munich, Germany), measuring range 0–5000 l h−1, overall accuracy 0.2% ± 1.77 l h−1). Additionally, a power meter (YOKOGAWA WT333 (Yokogawa Electric, Tokyo, Japan), three-phase power quality logger, accuracy ±(0.1% of reading + 0.1% of range)) is employed during experimental testing to measure the electrical input power of the HP.
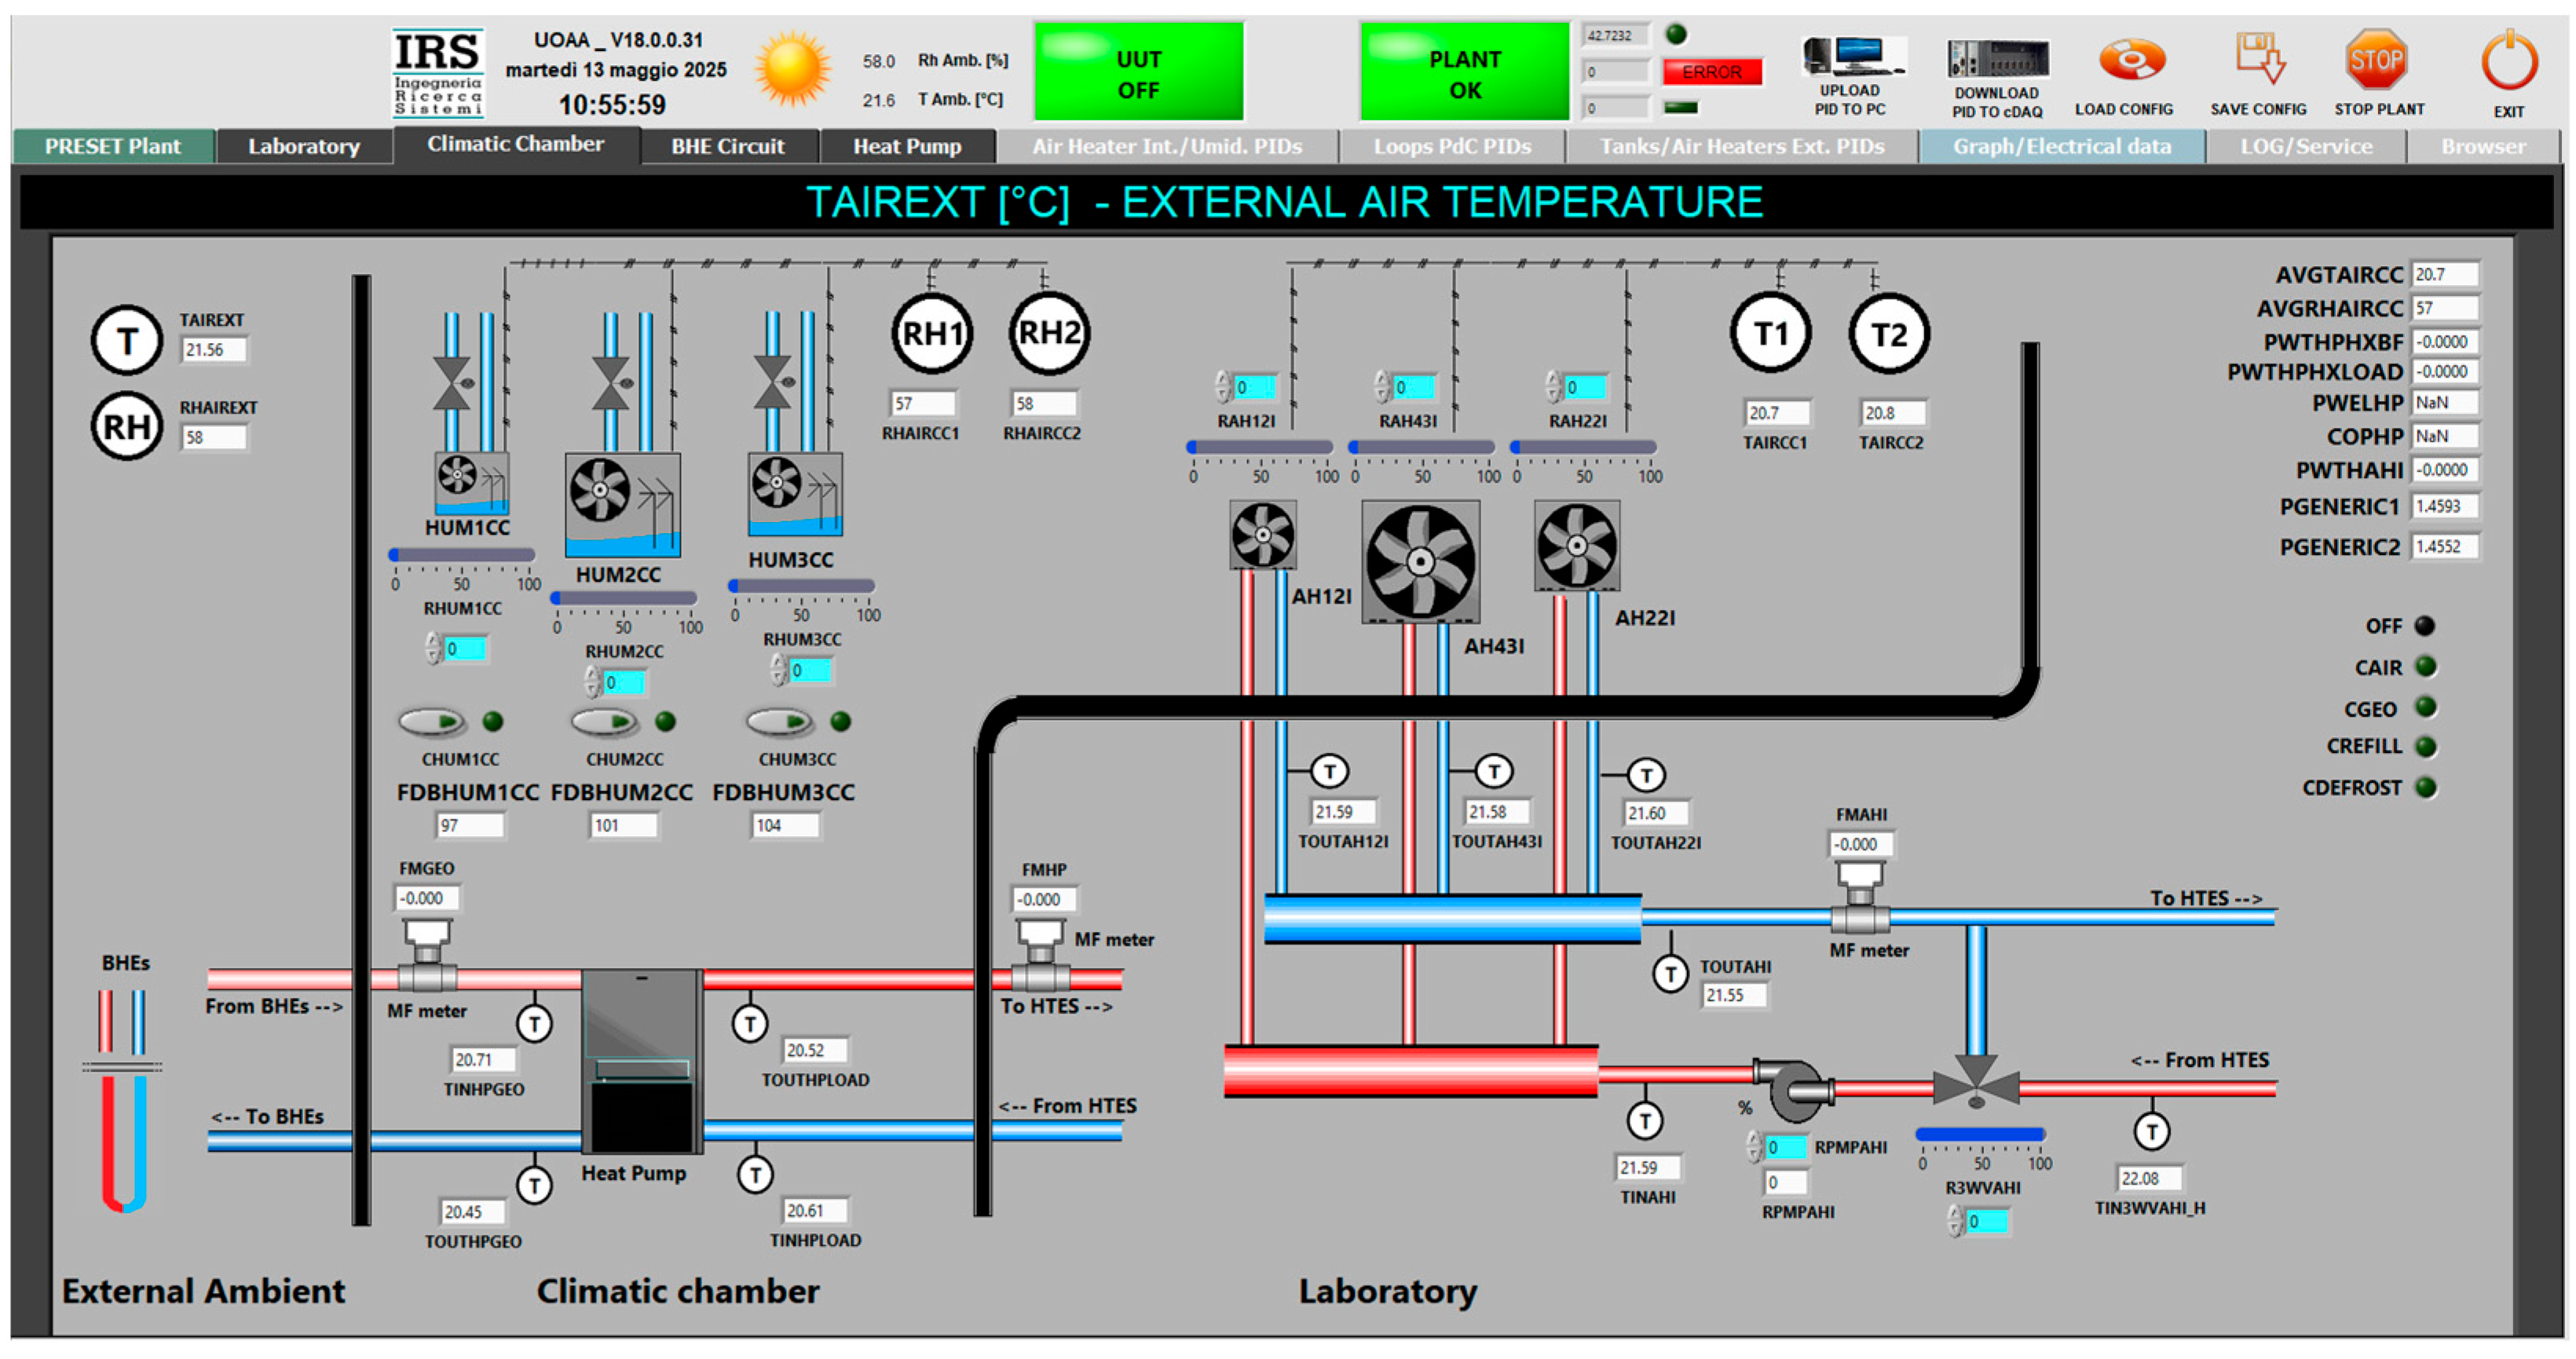
Finally, a control and monitoring system was implemented in LabVIEW Ver. 18. As an example, a synoptic reproducing part of the test rig components is shown in
Figure 3. In order to perform dynamic experimental tests, several PID controllers were tuned to control the operating conditions of the tested unit, such as the CC air temperature, and the mass flow rate and inlet temperature of the water streaming through the heat pump condenser (user side). Moreover, the test rig can be employed in accordance with the HiL methodology; indeed, the setpoint values of the monitored variables (i.e., temperature and mass flow rate) chased by the PID controllers can be varied dynamically in accordance with the results of a numerical simulation. In this way, it is possible to connect real hardware (i.e., the DSHP) to an emulated system (in this case, a building–HVAC system coupled to the heat pump, whose behavior is evaluated through numerical simulations).
3. Methods
The experimental campaign was organized into two phases: the first one investigates the ground thermal response during and after the HP operation; the second one assesses the DSHP seasonal performance through a simplified HiL approach.
3.1. Ground Thermal Response Methodology
In the initial phase of the research, the DSHP was run constantly at full power for a period of 7–8 h in heating mode, utilizing the ground as the external heat source, namely the discharging phase. This was followed by a resting period of three days, allowing the ground to recover its undisturbed temperature, referred to as the recharging phase. Various discharging durations were tested to investigate the thermal response of the ground under different operating conditions at the onset of the recharging phase.
The experimental tests, combined with measurements from the DTS system, enabled the evaluation of the temperature distribution along the boreholes during both heat extraction (i.e., when the DSHP was active) and the subsequent recovery phase (i.e., when the DSHP was inactive). These measurements also facilitated the assessment of the heat transfer rate between BHE fluid and surrounding ground.
In addition to the nominal borefield length, several lengths of the BHE field, from 55 m to 300 m, as reported in
Table 1, were connected to the heat pump prototype.
Accurate calculation of the nominal BHE field length (
LBHE,nom) would require detailed information on the building energy needs; however, a rough estimation of this property can be obtained considering Equation (1):
where
Pth,nom is the rated thermal capacity of the HP in geothermal mode (see
Section 2),
COPnom its coefficient of performance in rated conditions (equal to 4.2 based on manufacturer data sheets), and
q a selected thermal extraction rate from the ground in the range 40–50 W/m [
33]. Consequently, the BHE field associated with the DSHP has a nominal length ranging from 190 m to 240 m. Indeed, configuration F can be identified as the design option and the under-/oversizing of the tested configurations varies between −73% (case A) and +46% (case H).
Moreover, since water is used as BHE heat transfer fluid, a threshold temperature value of 5 °C for the fluid at the HP outlet was defined to stop the machine to avoid freezing. This safety practice was mainly necessary in the presence of undersized configurations, where the BHE fluid experiences lower temperature values. Regarding the measurement equipment, due to the different time scales of the discharging and recharging phases (with faster changes occurring when the HP is active), the DTS experimental data were logged every 30 s during the discharging phase, whereas a 10 min logging interval was deemed optimal for the subsequent recharging phase.
3.2. Representative Days Tests Methodology
In the second phase of the experimental campaign, the seasonal performance of the DSHP was evaluated by testing the HP under the operating conditions of a few representative days of the heating season, following the HiL methodology. The overall HiL procedure was structured according to the following phases: (i) selection of the reference building and climate, and evaluation of the building’s heating and cooling loads by means of a dynamic simulation; (ii) selection of a certain number of days (two in this case) representative of the season according to the k-medoids method; (iii) assessment of the simulated heat pump operating conditions during the selected days, and setting of these profiles as operating conditions for the experimentally tested heat pump; (iv) execution of experimental dynamic tests on the heat pump, reproducing the operating conditions assessed in the previous phase. The daily tests were performed by using the DSHP before in air mode only, and then exploiting both heat sources (air and ground). In order to investigate the ground thermal response over the daily tests, the temperature within the borefield was monitored using the DTS system. The four phases of the HiL procedure mentioned above are deepened as follows.
3.2.1. Simulation of the Reference Building–HVAC System
The building modeled in this work is located in Rome (central Italy), and it represents the SFH100 type introduced by the IEA SHC Task 44 [
34], a non-renovated existing building with 120 m
2 of conditioned floor area, a surface-to-volume ratio of 0.36 m
−1, and a transmittance value of the external walls equal to 0.67 W/(m
2 K). The numerical model was implemented with the ALMABuild [
35,
36] and Carnot Ver. 7.3 [
37] toolboxes, which are open-source libraries developed in the Matlab-Simulink environment for the dynamic simulation of coupled building–HVAC systems. A peak heating load equal to 7.8 kW, and a maximum cooling load of 5.8 kW were evaluated through the ALMABuild tool. A nominal length of 205 m for the BHE field coupled to the DSHP was evaluated following the methodology defined by ASHRAE [
20]. However, to investigate the HP performance in the presence of a strongly undersized BHE field, in this second part of the experimental campaign only one vertical borehole 55 m long, namely BHE2, was used, corresponding to a borefield length 73% reduced compared to the nominal one. Since the conventional heat generation system, used as a benchmark, is based on an ASHP, the behavior of the tested prototype was evaluated numerically in aerothermal mode through a dynamic model implemented in ALMABuild, in which the HP was coupled to the reference building. For the sake of clarity, a summary of the main properties of the reference building–HVAC system is reported in
Table 2.
3.2.2. Selection of the Representative Days
The numerical results were used as input for the partitioning around medoids (PAM), also referred to as the
k-medoids method, a well-known partitioning technique for clustering [
38]. Starting from an assembly of objects (in this work 166, corresponding to the heating season days), the PAM aims at finding a user-defined number of elements, one for each group in which it is intended to divide the objects. Each object is described by a number of properties that are used to evaluate the normalized distance (squared Euclidean) between elements. In this way, a similarity criterion can be identified within the data set objects. In particular, the building thermal energy demand (in kWh day
−1), daily mean external air temperature (in °C) and solar irradiation on horizontal surface (in Wh m
−2 day
−1) were selected as the most influencing parameters characterizing a conditioning day. The
k-medoids Matlab function was used to implement the PAM selecting 2 clusters with 1 medoid each. The following representative days were obtained: December 9th (RD1) and March 7th (RD2). In order to further validate the representativeness of the selected days, the total building thermal energy demand, obtained by multiplying the thermal energy demand of the two RDs by the number of days of the corresponding cluster, was compared to the annual energy demand obtained from the full-year simulation, obtaining a deviation of less than 4%. In
Figure 4, the external temperature (
Text), solar irradiance (
Irr) and heating load (
Pth) profiles during RD1 and RD2 are shown. The daily solar irradiation is 1830 and 5047 Wh m
−2 day
−1 during RD1 and RD2, respectively, and this explains why the HP operates more during RD1 compared to RD2 even though the mean outdoor temperature is greater in RD1.
3.2.3. Setting of the Operating Conditions
The operating profiles of the two representative days were selected as boundary conditions of the tested heat pump during the experimental daily tests. In further detail, the water temperature at the HP inlet and the external air temperature values, obtained from the ALMABuild simulation, served as pre-defined setpoint profiles and were reproduced in the experimental test rig by adjusting the operation of a 3-way valve and the three air-heaters inside the CC, respectively. The water flow rate, set constant in the simulation to 1908 m3 h−1, was reproduced in the lab accordingly. Actually, the adoption of pre-defined profiles neglects the building–HVAC system feedback, but allows avoiding real-time communication between hardware and simulator, thus reducing the necessary equipment and interface. Moreover, this approach maintains the advantage of investigating experimentally the real HP behavior.
3.2.4. Performing of Daily Dynamic Tests
To compare the DSHP performance to that of a traditional ASHP, the same typical days (and working conditions) were reproduced in the test rig operating the DSHP before in air mode only and successively exploiting both sources. In this way, a reference
COP in air mode was obtained experimentally to be compared with the heat pump performance in dual-source mode. To meet the intermittent building load, during the RDs, the HP unit had to perform several on–off cycles. To better explain the method employed in reproducing a generic HP on–off cycle, in
Figure 5, an extract of the HP behavior is reported. For the sake of clarity,
Figure 5 refers specifically to the dual-source operation; however, the same methodology was applied to the pure aerothermal mode.
The HP unit (orange continuous line in
Figure 5) was turned on when the simulated HP (blue curve) switched on; on the contrary, the system was shut down when the cumulative thermal energy delivered by the HP under test (orange area) and by the simulated HP (blue area) became equal during the on–off cycle, ensuring, in this way, that the building energy need was met at every HP activation. This was checked using a Matlab code that was run in parallel with the experimental tests to calculate the real HP thermal power and the energy supplied to the emulated building (namely the comparing parameter for switching the real HP off) through a numerical integration method (trapezoid rule). The Matlab code provided calculations based on experimental measurements averaged every two minutes.
During the dual-source operating mode, the prototype can choose between one of the two external sources. At the startup, the HP was turned on in geothermal mode since the ground, restored during the HP deactivation, could guarantee a higher source temperature. Then, the DSHP switched to the air mode in the presence of one of the following conditions:
COP in ground mode (
COP_DSHP in
Figure 5) lower than that experimentally obtained in air mode (
COP_ASHP), or geothermal fluid temperature under the freezing risk threshold value. The HP unit under test was operated at full power (invert frequency of 110 Hz) during the on–off cycles, except during the switching between the two external heat sources when the inverter automatically reduced the frequency to limit the mechanical stress on the components. Given the current control logic, no more than one mode-switch can occur during each on–off cycle. Furthermore, during the switching phase, the compressor is not completely turned off, but its speed is modulated via the inverter. This approach significantly reduces mechanical stress compared to a full on–off cycle, thereby mitigating potential wear and improving system reliability.
3.3. Performance Analysis
To investigate the ground thermal response during the first part of the experimental campaign, the charge percentage (CP) parameter was introduced as follows. CP represents the ratio of the mean water temperature in the borefield during the recharging phase to the initial undisturbed ground temperature recorded before the onset of the test. The mean water temperature was obtained by averaging the measurements of the DTS system.
On the other hand, in the second series of tests (evaluation of the DSHP seasonal performance), the investigation of the different HP systems was carried out following the key performance indicators reported in Equations (2) and (3), whilst Equation (4) was used to evaluate the uncertainty in the thermal power calculation.
The net daily coefficient of performance (DCOPnet, Equation (2)) serves as the daily performance indicator. It is defined as the ratio between the thermal energy delivered by the heat pump (Eth,net,RDi) and the corresponding electrical energy consumed by the compressor (Eel,net,RDi) during a representative day. In Equation (2), τd is the RD duration, ṁ is the water mass flow rate at the heat pump condenser, cp is water specific thermal capacity, Tin/out is the inlet/outlet water temperature at the condenser, Pel the electric power input, and the subscript on indicates that the no stand-by operation is considered.
In Equation (3), the net seasonal coefficient of performance (
SCOPnet), which is the whole winter performance indicator, was obtained as the ratio between the overall thermal energy supplied by the heat pump (evaluated by summing the product of the medoids thermal energy (
Eth,net,RDi) for the corresponding cluster days number (
ndays,RDi)), and the seasonal electric energy consumption (evaluated summing the product of the medoids electric energy (
Eel,net,RDi) for the corresponding cluster days number). The uncertainty in the obtained thermal power values (Δ
Pth) was evaluated according to Equation (4), following the error propagation theory [
39]: Δ
ṁ and Δ
Tin/out,HP represent the HP water mass flow rate and temperature at the HP inlet/outlet uncertainties, respectively. For the electric power accuracy calculation, the electric power meter uncertainty was taken into account. The relative error of indirect measurement parameters (
Pth,
Eth,net,RDi,
Eel,net,RDi,
DCOPnet and
SCOPnet) is below 6.4%.
4. Results and Discussion
4.1. Experimental Results for Continuous Operation
In the initial phase of this study, the DSHP was run in geothermal mode and tested in conjunction with various borefield configurations (total length from 55 to 300 m, see
Table 1) to analyze their influence on the ground response. For the sake of clarity, the described configurations were tested on different days. The total duration obtained for each discharge phase is reported in
Table 3.
When BHE2 and BHE3 were employed singularly, that is in cases A and B, respectively, the minimum threshold value of 5 °C at the HP outlet linked to freezing risk was reached, so the heat pump switched off and very low discharge periods were obtained (see
Table 3). No freezing risk occurred in the remaining cases.
Figure 6 and
Figure 7 depict the evolution of the
CP parameter over time during the recharging phase for the specific borefield configuration and monitored borehole (BHE2 or BHE3). Both figures demonstrate that, across all configurations, the geothermal fluid restores approximately 90% of its initial undisturbed temperature within 7 h (about 400 min) after the HP deactivation. Furthermore, in the configuration with the longer borefield (Case H), the deeper borehole (blue curve in
Figure 6) shows a higher initial
CP value (82%) compared to the shorter one (75%, green curve). This difference arises from the varying thermal behavior along the boreholes during the discharging phase. Although the inlet temperature of the heat transfer fluid remains uniform throughout the operation, the longer borehole provides a greater heat exchange surface, resulting in a higher average fluid temperature within the BHE.
This behavior is also confirmed by observing the results of configuration D (where only BHE2 and BHE3 are employed). Indeed, even in this test the initial
CP of the longer borehole (yellow curve in
Figure 6) is higher (57% at the initial time) than that of the shorter one (48%, black curve). Moreover, despite test D having a shorter duration of the discharging phase (5.1 h) compared to test H (7.3 h), the initial
CP values for configuration D are lower than those for configuration H due to the smaller total heat exchange area.
Figure 7 shows the
CP of BHE2 in all the adopted borefield configurations. All the curves reported exhibit the same trend, except test A (green curve), where BHE2 was employed alone in the most undersized configuration (−73% compared to nominal size) and the
CP increases much faster at the beginning compared to the others. This behavior can be explained considering the duration of each test: due to the very short borefield length of case A, the ground heat exchanger cannot be used for a prolongated period due to the freezing risk, and this implies that little energy is extracted from the ground during test A, while the surrounding field remains warm (only the ground volume adjacent to the borehole interface is rapidly cooled down). Moreover, at the moment of heat pump shutdown, a larger temperature gradient between the BHE fluid and the surrounding ground is observed, which enhances the heat transfer rate, and no thermal interference between different BHEs is present. As a consequence, when the HP is switched off, BHE2 in case A can recharge the heat transfer fluid temperature quite rapidly compared to the same borehole employed in the other larger BHE field configurations. More in detail, in case A, the heat transfer rate between ground and BHE2 in the first hour of the resting phase is significantly higher (+0.08 K min
−1) compared to that observed for the same borehole tested in the longest borefield of case H (blue curve, +0.03 K min
−1). Furthermore, in test A, 85% of the undisturbed temperature can be recovered by the BHE fluid in about one hour. The results point out that for a single borehole in an undersized configuration, the ground can rapidly restore its thermal level after being used, and thus a reduced ground heat exchanger can be suitable, especially under intermittent operation, which is typical of the climatization of buildings. According to that, in the second phase of the campaign, the DSHP prototype was tested under the intermittent operating conditions of two representative days of the heating season by adopting an undersized BHE field.
4.2. Experimental Results for the Seasonal Performance Assessment
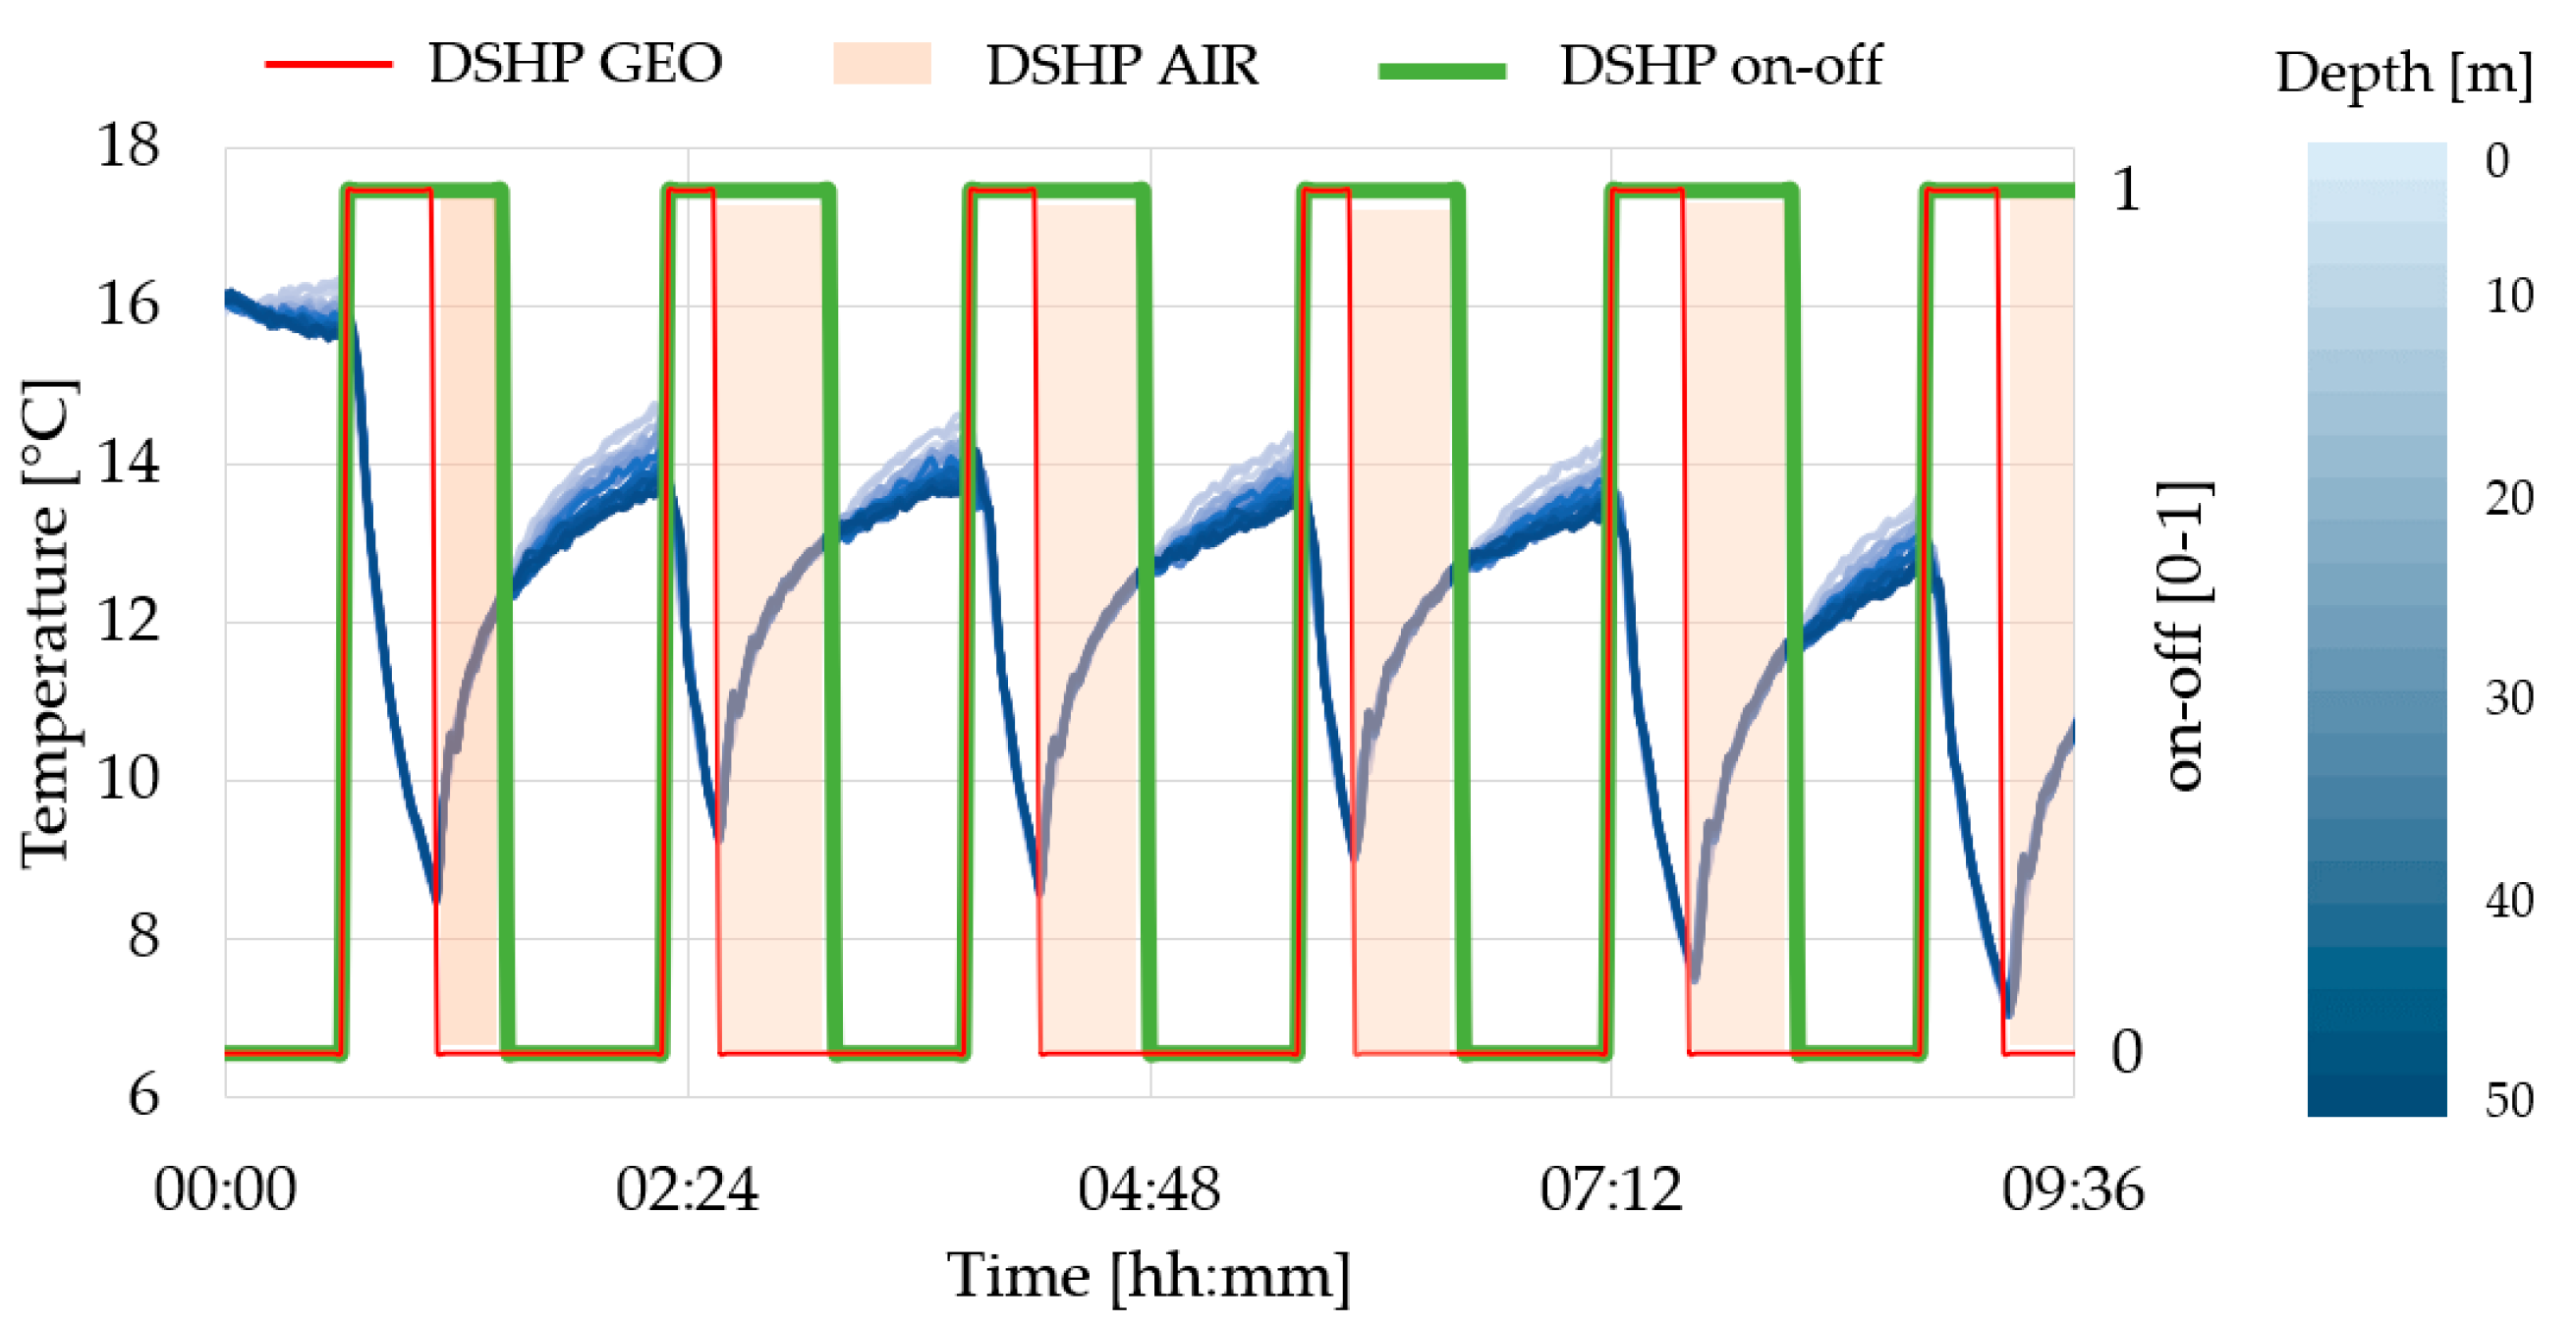
During the reproduction of the two RDs, the DTS system was used to dynamically investigate the water temperature trend within BHE2 in configuration A (−73% of nominal borefield length), from which thermal energy was extracted in ground operation mode. The results of this monitoring analysis during the first part of RD1 are shown in
Figure 8, where the time-dependent water temperature within BHE2 (averaged between BHE supply and return pipes) is reported together with the DSHP on–off cycling. In particular, the profile labelled “DSHP on–off” represents the HP activation, “DSHP AIR” indicates the air-source mode, and “DSHP GEO” the geothermal operation. Additionally, a chromatic scale was introduced to show the distribution of the temperature along the borehole depth.
According to
Figure 8, when the DSHP is operated in ground mode (red curve profile), a sudden decrease (about 0.2–0.3 K min
−1) in the BHE fluid temperature is noticed. Additionally, it is interesting to observe that, in ground mode, the average water temperature is almost the same over the entire length of BHE2, independently of the depth (no chromatic scale can be observed). This behavior persists even when the DSHP operates in air mode (red light areas) due to the continued operation of the BHE field circulating pump. In contrast, when both the HP and the circulating pump are turned off, the average temperature varies along the length of the borehole, with the lowest temperature value occurring at the deepest depth (darker blue color) and the highest occurring at the surface (lighter blue color). It is also evident that the longer the DSHP operates in ground mode during an on–off cycle, the lower the water temperature before switching: compare, e.g., the temperature gap reached in the fifth cycle (longer operation in ground mode) to that obtained in the fourth one (shorter operation in ground mode). Moreover, when geothermal energy is not extracted, the ground layers closest to the borehole are able to recharge their thermal energy rapidly, primarily via conduction, thanks to the temperature gradient between the heat transfer fluid and the ground. Based on measurements from the DTS system, it was calculated that approximately 80% of the initial fluid temperature is restored between two consecutive startups in ground mode. Consequently, a BHE field that is significantly smaller than the nominal size can be utilized as long as it is energy-efficient; after that, the ground must recharge itself naturally while the aerothermal source is used to meet the remaining building load.
4.2.1. Switching Analysis
In order to fully investigate the heat pump performance during the on–off cycle, it is necessary to comprehend the switching phase deeply. For this reason,
Figure 9 reports the most important HP parameters in terms of electric and thermal power, evaporation (
p_evap) and condensation pressure (
p_cond), and
COP and fans control (0/1) during a switching phase.
From
Figure 9, it is clear that when the DSHP starts operating in air mode (switch starting point), a decrease can be observed in both the thermal power supplied (green continuous line) and the electric power absorbed (green dotted line) by the HP. The electric consumption falls following the HP inverter controller, which modulates the frequency from the maximum limit (110 Hz) to a minimum value kept constant during the transient phase (approximately 45 Hz). In parallel, the reduction in the inverter frequency implicates a drop in the refrigerant flow rate, which produces a fall in thermal capacity. Interestingly, the thermal-to-electric power ratio, namely the
COP (red curve), initially increases due to a faster decline in electric absorption compared to the thermal power decline. After reaching the peak, the
COP drops slightly as the electric power input stabilizes while the thermal power supplied continues to decrease. Generally, the
COP trend presents a high value throughout the transient phase, ensuring optimal operation. This outcome can also be explained by examining the pressure profile in the circuit, as shown in
Figure 9. Indeed, the evaporation pressure (blue dotted line) rises while the condensation pressure (blue continuous line) decreases, resulting in a diminished compression ratio, and thus, in better performance.
In order to provide an overview of the switching operation characteristics, the most important parameters of this transient phase are presented in
Table 4. For clarity,
Eel,switch,net and
Eel,RD,net represent the electric consumption during the switching phase only and the RD, respectively, and
DCOPswitch,net indicates the daily energy performance of the switching phase only.
The time period related to the switch was identified as follows: the switch transient begins as soon as the heat pump receives the mode change command from the LabVIEW control system and ends when the HP capacity remains for at least 2 min in a 5% range of the steady-state thermal power. According to this definition, the switch phase has an average duration of about 7 min, representing approximately 15% of the average duration of a whole on–off cycle (about 44 min, see cycle duration in
Table 4). When examining daily electricity consumption, it is observed that the switching phase (
Eel,switch,net) accounts for 11% of the total electricity consumed in both days under consideration (
Eel,RD,net). However, since, as evidenced before, the switching period is characterized by an efficient transient operation, high values of
DCOPswitch,net are obtained (4.19 ± 0.25 and 3.93 ± 0.25 during RD1 and RD2, respectively). Despite the high performance of this transient, increasing the switching frequency is not recommended since it would negatively affect the stability of the supplied water temperature. Furthermore, the efficiency during the switching phase benefits from the thermal inertia of the heat pump, which is operated at full power prior to switching. Limiting this benefit by reducing the full power periods could alter the efficiency of the switching process itself, and this potential impact warrants further investigation.
4.2.2. Daily and Seasonal HP Performance
In
Table 5, the main experimental results obtained on a daily and seasonal basis are summarized.
As shown in
Table 5, the thermal energy delivered to the building (
Eth,RD,net) by the ASHP and by the DSHP is about the same during each representative day: about 106 and 95 kWh during RD1 and RD2, respectively. In contrast, the electric energy consumed by the compressor (
Eel,RD,net) varies between the two heat pumps. More specifically, the ASHP consumes about 4% more during RD1 and 1% more during RD2. Since the number of days in cluster 1 (127) is much higher than that in cluster 2 (39), the consumption of RD1 has a greater influence on a seasonal basis. Therefore, the ASHP seasonal consumption (
Eel,seas,net = 4.82 ± 0.05 MWh) is about 4% higher than that of the DSHP (
Eel,seas,net = 4.63 ± 0.05 MWh).
In terms of efficiency, the DSHP
DCOPnet is 3% and 2% higher than that of the air unit during RD1 and RD2, respectively. In addition, comparing the
DCOPswitch,net values in
Table 4 to the DSHP
DCOPnet values in
Table 5, it is confirmed that the switch phase is an efficient transient period. In particular, the switch is up to 13% more efficient than the daily operation. Considering the whole heating season, the DSHP
SCOPnet is 3.69 ± 0.19, whereas that of the ASHP is 3.59 ± 0.19. Therefore, the increase in the DSHP performance is limited (3%). The reasons for this result are different: (i) the location identified for the reference building, Rome, is characterized by a mild and not very humid climate over the year, a condition that certainly benefits the ASHP performance since it allows to limit defrost cycles; (ii) the characteristic days selected with the medoid technique have average ambient air temperatures that are not excessively low, as visible in
Figure 4, and, for this reason, the ASHP performance is significantly high; (iii) the borefield coupled to the DSHP is severely undersized (−70% of the nominal size), and this results in a rapid drop in the source-side water temperature, and consequently also in the DSHP
COP.
According to the experimental results, a DSHP prototype connected to a strongly undersized borefield can increase the seasonal efficiency of an HVAC system compared to a traditional air-source unit and diminish the initial investment cost related to the borefield installation. Indeed, the possible use of the ground, even in the presence of a short BHE field, proved to be convenient. The outcomes of the discharging tests applied to the ground pointed out that the BHE fluid recovers 90% of its initial undisturbed temperature within 7 h after the HP deactivation in all investigated borefield configuration and the recharging process was further faster for a single borehole since 85% of its undisturbed temperature could be restored in about 60 min. This capability is completely suitable for intermittent operation, typical of the climatization of buildings, as was confirmed by the daily dynamic tests in which the ground was able to rapidly recharge, enabling the efficient use of both sources under optimal conditions.
A preliminary economic analysis suggests that a 3% increase in efficiency, obtained by the DSHP with respect to the ASHP, is insufficient to justify the initial investment cost required for the installation of a borefield. However, DSHPs with a larger borefield can yield higher annual system performance compared to that of air-source units, while maintaining the investment cost significantly more affordable than that for a ground-source heat pump system. Over time, this improvement in performance results in more favorable economic returns, making the investment justifiable from a long-term cost–benefit perspective. Moreover, the climate considered in this paper (Rome) is characterized by mild conditions during the heating season. Consequently, the enhancement in the DSHP seasonal performance is limited by the high performance of the ASHP and the low frequency of defrost cycles. In locations characterized by more severe climatic conditions, the increase in efficiency linked to a DSHP is expected to rise up to 10% [
17].
5. Conclusions
In this work, a dual-source heat pump (DSHP) prototype, designed to harness both geothermal and aerothermal energy sources, was tested under different operating conditions while a distributed temperature sensing (DTS) system was used to monitor the borehole heat exchanger (BHE) fluid temperature allowing a dynamic ground thermal response analysis during each experimental run.
In the initial phase of the research, the DSHP was run constantly at full power for a period of 7–8 h in geothermal heating mode in order to study the ground response during (discharging phase) and after (charging phase) the HP operation. In the second phase of the campaign, the DSHP prototype, connected to a strongly undersized BHE field (73% shorter compared to the nominal size) was tested under the operating conditions of two representative days (RDs) of the heating season, in order to evaluate its seasonal performance factor and assess efficiency improvement with respect to a traditional air-source heat pump (ASHP).
The experimental results highlight that when geothermal energy is not extracted, the water flowing in the borefield is able to recharge its thermal energy rapidly: approximately 80% of the initial undisturbed fluid temperature can be recovered between two consecutive heat pump startups in ground mode. The fastest recharging process was achieved in the presence of an undersized BHE field. This is due to a limited energy extraction rate, which can also help to limit the ground temperature drift over time. Consequently, a BHE field significantly smaller than the nominal size can be utilized as long as it is energy-efficient; after that, the ground recharges itself naturally while the aerothermal source is extracted to meet the remaining building load.
The daily dynamic tests proved that the DSHP net daily coefficient of performance (DCOPnet) is 3% and 2% higher than that of the air unit during RD1 and RD2, respectively. Interestingly, comparing the DCOPnet of the switching phase only to that of the RDs, it is noticed that the switch phase is up to 13% more efficient than the daily operation. Given the current HP control logic, no more than one mode switch is permitted per activation cycle. However, considering the energy benefits associated with this transient phase, the potential impact of increased switching frequency on daily system efficiency deserves further investigation. On a seasonal basis, the ASHP electric energy consumption is about 4% higher than that of the DSHP, resulting in a SCOP increase of about 3% in favor of the dual-source generator. However, the DSHP performance is only slightly higher than that of the ASHP due to some reasons: the location identified for the reference building, Rome, and the characteristic days selected with the medoid technique are characterized by mild climate conditions that certainly benefit the ASHP performance; in addition, the borefield coupled to the DSHP is severely undersized (more than −70%). Consequently, even if, from a preliminary economic analysis, a 3% increase in efficiency does not justify the initial investment required for the installation of a borefield, for DSHPs with a larger borefield and locations characterized by more severe climatic conditions, the investment is justifiable from a long-term cost–benefit perspective.
In conclusion, the DSHP system proves to be competitive in the market for several applications: (i) to balance the ground loads when the building loads are highly unbalanced and/or when the borefield is undersized; (ii) to reduce the investment costs of the HVAC system by choosing a total BHE field length reduced with respect to the design one; (iii) to increase the seasonal efficiency compared to that of a traditional ASHP; and (iv) to replace traditional GCHPs when the borehole field has been poorly designed or becomes undersized over time due to the increase/unbalancing of the building loads. Regarding the latter point, the ground load can increase e.g., if a building undergoes an expansion of the heated volume, or if the same borefield is intended to serve multiple neighboring buildings. In such cases, replacing only the heat generator while maintaining the existing BHE field is a viable solution.
In future research activities, the influence of the selected number of RDs on the HP efficiency will be examined by choosing more than two RDs. Additionally, less undersized borefield configurations will be examined.
Author Contributions
Conceptualization, M.D., C.N. (Claudia Naldi) and G.L.M.; methodology, C.N. (Christian Natale) and M.D.; software, C.N. (Christian Natale); validation, C.N. (Christian Natale) and C.N. (Claudia Naldi); formal analysis, M.D. and C.N. (Claudia Naldi); investigation, C.N. (Christian Natale), M.D. and C.N. (Claudia Naldi); resources, C.N. (Christian Natale) and M.D.; data curation, C.N. (Christian Natale); writing—original draft preparation, C.N. (Christian Natale) and C.N. (Claudia Naldi); writing—review and editing, M.D.; visualization, C.N. (Christian Natale); supervision, G.L.M.; project administration, G.L.M.; funding acquisition, G.L.M. All authors have read and agreed to the published version of the manuscript.
Funding
This research was funded by PTR Enea 2025-27, Project 1.7. “Tecnologie per la penetrazione efficiente del vettore elettrico negli usi finali”, LA 4.4, and by the National Recovery and Resilience Plan (NRRP), Mission 4 Component 2 Investment 1.5—Call for tender No. 3277 of 30/12/2021 of Italian Ministry of University and Research funded by the European Union—NextGenerationEU; project code ECS00000033, Concession Decree No. 1052 of 23/06/2022 adopted by the Italian Ministry of University and Research, CUP D93C22000460001, “Ecosystem for Sustainable Transition in Emilia-Romagna” (Ecosister), Spoke 4.
Data Availability Statement
The raw data supporting the conclusions of this article will be made available by the authors on request.
Acknowledgments
Authors wish to acknowledge the assistance of Corrado Camponeschi, Alessia Serafini, Valentino Borghi, and Vincenzo Ballerini.
Conflicts of Interest
The authors declare no conflicts of interest. The funders had no role in the design of the study; in the collection, analyses, or interpretation of data; in the writing of the manuscript; or in the decision to publish the results.
Abbreviations
The following abbreviations are used in this manuscript:
| Nomenclature |
| τd | Duration of representative day [s] |
| Δ | Uncertainty |
| cp | Specific thermal capacity [J kg−1 K−1] |
| E | Energy [kWh or MWh] |
| Irr | Irradiance [W m−2] |
| L | Length [m] |
| ṁ | Water flow rate [kg s−1] |
| ndays | Number of representative days |
| p | Pressure [barg] |
| P | Power [W] |
| q | Thermal power per unit length [W m−1] |
| T | Temperature [°C] |
| Subscript |
| cond | Condensation |
| el | Electric |
| evap | Evaporation |
| ext | External |
| in | HP inlet |
| nom | Nominal |
| on | HP active |
| out | HP outlet |
| seas | Seasonal |
| sim | Simulation |
| th | Thermal |
| Acronyms |
| ASHP | Air-source heat pump |
| BHE | Borehole heat exchanger |
| CC | Climatic chamber |
| COP | Coefficient of performance |
| CP | Charge percentage [%] |
| CTSS | Component test system simulation |
| CWTES | Cold water thermal energy storage |
| DCOPnet | Daily net coefficient of performance |
| DSHP | Dual-source heat pump |
| DTS | Distributed temperature sensing |
| GCHP | Ground-coupled heat pump |
| HiL | Hardware-in-the-loop |
| HP | Heat pump |
| HWTES | Hot water thermal energy storage |
| PAM | Partitioning around medoids |
| RD | Representative day |
| SCOPnet | Seasonal net coefficient of performance |
| SPF | Seasonal performance factor |
References
- European Parliament and Council, REPowerEU Plan. Communication from the Commission to the European Parliament, the European Council, the European Economic and Social Committee and the Committee of the Regions. Available online: https://eur-lex.europa.eu/legal-content/EN/TXT/?uri=COM%3A2022%3A230%3AFIN&qid=1653033742483 (accessed on 12 May 2025).
- European Parliament and Council, ’Fit for 55’: Delivering the EU’s 2030 Climate Target on the Way to Climate Neutrality. Available online: https://eur-lex.europa.eu/legal-content/EN/TXT/?uri=CELEX%3A52021DC0550 (accessed on 12 May 2025).
- European Parliament and Council, EPBD. Directive (EU) 2024/1275 of the European Parliament and of the Council of 24 April 2024 on the Energy Performance of Buildings (Recast). Available online: https://eur-lex.europa.eu/legal-content/EN/TXT/?uri=CELEX%3A32024L1275 (accessed on 12 May 2025).
- European Parliament and Council. Directive (EU) 2018/2001 of the European Parliament and of the Council of 11 December 2018 on the Promotion of the Use of Energy from Renewable Sources, Official Journal of the European Union; European Parliament and Council, Directive (EU): Brussels, Belgium, 2018. [Google Scholar]
- Madonna, F.; Bazzocchi, F. Annual performances of reversible air-to-water heat pumps in small residential buildings. Energy Build. 2013, 65, 299–309. [Google Scholar] [CrossRef]
- Fotiou, T.; Fragkos, P.; Zisarou, E. Decarbonising the EU Buildings|Model-Based Insights from European Countries. Climate 2024, 12, 85. [Google Scholar] [CrossRef]
- Michaelides, E.E. Energy Efficiency and the Transition to Renewables—Building Communities of the Future. Energies 2025, 18, 1778. [Google Scholar] [CrossRef]
- Khan, A.; Bradshaw, C.R. Quantitative comparison of the performance of vapor compression cycles with compressor vapor or liquid injection. Int. J. Refrig. 2023, 154, 386–394. [Google Scholar] [CrossRef]
- Hermes, C.J.L.; Boeng, J.; da Silva, D.L.; Knabben, F.T.; Sommers, A.D. Evaporator Frosting in Refrigerating Appliances: Fundamentals and Applications. Energies 2021, 14, 5991. [Google Scholar] [CrossRef]
- Vocale, P.; Morini, G.L.; Spiga, M. Influence of outdoor air conditions on the air source heat pumps performance. Energy Procedia 2014, 45, 653–662. [Google Scholar] [CrossRef]
- Song, M.; Deng, S.; Dang, C.; Mao, N.; Wang, Z. Review on improvement for air source heat pump units during frosting and defrosting. Appl. Energy 2018, 211, 1150–1170. [Google Scholar] [CrossRef]
- Sameer, H.; Behem, G.; Mostert, C.; Bringezu, S. Comparative Analysis of Resource and Climate Footprints for Different Heating Systems in Building Information Modeling. Buildings 2022, 12, 1824. [Google Scholar] [CrossRef]
- Rivoire, M.; Casasso, A.; Piga, B.; Sethi, R. Assessment of Energetic, Economic and Environmental Performance of Ground-Coupled Heat Pumps. Energies 2018, 11, 1941. [Google Scholar] [CrossRef]
- Reum, T.; Schmitt, D.; Summ, T.; Trinkl, C.; Ochs, F.; Schrag, T. Experimental analysis of parallel operation of two heat sources in a dual-source heat pump incorporating two compressors. Int. J. Refrig. 2025, 171, 124–138. [Google Scholar] [CrossRef]
- Corberán, J.M.; Cazorla-Marín, A.; Marchante-Avellaneda, J.; Montagud, C. Dual source heat pump, a high efficiency and cost-effective alternative for heating, cooling and DHW production. Int. J. Low. Carbon. Technol. 2018, 13, 161–176. [Google Scholar] [CrossRef]
- Cannistraro, M.; Mainardi, E.; Bottarelli, M. Testing a dual-source heat pump. Math. Model. Eng. Probl. 2018, 5, 205–210. [Google Scholar] [CrossRef]
- Grossi, I.; Dongellini, M.; Piazzi, A.; Morini, G.L. Dynamic modelling and energy performance analysis of an innovative dual-source heat pump system. Appl. Therm. Eng. 2018, 142, 745–759. [Google Scholar] [CrossRef]
- Marinelli, S.; Lolli, F.; Butturi, M.A.; Rimini, B.; Gamberini, R. Environmental performance analysis of a dual-source heat pump system. Energy Build. 2020, 223, 110180. [Google Scholar] [CrossRef]
- Elshehabi, T.; Alfehaid, M. Sustainable Geothermal Energy: A Review of Challenges and Opportunities in Deep Wells and Shallow Heat Pumps for Transitioning Professionals. Energies 2025, 18, 811. [Google Scholar] [CrossRef]
- ASHRAE. ASHRAE Handbook 2007—HVAC Applications; ASHRAE: Atlanta, GA, USA, 2007; Chapter 32. [Google Scholar]
- Morchio, S.; Fossa, M.; Priarone, A.; Memme, S. Extended version at 25 years of the ASHRAE-Tp8 method for the design of BHE fields operating with geothermal heat pumps. Geothermics 2024, 123, 103128. [Google Scholar] [CrossRef]
- Fujii, H.; Okubo, h.; Nishi, k.; Itoi, R.; Ohyama, K.; Shibata, K. An improved thermal response test for U-tube ground heat exchanger based on optical fiber thermometers. Geothermics 2009, 38, 399–406. [Google Scholar] [CrossRef]
- Aranzabal, N.; Martos, J.; Stokuca, M.; Mazzotti Pallard, W.; Acuña, J.; Soret, J.; Blum, P. Novel instruments and methods to estimate depth-specific thermal properties in borehole heat exchangers. Geothermics 2020, 86, 101813. [Google Scholar] [CrossRef]
- EN 14825:2022; Air Conditioners, Liquid Chilling Packages and Heat Pumps, with Electrically Driven Compressors, for Space Heating and Cooling, Commercial and Process Cooling—Testing and Rating at Part Load Conditions and Calculation of Seasonal Performance. CEN: Brussels, Belgium, 2022.
- Ballerini, V.; Lubowicka, B.; Valdiserri, P.; Krawczyk, D.A.; Sadowska, B.; Kłopotowski, M.; di Schio, E.R. The Energy Retrofit Impact in Public Buildings: A Numerical Cross-Check Supported by Real Consumption Data. Energies 2023, 16, 7748. [Google Scholar] [CrossRef]
- El-Baz, W.; Mayerhofer, L.; Tzscheutschler, P.; Wagner, U. Hardware in the loop real-time simulation for heating systems: Model validation and dynamics analysis. Energies 2018, 11, 3159. [Google Scholar] [CrossRef]
- Conti, P.; Bartoli, C.; Franco, A.; Testi, D. Experimental Analysis of an Air Heat Pump for Heating Service Using a “Hardware-In-The-Loop” System. Energies 2020, 13, 4498. [Google Scholar] [CrossRef]
- Haller, M.Y.; Haberl, R.; Persson, T.; Bales, C.; Kovacs, P.; Chèze, D. Dynamic whole system testing of combined renewable heating systems– the current state of the art. Energy Build. 2013, 66, 667–677. [Google Scholar] [CrossRef]
- Bales, C. Combitest—A New Test Method for Thermal Stores Used in Solar Combi Systems. Ph.D. Thesis, Chalmers University of Technology, Göteborg, Sweden, 2004. [Google Scholar]
- Albaric, M.; Nowag, J.; Papillon, P. Thermal performance evaluation of solar combi systems using a global approach. In Proceedings of the EUROSUN, Lisbon, Portugal, 7–10 October 2008. [Google Scholar]
- Menegon, D.; Soppelsa, A.; Fedrizzi, R. Development of a new dynamic test procedure for the laboratory characterization of a whole heating and cooling system. Appl. Energy 2017, 205, 976–990. [Google Scholar] [CrossRef]
- Dongellini, M.; Ballerini, V.; Morini, G.L.; Naldi, C.; Pulvirenti, B.; Rossi Di Schio, E.; Valdiserri, P. A new climate chamber for air-source and ground-source heat pump testing based on the Hardware-in-the Loop approach: Design and cross validation. J. Build. Eng. 2023, 64, 105661. [Google Scholar] [CrossRef]
- Florides, G.; Kalogirou, S. Ground heat exchangers—A review of systems, models and application. Renew. Energy 2007, 32, 2461–2478. [Google Scholar] [CrossRef]
- Dott, R.; Haller, M.Y.; Ruschenburg, J.; Ochs, F.; Bony, J. The Reference Framework for System Simulations of the IEA SHC Task 44/HPP Annex 38 Part B: Buildings and Space Heat Load; Solar Heating & Cooling Programme, International Energy Agency: Paris, France, 2013. [Google Scholar] [CrossRef]
- Campana, J.P.; Morini, G.L. BESTEST and EN ISO 52016 Benchmarking of ALMABuild, a New Open-Source Simulink Tool for Dynamic Energy Modelling of Buildings. Energies 2019, 12, 2938. [Google Scholar] [CrossRef]
- Campana, J.P. ALMABEST: A new whole building energy simulation Simulink-based tool for NZEB design. Ph.D. Thesis, Alma Mater Studiorum—University of Bologna, Bologna, Italy, 2019. [Google Scholar] [CrossRef]
- CARNOT Toolbox, Ver. 7.3, 05/2022 for Matlab/Simulink R2021b; Solar-Institut Juelich: Aachen, Germany, 2022.
- Kaufman, L.; Rousseeuw, P.J. Finding Groups in Data: An Introduction to Cluster Analysis; John Wiley & Sons: New York, NY, USA, 1990. [Google Scholar]
- Figliola, R.S.; Beasley, D.E. Theory and Design for Mechanical Measurements, 7th ed.; John Wiley & Sons: New York, NY, USA, 2021. [Google Scholar]
| Disclaimer/Publisher’s Note: The statements, opinions and data contained in all publications are solely those of the individual author(s) and contributor(s) and not of MDPI and/or the editor(s). MDPI and/or the editor(s) disclaim responsibility for any injury to people or property resulting from any ideas, methods, instructions or products referred to in the content. |
© 2025 by the authors. Licensee MDPI, Basel, Switzerland. This article is an open access article distributed under the terms and conditions of the Creative Commons Attribution (CC BY) license (https://creativecommons.org/licenses/by/4.0/).


