
Impact of Pore Structure and Hydrate Distribution on CO2-CH4 Replacement in CH4 Hydrate: A Pore-Scale Numerical Analysis


Abstract
1. Introduction
2. Methods
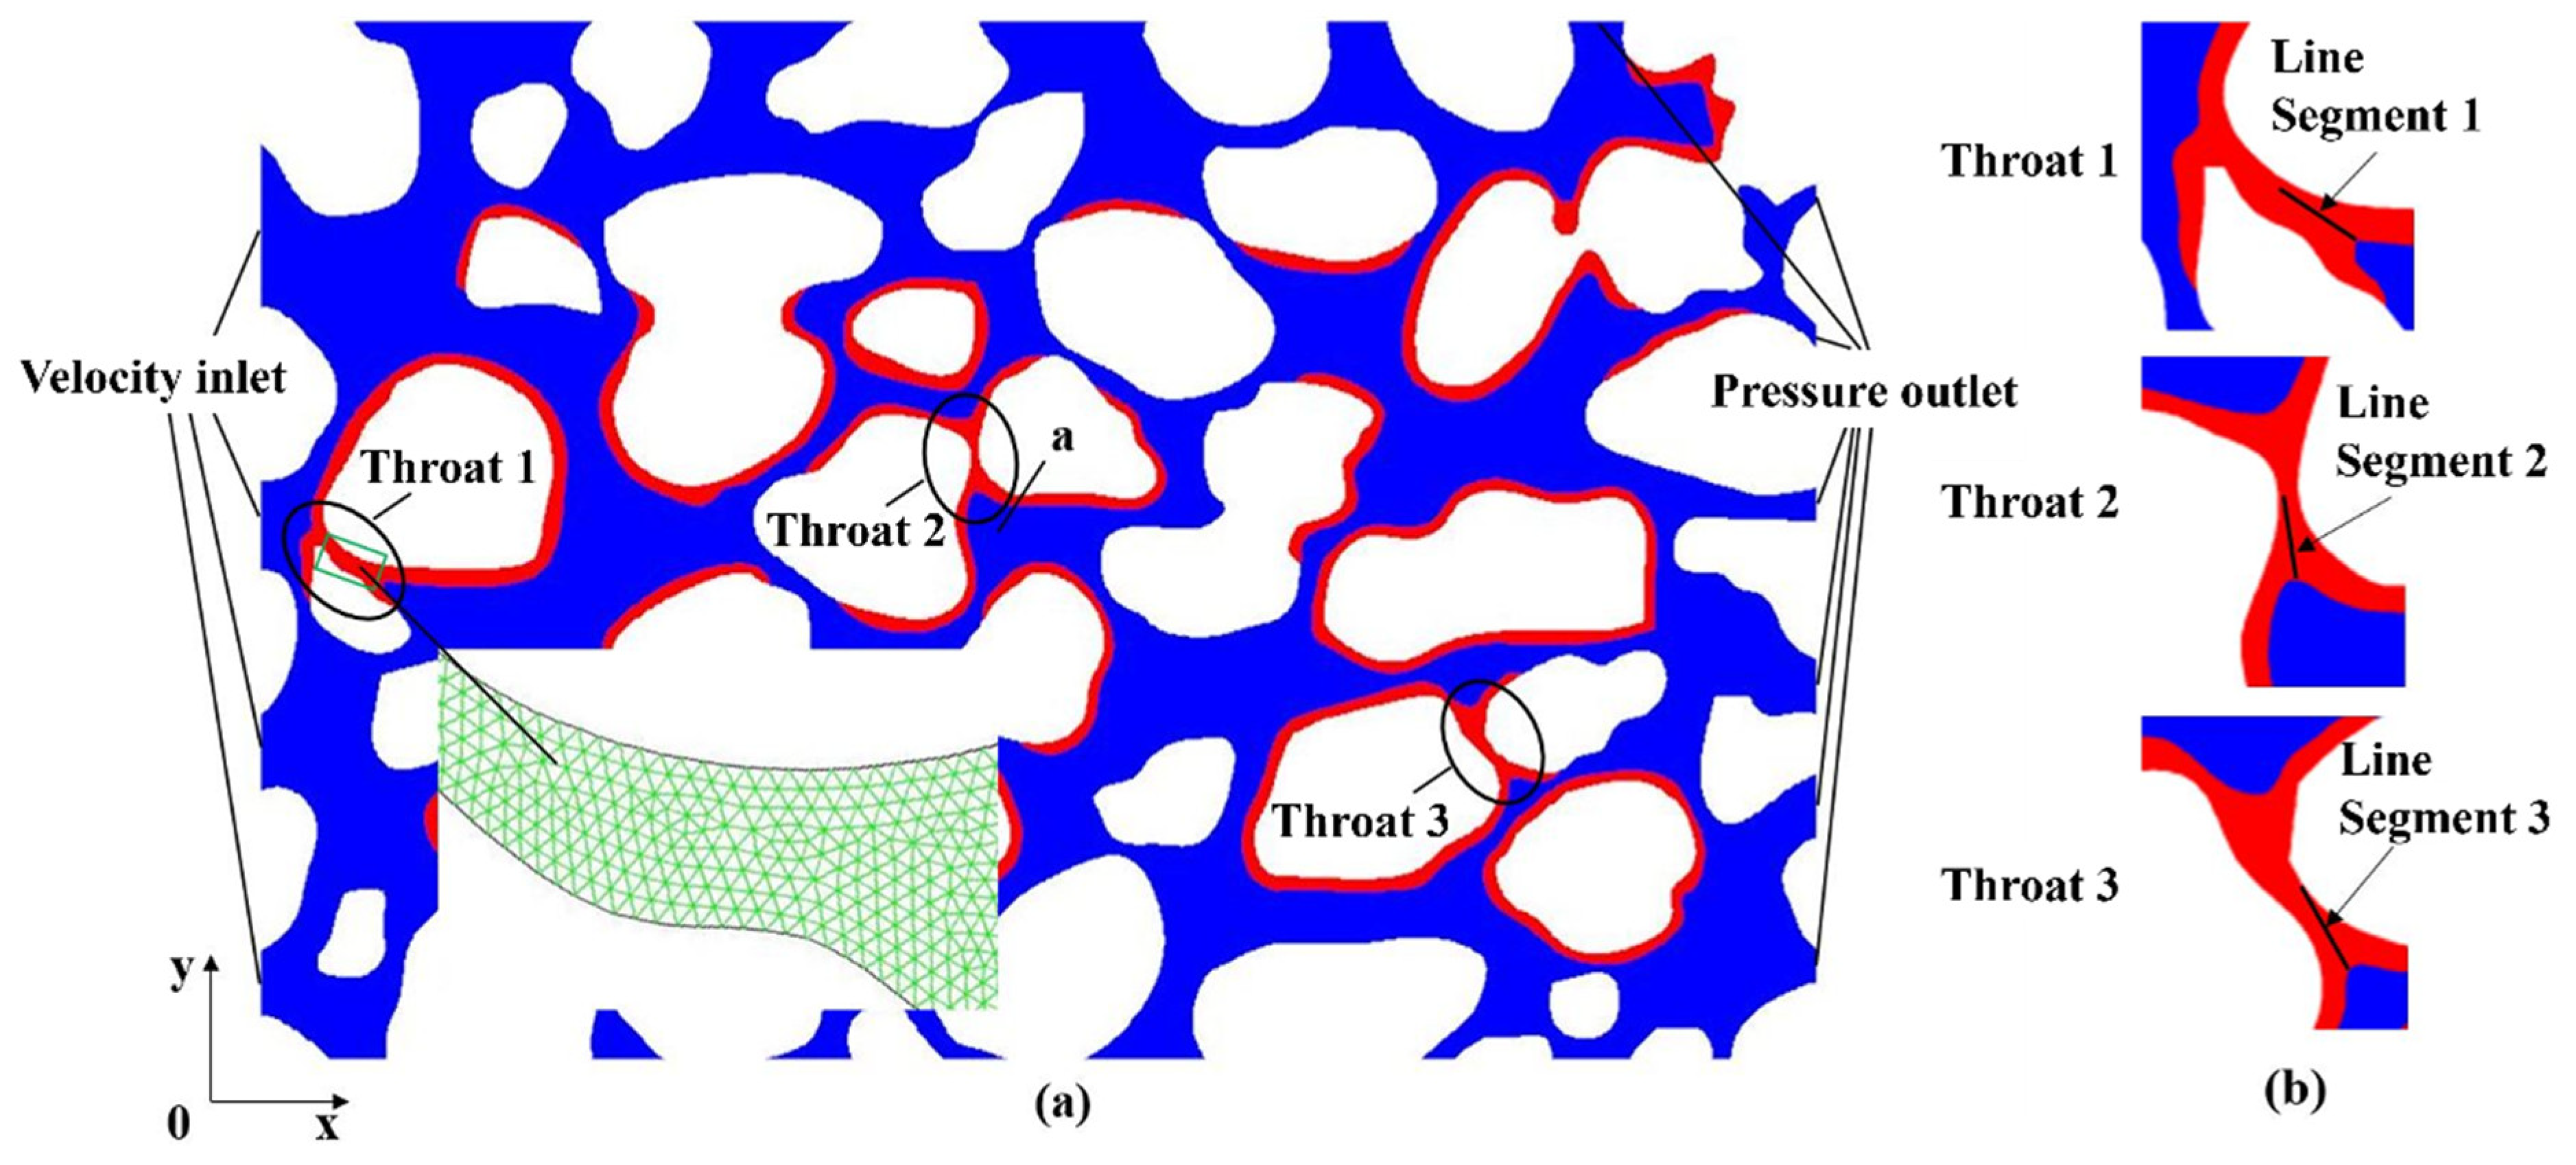
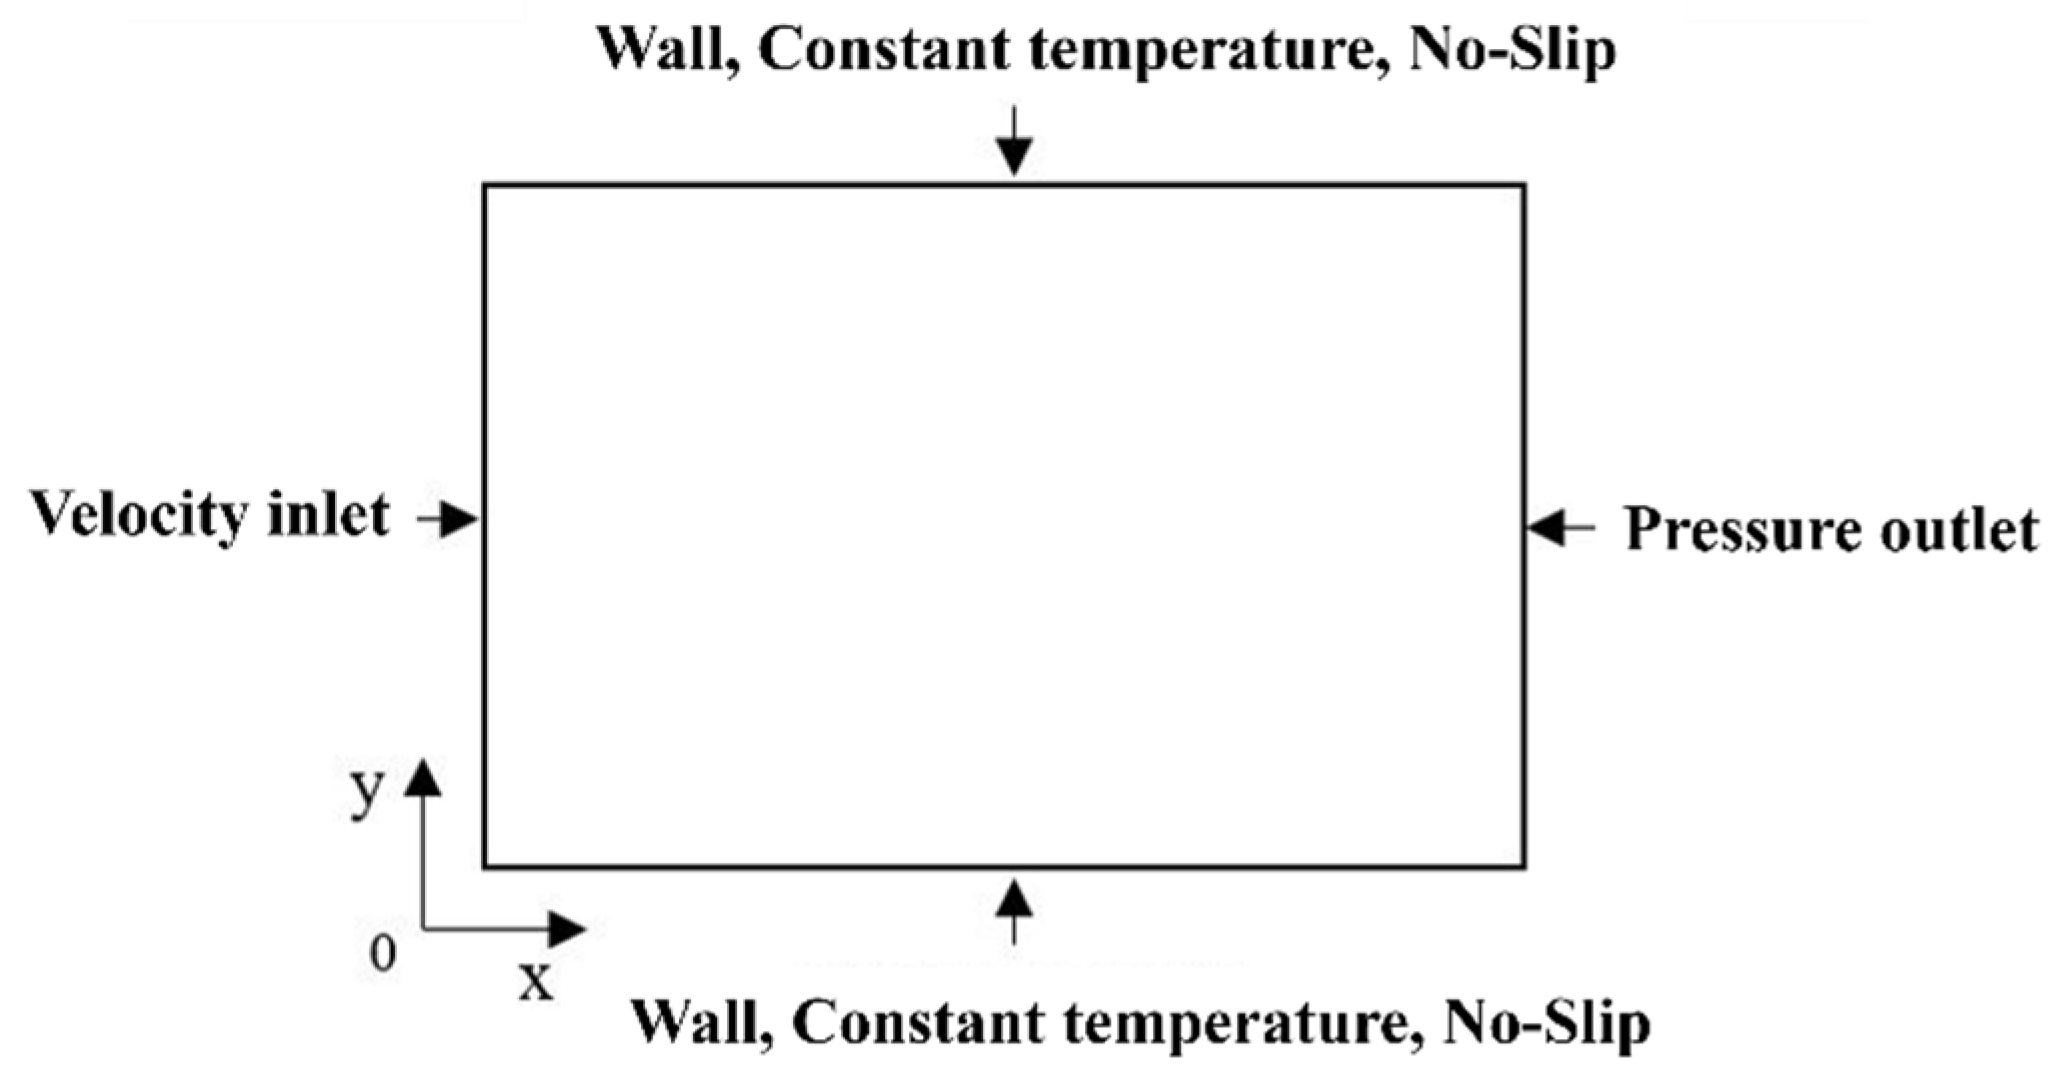
2.1. Physical Model
2.2. Numerical Model
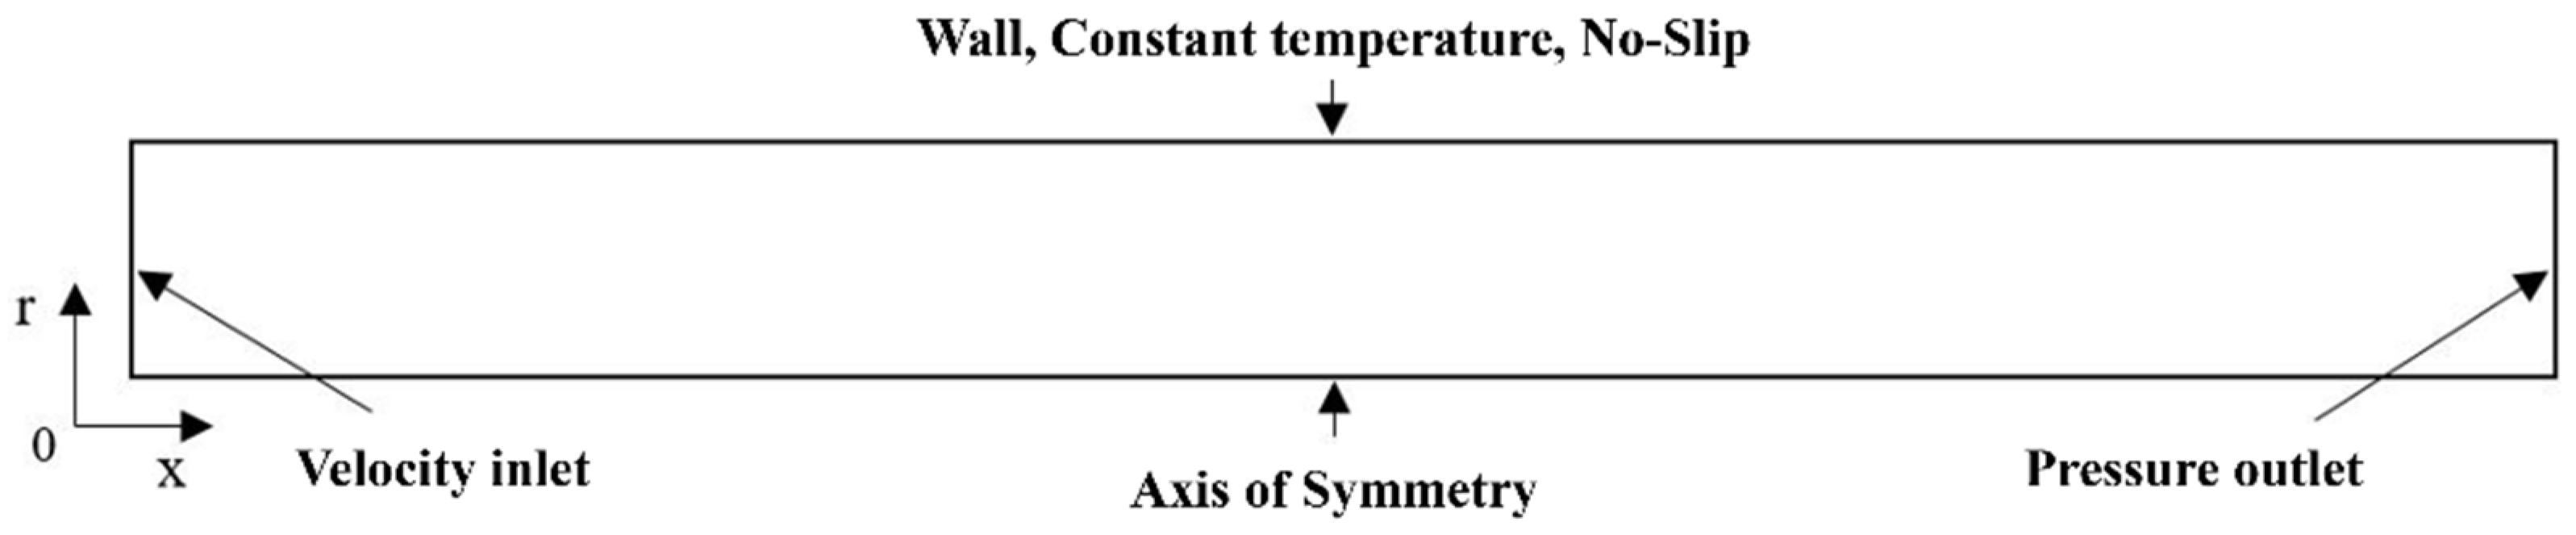
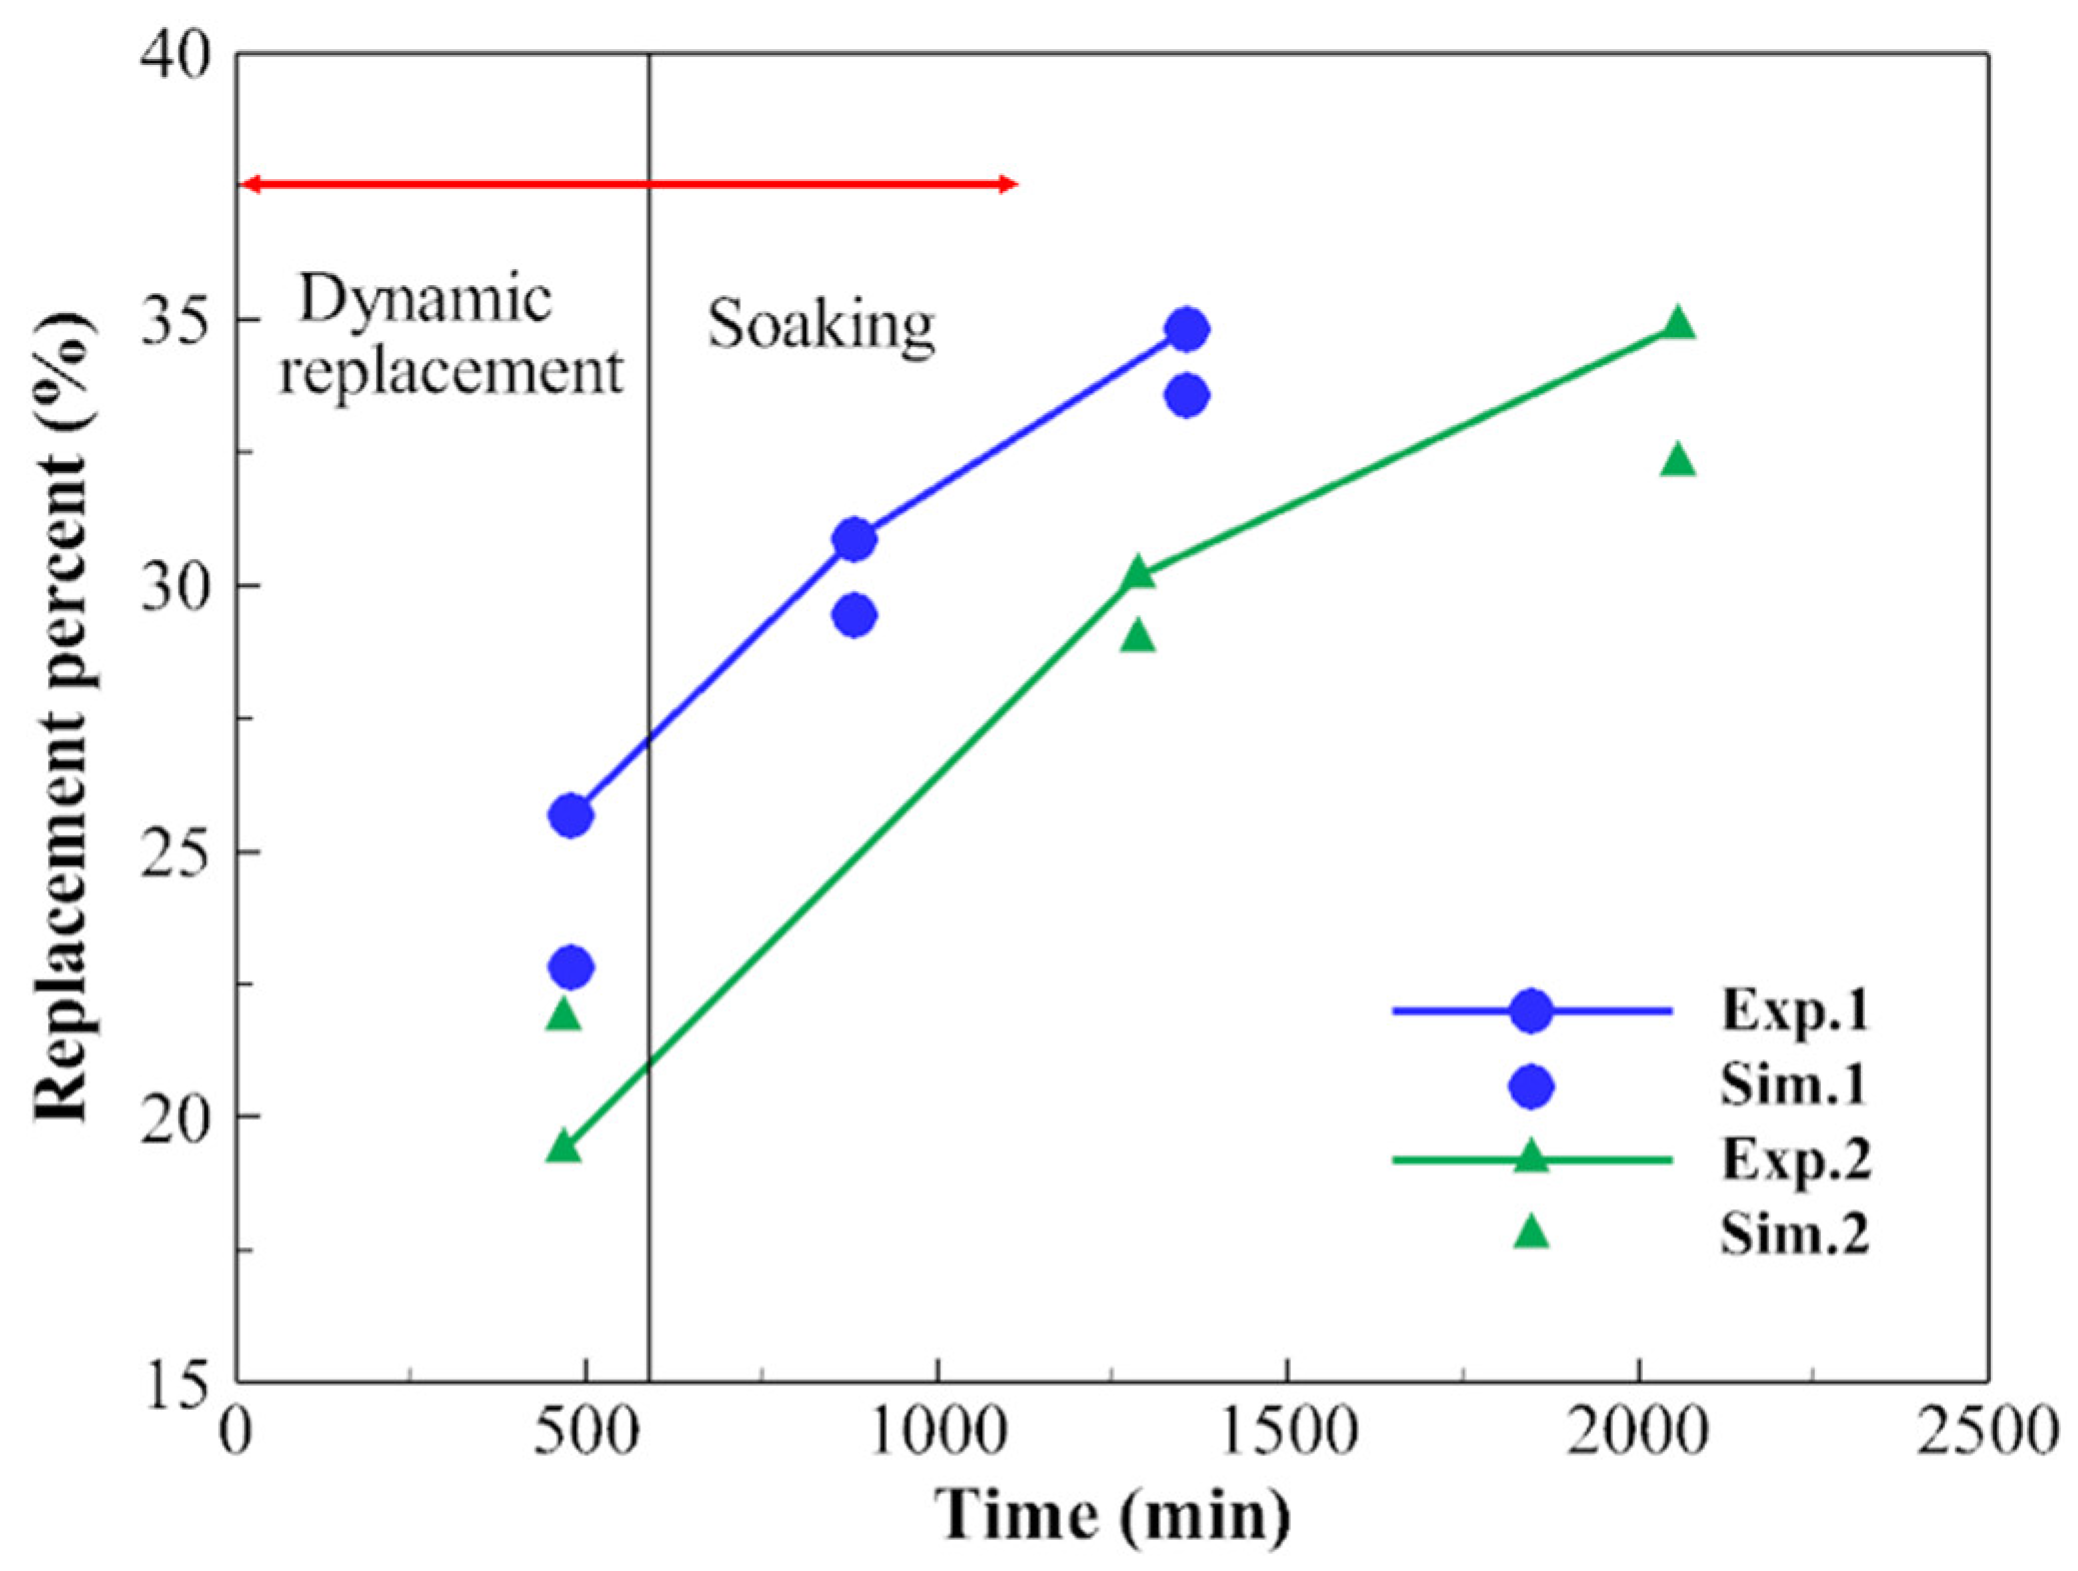
3. Model Validation
4. Results
4.1. Simulation Setup
4.2. Mesh Independence Verification
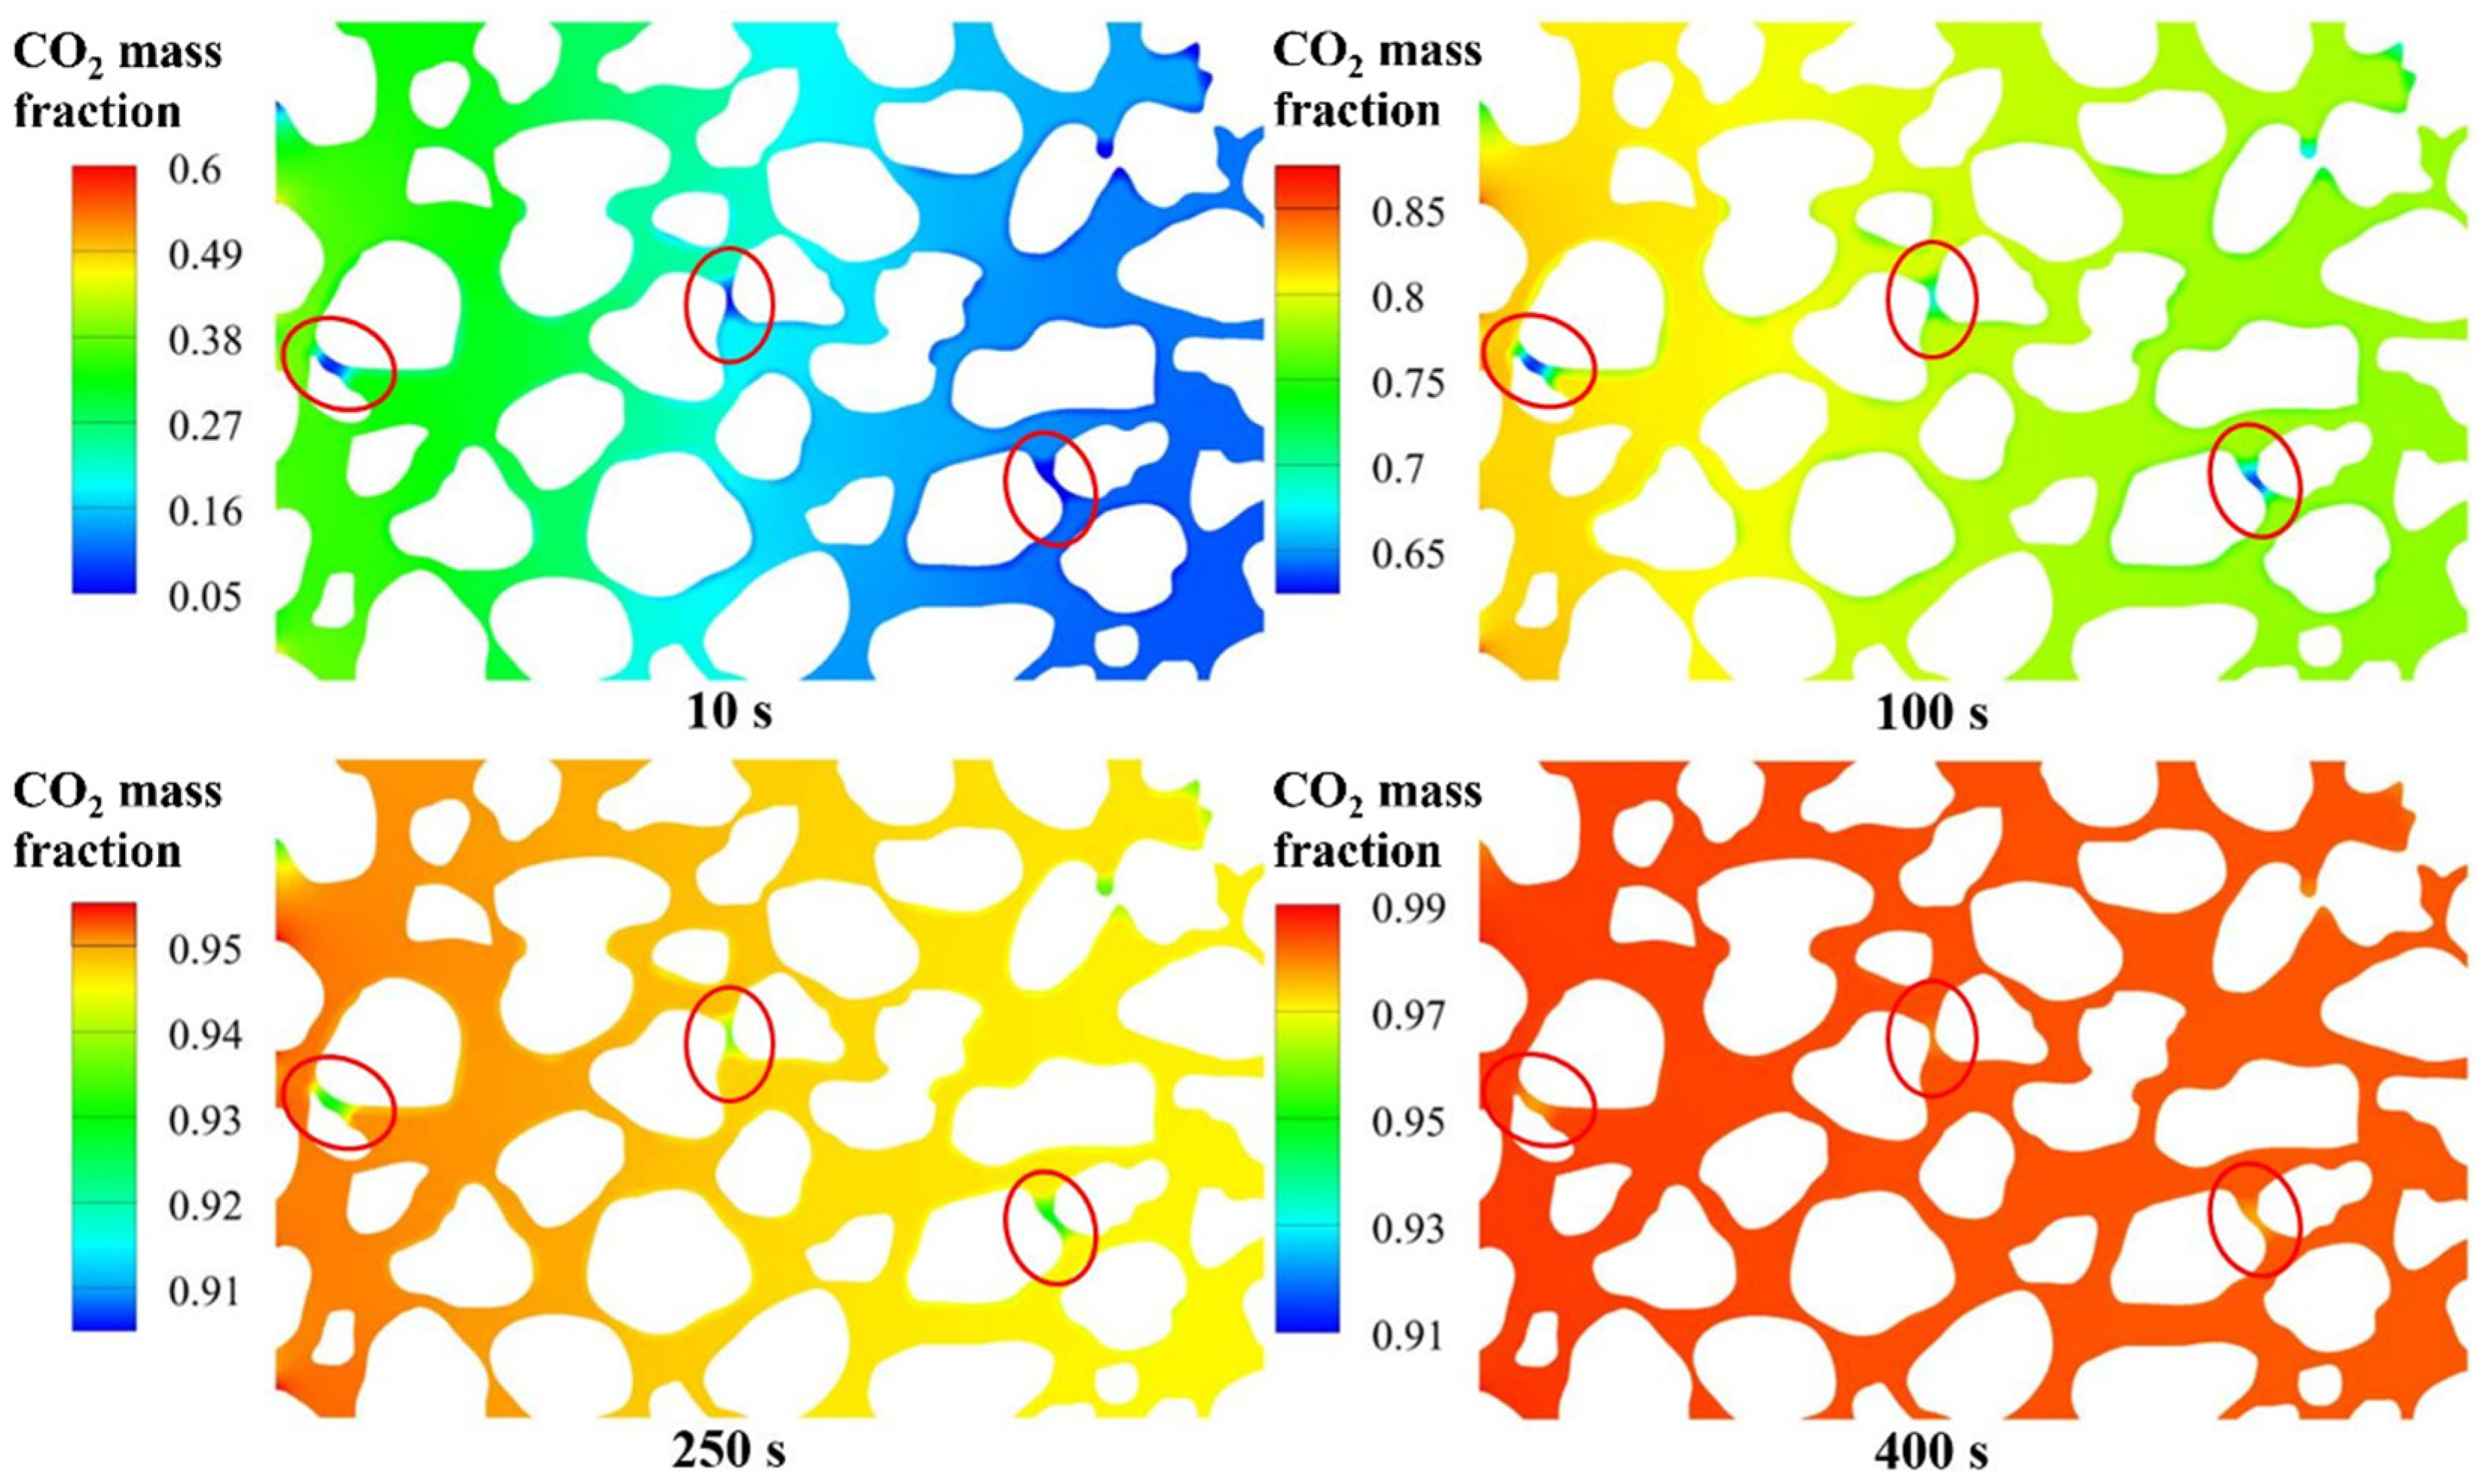
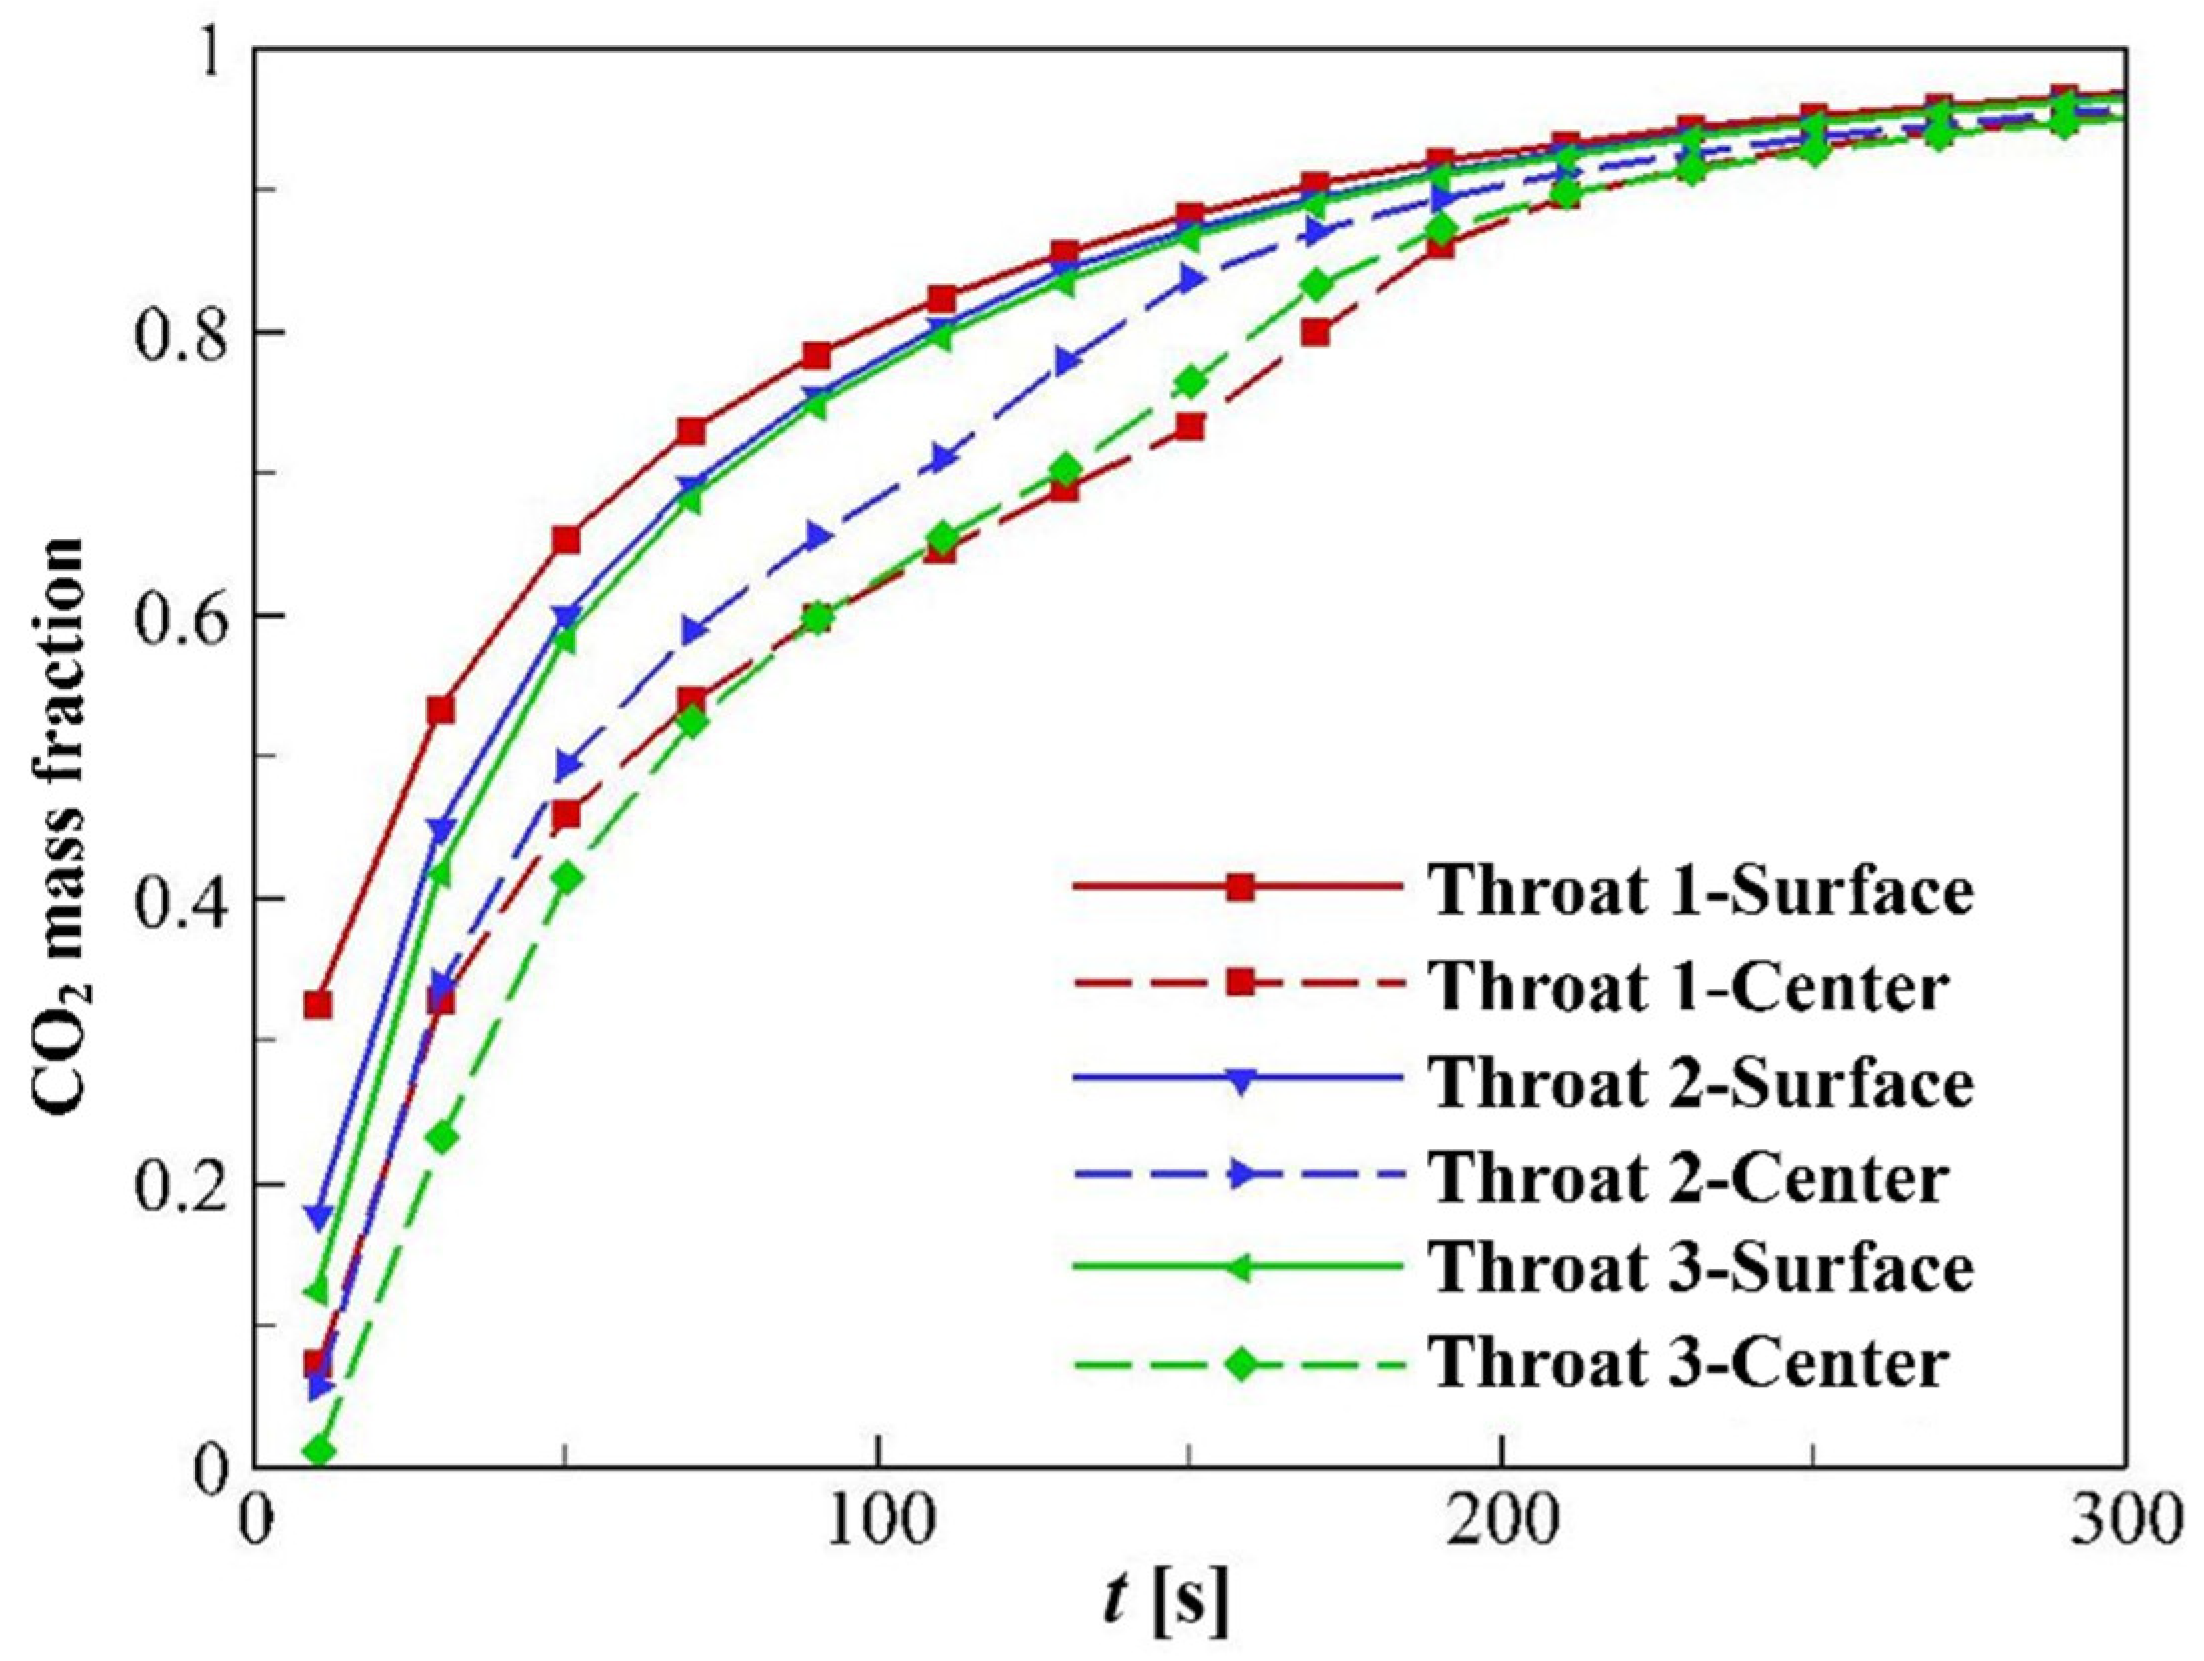
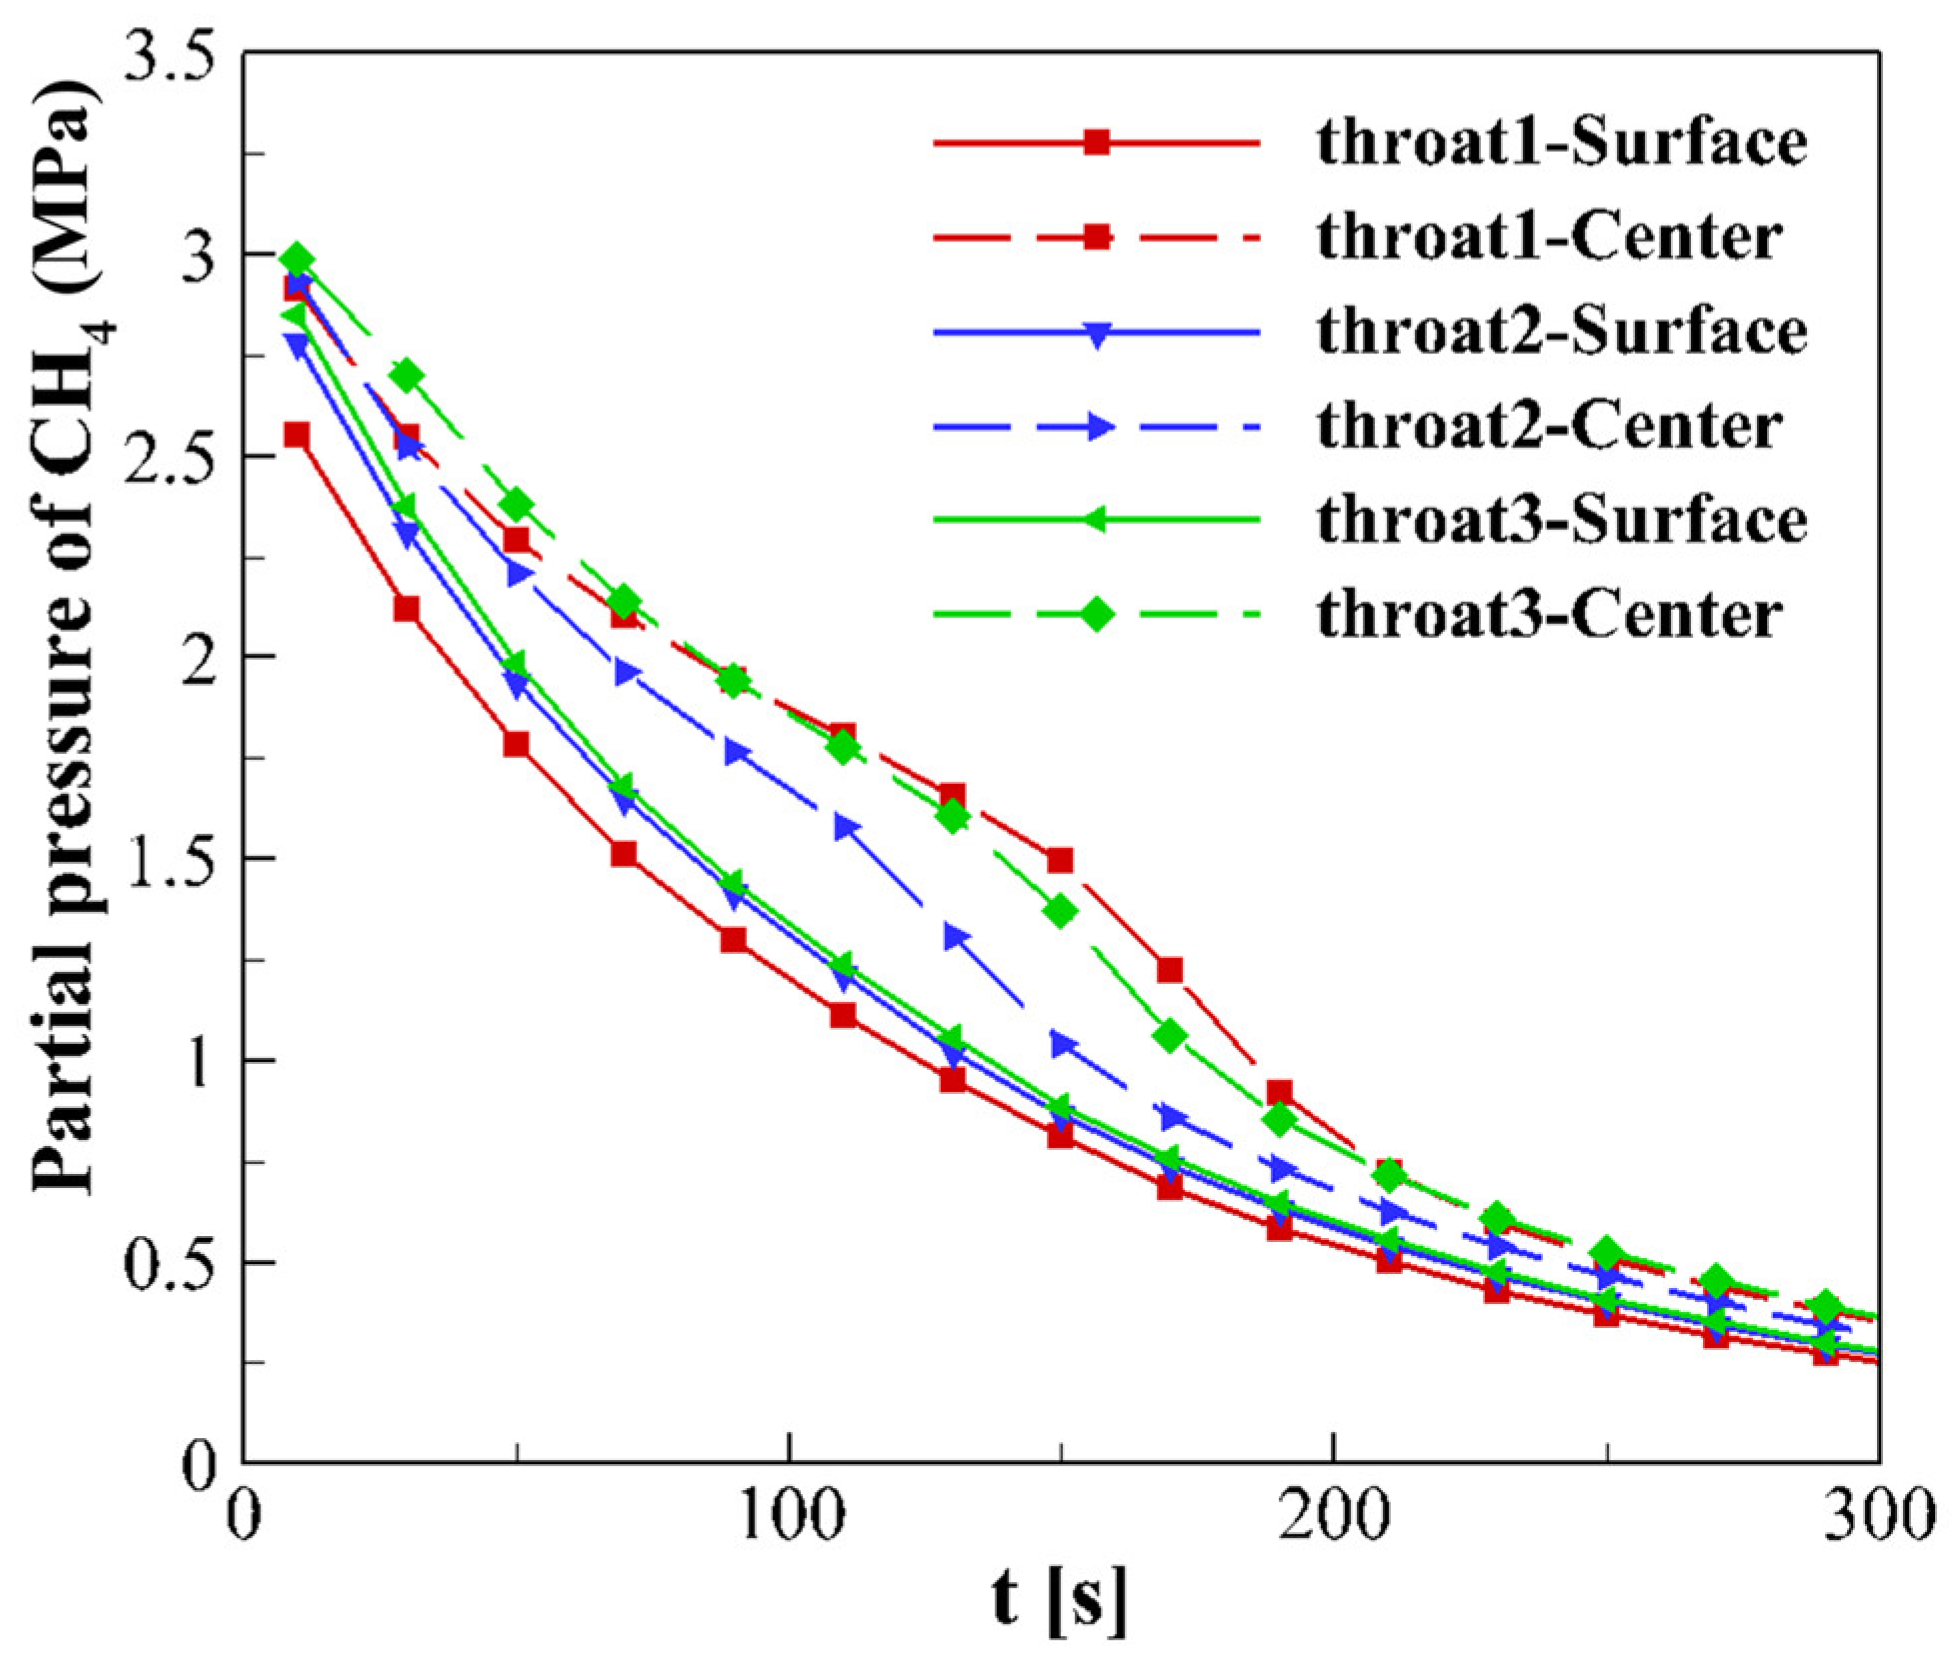
4.3. Replacement Process and Influence of Effective Throat Length
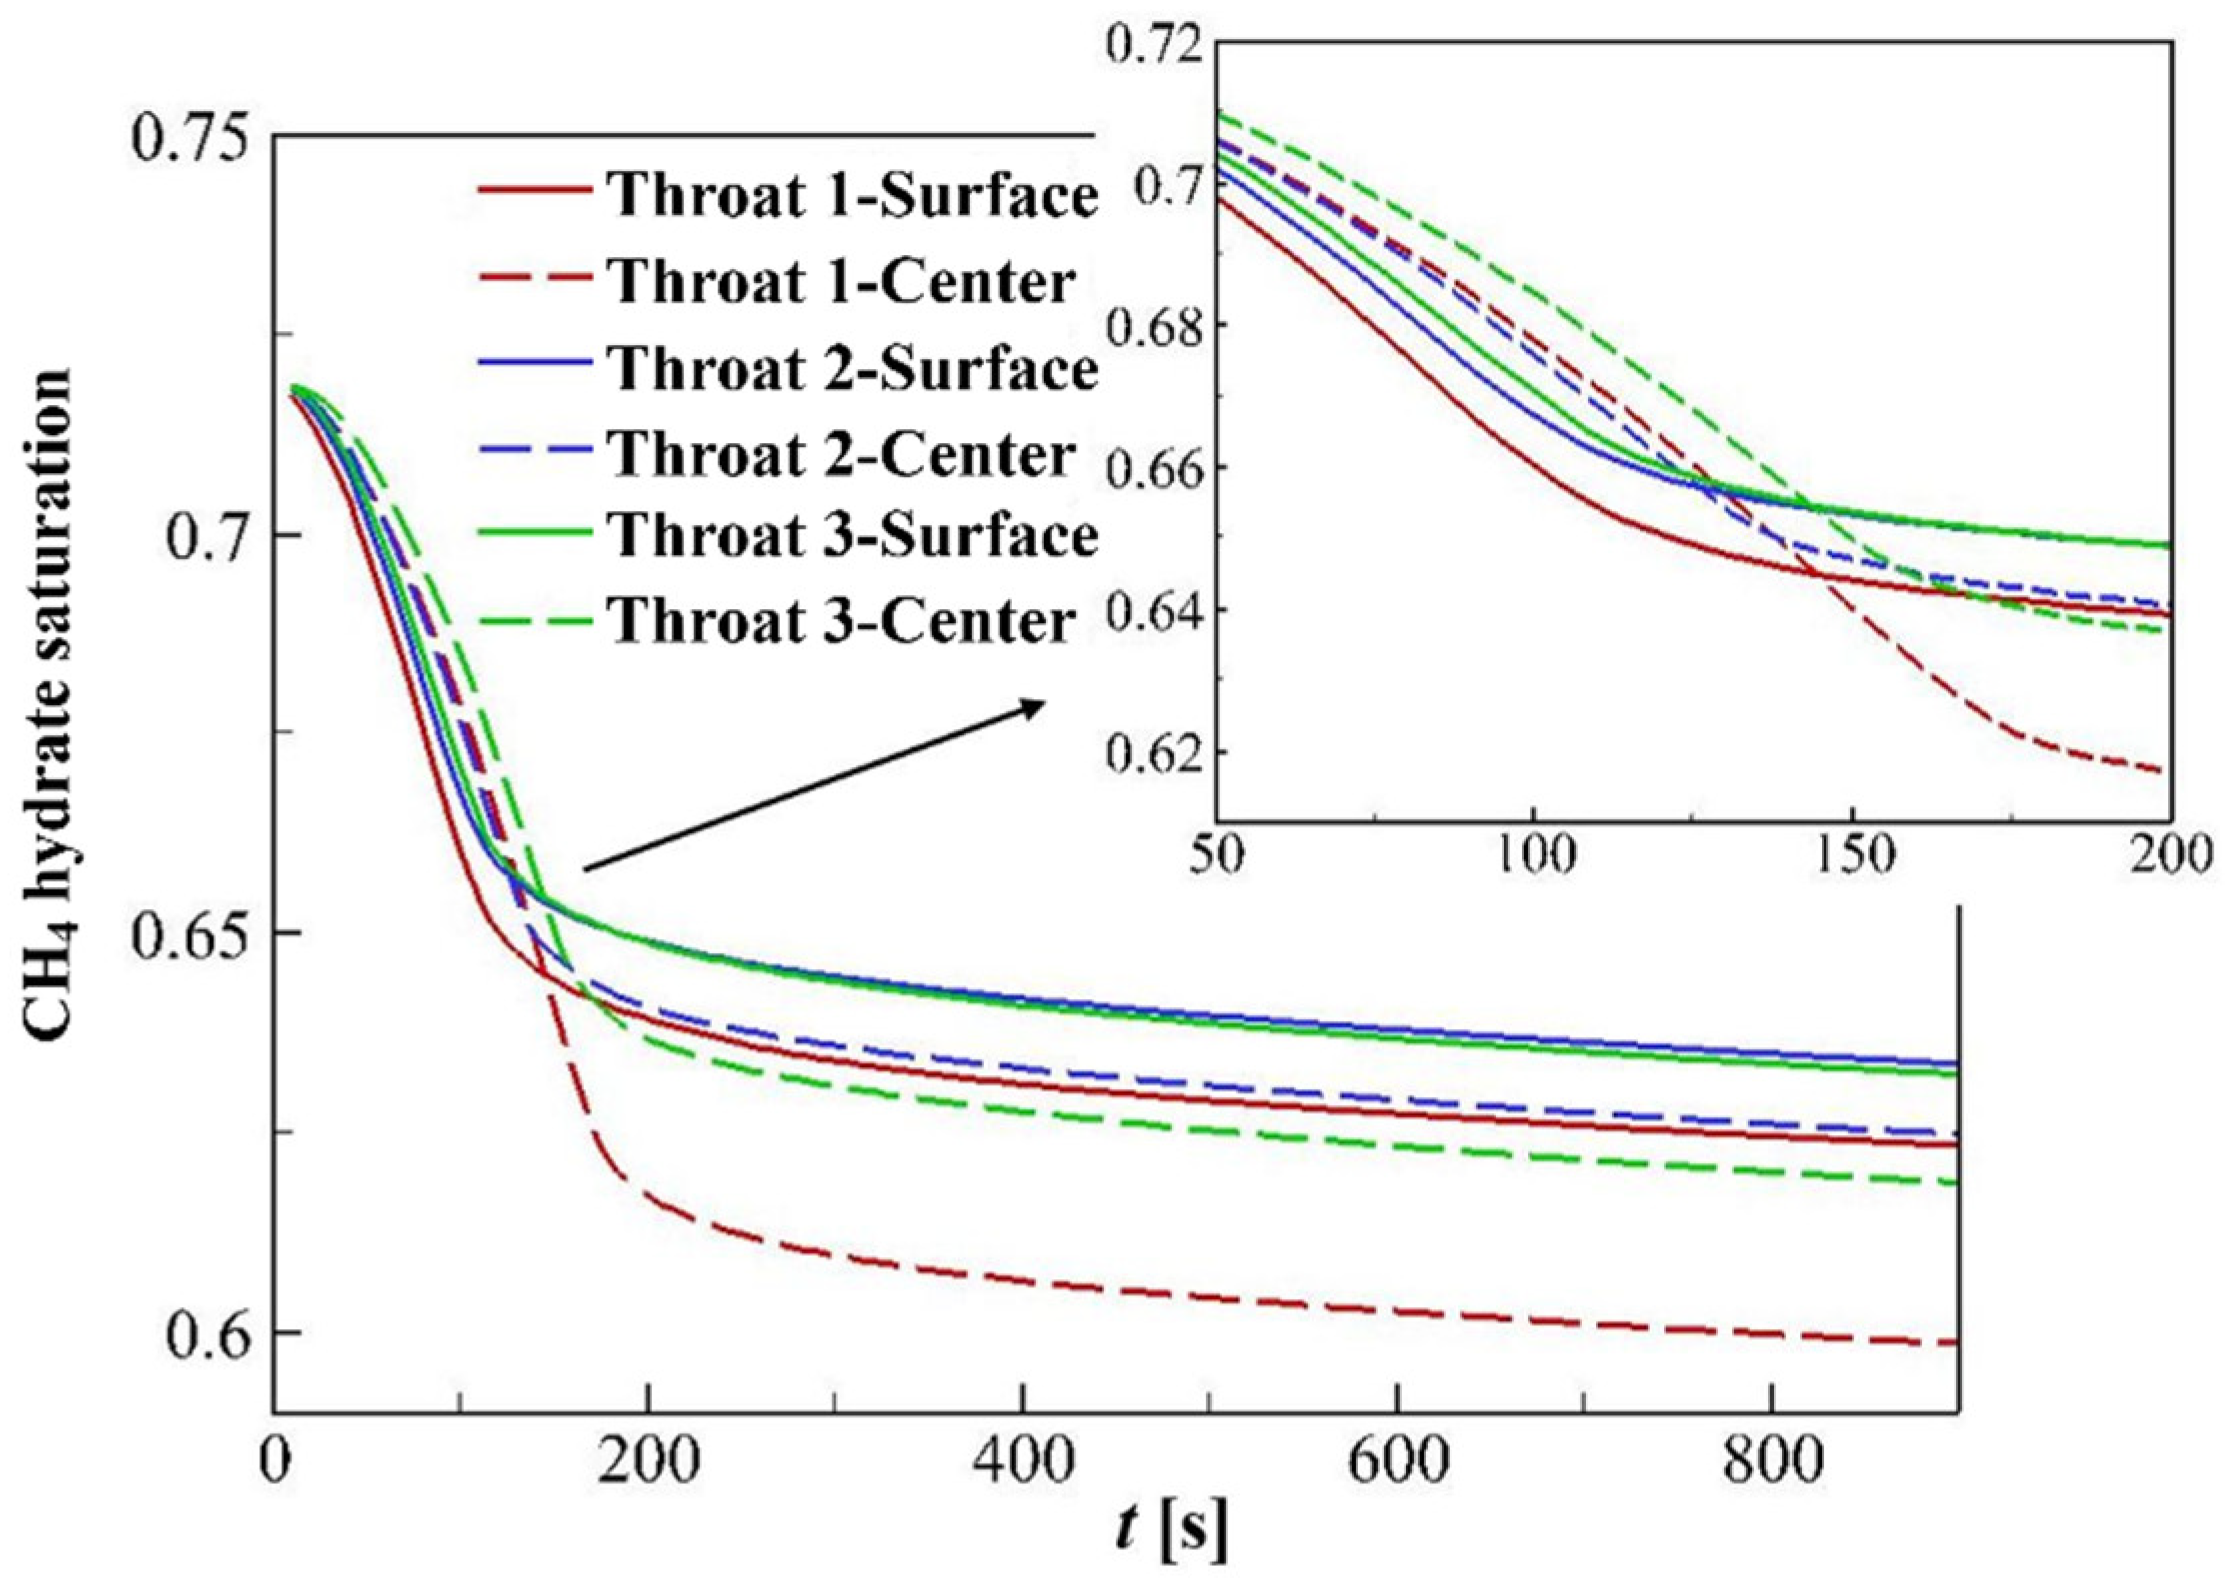
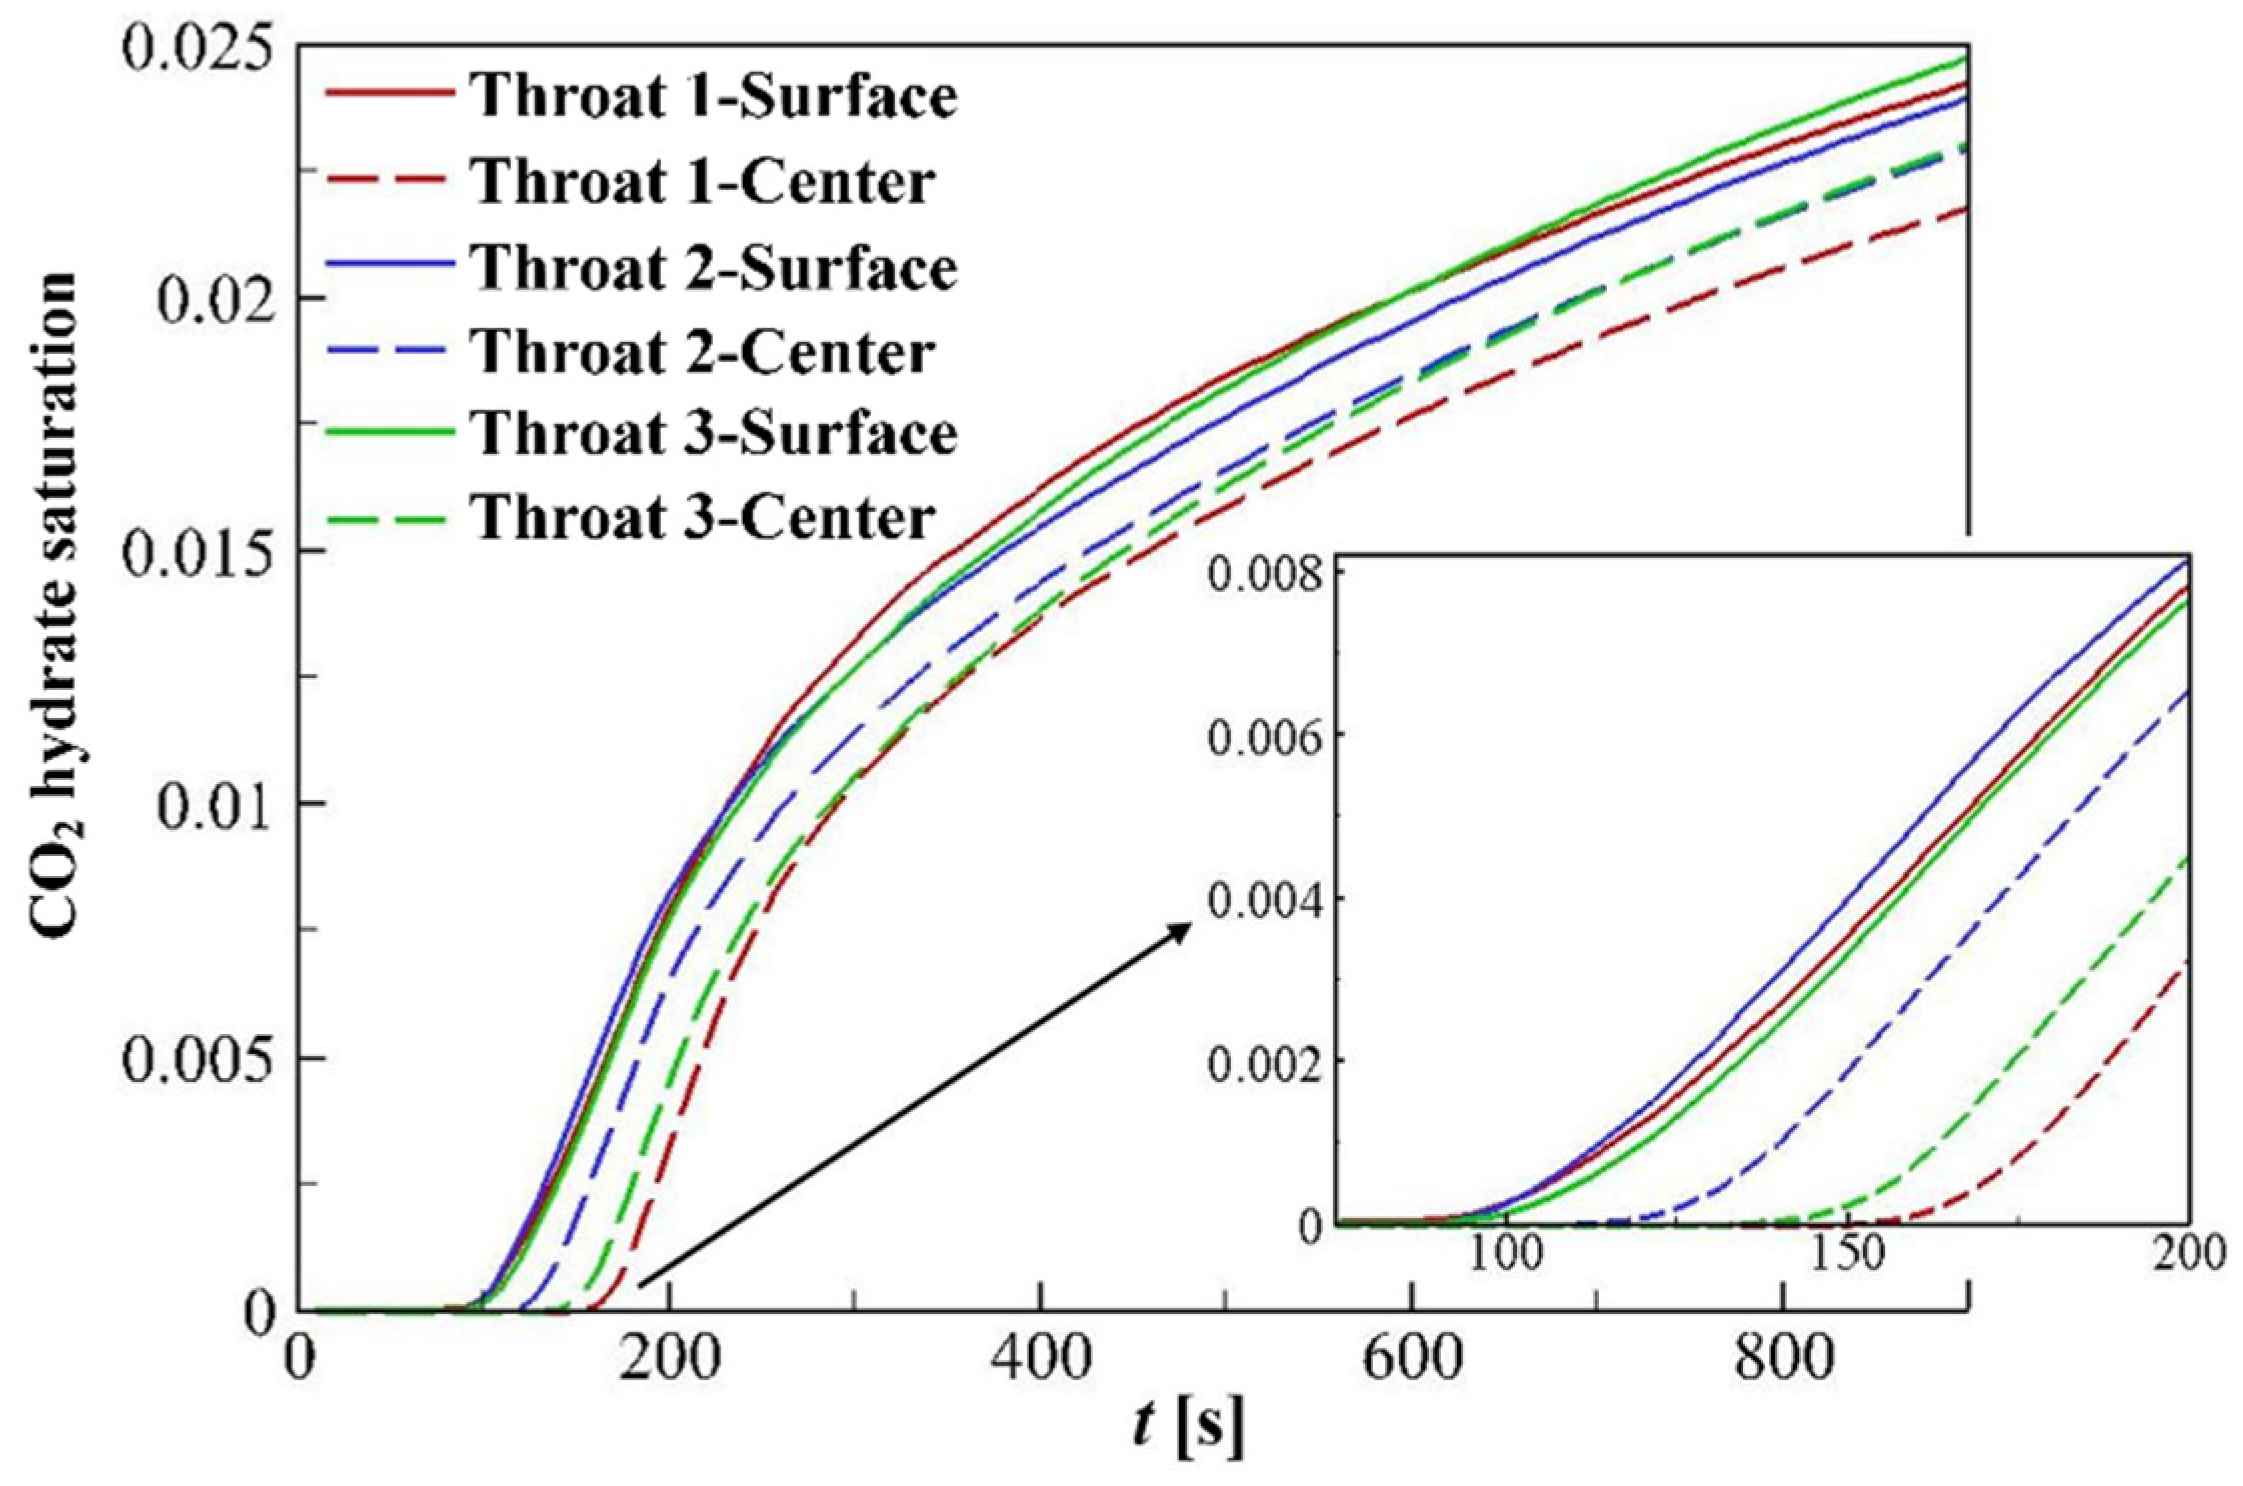
4.3.1. CO2 Mass Fraction and Partial Pressure of CH4
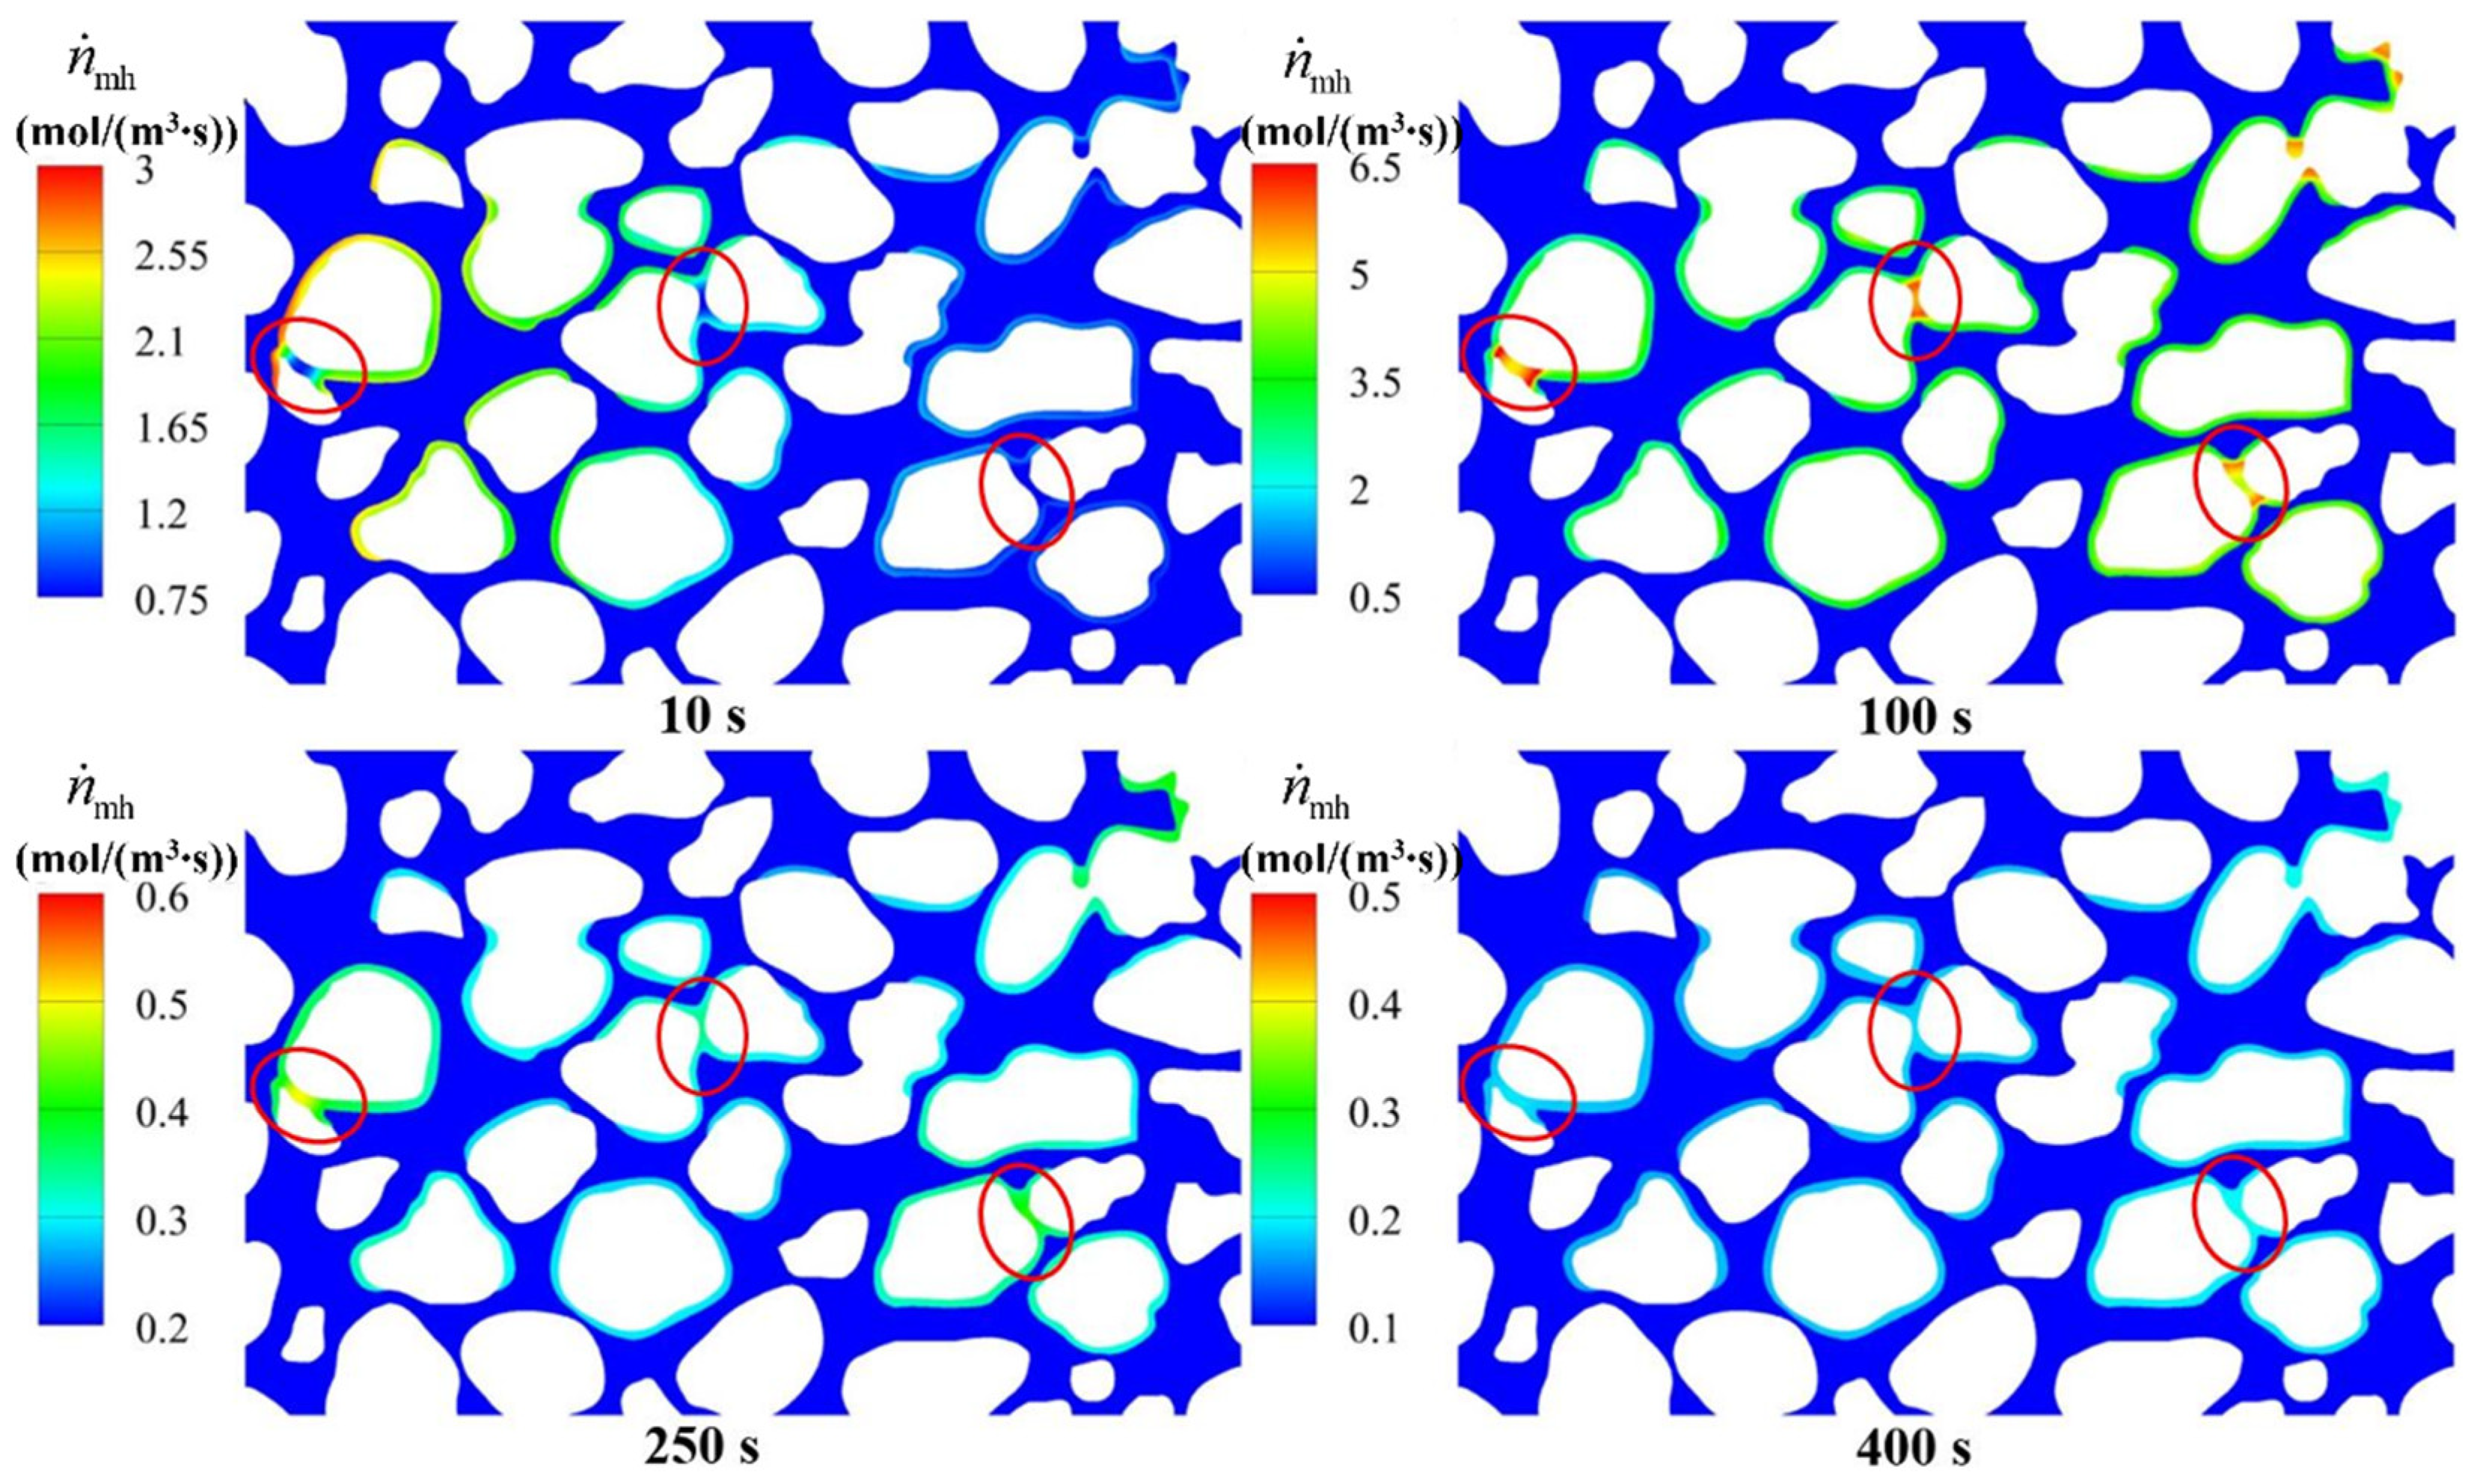
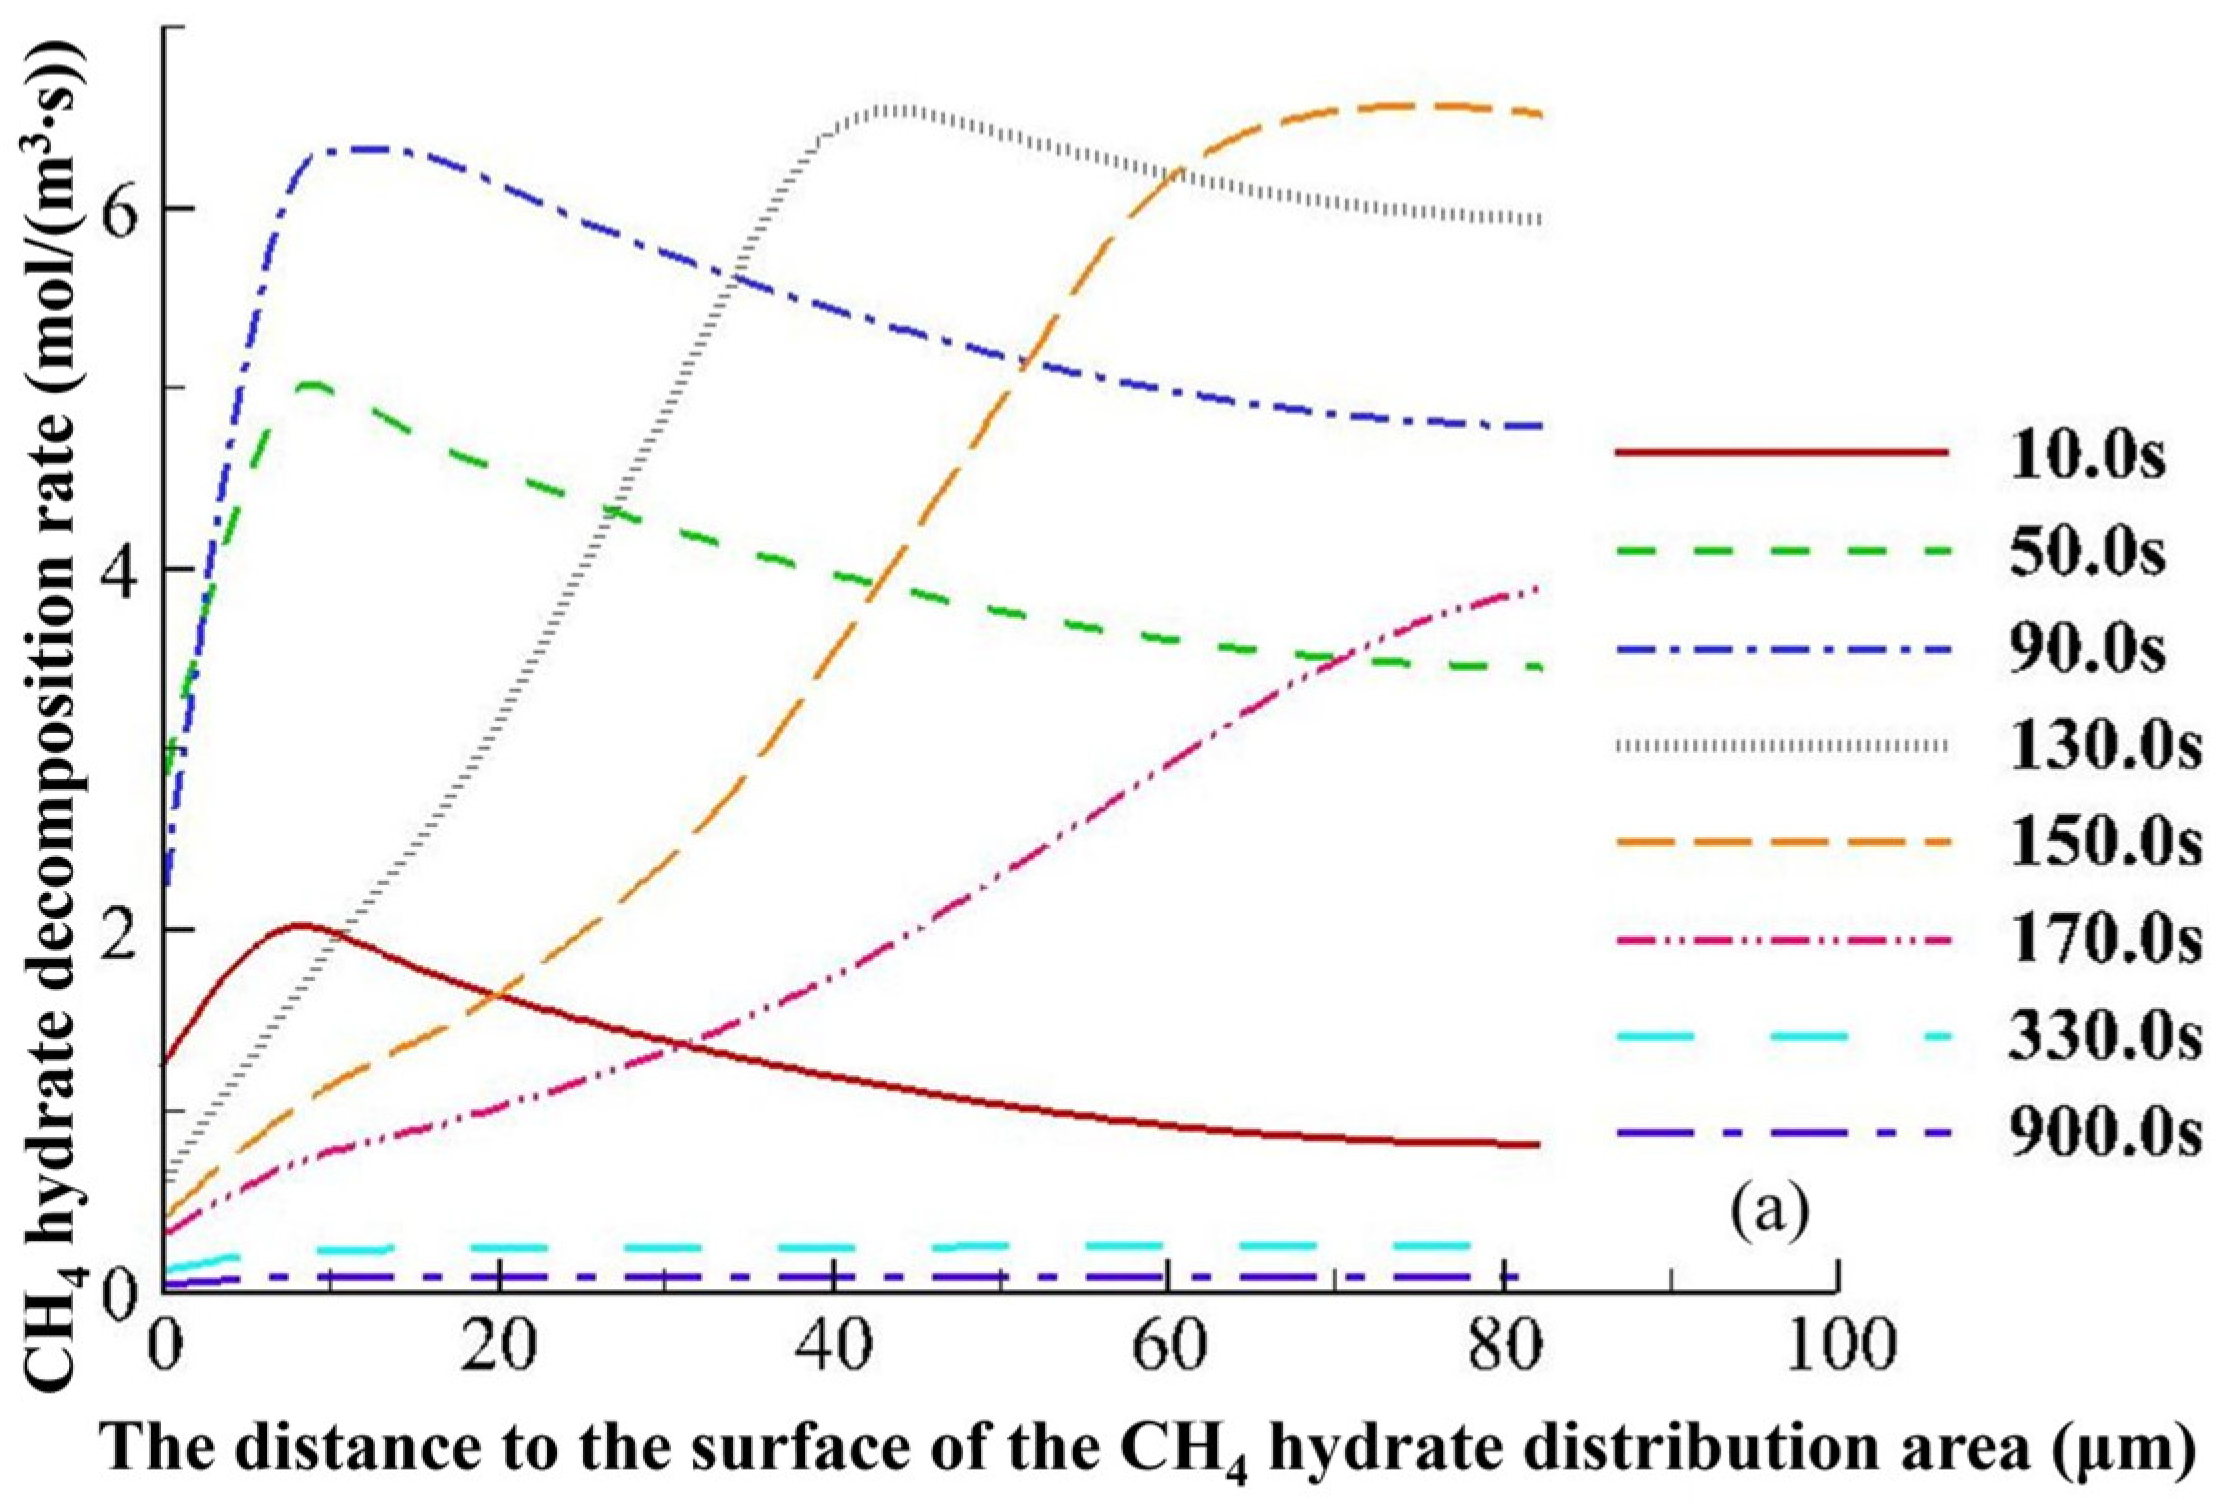
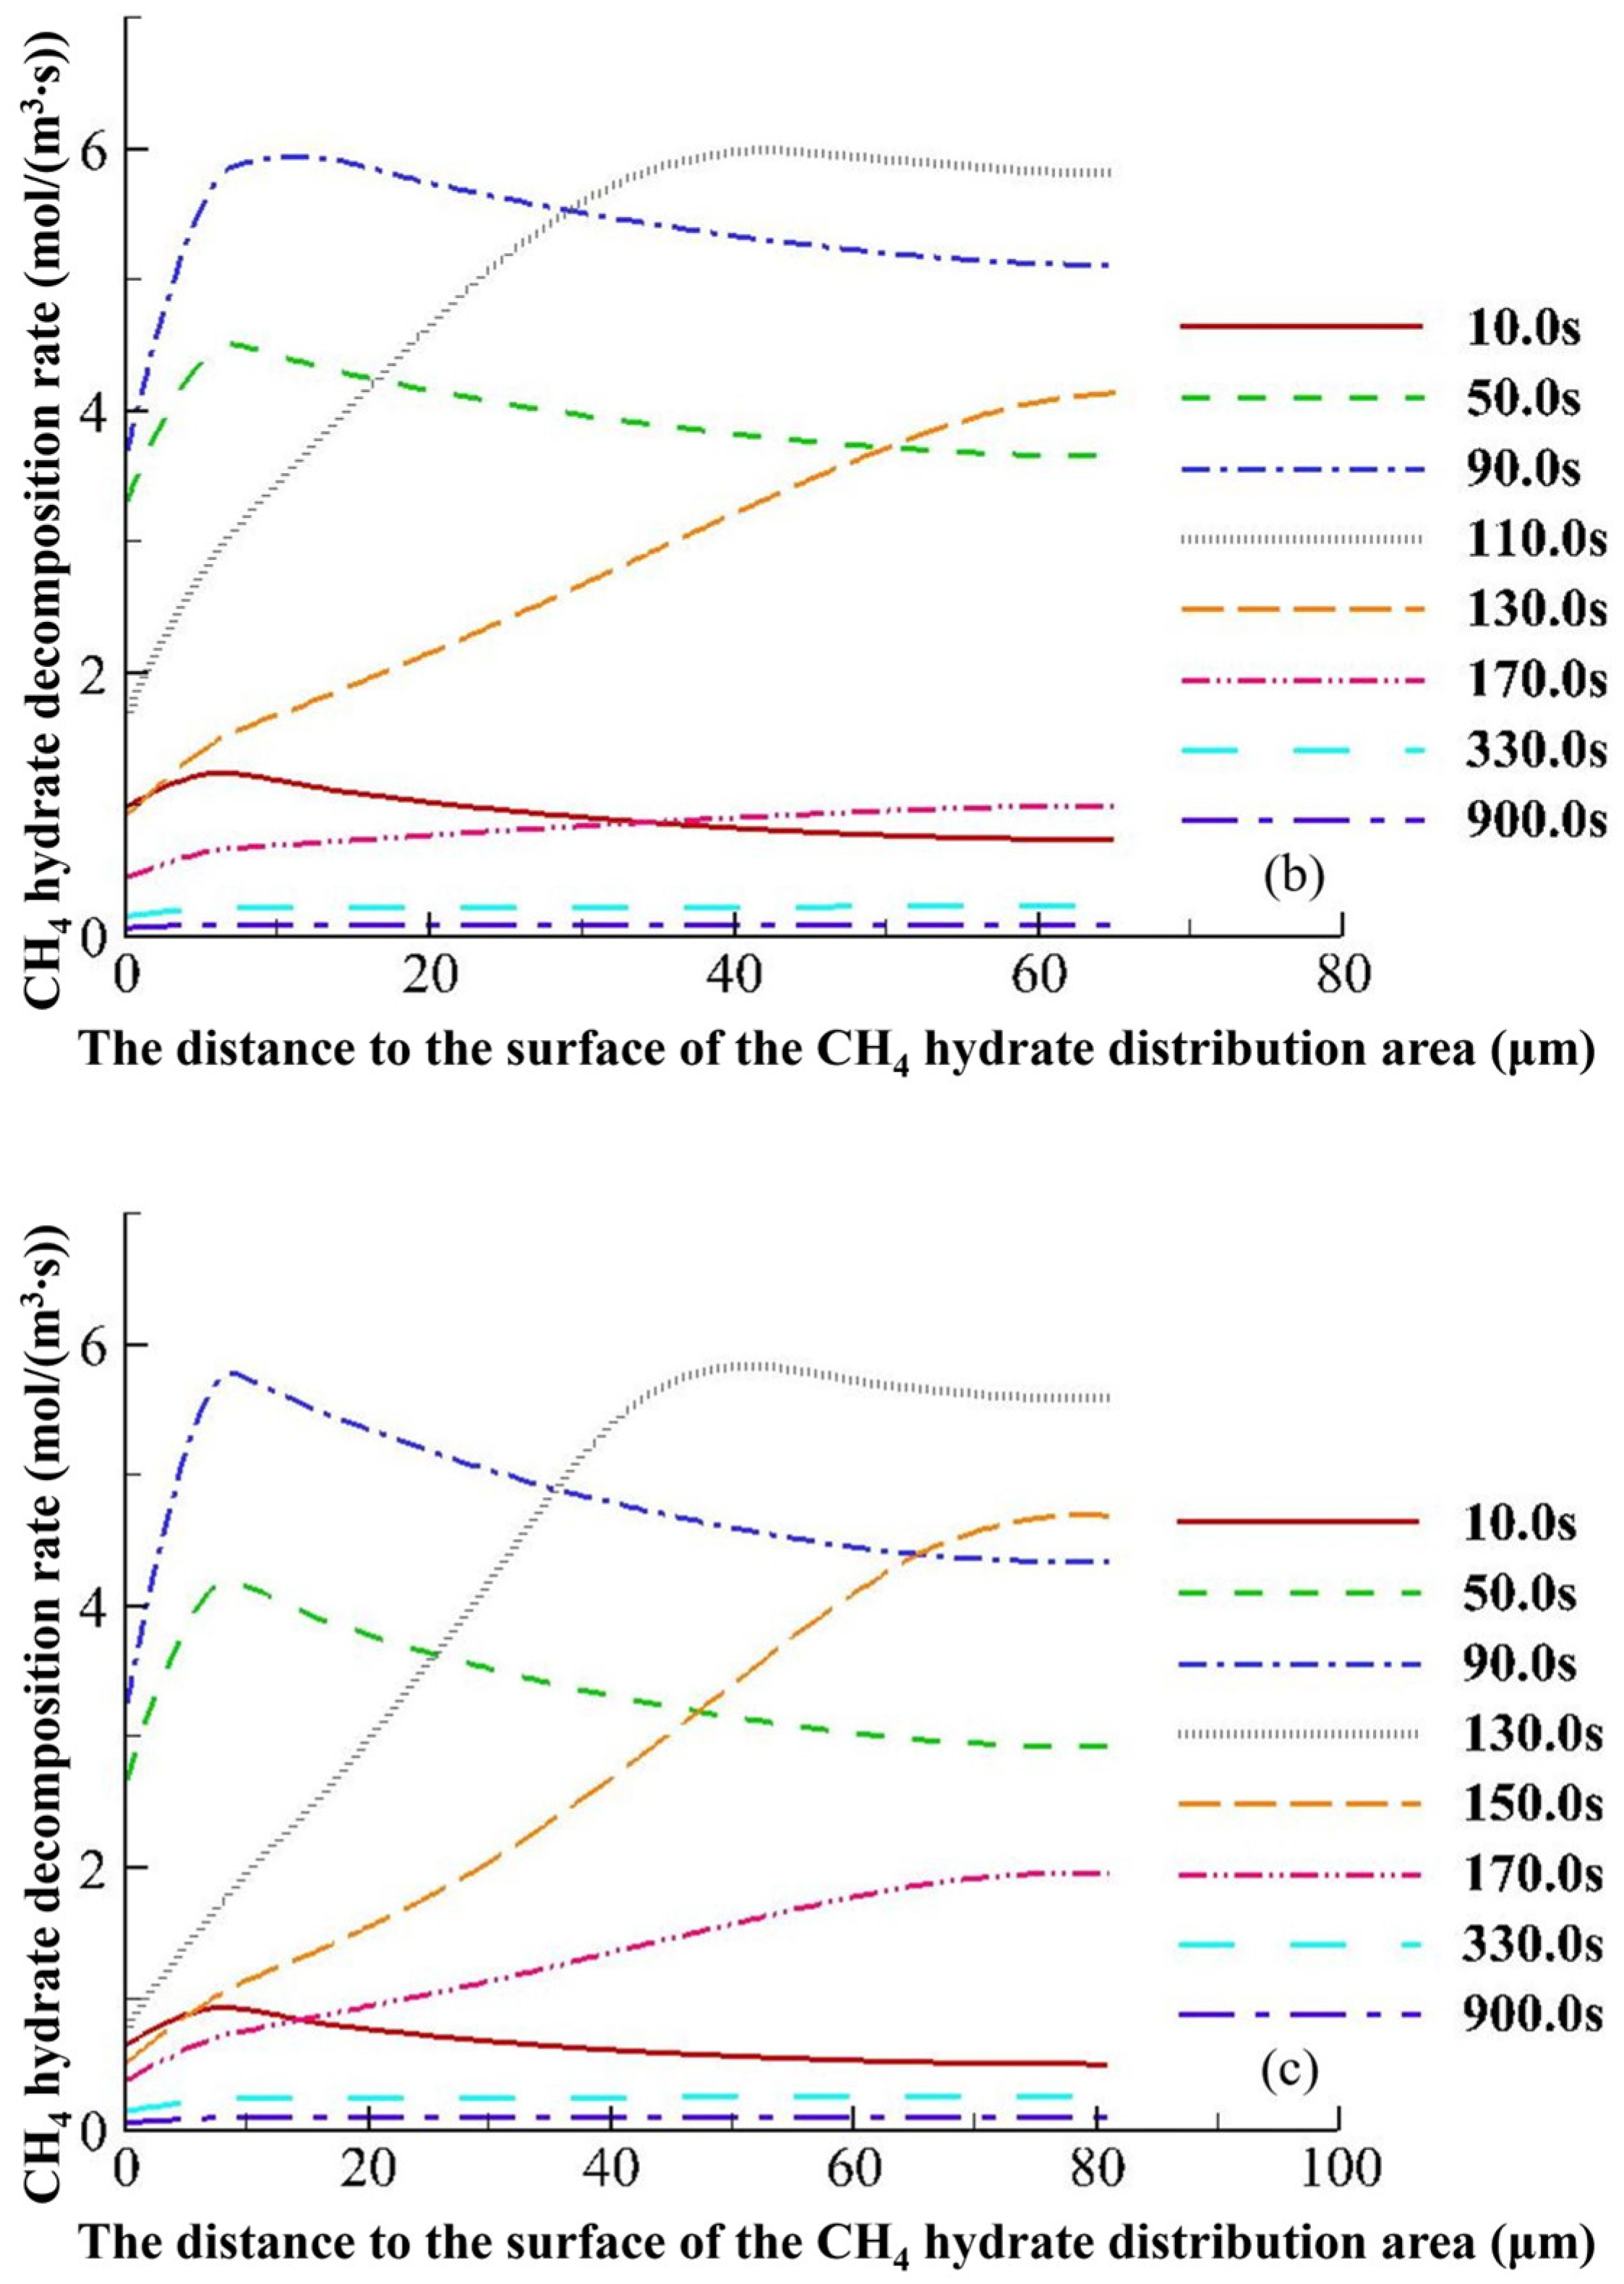
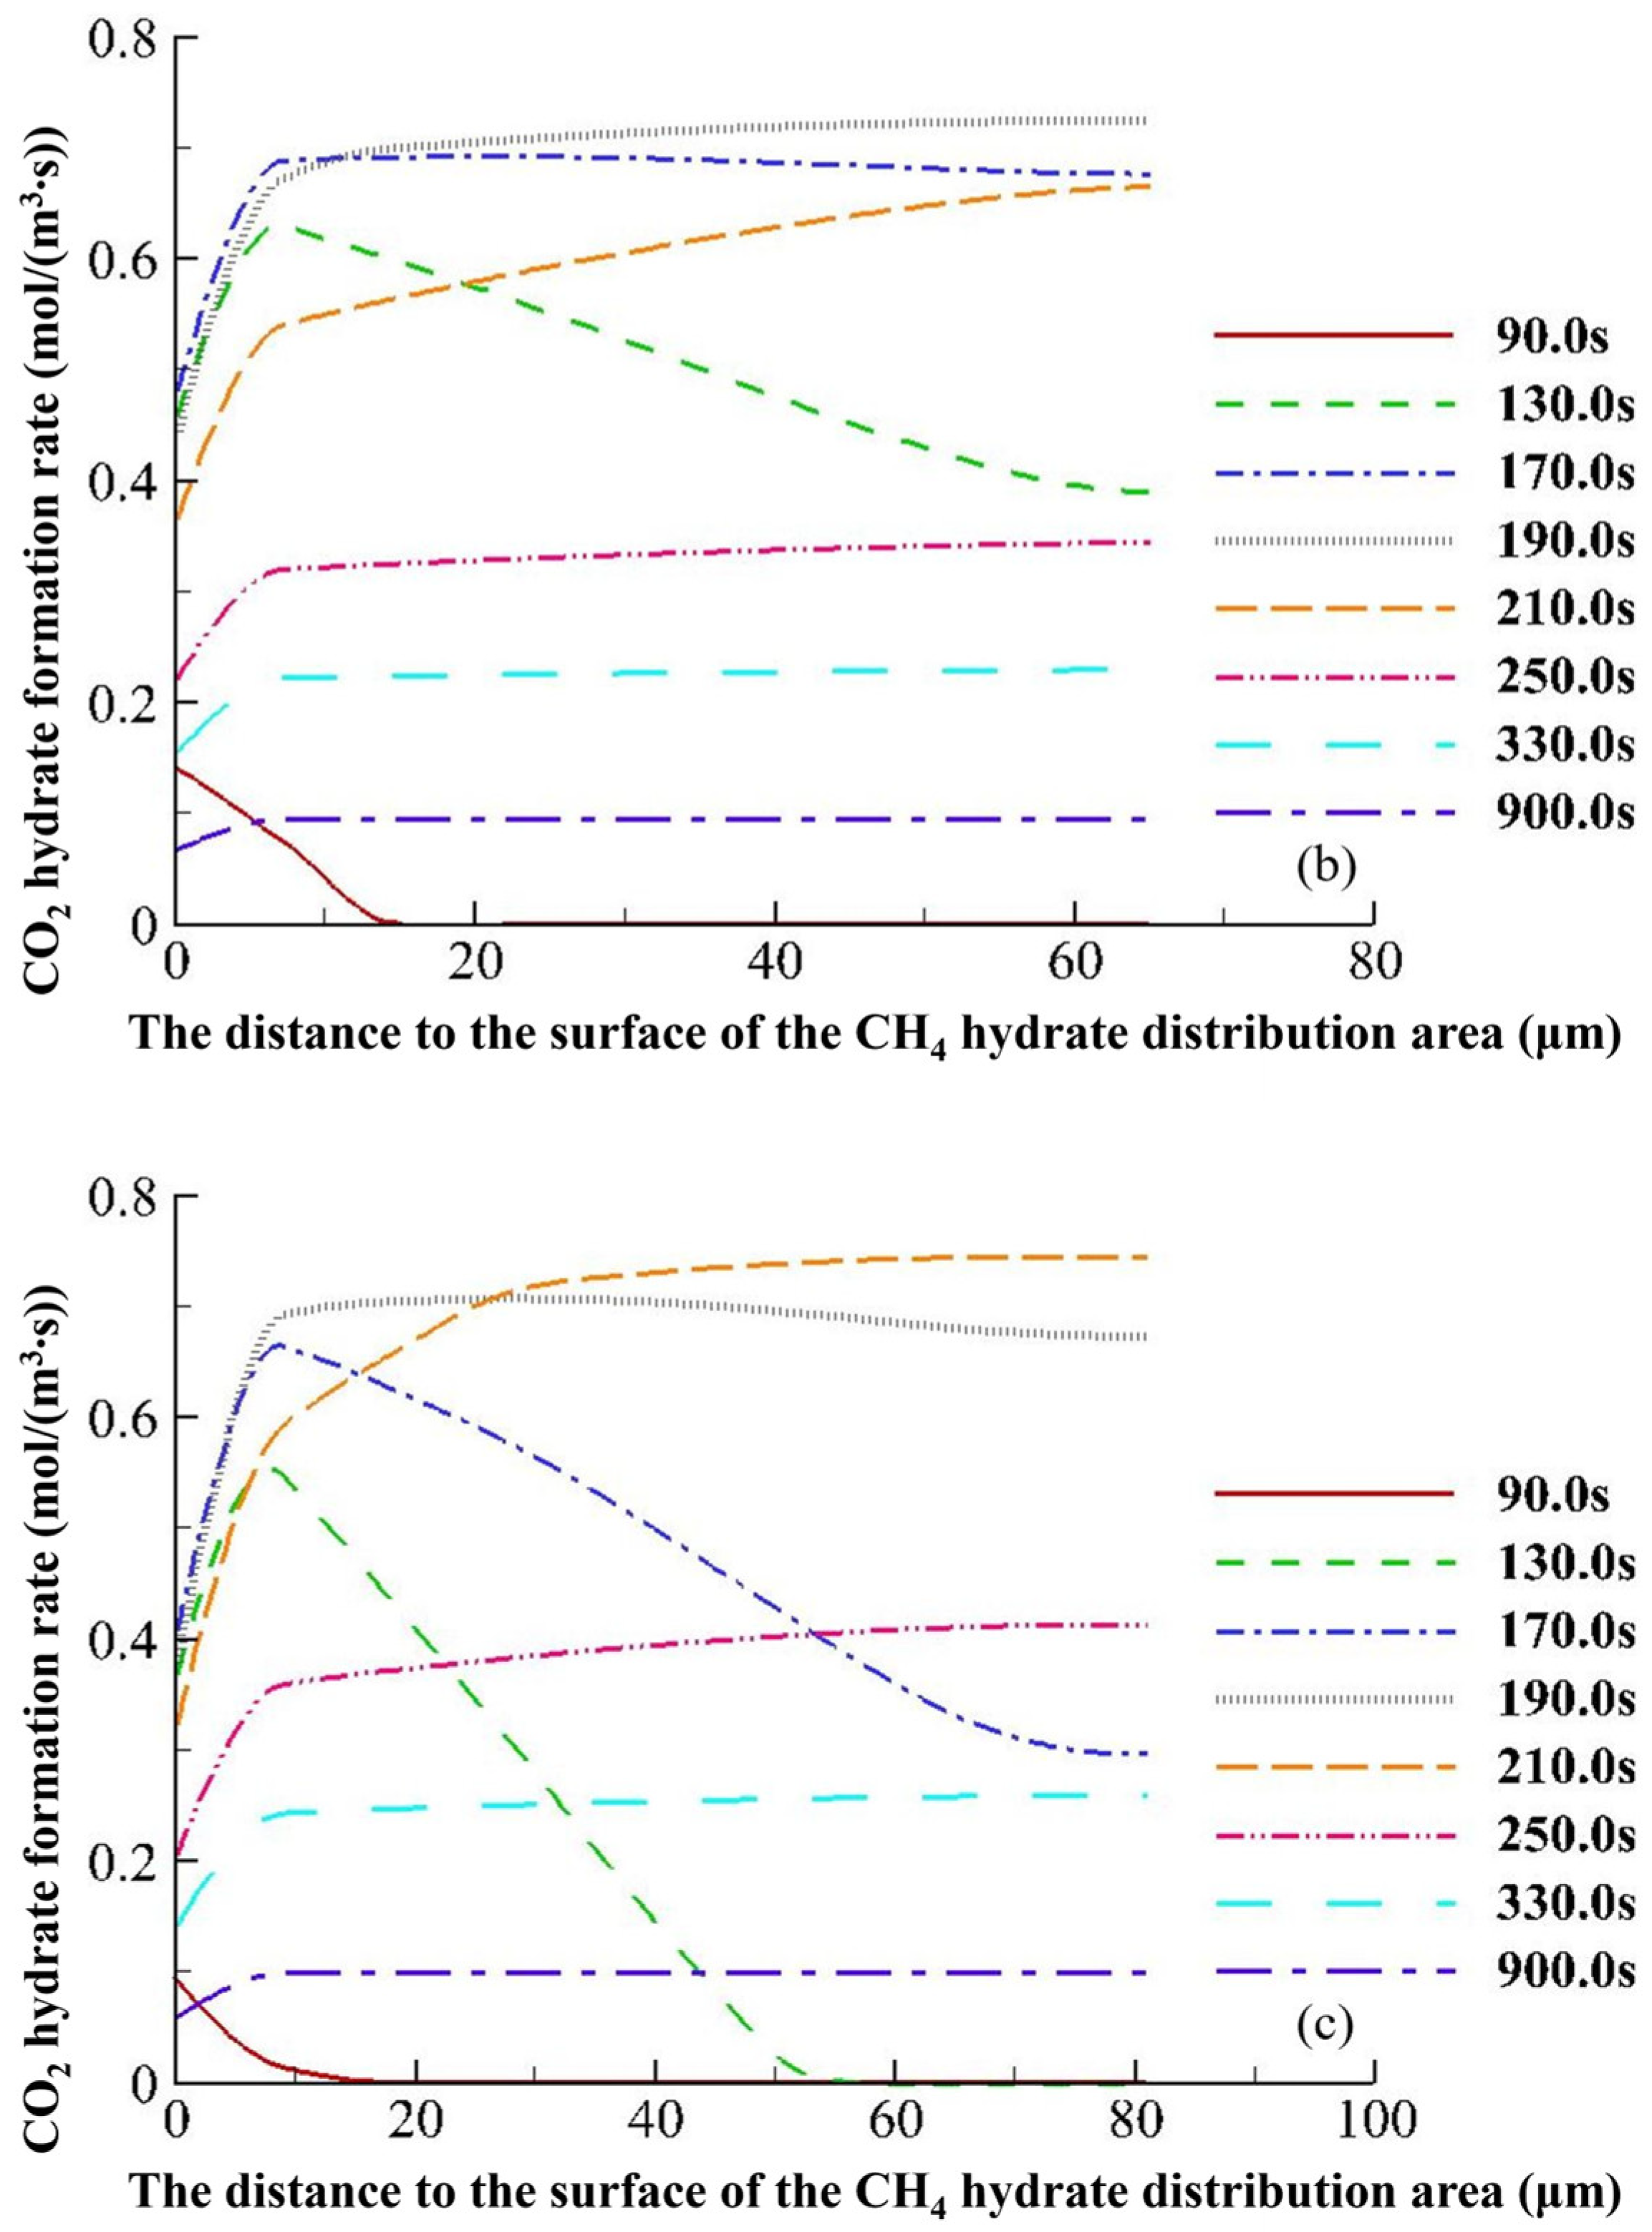
4.3.2. Hydrate Variation Rates
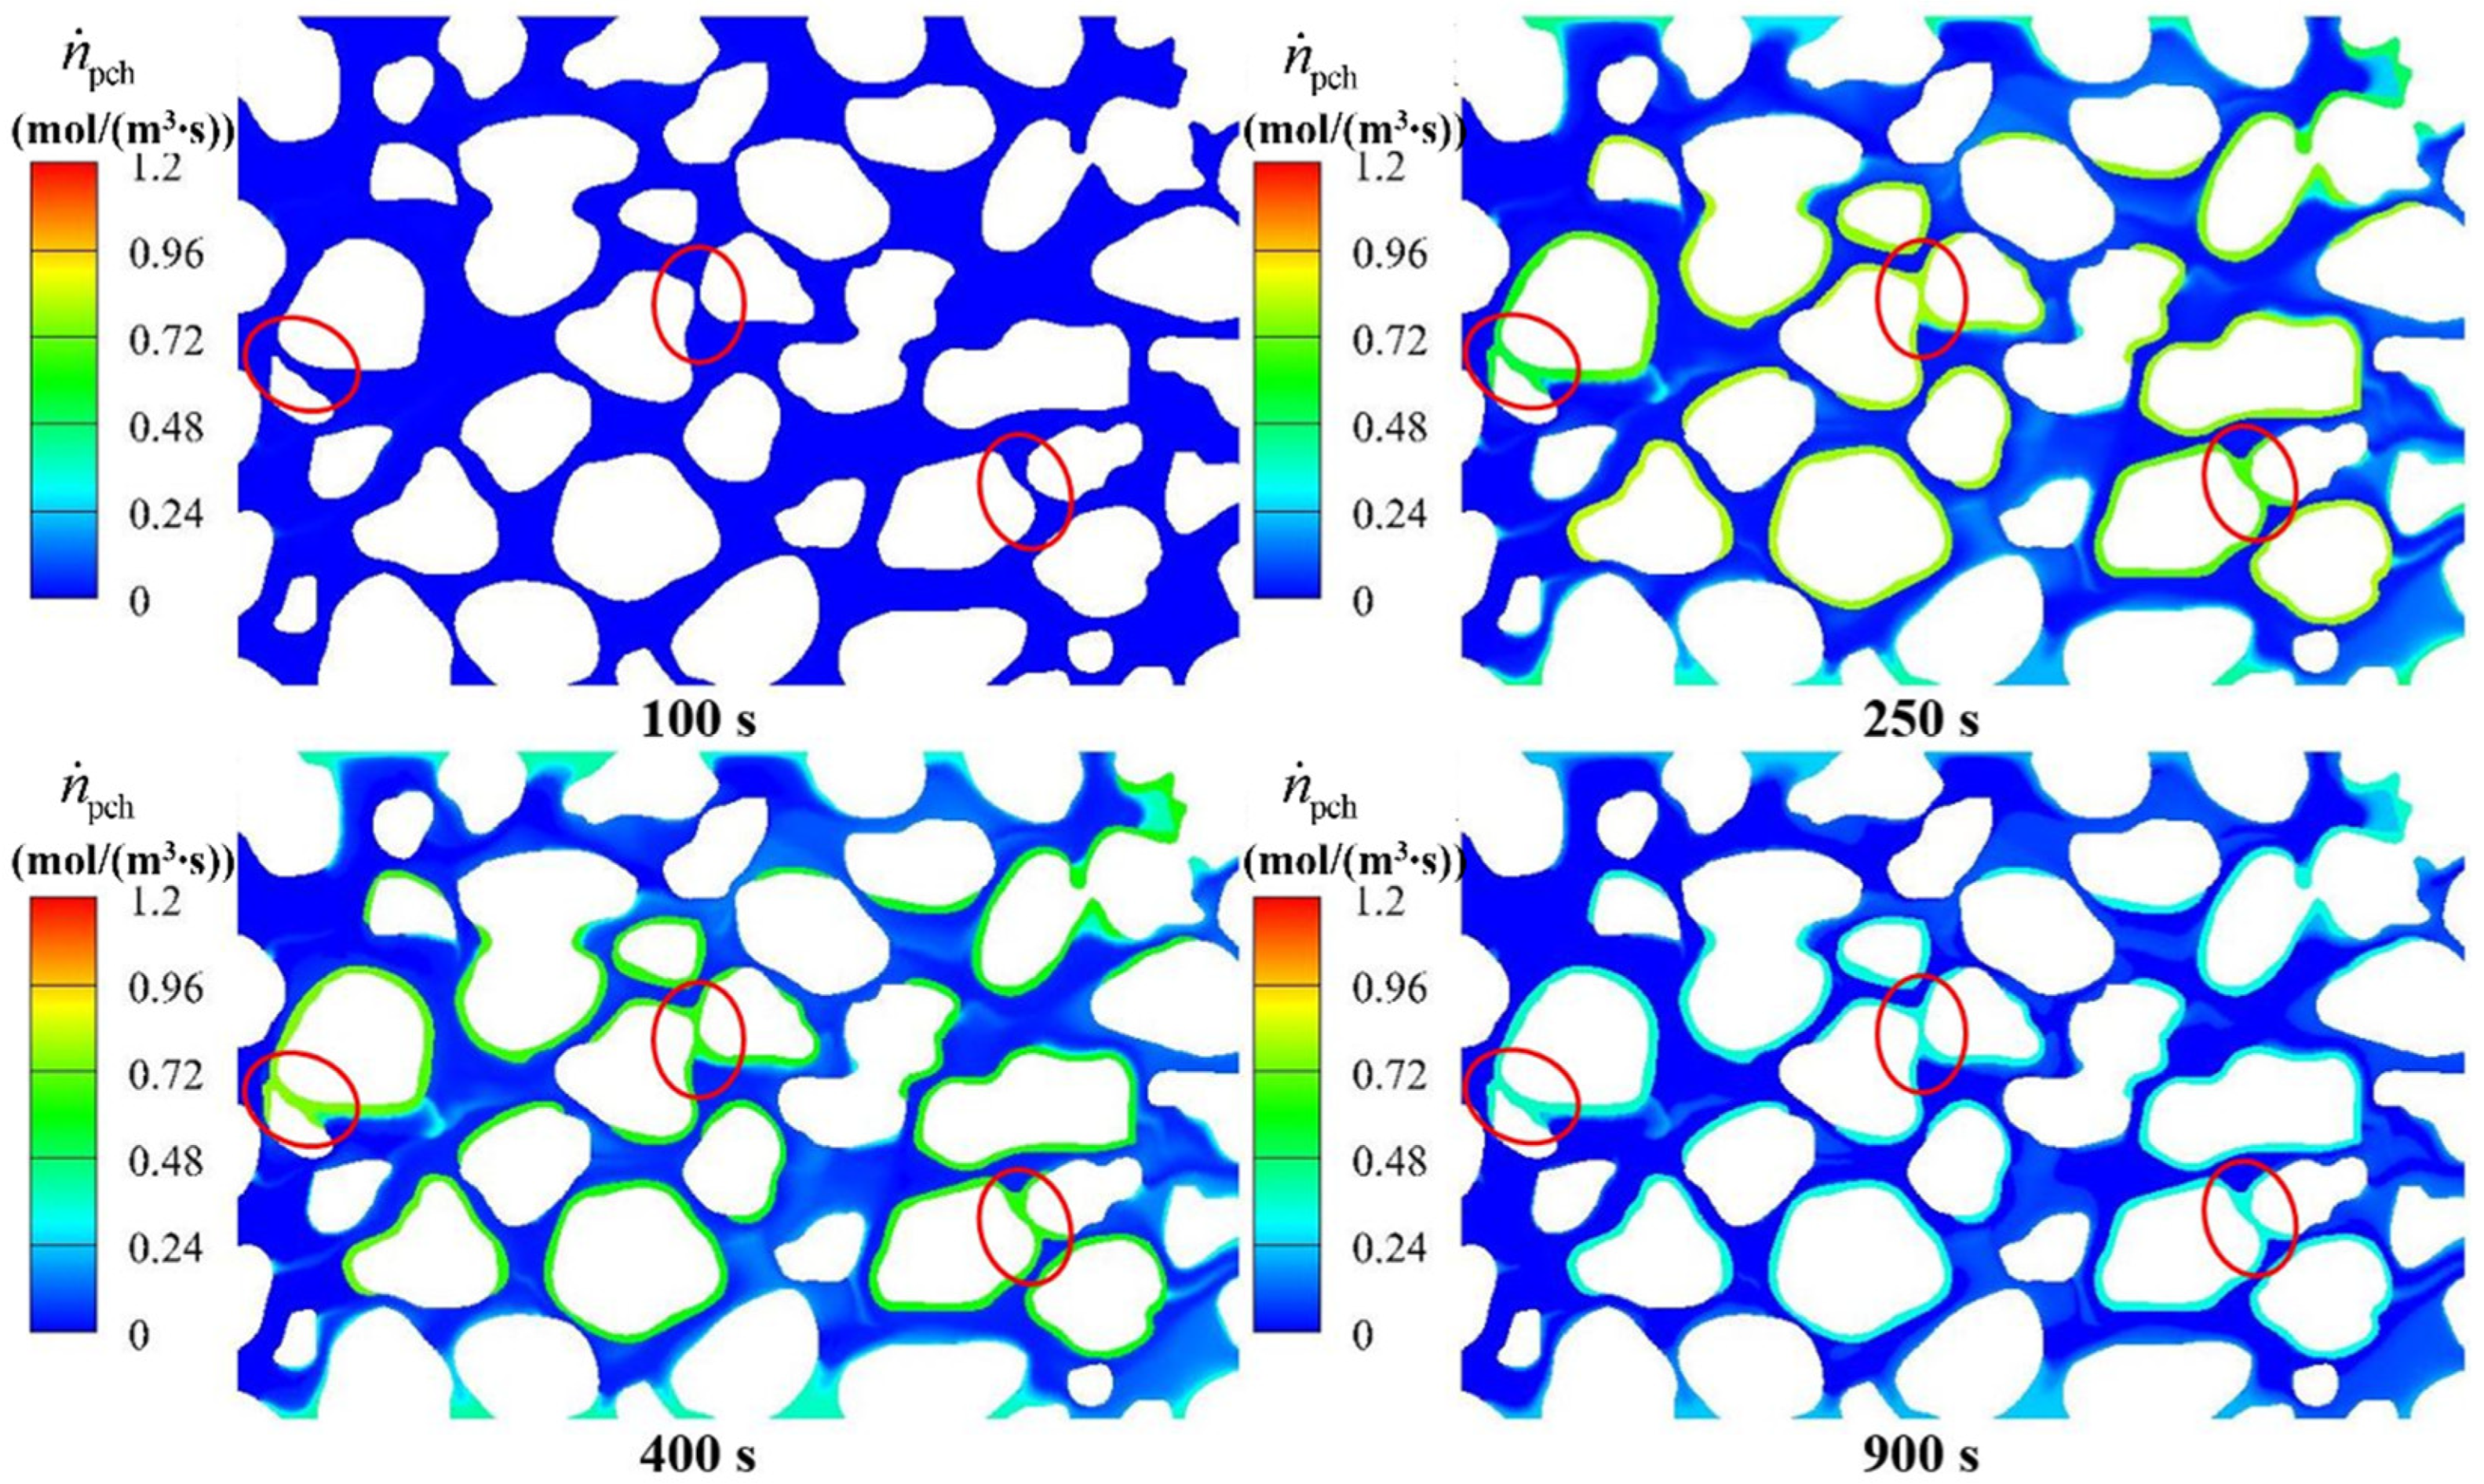
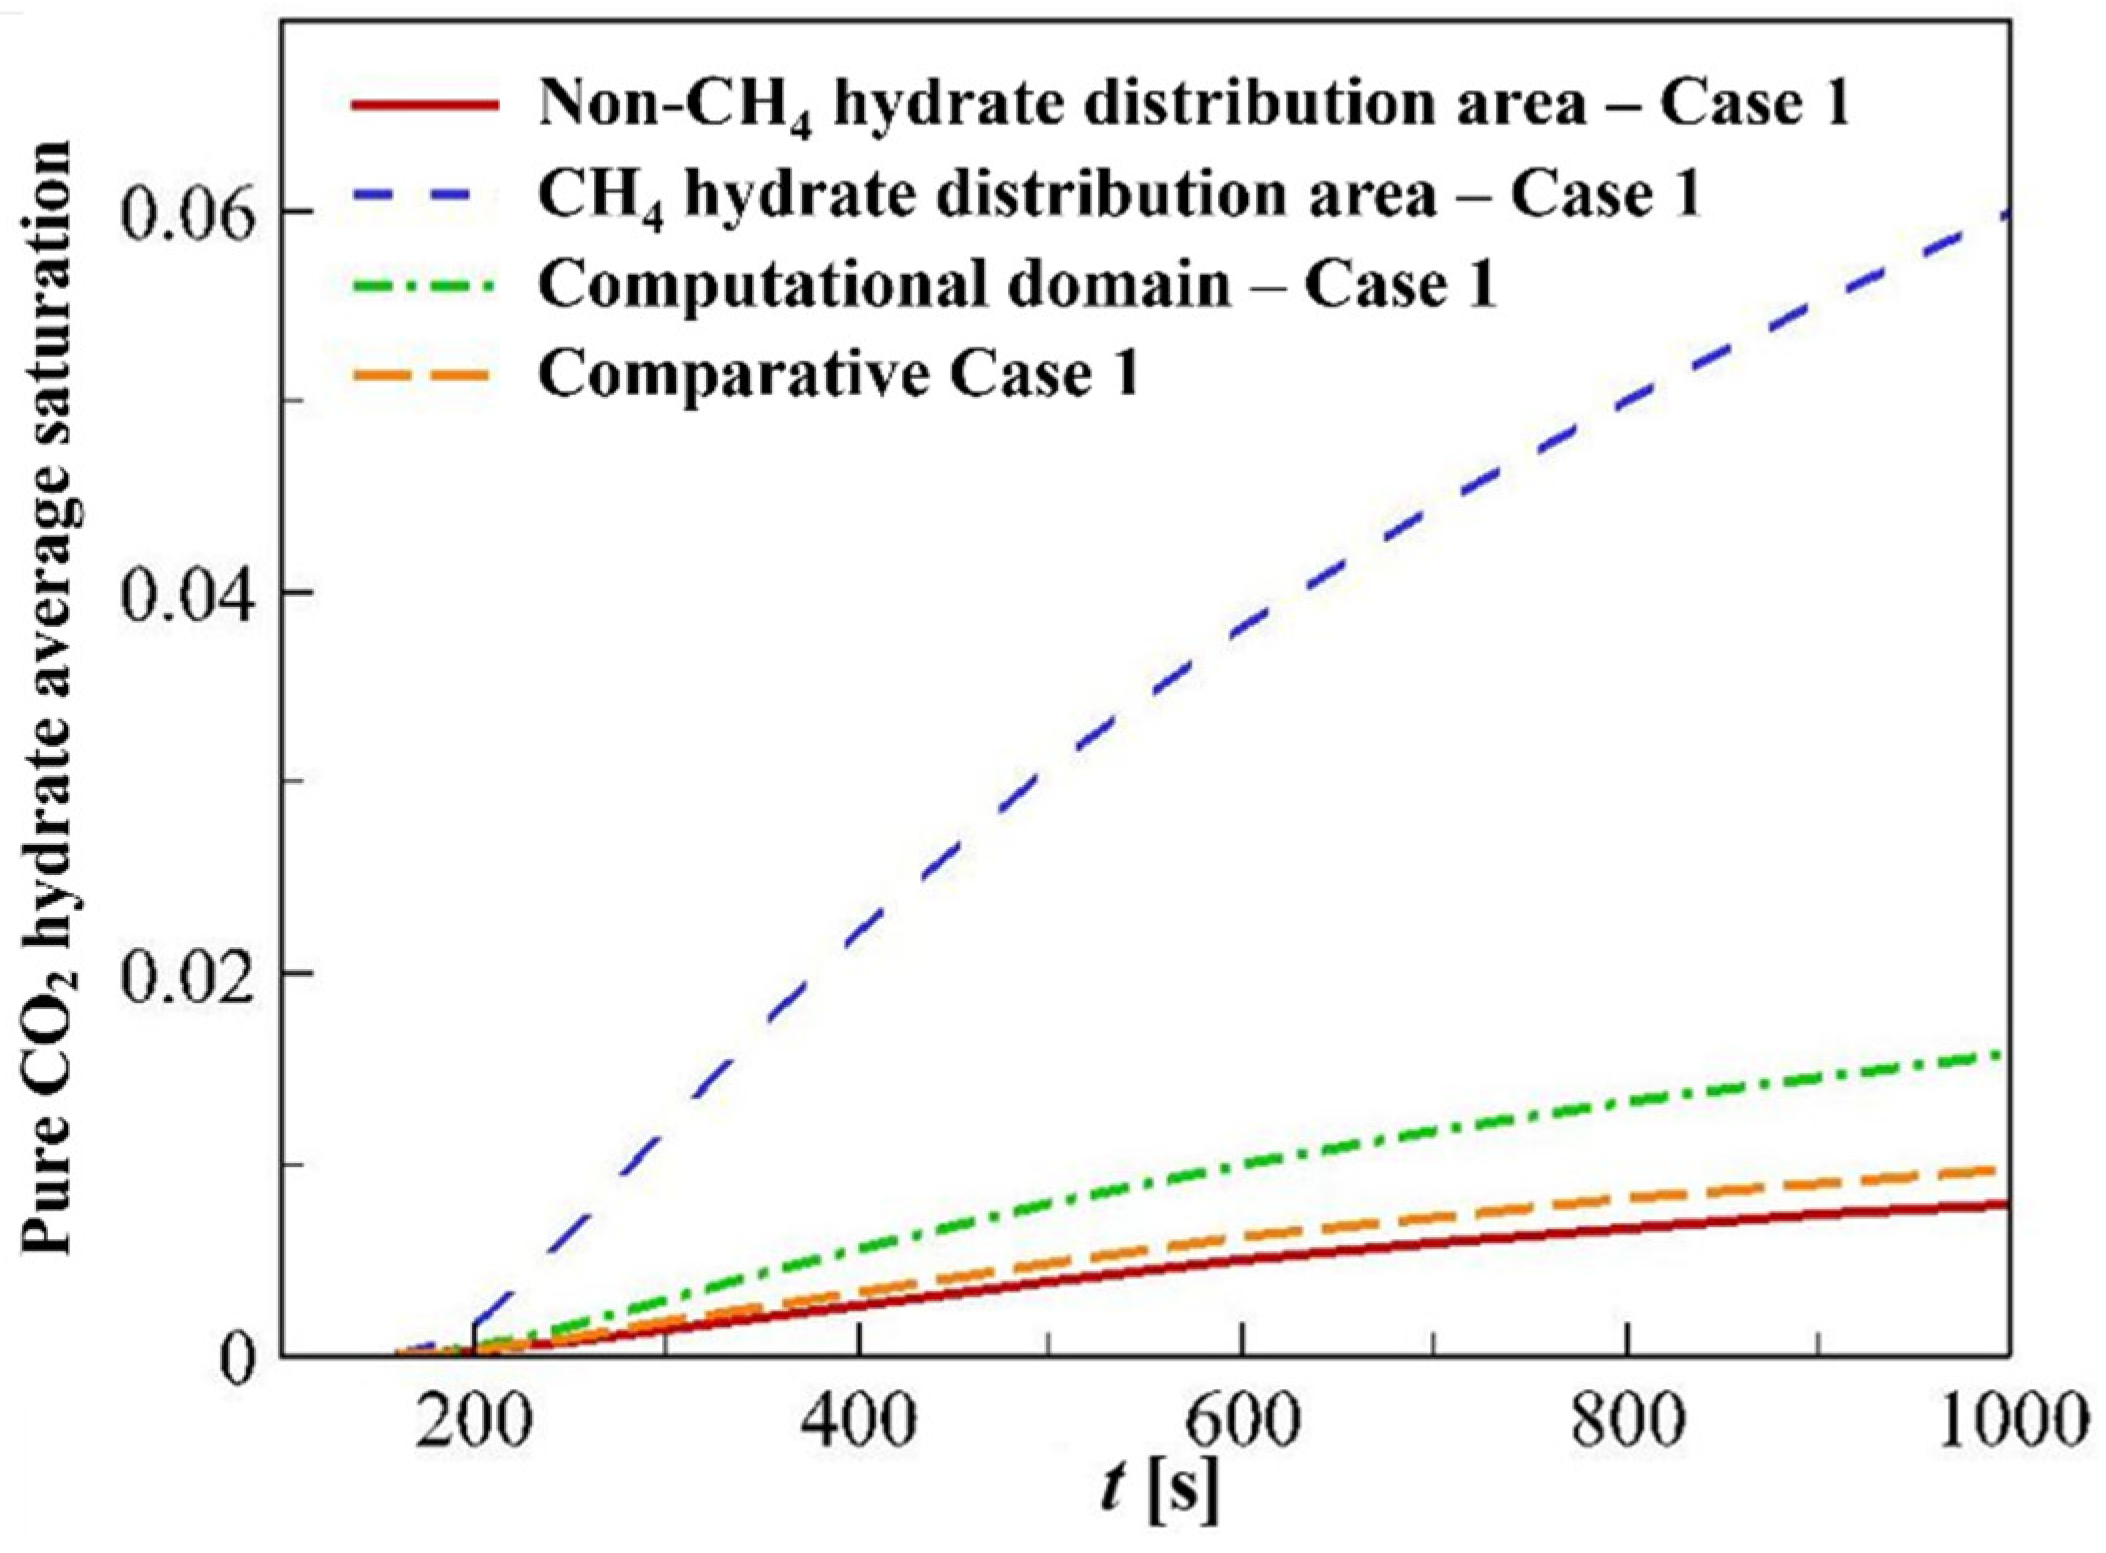
4.3.3. Hydrate Distributions
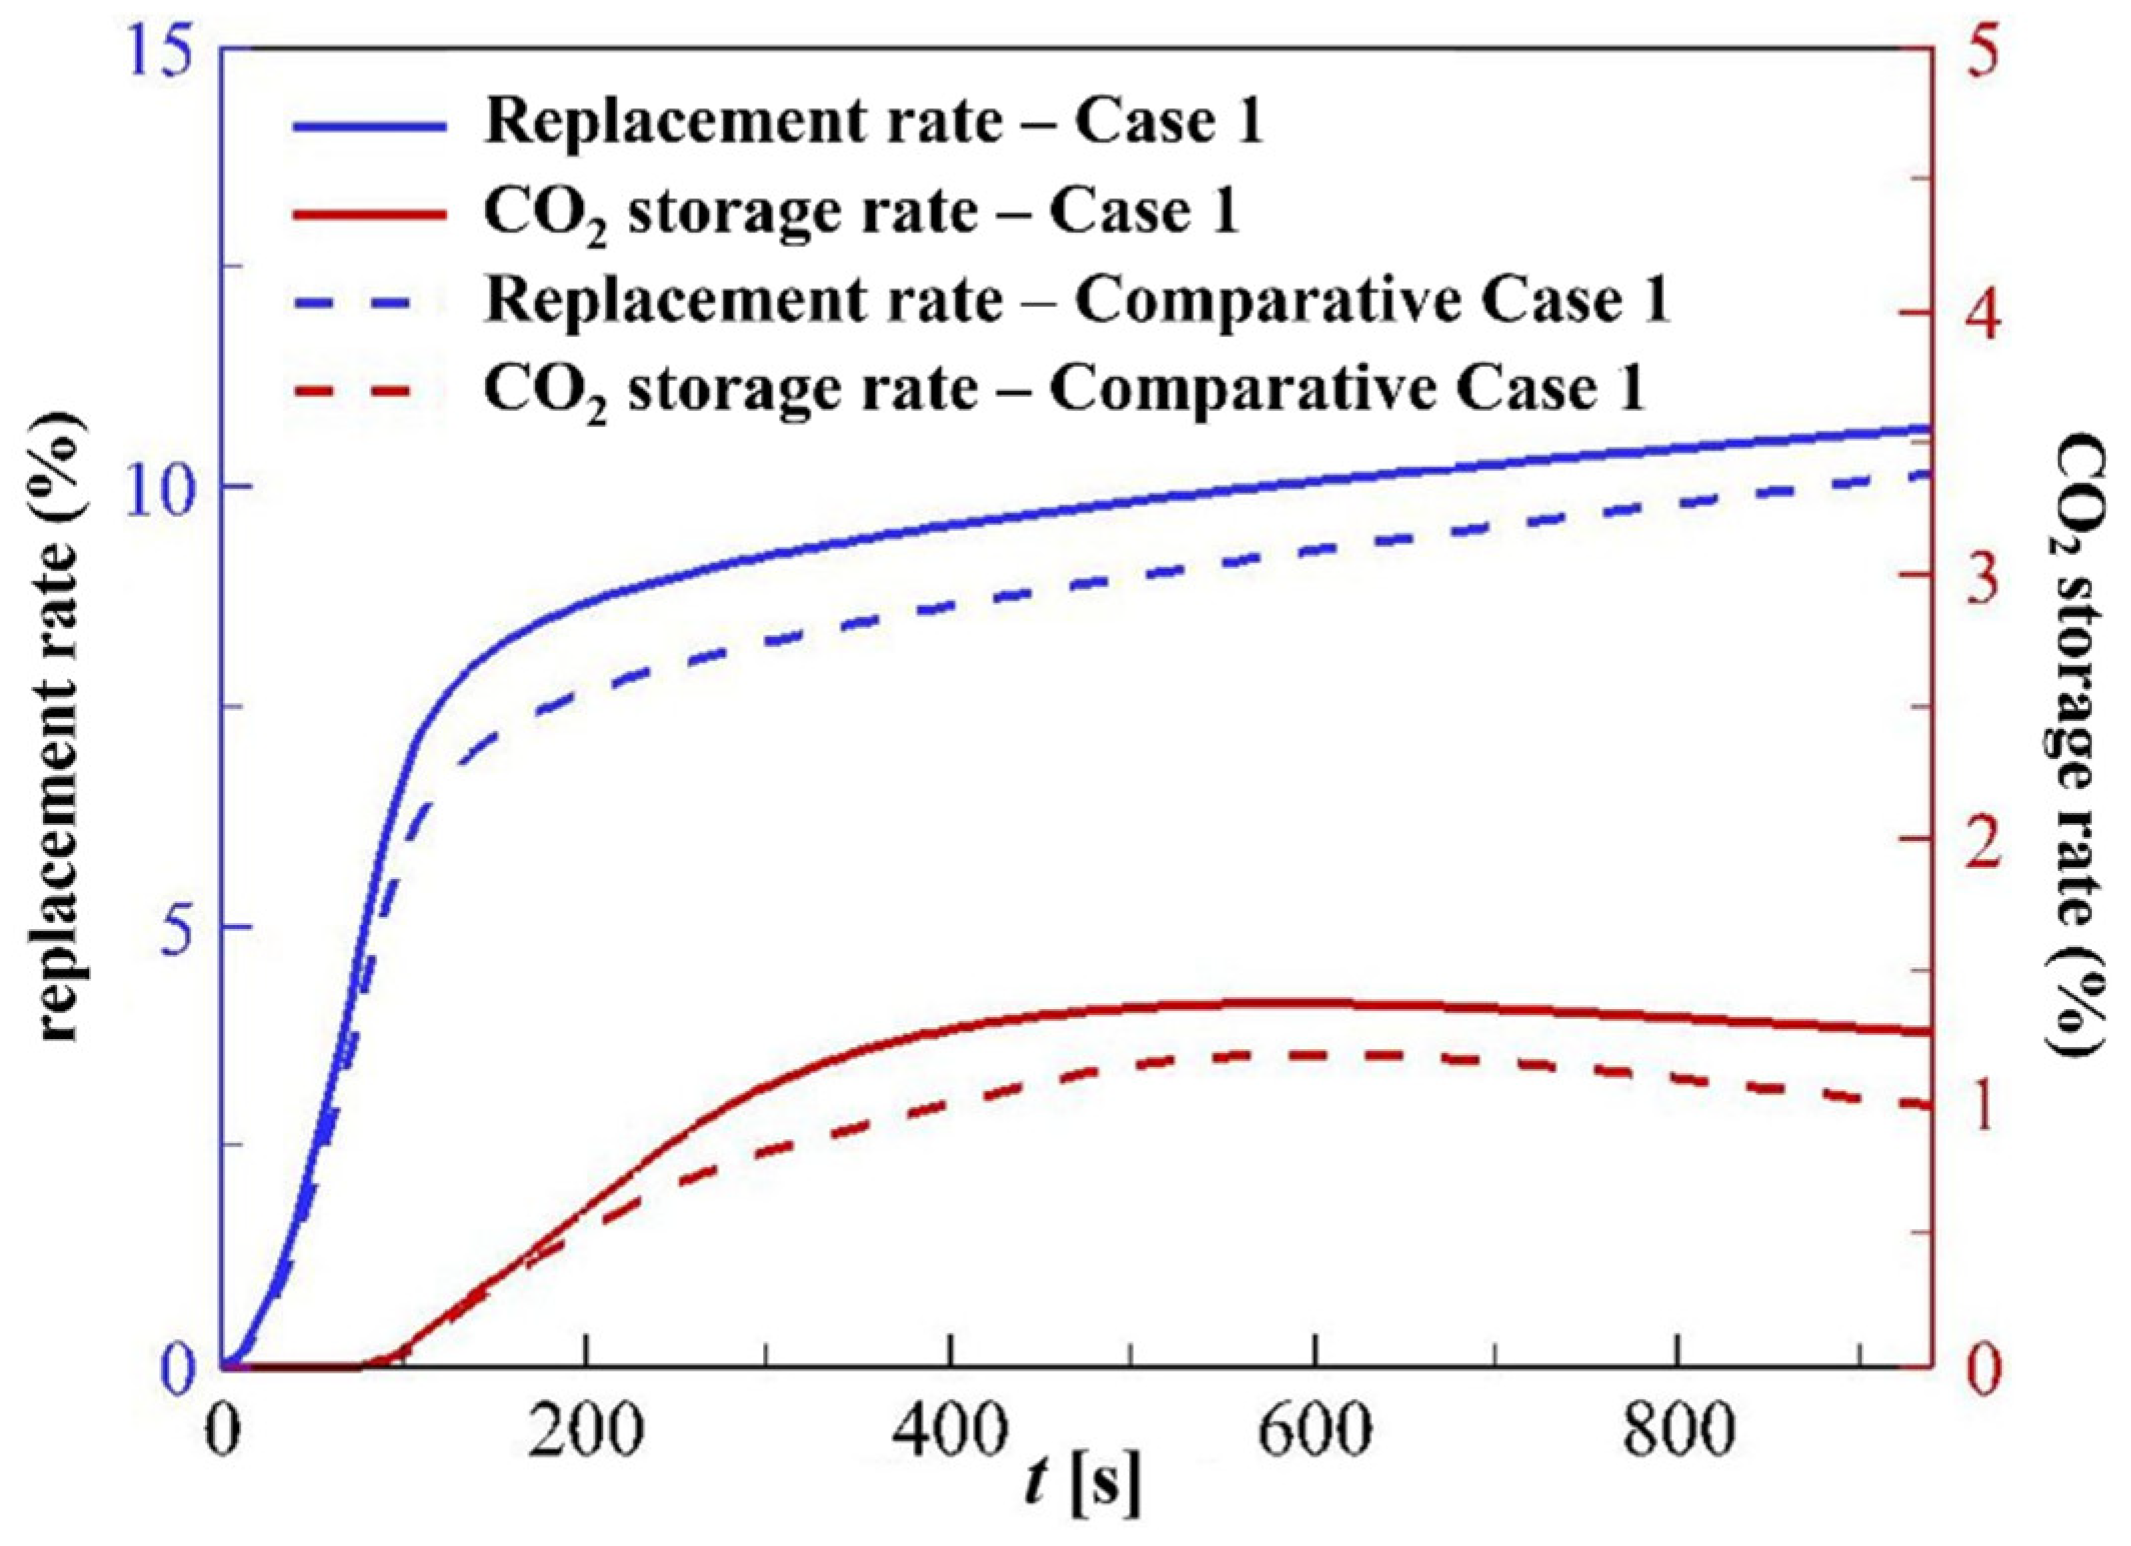
4.3.4. Replacement Rate and CO2 Storage Rate
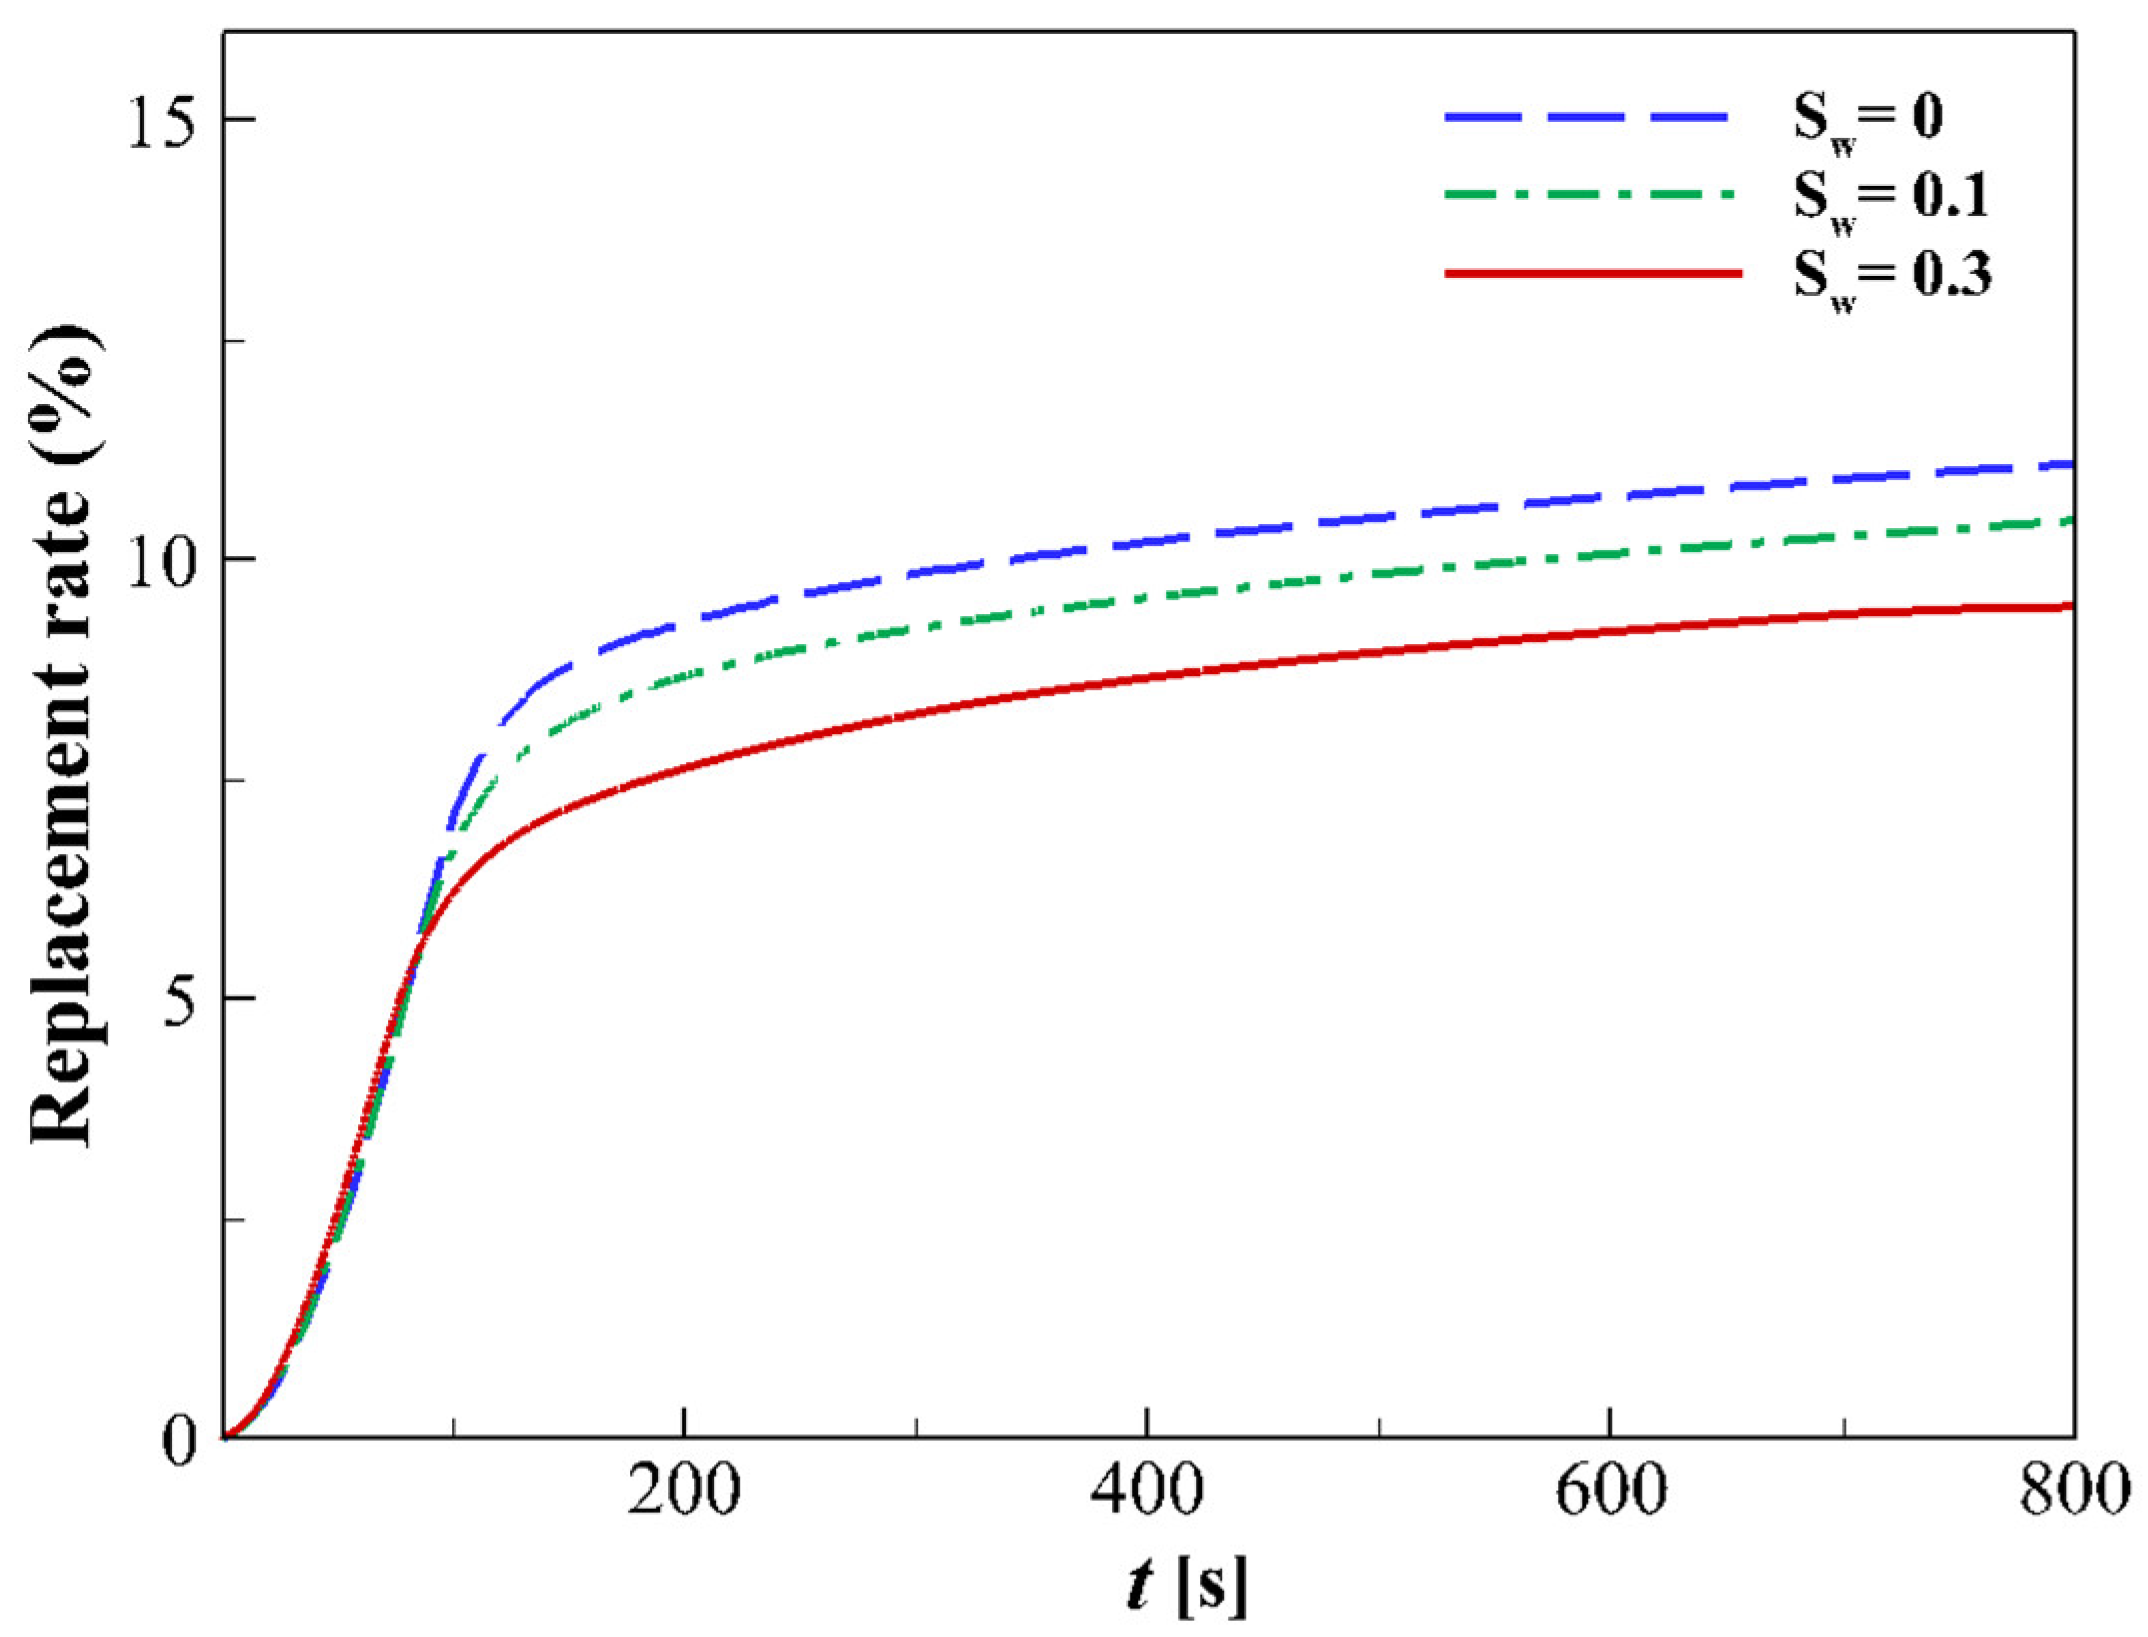
4.4. Influence of Initial Water
5. Conclusions
Author Contributions
Funding
Data Availability Statement
Conflicts of Interest
References
- Ndlovu, P.; Babaee, S.; Naidoo, P. Review on CH4-CO2 replacement for CO2 sequestration and CH4/CO2 hydrate formation in porous media. Fuel 2022, 320, 123795. [Google Scholar] [CrossRef]
- Heeschen, K.U.; Deusner, C.; Spangenberg, E.; Priegnitz, M.; Kossel, E.; Strauch, B.; Bigalke, N.; Luzi-Helbing, M.; Haeckel, M.; Schicks, J.M. Production method under surveillance: Laboratory pilot-scale simulation of CH4-CO2 exchange in a natural gas hydrate reservoir. Energy Fuels 2021, 35, 10641–10658. [Google Scholar] [CrossRef]
- Prasad, P.S.R.; Kiran, B.S. Guest molecular exchange and stability of carbon dioxide hydrates under the influence of methane gas. J. Nat. Gas Sci. Eng. 2020, 84, 103689. [Google Scholar] [CrossRef]
- Zhou, H.; Chen, B.; Wang, S.; Yang, M. CO2/N2 mixture sequestration in depleted natural gas hydrate reservoirs. J. Pet. Sci. Eng. 2019, 175, 72–82. [Google Scholar] [CrossRef]
- Yu, S.; Uchida, S.; Myshakin, E.M.; Seol, Y.; Deusner, C. Numerical investigation of CH4 gas production from CH4 hydrate-bearing sediments via CO2 injection. Energy Fuels 2024, 38, 462–481. [Google Scholar] [CrossRef]
- Pandey, J.S.; Karantonidis, C.; Karcz, A.P.; von Solms, N. Enhanced CH4-CO2 hydrate swapping in the presence of low dosage methanol. Energies 2020, 13, 5238. [Google Scholar] [CrossRef]
- Mok, J.; Lee, J.; Choi, W.; Lee, Y.; Seo, Y. Enhanced CH4-CO2 replacement in structure H hydrates: Kinetics, mechanisms, and implications for CO2 storage and CH4 production. ACS Sustain. Chem. Eng. 2024, 12, 8148–8155. [Google Scholar] [CrossRef]
- Yin, Z.; Linga, P. Methane hydrates: A future clean energy resource. Chin. J. Chem. Eng. 2019, 27, 2026–2036. [Google Scholar] [CrossRef]
- Wei, W.N.; Li, B.; Gan, Q.; Li, Y.-L. Research progress of natural gas hydrate exploitation with CO2 replacement: A review. Fuel 2022, 312, 122873. [Google Scholar] [CrossRef]
- Gambelli, A.M.; Castellani, B.; Nicolini, A.; Rossi, F. Experimental study on natural gas hydrate exploitation: Optimization of methane recovery, carbon dioxide storage and deposit structure preservation. J. Pet. Sci. Eng. 2019, 177, 594–601. [Google Scholar] [CrossRef]
- Kasala, E.E.; Wang, J.; Mkono, C.N.; Hussain, W. Systematic review and perspectives of methane (CH4) classifications and production methods from CH4 hydrate reservoirs. Energy Fuels 2024, 38, 19293–19335. [Google Scholar] [CrossRef]
- Wu, G.; Tian, L.; Chen, D.; Niu, M.; Ji, H. CO2 and CH4 hydrates: Replacement or cogrowth? J. Phys. Chem. C 2019, 123, 13401–13409. [Google Scholar] [CrossRef]
- Choi, W.; Mok, J.; Lee, J.; Lee, Y.; Lee, J.; Seo, Y. Influence of CO2 injection rate and memory water on depressurization-assisted replacement in natural gas hydrates and the implications for effective CO2 sequestration and CH4 exploitation. Energy 2024, 309, 133130. [Google Scholar] [CrossRef]
- Almenningen, S.; Graue, A.; Ersland, G. Experimental investigation of critical parameters controlling CH4-CO2 exchange in sedimentary CH4 hydrates. Energy Fuels 2021, 35, 2468–2477. [Google Scholar] [CrossRef]
- Huneker, R.H. Natural Gas Production and CO2 Sequestration in a Class 2 Hydrate Accumulation: A Numerical Simulation Study. Master’s Thesis, Delft University of Technology, Delft, The Netherlands, 2010. [Google Scholar]
- White, M.D.; Wurstner, S.K.; McGrail, B.P. Numerical studies of methane production from Class 1 gas hydrate accumulations enhanced with carbon dioxide injection. Mar. Pet. Geol. 2011, 28, 546–560. [Google Scholar] [CrossRef]
- Janicki, G.; Schlüter, S.; Hennig, T.; Lyko, H.; Deerberg, G. Simulation of methane recovery from gas hydrates combined with storing carbon dioxide as hydrates. J. Geol. Res. 2011, 2011, 462156. [Google Scholar] [CrossRef]
- Phirani, J.; Mohanty, K.K. Kinetic simulation of CO2 flooding of methane hydrates. In Proceedings of the SPE Annual Technical Conference and Exhibition, Florence, Italy, 19–22 September 2010; Volume 3, pp. 1781–1797. [Google Scholar]
- Oldenburg, C.M.; Pruess, K.; Benson, S.M. Process modeling of CO2 injection into natural gas reservoirs for carbon sequestration and enhanced gas recovery. Energy Fuels 2001, 15, 293–298. [Google Scholar] [CrossRef]
- Luo, F.; Xu, R.N.; Jiang, P.X. Numerical investigation of the influence of vertical permeability heterogeneity in stratified formation and of injection/production well perforation placement on CO2 geological storage with enhanced CH4 recovery. Appl. Energy 2013, 102, 1314–1323. [Google Scholar] [CrossRef]
- Zhao, J.; Zhu, Z.; Song, Y.; Liu, W.; Zhang, Y.; Wang, D. Analyzing the process of gas production for natural gas hydrate using depressurization. Appl. Energy 2015, 142, 125–134. [Google Scholar] [CrossRef]
- Castellani, B.; Rossetti, G.; Tupsakhare, S.; Rossi, F.; Nicolini, A.; Castaldi, M.J. Simulation of CO2 storage and methane gas production from gas hydrates in a large scale laboratory reactor. J. Pet. Sci. Eng. 2016, 147, 515–527. [Google Scholar] [CrossRef]
- Yuan, Q.; Sun, C.Y.; Yang, X.; Ma, P.C.; Ma, Z.W.; Liu, B.; Ma, Q.L.; Yang, L.Y.; Chen, G.J. Recovery of methane from hydrate reservoir with gaseous carbon dioxide using a three-dimensional middle-size reactor. Energy 2012, 40, 47–58. [Google Scholar] [CrossRef]
- Zhao, J.; Zhang, L.; Chen, X.; Zhang, Y.; Liu, Y.; Song, Y. Combined replacement and depressurization methane hydrate recovery method. Energy Explor. Exploit. 2016, 34, 129–139. [Google Scholar] [CrossRef]
- Baig, K.; Kvamme, B.; Kuznetsova, T.; Bauman, J. Impact of water film thickness on kinetic rate of mixed hydrate formation during injection of CO2 into CH4 hydrate. Aiche J. 2015, 61, 3944–3957. [Google Scholar] [CrossRef]
- Jadhawar, P.; Mohammadi, A.H.; Yang, J.; Tohidi, B. Subsurface carbon dioxide storage through clathrate hydrate formation. In Advances in the Geological Storage of Carbon Dioxide; Springer: Dordrecht, The Netherlands, 2006; pp. 111–126. [Google Scholar]
- Jang, J. Gas Production from Hydrate-Bearing Sediments. Ph.D. Thesis, Georgia Institute of Technology, Atlanta, GA, USA, 2011. [Google Scholar]
- Hsieh, P.Y.; Sean, W.Y.; Sato, T.; Seo, Y.W. Mesoscale modeling of exploiting methane hydrate by CO2 replacement in homogeneous porous media. Int. J. Heat Mass Transf. 2020, 158, 119741. [Google Scholar] [CrossRef]
- Fukumoto, A.; Kamada, K.; Sato, T.; Oyama, H.; Torii, H.; Kiyono, F.; Nagao, J.; Temma, N.; Narita, H. Numerical simulation of pore-scale formation of methane hydrate in the sand sediment using the phase-field model. J. Nat. Gas Sci. Eng. 2018, 50, 269–281. [Google Scholar] [CrossRef]
- Wang, Y.; Dong, B.; Wang, P.; Zhang, L.; Chen, C.; Qin, Y.; Liu, Y.; Li, W.; Song, Y. Pore-sale investigation for the influence of initial water on CO2-CH4 exchange in a hydrate by CO2 injection. Energy Fuels 2022, 36, 9950–9966. [Google Scholar] [CrossRef]
- Zhao, X.; Blunt, M.J.; Yao, J. Pore-Scale Modeling: Effects of wettability on waterflood oil recovery. J. Pet. Sci. Eng. 2010, 71, 169–178. [Google Scholar] [CrossRef]
- Hauge, L.P.; Gauteplass, J.; Høyland, M.D.; Ersland, G.; Kovscek, A.; Fernø, M.A. Pore-level hydrate formation mechanisms using realistic rock structures in high-pressure silicon micromodels. Int. J. Greenh. Gas Control 2016, 53, 178–186. [Google Scholar] [CrossRef]
- Hou, J.; Ji, Y.; Zhou, K.; Liu, Y.; Wei, B. Effect of hydrate on permeability in porous media: Pore-scale micro-simulation. Int. J. Heat Mass Transf. 2018, 126, 416–424. [Google Scholar] [CrossRef]
- Øren, P.E.; Bakke, S. Reconstruction of berea sandstone and pore-scale modelling of wettability effects. J. Pet. Sci. Eng. 2003, 39, 177–199. [Google Scholar] [CrossRef]
- Lee, B.R.; Koh, C.A.; Sum, A.K. Quantitative measurement and mechanisms for CH4 production from hydrates with the injection of liquid CO2. Phys. Chem. Chem. Phys. 2014, 16, 14922–14927. [Google Scholar] [CrossRef] [PubMed]
- Salamatin, A.N.; Falenty, A.; Kuhs, W.F. Diffusion model for gas replacement in an isostructural CH4-CO2 hydrate system. J. Phys. Chem. C 2017, 121, 17603–17616. [Google Scholar] [CrossRef]
- Yonkofski, C.M.R.; Horner, J.A.; White, M.D. Experimental and numerical investigation of hydrate-guest molecule exchange kinetics. J. Nat. Gas Sci. Eng. 2016, 35, 1480–1489. [Google Scholar] [CrossRef]
- Clarke, M.A.; Bishnoi, P.R. Determination of the intrinsic kinetics of CO2 gas hydrate formation using in situ particle size analysis. Chem. Eng. Sci. 2005, 60, 695–709. [Google Scholar] [CrossRef]
- Gambelli, A.M. Natural Gas recovery from hydrate compounds using CO2 replacement strategies: Experimental study on thermal stimulation. Energy Procedia 2018, 148, 647–654. [Google Scholar]
- Ryou, J.E.; Al-Raoush, R.I.; Alshibli, K.; Lee, J.Y.; Jung, J. Effects of soaking process on CH4-CO2 replacement efficiency for hydrate-bearing sediments. J. Pet. Sci. Eng. 2021, 196, 107772. [Google Scholar] [CrossRef]
- Zhao, J.F.; Ye, C.C.; Song, Y.C.; Liu, W.G.; Cheng, C.X.; Liu, Y.; Zhang, Y.; Wang, D.Y.; Ruan, X.K. Numerical simulation and analysis of water phase effect on methane hydrate dissociation by depressurization. Ind. Eng. Chem. Res. 2012, 51, 3108–3118. [Google Scholar] [CrossRef]


| Parameters | Units | Values |
|---|---|---|
| Length | 3.00 | |
| Width | 2.00 | |
| Porosity | % | 43.83 |
| Absolute permeability | D | 64.20 |
| X coordinate of point a | 1.4169 | |
| Y coordinate of point b | 0.9996 | |
| Effective length of Throat 1 | 58.93 | |
| Effective length of Throat 2 | 28.41 | |
| Effective length of Throat 3 | 54.75 | |
| Depth of CH4 hydrate in Throat 1 | 82.34 | |
| Depth of CH4 hydrate in Throat 2 | 65.09 | |
| Depth of CH4 hydrate in Throat 3 | 81.03 |
| Molar Variation Rate | Symbol | Expression |
|---|---|---|
| Initial decomposition rate of CH4 hydrate | ||
| CH4 generation rate | ||
| CH4 hydrate decomposition rate | ||
| CO2 hydrate formation rate | ||
| CO2 dissolution rate | ||
| Pure CO2 hydrate formation rate |
| Parameter | Unit | Value |
|---|---|---|
| Core radius | mm | 27.50 |
| Core length | mm | 460.00 |
| Initial/Wall temperature | K | 275.15 |
| Initial pressure | MPa | 3.89 |
| CO2 velocity at the inlet | m/s | 2.51 × 10⁻⁵ |
| Intrinsic permeability | D | 16.34 |
| Porosity (%) | (%) | (%) | |
|---|---|---|---|
| Exp. 1 | 41.74 | 28.87 | 7.61 |
| Exp. 2 | 42.07 | 23.22 | 11.99 |
| Parameter | Unit | Case 1 | Comparative Case 1 | Case 2 | Comparative Case 2 | Case 3 |
|---|---|---|---|---|---|---|
| Initial pressure | MPa | 3.00 | 3.00 | 3.00 | 3.00 | 3.00 |
| Outlet pressure | MPa | 3.00 | 3.00 | 3.00 | 3.00 | 3.00 |
| Initial temperature | K | 275.00 | 275.00 | 275.00 | 275.00 | 275.00 |
| Inlet velocity | m/s | 2.2 × 10⁻⁵ | 2.2 × 10⁻⁵ | 2.2 × 10⁻⁵ | 2.2 × 10⁻⁵ | 2.2 × 10⁻⁵ |
| in CH4 hydrate distribution area | - | 71.90% | - | 71.90% | - | 71.90% |
| Initial water saturation | - | 10.00% | 10.00% | 0.00% | 0.00% | 30.00% |
Disclaimer/Publisher’s Note: The statements, opinions and data contained in all publications are solely those of the individual author(s) and contributor(s) and not of MDPI and/or the editor(s). MDPI and/or the editor(s) disclaim responsibility for any injury to people or property resulting from any ideas, methods, instructions or products referred to in the content. |
© 2025 by the authors. Licensee MDPI, Basel, Switzerland. This article is an open access article distributed under the terms and conditions of the Creative Commons Attribution (CC BY) license (https://creativecommons.org/licenses/by/4.0/).
Share and Cite
Wang, Y.; Wu, X.; Zhang, Y.; Yin, C.; Dong, B.; Li, W. Impact of Pore Structure and Hydrate Distribution on CO2-CH4 Replacement in CH4 Hydrate: A Pore-Scale Numerical Analysis. Energies 2025, 18, 2519. https://doi.org/10.3390/en18102519
Wang Y, Wu X, Zhang Y, Yin C, Dong B, Li W. Impact of Pore Structure and Hydrate Distribution on CO2-CH4 Replacement in CH4 Hydrate: A Pore-Scale Numerical Analysis. Energies. 2025; 18(10):2519. https://doi.org/10.3390/en18102519
Chicago/Turabian StyleWang, Yingfei, Xiangen Wu, Yujie Zhang, Chunlin Yin, Bo Dong, and Weizhong Li. 2025. "Impact of Pore Structure and Hydrate Distribution on CO2-CH4 Replacement in CH4 Hydrate: A Pore-Scale Numerical Analysis" Energies 18, no. 10: 2519. https://doi.org/10.3390/en18102519
APA StyleWang, Y., Wu, X., Zhang, Y., Yin, C., Dong, B., & Li, W. (2025). Impact of Pore Structure and Hydrate Distribution on CO2-CH4 Replacement in CH4 Hydrate: A Pore-Scale Numerical Analysis. Energies, 18(10), 2519. https://doi.org/10.3390/en18102519